A PROJECT REPORT
ON
“ASTUDY ONWORKING CAPITAL MANAGEMENT
At Bharat Earth Movers Limited (BEML)”
SUBMITTED IN PARTIAL FULFILLMENT OF THE
REQUIREMENTS FOR THE AWARD OF THE DEGREE OF
BACHELOR OF BUSINESS MANAGEMENT
BANGALORE UNIVERSITY
BY
MS. K.THANUSHREE
(Reg.no.13VFC24116)
UNDER THE GUIDELINES OF
Mrs. ASHIMA GUPTA B.B.M
Faculty of Management
NEW HORIZON COLLEGE
MARATHALLI BANGALORE -560087
2015-2016
DECLARATION
I, THANUSHREE.K a student of New Horizon college Bangalore university,
Bangalore here by affirm that the project work “ A STUDY ON WORKING
CAPITAL MANAGEMENT” is bonafide work carried out entirely by me at
BEML, Bangalore under the guidance of Mrs.AshimaGupta , for partial
fulfilment for the award of bachelor of business management to Bangalore
University, Bangalore.
I also declare that this project has not been submitted to any other university/
institution for the award of any degree.
Place: Bangalore Name: THANUSHREE. K
Date: Reg.no.13VFC24116
GUIDE CERTIFICATE
Certified that the project report entitled “A Study on working capital
management at BEML” submitted by Thanushree.K, for the award of “
Bachelor of Business Management” of Bangalore University, Bangalore is
a record of independent project work under taken by her, under my supervision
and guidance and the project has not be submitted either in part or whole for the
award of any other degree or diploma of any university.
Place : Bangalore MRS. ASHIMA GUPTA
Date: (Internal guide)
HOD CERTIFICATE
This is to certify that THANUSHREE. K(13VFC24116) is bonafide student of
bachelor of business management. The project work entitle “A study on
working capital management at BEML” is bonafide work carried out by
Thanushree. K (13VFC24116) on partial fulfilment of the requirement for the
award of degree in business management of Bangalore university during the
year 2015-2016. It is to certify that all corrections/suggestions have been
incorporated in the project report and a copy is deposited in the department
library. This project work as been approved as it satisfies the academic
requirement for the award of bachelors of business management degree.
Place: Bangalore PRASANNA PRAKASH
Date: (HOD)
PRINCIPAL CERTIFICATE
This is to certify that THANUSHREE.K(13VFC24116) bonafide student of
this college. The project work entitled “A study on working capital
management at BEML” is bonafidework carried out by THANUSHREE.K
(13VFC24116) in partial fulfilment of requirement for the award of degree in
business management of Bangalore University during the year 2015-2016.
Place: Bangalore Dr.BODHI SATHVAN
Date: (principal)
ACKNOWLEDGEMENT
I would like to thank all those persons who have contributed towards the
successful completion of the project work. I am glad to say that working on this
project was illuminating and enjoyable for me.
I take this opportunity to thank our respected chairman Sri.Mohan Manghnani,
and our beloved principal Dr. Bodhi Sathvan for their generosity and kindness
to embrace us in, New Horizon college, Bangalore university .I have deep sense
of gratitude to Mrs. PrasannaPrakash professor and head of the department.
And Mrs. Ashima Gupta my internal project guide for her encouragement,
guidance and valuable suggestions throughout the project.
I deem it a great pleasure in acknowledge my external guide Mrs.Vijaya
Lakshmi, for her kind heart in allowing me to do the project work in the
organization and for his able guidance, expert advice and encouragement.
I would like to thank all the faculty members of BBM and my friends who
directly and indirectly helped me to complete this project.
Words fail me in expressing my deep sense of gratitude and affection to my
parents, for their constant love and moral support without them I could not have
been what I am.
THANUSHREE.K
(13VFC24116)
CONTENTS
Sl. No
CONTENTS
PAGE.
NO
1 Introduction
1-15
2 Company profile
16-42
3 Research design
43-44
4 Analysis and interpretation
45-73
5 Findings, suggestions and
conclusion
74-76
Bibliography
77
Annexure
78-83
LIST OF TABLES
TABLE
NO
TITLE OF TABLES
PAGE NO
1.1 Table showing current ratio 48
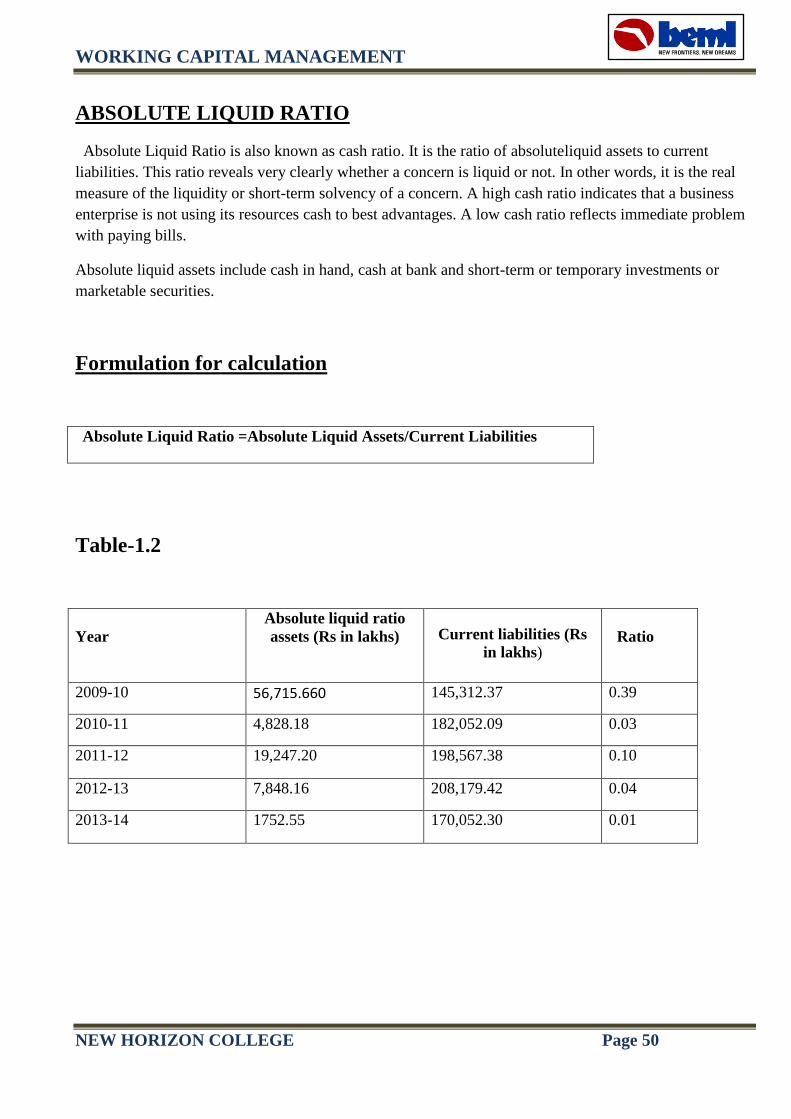
1.2 Table showing absolute liquid ratio
50
1.3 Table showing inventory to working
capital
52
1.4 Table showing inventory turnover ratio 54
1.5 Table showing working capital turnover
ratio
56
1.6 Table showing current assets turnover
ratio
58
1.7 Table showing fixed assets turnover
ratio
60
1.8 Table showing total assets turnover ratio 62
1.9 Table showing net- profit ratio
64
1.10 Table showing proprietary ratio
66
1.11 Table showing fixed assets to net worth
ratio
68
1.12 Table showing current assets to net
worth ratio
70
1.13 Table showing current liabilities to net
worth ratio
72
LIST OF GRAPHS
TABLE
NO
TITLE OF GRAPHS PAGE
NO
1.1 Graph showing current ratio
49
1.2 Graph showing absolute liquid ratio
50
1.3 Graph showing inventory to working
capital
53
1.4 Graph showing inventory turnover
ratio
55
1.5 Graph showing working capital
turnover ratio
57
1.6 Graph showing current assets turnover
ratio
59
1.7 Graph showing fixed assets turnover
ratio
61
1.8 Graph showing total assets turnover
ratio
63
1.9 Graph showing net profit ratio
65
1.10 Graph showing proprietary ratio 67
1.11 Graph showing fixed assets to net
worth ratio
69
1.12 Graph showing current assets to net
worth ratio
71
1.13 Graph showing current liabilities to
net worth ratio
73
EXECUTIVE SUMMARY
A Study on working capital management at “BEML”
Working capital management most significant part of assets of large majority of the
companies..
Suitable measures to overcome them and to find out the operating strength and weakness of
the firm.
The scope was to considering the availability of time, information and sources Of study is
confined to the performance of BEML. This study aims at analyzing the overall working
capital management of the company by using various tools and techniques.
The limitations was availability of information for the working capital management at
company was limited and restricted.
The findings are total working capital growth showing the progress trend. As the company
can use just in time technique, so that cost incurred on raw materials can be saved. The major
part of the inventory can be seen in raw materials and finished goods and remaining part in
work in progress.
The project work at working capital management has given me a clear idea of an
organization. The internship helped me a lot in theoretical concepts, which I learnt in my
regular course.
WORKING CAPITAL MANAGEMENT
NEW HORIZON COLLEGE Page 1
CHAPTER-1
INTRODUCTION
FINANACE
Financial is the science of funds management. The general areas of finance are business finance,
personal finance, and public finance. Finance includes saving money and often includes lending money.
The field of finance deals with the concept of time, money risk how they are interrelated. It also deals
with how money is spent and budgeted, finance works most basically through individual and business
organisations depositing money in a bank. The bank then lends then money out to other individuals or
corporations for consumption or investment, and charges interest on the loans.
Loans have become increasingly packaged for resale, meaning that an investor buys the loan (debt) from
a bank or directly from a corporation. Bonds are debt sold directly to investor from corporation, while that
investor can hold the debt and collect the interest or sell the debt on a secondary market. Banks are the
main facilitator of funding through the provision of credit, although private equity, mutual funds, hedge
funds, and other organisation have become as important as they invest in various forms of debt. Financial
asset, know as investments, are financially managed with careful attention to financial risk management
to control financial risk. Financial instruments allow many forms of securitised asset to be traded on
securities exchanges such as stock exchanges, including debt such as bonds as well as equity in publicly-
traded corporation. Central banks , such as the federal reserve system banks in the united states and bank
of England in the united kingdom , are strong players in public finance , acting as lenders of last resort
as well as strong influence monitory and credit conditions in the economy.
Finance is also considered to be the life blood of business. Financial management is concerned with
procurement and utilization funds in a proper way. Therefore, financial management enjoys great
importance in an organization. Financial management is crucial for the success of a business.
IMPORTANCE OF FINANCE
Finance is associated with plans and results of every functional department because every proposal and
every decision entails financial problems and has an influence on financial results. Finance is an
important function of every organization and its importance is listed below:
To set up an enterprise is very necessary.
For achievement of organizational goals finance is necessary.
Knowledge of finance and its tools and techniques provide strong and sound basis for making decision
in all business matters.
WORKING CAPITAL MANAGEMENT
NEW HORIZON COLLEGE Page 2
For the achievement of wealth maximization gaols, finance required.
Finance helps business entrepreneurs and management in getting over there business problems.
Finance is important for increasing the market value of the shares.
TRADITIONAL APPROACH TO FINANCE
Traditional financial theory or approach to finance was positive in its nature as it was rather collection or
review of “ rules “ used by investors and managers in decision making process than consistent and
complete explanation of reason lending to and consequence following the financial decisions. The aim of
the traditional approach to finance was discovered encompass financial decisions that proved worthy in
practise over longer period of time and afterwards established characteristics of chosen assets are
companies that made those very same decisions. At that time it seemed to be a way to construct some
kind of rules of decisions-making in finance.
Approach to decision- making when it came to investment as explained by Graham and Dodd (1951)
became very popular at that time. Their rule are rather suggestion on how to efficient chose among
financial assets was to by the asset that were under – priced and sell those that were over-period, which is
obviously a no – brainer sense of what to do once u know which asset are mispriced. The real question is
how to discover the mispriced assets. Graham Dodd for example identified characteristics of the
company‟s stock that may cause stock to be mispriced.
Traditional approach was primarily based on actual behaviour of investor and managers. It attempted to
define characteristics of financial assets and companies that affect the behaviour and decision – making
process as well as the way they affect them it did not assume some sort of universal rational behaviour of
the people (was not normative in its nature), but rather extracted “best practice “(was positive in its
nature) with respect of decision- making process by observing actual behaviour of people in given
environment and time.
MODERN FINANCIAL THEORY
The beginnings of the modern financial theory in finance are marked with contributions made by
Markowitz (1952) , Kendal (1953) , Modigliani and miller (1958) and Sharp (1964). Foundations, on
which the modern financial theory was put on, were drawn from the neoclassical economic theory, which
assumes rational behaviour of the individuals. The effectively meant that universal financial theory could
be derived under certain assumptions.
Individuals undertake financial decisions that maximize their welfare.
The welfare is at its maximum, when the utility of the consumption is at its maximum.
The utility of the consumption is at its maximum, when the consumption is at its maximum.
WORKING CAPITAL MANAGEMENT
NEW HORIZON COLLEGE Page 3
The consumption is at its maximum, when value of investor‟s financial assets is at its maximum.
The value of financial assets is maximized when with respect to each other.
1. Expected returns are maximized.
2. Expected returns occur in the nearest possible future.
3. Probably that expected returns materialize is maximize.
Individuals can:
1. Accurately measure risk and.
2. Being risk averse.
3. Can translate measured risk into additional required return from an investment.
4. Can trade financial assets at prices that equal additional expected return with additional required
returns.
FINANCIAL MANAGEMENT
Management of funds is a critical aspect of financial management. Management of funds acts as
thereforemost concern whether it is a business undertaking or in an educational institution. Financial
management is simply meant dealing with management of money matters.
MEANING OF FINANCIAL MANAGEMENT
Financial management means efficient use of economic resource namely capital funds. Financial
management is concerned with the managerial decision that results in the acquisitions and financing of
short term and long term credits foot the firms. It deals with the situation that required selection of
specific assets, or a combination of affects on the selection of specific problem of size and growth of an
enterprise. Herein the analysis deals with the expected inflows and outflows of funds and their effect on
managerial objectives. In short, financial management deals with procurement of fund and their effective
utilization in the business.
The analysis simply states two main aspects of financial management;
1. Procurement of funds and
2. Effective use of funds to achieve business objectives.
WORKING CAPITAL MANAGEMENT
NEW HORIZON COLLEGE Page 4
SCOPE OF FINANCIAL MANAGEMENT
Sound financial management is essential in all types of organizations whether it be profit or non
profit. Financial management essential in a planned economy as well as in a capitalist set-up as it involves
efficient use of the resources. Financial management optimizes the output from the given input of funds.
In a country India where resources are scarce and the demand for funds are many; the need for proper
financial management is required. In case of newly started companies with high growth rate it is more
important to have sound financial management since finance alone guarantees their survival. Financial
management is very important in case non profit organizations, which do not pay adequate attentions to
financial management. However a sound system of financial management has to be cultivated among
bureaucrat‟s administrators, engineers, educationalist and public at large.
FINANCIAL SYSTEM
The world “system “, in that term “financial system”, implies a set of complex and closely or
interlined institutions, agents,practices,markets, transactions, claims, and liabilities in the economy. The
financial system is concerned about money; credit and finance the three terms are intimately related yet
are somewhat different from cash. Other Indian financial system consists of financial market,
financialinstruments and financial intermediation.
PURPOSE OF FINANCIAL SYSTEM
Financial systems help to inform your organization‟s planning and action plans. Financial systems
also help you to track and manage the resource required to successfully complete your work. These tips
provide basic practices you will need to build financial sustainability in your organization. Demonstrating
good stewardship of resources assists CSOs in efforts to be accountable to stakeholders and funders, and
helps build confidence that your organization isa good place for funders to invest.Other reasons why
developing financial system is important include:
Financial system and capacity help the organization to make sound decision based on cash flow and
available resources.
Monitoring funds, or comparing actual income and expenses virus budgeted amounts, help managers
ensure that the necessary funds are in place to complete an activity.
Most government require that registered charitable organizations which create accounts that track
income and expenses.
Funders require reports that demonstrate the grants which were used for intended purpose.
Establishing financial controls and clear accounting procedures help to ensure that fund are used for
intended purposes.
Transparency, clear planning and realistic projections contribute to the creditability of the
organization.
WORKING CAPITAL MANAGEMENT
NEW HORIZON COLLEGE Page 5
FINANCIAL STATEMENTS
Financial statements are formal records of the financial activities of a business, person, person or
other entity. In British English, including United Kingdom company law, financial statements are often
referred to as accounts, although the term financial statements are also used, particularly by
accountants.Financial statements provide an overview of a business or person‟s financial condition both
short and long term. All the relevant financial information of a business enterprises presented in a
structured manner and in a form easy to understand is called the financial statements.
There are four basic financial statements;
1. Balance sheet: It also referred to as statement of financial position or condition, reports on a
company‟s assets liabilities, and Ownership equity at a given point in time.
2. Income statements: It also referred to as profit and loss statement, reports on a company‟s income and
expenses profit over a period of time. Profit and loss accounts provide information on the operation
of the enterprise. These include sale and the various expenses incurred during the processing state.
3. Statement of retained earnings: It explains the changes in a company‟s retained earnings over the
reporting period.
4. Statement of cash flows: It reports on a company‟s cash flow activities, particularly its operating,
investing and financial activities.
PURPOSE OF FINANCIAL STATEMENT
“The objectives of financial statements is to provide information about the financial position
performance and changes in financial and changes in financial position of an enterprise that is useful to a
wide range of users in making economic decision”. Financial statements should be most understandable,
relevant and comparable. Reported assets, liabilities and equity are directly related to an organisation‟s
financialposition. Reported income and expenses are directly to an organization‟s financial position.
Financial statements are intended to be under stable by readers who have “a reasonable knowledge of
business and economic activities and accounting who are willing to study the information diligently”.
Financial statements may be used by users for different purposes.Owners and Managers require financial
statements to make important business decision that effect its continued operations. Financial analysis is
then performed on these statements to provide management with a more detailed understanding of the
figures.
These statements are also used as part of management‟s annual report to the stockholders.
Employees also need these reports in making collective bargaining agreements with the managements,
in the case of labour unions or for individuals in discussing their compensation, promotion and
rankings.
Prospective investors make use of financial statements to access the viability of investing in a business.
Financial analyses are often used by investors and are prepared by professionals, thus providing them
with the basis for making investment decisions.
WORKING CAPITAL MANAGEMENT
NEW HORIZON COLLEGE Page 6
Financial institutions use them to decide whether to grant a company with fresh working capital or
extend debt securities to finance expansion and other significant expenditures.
Government entities (tax authorities) need financial statements to ascertain the propriety and accuracy
of taxes and other duties declared and paid by a company.
Vendors who extend credit a business require financial statements to access the credit worthiness of
the business.
Media and the general public are also interested in financial statements for a variety of reason.
WORKING CAPITAL MANAGMENT
INTRODUCTION
Working capital is the blood and nerve centre of a business. Just as circulation of blood is
essential in the human body for maintaining life,working capital is very essential to maintain the smooth
running of a business .No business can run successfully without an adequate amount of working capital.
Working capital refers to that part of firm‟s capital which is required for financing short term or current
assets such as cash, marketable securities, debtors and inventories. In other words working capital is the
amount of funds necessary to cover the cost of the operating enterprise.
MEANING:
Working capital means the funds (i.e. capital) available and used for the day to day operation (i.e.
working) of an enterprise.
It refers to funds which are used during an accounting period to generate a current income of a type
which is consistent with major purpose of a firm existence.
DEFINITION:
According to Weston& Brigham-
”Working capital refers to a firm‟s investment in short term assets such as cash accounts receivables,
inventories etc”.
According to J.S.Mill-
“The sum of the current assets is the working capital of the business”.
WORKING CAPITAL MANAGEMENT
NEW HORIZON COLLEGE Page 7
CONCEPT OF WORKING CAPITAL
1) Gross working capital
It refers to the firm‟s investment invarious components like currentassets namelycash, marketable
securities, raw materials, work in progress, receivables etc.current assets are the assets which can be
converted into cash with in an accounting year.
The gross working capital concept focuses attention on two aspects of current asset management:
Optimum investment in current assets
Financing of current assets.
2) Net working capital
It considers both current assets and current liability .It refers to the difference between current
assets and current liabilities .current liabilities are those claims of outsiders which are expected to mature
for payment within an accounting year like sundry creditors ,outstanding expenses , short term loans ,
bank over draft, dividends and payable etc.
Net working capital =Current Assets – Current Liabilities
Net working capital is a qualitative concept and it indicates the:
Liquidity position of the firm.
Suggests the extent to which working capital needs may be financed by permanent sources of funds.
OBJECTIVES OF WORKING CAPITAL
Every business needs some amount of working capital. It is need for following purposes:-
For the purchase of raw materials, components and spares.
To pay wages and salaries.
To incur day to day expenses and over head cost such as fuel, power, and office expenses etc.
To provide credit facilities to customers etc.
WORKING CAPITAL MANAGEMENT
NEW HORIZON COLLEGE Page 8
FACTORS THAT DETERMINE WORKING CAPITAL
The following factors determine the amount of working capital;
Size of business:
A business size may be measured in terms of a scale of operations. A firm with larger scale of
operation will need more working capital than small firm.
Manufacturing cycle:
Longer the manufacturing process, the higher will be requirements of working capital and vice versa.
Production policy:
The production schedule has a great influence on the level of inventories. In case of labour intensive
industry, working capital requirement will be more. While in case of highly automated plant
requirement of long –term fund is more.
Terms of purchase and sales:
A firm, which allows liberal credits to its customers may enjoy higher sales but will need more
working capital as compared to a firm enforcing strict credit terms.
Business cycle:
Business expands during the period of prosperity and declines during the period of depression.
Consequently, more working capital is required during the period of prosperity and less during the
period of depression.
Growth and Expansion:
If business firm has ambitious plan for expansion, it requires more working capital to fulfil
requirements.
Fluctuations in the supply of raw materials:
Certain companies have to obtain and maintain large reserves of raw materials due to their irregular
sales and intermittent supply. Thus working capital requirements of such industries are lard.
Price level changes:
Generally, rising price levels will require a firm to maintain higher amount of working capital. The
same level of current assets will need increased investment when prices are increasing.
Profit margin:
A net profit margin contributes towards the working capital poor. In fact net profit is a source
working capital to the extent it has been earned in cash.
WORKING CAPITAL MANAGEMENT
NEW HORIZON COLLEGE Page 9
Length of operating cycle:
Operating cycle of the firm also influence the working capital. Longer the Orating Cycle, the higher
will be the working capital requirement of the organization.
SOURCES OF WORKING CAPITAL The working capital requirements should be the met both from short-term as well as long-termsource of
funds.
Financing of working capital through short term source of funds has the benefitsof lower cost and
establishing close relations with banks.
Financing of working capital through long term source provides the benefits of reduce risk and
increase liquidity.
NEED FOR WORKING CAPITAL
The need for working capital gross or current assets cannot be over emphasized.
As already observed, the objective of financial decision making is to maximize the shareholders
wealth.
To achieve this, it is necessary to generate sufficient profits can be earned will naturally depend upon
the magnitude of the sales among other things but sales cannot convert into cash.
There is a need for working capital in the form of current assets to deal with the problem arising out
of lack of immediate realization of cash against goods sold.
Therefore sufficient working capital is necessary to sustain sales activity.
Technically this is refers to operating or cash cycle.
If the company has certain amount of cash, it will be required for purchasing the raw materials may
be available on credits basis.
Then the company has to spend some amount for labour and factory overhead to convert the raw
material in work progress, and ultimately finished goods.
WORKING CAPITAL MANAGEMENT
NEW HORIZON COLLEGE Page 10
The amount required to be invested in this current assets is always higher than the funds available
from current liabilities.
This is the precise reason why the needs for working capital arise.
TYPES OF WORKING CAPITAL
Working capital can be divided into two categories:
a) Permanent working capital :
It refers to that minimum amount of investment in all current assets which is required at all times to
carryout minimum level of business activities
b) Temporary working capital:
The amount of such working capital keeps on fluctuating from time to time on the basis of business
activities.
Operating cycle
Operating cycle is the durations required to convert sales into cash after the conversion of resources into
inventories. So Operating cycle can be known as following:
Raw materials.
Work in progress.
Cash from Debtors collections.
Sales
Finished goods, credit sales & cash sales.
Operating cycle may be of two types:
a) Gross Operating Cycle
Gross operating Cycle is the total time period from the conversion of raw material into finished goods
and finished goods into sales and then sales into cash.
WORKING CAPITAL MANAGEMENT
NEW HORIZON COLLEGE Page 11
b) Net Operating cycle
As we provide period to debtors for the payments, our creditors also provide period to us for payment
to them. So this reduces our requirements of working capital. This also affects the operating cycle.
Operating cycle length reduces with so many days as provided by the creditors to us. The difference
between gross operating cycle and period allowed by the creditors for payment is known as net
operating cycle.
ADVANTAGES OF WORKING CAPITAL
1) It helps the business concern in maintaining the goodwill.
2) It can arrange loans from banks and others on easy and favourable terms.
3) It enables a concern to face business crisis in emergencies such as depression.
4) It creates an environment of security,confidence, and the overall efficiency in a business.
5) It helps maintaining solvency of the business.
DISADVANTAGES OF WORKING CAPITAL
1) Rate of return on investment also fall with the shortage of working capital.
2) Excess working capital may result into overall inefficiency in organization.
3) Excess working capital means idle funds which earn no profits.
4) Inadequate working capital cannot pay its short term liabilities on time.
COMPONENTS OF WORKING CAPITAL
1) Current Assets:
Inventories:
Inventories represent raw materials and components, work-in-progress and finished goods.
Trade Debtors:
Trade Debtors comprise credit sales to customers.
Prepaid Expenses:
These are those expenses, which have been paid for goods and service whose
Benefits have yet to be received.
Loan and Advances:
They represent loans and advances given by the firms for a short period of time.
WORKING CAPITAL MANAGEMENT
NEW HORIZON COLLEGE Page 12
Investment:
These Assets comprise short-term surplus funds invested in government securities, shares and short-
terms bonds.
Cash and Bank Balance:
These assets represent cash in hand and at bank, which are used f meeting operations requirements.
One thing you can see here is that this current assets is purely liquid non- productive.
2) Current Liabilities:
Sundry creditors :
These liabilities stem out of purchase of raw materials on credit terms usually for a period of one to
two months.
Bank overdrafts:
These include withdrawals in excess of credit balance standing in the firm‟s current accounts with
banks.
Short-terms Loans:
Short-term borrowings by the firm from banks and others form part of current liabilities as short-term
loans.
Provision:
These include provision for taxations, proposed dividends and contingencies.
THREAT OF EXCESSIVE WORKING CAPITAL
Excessive WC means idle funds which earn no profit for the business and hence, business cannot
earn a proper rate of return on its investments.
When there is redundant WC, it may lead to unnecessary purchasing and accumulation of inventories
causing more chance of theft, waste and losses.
Excessive WC implies excessive debtors and defective credit policy which may cause higher
incidences of bad-debts.
It may result in overall inefficiency in org.
When there is excessive WC, relationships with banks and other financial institutions may not be
maintained due to low rate of returns on investments, the value of shares may also fall.
Availability of excess working capital may lead to carelessness about cost, and therefore, to
inefficiency of operations.
WORKING CAPITAL MANAGEMENT
NEW HORIZON COLLEGE Page 13
IMPORTANCE OF ADEQUATE WORKING CAPITAL
The main advantage of maintain adequate amount of working capital is as follows:
Solvency of business :
Adequate working capital helps in maintaining solvency of the business by providing uninterrupted
flow of production.
Goodwill :
Sufficient working unable a business concern to make prompt payments and hence helps in creating
and maintaining goodwill.
Easy loans:
A concern having adequate working capital, high solvency and good credit standing can arrange loans
from banks and other on easy and favourable terms.
Cash discount :
Adequate working capital also unable a concern to avail cash discounts on the purchase and hence it
reduces cost.
Regular supply of raw materials:
Sufficient working capital ensures regular supply of raw materials and continuous production.
Regular payment of salaries, wages and other day commitment:
A company which has ample working capital can make regular capital salaries, wages and other day
to day commitments which raise the morale of its employees, increase their efficiency, reduces
wastage and cost and enhances production and profile.
Exploitation of favourablemarket condition :
Only concerns with adequate working capital can exploit favourable market conditions such as
purchasing its requirement in bulk when the prices are lower and by holding its inventories for higher
prices.
Ability of face crisis :
Adequate working capital enables a concern to face business crisis in emergencies such as depression
because during such periods, generally, there is must presence on working capital.
Quick and regular return on investment:
Every investor wants a quick and regular return on his investments. Sufficient of working capital
enables a concern to pay quick dividends to its investors as there may not be much pressure to plough
back profit. This gains the confidence of its investors and creates favourable markets to raise additional
funds in future.
WORKING CAPITAL MANAGEMENT
NEW HORIZON COLLEGE Page 14
High morale :
Adequacy of working capital creates an environment of securities, confidence, and high morale and
creates overall efficiency in a business.
APPROACHES TO WORKING CAPITAL
There are 3 approaches
Matching or hedging approach.
Conservative approach.
Aggressive approach
Matching or hedging approach
The firm can adopt a financial plan which matches the expected life of assets with the expected life of
the source of funds raised to finance assets. When the firms follow the matching approach (known as
hedging approach), long-term financing will be used to finance the fixed assets and permanent current
assets and short-term financing to finance temporary or variable current assets.
When the firm uses long term sources to finance fixed assets and permanent current assets, short term
financing to finance temporary assets
.
Conservative approach:
Under this approach a firm finances its permanent assets and also a part of temporary current assets
with long term financing. It relies heavily on long term financing and is less risky so far as solvency is
concerned, however, the funds may be invested in such instruments which fetch small returns to build
up liquidity. This adversely affects profitability.
The financing policy of the firm is said to be conservative when it depends more on long term funds
for financing needs. Under conservative plan, the firm finances its permanent assets and also a part of
temporary current assets with long term financing.
Aggressive approach
A firm may be aggressive in financing its assets. An aggressive policy is said to be followed by the
firm when its users more short term financing than warranted by the matching plan. Under an
aggressive policy, the firm finances a part of its permanent current assets with short term financing.
WORKING CAPITAL MANAGEMENT
NEW HORIZON COLLEGE Page 15
The firm uses more short term financing than what is justified, in this approach. The firm finance a
part of its permanent current assets with short term financing. This is more risky but may have to the
return on assets.
SOURCES OF WORKING CAPITAL
Sources of working capital can be broadly divided into 2 types
1. Internal sources
2. External sources
Internal sources
1. Provisions.
2. Retained earnings.
3. Depression fund.
External sources
1. Bank credit.
2. Customer advances.
3. Short term public deposits.
4. Instalment credit.
5. Factoring.
6. Commercial papers.
7. Indigenous banker.
8. Trade credit.
9. Outstanding expense,
10. Depression.
11. Share capital.
WORKING CAPITAL MANAGEMENT
NEW HORIZON COLLEGE Page 16
CHAPTER-2
INDUSTRY AND COMPANY PROFILE
BEML Limited (formerly Bharat Earth Movers Limited) was established in May 1964 as a public
sector undertaking for manufacture of Rail coaches & spare parts and Mining Equipment at its Bangalore
complex. The company has partially disinvested and presently Government of India owns 54 percent of
total equity and rest 46 percent is held by public, financial Institutions, Foreign Institutional Investors,
Banks and Employees.
BEML Limited , a „Miniratna-Category-1‟, plays a pivotal role and serves India‟s core sectors like
defence , Rail, power , Mining and Infrastructure. The company started with a modest turnover of 5Cr
during 1965 and today, thanks to the diverse business portfolio, the company has been able to a turnover
of more than 3,500 Cr. Its three major business verticals viz., Mining &construction, Defence Rail and
Metro are serviced by its nine manufacturing units located in Bangalore, kola gold Fields (KGF), Mysore,
peaked and subsidiary-Vigny an Industries Ltd, in chikmangalur District. BEML‟s are sold and serviced
through its large Marketing Network spread all over the country. BEML‟s products are exported to more
than 56 countries. AS part of company„s globalization strategy, the company has expanded its global
reach by opening local company at Indonesia and Brazil recently in addition to Malaysia and china
offices.
The company operates under these major Business vertical-viz. Mining and construction, Defence and
Rail and Metro. Each of the above business is headed by a Director who acts as CEO of the business and
reports to the chairman & Managing Director of the company.
In addition to the above, Technology Division of the company provides end-to-end technology solutions
in Auto,Aero,Defence,Rail, and Metro areas. Trading division deals in non-company products. BEML
manufactures and supplies Defence Ground Support Equipment such as Tetra based high Mobility Trucks
, Recovery Vehicles, Bridge system , Vehicle for missile projects, Tank Transportation Trailers ,
MalarialWagons , mine ploughs , Crash fire Tenders, Snow cutters, Aircraft Towing tractors, Aircraft
weapon Loading Trolley. The Company also plans to take up overhaul and up gradation of Battle Tanks
with a view to assemble and roll out the products. Under Mining and Constructing Business, the company
manufactures and supplies mining and construction equipment like Bulldozers, Excavators, Dumpers,
shovels, Loaders andMotor Grades to various user segments and under Rail and Metro Business,
manufactures and supplies Rail coaches, Metro Cars, AC EMU‟s OHE Cars, steel and Aluminium
Wagons to the rail sector.
The company has a dedicated R&D Infrastructure and team in line with consistent policy of the company
to meet the technological demands through in –house R&D and strategic technical tie-ups with global
players.
WORKING CAPITAL MANAGEMENT
NEW HORIZON COLLEGE Page 17
BEML operates on the major business verticals for associated equipment manufacturing:
Mining & Construction.
Defence.
Rail & Metro.
In addition to the above there are three strategic Business Units (SBUs):
Technology Division for providing end-to-end engineering solutions.
Trading Division for dealing in non – company products.
International Business Division for export activities.
Thecompany has 9 manufacturing units spread over the following locations:
Kolar Gold Field (KGF) complex (around 100 km from Bangalore).
EarthMoving Division.
Rail Coach unit II
Heavy Fabrication unit
Hydraulic & Power line Division.
Mysore Complex (around 130 km from Bangalore).
Truck Division.
Bangalore complex –Rail & Metro Division.
Palakkad Complex
Vigny an industries, a subsidiary located at Tarikere (around 300 km from Bangalore)- Steel Castings.
BEML‟s nationwide network of sales offices enables buyers with ready access to its wide range of
products.Also, the full-fledged service centres and parts depot offer total equipment care, maintenance
contracts and rehabilitations services.
The company has been registering consistent growth in sales and profits and has made a turnover of
3,648 Cr in 2011-12 registering a growth of 18% over the previous year with a profit Before tax of 320 Cr
and has orders on hand of over 7066 Cr as of end march 2012.
The company had drawn up VISION-2013 with an ambitious growth rate of 12% CAGR for crossing
5,000 Cr in the next 2 years and is poised to achieve 10,000 Cr mark by 2013-17 and the company is
gearing up with necessary infrastructure for achieving the same.
WORKING CAPITAL MANAGEMENT
NEW HORIZON COLLEGE Page 18
VISION & MISSION
VISION
To become a market leader, as a diversified company supplying products and services to Mining
&Construction, Railway & metro and Defence services and emerge as an International player.
MISSION
Improve competitiveness through organizational transformational and collaboration or strategic
alliances/ joint ventures in technology.
Grow profitability by aggressively pursuing opportunities in national and international markets.
Attract and build people in a rewarding and inspiring environment by fostering creativity and
innovation.
OBJECTIVES
To maintaina dominant position in design, Development Manufacture and marketing of
defence,Earthmoving & Constructing and Rail & Metro equipment.
To diversify and grow.
To provide total engineering solutions to its customers.
To internationalize operations by enhancing exports
To improve profitability.
To maintain state-of -the -Art technology for all products.
Re-orientation of the business operations to match present scenario.
Continuous building of skills and competencies to bring about executive effectiveness for management
succession.
BEML Limited views quality improvement as a business strategy and hence remains pro-active in the
areas of products and services quality. At BEML, a corporate quality policy emphasizing total quality
management ensures that quality system adopted results in products, services and process that meet
stringent standards and the trust towards total quality management.
All the manufacturing units of the company have been certified for ISO 9001-2008 quality
management System (QMS). The KGF complex, Bangalore complex and Mysore complex is certified
for BS OHSAS 18001-2007 OHASAS Integrated Management System (IMS) and Engine division,
Mysore complex is certified for AS9100B Aerospace certification.
WORKING CAPITAL MANAGEMENT
NEW HORIZON COLLEGE Page 19
BUSINESS DIVISIONS
Mining & Construction Business
BEML Limited offers a comprehensive and diverse range of mining machinery for both opencast
and underground mines. BEML produces machines such as Electric Rope Shovels, Hydraulic
Excavators,Bulldozers, Wheel Loaders, Wheel dozers, and Dump trucks, motors Graders, pipe Layers,
TyreHandlers, Water Sprinklers and Backhoe Loaders. Beside BEML also manufactures mammoth
Walking Draglines for cost –effective operations in the opencast mines. BEML has ventured into
underground mining with products such as side Discharge Loader, Load Haul Dumper, winch, winder,
Granby Car, Skip etc. The boom in the mining industry has opened new avenues for BEML in contract
mining.
BEML has formed a joint venture company with its partners, Midwest granite Limited and Pt.
Slumber Mitre Jaya, Indonesia to take up mining within the country and overseas. The joint venture
company is called BEML-Midwest Limited and the company will bid for coal other mining contracts in
India and abroad.
Mining & construction
Backhoe Loaders
WORKING CAPITAL MANAGEMENT
NEW HORIZON COLLEGE Page 25
Rail & Metro Business
In recentyears, BEML limited has forayed in high –tech Metro developed for Intra-city
commuting. BEML is expanding its infrastructure to meet the greater needs of metro projects coming up
in the country. Also ,BEML supplies equipment to Indian Railways which include integral Rail coaches,
Overhead Electric Inspection Cars, postal Vans, AC/DC Electric Multiple Units, D-EMUs, Utility Track
Vehicles, track Laying Equipment , Board-Gauge Rail Bus, Treasury Vans, and Spoil Disposal Units, etc.
Rail & Metro
Stainless steel Metro cars
WORKING CAPITAL MANAGEMENT
NEW HORIZON COLLEGE Page 31
Defence business
Being India‟s leading defence equipment manufacturer, BEML Limited Keeps the Indian Army
and other defence forces abreast with state-of-the-art military equipment. The company
manufactures variants of Tetra vehicles for all terrain operations including Bridge Layer, Field Artillery
Tractor, Medium & Heavy Recovery Vehicle, pontoon Mainstream Bridge system, Crash Fire Tenders,
Mobile Mast Vehicle, etc. BEML also supplies Engineering MinePloughs, Tanks Transportation Trailers,
Weapon Loading Equipment, Armoured Recovery Vehicle, Malarial Coaches and Wagons apart from
Aircraft Weapon Loading Trolley and Aircraft Towing Tractor. BEML plays a stellar role in the
country‟s Integrated Guided Missile Development Project by supplying ground support vehicles. The
company has also created a world class test track at its KGF complex to test defence equipment and
vehicles.
Aerospace Business
BEML Limited, in its drive towards continuing diversity, from its current product configurations of
mining 7 Construction, Rail & Metro and Defence sectors, has forayed into Aerospace business. Taking
advantage of the global and domestic opportunities available in the fast expanding aerospace market in
India , and the “Off-set “ policy laid down for defence procurement by Government of India, BEML
launched its Aerospace vertical in its technology division during the year 2007 to exploit the potential of
the engineering service in the aerospace domain. Subsequently, a new Aerospace Manufacturing
Division was launched during Aero India 2009. Sri Pradeep Kumar, then Secretary, Defence production
inaugurated the new aerospace manufacturing division on 12th
February 2009.
The Aerospace vertical of the Technology Division provides expert services like CAD/CAE & NPDs;
offers high quality customized engineering services & solutions, extensive experience and inherent
strength in product design & development. Technology division have certifications of CEMILAC, ISO
9001:2000 & NABL.
BEML is already supporting the aerospace operations by supporting Ground support Equipment such
as Aircraft Towing Tractor (ATT), Multi-purpose weapon Loader (WPWL- Bhīma) and Crash Fire
Tender (CFT). The manufacturing division has scaled up its activities through manufacture & supply of
wide variety of jigs , fixtures, Ground support and test equipment .The other areas of concentration will
be manufacture of gears and hydraulic aggregates to aeronautical standards as BEML has core strength in
these areas. To progress further , the activities are planned in a phased manner with additional
infrastructure to manufacture sheet metal and CNC components leading fabrications of sub – assemblies,
Landing gears in aircraft, manufacture of composites with the ultimate objective of building and testing
fixed wing and rotary wing craft, assembly of UAV from kits and upgrades of aircrafts andhelicopters.
The Aerospace Manufacturing facility is established in Mysore complex of BEML.
WORKING CAPITAL MANAGEMENT
NEW HORIZON COLLEGE Page 32
International Business Division
a) Leader in India and Going Global
BEML Limited has an expanding international presence in more than 52 countries spread worldwide
including Syria, Tunisia, UAE, Jordan Suriname, South Africa, UK, Srilanka, Bangladesh, Philippines,
Indonesia, Oman, Nepal etc. An export house with “star Exporter” status, BEML has proven strengths in
handling large scale trading and counters Trade and has pushed the export of engineering goods as well as
other equipment. Plans are in the offing to set up assembly operations at Morocco, Suriname and
Indonesia in partnership with local players. Besides, BEML has international office-cum-warehouse in
Malaysia and international procurement office in china. BEML has Dealers/Distributor operating from
Syria, Tunisia,Srilanka, & UAEand representatives in Morocco and Suriname. With the effective system
of Extension Service Management, BEML has its marketing network in Middle East, Africa, and Far East
countries. BEML has secured repeat orders from countries like Syria and Tunisia for its products in view
of their commendable performance.
A reliable product with comprehensive service packages attracts new buyers and retains existing
customers. BEML strategically plans on Fleet Optimization study (FOS), Recommended User‟s
profitability (RUP) study and comprehensive after sales support services to achieve higher level of
customer satisfaction. BEML also undertakes long-term maintenance contracts like MARC, FMC with
our esteemed customers.
b) Global Management of BEML
Company has opened its overseas offices in Malaysia and China for sourcing components and parts as
well as for promoting its products in these markets. “BEML Brazil Industrial Ltd” was set up in Brazil for
sales of mining and construction equipment in Latin American countries with a phased local
manufacturing program. The company opened its sales and services centre in Indonesia in August 2009.
Trading Division
“New products & solutions to your new needs”
Trading Division deals with non – company products for internationals trade –both import & export and
for the customer within the country and abroad. Trading division of BEML has been awarded the status of
“TRADING HOUSE”by DGFT.
The Division currently deals in a wide variety of items. It also plans to handle all India distribution of
industrial products & intermediaries from global suppliers. Exports /Imports of high value projects
/products may find BEML„s trading services convenient and valuable. Currently it is working on projects
of ARFF, Soft Shelters, Security & Surveillance on UGV‟s, etc.,
WORKING CAPITAL MANAGEMENT
NEW HORIZON COLLEGE Page 33
To enable us to serve you better and respond to your queries quickly and accurately, we request you to
provide your details of specific needs/proposals. We would prefer to work on projects starting with your
needs and finally arranging a complete solution meting your needs, especiallyfacilitating the same for
Government, Quail Government and other major organizations.
Environment protection
BEML has been evincing keen interest in the forestation programmein and around BEML factory,
township and surrounding areas. Due to concerted efforts of BEML management, over two hundred
thousand trees have come-up in and around KGF and the area is quite green. Normslay down by the water
and air pollution control board have been fully complied with. All the effluents and discharges are
released to the oxidation ponds and recycling arrangements have been carried out on regular basis.
Fulfilment of social Obligation
a) Educational Facilities
KendriyaVidalia of grade+2 levels, a High School, a Primary school, two Nursery schools and junior
college are provided to educate the employee‟schildren. Typewriting and shorthand institute, computer
centres are run for the benefit of employees and employee‟s children.
b) Welfare Measures
Apart from above , Housing (Township)with 1500 Quarters for officers and Employees, Co-operative
stores, sports , Rehabilitation of widows , welfare of physically handicapped , welfare of SC/ST, fully
fledged medical centre with over 100 bed capacity hospital equipped with all modern facilities and a team
of experienced .
doctors and Para medical staff, Transportation facilities, Workers education scheme , Labour welfare fund
schemes, Merit scholarship for employees children , etc., have been provided for the benefit of employees
under welfare Measures .Also a fullyfledged sports complex with a stadium having a seating capacity of
around 15000 to 20000 personnel and a
well maintained swimming pool, Golf course , Lawn Tennis court, shuttle Badminton hall, Billiards ,
Carom , Squash and a health club with modern equipments are the other facilities available for up keep of
health and sports activities . Tournaments are held at regular intervals in almost all the sports activities
separately for gents, ladies and children.
For recreations and for conducting cultural programmes there are two Auditoria where films in different
languages are screened weekly and film festivals are also organized occasionally. Kalakshetra& Open Air
Theatre for conducting cultural programmes and other functions are available. Also a fullyfledgedEM-
WORKING CAPITAL MANAGEMENT
NEW HORIZON COLLEGE Page 34
Club for Executives with a beautiful location surrounded with hills on one side and a green lawn & well
maintained garden on the other side has facilities like a TV Hall, Reading Room /Library , Bar, a Guest
house with fully furnished rooms.
c) Society Development
Also BEML plays a vital role in rural development. BEML adopted Village Dasorahosahalli situated 2.5
km from EM Division. Welfare of youth, Blood donation, National savings, Fire protection and
community medical care are the other activities carried out by KGF Complex towards society
development and improvement.
BANGALORE COMPLEX
BEML limited (formerly known as Bharat Earth Movers Limited) as a full –fledged corporation was
established in 1964 with Bangalore Complex as the mother unit. The Bangalore complex (the than Rail
coach Limited) was in existence from 1947 as a part of Aircraft Factory (currently Hindustan Aeronautics
Limited). Initially, the division was manufacturing Rolling stock producing various models of Broad
Gauge Coaches. Subsequently, over the years, the metro Coaches and some of the defence products
manufacture also has been added in this complex.
The products manufactured at Bangalore complex are:
Rail & Metro
Stainless Steel metro cars for DMRC
Passenger Coaches
DC Electric Multiple units
AC Electric units
Overhead Equipment Inspection cars
Rail Bus
Treasury Vans
Spoil Disposal Units
Track Laying Equipment
Sky Bus
MIL Rail Coaches
Utility Track Vehicle (UTV)
WORKING CAPITAL MANAGEMENT
NEW HORIZON COLLEGE Page 35
Defence
Variance on BEML –Tetra Trucks
o Prithvi Missile Launcher
o Field Artillery Tractor
o Crash Fire Tender
o 30m Mobile Mast
o Ammunition Loader
o 15m Bridge –avatar
Pontoon Bridge system
Trailers -50T,20T
Railway products for Defence
o Wagons
o Military Rail
MANUFACTURING FACILITIES
The complex has large sophisticated machines such as CNC Turning Centre, CNC Boring machines,
Vertical Turret lathes and Honing machines in addition to General purpose machines. The dedicated
machines are;
Machine shop
Boring machines for Axle box
AF/Axle Box spring seat machining
Wotan internal girding machine for Axle box
Vertical turret lathe for Axle box machining
Honing machine
Flash butt welding machine for Bush pressing
Hydraulic press 100 T for Bush pressing
WORKING CAPITAL MANAGEMENT
NEW HORIZON COLLEGE Page 36
Sheet Metal
A well – established sheet metal shop has a band of special machines and dedicated machines:
Laser cutting machine
NC shearing machine
Punch press: 40-1000T
Press Brake:40-500T
Material preparation
Optical tracer flame cutting machines
CNC Flame cutting machine
Shot blasting machine for (Rolled section & plates)
Shearing M/C to 30 mm capacity with inbuilt Bevelling for weld joints
Sub Assembly
spot Welding machine
shot blasting machine (Rotary & Conveyor type)
Under Frame
Foil Roll welding machine for welding of corrugated sheets used for Floor
Corrugated rolling machine
Plasma cutting machine
Bogie
Submerged Arc welding sets
Check & straightening machine for Bogie components
Major Assembly & Erection shop
Robot spot welding machine
Roller bending machine for roof skins
Foil Roll-welding M/C for Roof , side wall & End wall of Rail coaches
Roof leak test facility
WORKING CAPITAL MANAGEMENT
NEW HORIZON COLLEGE Page 37
Pre-treatment & painting Shop
Conveyorised painting booth
Shot Blasting facilities for Rolled sections and plates
Coach Delivery shop
Lifting jacks of 16 T capacity
Air brake testing equipments (4 numbers)
Traverses of 75 T capacity (2numbers)
Water leak test facility for Metro cars
Dedicated Facilities
248 M Test track (2numbers) for Metro and AC-EMU testing
Bogie testing machine (3 numbers) up to 60 Ton capacity
Well –established metrological laboratory for Quality products
Well –laid Railway lines inside the production shops for smooth stage production
Railway sidings for delivery of coaches and receipt of raw materials.
Welding Fabrication Associated Facilities
Marketing & sales
BEML Limited has nationwide marketing network for sales and service of construction equipment
spread across 22 statesthenational capital region and 2 Union Territories.
A part from the domestic market penetration, BEML‟s machines reach over 52 countries worldwide
covering Asia, Africa, Latin America and the Middle East. With the plans to increasing global presence,
BEML has set up overseas office and entering strategic alliances. Shoring up its revenues in the
International Business is an immediate priority to BEML. It has established its international offices in
china and warehouse at Malaysia. BEML has already established marketing base in Brazil, Which will be
followed by an assembly plant.
WORKING CAPITAL MANAGEMENT
NEW HORIZON COLLEGE Page 38
Application Engineering
BEML offers application engineering to its customers, which includes preparation of pre-feasibility
reports, equipment selection studies, total fleet optimization solutions and customizationof equipment.
Recommendation-for-user-profit (RUP) studies enable customers to improve machine productivity and
reduce operating costs.
SERVICES & NETWORK
BEML’s nation –wide after-sales services network includes
4 zones Offices
10 Regional Offices
16 District Offices
15 Dealers and the number is growing to cover countrywide for the smaller/ construction
equipment sector, exclusively
5 Service centre
11 Activity Centres
Each office in the vast Network, is headed by a senior manager for product support at pit-head/ on-site,
for Erection &Commissioning, Maintenance, Trouble-shooting, condition Based Monitoring (CBM),
Training, Total support for Mid –life Overhauling & Major Rehabilitation of Equipment for availability &
productivity.
BEML‟s after – sales service is available for the life of the equipment. The product support packages
include Annual Maintenance Contracts (AMC), Annual Service contracts Maintenance and repair
contracts(MARC) and Guaranteed Availability & spare consumption contract
BEML has established a full- fledged service Training centre at KGF and Mysore complexes for offering
variety of programmes, scheduled round-the-year.
BEML Services centres
BEML has established 5 services centres close to customer sites to offer customers, economic repair
solutions, Recon-Exchange of major Aggregates like Engine, Transmission, Hydraulic pumps , Rear
Axle, etc, Andrehabilitation of equipment. All these service centres are backed by spare parts Depots and
net-worked with company-wide ERP system.
WORKING CAPITAL MANAGEMENT
NEW HORIZON COLLEGE Page 39
Nagpur Service Centre
Services Offered
Reconditioning / Repair of Hydraulic pumps of Excavators
Recon Exchanges & Offer of Reconditioned Assemblies
Rehabilitation of Equipment
Hyderabad services centre
Services Offered
Reconditioning / Repair of Hydraulic pumps of Excavators
Recon Exchanges & Offer of Reconditioned Assemblies
Rehabilitation of Equipment
Singrauli service centre
The facility at Singrauli at Madhya Pradesh is located right at the centre of major coal fields & other
mineral mines, thermal power stations, cement & Aluminium plants.
Services Offered
Reconditioning / Repair of Hydraulic pumps of Excavators
Recon Exchanges & Offer of Reconditioned Assemblies
Rehabilitation of Equipment
Kolkata services Centre
Kolkata service centre specializes in repair of Transmissions and fuel pumps and equipped with
sophisticated AIDCO Transmission Test Stand and Diesel-KIKI Fuel pump test Stand.
Services Offered
Reconditioning / Repair of Hydraulic pumps of Excavators
Recon Exchanges & Offer of Reconditioned Assemblies
Rehabilitation of Equipment
WORKING CAPITAL MANAGEMENT
NEW HORIZON COLLEGE Page 40
Ballarpur service centre
This centrally located service centre caters to the repair requirements of SECL, NCL, ECL, WCL, and
other major customers for all electrical motor and alternator repair. In addition to this, the work shop is
also equipped with a fuel pump calibration stand for overhaul of fuel pumps.
Services Offered
Reconditioning / Repair of Hydraulic pumps of Excavators
Recon Exchanges & Offer of Reconditioned Assemblies
Rehabilitation of Equipment
Maintenance and Repair Contract (MARC)
Maintenance contracts are generally the most economical method for servicing or maintaining equipment.
Equipment is normally best maintained or serviced by the original equipment manufacturer (OEM) or its
authorized service organization. Maintenance contract is recommended for highly technical scientific
equipment because of the nature of the equipment and the need to keep equipment downtime to a
minimum.
HUMAN RESOURCES
HR vision
HR will be a Dynamic, pro-Active & strategic Business Partner to enable BEML to maintain its
leadership position in all its Business Domains.
HR Mission
To continuously innovate, evaluate and realign HR practices with the environment, business
strategies / directions and employee expectations to maintain relevance to attract, nurture and retain
talent.
To foster a spirit of creativity and innovation amongst the employees by facilitating creation of a
rewarding, inspiring and motivational organisational climate.
To act as a champion of change and managing the people implication of organisational changes.
WORKING CAPITAL MANAGEMENT
NEW HORIZON COLLEGE Page 41
HR Strategies
Align all HR activities with the organisation‟s business strategies
o Lead and manage organisational changes
o Institutionalisation of competency based HR systems/ processes
o Building employee commitment
o Building enabling systems
Employee empowerment
o Build ownership
o Recognition of ideas
o Enabling managers to take decisions within the policy frame work
o Provide feedback and resolve issue.
Develop leadership capability
o Identifying critical leadership competencies.
o Creating a context for leadership development
o Developmental coaching and performance feedback
o Nurture leadership talent
o Put in place development system, succession plans, training, programmes and projects, mentoring
opportunities and management review teams
Manage Attrition and Retention of Key Personnel
o Differential reward policy
o Creation of performance culture for nurturing key talents
o Identifying next generation leaders
o Career development programme
o Building leadership commitment
o Encouragement to exemplary employees
o Increase in variable pay component based on performance
WORKING CAPITAL MANAGEMENT
NEW HORIZON COLLEGE Page 42
Efficient and Effective Services Delivery
o Ensure efficient and effective service delivery
o Standardisation and simplification of HR processes and systems
o Automation of routine services (e-HR Services)
o Connect to employee and customers value propositions
o Outsourcing
o Cost Reduction /Optimisation
Develop Proactive Strategies on Employee Relations
o Fostering a culture of discipline and managing of discipline
o Proactive industrial relations (IR) management
o Corporate social responsibility.
SWOT Analysis of BEML
BEML is a premier ISO-9001-20000 company in India & the second largest manufacture or Earth
Moving Equipment in Asia. BEML has vital applications in diverse sectors of economy such as Coal,
Mining, Steel, Cement, power Irrigation, Construction, Road, Building & Railways.
It has expanded its product range to cover high quality hydraulics, heavy duty diesel engines, wielding
Robots understanding of heavy fabrication jobs. It was incorporated by Government of India as a private
limited company in May 11, 1964 and went public on Feb 21,1992.
WORKING CAPITAL MANAGEMENT
NEW HORIZON COLLEGE Page 43
CHAPTER-3
RESEARCH DESIGN
TITLE OF THE STUDY
“A study on working capital management at BEML in Bangalore”
OBJECTIVES OF THE STUDY
1. To know the needs for investment in working capital.
2. To know the various sources of working capital.
3. To study the efficiency of cash, inventory and receivables management of the company.
4. To know the factors influencing working capital components.
RESEARCH METHODOLOGY
The period covered under this study is five financial years that is from 2009-10 to 2013-14. The research
is purely an analytical method where the data has been analyzed on the basis of information supplied by
the manager. The study is designed in order to get a clear picture of the company.
SCOPE OF STUDY
Since the decision regarding working capital are of an operating nature not one time decision, the scope
of the study is geared towards identifying important areas of control and to establish model for better
control of the various components of working capital
The study would also attempt to identify the various sources available for financing of working capital.
The study gives a fair idea of improvement in efficiency of working capital management and also to have
proper control over the components of working capital and managing of efficiency.
WORKING CAPITAL MANAGEMENT
NEW HORIZON COLLEGE Page 44
STATEMENT OF PROBLEM
Every organisation prepares final accounts i.e. trading, profit & loss a/c and balance sheet but it only
shows profitability and financial position of the organization. The financial statement analysis takes non –
financial factors into consideration and provides basis for comparisons and decision making.
LIMITATIONS OF STUDY
1. The study was conducted mainly to understand and analyze the issue of working capital management,
being practically employed in BEML.
2. It was not possible to have an in-depth study, as the company executives were not revealing facts on
the aspects that adversely affect the interest of the organization.
3. The major part of the analysis has been based on the audited financial report of BEML.
4. This study is confirmed only to BEML.
5. Only 5 years have been considered for the calculation of working capital of the company.
SOURCES OF DATA
PRIMARY DATA:The data was obtained through personal interaction with the company officials the
internship period
SECONDARY DATA:This data is basically covered from the annual reports approved by the heads,
TECHNIQUES FOR ANALYSIS
After the collection of secondary data, the analysis is based on tools like ratio analysis, and the results are
depicted in the form of tables and graphs.
WORKING CAPITAL MANAGEMENT
NEW HORIZON COLLEGE Page 45
CHAPTER-4
ANALYSIS AND INTERPRETATION
INTRODUCTION
It is the process of establishing the meaningful relationship between the items Of two financial statements
with the objectives of identifying the financial and operational strength and weakness. This process
includes both analysis and interpretation.
MEANING
Financial analysis is a process of evaluating the understanding of the firm‟s position and performance.
Financial statements analysis is largely a study of relationship among the various financial factors in
business as disclosed by a single set of statement and a study of the trends of these factors.
TYPES OF FINANCIAL ANALYSIS:
External analysis
Internal analysis
Vertical analysis
Horizontal analysis
External analysis
This is analysis done by external parties that is outsider of the business. They include shareholders,
tenders, investors, creditors, etc. They have no access to the books of accounts and the internal records of
the concern.
Internal analysis
This analysis is done by internal parties. They include persons who have access to books of accounts and
internal records of the concern officers appointed for this purpose by the government, personal of the
finance and accounting departments of the concern can also do internal analysis.
WORKING CAPITAL MANAGEMENT
NEW HORIZON COLLEGE Page 46
Vertical or structured analysis
It is a type of analysis used to study through ratios, the quantitative relationship of items in the financial
statements on a particular date or for accounting year.
Horizontal or trend analysis
Comparative statements
Trend analysis
Fund flow statements
Cash flow statements
Ratio analysis
Comparative statements
The Comparative financial statements are statements of financial position at different period of time & the
elements of the financial position of two or more period
Trend analysis
The financial statements may be analyzed by computing trend and series of information. This method
determines the direction upwards or downwards and involves the computation of percentage that each
statement items bears to the same item in basis year.
Ratio analysis
The ratio is simple arithmetic expression of a relationship of one number to another. Ratio analysis is a
process is a process of establishing and interpreting various ratios for helping in marketing certain
decision
Working capital overall analysis
Working capital is essential for smooth running of business. In the absence of adequate working
capital, fixed assets cannot be utilized properly .There should not be inadequate working capital, which
leads to interruption in the production and firm fails to pay current obligations in time . Many incurred
losses due to lack of working capital. Inadequate working capital is a business bailment.
WORKING CAPITAL MANAGEMENT
NEW HORIZON COLLEGE Page 47
If the firm maintains an adequate working capital, it not only gets rid off danger of short working capital
but also enjoys a good credit rating and receives cash discounts on its payments
LIQUIDITY RATIOS
Current Ratio:
Current ratio is more dependable of solvency that is working capital. The ideal current ratio 2:1, it means
the current assets should be twice the current liabilities.
Current ratio may be defines as the relationship between current assets and current liabilities. This
ratio is also known as “Working capital management”. It is a measure of general liquidity and is most
widely used to make the analysis for short term financial position or liquidity of a firm. It is calculated by
dividing the total of the current assets by current liabilities.
The two basic components of this ratio are current assets and current liabilities. Current assets
include cash and those assets which can be easily converted into cash within a short period of time,
generally one year, such as marketable securities or readily realizable investments, bill receivables,
expenses should also be included in current assets because they represent payments made in advance
which will not have to be paid in near future.
Current liabilities are those obligations which are payables within a short period of time, generally
one year, and include outstanding expenses, bill payments, sundry creditors, bank overdraft, accrued
expenses, short term advances, income tax payable, dividend payable, etc.
WORKING CAPITAL MANAGEMENT
NEW HORIZON COLLEGE Page 48
CURRENT RATIO
Current Ratio expresses the relationship of current assets and current liabilities. It is most widely used
to know the working capital position. The ratio gives the information about firm ability to meet short term
and long term working capital.
Formula for calculation
Current Ratio = Current Assets / Current Liabilities
Table 1.1
Year
Current Assets(Rs. In
lakhs)
Current liabilities (Rs.
in lakhs)
Ratio
2009-10 404,958.49 145,312.37 2.79
2010-11 344,450.89 182,052.09 1.89
2011-12 404,029.15 198,567.38 2.03
2012-13 414,935.63 208,179.42 1.99
2013-14 368,474.74 170,052.30 2.17
WORKING CAPITAL MANAGEMENT
NEW HORIZON COLLEGE Page 49
Graph 1.1
Interpretation:
From the above table it can analyzed that the current ratio of the company for the year 2009-10,2010-
11,2011-12,2012-13,and 2013-14 is 2.79, 1.89,2.03,1.99 and 2.17.
It has been decreased in the year 2010-11 from 2.79 to 1.89
It has been increased in the year 2011-12 from 1.89 to 2.03
It has been decreased in the year 2012-13 from 2.03 to 1.99
It has been increased in the year 2013-14 from 1.99 to 2.17
0
0.5
1
1.5
2
2.5
3
2009-10 2010-11 2011-12 2012-13 2013-14
Current Ratio
Ratio
WORKING CAPITAL MANAGEMENT
NEW HORIZON COLLEGE Page 50
ABSOLUTE LIQUID RATIO
Absolute Liquid Ratio is also known as cash ratio. It is the ratio of absoluteliquid assets to current
liabilities. This ratio reveals very clearly whether a concern is liquid or not. In other words, it is the real
measure of the liquidity or short-term solvency of a concern. A high cash ratio indicates that a business
enterprise is not using its resources cash to best advantages. A low cash ratio reflects immediate problem
with paying bills.
Absolute liquid assets include cash in hand, cash at bank and short-term or temporary investments or
marketable securities.
Formulation for calculation
Absolute Liquid Ratio =Absolute Liquid Assets/Current Liabilities
Table-1.2
Year
Absolute liquid ratio
assets (Rs in lakhs) Current liabilities (Rs
in lakhs)
Ratio
2009-10 56,715.660 145,312.37 0.39
2010-11 4,828.18 182,052.09 0.03
2011-12 19,247.20 198,567.38 0.10
2012-13 7,848.16 208,179.42 0.04
2013-14 1752.55 170,052.30 0.01
WORKING CAPITAL MANAGEMENT
NEW HORIZON COLLEGE Page 51
Graph-1.2
Interpretation
From the above table it shows that the absolute liquid ratio of the company for the year
2009-10, 2010-11, 2011-12, 2012-13, and 2013-14
It has been decreased in the year 2010-11 from 0.39 to 0.03
It has been increased in the year 2011-12 from 0.03 to 0.10
It has been decreased in the year 2012-13 from 0.10 to 0.04
It has been decreased in the year 2013-14 from 0.04 to 0.01
0
0.05
0.1
0.15
0.2
0.25
0.3
0.35
0.4
0.45
2009-10 2010-11 2011-12 2012-13 2013-14
Absolute Liquid Ratio
WORKING CAPITAL MANAGEMENT
NEW HORIZON COLLEGE Page 52
INVENTORY TO WORKNG CAPITAL
This ratio shows the relationship between inventory and working capital. It is to reveal the proportion of
working capital covered by inventories alone. It is also indicated whether there is over stocking or under
stocking.
Inventories include closing stock of raw materials, work-in-progress, finished goods, working capital are
the excess of current assets over current liabilities.
Formulation for calculation
Inventory to working capital = Inventory/ working capital * 100
Table 1.3
Year
Inventory (Rs. In
Lakhs)
Working capital (Rs.
In Lakhs)
Ratio
2009-10 165,300.30 259,646.12 63.66
2010-11 188,890.92 162,398.80 116.31
2011-12 242,240.66 205,461.77 118
2012-13 245,619.92 206,756.21 118.80
2013-14 215,210.29 198,422.44 108.46
WORKING CAPITAL MANAGEMENT
NEW HORIZON COLLEGE Page 53
Graph 1.3
Interpretation
From the above table it shows that the inventory to working capital ratio of the company in the year 2009-
10, 2010-11,2012-13, and 2013-14 is 63.66, 116.31,118, 118.80 and 108.46.
It has been increased in the year 2010-11 from 63.66 and 116.31
It has been increased in the year 2011-12 from 116.31 to 118.
It has been increased in the year 2012-13 from 118 to 118.80.
It has been decreased in the year 2013-14 from 118.80 to 108.46
0
20
40
60
80
100
120
140
2009-10 2010-11 2011-12 2012-13 2013-14
Inventory to working capital Ratio
Ratio
WORKING CAPITAL MANAGEMENT
NEW HORIZON COLLEGE Page 54
INVENTORY TURNOVER RATIO
This ratio establishes relationship between cost of goods sold during the given period and the average
amount of inventory held during the given period. It indicates whether there is over stocking or under
stocking of finished goods.
Formulation for calculation
Inventory Turnover Ratio= cost of goods sold/ Average inventory
Table 1.4
Year
Sales ( Rs in lakhs) Inventory (Rs. In
Lakhs)
Ratio
2009-10 355,767.69 165,300.30 2.17
2010-11 284,672.54 188,890.92 1.50
2011-12 277,157.58 242,240.66 1.14
2012-13 291,250.40 245,619.92 1.19
2013-14 297,490.35 215,210.29 1.38
WORKING CAPITAL MANAGEMENT
NEW HORIZON COLLEGE Page 55
Graph 1.4
Interpretation
From the above table it shows that the inventory turnover ratio of the company in the year 2009-10,2010-
11,2011-12,2012-13 and 2013-14 is 2.17, 1.50,1.14,1.19 and 1.38
It has been decreased in the year 2010-11 from 2.17 to 1.50
It has been decreased in the year 2011-12 from 1.50 to 1.14
It has been increased in the year 2012-13 from 1.14 to 1.19
It has been increased in the year 2013-14 from 119 to 1.38
0
0.5
1
1.5
2
2.5
2009-10 2010-11 2011-12 2012-13 2013-14
Inventory Turnover Ratio
Ratio
WORKING CAPITAL MANAGEMENT
NEW HORIZON COLLEGE Page 56
WORKING CAPITAL TURNOVER RATIO
This ratio shows the relations between the working capital and the sales. This ratio shows the times
working capital is turned over in a stated period. The ratio indicates the effective or in- effective
utilizations of the working capital of an enterprise.
Formula for calculation
Working capital Turnover ratio= Net sales/ working capital
Table 1.5
Year
Net sales (Rs. In Lakhs) Working capital
(Rs. In Lakhs)
Ratio
2009-10 355,767.69 259,649.12 1.37
2010-11 284,672.54 162,398.80 1.75
2011-12 277,157.58 205,461.77 1.34
2012-13 291,250.40 206,756.21 1.40
2013-14 297,490.35 198,422.44 1.50
WORKING CAPITAL MANAGEMENT
NEW HORIZON COLLEGE Page 57
Graph 1.5
Interpretation
From the above table it shows that the working capital turnover ratio of the company in the year 2009-
10,2010-11,2011-2012,2012-13, and 2013-14 is 1.37,1.75,1.34,1.40 and 1.50
It has been increased in the year 2010-11 from 1.37 to 1.75
It has been decreased in the year 2011-12 from 1.75 to 1.34
It has been increased in the year 2012-13 from 1.34 to 1.40
It has been increased in the year 2013-14 from 1.40 to 1.50
0
0.2
0.4
0.6
0.8
1
1.2
1.4
1.6
1.8
2
2009-10 2010-11 2011-12 2012-13 2013-14
Working Capital TurnoverRatio
Ratio
WORKING CAPITAL MANAGEMENT
NEW HORIZON COLLEGE Page 58
CURRENT ASSETS TURNOVER RATIO
It is the ratio between current assets and sales. This ratio is the contribution of current assets to Sales.
Formulation for calculation
Current Assets Turnover Ratio = sales/ Current Assets
Table 1.6
Year
Sales (Rs. In lakhs)
Current Assets (Rs. In
lakhs)
Ratio
2009-10 355,767.69 404,958.49 0.88
2010-11 284,672.54 344,450.89 0.82
2011-12 277,157.58 404,029.15 0.68
2012-13 291,250.40 414,935.63 0.72
2013-14 297,490.35 368,474.74 0.81
WORKING CAPITAL MANAGEMENT
NEW HORIZON COLLEGE Page 59
Graph 1.6
Interpretation
From the above table it shows the current assets turnover ratio of the company in the year 2009-10,2010-
11,2011-12,2012-13,and 2013-14 is 0.88, 0.82, 0.68, 0.70 and 0.81
It has been decreased in the year 2010-11 from 0.88 to 0.82
It has been decreased in the year 2011-12 from 0.82 to 0.68
It has been increased in the year 2012-13 from 0.68 to 0.70
It has been increased in the year 2013-14 from 0.70 to 0.81
0
0.1
0.2
0.3
0.4
0.5
0.6
0.7
0.8
0.9
1
2009-10 2010-11 2011-12 2012-13 2013-14
current Asset Turnover Ratio
Ratio
WORKING CAPITAL MANAGEMENT
NEW HORIZON COLLEGE Page 60
FIXED ASSETS TURNOVER RATIO
This ratio expresses the number of times fixed assets are turned over in a stated period. This period show
well the fixed assets are being used in the business. It establishes the relationship between fixed assets
and sales.
Formulation for calculation
Fixed Assets Turnover Ratio= Sales/ Fixed Assets
Table 1.7
Year
Sales (Rs. In Lakhs) Fixed Assets (Rs. In
Lakhs)
Ratio
2009-10 355,767.69 30,608.08 11.62
2010-11 284,672.54 52,322.88 5.54
2011-12 277,157.58 62,029.28 4.46
2012-13 291,250.40 78,034.55 3.73
2013-14 297,490.35 77,417.95 3.84
WORKING CAPITAL MANAGEMENT
NEW HORIZON COLLEGE Page 61
Graph1.7
Interpretation
From the above table it shows that the fixed assets turnover ratio of the company in the years
2009 -10, 2010-11, 2011-12, 2012-13 and 2013-14 is 11.62, 5.54, 4.46, 3.73 and 3.84.
It has been decreased in the year 2010-11 from 11.62 to 5.54.
It has been decreased in the year 2011-12 from 5.54 to 4.46.
It has been decreased in the year 2012-13 from 4.46 to 3.73.
It has been decreased in the year 2013-14 from 3.73 to 3.84.
0
2
4
6
8
10
12
14
2009-10 2010-11 2011-12 2012-13 2013-14
Fixed Assets Turnover Ratio
Ratio
WORKING CAPITAL MANAGEMENT
NEW HORIZON COLLEGE Page 62
TOTAL ASSETS TURNOVER RATIO
Although fixed assets are directly converted with the generation of sales, the other also
Contribute to the production and other activities of the firm. Hence, to know whether all assets
Are utilized properly or not, this ratio is calculated. This ratio expresses the relationship
between total assets or resources or sales.
Formula for calculation
Total Assets Turnover Ratio= Sales/ Total Assets
Table 1.8
Year Sales(Rs in Lakhs) Total assets (Rs. In
Lakhs)
Ratio
2009-10 355,767.69 436,531.89 0.81
2010-11 284,672.54 424,476.88 0.67
2011-12 277,157.58 494,358.89 0.56
2012-13 291,250.40 521.513.99 0.55
2013-14 297,490.35 476,083.43 0.62
WORKING CAPITAL MANAGEMENT
NEW HORIZON COLLEGE Page 63
Graph 1.8
Interpretation
From the above it shows that the total assets turnover ratio of the company in the year 2009-10, 2010-
11,2011-12,2012-13, and 2013-14 is 0.81, 0.67, 0.56,0.55 and 0.62
It has been decreased in the year 2010-11 from 0.81 to 0.67
It has been decreased in the year 2011-12 from 0.67 to 0.56
It has been decreased in the year 2012-13 from 0.56 to 0.55
It has been increased in the year 2013-14 from to 0.55 to 0.62
0
0.1
0.2
0.3
0.4
0.5
0.6
0.7
0.8
0.9
2009-10 2010-11 2011-12 2012-13 2013-14
Total Assets Turnver ratio
Ratio
WORKING CAPITAL MANAGEMENT
NEW HORIZON COLLEGE Page 64
NET PROFIT RATIO
It indicates the result of overall operations of the firm. It also knows as profit margin. It measures the
relationship between net profit and sales of the firm.
This ratio helps determine the efficiency with affairs of the business is being managed. Net profit means
final balance of operating and non operating incomes after meeting all expenses
Formula for calculation
Net profit Ratio= Net profit/ Net sales * 100
Table 1.9
Year
Net profits ( Rs in
Lakhs)
Sales ( Rs in Lakhs)
Ratio
2009-10 22,284.82 355,767.69 6.26
2010-11 14,694.37 284,672.54 5.16
2011-12 5,724.50 277,157.58 2.06
2012-13 (7987.15) 291,259.40 (2.74)
2013-14 468.00 297,490.35 0.16
WORKING CAPITAL MANAGEMENT
NEW HORIZON COLLEGE Page 65
Graph 1.9
Interpretation
From the above table it shows that the net profit ratio of the company in the year 2009-10, 2010-
11,2011-12,2012-13 and 2013-14 is 6.26, 5.16, 2.06, (2.74) and 0.16
It has been decreased in the year 2010-11 from 6.26to 5.16
It has been decreased in the year 2011-12 from 5.16 to 2.06
It has been decreased in the year 2012-13 from 2.06 to (2.74)
It has been increased in the year 2013-14 from (2.74) to 0.16
-4
-3
-2
-1
0
1
2
3
4
5
6
7
2009-10 2010-11 2011-12 2012-13 2013-14
Net profit Ratio
Ratio
WORKING CAPITAL MANAGEMENT
NEW HORIZON COLLEGE Page 66
PROPRIETORY RATIO
Proprietory ratio brings out the relationship between shareholders fund and total assets. This ratio
indicates the proportion of total assets financed by owners.
Formulation for calculation
Proprietory Ratio = Net worth/ Total Assets
Net worth means the excess of total assets over total liabilities. It means owner or the proprietors or
shareholders fund. Total assets include all tangible assets, which are real and can be realized. It is an
index of the amount of proprietors funds invested on the total asset of a concern.
Table 1.10
Year Net worth (Rs. In
Lakhs)
Total Assets (Rs.In
Lakhs)
Ratio
2009-10 203,783.92 436,531.89 0.47
2010-11 213,904.07 424,476.88 0.50
2011-12 217,208.55 494,358.89 0.44
2012-13 208,003.35 521,513.99 0.39
2013-14 207,983.93 479,083.43 0.43
WORKING CAPITAL MANAGEMENT
NEW HORIZON COLLEGE Page 67
Graph 1.10
Interpretation
From the above table its shows that the Proprietory ratio of the company in the year 2009-10,2010-
11,2011-12,2012-13 and 2013-14 is 0.47,0.50,0.44,0.39,and 0.43
It has been increased in the year 2010-11 from 0.47 to 0.50
It has been decreased in the year 2011-12 from 0.50 to 0.44
It has been decreased in the year 2012-13 from 0.44 to 0.39
It has been increased in the year 2013-14 from 0.39 to 0.43
0
0.1
0.2
0.3
0.4
0.5
0.6
2009-10 2010-11 2011-12 2012-13 2013-14
Proprietary Ratio
Ratio
WORKING CAPITAL MANAGEMENT
NEW HORIZON COLLEGE Page 68
FIXED ASSETS TO NET WORTH RATIO
This ratio establishes the relationship between fixed assets and net worth. Fixed assets refer to assets like
land, building, machinery, vehicles, furniture etc...Which are used in the enterprise permanently? The
ratio indicates the proportion of the fixed assets financed by the owners.
Formula for calculation
Fixed Assets Turnover ratio = Fixed Assets/ Net Worth
Table 1.11
Year Fixed Assets (Rs. In
Lakhs
Net worth (Rs. In
Lakhs0
Ratio
2009-10 30,608.08 203,783.92 0.15
2010-11 52,322.88 213,904.07 0.24
2011-12 62,029.28 217,208.55 0.28
2012-13 78,034.55 208,883.35 0.38
2013-14 77417.95 207,983.93 0.37
WORKING CAPITAL MANAGEMENT
NEW HORIZON COLLEGE Page 69
Graph 1.11
Interpretation
From the above table it shows that the fixed assets to net worth ratio of the company in the years 2009-
10,2010-11,2011-12,2012-13, and 2013-14 is 0.15,0.24,0.28,0.18 and 0.37
It has been increased in the year 2010-11 from 0.15 to 0.24
It has been increased in the year 2011-12 from 0.24 to 0.28
It has been increased in the year 2012-13 from 0.28 to 0.38
It has been decreased in the year 2013-14 from 0.38 to 0.37
0
0.05
0.1
0.15
0.2
0.25
0.3
0.35
0.4
2009-10 2010-11 2011-12 2012-13 2013-14
Fixed assets to Net worth ratio
Ratio
WORKING CAPITAL MANAGEMENT
NEW HORIZON COLLEGE Page 70
CURRENT ASSETS TO NET WORTH RATIO
This ratio is calculated to measure the proportion of current assets financed by owner‟s funds. Generally,
2:1 considered ideal for a concern.
Formula for calculation
Current Assets to Net worth Ratio = current Assets/ Net worth
Table 1.12
Year Current Assets( Rs. In
Lakhs)
Net worth ( Rs. In.
Lakhs)
Ratio
2009-10 404,958.49 203,783.92 1.99
2010-11 344,450.89 213,904.07 1.61
2011-12 404,029.15 217,904.07 1.86
2012-13 414,935.63 208,003.35 1.99
2013-14 368,474.74 207,983.93 1.77
WORKING CAPITAL MANAGEMENT
NEW HORIZON COLLEGE Page 71
Graph 1.12
Interpretation
From the above table it shows that the current assets to net worth ratio of the company in the year 2009-
10,2010-11,2011-12,2012-13, and 2013-14 is 1.99, 1.61,1.86, 1.99 and 1.77
It has been decreased in the year 2010-11 from 1.99 to 1.61
It has been increased in the year 2011-12 from 1.61 to 1.86
It has been increased in the year 2012-13 from 1.86 to 1.99
It has been decreased in the year 2013-14 from 1.99 to 1.77
0
0.5
1
1.5
2
2.5
2009-10 2010-11 2011-12 2012-13 2013-14
Current assets net worth Ratio
Ratio
WORKING CAPITAL MANAGEMENT
NEW HORIZON COLLEGE Page 72
CURRENT LIABILITIES TO NET WORTH RATIO
This is the ratio between current liabilities of a firm and the net worth. It indicates relative contributions
of the short-term creditors and owners in the capital of the firm.
Formula for calculation
Current liabilities to Net worth Ratio = Current Liabilities/ Net worth
Table 1.13
Year Current liabilities (Rs.
In Lakhs)
Net worth (Rs. In
Lakhs)
Ratio
2009-10 145,312.37 203,783.93 0.71
2010-11 182,052.38 213,904.07 0.85
2011-12 198,567.38 217,208.55 0.91
2012-13 208,179.42 208,003.35 1.00
2013-14 170,052.30 207,983.93 0.81
WORKING CAPITAL MANAGEMENT
NEW HORIZON COLLEGE Page 73
Graph 1.13
Interpretation
From the above table it shows that the current liabilities to net worth ratio of the company in the year
2009-10,2010-11,2011-12,2012-13 and 2013-14 is 0.71,0.85,0.91,1.00 and 0.81.
It has been increased in the year 2010-11 from 0.71 to 0.85
It has been increased in the year 2011-12 from 0.85 to 0.91
It has been increased in the year 2012-13 from 0.91 to 1.00.
It has been decreased in the year 2013-14 from 1.00 to 0.81
0
0.2
0.4
0.6
0.8
1
1.2
2009-10 2010-11 2011-12 2012-13 2013-14
Current liabilities to Net worth Ratio
Ratio
WORKING CAPITAL MANAGEMENT
NEW HORIZON COLLEGE Page 74
CHAPTER-5
FINDINGS, SUGGESTIONS AND CONCLUSION
Summary of findings:
The study on “Working Capital Management in BEML LTD” has brought into some interesting findings
with the help of annual reports for the year 2009-10 to 2013-2014. The findings of the study are
highlighted below:
BEML is a defence oriented undertaking enjoying monopoly in earth moving heavy equipment
over a period of time in market. The present market for earth moving equipment is becoming
increasingly competitive. The number of manufactures within the country is increasing. The
company is also facing competitions from abroad due to globalization.
Railway segment resulting in slow drop in demand for the products. This had an effect on the
operation of the company, which is visible in the profitability position.
Defence segment is showing considerable increase, the sales in rail coaches segment has dropped
sharply. This is due to lack of order for rail coaches from railway board.
The current ratio of BEML is satisfactory which an indication of trading within its resource is.
Its current assets include more of the inventory than liquid assets which is a block of capital.
The creditors turnover ratio is fluctuating which indicates that the organisation is not paying bills
on the scheduled dates.
The gross profit ratio is increasing year after due to increase in sales.
Due to continuous increase in the cost of production, the Net Profit Ratio of the organisation is
also decrease.
WORKING CAPITAL MANAGEMENT
NEW HORIZON COLLEGE Page 75
Suggestions:
It is advisable to maintain the liquid ratio 1:1 by investing in fixed assets.
Closing Stock should be maintained at the optimum level by introducing some methods like JIT
(just in time) to improve the liquidity position of the company.
The company should focus on management of current assets; it should maintain stability in current
assets.
The company can improve its financial position by borrowing, as it is utilizing more of its own
fund.
It should make ways to make customers to know about the difference between BEML products
and other products like in quality, price, etc...
Though proprietary ratios are increasing year after year, percentage of increase in current assets is
more than percentage of increase in current liabilities. This would lead to good liquidity position.
They should maintain matching principle by identifying permanent working capital and temporary
working capital separately.
Since the Gross Profit Ratios is declining in the following years, it may be increased by taking the
following steps :
a) By lowering cost of goods sold, selling prices remaining constant.
b) By increasing selling prices, the cost of goods remaining constant.
c) By increasing the sale of those goods which have a higher gross margin.
WORKING CAPITAL MANAGEMENT
NEW HORIZON COLLEGE Page 76
Conclusions:
In a competitive environment we cannot demand a price what we want but can afford only
what customer wants and determine wants and determine the sales price.
The main objective is to have a balanced liquidity position and track off between risk and
profitability. The greater the amount of working capital maintained, the risk is lower, the level of
working capital and the profitability will be greater but the more will be the risk of running out of
capital to meet day to day requirements. The financial position for running day to day business is
sound.
To conclude, BEML a government of India undertaking under the defence is the joint
manufacture of heavy machines in India, though they are doing well, the company is on the side of
traditional form of financing so it is advisable to maintain ideal level of Debt-Equity Ratio and
Liquid Ratio which helps in increasing the profitability if the concern and maintaining constant
financial performance.
WORKING CAPITAL MANAGEMENT
NEW HORIZON COLLEGE Page 77
BIBLIOGRAPHY
BOOKS:
Financial Management by:H.R. Appannaiah, I.M. Pander.
Management Accounting: M.N ARORA, Himalaya Publishing House.
Cost and Financial Analysis: ShahsK.Gupta, Kahayan Publishing House.
COMPANY LITERATURE:
Five years Annual reports of BEML.
WEB SITE:
Www. bemlindialtd.com
Www. google.com
WORKING CAPITAL MANAGEMENT
NEW HORIZON COLLEGE Page 78
ANNEXURE
Five years balance Sheet of BEMLIn Rs Lakhs…
Particulars March
2013-2014
March
2012-2013
March
2011-2012
March
2010-2011
March
2009-2010
Source of
Funds
Total share
Capital
4,177.22
4,177.22
4,177.22 4,177.22
4,177.22
Equity share
capital
4,177.22
41,77.22
4,177.22
4,177.22
4,177.22
Share
Application
money
0
0
0
0
0
Preference
share capital
0
0
0
0
0
Reserves
203,806.71
203,826.13
213,031.33
209,726.85
1,99,606,70
Net worth
207,983.93
208,003.35
217,208.55
213,904.07
203,783.92
Secured loans
80,966.67
11,203.76
78,171.89
67,621.71
75,305.49
Unsecured
Loans
94,989,91
93,941.89
16,122.47
14,090.44
15,549.86
Total Debt
904.64
1,214.32
942.93.
817.12
908.55
Total
Liabilities
476,083.43
521,513.99
494,358.89
424,476.88
436,531.89
Application Of Funds
Gross block
11,788.07
11,696.73
11,210.81
94,542.69
79,870.87
Less:
Revaluation
reserves
0
0
0
0
0
WORKING CAPITAL MANAGEMENT
NEW HORIZON COLLEGE Page 79
Less:
Accumulative
Depreciation.
68,011.23
63,899.34
59,196.45
55,589.90
52,483.83
Net block
49,869.63
53,073.52
52,921.65
38,952.79
27,387.04
Capital work
in progress
13,533.63
11.322.87
2,386.48
7,958.71
3,221.04
Investments
257.64
257.64
443.19
794.89
819.89
Inventories
215,210.29
245,619.92
242,063.74
188,890.91
165,300.03
Sundry
debtors
977.36
861.51
792.46
1,287.53
1,36.074
Cash & bank
balance
1,623.49
7,692.46
19,247.20
4,828.18
56,715.06
Total current
assets
3,145.69
3,394.63
3,405.57
3,224.72
3,430.84
Loans
Advances
30,337.73
38.612.71
40,740.81
41,027.13
46,134.55
Fixed deposit
0
0
0
0
150.05
Total CA,
loans, &
advances
368,474.74
414,935.63
404,029.15
344,450.89
404,958.49
Deferred
credi
0
0
0
0
0
Current
liabilities
1,524.12
1,576.48
1,501.05
1,025.65
925.88
Provisions
252.25
344.31
319.02
319.14
560.88
WORKING CAPITAL MANAGEMENT
NEW HORIZON COLLEGE Page 80
Total CL
& provision
170,052.30
208,179.42
198,567.38
182,052.09
145,312.37
Net current
Assets
2,309.02
2,617.69
2,557.50
2,478.86
2,630.66
Miscellaneous
Expenses
0
0
0
0
1.45
Total Assets
476,083.43
521,513.99
494,358.89
424,476.88
436,531.89
Contingent
liabilities
911.84
148.96
1,295.02
179.21
206.49
Book
Value(Rs)
499.43
499.47
521.58
513.64
489.34
WORKING CAPITAL MANAGEMENT
NEW HORIZON COLLEGE Page 81
Five years profit& loss account of BEML In RsLakhs…
particulars March 2013-
2014
March
2012-2013
March
2011-2012
March
2010-2011
March 2009-
2010
Income
Sales
Turnover
297,490.35
291,259.40
277,157.58
284,672.54
355,767.69
Excise Duty
0
0
0
197.05
150.02
Net sales
297,490.35
291,259.40
277,157.58
284,672.54
355,767.69
Other
Income
6,338.95
10,359.39
4,509.16
22,283.92
13,741.36
Stock
adjustments
-97.06
69.92
428.81
145.08
150.25
Total
Income
289,373.51
299,254.31
322,921.29
283,536.32
312,664.05
Expenditure
Raw
Materials
1,631.57
1,733.26
1,862.70
1,672.41
1,829.51
Power& Fuel
Cost
35.76
33.54
34.43
29.23
31.25
Employee
cost
1,675.65
739,939.90
721,172.83
68,314.53
55,513.98
Other
Manufacturi
ng expenses
0
0
0
7.75
10.81
Selling and
Admin
Expenses
0
0
0
162.18
177.12
Miscellaneo
us Expenses
36,719.59
46,168.87
47,122.50
35,569.34
36,988.90
WORKING CAPITAL MANAGEMENT
NEW HORIZON COLLEGE Page 82
Preoperative
Expenses
Capitalise
0
0
0
0
0
Total
Expenses
296,236.82
304,668.46
273,567.84
278,699.41
280,702.47
Operating
Profit
113.16
-46.53
123.15
125.65
321.14
PBDIT
192.44
67.18
197.06
188.44
374.25
Interest
110.46
140.99
88.43
72.04
60.12
PBDT
851.98
-73.81
108.63
116.4
313.1
Depreciation
553.56
50.25
43.92
33.64
32.71
Other
Written off
0
0
0
6.87
0
Profit Before
Tax
28.42
-124.06
64.71
75.89
281.92
Extra-
ordinary
Items
-19.34
1.73
1.73
120.21
40.12
PBT(post
Extra-
ordinary
items)
9.08
-122.33
66.44
196.1
322.2
Tax
4.4
-42.46
9.21
46.31
99.41
Reported
Net profit
468.00
-7987.15
5,724.50
14,691.37
22,284.82
Total Value
Addition
1,069.72
1,192.10
1,169.45
974.52
855.62
WORKING CAPITAL MANAGEMENT
NEW HORIZON COLLEGE Page 83
Preference
Dividend
0
0
0
0
0
Equity
Dividend
4.16
10.41
20.82
41.64
41.64
Corporate
Dividend
Tax
0.71
1.77
3.38
6.92
7.72
Per share data(annualised)
Shares in
issue
(Laths)
416.45
416.45
416.45
416.45
416.45
Earnings
per share
(Rs)
1.12
-19.18
13.75
35.96
53.12
Equity
Dividend
(%)
10
25
50
100
150
Book
Value (Rs)
499.43
499.47
521.58
513.64
489.50