IntroductionTrigonometry is often introduced as a system of ratios of sides of right triangles. Although this aspect of the subject isuseful, it is to restrictive for further uses. This document outlines the development of trigonometry as a system of"circular functions."
The unit circleIn the Cartesian coordinate system, where each point is identified as pair Hx, yL, the unit circle is the set of all pointsthat are one unit away from the origin, H0, 0L.
-1 -0.5 0.5 1x
-1
-0.5
0.5
1
y
ü Questions
(a) What is the distance between any point PHx, yL and the origin? (b) What algebraic equality must be true in order for P to be on the unit circle?(c) What is the circumference of the unit circle?
The wrapping functionThe wrapping function is based on the idea that if you start with a string of length t, place one end at the point H1, 0Land wrap the string counterclockwise around the circle, the other end will lie on a point called PHtL. The function isdefined for negative numbers by agreeing that PH-tL is the terminal point of the string of length t that is wrappedclockwise starting at H1, 0L. The definition is complete by stipulating that PH0L = H1, 0L.
Since the circumference of the unit circle is 2 p, a string of length 2 p6= p
3 will terminate at a point one sixth of the way
around the circle.
Since the circumference of the unit circle is 2 p, a string of length 2 p6= p
3 will terminate at a point one sixth of the way
around the circle.
-1 -0.5 0.5 1x
-1
-0.5
0.5
1
y
PHpê3L
-1 -0.5 0.5 1x
-1
-0.5
0.5
1
y
PH-pê3L
ü Questions
Why does it make sense to define PH0L = H1, 0L?
If you extend your string by an additional 2 p units from t to t + 2 p , you end up at the same point since the 2 p justbrings you around the circle one additional rotation. This is summarized by the general identity PHt + 2 pL = PHtL.
There are many other similar identities try to fill in the blanks:(a) PHt + 4 pL = ___(b) PHt + pL = ___(c) PIt + p
2M = ___
Use your imagination - you might be able to come up with some other identities.
Compare the x coordinates of PHtL and PH-tL, how are they related?Compare the y coordinates of PHtL and PH-tL, how are they related?
(a) If PHtL lies in the second quadrant and its x coordinate is -4 ê5, what is its y coordinate?(b) If PHtL lies in the third quadrant and its y coordinate is -5 ê13, what is its x coordinate?
2 trigonometry.nb
(a) If PHtL lies in the second quadrant and its x coordinate is -4 ê5, what is its y coordinate?(b) If PHtL lies in the third quadrant and its y coordinate is -5 ê13, what is its x coordinate?
Notes: The units of t in the wrapping function are radians; so called because one unit of length is the length of the radius of the unit circle. One canthink of the variable t as time, in which case PHtL is capturing the motion a point that is rotating around a circle with constant speed.
The circular functionsThe circular function sin (short for sine) and cos (short for cosine) are defined in terms of the wrapping function.
sin t is the y coordinate of PHtLand
cos t is the x coordinate of PHtL
ü Questions
As t increases from 0 to 2 p, what values does sin t takes on? What values does cos t take on?
The identity PHt + 2 pL = PHtL tells us that sinHt + 2 pL = sin HtL. What other properties of the circular functions arederived directly from properties of the wrapping function?
(A calculus question - see if you can answer it intuitively) As t increases past zero, sin t increases. How fast is sin tincreasing when t = 0?
Connection with right triangle trigonometryPlace a right triangle ABC in the cartesian coordinate system as shown in the figure below, with the hypotenuseemanating from the origin and lying in the first quadrant. In addition, one side lies on the positive x-axis. Let B ' bethe point of intersection of the hypotenuse with the unit circle and drop B ' down to C ' on the x-axis to form triangleA B ' C ', which is similar to ABC. In right triangle trigonometry, the sine of —BAC is the ratio BC
AB. Since A B ' C ' is
similar, BCA B
= B'C'A B'
= B ' C ' . Notice that B ' C ' is the y-axis of the point B', which is PHtL, where t is the length of
the arc of the unit circle inside ABC - exactly how we define sin t as a circular function.
1x
1
y
A C' C
B
B'
Thus, the only difference between the circular functions and the right triangle trigonometric functions is the anglemeasurement system that is used. Instead of the familiar degree system, we use radians to measure angle in which theangle —BAC is the arc length, t.
trigonometry.nb 3
ü Question
Use geometry to derive the values cos p
3 and sin p
4. Click here for the correct values.
The other circular functionsThe other circular functions are defined in terms of sine and cosine. We won't do much with them here.
tangent: tan t = sin tcos t
cotangent: cot t = cos tsin t
= 1tan t
secant: sec t = 1cos t
cosecant: csc t = 1sin t
One particulary important thing about the tangent function: How does the angle a line makes with the x axis determineits slope?
t
TransformationsGiven any functional relationship y = f HtL, the effect on that relationship by replacing f HtL with f Hc tL, f Ht + cL, c f HtL,f HtL + c, or a combination of these is away of interest. The first three are of particular interest for the circular functionsand have particular names associated with them.
ü Changing the period and frequency.The contrast between sin t and sin c t is that, depending on the specific value of c, the period will change from 2 p to adifferent value. For example, sin 3 t is the y -coordinate of PH3 tL. Since P will wrap around the unit circle one when3 t = 2 p, t = 2 p
3 is the period of sin 3 t . This can be seen from the graph of the first periods of sin t (dashed) and
sin 3 t (solid).
4 trigonometry.nb
1 2 3 4 5 6
-1
-0.5
0.5
1
A smaller period implies a higher frequency , which measures the number of times the wrapping function point rotatesaround the unit circle per unit time. While sin t has frequency 1
2 p, sin 3 t has a higher frequency, 3
2 p. In general,
frequency = 1period
.
Everything said above about sine translates to cosine.
What happens when c is a relatively small number, like 15
?
What happens when c is a negative number?
ü Phase ShiftsThe contrast between sin t and sin Ht + cL is that the latter is a shift of the former by c units to the left if c > 0 ; whilethe shift will be to the left in c < 0.
-6 -4 -2 2 4 6
-1
-0.5
0.5
1
sinHt+pê3L
sin t
The same general rules apply to phase shifts of cosine.
-6 -4 -2 2 4 6
-1
-0.5
0.5
1
cosHt-1L
cos t
ü Change of AmplitudeMultiplying sin t by a constant will stretch or shrink the graph, depending on the constant.
trigonometry.nb 5
-6 -4 -2 2 4 6
-2
-1
1
2
0.5 sin t
2.5 sin t
sin t
If the constant is negative, the function's graph will be reflected across the x axis.
-6 -4 -2 2 4 6
-1.5
-1
-0.5
0.5
1
1.5
-1.5sin t
sin t
The maximum value of sin t is 1 — think about the unit circle! This is the amplitude of sin t. The amplitude ofc sin t is c . For example, the amplitude of -1.5 sin t is 1.5. The situation with multiplication of cos t by a constant is exactly the same as with sin t.
ü Vertical shiftsThe c + sin t is a vertical shift of sin t. Instead of ranging between -1 and 1, c + sin t will range between c - 1 andc + 1. For example, if c = 2:
-6 -4 -2 2 4 6
-1
1
2
3
2 + sin t
sin t
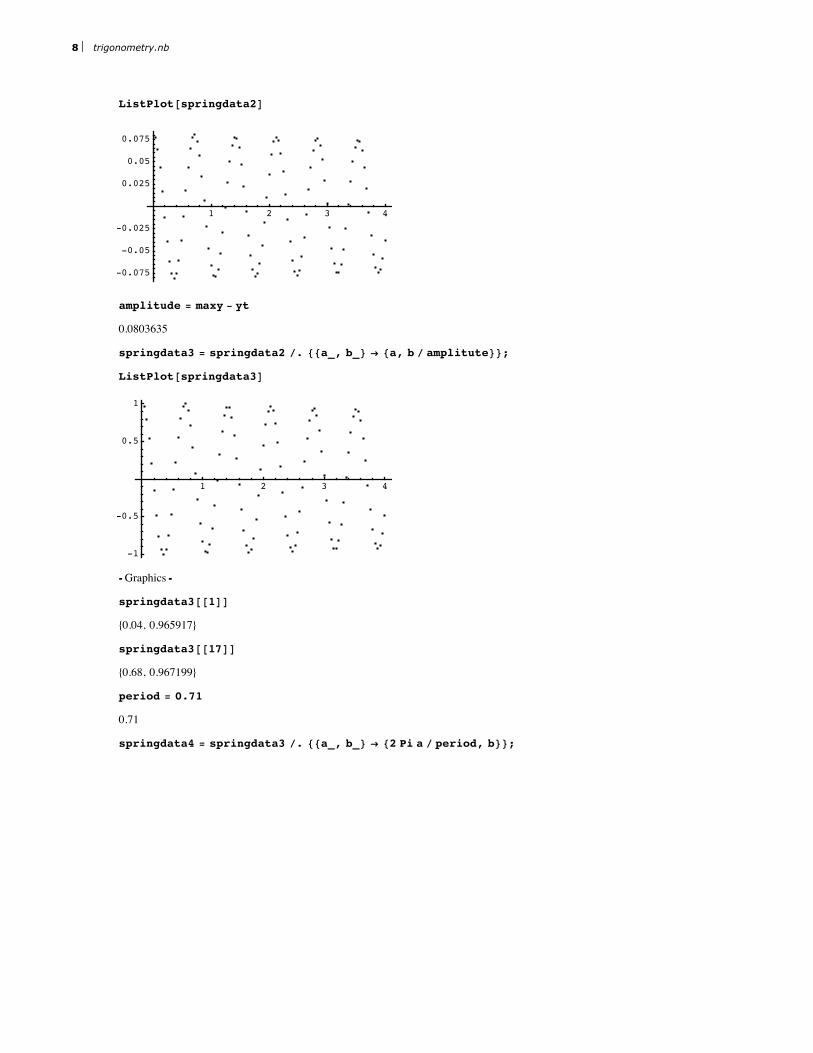
ü CombinationsIn most cases where circular functions describe real-life situations, a combination of these transformations would beneeded to match a function to reality. For example, here is a plot of real data from the motion of a weight attached to aspring. The data was collected for 4 seconds and the distance of the weight from the measuring device is in meters.The data certainly looks like a circular function! Let's see if we can identify a circular function that fits it. We will dothis be transforming the data backwards to sin x.
6 trigonometry.nb
1 2 3 4
0.45
0.475
0.525
0.55
0.575
Here is the actual data. springdata = 880.04`, 0.59222`<, 80.08`, 0.578781`<, 80.12`, 0.557728`<, 80.16`, 0.531471`<,
Therefore a reasonably close model for the original data is y = 0.0803635 sinH8.84956 t - 10.9735L + 0.514596, ascan be seen with the original data superimposed on the graph above. This formula is a good starting point for usingFindFit, which will fine-tune the formula to take into account all the data.betterfit = a Sin@b t + cD + d ê.
FindFit@springdata, a Sin@b t + cD + d, 88a, 0.08<, 8b, 8.85<, 8c, -10.97<, 8d, 5.15<<, tD
0.51463- 0.0777117 sinH11.0569- 8.90854 tL
This result might look very different from what we had derived, but it isn't:
d - a sinHc - b tL = d - aH-sin Hb t - cLL since sinH-tL = -sin t= d + a sin Hb t - cL
Plot@betterfit, 8t, 0, 4<, Epilog Ø Point êü springdataD
1 2 3 4
0.45
0.475
0.525
0.55
0.575
ü Questions
Match the following graphs with the circular functions listed below.
2 p
-3-2-1
123
HcL
2 p
-3-2-1
123
HdL
2 p
-3-2-1
123
HaL
2 p
-3-2-1
123
HbL
trigonometry.nb 11
1. 2 sinIt + p
4M
2. 3 sinH2 tL3. 2 sinH3 tL4. -2 sinHtL
Identify the amplitude, period and phase shift of the function that has the form a sinHb t + cL + d
2 p
-5
5
10
15
IdentitiesThere are countless identities that relate various expressions involving the circular functions. The fact that verydifferent looking expressions are really the same tends to make trigonometry confusing to many. Comments on a fewexamples are provided here. Several web sites provide good lists. Here are two of them: http://en.wikipedia.org/wiki/Trigonometric_identity
Proof: sin2 t + cos 2 t = Hy coordinate of PHtLL2 + Hx coordinate of PHtLL2
= 1 since PHtL is on the unit circle.
sin Ht + pL = -sin t
Proof: PHtL and PHt + pL are at opposite sides of the unit circle and so PHt + pL = -PHtL which means that the y coordi-nate of PHt + pL is the negation of the y coordinate of PHtL, which is exactly what the identity states.
cos It + p
2M = - sin t
Proof: Consider PHtL and PIt + p
2M. If you compare the y coordinate of PHtL, which is sin t, and the x coordinate of
PIt + p
2M, which is cosIt + p
2M, they have the same magnitude, but always opposite signs. The two images that follow
are for two possible quadrants, but this works for all values of t.
12 trigonometry.nb
-1 1 x
-1
1y
PHtL
PHt+pê2L
-1 1 x
-1
1y
PHtL
PHt+pê2L
ü More advanced identitiesAn example of a more advanced identity is the angle sum formula for sine:
sinHt + u L = sin t cos u + cos t sin u
Instead of a proof (there are many that can be found in books and on the web), here is how I remember this one if I'veforgotten the details. I recall the fact that when you multiply two complex numbers, you multiply their absolute values (moduli) and addtheir angles (arguments). This means that if I take two complex numbers on the unit circle, z = cos t + sin t  andw = cos u + sin u  their product will also be on the unit circle and their product isz w = Hcos t cos u - sin t sin uL + Hsin t cos u + cos t sin uL  At the same time, we know that z w = cos Ht + uL + sin Ht + uL  . Comparing the two expressions for z w , you get theidentity above and the corresponding one for cosine.Of course you need to have a facility with complex numbers to be able to recall the identities this way, but it works forme.If you remember one of these identities, the others can be derived by using some of the more basic identities. Forexample,
cos H u + vL = sin Iu + v + p
2M
= sinI u + Iv + p
2MM
= sin u cos Iv + p
2M + cos u sinIv + p
2M
= sin u H-sin vL + cos u cos v= cos u cos v - sin u sin v
Take some time to understand why every step is valid in deriving the identity for the cosine of the sum of two angles.
ü General IdentitiesThere are countless more advanced and general identities. Hardly anyone has them all at their fingertips. A few aresomewhat more important that others. The following has important consequences in some areas of mathematics. If nis an integer greater than 1, then cos n t = 2 cosHn - 1L t cos t - cos Hn - 2L tL
The implication of this identity is that cos Hn tL is a polynomial in cos x. For example,
cos 3 t = 2 cos 2 t cos t - cos t= 2 I2 cos2 t - 1M cos t - cos t= 4 cos 3 t - 3 cos t
Therefore, cos 3 t = pHcos tL , where pHxL = 4 x3 - 3 x. This particular polynomial is one called a Chebyshevpolynomial of the first kind. These polynomials are built into Mathematica. ChebyshevT@3, xD
4 x3 - 3 x
trigonometry.nb 13
The following demonstrates how the 7th degree Chebyshev polynomial in cos t reduces to cos 7 t.p = ChebyshevT@7, Cos@tDD
Derive the formula for the sine of the difference of two angles: sin Hu - vL.
Using the identities for the sine and cosine of the sum of two angles, derive identities for sin 2 t and sin t2
.
Find the six roots of the 6th degree Chebyshev polynomial 32 x6 - 48 x4 + 18 x2 - 1
Special anglesIf you pick a "random" angle, it is unlikely to be one of these "special" angles, but these special cases are worthknowing by heart because they do come up in special case. For example, equilateral triangles are often the solution tocertain problems. t radians degrees sin t cos t0 0 0 1p
630 ° 1
232
p
445 ° 1
2
1
2
p
360 ° 3
212
p
290 ° 1 0
14 trigonometry.nb
Mathematica code
This is undocumented code that was used in generating figures for this Notebook. Mathematica beginnersshould probably ignore this section. When you have more expertise with the software it might make moresense.