31
A U Interface & Project Analysis Professor J. Alberto Espinosa Business Analysis ITEC-630 Fall 2009
| Date post: | 22-Dec-2015 |
| Category: |
Documents |
| View: | 219 times |
| Download: | 2 times |

AUInterface & Project Analysis
Professor J. Alberto Espinosa
Business AnalysisITEC-630 Fall 2009

2
Objectives Discuss interface analysis Discuss project and cost estimation
issues

3
Interface Analysis

4
Usability
Derives from the industrial engineering field of “ergonomics” – how to design things so they are easy to use.
It refers to the “quality of a user's experience when interacting with a product or system … and how well users can learn and use a product to achieve their goals and how satisfied they are with that process ... people who use the product can do so quickly and easily to accomplish their tasks” – usability.gov
Other references: http://www.usernomics.com/usability.html
5
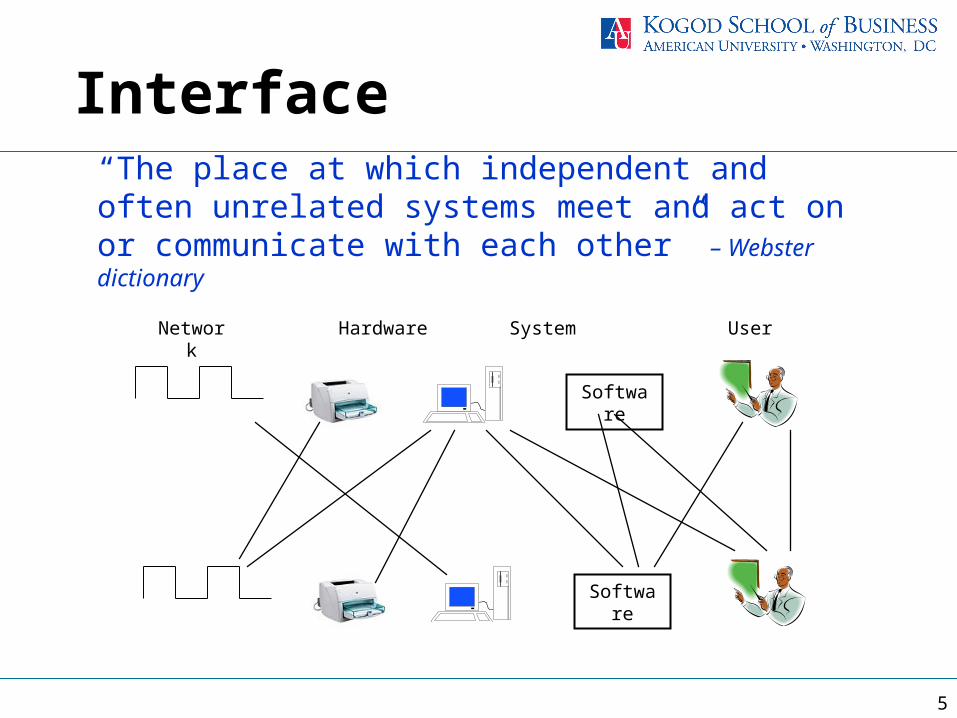
Interface
“The place at which independent and often unrelated systems meet and act on or communicate with each other” – Webster dictionary
Software
Network
Software
Hardware UserSystem

6
User Interface Design
Also referred to as “human computer interaction” (HCI) – is what the usability specialists do to build systems that are easy to use.
HCI also derives from the field of “ergonomics” often referred to these days as “human factors” to include digital and virtual interaction, in addition to physical interaction.
Other references:Cornell Univ: http://ergo.human.cornell.edu/ahtutorials/interface.htmlVirginia Tech: http://www.edtech.vt.edu/edtech/id/interface/Carnegie Mellon: http://www.usernomics.com/user-interface-design.html

7
ATM System
Customer
Bank Manager
ATM Service Rep
Customer Accounts System
Withdraws Funds
Makes Deposits
Manages Account
Inquires CustomerActivity
Monitors ATMStatus
Replenishes Cash
Upload CustomerTransaction
Data
Use Case Diagram without Interfaces

8
ATM System
Customer
Bank Manager
ATM Service Rep
Customer Accounts System
Withdraws Funds
Makes Deposits
Manages Account
Inquires CustomerActivity
Monitors ATMStatus
Replenishes Cash
Upload CustomerTransaction
Data
WithdrawalInterface
Deposit Interface
AccountManagement
Interface
Customer ActivityInquiry Interface
ATM StatusMonitor Interface
CashReplenishment
Interface
CustomerAccounts System
Interface
Use Case Diagram with InterfacesEx.1: 1 Interface per Actor-UC Interaction

9
ATM System
Customer
Bank Manager
ATM Service Rep
Customer Accounts System
Withdraws Funds
Makes Deposits
Manages Account
Inquires CustomerActivity
Monitors ATM Status
Replenishes Cash
Upload CustomerTransaction Data
Customer Interface
Customer Activity Inquiry Interface
ATM Status Monitor Interface
Cash Replenishment
Interface
Customer Accounts System
Interface
Use Case Diagram with InterfacesEx.2: 1 Interface for Customer Actor’s Interaction with all UC’s
10
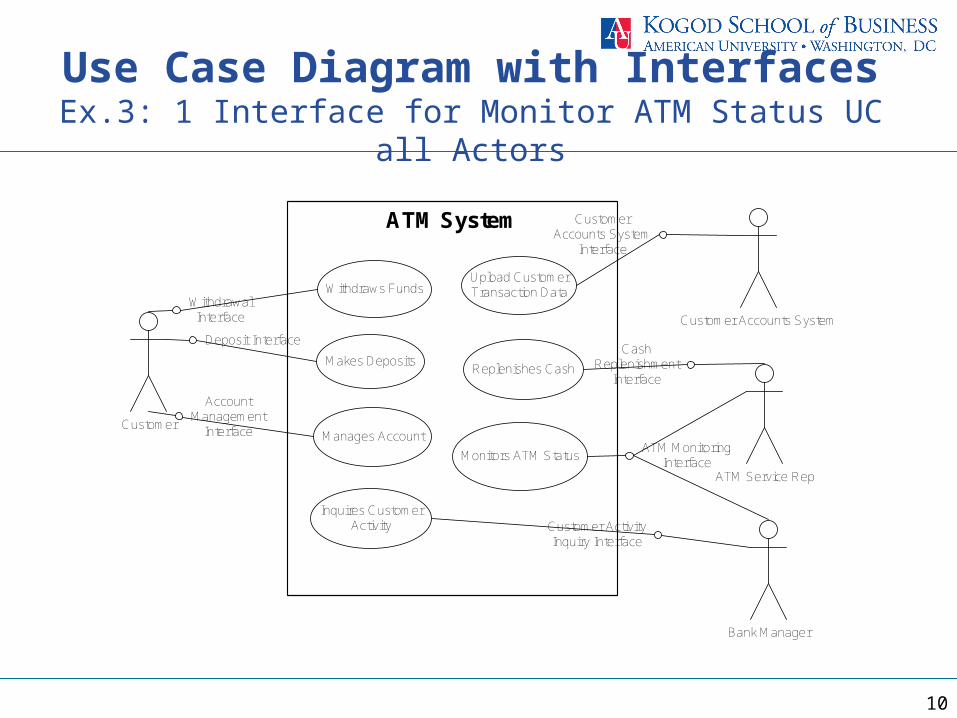
ATM System
Customer
Bank Manager
ATM Service Rep
Customer Accounts System
Withdraws Funds
Makes Deposits
Manages Account
Inquires CustomerActivity
Monitors ATM Status
Replenishes Cash
Upload CustomerTransaction Data
Withdrawal Interface
Deposit Interface
Account Management
Interface
Customer Activity Inquiry Interface
Cash Replenishment
Interface
Customer Accounts System
Interface
ATM Monitoring Interface
Use Case Diagram with InterfacesEx.3: 1 Interface for Monitor ATM Status UC all Actors
11
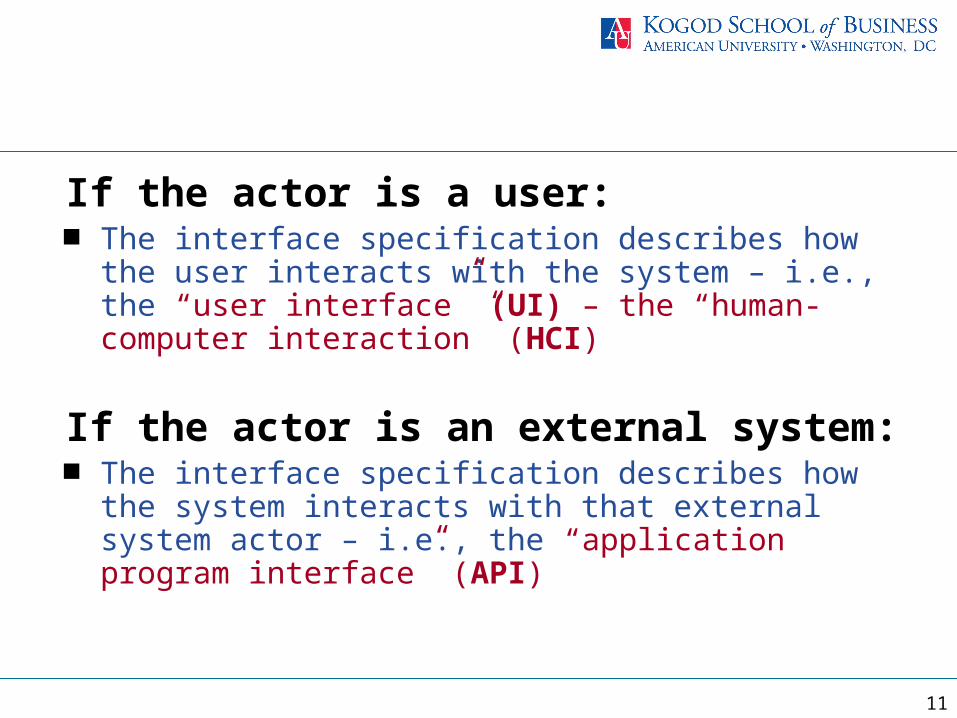
If the actor is a user: The interface specification describes how the
user interacts with the system – i.e., the “user interface” (UI) – the “human-computer interaction” (HCI)
If the actor is an external system: The interface specification describes how the
system interacts with that external system actor – i.e., the “application program interface” (API)
12
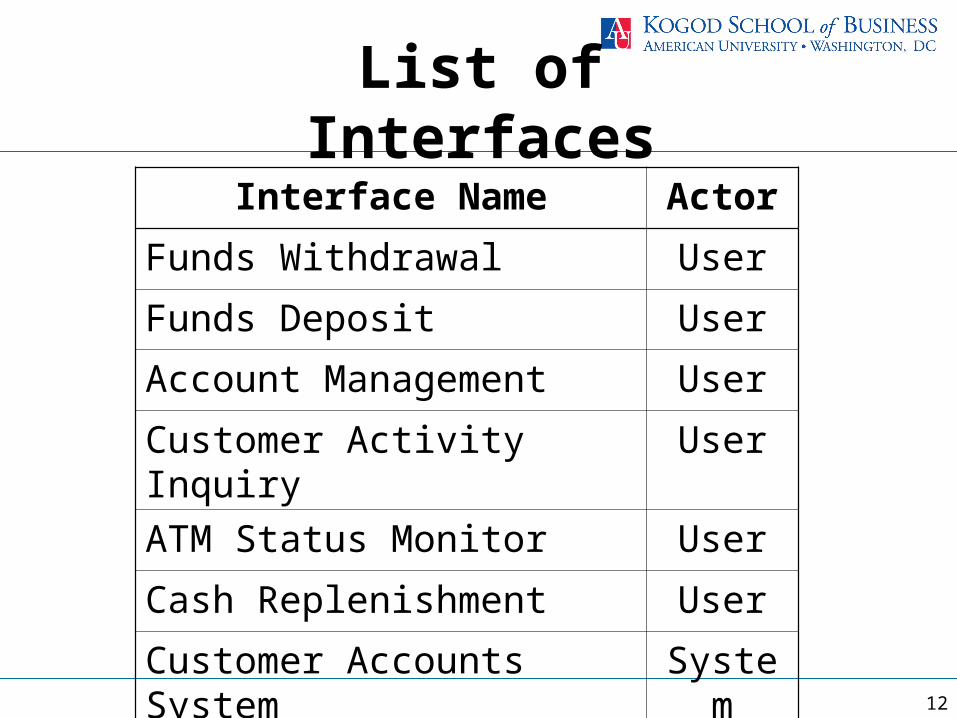
List of Interfaces
Interface Name Actor
Funds Withdrawal User
Funds Deposit User
Account Management User
Customer Activity Inquiry User
ATM Status Monitor User
Cash Replenishment User
Customer Accounts System System

13
Each Interface Has:
A name A set of “operation signatures” (for HCI and
API) indicating:– which data to “get” from the actor with the
operation (i.e., Get UserId, Name, etc.)– Which data to “return” to the actor when the
operation is complete A “storyboard” (for HCI only): visual
illustration of the sequence of screen designs to complete these operations

14
Example of Operation Signatures: Funds Withdrawal Interface
Get data from card magnetic tapeGet pass code from customer
Get customer transaction selection(user selects withdrawal)
Get account type for withdrawal Get amount to withdraw Return cash, or Return error message to customer Return thank you message to customer

15
A User Interface Can Be For:
Input into the system by the user for data entry or to query information from the system
A display output (on screen or other output device) by the system to the user
A printed output (on a printer or other output device)

16
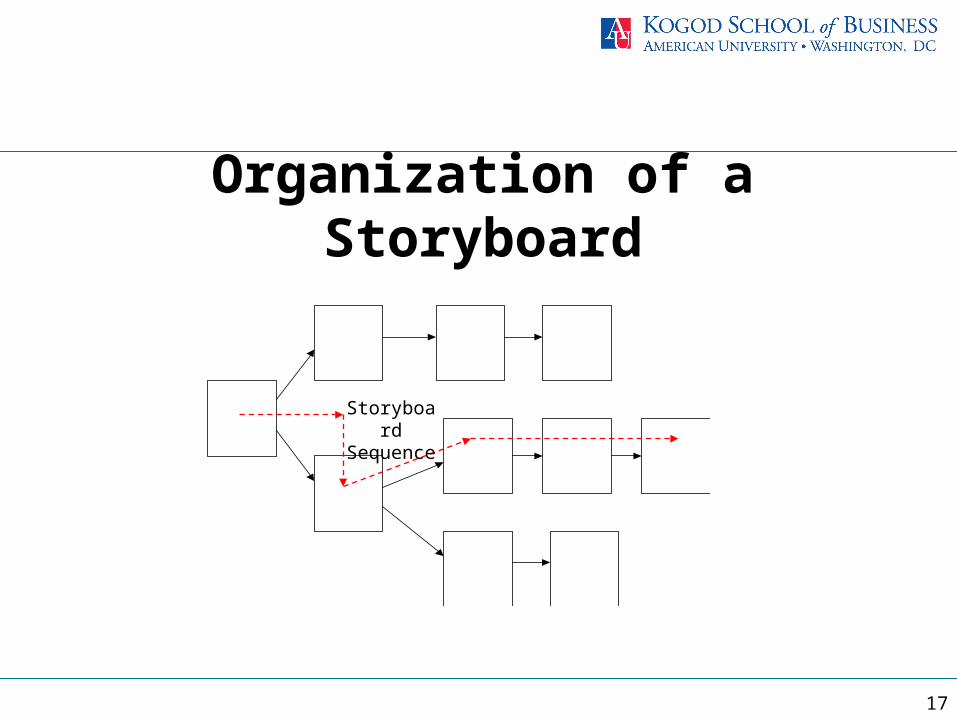
Diagramming the Interface: with “Storyboards”
User interfaces can be diagrammed as “storyboards”
A storyboard is a series of drawings that depict how the system looks at the start of the operation and after each significant change to the look of the interface
Is like a sequence of screenshots that follows the use case execution sequence
17
Organization of a Storyboard
Storyboard Sequence

18
A Bad Interface Storyboard

19
What to Include in an Interface Design Specification:
A list of all the interfaces between actors and use cases
For each interface (any actor – user or external system):– Indicate whether the actor is a user (human actor) or an external
system– Prepare a list of operation signatures detailing all the data that is
passed to/from the system before each operation and the data that is returned from/to the system after each operation
For users (human actors only):– Indicate when/if operations are taking place for data input, display
outputs or printed outputs– Prepare a storyboard for all screen input/output displays and printouts– Design the visual interface for all screen input/output displays and
printouts
For external system actors (only):– Indicate when/if operations are taking place to input or output data
from/to the system
20
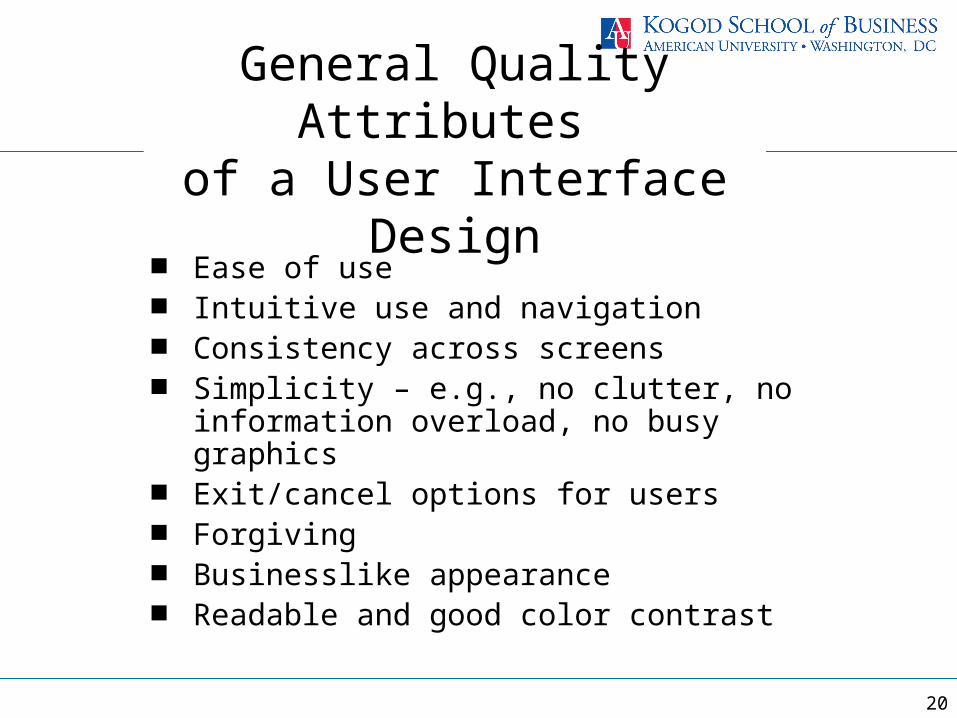
General Quality Attributes of a User Interface Design
Ease of use Intuitive use and navigation Consistency across screens Simplicity – e.g., no clutter, no information
overload, no busy graphics Exit/cancel options for users Forgiving Businesslike appearance Readable and good color contrast

AUProject Issues
22
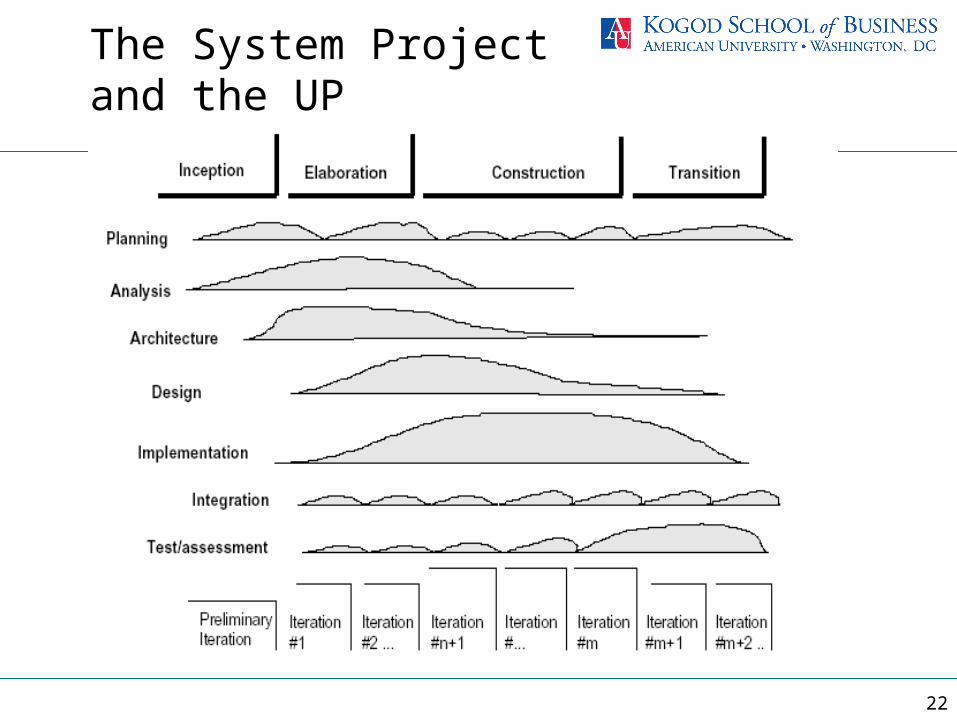
The System Project and the UP

23
The Project Plan
It is based on iterations, per the UP Define the iteration length Develop a domain model early Analyze, design, build, integrate, and test often Estimate how many (fixed-length) iterations
you will need for construction Decide the order in which things will be built
based on Use Case priorities Try to build the core functionality of the product
early (or at least prototype it)

24
Estimating Project Effort
Estimate the number of lines of code (LOCs)– Difficult to estimate upfront– Depends on the software language used– Not great for object-oriented systems & CASE tools
Constructive Cost Model (COCOMO)– A popular method– Effort estimation based on LOCs estimated– Same difficulties as with LOCs estimation
Use Case Points (UCP)– Similar to function points, but based on Use Case metrics
Function Points (FP)– Estimating effort based on what the software does, not LOCs– Every software function (e.g., a display, report, a data store)
has a function count– Then adjusted to function points based on complexity factors

25
Use Case Points (UCP) (Rational Software – a new way of estimating effort)
Count Actors and multiply by their weight:– 1 for a simple actor (an external system with a well
defined interface)– 2 for an average actor (an external systems with less
defined interface or a person using a simple interface)– 3 for a complex actor (people using a more complex
graphical interface) Count Use Cases and multiply by their weight
– 5 for simple Use Cases (3 transactions or less)– 10 for average Use Cases (4-7 transactions)– 15 for complex (more than 7 transactions)– A transaction is a set of Use Case steps performed
entirely or not at all (i.e., number of paths) Unadjusted Use Case Points (UUCP) Adjust for complexity and environmental factors

26
Calculate the Technical Complexity Factor (TCF)
Factor Description WeightRating
0: Irrelevant5: Essential
WeightedRating
T1 Distributed system 2
T2 Response performance objectives 1
T3 End-user efficiency 1
T4 Complex internal processing 1
T5 Code must be reusable 1
T6 Easy to install 0.5
T7 Easy to use 0.5
T8 Portable 2
T9 Easy to change 1
T10 Concurrent 1
T11 Secure 1
T12 Access to 3rd parties 1
T13 User training facilities 1
TFactor = Sum of weighted ratings
TCF = 0.6 + (0.01 * TFactor)
27
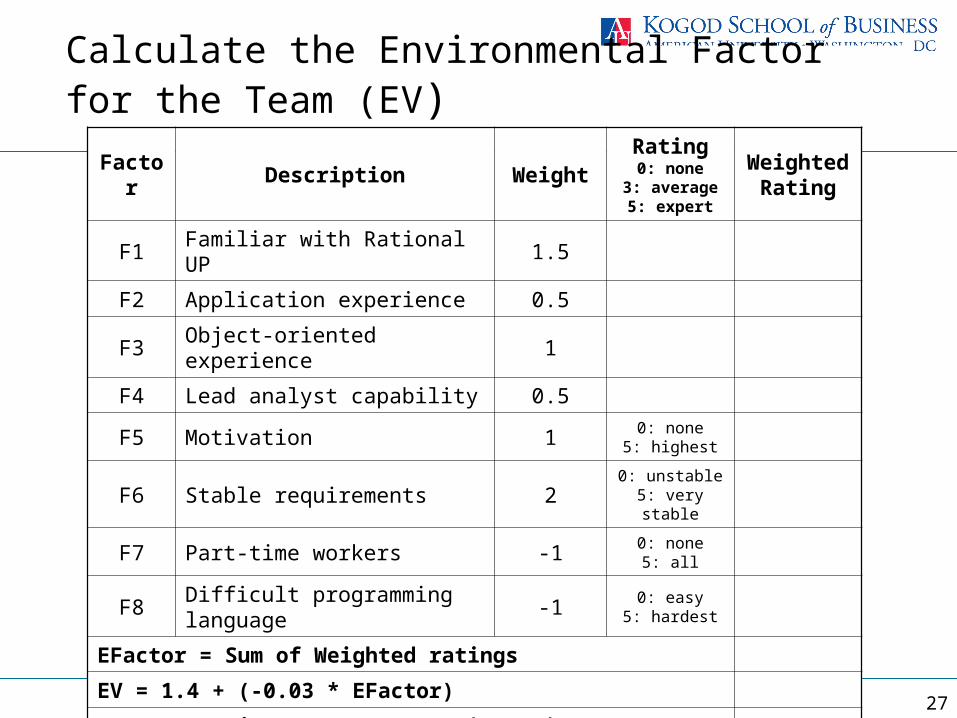
Calculate the Environmental Factor for the Team (EV)
Factor Description WeightRating0: none
3: average5: expert
WeightedRating
F1 Familiar with Rational UP 1.5
F2 Application experience 0.5
F3 Object-oriented experience 1
F4 Lead analyst capability 0.5
F5 Motivation 1 0: none5: highest
F6 Stable requirements 2 0: unstable5: very stable
F7 Part-time workers -1 0: none5: all
F8 Difficult programming language -1 0: easy5: hardest
EFactor = Sum of Weighted ratings
EV = 1.4 + (-0.03 * EFactor)
Use Case Points (UCP) = UUCP * TCF * EV

28
FYI Only: Function Points (FP) The traditional way of estimating effort Count:
– Number of user inputs– Number of user outputs– Number of user inquiries– Number of files– Number of external interfaces
Function Count = weight these counts based on their complexity and add them up
Function Points (FP) = adjust for other complexity factors

29
Function Count (FC)
Item Description Count x
Weight
=Weighted
CountSimple Avg Complex
Number of user inputs 3 4 6
Number of user outputs 4 5 7
Number of user inquiries 3 4 6
Number of files 7 10 15
Number of external interfaces 5 7 10
Total Weighted Function Count (FC)

30
Complexity Factor (CF) and Function Points (FP)Factor Description
Rating0: Irrelevant5: Essential
F1 Reliability and backup recovery
F2 Data communications
F3 Distributed processing
F4 Performance
F5 Operate on existing system
F6 On-line data entry
F7 Data entry over multiple screens
F8 Master files updated on-line
F9 Complex inputs, outputs, files & inquiries
F10 Complex internal processing
F11 Code needs to be reusable
F12 Need conversion and installation
F13 Multiple installations of the system
T14 Easy to change and use
Complexity Factor (CF) = sum of ratings
Function Points (FP) = FC x (0.65 + 0.01 x CF)

31
Estimate Effort and Cost from Experience
Project UCP’s FP’s LOCsEffort
(Person-Days
Cost per Person-
Day
TotalCost
ATM System 60.22 45.22 xx 362 $1,200 $434,400
Loan Processing System 82.34 53.21 xx 443 $1,200 $531,600
Order Processing System 95.20 65.22 xx 563 $1,200 $675,600
Point of Sale System 110.65 78.44 xx 615 $1,200 $738,000
Etc.
……… ….. ….. …. …. ….. ….
New project (est.) 134.30 108.77 xx xx $1,200 xx


