101
Energy Losses in the Immersion Compression Refrigerator Anna Warmińska Lublin 2013

Energy Losses in the Immersion Compression Refrigerator
Anna Warmińska
Lublin 2013
A. W
arm
ińsk
a E
ne
rgy Lo
sses in
the
Imm
ersio
n C
om
pre
ssion
Re
frige
rator

Energy Losses in the Immersion Compression Refrigerator

Monografie – Politechnika Lubelska
Politechnika Lubelska Wydział Mechaniczny ul. Nadbystrzycka 36 20-618 LUBLIN

Anna Warmińska
Energy Losses in the Immersion Compression Refrigerator
Politechnika Lubelska Lublin 2013

Impression: 100 copies
Reviewer: prof. dr hab. inż. Mirosław Wendeker Publication approved by the Rector of Lublin University of Technology © Copyright by Lublin University of Technology 2013 ISBN: 978-83-63569-66-2 Publisher: Lublin University of Technology ul. Nadbystrzycka 38D, 20-618 Lublin, Poland Realization: Lublin University of Technology Library ul. Nadbystrzycka 36A, 20-618 Lublin, Poland tel. (81) 538-46-59, email: [email protected] www.biblioteka.pollub.pl Printed by : TOP Agencja Reklamowa Agnieszka Łuczak www.agencjatop.pl

ContentsNotation . . . . . . . . . . . . . . . . . . . . . . . . . . . . . . . . . . . . . . . . . . 7
1. Introduction . . . . . . . . . . . . . . . . . . . . . . . . . . . . . . . . . . . . . 10
2. Literature Review . . . . . . . . . . . . . . . . . . . . . . . . . . . . . . . . . . 14
3. Modelling the Object of Study . . . . . . . . . . . . . . . . . . . . . . . . . . 27
3.1. Theoretical and Real Refrigeration Cycle . . . . . . . . . . . . . . . . . . 27
3.2. Refrigerator Experimental Model . . . . . . . . . . . . . . . . . . . . . . . 34
3.3. Characteristics of the couplings within the system and between thesystem and the environment . . . . . . . . . . . . . . . . . . . . . . . . . . 37
3.4. Analysis of Purposive Factors . . . . . . . . . . . . . . . . . . . . . . . . . 41
3.5. Analysing the Determinants of the Losses in the Refrigerating Appliance 44
3.5.1. Analysing the Major Losses in Compressor Subsystem - Ωsp . . 45
3.5.2. Analysing the Major Losses in Condenser Subsystem - Ωsk andEvaporator Subsystem - Ωpa . . . . . . . . . . . . . . . . . . . . . 46
3.5.3. Analysing the Major Losses in Regenerator Subsystem - Ωre
and Decompressor - Ωr . . . . . . . . . . . . . . . . . . . . . . . . 47
4. Methodology of the Experimental Studies . . . . . . . . . . . . . . . . . . 50
4.1. Refrigerator Design, Operational and Maintenance Properties . . . . . . 50
4.2. Process of Tank Liquid Cooling . . . . . . . . . . . . . . . . . . . . . . . . 52
4.3. Analysing the Major Factors for Energy Losses in a Real Refrigerator . 61
4.4. Experimental Set-up and Measurement Nodes . . . . . . . . . . . . . . . . 64
5. Experimental Studies in Transient and Steady-States . . . . . . . . . . . . 69
5.1. Methods of Measuring the Quantities Typical of Refrigerating ApplianceOperation . . . . . . . . . . . . . . . . . . . . . . . . . . . . . . . . . . . . . 69
5.2. Method for Measuring Refrigerant Mass Flow Rate . . . . . . . . . . . . 71
6. Analysing the Losses in the Refrigerating Appliance in Steady and
Transient State Conditions . . . . . . . . . . . . . . . . . . . . . . . . . . . . . 74
6.1. Experimental Studies . . . . . . . . . . . . . . . . . . . . . . . . . . . . . . 74
6.2. Analysing the Losses . . . . . . . . . . . . . . . . . . . . . . . . . . . . . . 83

6 Contents
7. Summary and Conclusions . . . . . . . . . . . . . . . . . . . . . . . . . . . . 90
Bibliography . . . . . . . . . . . . . . . . . . . . . . . . . . . . . . . . . . . . . . . 92
List of Figures . . . . . . . . . . . . . . . . . . . . . . . . . . . . . . . . . . . . . . 96
List of Tables . . . . . . . . . . . . . . . . . . . . . . . . . . . . . . . . . . . . . . . 99
Abstract . . . . . . . . . . . . . . . . . . . . . . . . . . . . . . . . . . . . . . . . . . 100
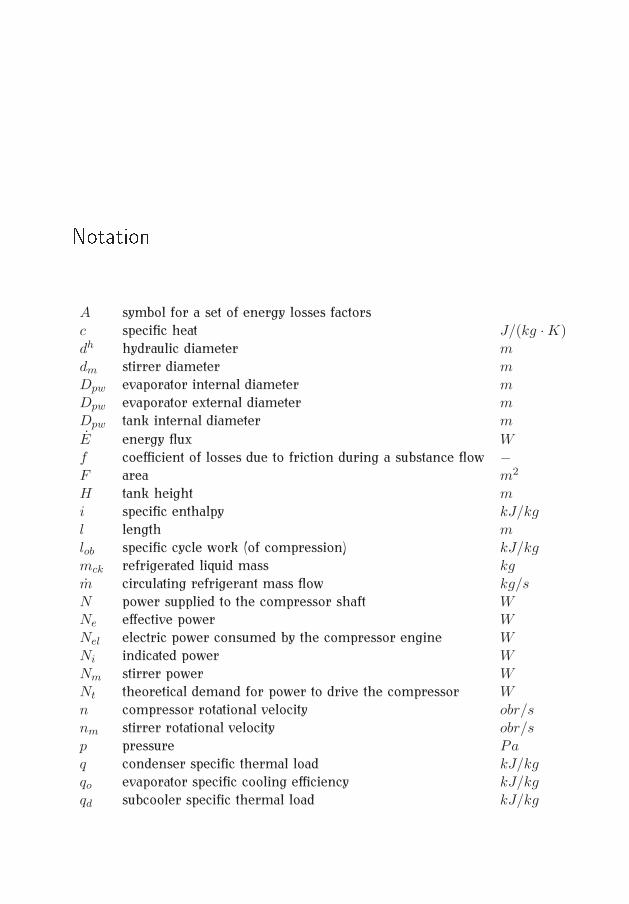
NotationA symbol for a set of energy losses factors
c specific heat J/(kg ·K)dh hydraulic diameter mdm stirrer diameter mDpw evaporator internal diameter mDpw evaporator external diameter mDpw tank internal diameter m
E energy flux Wf coefficient of losses due to friction during a substance flow −F area m2
H tank height mi specific enthalpy kJ/kgl length mlob specific cycle work (of compression) kJ/kgmck refrigerated liquid mass kgm circulating refrigerant mass flow kg/sN power supplied to the compressor shaft WNe effective power WNel electric power consumed by the compressor engine WNi indicated power WNm stirrer power WNt theoretical demand for power to drive the compressor Wn compressor rotational velocity obr/snm stirrer rotational velocity obr/sp pressure Paq condenser specific thermal load kJ/kgqo evaporator specific cooling efficiency kJ/kgqd subcooler specific thermal load kJ/kg
8 Notation
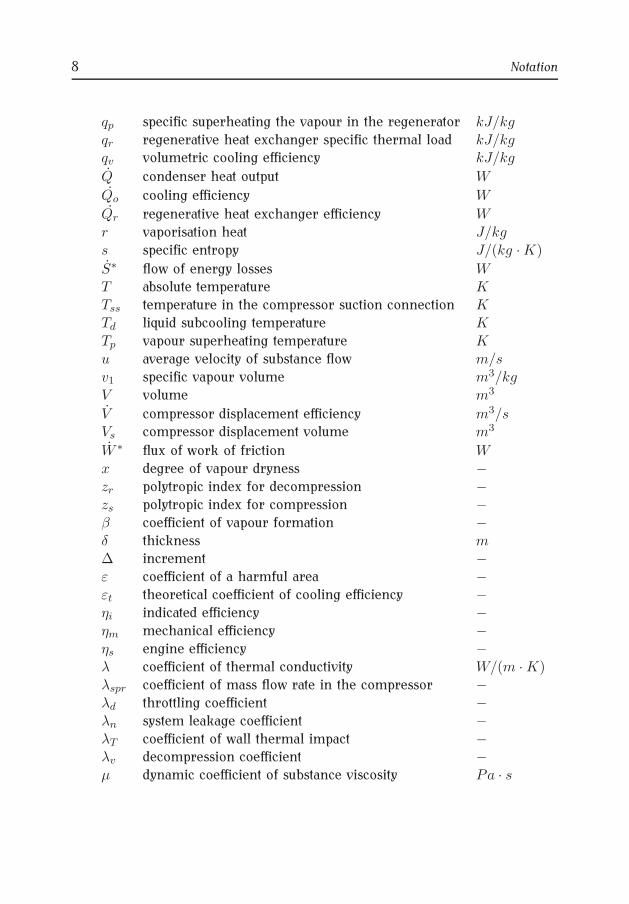
qp specific superheating the vapour in the regenerator kJ/kgqr regenerative heat exchanger specific thermal load kJ/kgqv volumetric cooling efficiency kJ/kg
Q condenser heat output W
Qo cooling efficiency W
Qr regenerative heat exchanger efficiency Wr vaporisation heat J/kgs specific entropy J/(kg ·K)
S∗ flow of energy losses WT absolute temperature KTss temperature in the compressor suction connection KTd liquid subcooling temperature KTp vapour superheating temperature Ku average velocity of substance flow m/sv1 specific vapour volume m3/kgV volume m3
V compressor displacement efficiency m3/sVs compressor displacement volume m3
W ∗ flux of work of friction Wx degree of vapour dryness −zr polytropic index for decompression −zs polytropic index for compression −β coefficient of vapour formation −δ thickness m∆ increment −ε coefficient of a harmful area −εt theoretical coefficient of cooling efficiency −ηi indicated efficiency −ηm mechanical efficiency −ηs engine efficiency −λ coefficient of thermal conductivity W/(m ·K)λspr coefficient of mass flow rate in the compressor −λd throttling coefficient −λn system leakage coefficient −λT coefficient of wall thermal impact −λv decompression coefficient −µ dynamic coefficient of substance viscosity Pa · s
9
Πs degree of compressor compression −Πr degree of compression −ρ substance density kg/m3
τ cooling time s
Subscripts:
ck liquid
d subcooling
k chamber
ot environment
p vapour
pa evaporator
s substance
sk condenser
w internal
z external
cp mixture (liquid and vapour)

1. IntroductionRefrigerating appliances are used in order to reduce the temperature of
substances below the ambient temperature. Temperature lowering can be re-
alised in open or closed cooling processes.
Different physical phenomena lowering the temperature for certain open
cooling processes were already known in ancient times. These include heat
absorption by evaporating water, the increased intensity of heat transfer at forced
airflow due to fans, and the use of water-ice to lower the temperature as close as
0oC. Scientific advances have brought along the use of refrigerating mixtures,
i.e. water-ice enhanced with various chemicals that can reduce temperature
below 0oC.
These open cooling processes are, however, merely temporary methods that
cannot guarantee continuous temperature lowering. To make a cooling process
continuous, it is necessary to develop a device which can continuously transfer
heat from lower to higher temperatures, or in a heat transfer direction opposite
to a natural one.
Heat transfer as determined by the second law of thermodynamics is only
possible if an additional outside energy is supplied. This energy can be supplied
into the system as mechanical work, heat or electricity.
Provided that mechanical work is supplied, the discussed here compressor
cooling appliance can operate, see Fig. 1.1.
The vapour compressor refrigerator of low and medium power consumption
is the most common type of a refrigerating appliance so as a group they can
consume a lot of electricity.
In the past, energy preservation in the cooling industry was of little attention
due to several factors:
• the amount of energy actually consumed for these purposes represents
a relatively small share in overall energy consumption;
• the energy to cool and refrigerate represents only a small share in the
energy consumed throughout the growing season and for food processing;
11
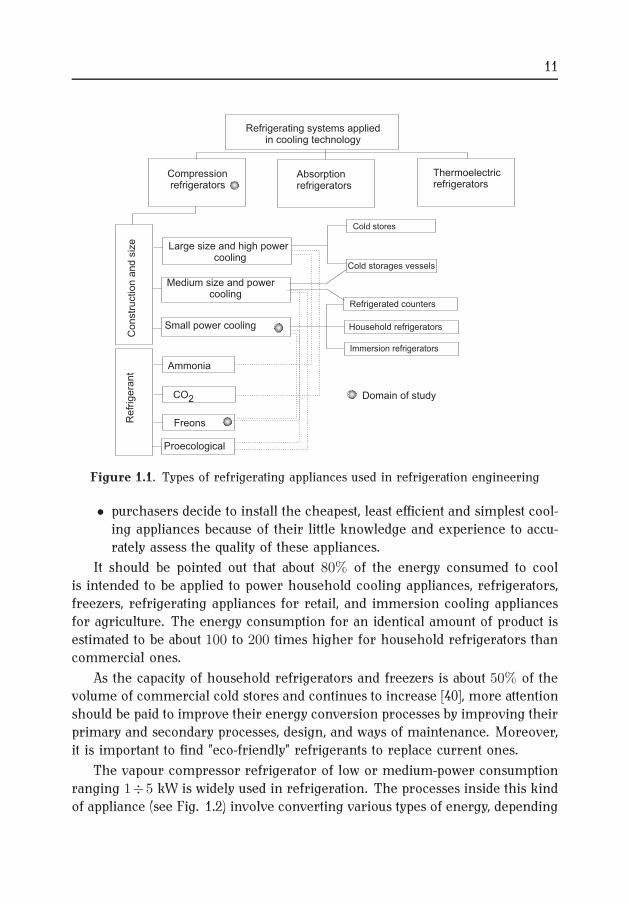
Refrigerating systems appliedin cooling technology
Thermoelectricrefrigerators
Absorptionrefrigerators
Compressionrefrigerators
Medium size and powercooling
Large size and high powercooling
Small power cooling
Ammonia
Freons
Proecological
Cold stores
Household refrigerators
Cold storages vessels
Refrigerated counters
Immersion refrigerators
CO2 Domain of study
Constr
uction a
nd s
ize
Refr
igera
nt
Figure 1.1. Types of refrigerating appliances used in refrigeration engineering
• purchasers decide to install the cheapest, least efficient and simplest cool-
ing appliances because of their little knowledge and experience to accu-
rately assess the quality of these appliances.
It should be pointed out that about 80% of the energy consumed to cool
is intended to be applied to power household cooling appliances, refrigerators,
freezers, refrigerating appliances for retail, and immersion cooling appliances
for agriculture. The energy consumption for an identical amount of product is
estimated to be about 100 to 200 times higher for household refrigerators than
commercial ones.
As the capacity of household refrigerators and freezers is about 50% of thevolume of commercial cold stores and continues to increase [40], more attention
should be paid to improve their energy conversion processes by improving their
primary and secondary processes, design, and ways of maintenance. Moreover,
it is important to find "eco-friendly" refrigerants to replace current ones.
The vapour compressor refrigerator of low or medium-power consumption
ranging 1÷5 kW is widely used in refrigeration. The processes inside this kind
of appliance (see Fig. 1.2) involve converting various types of energy, depending

12 1. Introduction
Compression
Throttlingprocess
Control ofthe operational
refrigerator
Heat transferin regenerator
Heat transferto environment
Heat transferfrom cold space
Thermodynamicalprocesses:evaporation,condensation,subcooling,heating
Transport ofrefrigerant
Realcoolingprocess
Energysupply to
the refrigeratingsystem
Figure 1.2. Diagram of the chief processes typical of the vapour compressor refriger-ator with heat regeneration
on their properties and applicability. If these processes proceed under real
conditions, they cause external and internal energy losses. The former ones
are due to flows of various kinds of energy between the refrigeration system
and the environment; whereas the latter ones occur inside the system as a result
of irreversible thermodynamic and flow processes that trigger an undesirable
increase in the entropy inside the system. Compression refrigerators have
aroused much interest for their broad application as cooling appliances used in
nearly all households, many farms or laboratories.
More attention should be paid to the compression refrigerators because of
the European Union regulations in force on food storage, milk processing tech-
nologies, and environmental protection. Simultaneously, these appliances are
high energy consuming equipment.
In fact, previous investigations have focused mostly on:
• a thermodynamic analysis of real cycles for quasi-steady and steady states
by means of energy and exergy methods;
• set-up experiments to test entire refrigeration systems and individual sub-
systems, including control systems;

13
Experimentaltests for selected
operationalconditions
Expermentalglobal test of
refrigeratingsystems
Experimentaltests of
separatedsubsystems
Analysisof cooling
efectiveness
Analysisof the internalproceses in
separatesubsystems Study of
the refrigeratingsystemcontrol
Analysisof the internal
processesof the total
system
Complex analysisof processes and
phenomena of compressionrefrigerating systems
Investigations ofthe refrigerantswhich are
ecologicallyfriendly
Searchof new
structuralmaterials
Objectives of experimentalinvestigations:- verification of theoreticalmodels,
Objectives of the theoreticalanalysis- selection of the parametersin order to minimize losses,
- study of the causes of lossesand their localisation,
- investtigations of proecologicalrefrigerants,
- readjustment of the structureto environmental conditionsand ergonomic maintenanceand reliability.
- testing of new refrigerantsand structural materials,
- analysis of control systemof the refrigerator.
Theoretical Analysis Experimental Investigations
Figure 1.3. Schematic of the methodology of studying compression refrigerator sys-tems
• studies on new, unconventional solutions for cooling systems, in particular
improving the ways of their maintenance and performance;
• a search for "eco-friendly" substances to replace the current refrigerants.
The research areas and their relations are summarised in Fig. 1.3.
2. Literature ReviewIn the relevant literature there is a discussion on results obtained for indi-
vidual refrigerator subsystems or examinations on ecological refrigerants. Ac-tually, there are only a few works which study comprehensively the overall
refrigeration system, including the immersion refrigerator one.
The discovery of the environmental impact of chlorofluorocarbons (CFCs)
on ozone hole formation and above all the greenhouse effect has triggered
intensive international actions to protect the environment. The challenge is
to cut down the production or use of chlorinated refrigerants, and ultimately
eliminate them. The first global legal regulations were the Vienna Conventionof 1985 for the Protection of the Ozone Layer and the Montreal Protocol of
1987 on Substances that Deplete the Ozone Layer to reduce CFC production
and consumption.
The objectives of some further international meetings of the countries that
signed up the Montreal Protocol were to reach an agreement on these restric-
tions and to enforce the deadlines for partial and total CFC reduction. To meet
these restrictions, new refrigerants are under research so that they could replace
successfully the current ones with no redesign or slightly modification only.
The small hermetic compressor refrigerator contains on average 100÷ 200grams of chlorofluorocarbon. Refrigerant leakage here is practically none since
these installations are welded or brazed and thus completely leakage-proof. The
entire amount of CFCs in this type of appliances corresponds to 1% of the total of
CFCs that escapes to the atmosphere. Certain procedures to remove a refrigerant
into closed containers, before the installation is opened, should be followed to
prevent CFC leakage in these appliances when repaired or disassembled. The
amount of CFCs in commercial and catering cooling appliances accounts for4% ÷ 5% of the total amount of a refrigerant generated worldwide. Thus, the
use of CFCs in these devices is not the most serious problem at all [40].
Nevertheless, environmental protection related to the emission of refrig-
erants is frequently considered for this group of appliances. This is critical
due to the need to find long-term alternative solutions that could satisfy all the
requirements for their due operation and service.
15
The ecological refrigerants that can replace the previous ones were classi-
fied in work [50]. It is extremely difficult to classify them in detail due to no
data available. To examine these refrigerants for their functions in a cooling
appliance, their thermodynamic properties and corresponding correct equations
of state need to be known. The BACKONE equations of state based on physicalproperties of alternative refrigerants such as natural refrigerants, hydrofluoro-
carbons (HFCs), saturated hydrocarbons (HC) or fluorine ethers were applied
here. Some calculations for a number of refrigerants have shown that hydro-
carbons and fluorinated ethers can be the best substitutes.
A set of equations to calculate refrigerant processes was developed in [30].
This set of equations is very useful for initial studies on the refrigerant because
only few experimental data is required there.
Refrigerant R134a is a type of modern refrigerant. It can be a good substitute
for its ecological properties. The paper [35] discusses several requirements
which need to be satisfied by the cooling appliance and conditions necessary to
be followed to operate the appliance appropriately if this type of refrigerant is
applied. There are developed the algorithms that enable a cooling mixture of
an equivalent volumetric cooling consumption compared to chlorofluorocarbon
refrigerants typical for the vapour compressor refrigerator. The author of the
work in [2] analysed the thermodynamic properties of cooling mixtures that
could replace the previous ones. Their properties have been taken from theFREPROD database. The computational algorithm enabled the cooling capacity
coefficients for these new mixtures to be derived. Then, they were compared
with the cooling capacity coefficients for CFC refrigerants. The comparative
pairs were as follows: R12 and mixture R290/R600a (56/44), R22 and mixture
R32/R125/R134a (32.5/5/62.5), and R502 and mixture R32/R125/R134a (43/5/52).
The tests have proved that these mixtures can successfully substitute CFCs.
Finding new refrigerants that could be harmless to the environment is still
a great challenge and many studies deal with this topic all the time. In order tofind the best new refrigerant, many research centres in the world frequently ex-
amine cooling appliances using a variety of refrigerants. Consequently, new nat-
ural freezing substances and mixtures are frequently discovered. Propane, bu-
tane, and their mixtures and derivatives are the most frequently investigated nat-
ural refrigerants. The results of these examinations show that these substances
can be applied more often than it is now due to their properties. The paper
[8] provides some results regarding the possibility of using a propane/isobutane
mixture as a circulating refrigerant in small compressor systems for house-
hold refrigerators, refrigeration counters and air-conditioners. The volume of

16 2. Literature Review
a refrigerant in the system, or the amount of a refrigerant circulating in the
cycle was studied in particular. Obviously, the volume of a refrigerant in the
system influences its thermodynamic parameters, energy consumption, and ef-
ficiency. Small systems with a mixture of propane/isobutane turned out to be
very sensitive to even slight changes in the volume of charging. Similar resultswere obtained for several other tested appliances. These results enabled the
ranges of charging to be defined for which the cooling appliance could reach
the thermodynamic parameters assumed. The refrigerator charging volume
range was compared to the ranges of charging volumes with refrigerants R12and R134a. It was emphasised that not only mixture composition but also the
charging volume need to be optimised.
In another study [23], the authors evaluated propane/butane mixtures as alter-
native refrigerants to R134a for household refrigerators. Numerical simulations
helped evaluate benefits from hydrocarbon mixtures as refrigerants. Cooling
performance characteristics were analysed within wide temperature ranges of
evaporation and condensation, i.e. (−30oC ÷ −10oC) and (40oC ÷ 60oC), re-
spectively for refrigerants such as R134a, propane, butane, and propane /isobu-
tane /n-butane mixtures with a varied mass fraction of propane. The charac-
teristics of these household refrigerators were analysed using a refrigeration
performance coefficient, volumetric refrigeration efficiency, condenser thermal
efficiency, power supplied to the compressor, compression in the compressor,
refrigerant mass flow rate. The results demonstrated that pure liquid propane
cannot replace R134a because of its high pressure operation and low efficiency.Butane shows numerous desirable properties but the compressor should be dif-
ferent then. A refrigeration performance coefficient for household refrigerators
with a three-component hydrocarbon mixture where a mass share of propane
ranges from 0.5 to 0.7 is higher than for R134a. To compare these refrigerants,
an average mass flow rate for a propane/butane mixture is confirmed to be 50%
lower than that of R134a, and saturation pressure, decompression temperature,
condenser heat load, power input, refrigeration efficiency, and refrigeration vol-
umetric efficiency for the same mixture but with a 60% mass share of propane
are almost identical as for R134a. The pressure ratio for 60% of propane in
a hydrocarbon mixture is lower by about 11.1% than that for R134a. These
results show that a propane /isobutane /n-butane mixture with a 60% fractionof propane is the most efficient for household refrigerators.
Performance and effectiveness of any cooling appliance is impacted by the
refrigerant used. Less ecological refrigerants need to be gradually replaced by
more ecological. The best refrigerants to replace less ecological ones in the
existing appliances are being continuously searched for. As specified in the

17
schedule on the withdrawal of harmful to the ozone layer refrigerants, refriger-
ant R22 can be used only until the end of 2013. Therefore, there is a continuous
search for the refrigerants having little impact on conditions and parameters
of the refrigeration cycle and whose replacement can be as cheap as possible.
Described in papers [36],[16], such beneficial refrigerants as alternatives for R22include R417A, R419A and R422. The study [3] deals with the procedure how
to convert a cooling appliance from R22 to R134a. The compared operation
characteristics resulting from these two refrigerants demonstrated that running
on R134a is 10% more expensive than on R22. The paper [32] compared the
operating properties of some environmentally friendly refrigerants like R134a,
R717, and R290 with the currently applied refrigerants, i.e. R12 and R22. This
study focused on how the loss of throttling and the theoretical and general ener-
getic efficiency in the single-stage compression refrigerating system is impacted
by refrigerants.
Another paper [9] provides the results of the research into household refrig-
erators with a propane/butane mixture. The theoretical analysis and preliminary
experimental studies prove that hydrocarbons are able to replace R12. It was
noticed that no construction changes are required if hydrocarbons are to be used
in the appliance, and the energy consumption is comparable to the nominal one
when refrigerant R12 circulates in the system. To replace any refrigerant in
a cooling appliance often needs redesigning and oil exchanging which can be
expensive. Therefore, the challenge is to find refrigerants that can replace
and efficiently operate as an alternative to CFCs in the existing devices. Theauthors of [57] looked for a new cooling mixture to replace R12 in house-
hold refrigerators. Thus, they experimentally examined new mixtures of sat-
urated hydrocarbons and hydrofluorohydrocarbons. The resultant parameters
and factors that impact on the performance characteristics of these refrigerants
were compared to those of R12. The results show that a butane/propane/R134a
mixture features excellent parameters, e.g. refrigeration efficiency coefficient,
compression power, filling coefficient, condenser and compressor efficiencies.
Moreover, these results indicate that this mixture can be an alternative to R12without exchanging oil in the compressor.
Similarly, the authors of [51] searched for mixtures alternative to R12. They
experimentally studied ecological HFC134a/HC600a/HC290 mixtures. Some of
them are highly flammable and have a low refrigeration efficiency coefficient so
safer and more efficient mixtures are required. This paper provided the results
of the experimental study on mixture HFC134a/HC in two low-temperature and
two medium-temperature systems. This mixture contains 9% of HC (by weight

18 2. Literature Review
concentration) and shows better performance by about 10 − 30% and lower
energy consumption by about 5− 15% than that of CFC12 in such systems.
The real challenge is to find new refrigerants as alternatives to the cur-
rently used. Frequently, works discuss partial examinations that focus only on
refrigerator elements running on a new refrigerant. For example, the author in
[65] studied the heat regeneration in a single-stage cycle with a new refrigerant,
i.e. R134a. The theoretical cycle included losses due to the thermostatic su-
perheating of a decompressing valve, the presence of oil, and the heat transfer
efficiency of a regenerative heat exchanger. The calculations have demonstratednumerous benefits from regeneration. In fact, they are increasingly significant
if the difference between a circulation temperature and oil concentration in
a solution is greater.
Many works have dealt with different elements of a cooling appliance. Thepapers [11], [12] explained how to select accurately a capillary tube which is
a typical throttling element in small refrigerators. These works provided some
models of a two-phase refrigerant adiabatic flow in a capillary tube and results
of the calculations for the CFCs, that are not used any longer and their future
alternatives. The authors discussed how to select the best capillary tube for new
refrigerants and how types of oil can impact on throttling [13].
The paper [5] provides an experimental model to select capillary tubes that
can adiabatically and non-adiabatically decompress a refrigerant in the small
compressor refrigeration system, in particular household refrigerators and freez-
ers. This model employs the assumption that the size of a capillary tube depends
on five basic variables, i.e. its diameter, refrigerant mass flow through this tube,
the pressure difference between high- and low-pressure sides, refrigerant sub-
cooling before the tube, and relative tube material roughness. The model was
compared with the authors’ previous studies for refrigerant HFC134a and is con-
sistent with experimental data. Another study [6] provides a uniform model ofan adiabatic capillary tube. A homogeneous two-phase flow model called CAPIL
was designed to analyse the performance of adiabatic capillary tubes in cooling
systems like refrigerators and freezers. The study adopted the fundamental
equations of mass, energy, and momentum conservation which were solved in
an iterative procedure by the Simpson method. The authors used experimental
relations for single- and double-phase flows that include flow resistance. They
employed the REFPROP database where the Carnahan - Starling - DeSantis state
equation to determine refrigerant properties is applied. This model takes into
account the effect of various parameters such as a tube diameter, relative tube

19
surface roughness, tube length, refrigerant subcooling at a tube inlet, refrigerant
flow speed in a tube. The calculations refer to refrigerant R134a.
The authors in their paper [7] developed a numerical model of capillaryheat exchangers to examine the performance of small household refrigerators.
The relevant heat transfer correlations were applied to illustrate reverse heat
transfer and re-condensation in the capillary tubes. The model was tested for
two refrigerants, HFC 134a and HC 600a. Simple theoretical equations were
expanded to describe the re-condensation in non-adiabatic tubes.
The work [33] discussed the impact of throttling on the efficiency of com-
pressor cooling cycles as well as the impact of refrigerants on the energy losses
due to throttling in these systems. The tests showed that ammonia was the least
sensitive refrigerant to such energy losses. The paper [26] analysed how adiabaticthrottling can influence the basic operation parameters of a system composed
of a capillary tube and a compressor suction line. The paper provided some
designing solutions of freezers applied in compressor refrigerators of low and
medium power. Additionally, the scientists attempted to evaluate how the heat
transfer in a freezer and the geometry of the system with a capillary tube and
a suction line can trigger the conditions for a critical flow, a meta-steady flow
or can influence capillary tube performance acoustics.
Another work [39] focused on the research activities undertaken by the Sci-
entific, Technical and Experimental Centre for Cooling Appliance Constructionin Moscow. This institution is engaged in the activities to improve the efficiency
of small cooling appliances with hermetic compressors in which a capillary tube
is a throttling device.
Heat exchangers are critical elements in cooling appliances so many works
discuss them. One of the papers deals with multi-criteria optimisation to design
heat exchangers [27]. When condensers and evaporators are designed, designers
need to consider many possible solutions and constraints, starting from those
related to a heat exchanger and ending with a device enforcing a cooled fluid or
coolant flow through a heat exchanger. Multi-criteria optimisation employs allkinds of correlations between quality criteria and decision variables to determine
a certain optimal set included within a set of feasible solutions and to determine
the optimal solution.
The models that describe the performance of heat exchangers in freezers
were assessed experimentally in the work [1]. These mathematical descriptions
take into account the variability of the heat transfer in an exchanger and the pa-
rameters indispensable to determine heat transfer coefficients for the refrigerant

20 2. Literature Review
with respect to subcooling, overheating, and two-phase flow for an evaporator
and a condenser. The experimental and analytical results were compatible.
The work [63] describes a thermal calculation method for evaporators and
condensers. Generalised variables applied in heat exchanger analysis simplified
the calculations and sometimes enabled researchers to abandon an iterative
method. Sample calculations performed for several heat exchangers demon-
strate that a generalised analysis can be applied in a designing process.
Improving heat transfer in refrigeration engineering is an important techni-
cal, economical, and ecological challenge. The author [46], [47] overviewed the
recent construction advances in shell - tube, plate or shell - plate heat exchangers.
All refrigerants are applicable for modern heat exchangers used as evaporatorsand condensers. The experimental studies were useful to specify the conditions
that can influence the intensification of heat transfer by turbulising the flow due
to increased flow resistance as well as determine when this phenomenon can
be beneficial.
The models of heat exchangers described in the literature typically refer
to a single element. Numerous works discuss evaporators and condensers or
subcoolers considered as elements of an entire refrigerating appliance. This
enables comprehensive examination of any process that occurs in them and
of the impact a given heat exchanger could have on the performance of the
entire appliance. Brazed plate heat exchangers are widely used as evaporators
and condensers in refrigeration engineering. They frequently work as heat
exchangers to recover the heat from the overheated refrigerant. The paper [15]
focused on using a plate heat exchanger as a subcooler/superheater to improve
operation parameters of the entire cooling system within a cooling cycle.
The performance of a pipe - ribbed evaporator for varied refrigerants, e.g. R600a
(isobutane), R290 (propane), R134a, R22, R410A, and R32 underwent optimisa-
tion analysis in [21]. Also, the authors studied how evaporator performance can
be impacted by these refrigerants. Evaporator operation was analysed not only interms of different refrigerants but also different designing solutions. Developed
with dedicated computer software, the evaporator model was used to analyse
varied refrigerants in a traditional way. A theoretical analysis of evaporator
performance on refrigerants like R410, R32, R290, R134a, R600a compared
with R22 shows that a cooling performance coefficient can be higher or lower
for these refrigerants as compared to that of refrigerant R22. These changes
are of 11.7% and can be given in the following formula: εi−ε22ε22
, where εi is
a cooling performance coefficient of a refrigerant compared. A performance
coefficient for R290 is better by about 3.5% for the modified evaporator than
21
that for R22, whereas performance coefficients for the other factors are higher
only by about 2%. The calculations refer to two temperatures.
The impact of compression subcoolers in domestic refrigerators on re-
frigeration was studied in [34]. The results indicate that subcooling increases
the mass flow rate of a throttled refrigerant under a full range of evaporation
temperature changes and the degree of subcooling of a liquid refrigerant as well
as significantly increases a vapour temperature in a compressor sucking line.
A mathematical model for evaporative condenser performance was devel-
oped in the paper [67]. The calculations and experiments indicate that this
mathematical model can correctly describe the qualitative and quantitative pro-cesses of heat and mass transfer in the spray - evaporative condenser. The
heat transfer in condensers and the shape of tube and wire condensers for
household refrigerators have been frequently discussed in many works. Thus,
the authors of [20] studied condenser designs to improve heat transfer there.
They compared different condensers and changed angles of their tubes to
examine how a heat transfer coefficient can change then.
The finite element method was used in [4] to develop a simulation model
to optimise tube and wire condensers. This model distinguishes a change
in thermal conductivity when a refrigerant flows along the condenser. The
experiments were done on pipe and wire condensers that are typical of domestic
vapour compressor refrigerators. Installed in a real refrigerator, the condenser
was tested under certain performance conditions. Its efficiency per unit of
weight for varied diameters of tubes and wires was optimised. An optimisation
coefficient was defined as the ratio of condenser efficiency per unit of the weightof the condenser designed, relative to its current design. Such a coefficient
enabled a better design as its mass flow rate was improved by 3% and weight
was reduced by 6%.
New condenser designs should feature better operation and maintenance
coefficients such as reduced energy consumption by a compressor engine,
which can be significant, considering a number of refrigerators in use.
The thermal performance of WTT Onda plate heat exchangers that work as
condensers was examined in [56]. The paper [14] discussed how to determine the
best surface area for heat exchange in a condenser powered by means of highly
overheated vapour. Such vapour generally reaches a condenser in a cooling
appliance and may be condensed there only when saturated, i.e. cooled before.
Moreover, the subcooling of condensate may occur in the condenser only if
an adequate heat exchange surface in this heat exchanger is provided. The
paper [49] presents a model of the condensation in a condenser of a convection

22 2. Literature Review
refrigerator and a two-phase flow for a condensing refrigerant in a pipe. The
authors discussed the relations for a heat transfer coefficient with respect to the
condensing solution of refrigerants.
Many works focused on the compressor as it is one of the most important
elements in any cooling appliance. For example, the authors [48] developed an
experimental and theoretical model of a reciprocating compressor to simulate
a cooling cycle. This model employed thermodynamic relations and extensive
experimental data referring to eight different refrigerants and two compressors.
Using this model, a relative error to determine refrigerant mass flow rate
and compressor power demand did not exceed 10%. The work [44] described
software that supports reciprocating compressor designing and helps to under-stand any processes while compressing a refrigerant. This software is capable
of examining the impact of various construction and thermal parameters on
compressor performance. The author [41] outlined the exergy method for
a compressor performance analysis to easily identify defects that influence
compressor shaft power. This knowledge can be helpful in improving the
compressor construction. Any losses may be due to friction, one-way heat
transfer, fluid throttling or mixing. These losses were recognised as exergy
indicators of destruction and then localised. This method can be applied to any
type of displacement compressors.
Based on experimental studies, energy characteristics for a reciprocating
compressor running on refrigerant R134a were developed in the work in
[17]. Also, this work discussed how reciprocating compressors and other
cooling appliance components should be efficiently selected for new ecological
refrigerants. Little knowledge about these refrigerants was expanded by some
experimental studies that enable finding some relations to efficiently select
refrigerants.
The several year development of refrigeration compressor designing and its
trends were outlined in the works [60], [61]. Also, the entire cooling appliance
was attempted to be examined there.
The paper [66] provided the research results for a cooling appliance running
on a new refrigerant, i.e. Forane 134a as an alternative to R12. The appliance
examined had got a hermetic aggregate adapted to R12. The refrigerant but
not mineral oil was exchanged. The energy measurement results indicate that
R134a can be used, especially in old appliances, with no need to change oil in
a hermetic aggregate. The device worked with and without a regenerated cycle.
The experiments confirmed that a regenerated circle for R134a is beneficial.
23
A mathematical model of a household compressor refrigerator was devel-
oped in [38]. The refrigerator was assumed to operate in a periodically fixed
state. Equations of energy and substance balance and additional heat transfer
equations were used to do the calculations for the whole system and individual
elements, respectively. The model was used to calculate a refrigerator consistingof an evaporator, a hermetic compressor, a condenser, a capillary tube, and
a subcooler.
A model to optimise a domestic compression refrigerator was discussedin another paper [53]. In fact, this new, much simpler and accurate model
was a good alternative to a previous complex mathematical one. The author
also claimed that the basic relations to describe the household compressor
refrigerator are approximately linear or square.
Thermo-economical optimisation of superheated cycles with subcooling in
the vapour compressor cooling appliance was provided in [52]. Exergy allowed
for separate optimisation of individual systems in a cooling appliance such as
a condenser, an evaporator, a subcooler but not the entire appliance. The
paper specified the optimal heat exchange area and the optimal temperatures
of subcooling and superheating. The cost of cooling was an optimisation
condition. All the calculations were done for three refrigerants, i.e. R22, R134a,
and R407C. Thermodynamic refrigerant properties were determined using an
artificial neural network approach.
A methodology to study single- and multi-stage cooling cycles in cooling
installations was discussed in [18]. The work describes how to standardise
a method for specifying cooling cycle efficiency. Moreover, the available
coefficients to evaluate cooling cycles are discussed. In the work [42] the author
provided a Carnot cooling cycle based on isothermal vapour compression andtwo reversible decompressors. This cycle is ideal, although it is similar to the
real one which can be developed for today’s appliances. Efficient operation of
any cooling appliance is defined by efficiency coefficients. Effective energy in
real refrigerators is much lower than that of an ideal one that operates between
a cooled chamber temperature and the ambient temperature. The reasons for
this significant deterioration in efficiency were determined by partial efficiencies
which if multiplied gave energy efficiency for the entire appliance [54].
The authors [58] analysed some defects in compressor refrigerators and
developed a leakage detection method for them. The resulting environmental
pollution could be avoided if their efficiency improved and refrigerant leakage
reduced. Refrigerant losses can directly and indirectly cause global warming.
As energy consumption in an inefficient appliance is much higher, more

24 2. Literature Review
greenhouse gases is emitted and the operating costs are higher. Today’s
leakage detection methods are not efficient enough as they fail to locate leakage
and indicate gradual leakage where refrigerant losses are insignificant and slow.
Thus, there is a need to develop methods for monitoring refrigeration systems
and analysing defects. The mentioned paper discusses the development ofleakage detection methods and introduces a new monitoring method based on
artificial intelligence. The system efficiency was tested under different operating
conditions.
Certain new ideas to develop a refrigeration method to quickly increase
refrigerant flow, i.e. within 1 minute by storing a refrigerant at low temperatures
were described in [29]. The method is capable of controlling refrigerant flow
rate through the evaporator. Therefore, the refrigerator compressor does not
need to be large to cope with significant loads during discontinuous operation.Higher mass flow rate, i.e. faster refrigerant flow can be obtained within this
short time than under steady operation. Research instruments were designed
and made to verify the assumptions adopted. Two tanks to store a refrigerant
were installed behind and in front of the evaporator. Refrigerant flow was
controlled with special valves. The assumptions for rapid cooling were verified
experimentally as correct. Actually, this approach can temporarily improve the
cooling efficiency in the low-efficient system. However, practical approaches
need to optimise cooling tanks and to make them smaller.
The challenge to design the micro-refrigerator was discussed in the work in
[28]. The author demonstrated how entropy generation rate can change in any
system depending on how much vapour compressor refrigerator is miniaturised.
As the parts in the micro-refrigerator are micro-scale, their efficient operation
can hardly follow the second law of thermodynamics. Although quantitative
assessment of entropy generation was not discussed there, the mechanical
compressor was the most difficult element to be miniaturised. If the vapour
compressor micro-refrigerator is to function correctly, the micro- compressor
and the minimisation of internal heat transfer into an evaporator needs to
be further studied. Another paper focused on the energy loss in the steam
compressor refrigerator due to refrigerant flow resistance [55]. The refrigerantflow resistance in the evaporator and condenser can significantly increase energy
consumption. The author introduced the definition of hydraulic efficiency to
describe these losses and provided its sample values based on the measurements.
Based on the reviewed literature, the works on vapour compressor refrig-
erators fall into four groups. The first group includes investigations on new
refrigerants and their thermodynamic properties. The second group covers

25
studies on partial optimisation of elements in vapour compression refrigerators
such as heat exchangers (evaporators, condensers), compressors, subcoolers,
and capillary tubes. These studies discuss how to optimise the performance of
the refrigerator with respect to individual parameters like refrigerant volumetric
flow in the evaporator and condenser, compressor efficiency etc. Multi-criteriaoptimisation increasingly involves the task to specify a set of optimal param-
eters for thermodynamic processes. The studies examine the impact of an
individual refrigerator element on entire refrigerator performance. Often, new
refrigerants and their properties are studied and compared with the previous
ones. Finally, the third group deals with the entire thermodynamic systems in
vapour compression refrigerators. Usually, the cooling efficiency of a cooling
appliance for various refrigerants is compared. The fourth group refers to tech-
nological studies. There is no comprehensive research capable of determining
a quantitative relationship between refrigerants that influence thermodynamic
processes and refrigerator efficiency coefficients.
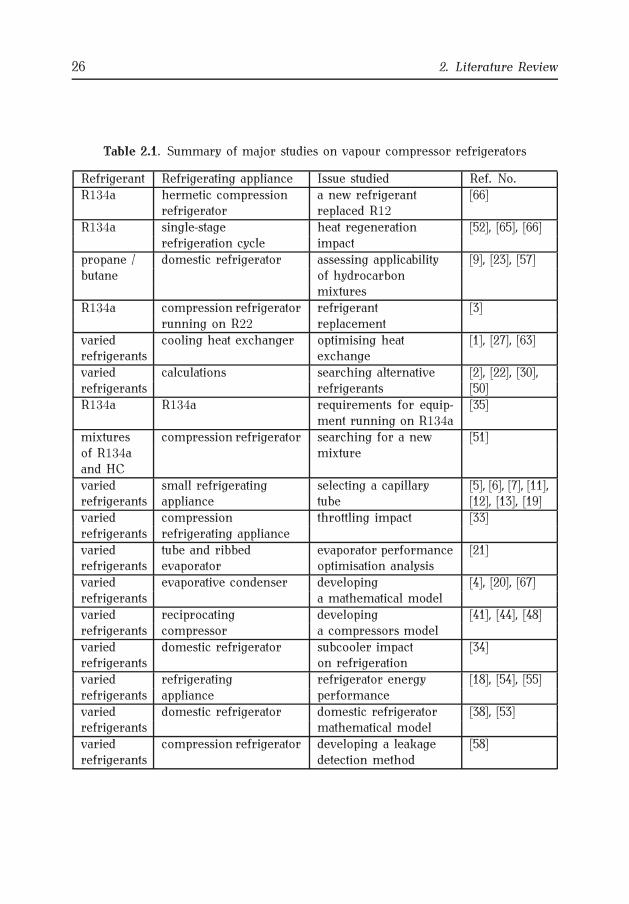
Table 2.1 summarises major studies on this undertaken subject. In fact,
no detailed descriptions of comprehensive studies on energy loss, especially
in the refrigeration compressor are available. Most of them study domestic
compressor refrigerators, excluding refrigerators typical of farming and the
food industry. There is also no systematic description of the cooling appliance.
This fact and also a large number of cooling appliances in operation, which
results in high energy consumption, motivated the author for examination of
energy losses in immersion compression refrigerants.
26 2. Literature Review
Table 2.1. Summary of major studies on vapour compressor refrigerators
Refrigerant Refrigerating appliance Issue studied Ref. No.
R134a hermetic compression a new refrigerant [66]refrigerator replaced R12
R134a single-stage heat regeneration [52], [65], [66]refrigeration cycle impact
propane / domestic refrigerator assessing applicability [9], [23], [57]butane of hydrocarbon
mixtures
R134a compression refrigerator refrigerant [3]running on R22 replacement
varied cooling heat exchanger optimising heat [1], [27], [63]refrigerants exchange
varied calculations searching alternative [2], [22], [30],refrigerants refrigerants [50]
R134a R134a requirements for equip-ment running on R134a
[35]
mixtures compression refrigerator searching for a new [51]of R134a mixtureand HC
varied small refrigerating selecting a capillary [5], [6], [7], [11],refrigerants appliance tube [12], [13], [19]
varied compression throttling impact [33]refrigerants refrigerating appliance
varied tube and ribbed evaporator performance [21]refrigerants evaporator optimisation analysis
varied evaporative condenser developing [4], [20], [67]refrigerants a mathematical model
varied reciprocating developing [41], [44], [48]refrigerants compressor a compressors model
varied domestic refrigerator subcooler impact [34]refrigerants on refrigeration
varied refrigerating refrigerator energy [18], [54], [55]refrigerants appliance performance
varied domestic refrigerator domestic refrigerator [38], [53]refrigerants mathematical model
varied compression refrigerator developing a leakage [58]refrigerants detection method
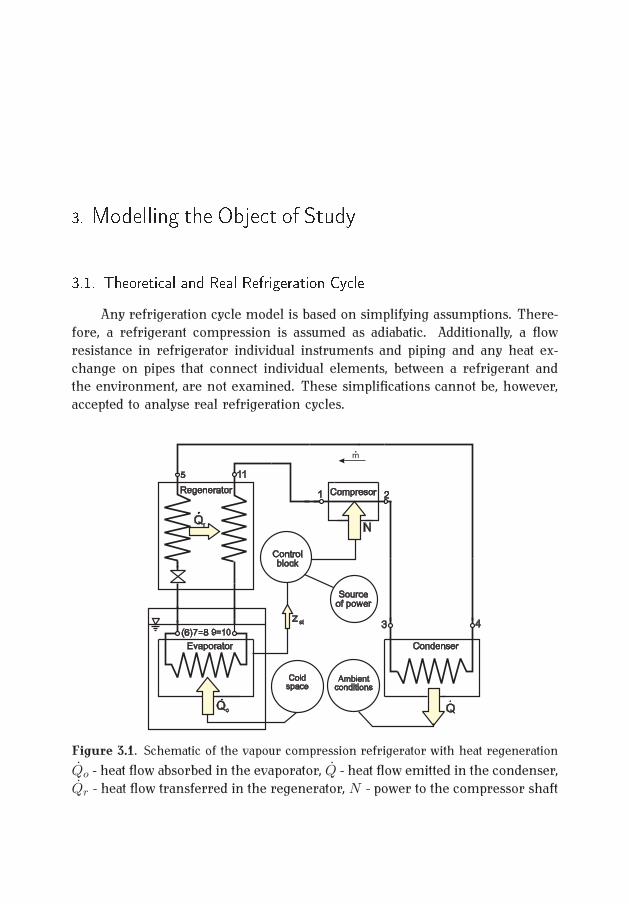
3. Modelling the Object of Study3.1. Theoretical and Real Refrigeration CycleAny refrigeration cycle model is based on simplifying assumptions. There-
fore, a refrigerant compression is assumed as adiabatic. Additionally, a flow
resistance in refrigerator individual instruments and piping and any heat ex-
change on pipes that connect individual elements, between a refrigerant andthe environment, are not examined. These simplifications cannot be, however,
accepted to analyse real refrigeration cycles.
Regenerator
Qr
Evaporator
Compresor
N
.
Qo
.
Condenser
Q.
3 4(6)7=8 9=10
5 11
1 2
Sourceof power
Controlblock
Ambientconditions
Coldspace
z st
m.
Figure 3.1. Schematic of the vapour compression refrigerator with heat regeneration
Qo - heat flow absorbed in the evaporator, Q - heat flow emitted in the condenser,
Qr - heat flow transferred in the regenerator, N - power to the compressor shaft

28 3. Modelling the Object of Study
Thus, an irreversible dry cycle which follows a dry refrigeration cycle with
heat regeneration (see PN/M-04600) is adopted as a thermodynamic model in
this refrigerator. A cooling appliance that operates according to the Linde
theoretic vapour cycle with heat regeneration and a thermodynamic cycle are
graphs of T − s and log p− i in Fig. 3.1 [31] and 3.2, respectively.
log pq
q
q
l
pT
T
TT
p
q
i
K
176
5 234
x=0
obo
Tsk
T2
papa
sk sk
p
d
d
p
,
,
(a) (b)
Figure 3.2. Thermodynamic cycle with heat regeneration as graphs of T − s andlog p− i
The compressor sucks in superheated vapour of pressure ppa and tempera-
ture T1 and compresses it during reversible adiabatic states 1− 2 up to pressure
psk and temperature T2. The refrigerant in state 2 enters the condenser, returns
its heat to the upper source, cools isobarically in the initial part of the condenseruntil saturated (state 3), and finally condenses between state 3− 4 farther in the
condenser at psk = const.
The refrigerant in state 4 as a boiling liquid of pressure psk enters the
regenerative heat exchanger where it returns its heat and cools isobarically upto state 5. The regenerative heat exchanger enables heat transfer between the
liquid refrigerant that flows from the condenser and the vapour refrigerant
that leaves the evaporator. This internal heat transfer results in subcooling
the liquid between states 4− 5 at psk = const and overheating vapour between
states 7 − 1 at ppa = const. This subcooled liquid of state 5 flows into the
compressing valve where it is throttled (isenthalpe 5− 6) up to pressure ppa.
Vapour that enters the evaporator (state 6) boils in the evaporator up to state
7. Later, when it leaves the evaporator, it becomes dry and saturated. This dry
saturated vapour of pressure ppa enters the regenerative heat exchanger where

3.1. Theoretical and Real Refrigeration Cycle 29
it warms up at ppa = const while absorbing heat. Consequently, its overheating
increases up to temperature Tp. Figure 3.2 shows the main processes in the
cycle that occur in different parts of the cooling system as graphs of coordinates
T − s and logp− i.
The refrigerator as a typical flow system should be described by typical
energy quantities relevant for its operation, i.e. relative to 1kg/s of a refrigerant,
if m of a refrigerant is known. In order to describe a refrigerator model, the
following quantities are introduced, as specified in Fig. 3.2:
• specific cooling efficiency qo
qo = i7 − i6 (3.1)
• specific compression (cycle) operation lob
lob = i2 − i1 (3.2)
• specific condenser heat load q
q = i2 − i4 (3.3)
• specific subcooler heat load qd
qd = i4 − i5 (3.4)
• theoretical coefficient of cooling efficiency εt
εt =qolob
=i7 − i6i2 − i1
(3.5)
• refrigerant mass flow rate in cycle m
m =Qo
qo(3.6)
• volumetric cooling efficiency qv
qv =qov1
(3.7)
where:
v1 - specific vapour volume in m3/kg

30 3. Modelling the Object of Study
• theoretical demand for power to drive the compressor Nt
Nt =Qo
εt=Qo
qolob (3.8)
• compressor displacement efficiency V
V =Qo
qv=Qo
qov1 (3.9)
• demand for indicated power Ni
Ni =Nt
ηi(3.10)
where :
ηi - compressor indicated efficiency
• effective power demand Ne
Ne =Ni
ηm(3.11)
where :
ηm - compressor mechanical efficiency.
Having defined these basic quantities, we can determine the flow of con-
denser heat emitted to the environment and the flow of subcooler heat emitted
Q = m (i2 − i4) (3.12)
Qd = m (i4 − i5) (3.13)
The enthalpy of superheated vapour (behind the regenerator) can be calculated
from the regenerator balance equation:
Qr = m (i1 − i7) = m (i4 − i5) (3.14)
If this equation is divided by m, the following equation is obtained
qr = i1 − i7 = i4 − i5 (3.15)

3.1. Theoretical and Real Refrigeration Cycle 31
and hence
i1 = i7 + i4 − i5 (3.16)
where : Qr/m = qr - specific heat load in the regenerator.
A unitary refrigerator heat balance is defined as follows:
|lob|+ qo + qp = |q|+ qd (3.17)
where:
qp = qd (3.18)
qp - specific overheated heat in the regenerator.
Internally exchanged in the system, regenerative heat is at the both sides of
that balance equation. Its value can be reduced by balance equations because
it has no effect on the final form of a heat balance equation in the appliance.
These considerations were based on simplifying assumptions. First of all,
the refrigerant compression was assumed as adiabatic. Any flow resistance in
each refrigerator instrument and piping was disregarded, provided that any
changes are isobaric. Furthermore, the heat exchange between a refrigerant
and the environment was assumed to occur only in heat exchangers. Figure
3.3 shows the real refrigeration cycle, given by coordinate systems T − s and
log p− i.
The real heat flow differs significantly from the theoretical one in terms of
energy, volume and hydrodynamic losses. Compression in real vapour cooling
cycles proceeds in a much more complex way - see Fig. 3.3. The refrigerant
of state 1, pressure ppa2 and temperature T1 is in the compressor inlet pipe.
Throttling due to suction decreases refrigerant pressure up to pss. Then the
sucked refrigerant is heated in the compressor before a compression stroke,
and isobar pss shifts to the right, i.e. as specific entropy increases. Any furthertemperature rise is due to the mixing of a refrigerant that remained in a harmful
cylinder space and that which was decompressed in the previous compressor
stroke, which results in state 1s. The heat transferred between states 1 − 1scan be considered as a loss. The real course of compression occurs when
an exponent of polytropy changes continuously. In the initial phase (passage
1s− pA), when the refrigerant compresses, it absorbs the heat from cylinder
compressor walls. The temperatures of the refrigerant and the walls level
in state pA, i.e. at an adiabatic transition point. As pressure increases due
to further movement of a piston, the refrigerant temperature increases. The

32 3. Modelling the Object of Study
direction of heat flow changes and heat transfer occurs between the refrigerant
and the walls (passage pA− 2s). The pressure in state 2s is higher than that
in the condenser due to flow resistance, i.e. throttling in discharging valves.
T
1
2
3
45
6
789
1011
1s
i=idem
i=idem
i=idem
pA
2s
s
ppa1
ppa2pss
lob
psk1
psk2
pd
qd
qp
qo
1
2345
6
7 8910 11
1s
log p
pA
2s
Kx=
0 x=1
s=id
em
i
p
p
sk2
ppa1
pa2
pss
Tp
Td
pd
psk1
q
qp
qo
qd
a)
b)
Figure 3.3. Schematic of a hypothetical cooling process in a real appliance (a) ina set log p− i and (b) in a set T − s
The processes include: 1 − 2 sucking and compressing a refrigerant with
a compressor, 3 − 4 cooling a refrigerant in a condenser, 5 − 6 subcooling
a refrigerant in a regenerator, 6−7 throttling a refrigerant in a capillary tube,
8− 9 boiling a refrigerant in an evaporator, 10− 11 process in a regenerative
heat exchanger
At first, the compressed refrigerant is cooled due to heat emitted to cylin-
der walls. Then, it passes through discharging valves and its state changes
isenthalpically and reaches pressure psk1. Refrigerant flow and condensation

3.1. Theoretical and Real Refrigeration Cycle 33
while flowing through the condenser is accompanied by a pressure drop just as
evaporation in the evaporator. Pressure drops follow flow and internal friction
resistances. The process of subcooling the liquid refrigerant and superheating
the refrigerant vapour occur in the regenerator. The subcooled refrigerant
in state 6 enters the discharging valve where it decompresses, and its heat isemitted to the environment.
The fundamental output values to calculate thermally the model cycle given
in Fig. 3.2 are:
- refrigeration cycle efficiency Qo kW
- circulating refrigerant temperatures:
• evaporation temperature Tpa K
• condensation temperature Tsk K
• subcooling temperature Td K
• overheating temperature Tp, or alternatively refrigerant vapour
temperature Tss in the compressor suction nozzle K
Refrigeration cycle efficiency Qo, or the so called cooling power results from
the heat balance equation of the environment cooled and depends on the mass
of the liquid cooled, a required refrigeration degree, and its physical properties.
Cycle refrigeration efficiency is defined by the formula:
Qo = KQou (3.19)
where:
Qou - is useful cooling power.
Coefficient K includes the increased heat flow that reaches a cycle model
relative to the heat flow which would reach the reference cycle. Its value shall
range from 1 to 1.2. Useful average cooling power Qou is calculated from the
equation:
Qou =mckcck (Tck1 − Tck2)
τ(3.20)
where:
mck - refrigerated liquid mass, kg
cck - liquid specific heat, kJ/(kg ·K)Tck1, Tck2 - liquid initial and final temperatures, K
τ - liquid cooling time, s.
The values of the above temperatures are selected according to specific rules,
e.g. following operating conditions. Condensation temperatures depend on

34 3. Modelling the Object of Study
the ambient temperature. The difference between condensation temperature
Tsk and average temperature of the air that reaches condenser Tpo ranges
from 10 to 15K, which depends on an air heat transfer surface, i.e. cooling
air temperature can rise from 5 to 10 K. Evaporation temperatures depend
on technological aspects, i.e. selected with respect to the temperatures of therefrigerated environment. While cooling the liquid, evaporation temperature
Tpa is recommended to be by 5 ÷ 8 K lower than the average temperature
of the refrigerated environment if an evaporator material is to be expensive,
otherwise this range should be less. Refrigerant subcooling temperature Tdbefore the capillary tube should be lower by about 2÷ 5 K than condensation
temperature Tsk .3.2. Refrigerator Experimental ModelElements of any refrigerator system are connected with pipes in which
a refrigerant flows. This is a closed thermodynamic flow system where heat and
work are transferred to the environment. When partial refrigeration processes
occur in each of these elements, these elements interact with others and some
of them interact with the environment. The irreversibility of these processes
can be internal, i.e. internal irreversibility - Sw or external, i.e. externalirreversibility - Sz . The former type refers to failed thermodynamic balance
conditions, internal friction of refrigerant particles, chemical reactions, mixing
etc. The latter one includes heat transfer at a finite temperature difference and
throttling.
Any real left-side cycle is irreversible. This raises the issue of how to
determine a degree of its irreversibility. Thermodynamically, this issue is
solved by comparing an irreversible cycle with a selected reversible cycle of
equivalent useful cooling power, or of the same refrigeration efficiency - qo(related to 1 kg of a refrigerant).
To facilitate this analysis, refrigerator operation is given in a systematic way
and the Linde dry cycle with heat regeneration is adopted as a reference cycle.
Correct assessment of the irreversibility of a real cycle is possible only if
an equivalent (referential) reversible cycle is selected correctly. Criteria for
this selection include a varied heat source (upper and lower) temperature.
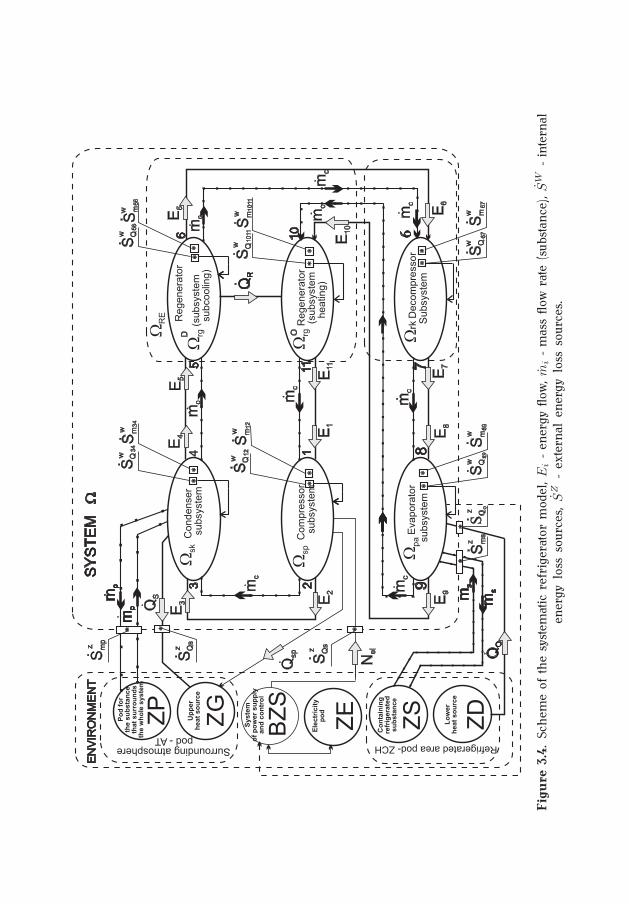
Thus, the refrigerator is a thermodynamical and flow system where energy is
converted for specified purposes and which interacts with a given environment,
as depicted in Fig. 3.4.
3.2. Refrigerator Experimental Model 35
The refrigeration system includes: compressor subsystem - sp, condenser
subsystem - sk, evaporator subsystem - pa, decompressor subsystem - rk,
regenerator subsystem - rg. In the vicinity of the system – o, there are energy
sources: electricity - ZE, surrounding atmosphere - AT (referred to as "upper
heat source" - ZG and the substance that surrounds the whole system - ZP ,excluding the evaporator subsystem), refrigerated area - ZCH (referred to as
"lower heat source" - ZD and containing refrigerated substance - ZS). Nearby,
there is also a system to control system operation indicated as - BZS.
Wsk
Co
nd
en
se
rsu
bsyste
m
Re
ge
ne
rato
r
(su
bsyste
msu
bco
olin
g)
Wrg
Wsp
Co
mp
resso
rsu
bsyste
m
WR
E
Wrg
Re
ge
ne
rato
r(s
ub
syste
mh
ea
tin
g)
su
bsyste
m
Wp
aE
vapora
tor
Su
bsyste
mW
rkD
ecom
pre
ssor
45
OD6
3 21
11
10
98
76
Po
d f
or
the s
ub
sta
nce
that
su
rro
un
ds
the w
ho
le s
yste
m
Up
pe
rh
ea
t s
ou
rce
Ele
ctr
icit
yp
od
Sy
ste
mo
f p
ow
er
su
pp
lya
nd
co
ntr
ol
Co
nta
inin
gre
frig
era
ted
su
bsta
nce
Lo
we
rh
ea
t s
ou
rce
ZP
ZG
ZE
ZS
ZD
EN
VIR
ON
ME
NT
SY
ST
EM
W
SQ
s
Nel
Sm
sS
QS
QS
QS
mS
m
Sm
Sm
SQ
SQ
.z
.w
.w
.w
.w
.w
.w
.w
.w
Sm
p
.z
SQ
s
.z
.z
.z
ms
ms
QO
Qsp
89
67
89
67
34
56
34
56
Sm
SQ
.w
.w
.1
21
2Q
RS
mS
Q
.w
.w
10
11
10
11
E5 E
11
E1
E10
E6
E2
E9
E4
E3Q
Smp
mp
Surrounding atmospherepod -AT
Refrigerated area pod- ZCH
BZ
S
**
*
**
E6
E7
E8
*
*
*
o
**
mc
mc
**
mc
**
mc
mc m
c
mc
mc
mc
*
*
*
Fig
ure
3.4
.Sch
eme
of
the
syst
emat
icre
frig
erat
or
model
,E
i-
ener
gy
flow
,m
i-
mas
sflow
rate
(subst
ance
),SW
-in
tern
alen
ergy
loss
sourc
es,SZ
-ex
tern
alen
ergy
loss
sourc
es.
3.3. Characteristics of Internal and External Couplings 373.3. Characteristics of the couplings within the system and between thesystem and the environmentInternal and external couplings, i.e. between the subsystems, and between
the system and the environment are discussed for each subsystem, respectively.
Compressor subsystem - Ωsp
Here, energy conversion proceeds during non-adiabatic and irreversible
thermodynamic transformations, refrigerant compression in a state of super-
heated vapour and irreversible processes when the refrigerant is transported
to and from the compressor, and the conversion of electricity into mechanicalenergy. These conversion processes are accompanied by internal and external
energy losses. This subsystem consists of compressor subsystems and their
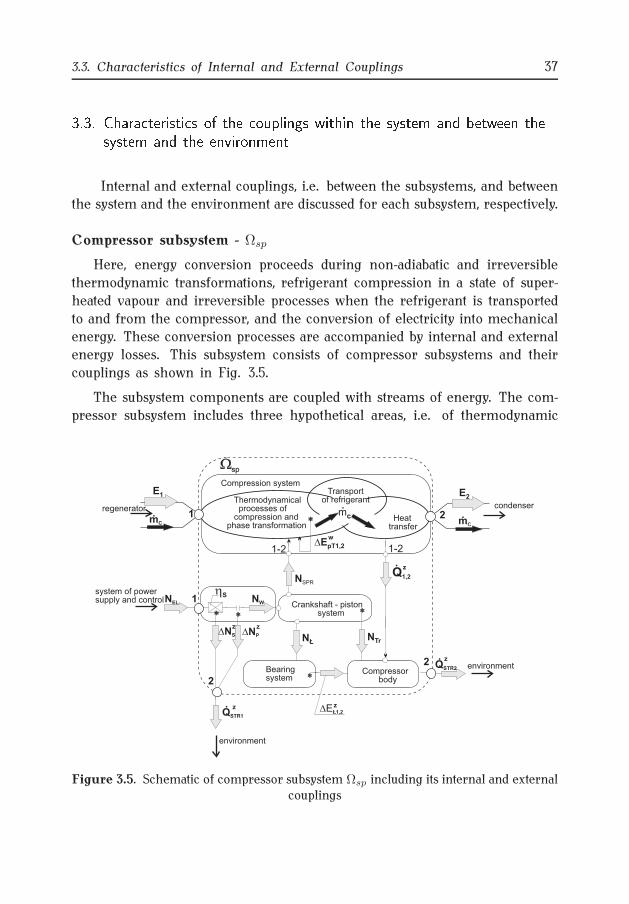
couplings as shown in Fig. 3.5.
The subsystem components are coupled with streams of energy. The com-
pressor subsystem includes three hypothetical areas, i.e. of thermodynamic
.
mC
.mC
.mc
.
E1 E2
1
1
2
2
2
Thermodynamicalprocesses of
compression andphase transformation
Heattransfer
Compression system
1-2
NSPR
1-2
Q1,2
.
Crankshaft - pistonsystem
NŁNTr
Bearingsystem
hSNW
QSTR1
.
NEL
mc
.
Wsp
DEpT1,2
w
Compressorbody
z
QSTR2
.
z
z
DNPDNS
z z
DEŁ1,2
z
Transportof refrigerant
*
*
**
*regenerator
system of powersupply and control
environment
condenser
environment
Figure 3.5. Schematic of compressor subsystem Ωsp including its internal and externalcouplings

38 3. Modelling the Object of Study
conversions, refrigerant transportation processes, and heat transfer processes.
These areas are in contact and connected with no energy losses.
Subsystem Ωsp is internally (substantially and energetically) coupled to the
subsystems of regenerator and condenser, - Ωrg and - Ωsk, respectively. The
subsystem is connected externally to surrounding atmosphere - AT (energeti-
cally to upper heat source - ZG and substantially to electricity source - ZP ),
and energetically to electricity source - ZE where this coupling is controlled
by the controller depending on the evaporator environment - BZS.
Condenser subsystem - Ωsk and evaporator subsystem - Ωpa
The isobar-like open irreversible thermodynamical conversion of a refrig-erant phase change proceeds in condenser subsystem - Ωsk. This conversion
is triggered by heat transfer, from the refrigerant towards the environment
and a compressor pumping effect, which leads to internal and external energy
losses.
The area ofthe thermodynamicaltransformation witha phase change
Heattransfer
m.
.
Geometrical and materialstructural parameters
mc
.
Internal space
Ambient air
regenerator*
The area ofthe flow
.
compressor
QS
QS
.
.
QS
.
Wsk
E3 E4
3 4
DE3,4
w
environmentmpmp
mp
mcmc
..
.
. .
environment
Heattransfer
Figure 3.6. Schematic of condenser subsystem Ωsk with its internal and externalcouplings
3.3. Characteristics of Internal and External Couplings 39
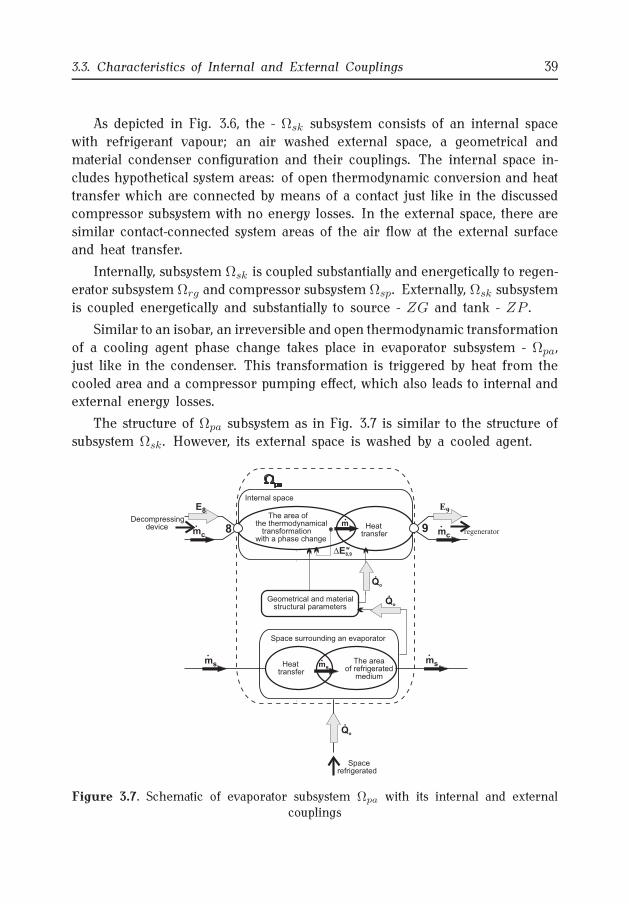
As depicted in Fig. 3.6, the - Ωsk subsystem consists of an internal space
with refrigerant vapour; an air washed external space, a geometrical and
material condenser configuration and their couplings. The internal space in-
cludes hypothetical system areas: of open thermodynamic conversion and heat
transfer which are connected by means of a contact just like in the discussedcompressor subsystem with no energy losses. In the external space, there are
similar contact-connected system areas of the air flow at the external surface
and heat transfer.
Internally, subsystem Ωsk is coupled substantially and energetically to regen-
erator subsystem Ωrg and compressor subsystem Ωsp. Externally, Ωsk subsystem
is coupled energetically and substantially to source - ZG and tank - ZP .
Similar to an isobar, an irreversible and open thermodynamic transformation
of a cooling agent phase change takes place in evaporator subsystem - Ωpa,
just like in the condenser. This transformation is triggered by heat from the
cooled area and a compressor pumping effect, which also leads to internal andexternal energy losses.
The structure of Ωpa subsystem as in Fig. 3.7 is similar to the structure of
subsystem Ωsk. However, its external space is washed by a cooled agent.
The area ofthe thermodynamical
transformationwith a phase change
Heattransfer
The areaof refrigerated
medium
m.
.
Geometrical and materialstructural parameters
Qo
Qo
.
.
Qo
.
Wpa
ms
.
mc
.
E8 E9
8 9
DE8,9
w
Internal space
Space surrounding an evaporator
Decompressingdevice
regenerator*
msms
mcmc
..
..
Heattransfer
Spacerefrigerated
Figure 3.7. Schematic of evaporator subsystem Ωpa with its internal and externalcouplings

40 3. Modelling the Object of Study
Inside the system, the subsystem Ωpa is coupled substantially and ener-
getically to the subsystem of decompressing appliance - Ωrk and regenerator
Ωrg. Externally, the evaporator subsystem is coupled energetically to lower
heat source - ZD and substantially to cooled substance container - ZS. These
two form the area ZCH , in the surroundings.
Regenerator subsystem - Ωrg and decompressing appliance - Ωrk
Regenerators, in the small and medium-power refrigerators, work as sub-
coolers and decompressing devices. These two functions are considered here as
two separate in-line subsystems, namely regenerator - Ωre and decompressing
device - Ωrk, as in Fig. 3.8.
Throttling The areaof refrigerant
flow
.
LSTR
.QRK
.
Wrk
.mc
.mc
.mc
mc
.
6 7
E7E6
regenerator
Fluid flow - liquid state
The areaof air flow
Heattransfer
QSTR
QR
QR.
.
.
QSTR
.
. .
Wrg
.mc
.mc
.mc
.mc
.mc
.mc mc
.mc
.
mc
.
5 6
Geometrical and materialstructural parameters
mp
.
10 11
E11
DE5-6
DE10-11
E10
E5 E6
*
*
w
w
Space of high pressure
Ambient air
environment
compressor
Decompressingdevice
condenser
evaporator
evaporator
Heattransfer
Space of low pressure
Fluid flow - vapour state
Heattransfer
Figure 3.8. Schematic of regenerator subsystem - Ωrg and decompressing device -Ωrk with their internal and external couplings
This approach influences the way these subsystems are modelled. Triggeredby
aflowofregenerationheat andcompressorpumpingeffects, irreversibleprocesses

3.4. Analysis of Purposive Factors 41
such as agent cooling in the high pressure internal area and agent heating in the
low pressure external area proceed in regenerator subsystem - Ωrg.
The subsystem consists of:
• a high pressure cooled area with possible areas of system processes
like changes in the degree of heating and cooling and refrigerant flow,
connected by means of a contact with no energy losses;
• a low pressure heated area with the same system areas;
• an air-washed external area with contact-connected possible system areasof heat transfer and air flow;
• a geometric and material system, coupled energetically.
The Ωrg regenerator subsystem within the system is coupled substantially and
energetically to the subsystems of condenser - Ωsk, of decompressing appliance
- Ωrk, of evaporator - Ωpa, and of compressor - Ωsp. Externally, subsystem
Ωrg is coupled energetically to "upper heat source" - ZG and substantially to
container - ZP , that are in the environment (AT ).
As in the system model for the regenerator and the decompressing device,
it was assumed that an irreversible, isenthalpic throttling transformation with
a change in concentration of a refrigerant without external work proceeds in
subsystem - Ωrk but is impacted by the compressor pumping. The subsystem
structure in Fig. 3.8 includes one internal area with the hypothetical system
areas of the changes in thermodynamics and refrigerant flow. These areasare coupled energetically by means of an internal work flow transformed into
the heat of internal friction. Within the system, subsystem Ωrk is coupled
substantially and energetically to the subsystems of Ωrg and Ωpa. There is no
coupling to the environment.3.4. Analysis of Purposive FactorsCompressor subsystem - Ωsp
The compressor subsystem in energy conversion is to generate refriger-
ant mass flow and a correct compression degree. These values depend on
displacement, compressor damaging volume, the index for compression anddecompression polytrophy of a residual refrigerant and rotational velocity.
A set of purposive factors describes the formal relationship as in (3.21) and
factor relationships are given in Fig. 3.9.
Acsp = mc, ppa, psk,∆p1,∆p2, Tot, n, Vs, ε, zs, zr (3.21)

42 3. Modelling the Object of Study
Vs
Dp2
n
l
Vsz Tot
mc
PS
T T1 2T
pSK
pPA
Fundamental factors
zr
.
e
Nnap
zz
Dp1
Figure 3.9. Links between the fundamental factors which have an impact on powerprocessing in the compressor subsystem
Condenser subsystem - Ωsk and evaporator subsystem - Ωpa
The condenser and evaporator subsystems are membrane heat exchangers
for the heat transfer between the refrigerant and the media washing the
exchangers from the environment. Heat flows in the condenser into the
mc
mpz
dSK
Fundamental factors
Ambient medium
FSK
xSK
rSK
uSK
upz
TSKpSK
QSK
Tot
.
.
.h
Figure 3.10. Critical purposive factors that have an impact on energy conversionduring the heat transfer in the condenser subsystem
ambient air when there is a change in the degree of refrigerant vapour dryness,
i.e. (1 → xsk → 0). In the evaporator, heat flows from a refrigerated area,
which changes the degree of refrigerant vapour dryness, i.e. (0 → xpa → 1).
Thus, the energy transformation in both subsystems is related to heat transfer
and a change in a state of matter.

3.4. Analysis of Purposive Factors 43
mcFundamental factors
.
.
huPAFPA
TK
TPA
mK
VK
uKpPA
Qo
rPA
dPA
xp
Coldroom
Ambientmedium
.
Figure 3.11. Critical purposive factors that have an impact on energy conversionduring the heat transfer in the evaporator subsystem
The sets of purposive factors describe formal relations:
Acsk =
mc, mpz, psk, Fsk, dhsk, usk, upz, rsk, Tot
(3.22)
Acpa =
mc, mk, ppa, Fpa, dhpa, upa, uk, rpa, Tk, Vk
(3.23)
The relations between the factors for both subsystems are depicted in Figs. 3.10
and 3.11.
Regenerator subsystem - Ωre and decompressing device - Ωrk
A regenerator subsystem is a membrane heat exchanger where a refrig-
erant flows at the both sides of the membrane, though under varied thermal
conditions, i.e. heating. As a result of energy conversion and simultaneousheat transfer, the fluid is subcooled at one side of the membrane at the expense
of superheating the vapour that evaporates from the evaporator at the other
side of the membrane. This depends on the factors which determine the heat
transfer with no change in states of matter.
The set of purposive factors in (3.24) describes the formal relationship and
the relations between the factors are given in Fig. 3.12.
Acre =
mc, dhc , d
hp , uc, up, cpp, cpc, Fre,∆Tc,∆Tp
(3.24)
The decompressing device subsystem in this system model is to decompress
the refrigerant at the required degree of decompression and to guarantee good
mass flow rate. If a capillary tube satisfies these requirements, isenthalpic
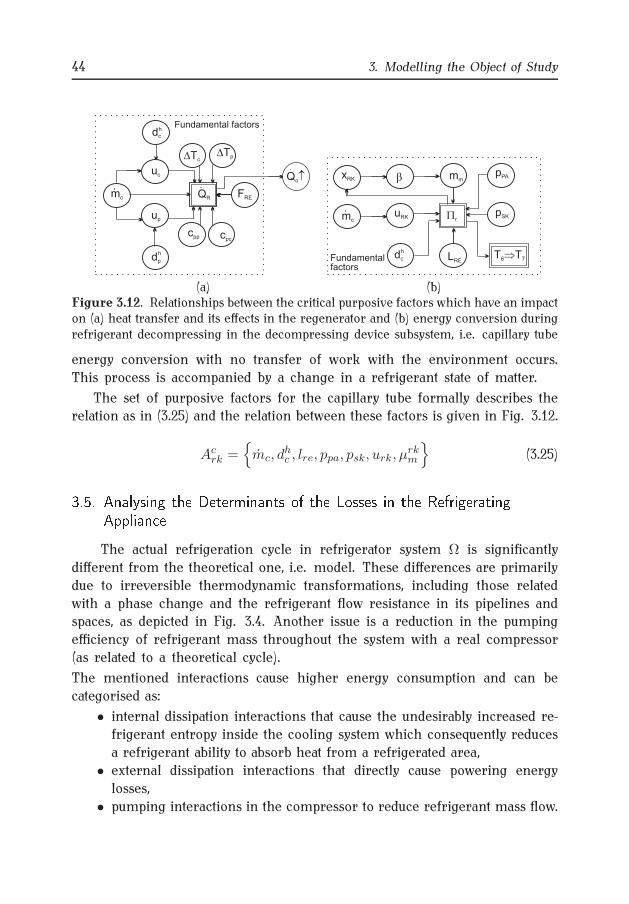
44 3. Modelling the Object of Study
QR FRE
cpccpp
dc
dp
up
uc
mc
DTpDTc
Fundamental factors
Qo..
.
h
h
T T6 7T
pPA
pSKmc
bxRK
uRK Pr
LREdcFundamental
factors
mm
.
h
(a) (b)Figure 3.12. Relationships between the critical purposive factors which have an impacton (a) heat transfer and its effects in the regenerator and (b) energy conversion duringrefrigerant decompressing in the decompressing device subsystem, i.e. capillary tube
energy conversion with no transfer of work with the environment occurs.
This process is accompanied by a change in a refrigerant state of matter.
The set of purposive factors for the capillary tube formally describes therelation as in (3.25) and the relation between these factors is given in Fig. 3.12.
Acrk =
mc, dhc , lre, ppa, psk, urk, µ
rkm
(3.25)3.5. Analysing the Determinants of the Losses in the RefrigeratingApplianceThe actual refrigeration cycle in refrigerator system Ω is significantly
different from the theoretical one, i.e. model. These differences are primarily
due to irreversible thermodynamic transformations, including those related
with a phase change and the refrigerant flow resistance in its pipelines andspaces, as depicted in Fig. 3.4. Another issue is a reduction in the pumping
efficiency of refrigerant mass throughout the system with a real compressor
(as related to a theoretical cycle).
The mentioned interactions cause higher energy consumption and can be
categorised as:
• internal dissipation interactions that cause the undesirably increased re-
frigerant entropy inside the cooling system which consequently reduces
a refrigerant ability to absorb heat from a refrigerated area,
• external dissipation interactions that directly cause powering energy
losses,
• pumping interactions in the compressor to reduce refrigerant mass flow.
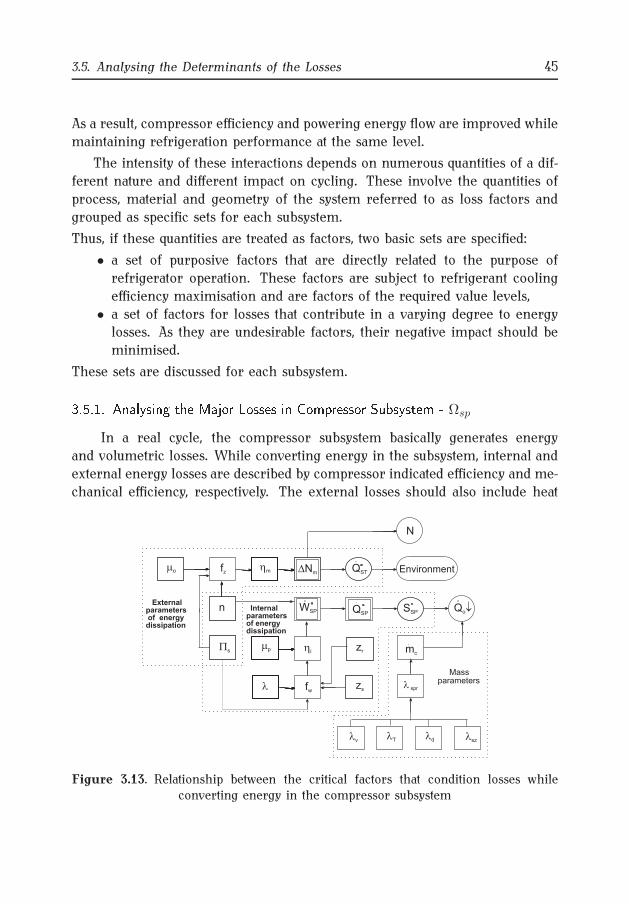
3.5. Analysing the Determinants of the Losses 45
As a result, compressor efficiency and powering energy flow are improved while
maintaining refrigeration performance at the same level.
The intensity of these interactions depends on numerous quantities of a dif-
ferent nature and different impact on cycling. These involve the quantities of
process, material and geometry of the system referred to as loss factors and
grouped as specific sets for each subsystem.
Thus, if these quantities are treated as factors, two basic sets are specified:
• a set of purposive factors that are directly related to the purpose of
refrigerator operation. These factors are subject to refrigerant cooling
efficiency maximisation and are factors of the required value levels,
• a set of factors for losses that contribute in a varying degree to energylosses. As they are undesirable factors, their negative impact should be
minimised.
These sets are discussed for each subsystem.3.5.1. Analysing the Major Losses in Compressor Subsystem - Ωsp
In a real cycle, the compressor subsystem basically generates energy
and volumetric losses. While converting energy in the subsystem, internal and
external energy losses are described by compressor indicated efficiency and me-
chanical efficiency, respectively. The external losses should also include heat
hm DNm
N
mo
WSP
QST
QSPSSP QoZ
hiPs
n
mp
l
mc
l
lvlT ld lsz
Environmentfz
* *
*
*
zs
Internalparametersof energydissipation
Massparameters
fw
.
.
..
.
zr
spr
Externalparametersof energydissipation
Figure 3.13. Relationship between the critical factors that condition losses whileconverting energy in the compressor subsystem

46 3. Modelling the Object of Study
flow absorbed by the environment at the second phase of refrigerant compres-
sion. Mass losses in the reciprocating compressor subsystem are measured by
a coefficient of performance, i.e. pumping. Mass losses indirectly contribute
to an increase in powering energy consumption. The formulae in (3.26)-(3.29)
define the set of the factors conditioning losses in the compressor subsystem.The relationship between these factors is presented in the diagram in Fig. 3.13.
Acsp = Asw
sp ∪Aszsp ∪A
smsp (3.26)
Aswsp = f(λspr,Πs, n, zs, zr, mc,∆p1,∆p2, µp) (3.27)
Aszsp = f(Πs, µo, n) (3.28)
Asmsp = f(Πs, ε, Tspr, Tot,∆p1,∆p2, µp) (3.29)3.5.2. Analysing the Major Losses in Condenser Subsystem - Ωsk and EvaporatorSubsystem - Ωpa
The energy conversion in the condenser and evaporator subsystems is
accompanied by internal losses due to internal and external friction that occurs at
the walls (for two-phase mixture flow) and the irreversibility of thermodynamic
phase transitions. Also, there are external losses due to heat transfer at finite
temperature differences between a refrigerant and heat sources. As defined
in cooling thermodynamics, there may occur external losses in the evaporator
due to the heat generated by the stirrer placed in the cooled area, whereas the
energy consumed to power the washing air blower can be regarded as external
losses in the condenser.
The dependencies in (3.30)-(3.32) refer to the set of the factors that con-dition these losses, whereas the diagrams in Figs. 3.14, 3.15, illustrate their
relationships. These losses can reduce cooling efficiency and increase demand
for driving power. Besides, a stirrer that generates additional losses may be
installed in the evaporator cooling chamber.
Aswsk = f(lsk, d
hsk, mc, µ
skcp , usk) (3.30)
Aswpa = f(lpa, d
hpa, mc, µ
pacp , upa) (3.31)
Aszpa = f(Vk, mk, µk, uk)[2mm] (3.32)
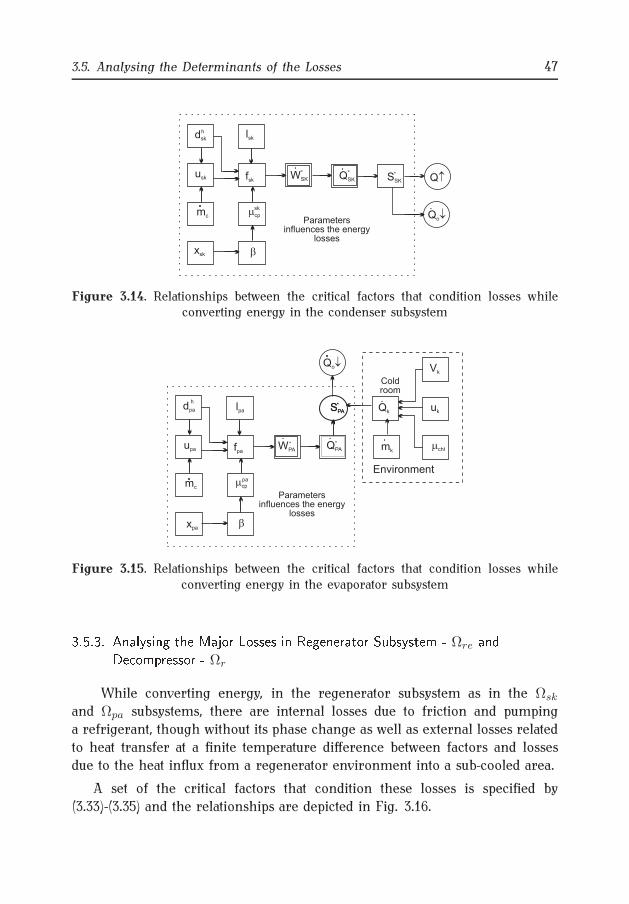
3.5. Analysing the Determinants of the Losses 47
b
mc
dsk
*
Parametersinfluences the energy
losses
fsk SSK
mcp
QSKusk WSK
xsk
**
lsk
Q
QoZ.
.
.
..
h
sk
Figure 3.14. Relationships between the critical factors that condition losses whileconverting energy in the condenser subsystem
mcp
Qk
WPA QPA
SPASPA
mkupa
uk
b
mc
mchł
xpa
lpadpa
Vk
**
**
QoZ
Coldroom
Parametersinfluences the energy
losses
fpa
Environment
.
.
.
.
. .
h
pa
Figure 3.15. Relationships between the critical factors that condition losses whileconverting energy in the evaporator subsystem3.5.3. Analysing the Major Losses in Regenerator Subsystem - Ωre andDecompressor - Ωr
While converting energy, in the regenerator subsystem as in the Ωsk
and Ωpa subsystems, there are internal losses due to friction and pumping
a refrigerant, though without its phase change as well as external losses related
to heat transfer at a finite temperature difference between factors and losses
due to the heat influx from a regenerator environment into a sub-cooled area.
A set of the critical factors that condition these losses is specified by
(3.33)-(3.35) and the relationships are depicted in Fig. 3.16.
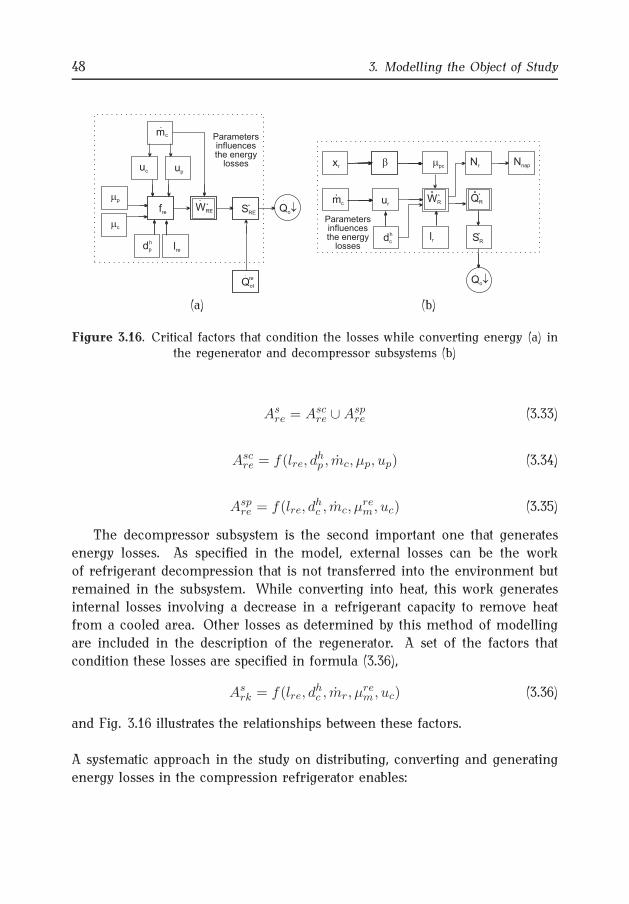
48 3. Modelling the Object of Study
WRE SRE
Qot
QoZ
lredp
upuc
cm
mc
mp
*
re
*
Parametersinfluencesthe energy
losses
fre
. .
.
.
h
m urWR
Nr
QR
Nnap
SRlr
mpcb
dc
xr
c
*
**
QoZ.
...
h
Parametersinfluencesthe energy
losses
(a) (b)
Figure 3.16. Critical factors that condition the losses while converting energy (a) inthe regenerator and decompressor subsystems (b)
Asre = Asc
re ∪Aspre (3.33)
Ascre = f(lre, d
hp , mc, µp, up) (3.34)
Aspre = f(lre, d
hc , mc, µ
rem , uc) (3.35)
The decompressor subsystem is the second important one that generates
energy losses. As specified in the model, external losses can be the work
of refrigerant decompression that is not transferred into the environment but
remained in the subsystem. While converting into heat, this work generatesinternal losses involving a decrease in a refrigerant capacity to remove heat
from a cooled area. Other losses as determined by this method of modelling
are included in the description of the regenerator. A set of the factors that
condition these losses are specified in formula (3.36),
Asrk = f(lre, d
hc , mr, µ
rem , uc) (3.36)
and Fig. 3.16 illustrates the relationships between these factors.
A systematic approach in the study on distributing, converting and generating
energy losses in the compression refrigerator enables:

3.5. Analysing the Determinants of the Losses 49
• rational analytical decoupling a device structure into subsystems and
objects consistent in terms of phenomena that occur there, as well as
distinguishing and unambiguously defining an environment of a device,
• decoupling all interpenetrating thermodynamic, flow and thermal pro-
cesses,• systematising the interactions that occur within the system and between
the system and the environment.
A set of the critical factors that condition energy losses, both internal and
external, for each refrigerator subsystem was determined by means of the
analysis of energy losses using the refrigerator systemic model.

4. Methodology of the Experimental Studies4.1. Refrigerator Design, Operational and Maintenance PropertiesToday’s vapour compression refrigerators, especially of low and medium
power are commonly used and thus their energy consumption is quite high. The
possibility to use the refrigerating appliance in agriculture, including those for
milk cooling, is particularly important. Poland as a member of the European
Union needs to ensure that Polish food products satisfy high standards of
quality. Therefore, more attention should be paid to improve energy conversion
in these devices by improving their primary and secondary processes, designs,
and maintenance. All these aspects have influenced the choice of an object
to test, i.e. an appliance classified as a milk refrigerator with an immersionevaporator, and the methods of its analysis.
The test device was the IC/P 253 refrigerating appliance with an immersion
evaporator manufactured by ALFA LAVAL. The device is dedicated to cool
a certain quantity of liquid such as milk ∼ 100l/h when its temperature
was decreased continuously and monotonically between two certain levels of
temperature, e.g. 35oC÷4oC for milk. The basic technical data of this appliance
are given in Table 4.1 whereas its schematic, including its all subsystems
are shown in Fig. 4.1. The characteristic of refrigerant flow cross-sections are
marked with digits in the diagram.
Table 4.1. Basic technical data of Alfa Laval IC/P 253Rated output 0.7 kWAverage cooling capacity 3328WAmount of cooled milk (cooling from 35oCto 4oC at the ambient temperature of 25oC 250/150 l/minAmount of milk cooled per hour 100 lCooling temperatures set 4o C or 10o CFan efficiency 2200m3/hCondenser efficiency 4.1 kW
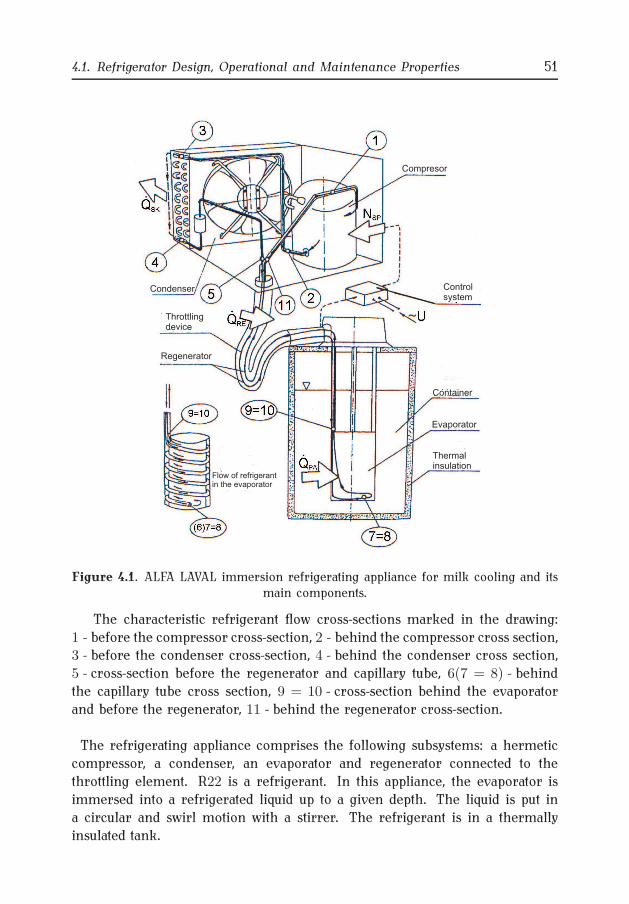
4.1. Refrigerator Design, Operational and Maintenance Properties 51
Compresor
Thermalinsulation
Evaporator
Flow of refrigerantin the evaporator
Container
Regenerator
Throttlingdevice
Condenser Controlsystem
Figure 4.1. ALFA LAVAL immersion refrigerating appliance for milk cooling and itsmain components.
The characteristic refrigerant flow cross-sections marked in the drawing:
1 - before the compressor cross-section, 2 - behind the compressor cross section,3 - before the condenser cross-section, 4 - behind the condenser cross section,
5 - cross-section before the regenerator and capillary tube, 6(7 = 8) - behind
the capillary tube cross section, 9 = 10 - cross-section behind the evaporator
and before the regenerator, 11 - behind the regenerator cross-section.
The refrigerating appliance comprises the following subsystems: a hermetic
compressor, a condenser, an evaporator and regenerator connected to the
throttling element. R22 is a refrigerant. In this appliance, the evaporator is
immersed into a refrigerated liquid up to a given depth. The liquid is put in
a circular and swirl motion with a stirrer. The refrigerant is in a thermally
insulated tank.

52 4. Methodology of the Experimental Studies
Figure 4.1 shows the immersion evaporator construction. The refriger-
ant reaches the evaporator as wet vapour of low-degree dryness. Inside the
evaporator, the refrigerant flows along the coil to the end of a coat and then
returns as a counter flow between coils of the coil to reach the outlet in the
direction of the compressor. The compressor and condenser are connectedwith the evaporator with a flexible piping (the other pipes in the system are
rigid and made of copper). The pipe that joins the condenser and the evaporator
functions as a throttling element, i.e. capillary tube and the area to subcool the
refrigerant, and the pipe that surrounds it and links the compressor functions
as an area to overheat regenerator vapour. Hence, a refrigerant is subcooled
before it enters the evaporator by overheating refrigerant vapour as it flows
between the evaporator and the compressor. The appliance uses a typical
hermetic single-stage refrigeration compressor of a 0.7 kW efficiency. The
compressor and its electric engine to drive it directly are both sealed inside
the welded sheet steel cover. The electric engine shaft is upright. The stator
is suspended by three springs. The compressor is lubricated using centrifugal
forces which make oil reach all points that need lubrication through horizontalsnap rings. This place, through accurately set channels, is reached by new
oil from the bowl at the bottom of the cover. Lubrication is plentiful because
oil also cools the compressor and the engine. The lamellar condenser as an
element of the appliance is cooled by air flow forced with a fan. This condenser
is made of the coil with embedded ribs (lamellas). To achieve good thermal
conductivity, the coil and ribs are made of copper and aluminium, respectively.
The course of liquid (milk) cooling rate is controlled with an electronic device
which cooperates with thermometers controlling the changes in temperature
levels in the condenser and evaporator areas of the cooled liquid.4.2. Process of Tank Liquid CoolingA typical feature of cooling a liquid in the considered appliance is a contin-
uous, monotonic decrease in its temperature. Refrigeration proceeds in a tank
where the liquid flows in a turbulent and circular manner around the evaporator
due to a stirrer movement. This brings about certain conditions for heat transfer
between the liquid and the evaporator cover. These conditions are established
by the specific refrigerant flow inside the evaporator as specified in Fig. 4.1
and under the influence of intensive phase transitions. The sequence of the
following flows can be distinguished in the evaporator internal structure, at the
intake of the liquid:
4.2. Process of Tank Liquid Cooling 53
• a single-phase liquid flow with a small amount of vapour,
• a two-phase follicular liquid flow with a predominance of a liquid phase,
• a two-phase cork liquid flow with a predominance of a gaseous phase,
• a core flow, i.e. the flow of wet vapour with wall liquid phases.
Due to the intensity of heat transfer, the evaporator structure should be divided
into three distinctive areas:
• an initial area where boiling is initiated,
• a boiling area where violent boiling, i.e. follicular and cork flows leads to
an intensive dissipation of heat by vapour bubbles arising at the evaporatorinternal walls,
• an area of convective evaporation, i.e. core flow where heat transfer
proceeds mainly by evaporating wall liquid phases out of vapour core flux
from the separating surfaces.
When the liquid is cooled and heat dissipates, refrigerant evaporation tempera-
ture is continuously reduced, and the discrepancy between these two tempera-
tures simultaneously decreases. The result is a variable heat flux emitted from
the liquid cooled. With decreasing the temperature, refrigerator efficiency de-creases, and temperatures asymptotically tend to reach the values determined.
The most important issue for the process is the time after which the final
temperature is obtained.
The static model as in [64] employs average values under certain assumptions:
• energy accumulation occurs only in a cooled liquid and its state is de-
termined by average temperature T,
• any heat gains from the environment are ignored,• a control system provides constant condensing temperature Tsk• coefficient Ko = (kF )o for the evaporator is constant,
• cooling efficiency for a compressor of a V displacement is calculated
from the equation:
Q = V · ψ (Tpa) (4.1)
where : ψ is a function of evaporation temperature of Tpa, J/m3
A model of object statics allows us to determine an average flux received fromthe liquid:
Qsr =M (Tck1 − Tck2)
∆τ(4.2)
where: M = mckcck is cooled liquid heat capacity,

54 4. Methodology of the Experimental Studies
and compressor capacity can be calculated from Eq. (4.1):
Vsr =Qsr
ψ (Tsr)(4.3)
where an average temperature is:
Tsr =Tck1 + Tck2
2−Qsr
Ko. (4.4)
The solution of the equations (4.2 – 4.4) with respect to Vs can be written as
a function:
Vs = f1(M,Ko,∆τ, Tck1, Tck2, ψ) (4.5)
The specific solution depends on the assumed form of function ψ. As in [64],
it can be assumed that an accurate approximation of ψ is a quadratic function:
ψ = a0 + a1Tsr + a2T2sr (4.6)
Substituting function (4.6) into (4.3), the following solution is received:
Vsr =mckcck (Tck1 − Tck2)
τo
[
a0 + a1 (Tsr1 − Tsr2) + a2 (Tsr1 − Tsr2)2] (4.7)
where:
Tsr1 = (Tck1 + Tck2)/2Tsr2 = mck · cck · (Tck1 − Tck2)/(τo ·Ko)
With the same assumptions, a model of refrigerator dynamics can be rep-
resented by the following set of equations [64]:
MdT
dτ= −Ko (T − Tpa) (4.8)
VD ψ (Tpa) = Ko (T − Tpa) (4.9)
and initial conditions: τ = 0 T = Tck1τ = ∆τ T = Tck2

4.2. Process of Tank Liquid Cooling 55
Liquid cooling time can be calculated from equation (4.8) after the variables
separation and then integration:
∆τ =M
Ko
∫ Tck2
Tck1
dT
Tpa − T(4.10)
where:
Tpa = ϕ (T,Ko, VD) (4.11)
is a solution as the functional equation (4.9) relative to To.Equation (4.10) can be used to determine the required compressor displacement.
The overall dependence is similar as in Eq. (4.5):
VD = f2(M,Ko,∆τ, Tck1, Tck2, ψ) (4.12)
Its solution depends on the assumed form of function ψ. Accepting a quadratic
function, as in the static model, the analytical equation of liquid cooling time
is as follows:
∆τ =M
Kolna0 + a1T01 + a2(T01)
2
a0 + a1T02 + a2(T02)2+ (4.13)
+2M
VD√
4a0a2 − (a1)2arctg
a2(T02 − T01)√
4a0a2 − (a1)2
2(a2)2T01T02 + a1a2(T01 + T02) + 2a0a2
where:
T0i =
√
(VD a1 +Ko)2 − 4VD a2(VD a0 −KoTi)− (VD a1 +Ko)
2VD a2(4.14)
i = 1, 2 . . .
Considering the processes of tank liquid cooling under the assumptions as below,
a thermal balance equation can be set up to accurately describe any changes in fluid
temperatures during cooling until the liquid reaches the required temperature.
The heat balance equation is set up in accordance with the diagram in Fig. 4.2.
The assumptions are as follows:
• liquid temperature Tck is evenly distributed in mass apart from evaporator
and tank wall layers, which is justified by significantly turbulent flow,
• the conditions for the heat transfer from the liquid to the refrigerant and
from the environment to the liquid are determined by average coefficients
of heat penetration of uniform distributions on heat transfer surfaces,
• the evaporator is fully immersed in milk and the tank is not insulated.

56 4. Methodology of the Experimental Studies
Cooledliquid
EnvironmentEvaporator
Air abovea liquidsurface
Stirrer
N =N (n )m m m
T ( )=constpa t T ( )=constOT t
T =constpo
dTck
dt <0
dTpo
dt <0
DQck
.T ( )=constck t
N
QOT
QPO
QPR
..
.
Figure 4.2. The energy flow balance structure for an area with a cooled liquid
The energy balance equation becomes as:
mck · cckdTckdτ
+ Fp · kp [Tck (τ)− Tpa] = Nm (4.15)
+Fzkz [Tot − Tck (τ)] + Fpo · αpo [Tpo (τ)− Tck (τ)]
where:
Fp - evaporator surface washes by the liquid; m2,
Fz- surface tank washed by the liquid; m2,
Fpo - area of the liquid-air contact inside the tank; m2,
αpo - coefficient of the heat absorption from the air inside the tank to the liquid;
W/(m2 ·K),kp = 1/(1/αPC +1/αPM ) – coefficient of the heat transfer between the liquid
and the refrigerant; W/(m2 ·K),kz = 1/(1/αZO + 1/
∑ δiλi
+ 1/αZM ) - coefficient of heat transfer from the
environment into the tank inside filled with the liquid; W/(m2 ·K).
Table 4.2. Dimensionless relationships covered by the energy equation and theirquantities
Dimensionless quantity Formula for the dimensionless Variation rangequantity
Liquid dimensionless Θ = (Tck − Tpa)/∆Tmax Θk ≤ Θ ≤ 1temperatures 0 < Θk < 1
ΘT0 = (Tot − Tpa)/∆Tmax 1 < Θto < 1.2ΘPO = (Tpo − Tck)/∆Tmax Θpo < 1
Dimensionless time τo = τ/τk 0 ≤ τo ≤ 1Process time constant βm = mck · cck/(Fp · kp + Fz · kz)

4.2. Process of Tank Liquid Cooling 57
In the first approximation, it was assumed that
∆Tpo (τ) = Tpo (τ)− Tck (τ) ∼= const
Then equation (4.15) is transformed into the dimensionless form after introducing
the dimensionless relationships given in Table 4.2 and the dimensionless modules
to specify the intensity of a thermal impact as of:
ΦPZ =Fz · kzFp · kp
(4.16)
ΦM =Nm
∆Tmax · Fp · kp(4.17)
ΦPO =Fpo · αo
Fp · kp(4.18)
where:
∆Tmax = (Tmmax − Tpa)
Having regarded the relationships in (4.16) - (4.18) and the dependencies in
Table 4.2, balance equation (4.15) is developed in a dimensionless form suitable
for solving and further analysing:
βmτk
·dΘ
dτo+Θ = Cpz (4.19)
under an initial condition:
for
τo = 0 , Θ = 1 (4.20)
where:
CPZ =ΦM
1 + ΦPZ
+ΦPZ
1 + ΦPZ
·ΘTO +ΦPO
1 + ΦPZ
·ΘPO (4.21)
Equation (4.19) is a heterogeneous differential equation of a first stage with
constant coefficients.
Overall integral of equation (4.19) is as follows:
Θ(τo) = Ω · eτkβm
·τo + CPZ (4.22)

58 4. Methodology of the Experimental Studies
Having used condition (4.20) and determining the differential constant, a par-
ticular integral was obtained as a function:
Θ(τo) = (1− CPZ) · eτkβm
·τo +CPZ (4.23)
and function (4.23) describes a change in a dimensionless liquid temperature
difference during cooling.
Function (4.23) can be used to initially determine the required quantity of
constant βm.
Having used the concept of the final condition as:
for τo = 1 is Θ = Θk ,
the dependence that describes the "required quantity" of process time constant
βm was obtained as:
β∗m = 1/(ln1− CPZ
Θ−CPZ) · τk . (4.24)
At the same time the analysis of relationship (4.23) indicates the dependence
of temperature changes during liquid cooling on two sets of factors.
The first set, i.e. ACPA involves the factors whose values are deliberately
calculated to complete the desired cooling of a certain amount of liquid in terms
of the time and speed of temperature reduction. This set is formally described
by formulae (4.25) - (4.28) and shown in the diagram in Fig.4.3a.
ACPA = AC
G ∪ACP ∪AC
WF (4.25)
where:
ACG = f(dhpa,Dzw,Dpw,H, lp) (4.26)
ACP = f(nm, mc, mm, ppa, wm, wpa, xpa, β) (4.27)
ACWF = f(rpa, ρ
′
pa, ρ”pa, η
′
pa, η”pa, λ
′
pa, λm, ρm, cm, ηm) (4.28)
Constant βm that specifies cooling rate defines the impact of these factors
in Eq. (4.23)
Second set ASEN involves the undesirable factors that generate energy losses.

4.2. Process of Tank Liquid Cooling 59
? ?T T
dT
d
m m
m
?
?
?
?0
Fpmc
.
mm
.
H
nm wm
Dzw
am
Dpw
Dpz
cm
hm
lmTparpa
xpa
ppa
b
apa
rparpa
"
'
lpa
"
"'
'
hpa
hpa
wpa
wpa
wpa
dpa
hI
lst
dst
mc
.Tpa
xpa
Tsk
*SWR *SWS
*SZR
*SZM
*SZS
*SZZ
External losses
Internal losses
s
kspr
Pr Ps
lspr
lm
lr
dm
nm
hm
hs
hm
wm
Dzw
mm
.
cm
aot
azm
ns
H
DTot
a)
b)
Figure 4.3. Liquid cooling (a) the relationships between the critical factors thatinfluence the processes of energy conversion in liquid cooling (b) the relationshipsbetween the critical factors that condition energy losses while converting energy during
cooling the liquid
This set is formally defined by formulas (4.29) - (4.32), and the relationships
there are given in the diagram in Fig. 4.3b.
ASEN = AS
G ∪ASP ∪AS
WF (4.29)
ASG = f(dr, lr, dm,Dzw,H, δst) (4.30)
ASP = f(Πs,Πr, x, s, nm, ns, mc, mm, Tpa, Tsk,∆Tot, kspr, λspr, ηm, ηs) (4.31)
ASWF = f(rc, ρ
′
c, ρ”c , η
′
c, η”c , λst, λm, cm, ηm) (4.32)

60 4. Methodology of the Experimental Studies
The impact of the ASEN set of factors is reflected in equation (4.23) by modules:
ΦPZ – the thermal resistance of heat transfer from the environment by the
tank outer wall to the liquid,
ΦPO – the thermal resistance of heat absorption from the air above a liquid
surface,ΦM – the dissipation of liquid mixing energy.
bm k p
ilość iteracji ilość iteracji
2100
3000
2700
2400
200
275
250
225
5 510 1015 1520 20
bm
,pz
,C
pz0Cbm0*
pz(C )bmi*
b = bmim*
b = bm0m*
mpik ( )b ppziC (k )
p
,k
a)
b) c)
number of iterations number of iterations
Figure 4.4. Itinerary calculations βm
Process time constant βm corresponding to a certain amount of cooled liquid
in the desired time at the temperature ranging from 35oC to 4oC , as specifiedin Fig. 4.4, is determined after a certain number of iterations by specifying β∗maccording to dependence (4.24) and comparing it with value βm calculated from
formula (4.2). This procedure also allows for determining the required quantity
of the coefficient of the heat transfer between the liquid and refrigerant kp as
in Fig. 4.5. The graphs show a change in the coefficients of: heat transfer
between the liquid and refrigerant kp and heat transfer between the liquid
and evaporator αPM and the graphs with changes in quantities: βm and Cpz
determined from the formulae given, depending on stirrer rotational speed nm.

4.3. Analysing the Major Factors for Energy. . . 61
The graphs in Fig.4.6 show the changes in: liquid cooling rates dΘdτ0
in time τ0,graphs a and b, and liquid temperatures Tm in cooling time τ , graph c.
275
270
265
260
255
600 600600800 8008001000 100010001200 12001200n (rpm) n (rpm)n (rpm)
0.042
0.040
0.038
0.036
Cpz
2700
2750
2800
2850
bm(s)
freon R22- - apm
___
freon R22uninsulated tankcooling time - 3 h
freon R22uninsulated tankcooling time - 3 h
aPM
230
235
240
245
250
kp
kp
a) b) c)
aPM
Figure 4.5. Heat transfer coefficient kp, heat absorption coefficient αPM , βm and Cpz
vs. stirrer rotational speed
0.00.0
294
287
280
2.0
-2.0
-3.0
0.0
0.20.2
0.2
0.4
0.4
0.4 0.6 0.6
0.6
0.8
0.80.8
301
1.0
-4.0
-1.0
0.0
freon R22n =1200 rpmm
freon R22n =1200 rpmm
freon R22n =1200 rpmm
dQdt Q Tm
t0 t0t0
(K)
(h)
a) b) c)
Figure 4.6. Changes in liquid cooling rate dΘdτ0
(a), dimensionless cooling time τ0 (b),
and dependence of liquid temperature change Tm and cooling time τ (c)4.3. Analysing the Major Factors for Energy Losses in a Real RefrigeratorRegardless of a refrigerant used, the energy losses in the refrigerating
appliance under study result from:
• internal interactions related to irreversible thermodynamic and flow trans-
formations that lead to the undesirable increase in the entropy inside
the refrigerator system and thus decreasing refrigerant ability to absorb
heat from the refrigerated area,
• external interactions which include efficiency of converting electrical
energy into mechanical energy which is directly supplied into the refrig-
erant on a compressor piston crown surface, unproductive refrigerant
decompression in the decompressor, a finite value of thermal resistance
of liquid tank insulation, and converting the energy supplied by a stirrer
into heat.

62 4. Methodology of the Experimental Studies
The further part of this work discusses the most fundamental losses due
to external interactions, i.e. losses due to converting electric energy into
mechanical energy that is directly supplied to the refrigerant, losses due to
decompression work non-recovery, losses due to failed tank thermal insulation
and the conversion of mixing energy into heat in the refrigerated substance.Fig. 4.7 shows schematically distribution of the sources of those losses. The
formulae above refer to the average values of energy losses when liquid portion
τ is cooled.
Regenerator
Evaporator
Compresor
Condenser
3 4
(6)7=8
5a
9=10
5 111 2
Sourceof power
Controlblock
Ambientconditions
Cold space
zst
SZM
SZ =LR R
SWS
SWR
SWP
SZS
SZPO
SW = QR D
SZZ
.
.
Compressionspace
Compressionsystem
Motor
..
...
Q.
Q.
PO
Q.
Z
Q.
O
Nm
New
N Nesi
Nem
Q.
R
NsDNmD
NiD
SWQ0
.SWQ
.
SWS
SZW
Figure 4.7. The system of refrigerator devices and the refrigerated liquid tank withmajor sources of losses
The formulae which determine the most fundamental energy losses include:
– internal losses
The losses due to the irreversibility of refrigerant compression related to the
cylinder inside:
SWs = Nm (1− ηi) (4.33)
where:
ηi = λvλdλTλnNtt
Ni(4.34)
Ntt =k
k − 1p1V1
[
Πk−1
ks − 1
]
(4.35)
4.3. Analysing the Major Factors for Energy. . . 63
losses due to the irreversibility of refrigerant decompression in the decompressor
SWr = mcTpa (x5 − x5c) [s,, (Tpa)− s, (Tpa)] (4.36)
losses of indicated power
SWni = ∆Ni = Ni (1− ηi) (4.37)
– external losses
Loss due to converting electric energy in the compressor
SZs = (1− ηm) ηsNes (4.38)
losses due to work of decompression in the decompressor
SZr = mc (i5 − i5c) (4.39)
losses of heat reaching the liquid due to thermal insulation
SZz = Fzkz (Tc − Tot) (4.40)
losses due to converting energy of mixing into heat
SZM = Nm (4.41)
losses of heat reaching the tank air
SZpo = Qpo = Fpoαpo (Tpo − Tc) (4.42)
losses of engine power
SZmn = ∆Nm = Ns (1− ηm) (4.43)
losses of electrical power supplied to the engine
SZns = ∆Ns = Nel (1− ηs) (4.44)

64 4. Methodology of the Experimental Studies4.4. Experimental Set-up and Measurement NodesHaving analysed the research problem discussed in works [24], [25], tem-
perature and pressure were measured at the points of this refrigerator, as shown
in Fig. 4.8. As measurement points for pressure and temperature were specified,
it was necessary to design measurement heads so that the sensors could be
accurately placed in the area of a refrigerant flow.
The sensors should be installed to be mechanically strong and make the
system completely hermetic. Due to the structure of a refrigerant flow in this
appliance, i.e. flow along a single pipe or a double concentric pipe, two types
of heads needed to be designed, as in Fig. 4.9.
While installing the thermometer, it was important to treat it as a source of
disturbance to the existing temperature field and that these disturbances should
be as small as possible. At the same time, it was necessary to guarantee the
conditions that the temperature of a thermometric body could be as close as
possible to the temperature of the appliance studied.
Evaporator
Thermometer
Refrigeratorthermometer
Controlsystem
Nel
Nel
Regenerator
Condenser
Compressor
W
A
W
4
7 6
5
1 2 3
T
m.
m.
m.
Figure 4.8. Schematic of the refrigerator studied with the selected measurementpoints corresponding to the control cross-sections of a refrigerant flow
1 - cross-section at the compressor input, 2 - cross-sectionat the compressor output,
3 - cross-section in front of the condenser, 4 - cross-section behind the condenser,
5 - cross-section behind the capillary tube, 6 - cross-section before the evaporator,
7 - cross-section behind the evaporator

4.4. Experimental Set-up and Measurement Nodes 65
Pressure sensor
thermocouple
Pressure- variable y
6
6
7
7
Pressure 6 - variable y
thermocouple
Pressure sensor
Pressure 7- variable y
temperature- variable x
temperature- variable x
temperature - variable x
Figure 4.9. Schematic of the heads to measure temperature and pressure: a) in a singlepipe, b) in a double concentric pipe
Figures 4.10 and 4.11 show the refrigeration unit with the measurement heads
mounted on individual pipes and a double concentric pipe, respectively.
compressor
Pressure sensor 1
thermocouple 3
condenser
cooling fan
Pressure sensor 5
Pressure sensor 4
Pressure sensor 3
thermocouple 1
thermocouple 4thermocouple 5
Figure 4.10. Cooling unit with sensors
The heads shown in Figure 4.9a are mounted at points1, 2, 3, 4 and 5 of the cooling
system,seeFig. 4.8. Refrigerantvapourorliquidflowsthroughthecross-sectionthat
corresponds these points as it flows along single copper pipes of internal diameters
ranging4 to10 mm. Suchheadsarecapableofmeasuringrefrigerant temperatures
and pressures through the same cross-section. The head in Fig.4.9b measures tem-
peratures and pressures through the cross-sections of two concentric pipes where

66 4. Methodology of the Experimental Studies
evaporator
sensors 6 and 7
Adiabatictank
Figure 4.11. Immersion evaporator and its adiabatic tank for cooling a liquid
Figure 4.12. General view of the experimental set-up
a refrigerant counter flow occurs. As in Fig. 4.8, the cross-sections correspond to
points 6 and 7, i.e. regenerator input and output points. The refrigerant flows as
a liquid from the regenerator through cross-section 6 towards the evaporator along
acopperpipeofa1.4 mminternaldiameter. Thecapillary tubeis inside thestainless
steel pipe of a15 mm internal diameter alongwhich refrigerant vapour flows in the
opposite direction. To mount the measuring heads on the device, the refrigeration
unitneededtobedepressurisedandFreonwasremovedfromthesystemintobottles

4.4. Experimental Set-up and Measurement Nodes 67
and then the pipes were cut at the measurement cross-sections. There was a risk of
getting the refrigeration installationwet and dirty. That is why, having installed the
measuringheads, thesystemwasdrained,checkedforleak-tightnessofconnections
andtheinstallationmountedundervacuum. Checkingleak-tightnessundervacuum
involves removing the refrigerant from the refrigeration unit with a vacuum pumpuntil nearly absolute vacuum is achieved. If the unit is sealed, vacuum shown by
a manovacuometer should not decrease after 24 hours.
Leak-tightness was tested in terms of:
• air leakage into the system, especially in the areas of refrigerant lower
pressure,• refrigerant leakage from the system into the environment, which is
critical for a higher pressure area above the environment pressure level.
When the pressure in the installation was stabilised at about 2 bar, all the
connections and the places suspected of leakage were inspected with a sensor
which can detect Freon in the air. Figure 4.12 presents the experimental set-up
with the refrigeration unit as well as the measuring apparatus and adiabatic
tank where the evaporator was installed.
Evaporator
Thermometer
Pressuremeasurementand datarecording
Temperaturemeasurementand datarecording
Refrigerator’sthermometer
Controlsystem
Nel
Nel
p T2 2, p T44 ,p T3 3,p T55, p T11,
p T66,p T77,
y p7 7?
y p5 5?
y p6 6?
y p1 1?
y p4 4?
y p3 3?
x T7 7?
x T4 4?
x T5 5?
x T6 6?
y p2 2?
Regenerator
Condenser
Compresor
W
A
W
1
12
2
3
3
4
4
5
5
6
6
7
7
4
7 6
5
1 2 3
xT
11
??
xT
22
?
xT
33
??
Figure 4.13. Schematic of the temperature and pressure measurement tracks
The experimental studies were conducted on a set-up dedicated to collect
data from the selected points in real time. The schematic of the measurement
tracks is depicted in Fig. 4.13. Parameters like temperature, pressure and power
consumption were controlled.

68 4. Methodology of the Experimental Studies
COMPUTER
control/measurementmodule
LC-011-1612
data acquisition card
LC-055-PIO
power supply
AMP-PWS-50AMP-TPR-04
AR 921amplifier for pressure
measurement
AR 402
module
EXT-BNC-16
KA
B-B
NC
-2.0
-2
KAB-K19-BNC-08
analogue cableKAB-EXT-16
KAB-DIG-55
digital cable
signal from the pressure sensors signal from the thermocouples
analoguecable
power supply amplifier for temperaturemeasurement
Figure 4.14. Schematic of the methodology of experimental studies on compressionrefrigerator systems
The system consists of sensors and transducers, an analogue/digital trans-
ducer and a computer as in Fig. 4.14. The sensors and transducers are used to
convert some physical quantities like temperature, pressure, and electrical power
into standard electrical signals easy to transmit at a distance. These signalsare supplied to the inputs of the cards that converts their analogue values
into discrete digital ones. A computer with appropriate software controlled the
measurements, i.e. determined the time between the measurements, selected
the correct measurement track as well as recorded digital values in its memory
and in an appropriate format in its hard drive.

5. Experimental Studies in Transient and Steady-States5.1. Methods of Measuring the Quantities Typical of RefrigeratingAppliance OperationEnergy measurements for the compression refrigerating appliance include
measurements of certain specific quantities to determine energy characteristicsand maintenance/operation coefficients for a refrigerating appliance and its
components [43], [62]. These tests allow assessing whether coefficients defined
and assumed by designers are achieved. Consequently, certain proposals to
improve the way of designing machines and appliances can be formulated. As
specified in [37], the research aims at:
• determining unit cooling power, i.e. total and useful cooling capacity,
• determining thermal loads and assessing operation of apparatus, heat
exchangers, and compressors,
• specifying agent consumption, i.e. water, air, refrigerants,• determining energy consumption by the compressor and auxiliary ma-
chinery,
• determining losses and flow resistance in pipelines, apparatus, and heat
exchangers,
• determining technical and energetic coefficients to describe the operation
of the entire system or individual components.
Any refrigerating appliance is evaluated upon an examination which includes
qualitative measurements of thermodynamic parameters at characteristic points
capable of determining the real cycling in the appliance and quantitative mea-surements capable of determining total and useful cooling efficiency and thermal
loading in each exchanger. In addition, compressor drive effective power should
be measured.
The qualities obtained from the measurements are used to carry out a qual-
itative and quantitative assessment of the entire appliance and its components.
The thermodynamic parameters of a refrigeration cycle measured during the
tests include: the temperature and pressure before and after each element of

70 5. Experimental Studies in Transient and Steady-States
Experimental methods of single-stage refrigerating systems
Measurement of a rate flow Work refrigerator systems valuation
Measurement methods of refrigerating capacity
Direct measurementmethod
Indirect methodby heat balance ofheat exchangers
direct methods Indirect methods
measuring tuberotametersmeasuring vessels
---
Measurement general of refrigerating capacityMeasurement effective of refrigerating capacityMeasurement of capacity usable
---
General heat balanceDetermination of effective
capacityof general capacity by use
of a standard compressor
capacity fromgeneralDetermination
--
-water-cooled condenserevaporator refrigeration liquidsubcooler liquid refrigerantextra heat exchanger instaled in the systemcondenser withevaporator with air forced motion
air forced motion
------
Figure 5.1. Methods applied to study a single-stage refrigerating appliance
the refrigerating appliance, i.e. heat exchanger, apparatus or compressor; thetemperature and pressure of liquids that cool the condenser and subcooler,
i.e. before and after the heat exchangers; and the temperature and pressure of
liquids subcooled in the evaporator, i.e. before and after the heat exchanger.
As specified in standard PN -72/M -04600, measurements of temperature and
pressure to determine a heat flux (efficiency) should be as accurate as to calculate
these quantities with the required accuracy. The temperature measurement ac-
curacy was 0.5 K. The measurements of pressures, especially before and after the
heat exchangers and the compressor, shall be carried out with such an accuracy
to determine saturation temperatures corresponding pressures, with an error
below 0.5 K. Pressure and temperature should be measured in areas showing as
much as possible uniform cross-section stream speed. Any places located beforeor after a flow direction change as well as places where a change in speed or
a type of flow occurs should be avoided. As specified in [37], the pressure and
temperature of compressor suction or pumping need to be measured at the same
measurement cross-section at a straight pipe of an equal diameter, at a distance
of 8 diameters of this pipe but not less than 300 mm from a compressor inlet
or a valve which is its component. Basically, the refrigerant pressure and
temperature at the inlet and outlet of a balanced heat exchanger or device
should be measured at the same cross-section at a distance of 3 diameters
of a pipe from these devices. While measuring temperatures to determine

5.2. Method for Measuring Refrigerant Mass Flow Rate 71
other quantities, it is necessary to be sure that vapour is definitely overheated,
i.e. at least 5÷ 8 K, depending on the type of refrigerant and liquid strongly
undercooled, i.e. at least 3 K. To measure pulsating pressures, an accurately
selected damping device should be applied [43]. Figure 5.1 summarises types
of studies on refrigerating appliances. The choice of a method depends on theappliance selected for research and the purpose of measurements.5.2. Method for Measuring Refrigerant Mass Flow Rate
The flow rate of a refrigerant circulating in the system can be measured
using the method of destroying refrigerator cooling efficiency. It is an indirect
method for measuring mass flow rate with the use of an evaporator heat balance
to cool a liquid. To achieve thermal and heat equilibrium, the following process
should occur:
Qp = Qg = Ng (5.1)
where:
Qp - evaporator cooling efficiency,
Qg - electric heater thermal efficiency,
Ng - electric heater power.
Firstly, the refrigerator should be started, as in Fig. 5.2a. The evaporator
starts absorbing heat from the liquid that fills the tank. Over time the tank
temperature falls from to to tk. Secondly, the electric heater with an electrical
.
m
pQ
.
t
3
2
1
t
to
tk
??
??
.
m
pQ
.
t
3
2
1
4
gg QN.
?
????
tr = const
t
(a) (b)Figure 5.2. Schematic of the method for destroying evaporator cooling efficiency tocool the liquid: 1 – evaporator, 2 – tank with an adiabatic shield, 3 – cooled liquid,
4 – electric heater

72 5. Experimental Studies in Transient and Steady-States
system to control heater power Ng should be started, as showed in Fig. 5.2b.
A heat flux begins flowing into the liquid in the tank. If power Ng is accurately
selected, after some time the temperature of the tank liquid will stabilise at tr .This stabilisation indicates the required equilibrium in the system. This is the
way to learn the value of heat flux Qp that reaches the evaporator (Qp = Ng).The value of refrigerant mass flow rate is calculated from the formula:
m =Qp
∆ip(5.2)
where:∆ip – an increase in refrigerant enthalpy in the evaporator.
Figure 5.3 shows how this process proceeds in the appliance studied
evaporator
Nel
A
W
Nel
A
W
WW
7 6
thermometer
T
m.
r
ck
m.
c
cooledliquid
stirrer
electricheater
thermallyinsulatedtank
electricheater
Figure 5.3. Determining the refrigerant mass flow rate by the method of destroyingcooling efficiency
T6 = T7, p6 = p7, i6 6= i7, mc = Qp/qp (5.3)
where: mc - refrigerant mass flow rate,
Qp - evaporator cooling efficiency,
qp - evaporator specific cooling efficiency

5.2. Method for Measuring Refrigerant Mass Flow Rate 73
qp = i7 − i6 (5.4)
where:
i7 - refrigerant enthalpy after the evaporator,
i6 - refrigerant enthalpy before the evaporator.
The heat balance is determined by the relation
Qp = Qg dla Tr = const (5.5)
Tr - refrigerated liquid temperature, Qg - electric heater thermal efficiency
expressed by the relation
Qg = Ng = Nel ηg (5.6)
where:
Nel - electric power,
ηg - heater efficiency.
The tank was equipped with additional stirrers to uniformly heat the liquidwith electric heaters and cool it with the evaporator.

6. Analysing the Losses in the Refrigerating Appliancein Steady and Transient State Conditions6.1. Experimental StudiesQuantities (T, p, N) were experimentally studied at the selected measurement
points on the experimental set-up. The results enabled refrigerator performance
characteristics.
The graphs in Figs.6.1, 6.2 show a change in refrigerator pressure, tempera-
ture, compression and compression power during many hours of operation. In
fact, only the first cooling cycle is different from the others. The next cycles can
maintain liquid temperature at the required level so the refrigerator operation is
periodic (cyclical). The appliance begins working if liquid temperature exceeds
an acceptable level. This operation range is regarded as a steady operation
state as pressure and temperature remain the same during numerous cycles.
The graphs show insignificant temperature changes due to a change in the
ambient temperature while cooling. The entire unit except for the evaporator,
which is immersed in the liquid in a thermally insulated tank, operates atthe ambient temperature. A transient state occurs during the first cycle as
soon as the refrigerator starts after a break. As a cooled liquid is of much
higher initial temperature, the first cooling cycle lasts much longer. These
graphs demonstrate cyclical changes in basic thermodynamic quantities during
operation. The moment the refrigerator stops, the refrigerant temperature in
the evaporator is by a few to several degrees lower than the temperature of the
liquid around the evaporator. The refrigerant in the evaporator is then a boiling
liquid and saturated or possibly as superheated vapour if near the outlet. If
the compressor is switched off, evaporator refrigerant temperature tends to
equalise with cooled liquid temperature. A rise in refrigerant temperature is
accompanied by an increase in its pressure but liquid refrigerant mass decreasesin favour of increased volatile refrigerant mass. At start-up, there is a gradual
decrease in pressure due to sucking the vapour by the compressor.
All thevariations incompressorpressure, temperature, powerandcompression
are demonstrated for a single refrigerator operation, as in Figs. 6.3, 6.4.

6.1. Experimental Studies 75
0 2 4 6 8 10 12 14t (h)
0.2
0.3
0.4
0.5
0.6
0.7
p1
(MP
a)
0 2 4 6 8 10 12 14t (h)
10
15
20
25
30
T1
(oC
)
(a)
0 2 4 6 8 10 12 14t (h)
0.4
0.6
0.8
1
1.2
1.4
1.6
p2
(MP
a)
0 2 4 6 8 10 12 14t (h)
10
20
30
40
50
60
T2
(oC
)
(b)
0 2 4 6 8 10 12 14t (h)
0.4
0.6
0.8
1
1.2
1.4
1.6
p3
(MP
a)
0 2 4 6 8 10 12 14t (h)
10
20
30
40
50
T3
(oC
)
(c)Figure 6.1. Changes in pressure and temperature during cooling, (a) point 1, (b)
section 2, (c) point 3; cooling temperature set as 10oC
One of several repeating operation cycles was selected to show these changes.
The graphs show how these quantities can change during compressor operation
until the cooled liquid reaches the required temperature. When the compressor

76 6. Analysing the Losses in the Refrigerating Appliance
0 2 4 6 8 10 12 14t (h)
0.4
0.6
0.8
1
1.2
1.4
1.6
p4
(MP
a)
0 2 4 6 8 10 12 14t (h)
10
15
20
25
30
T4
(oC
)
(d)
0 2 4 6 8 10 12 14t (h)
0.4
0.6
0.8
1
1.2
1.4
1.6
p5
(MP
a)
0 2 4 6 8 10 12 14t (h)
10
15
20
25
30
T5
(oC
)
(e)
0 2 4 6 8 10 12 14t (h)
0
0.2
0.4
0.6
0.8
1
1.2
Nsp
(kW
)
0 2 4 6 8 10 12 14t (h)
1
2
3
4
5
6
p2/p
1
(f)Figure 6.2. Changes in pressure and temperature during cooling - continued, (d)point 4, (e) point 5, (f) a change in compressor power and compression; cooling
temperature set as 10oC
starts operating, the pressure and temperature drop at point 1, i.e. before the
compressor.
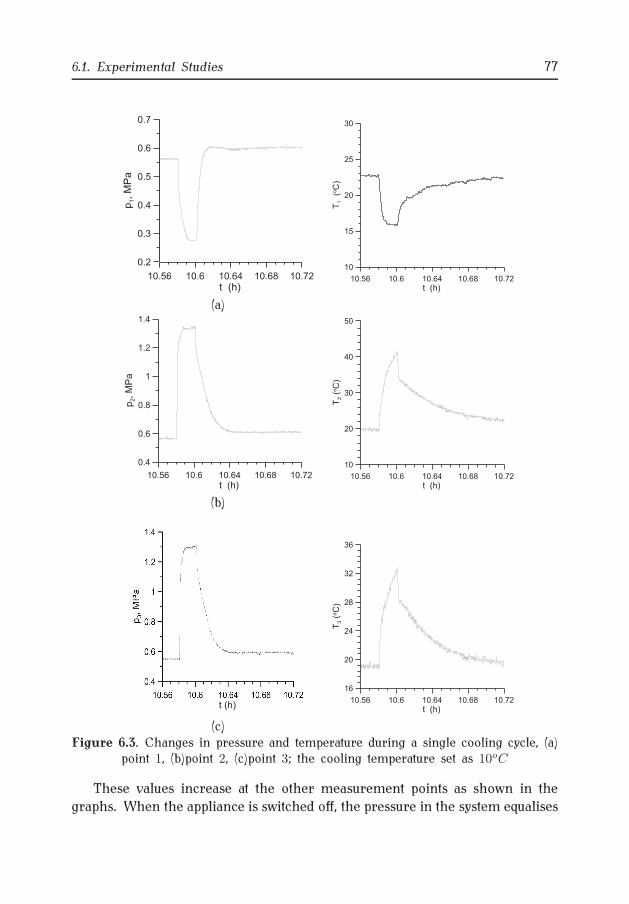
6.1. Experimental Studies 77
10.56 10.6 10.64 10.68 10.72t (h)
0.2
0.3
0.4
0.5
0.6
0.7p
1,M
Pa
10.56 10.6 10.64 10.68 10.72t (h)
10
15
20
25
30
T1
(oC
)
(a)
10.56 10.6 10.64 10.68 10.72t (h)
0.4
0.6
0.8
1
1.2
1.4
p2,M
Pa
10.56 10.6 10.64 10.68 10.72t (h)
10
20
30
40
50
T2
(oC
)
(b)
t (h)10.56 10.6 10.64 10.68 10.72
t (h)
16
20
24
28
32
36
T3
(oC
)
(c)Figure 6.3. Changes in pressure and temperature during a single cooling cycle, (a)
point 1, (b)point 2, (c)point 3; the cooling temperature set as 10oC
These values increase at the other measurement points as shown in the
graphs. When the appliance is switched off, the pressure in the system equalises
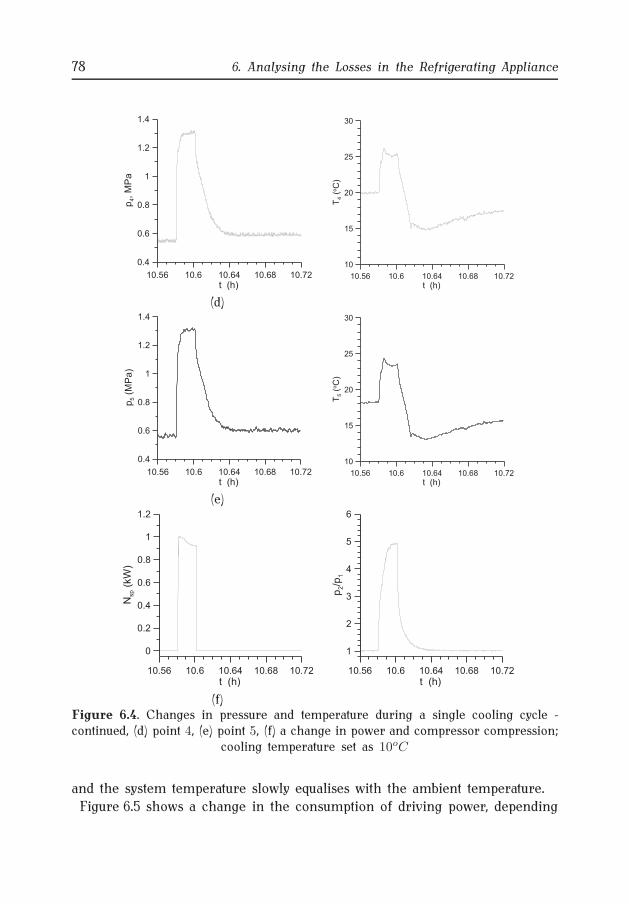
78 6. Analysing the Losses in the Refrigerating Appliance
10.56 10.6 10.64 10.68 10.72t (h)
0.4
0.6
0.8
1
1.2
1.4p
4,M
Pa
10.56 10.6 10.64 10.68 10.72t (h)
10
15
20
25
30
T4
(oC
)
(d)
10.56 10.6 10.64 10.68 10.72t (h)
0.4
0.6
0.8
1
1.2
1.4
p5
(MP
a)
10.56 10.6 10.64 10.68 10.72t (h)
10
15
20
25
30
T5
(oC
)
(e)
10.56 10.6 10.64 10.68 10.72t (h)
0
0.2
0.4
0.6
0.8
1
1.2
Nsp
(kW
)
10.56 10.6 10.64 10.68 10.72t (h)
1
2
3
4
5
6
p2/p
1
(f)Figure 6.4. Changes in pressure and temperature during a single cooling cycle -continued, (d) point 4, (e) point 5, (f) a change in power and compressor compression;
cooling temperature set as 10oC
and the system temperature slowly equalises with the ambient temperature.
Figure 6.5 shows a change in the consumption of driving power, depending

6.1. Experimental Studies 79
Figure 6.5. Power vs. ambient temperature as a function of time for a 4oC liquidcooling temperature
on the ambient temperature.
If the ambient temperature is lower, the compressor less frequently switches
on and thus energy consumption is lower. Therefore, refrigerators need to be
in shadowed and airy places.
The initial temperature of the refrigerated liquid was changed while main-
taining its mass, see Figs. 6.6 and 6.8. The graphs in Fig. 6.6 show a change
0 1000 2000 3000 4000 5000 6000
time t, s
0.2
0.4
0.6
0.8
1
pre
ssu
rep
pa
,M
Pa
30oC
35oC
40OC
50oC
0 1000 2000 3000 4000 5000 6000
time t, s
0.2
0.4
0.6
0.8
1
pre
ssu
rep
pa
,M
Pa
20 oC
30oC
40 oC
(a) (b)Figure 6.6. Pressure ppa for the same amount of liquid, a) cooling temperature as
of 4oC , b) cooling temperature as of 10oC

80 6. Analysing the Losses in the Refrigerating Appliance
0 1000 2000 3000 4000 5000 6000
time t, s
0
0.4
0.8
1.2
1.6
2
pre
ssu
rep
pa,p
sk
,M
Pa
20oC
30oC
40oC
Figure 6.7. Pressures ppa and psk during liquid cooling at varied initial temperaturesfor identical liquid mass
0 1000 2000 3000 4000 5000 6000
time t, s
1
2
3
4
5
pre
ssu
rep
sk/
pp
a
30oC
35oC
40oC
50oC
Figure 6.8. Change in the psk/ppa ratio during liquid cooling at varied initial tem-peratures for identical liquid mass
in evaporator pressure at different initial refrigerated liquid temperatures and
cooling temperatures as of 6.6 and 10oC . Pressure courses for a given level
of cooling are similar, though differ in cooling time. For a cooling up to 4oC ,
the evaporator pressure is lower than that for a cooling up to 10oC .
Figure 6.7 shows how the pressures in the evaporator and condenser change
during a single cooling cycle at varied initial temperatures of the refrigerated

6.1. Experimental Studies 81
liquid for the same cooling temperature as of up to 4oC . The condenser
pressure discrepancies at the end of a cooling cycle are due to the changes in
the ambient temperature.
Figure 6.8 shows how compression changes during liquid cooling up to 4oCdepend on varied initial refrigerated liquid temperatures.
0 50 100 150 200 250 300
time t (s)
16
20
24
28
32
36
40
tem
pe
ratu
ret 2
,t3
(oC
)
temperature behind compresor t2
temperature before condenser t3
0 50 100 150 200 250 300
time t (s)
0.6
0.8
1
1.2
1.4
pre
ssu
rep
2,p
3(M
Pa
)
pressure behind
compresor p2
pressure before
condenser p3
(a) (b)Figure 6.9. Changes in (a) temperature and (b) pipeline pressure behind compressor
and in front of the condenser
0 50 100 150 200 250 300
time t (s)
10
14
18
22
26
30
tem
pera
ture
t 4,t
5(o
C)
temperature behindcondenser t4
temperature beforeregenerator t5
0 50 100 150 200 250 300
time t (s)
0.6
0.8
1
1.2
1.4
pre
ssu
rep
4,p
5(M
Pa
)
pressure behind
condenser p4
pressure before
regenerator p5
(a) (b)Figure 6.10. Changes in (a) temperature and (b) pipeline pressure between the
condenser and regenerative heat exchanger
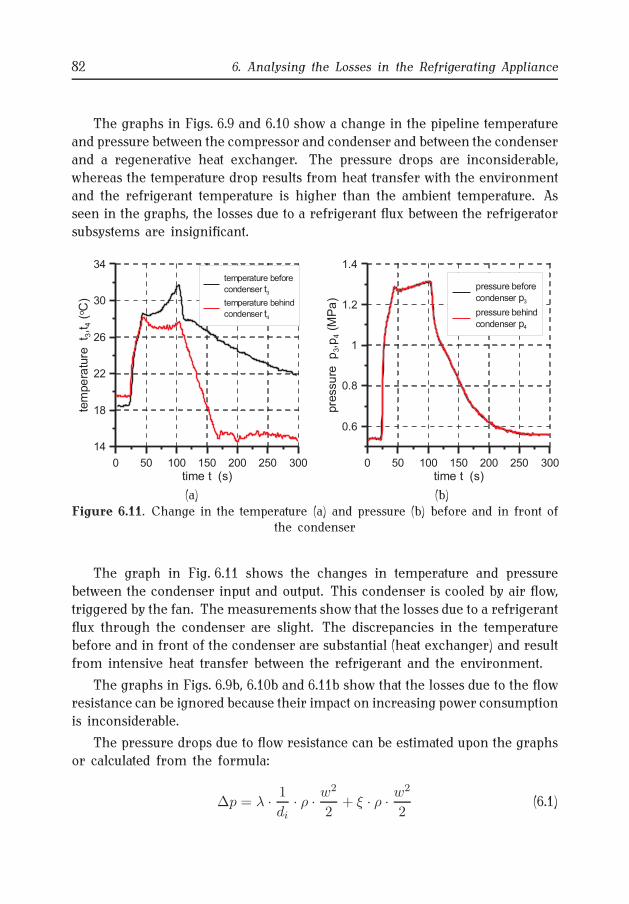
82 6. Analysing the Losses in the Refrigerating Appliance
The graphs in Figs. 6.9 and 6.10 show a change in the pipeline temperature
and pressure between the compressor and condenser and between the condenser
and a regenerative heat exchanger. The pressure drops are inconsiderable,
whereas the temperature drop results from heat transfer with the environment
and the refrigerant temperature is higher than the ambient temperature. Asseen in the graphs, the losses due to a refrigerant flux between the refrigerator
subsystems are insignificant.
0 50 100 150 200 250 300
time t (s)
14
18
22
26
30
34
tem
pe
ratu
ret 3
,t4
(oC
)
temperature before
condenser t3temperature behind
condenser t4
0 50 100 150 200 250 300
time t (s)
0.6
0.8
1
1.2
1.4
pre
ssu
rep
3,p
4(M
Pa
)
pressure before
condenser p3
pressure behind
condenser p4
(a) (b)Figure 6.11. Change in the temperature (a) and pressure (b) before and in front of
the condenser
The graph in Fig. 6.11 shows the changes in temperature and pressure
between the condenser input and output. This condenser is cooled by air flow,
triggered by the fan. The measurements show that the losses due to a refrigerant
flux through the condenser are slight. The discrepancies in the temperature
before and in front of the condenser are substantial (heat exchanger) and result
from intensive heat transfer between the refrigerant and the environment.
The graphs in Figs. 6.9b, 6.10b and 6.11b show that the losses due to the flowresistance can be ignored because their impact on increasing power consumption
is inconsiderable.
The pressure drops due to flow resistance can be estimated upon the graphs
or calculated from the formula:
∆p = λ ·1
di· ρ ·
w2
2+ ξ · ρ ·
w2
2(6.1)
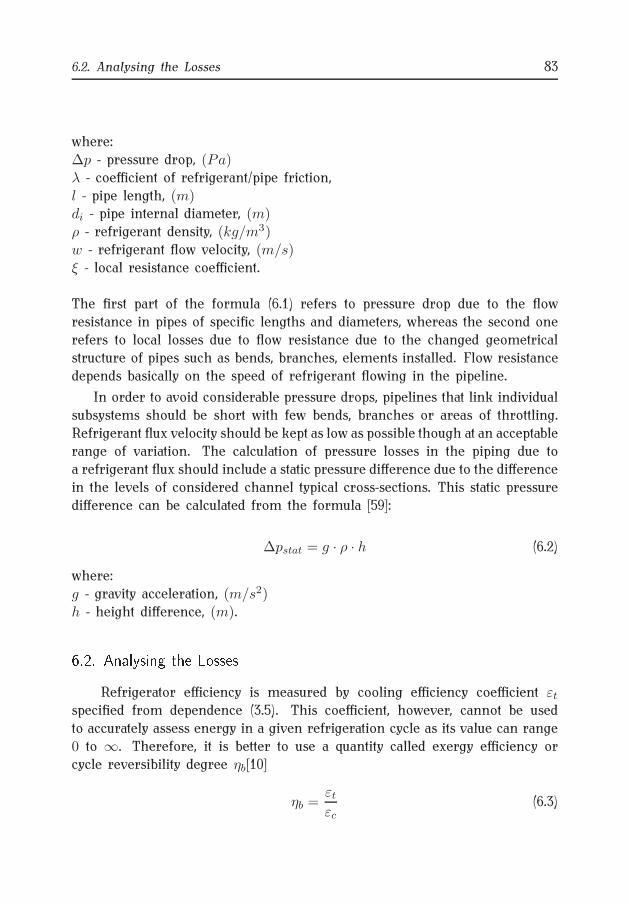
6.2. Analysing the Losses 83
where:
∆p - pressure drop, (Pa)λ - coefficient of refrigerant/pipe friction,
l - pipe length, (m)di - pipe internal diameter, (m)ρ - refrigerant density, (kg/m3)w - refrigerant flow velocity, (m/s)ξ - local resistance coefficient.
The first part of the formula (6.1) refers to pressure drop due to the flow
resistance in pipes of specific lengths and diameters, whereas the second one
refers to local losses due to flow resistance due to the changed geometrical
structure of pipes such as bends, branches, elements installed. Flow resistance
depends basically on the speed of refrigerant flowing in the pipeline.
In order to avoid considerable pressure drops, pipelines that link individual
subsystems should be short with few bends, branches or areas of throttling.
Refrigerant flux velocity should be kept as low as possible though at an acceptable
range of variation. The calculation of pressure losses in the piping due to
a refrigerant flux should include a static pressure difference due to the difference
in the levels of considered channel typical cross-sections. This static pressure
difference can be calculated from the formula [59]:
∆pstat = g · ρ · h (6.2)
where:
g - gravity acceleration, (m/s2)h - height difference, (m).6.2. Analysing the Losses
Refrigerator efficiency is measured by cooling efficiency coefficient εtspecified from dependence (3.5). This coefficient, however, cannot be used
to accurately assess energy in a given refrigeration cycle as its value can range
0 to ∞. Therefore, it is better to use a quantity called exergy efficiency or
cycle reversibility degree ηb[10]
ηb =εtεc
(6.3)

84 6. Analysing the Losses in the Refrigerating Appliance
where:
εt =qolob
; εc =Tpa
Tsk − Tpa(for Carnot cycle) (6.4)
Exergy efficiency allows us to define how much a refrigeration cycle in a given
system is similar to an ideal cycle.
Refrigeration cycle efficiency is evaluated by thermal efficiency referred to
as refrigeration efficiency ηch.
ηch = εt · T∗ (6.5)
where:
T ∗ is referred to as reduced temperature difference
T ∗ =Tsk − Tpa
Tsk(6.6)
Exergy efficiency recognises the impact of several parameters on perfor-
mance efficiency of a given refrigeration cycle, evaluates refrigerants used in
a cycle in terms of their applicability for optimal application.
The data from the test bench measurement was used to develop the graphs in
Fig. 6.12. They show how refrigeration efficiency and refrigerator power change
in a single recurring cooling cycle from the moment an aggregate starts until
the compressor stops just when the required temperature of a refrigerated liquid
is reached. The compressor switches on automatically as soon as a refrigerated
liquid heats up and reaches a too high temperature due to a heat flux through
the tank insulation. All of these changes in parameters occur during a full
compressor operation cycle. The efficiencies given in the graphs reach theirlowest values at the beginning of a cooling cycle and their values increase over
time. The compressor operation cycle to maintain the cooled liquid temperature
constant heated up by an outside heat influx is short.
The compressor as a basic part of any refrigerator powers it although it
generates the highest losses. Reciprocating compressor efficiency is specified not
only upon mass flow or refrigerant volume but also the refrigeration efficiency of
an appliance it powers. Any inevitable volumetric and energy losses can reduce
efficiency and increase energy consumption. Volumetric losses are mainly due
to a harmful area and are specified by mass flow rate λ. These losses do not
require increasing the work needed to compress, but they can deteriorate the
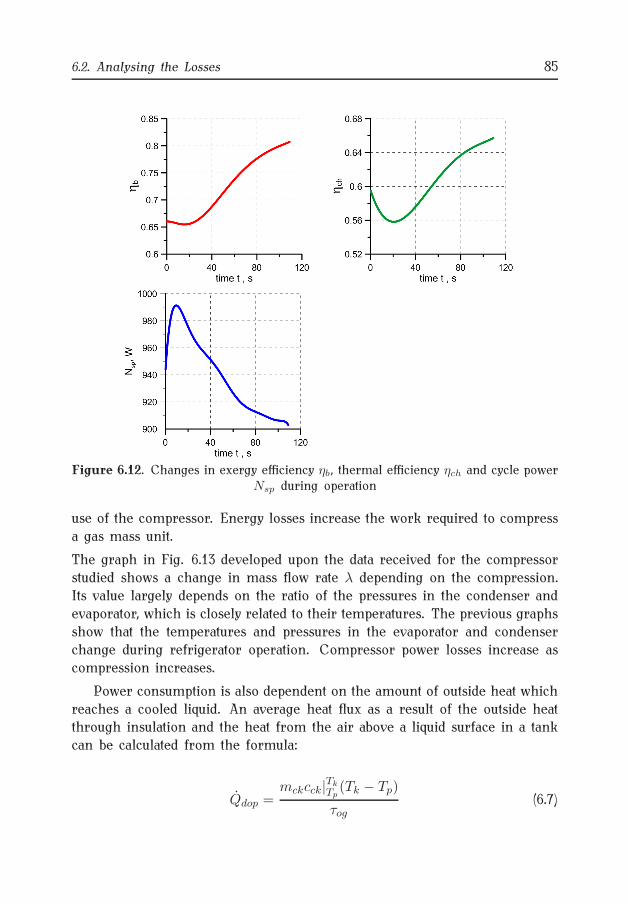
6.2. Analysing the Losses 85
Figure 6.12. Changes in exergy efficiency ηb, thermal efficiency ηch and cycle powerNsp during operation
use of the compressor. Energy losses increase the work required to compress
a gas mass unit.
The graph in Fig. 6.13 developed upon the data received for the compressor
studied shows a change in mass flow rate λ depending on the compression.
Its value largely depends on the ratio of the pressures in the condenser and
evaporator, which is closely related to their temperatures. The previous graphs
show that the temperatures and pressures in the evaporator and condenser
change during refrigerator operation. Compressor power losses increase as
compression increases.
Power consumption is also dependent on the amount of outside heat which
reaches a cooled liquid. An average heat flux as a result of the outside heatthrough insulation and the heat from the air above a liquid surface in a tank
can be calculated from the formula:
Qdop =mckcck|
Tk
Tp(Tk − Tp)
τog(6.7)

86 6. Analysing the Losses in the Refrigerating Appliance
Figure 6.13. Mass flow rate λ vs. compression
where :
mck - refrigerated liquid mass, kgcck|
Tk
Tp- average liquid specific heat, kJ/(kgK)
Tp, Tk - liquid initial and final temperatures in standstill, Kτog - time of a heat influx to a liquid through insulation and from tank air,(s).
Figure 6.14. Average heat influx reaching the tank as a function of the ambienttemperature
Any changes in an average heat influx depending on the ambient temperature
are given in Fig. 6.14. Energy consumption increases with a heat influx increase.
The evaporator needs to absorb more heat from the refrigerated liquid.
The losses due to the processes that occur during refrigerator operation are
accompanied by the losses due to the wear of aggregate parts.

6.2. Analysing the Losses 87
The refrigerant compressor is most sensitive to failures and wear [45]. The
graphs in Figs. 6.15, 6.16 show a share of the failure frequency of parts and
assemblies in the reciprocating compression refrigerator and the percentage
of reasons for failure. The graph in Fig. 6.15 shows that the most common
reason for failure is the wear of pistons, bearing, and crankshafts.
Figure 6.15. Percentage of individual parts and assemblies in the reciprocating com-pression refrigerator vs. failure frequency
Figure 6.16. Failure frequency in the refrigerating compressor vs. the reasons offailure

88 6. Analysing the Losses in the Refrigerating Appliance
Condenser 44% + cooling fan 28%
Evaporator 27% + cooling fan 39%
Compresor
Motor
Trottling loss
Theoretical work of the Carnot cycle 100%
72%
66%
78%
32%
51%
Figure 6.17. Energy losses referenced to the theoretical demand for powering work
The losses due to a refrigerant flow through pipelines that connect individual
components and subsystems in the refrigerator are not considerable. The
pressure drops in the condenser are shown in Fig. 6.11. The pressure drops
in the pipelines behind the compressor and in front of the condenser as well
as in the pipeline between the condenser and the regenerative heat exchanger
are shown by the graphs in Figs. 6.9 and 6.10, respectively.Figure 6.17 summarises the energy losses referenced to the theoretical demand
for powering work to show the level of losses in each part of the refrigeration
system [40]. The losses depicted in the graph refer to the major refrigerator
components. The largest losses are in the compressor, i.e. of about 78 %, and
the smallest ones are in the evaporator, i.e. of about 27 %. The other parts
suffer mostly from the suppression loss of about 51 %. One should remember
that these values are referenced to the theoretical demand for powering work,
Figure 6.18. Average unit motive energy vs. refrigerated liquid mass for temperaturesset as 4oC and 10oC

6.2. Analysing the Losses 89
i.e. Carnot’s cycle. As not only theoretical demand for power but also all the
losses in the refrigeration cycle increase because of the irreversible processes
in the compressor, compressor energy efficiency is critical to balance the losses
in the entire refrigerator.
Demand for motive energy is closely related with refrigerated liquid mass.
More refrigerated liquid mass requires more energy to be supplied. To eval-
uate refrigerator performance efficiency, its motive energy is referenced to
refrigerated liquid unit mass where average unit energy was defined as:
esr =E
m(6.8)
Figure 6.18 shows the changes in demand for average unit energy that is
needed to refrigerate the refrigerated liquid unit mass depending on the refrig-
erated liquid mass at a given refrigeration temperature. As shown in the graph,
average unit energy decreases with increasing refrigerated liquid mass, within
the testing scope. This means that average unit power consumption in a cooling
cycle for the immersion refrigerator depends essentially on refrigerant mass
in the appliance. The tank for the tests was too small to make measurements
for more liquid. Based on the experimental data and relevant literature, it can
be concluded that the optimum amount of refrigerated liquid for which powerconsumption is minimal can be specified for every tank used to refrigerate
a liquid in the refrigerator.

7. Summary and ConclusionsThis monograph provides the results of the theoretical and experimental
investigations on the energy losses generated when the immersion compression
refrigerator operates.
To facilitate this analysis, a systemic approach, i.e. Linde dry cycle with heat
regeneration as a model cycle was adopted to describe immersion refrigerator
operation.
This approach was adopted to study dissipation, transfer and generation of
energy losses in the compression refrigerator. As a result, the refrigerator struc-
ture was divided into subsystems and coherent consistent objects, i.e. subsystems
of the compressor, evaporator, condenser, regenerator and decompressor in
terms of phenomena that occur there. Any interpenetrating thermodynamic,
flow and thermal processes in the refrigerator were decoupled. Each subsystem
was discussed in terms of the processes that occur there as well as its impacton the other subsystems and the environment. For each subsystem, purposive
factors which directly contribute to completing the task of the refrigerator
were specified. These factors were used to maximise a refrigeration efficiency
coefficient.
The analysis of the subsystems enabled specifying the sets of process, material
and geometric factors that to a varying degree caused energy losses in the
refrigerator studied when energy was converted during cooling the liquid.
As seen in Fig. 4.7, the examination enabled specifying the sources of major
internal and external losses and their distribution in the system.
The major internal losses include the losses due to the refrigerant irreversible
compression related to the cylinder inside, the losses due to the refrigerant
irreversible decompression in the decompressor, and the losses of indicated
power. The major external losses refer to the losses due to energy conversion
in the compressor, the losses due to decompression work in the decompressor,
the losses of engine power, the losses of electric power supplied to the engine,
the losses due to converting energy of mixing into heat, and the losses due to
a heat influx thought tank insulation and from the air in the tank.

91
For the experimental research, the set-up comprised an immersion refrig-
erator, adiabatic tank and measurement instruments. Temperature and pressure
were measured with the specially designed and made measuring heads which
enabled sensors in the area of a refrigerant flow. These heads were indispensable
to do correct measurements with a minimally disturbed flow. The refrigeratedliquid was in the specially designed adiabatic tank. The measurement was
done at the selected points at the refrigerator. The results were recorded with
the instruments installed in the set-up to acquire data over real time. The
measurements were done at varied initial temperatures of refrigerated liquid
and environment. The temperature of the refrigerated liquid changed, i.e. up to
4oC or 10oC . Refrigerated liquid mass was another parameter changed during
the measurement.
The changes in pressure, temperature and driving power during operation
prove that a pressure drop due to a refrigerant flow through the refrigerator
individual elements are inconsiderable and hardly influence energy losses. The
largest energy losses occur during a start-up as shown in the graphs in Fig. 6.12.
The examination demonstrates that the consumption of unit powering en-
ergy during a single refrigeration cycle of the immersion refrigerator basically
depends on refrigerant mass in a given appliance. Figure 6.18 shows the rela-tionship between the amount of a refrigerated liquid and a unit energy needed
to cool it. More mass of a refrigerated liquid requires more energy under
given circumstances. In addition, the amount of energy needed to cool unit
mass changes as the amount of a cooled refrigerant in the tank increases.
Unit energy decreased within the testing scope. Any further increase in unit
mass is expected to increase unit energy because of refrigerator limited cooling
efficiency.
The practical conclusion is that for a given refrigerator it is possible to
specify a correct refrigerated liquid mass for which energy consumption for
a mass unit can be as low as possible. To conclude, the systemic approach to
the losses enables developing a variety of models of functional refrigerators
and analysing them in terms of these criteria.
This approach can be adopted to design and optimise the low-power con-sumption refrigerator.

Bibliography[1] ADMIRAAL D., BULLARD C. Experimental validation of heat exchanger models for
refrigerator/freezers. ASHRAE Transactions 101, 1 (1995), 34–43.[2] ARCAKLIOGLU E., ÇAVUSOGLU A., ERISEN A. Thermodynamic analysis of refrigerant
mixtures for possible replacements for cfcs by an algorithm compiling propertydata. Applied Thermal Engineering, 26 (2006), 430–439.
[3] BAILLY B., JURKOWSKI J., COCHET C. Passage du R22 au R134a. Revue Générale
du Froid 83, 933/4 (1993), 35–40.[4] BANSAL P., CHIN T. Modelling and optimisation of wire-and-tube condenser.
International Journal of Refrigeration, 26 (2003), 601–613.[5] BANSAL P., RUPASINGHE A. An empirical model for sizing capillary tubes. Inter-
national Journal of Refrigeration 19, 8 (1996), 497–505.[6] BANSAL P., RUPASINGHE A. An homogeneous model for adiabatic capillary tubes.
Applied Thermal Engineering, 18 (1998), 207–219.[7] BANSAL P., YANG C. Reverse heat transfer and re-condensation phenomena in
non-adiabatic capillary tubes. Applied Thermal Engineering, 25 (2005), 3187–3202.[8] BIAŁKO B., KRÓLICKI Z. Wartości parametrów pracy małego systemu spręż arkowego
napełnionego mieszaniną propan - izobutan. Chłodnictwo XXXV, 1 (2000), 8–12.[9] BODIO E., CHOROWSKI M., WILCZEK M. Badania chłodziarek domowych
napełnionych mieszaniną propanu-butanu. Chłodnictwo XXVI, 6 (1991), 3–6.[10] BOHDAL T., CHARUN H., CZAPP M. Urządzenia chłodnicze sprężarkowe parowe.
WNT, Warszawa, 2003.[11] BUTRYMOWICZ D., BONCA Z. Problematyka doboru rurki kapilarnej jako elementu
dławiącego dla nowych czynników chłodniczych. Część 1. Chłodnictwo XXXII, 7(1997), 32–39.
[12] BUTRYMOWICZ D., BONCA Z. Problematyka doboru rurki kapilarnej jako elementudławiącego dla nowych czynników chłodniczych. Część 2. Chłodnictwo XXXII, 7(1997), 7–12.
[13] BUTRYMOWICZ D., KORNECKI I. Rurki kapilarne w małych urządzeniach chłod-niczych. Technika Chłodnicza i Klimatyzacyjna, 1 (1996), 27–32.
[14] BUTRYMOWICZ D., TRELA M. Dobór pola powierzchni wymiany ciepła skraplaczazasilanego parą o wysokim przegrzaniu. Technika Chłodnicza i Klimatyzacyjna,1 (2005), 5–11.
[15] CABAJ M., KĘDZIA J. Wymiennik ciepła jako dochładzacz / przegrzewacz w obieguchłodniczym. Chłodnictwo XXXIX, 11 (2004), 22–24.

Bibliography 93
[16] CALM J., DOMAŃSKI P. Substytucja R22 - stan obecny. Technika Chłodnicza
i Klimatyzacyjna, 8 (2005), 268–275.[17] CHARUN H. Eksperymentalne charakterystyki energetyczne sprężarki tłokowej
z czynnikiem R134a. Technika Chłodnicza i Klimatyzacyjna, 8 (2005), 290–296.[18] CHŁOPECKI A. Metodologia badań obiegów jedno- i wielostopniowych w instalacjach
chłodniczych. Chłodnictwo XXV, 7 (1990), 3–9.[19] DE BOER P. Analysis of basic pulse-tube refrigerator. Cryogenics 35, 9 (1995),
547–553.[20] DEKA A., KULESZA J. Problemy wymiany ciepła i ukształtowania skraplaczy
rurowo-drutowych dla chłodziarek domowych. Chłodnictwo XXIII, 1 (1988), 6–10.[21] DOMANSKI P., YASHAR D., KIM M. Performance of a finned-tube evaporator
optimized for different refrigerants and its effect on system efficiency. International
Journal of Refrigeration, 28 (2005), 820–827.[22] ESLAMI H., MEHDIPOUR N., BOUSHEHRI A. An analytical equation of state for
refrigerant mixtures. International Journal of Refrigeration, 29 (2006), 150–154.[23] FATOUH M., EL KAFAFY M. Assessment of propane/commercial butane mixtures
as possible alternatives to R134a in domestic refrigerators. Energy Conversion
and Management, 47 (2006), 2644–2658.[24] FIJAŁKOWSKI S., WARMIŃSKA A. Analiza strat energii przy guasi-ustalonym działaniu
sprężarkowych chłodziarek małej mocy. Część I : Analiza czynników warunkują-cych powstanie istotnych strat energii w chłodziarkach małej mocy. Chłodnictwo
XXXII, 4 (1997), 14–19.[25] FIJAŁKOWSKI S., WARMIŃSKA A. Analiza strat energii przy guasi-ustalonym działaniu
sprężarkowych chłodziarek małej mocy. Część II : O poziomie wykorzystaniaenergii napędowej w procesie chłodniczym przy zmiennej temperaturze przestrzenischładzania. Chłodnictwo XXXII, 5 (1997), 9–17.
[26] FLOREK R., KRÓLICKI Z. Diabatyczność procesu dławienia. Dobór geometrii układururka kapilarna - przewód ssawny sprężarki. Chłodnictwo XXXIX, 1-2 (2004), 22–28.
[27] GERLACH-KOLASA Z. Celowość stosowania optymalizacji wielokryterialnej w pro-jektowaniu chłodniczych wymienników ciepła. Chłodnictwo XXVIII, 2 (1993),8–12.
[28] JEONG S. How difficult is it to make a micro reffigerator ? International Journal
of Refrigeration, 27 (2004), 309–313.[29] JEONG S., JANG K., KO J. A novel concept of rapid cooling method of refrigeration
system. International Journal of Refrigeration, 28 (2005), 176–182.[30] KABELAC S. A simple set of equations of state for process calculations and its
application to R134a and R152a. International Journal of Refrigeration 14, 4(1991), 217–222.
[31] KARPIŃSKI W. Termodynamiczne podstawy budowy urządzeń przemysłu
spożywczego, chłodnictwa i klimatyzacji. Część I Urządzenia Chłodnicze.Wydawnictwo Politechniki Łódzkiej, Łódź, 1993.
[32] KOZIOŁ J., GAZDA W. Wpływ czynników eksploatacyjnych na sprawność obiegówjednostopniowych ziębiarek sprężarkowych. Chłodnictwo XXXV, 1 (2000), 14–18.

94 Bibliography
[33] KOZIOŁ J., MRÓZ M. Czynnik obiegowy a straty dłwienia w chłodziarkachsprężarkowych. Technika Chłodnicza i Klimatyzacyjna, 1 (1996), 12–16.
[34] KRÓLICKI Z. Badania doziębiaczy sprężarkowych chłodziarek domowych. Chłod-
nictwo XX, 10 (1985), 3–5.[35] KRZYŻA G., GAZIŃSKI B., ZAPOLSKA D. Freony a ochrona środowiska. Własności
freonu R134a. Chłodnictwo XXVIII, 4 (1993), 11–16.[36] KRZYŻANIAK G., STOCKFISH N. Alternatywne czynniki chłodnicze dla R22. Chłod-
nictwo XL, 4 (2005), 28–30.[37] KULESZA J. (PRACA ZBIOROWA) Pomiary cieplne. WNT, Warszawa, 1995.[38] LANGE G., STOLARSKI M., ŻAK M. Model matematyczny domowej chłodziarki
sprężarkowej. Chłodnictwo, 2 (1983), 20–23.[39] LEPJAVKO A., NEMCEV A. Povyshenie ehffektivnosti malykh kholodilnykh mashin.
Khoșodilnaja Tekhnika, 1 (1996), 21.[40] LORENTZEN G. Oszczędzanie energii w chłodnictwie. Chłodnictwo XXV, 1-2 (1990),
17–21.[41] MCGOVERN J., HARTE S. An exergy method for compressor performance analysis.
International Journal of Refrigeration 18, 6 (1995), 421–433.[42] MEUNIER F. Refrigeration carnot-type cycle based on isothermal vapour compres-
sion. International Journal of Refrigeration, 29 (2006), 155–158.[43] MIESZKOWSKI M. (PRACA ZBIOROWA) Pomiary cieplne i energetyczne. WNT,
Warszawa, 1985.[44] NADZIAKIEWICZ J. Numeryczne modelowanie procesu sprężania czynników chłod-
niczych w sprężarce tłokowej. Chłodnictwo XXX, 3 (1995), 21–25.[45] PALIWODA A. Uszkodzenia i awarie sprężarek chłodniczych. Technika Chłodnicza
i Klimatyzacyjna, 3 (1999), 117–118.[46] PALIWODA A. Postęp techniczny w budowie wymienników ciepła urządzeń chłod-
niczych, klimatyzacyjnych i pomp ciepła. Część I. Wymienniki płaszczowo - rurowe.Chłodnictwo, 11 (2001), 428–431.
[47] PALIWODA A. Postęp techniczny w budowie wymienników ciepła urządzeń chłod-niczych, klimatyzacyjnych i pomp ciepła. Część II. Wymienniki ciepła o budowiewysoko zwartej. Chłodnictwo, 12 (2001), 469–473.
[48] POPOVIC P., SHAPIRO H. A semi-empirical method for modeling a reciprocatingcompressor in refrigeration systems. ASHRAE Transactions 101, 2 (1995), 367–382.
[49] RESZEWSKI S., BIAŁKO B., KRÓLICKI Z. Kondensacja zeotropowych roztworów wę-glowodorów nasyconych w skraplaczach konwekcyjnych małych urządzeń chłod-niczych - analiza teoretyczna procesu. Technika Chłodnicza i Klimatyzacyjna,8 (2003), 274–281.
[50] SALEH B., WENDLAND M. Screening of pure fluids as alternative refrigerants.International Journal of Refrigeration, 29 (2006), 260–269.
[51] SEKHAR S., LAL D. HFC 134a/HC600a/HC290 mixture a retrofit for CFC12 systems.International Journal of Refrigeration, 28 (2005), 735–743.
[52] SELBAS R., KIZILKAN O., SENCAN A. Thermoeconomic optimization of subcooled andsuperheated vapor compression refrigeration cycle. Energy, 31 (2006), 2108–2128.
Bibliography 95
[53] STOLARSKI M., SZARYNGER J., ŻAK M. Racjonalny model do obliczeń optymaliza-cyjnych domowej chłodziarki sprężarkowej. Chłodnictwo XX, 7 (1985), 13–20.
[54] SZARGUT J. Sprawności cząstkowe ziębiarki parowej sprężarkowej. Chłodnictwo
XXXII, 6 (1997), 10–12.[55] SZARGUT J. Straty energetyczne w ziębiarce parowej sprężarkowej spowodowane
oporami przepływu czynnika chłodniczego. Chłodnictwo XXXII, 1 (1997), 9–12.[56] TALARCZYK R. Badania chłodniczych skraplaczy płytowych firmy wtt. Technika
Chłodnicza i Klimatyzacyjna, 1 (2006), 22–26.[57] TASHTOUSH B., TAHAT M., SHUDEIFAT M. Experimental study of new refrigerant
mixtures to replace R12 in domestic refrigerators. Applied Thermal Engineering,22 (2002), 495–506.
[58] TASSOU S., GRACE I. Fault diagnosis and refrigerant leak detection in vapourcompression refrigeration systems. International Journal of Refrigeration, 28(2005), 680–688.
[59] ULLRICH H. Technika chłodnicza - Poradnik. Tom 2. IPPU MASTA, 1999.[60] WARCZAK W. Rozwój konstrukcji sprężarek chłodniczych w okresie ostatnich
kilkudziesięciu lat i prognoza dalszych kierunków rozwoju. Część 1. Technika
Chłodnicza i Klimatyzacyjna, 1 (2001), 11–14.[61] WARCZAK W. Rozwój konstrukcji sprężarek chłodniczych w okresie ostatnich
kilkudziesięciu lat i prognoza dalszych kierunków rozwoju. Część 2. Technika
Chłodnicza i Klimatyzacyjna, 2 (2001), 66–71.[62] WESOŁOWSKI A. Urządzenia chłodnicze i kriogeniczne oraz ich pomiary cieplne.
WNT, Warszawa, 1980.[63] ZAJCEV A., PROCENKO V., SAFONOV V. Obobshhonnyj metod teplovogo rascheta
inspritelej i kondensatorov. Khoșodilnaja Tekhnika, 9 (1989), 45–48.[64] ŻAK M., ŻÓŁTANIECKI A. Projektowanie ziębiarki sprężarkowej do oziębiania cieczy
w zadanym czasie i przedziale temperatur. Chłodnictwo XXXV, 9 (2000), 20–23.[65] ZAKRZEWSKI B. Regeneracja ciepła w jednostopniowym obiegu chłodniczym
z nowym czynnikiem R134a. Chłodnictwo XXIX, 11 (1994), 17–21.[66] ZAKRZEWSKI B., HABEREK J. Badania urządzenia chłodniczego z czynnikiem forane
134a. Chłodnictwo XXX, 4 (1995), 21–24.[67] ZALEWSKI W., NIEZGODA B., GRYGLASZEWSKI P. Matematyczny model działania
skraplaczy wyparnych. Chłodnictwo XXV, 3-4 (1990), 3–7.

List of Figures1.1. Types of refrigerating appliances used in refrigeration engineering . . . . 11
1.2. Diagram of the chief processes typical of the vapour compressorrefrigerator with heat regeneration . . . . . . . . . . . . . . . . . . . . . . . 12
1.3. Schematic of the methodology of studying compression refrigerator systems 13
3.1. Schematic of the vapour compression refrigerator with heat regeneration 27
3.2. Thermodynamic cycle with heat regeneration as graphs of T − s andlog p− i . . . . . . . . . . . . . . . . . . . . . . . . . . . . . . . . . . . . . . . 28
3.3. Schematic of a hypothetical cooling process in a real appliance (a) ina set log p− i and (b) in a set T − s . . . . . . . . . . . . . . . . . . . . . . 32
3.4. Scheme of the systematic refrigerator model, Ei - energy flow, mi - massflow rate (substance), SW - internal energy loss sources, SZ - externalenergy loss sources. . . . . . . . . . . . . . . . . . . . . . . . . . . . . . . . . 36
3.5. Schematic of compressor subsystem Ωsp including its internal andexternal couplings . . . . . . . . . . . . . . . . . . . . . . . . . . . . . . . . . 37
3.6. Schematic of condenser subsystem Ωsk with its internal and externalcouplings . . . . . . . . . . . . . . . . . . . . . . . . . . . . . . . . . . . . . . 38
3.7. Schematic of evaporator subsystem Ωpa with its internal and externalcouplings . . . . . . . . . . . . . . . . . . . . . . . . . . . . . . . . . . . . . . 39
3.8. Schematic of regenerator subsystem - Ωrg and decompressing device -Ωrk with their internal and external couplings . . . . . . . . . . . . . . . . 40
3.9. Links between the fundamental factors which have an impact on powerprocessing in the compressor subsystem . . . . . . . . . . . . . . . . . . . . 42
3.10. Critical purposive factors that have an impact on energy conversionduring the heat transfer in the condenser subsystem . . . . . . . . . . . . 42
3.11. Critical purposive factors that have an impact on energy conversionduring the heat transfer in the evaporator subsystem . . . . . . . . . . . 43
3.12. Relationships between the critical purposive factors which have an impacton (a) heat transfer and its effects in the regenerator and (b) energyconversion during refrigerant decompressing in the decompressingdevice subsystem, i.e. capillary tube . . . . . . . . . . . . . . . . . . . . . . . 44
3.13. Relationship between the critical factors that condition losses whileconverting energy in the compressor subsystem . . . . . . . . . . . . . . . 45

97
3.14. Relationships between the critical factors that condition losses whileconverting energy in the condenser subsystem . . . . . . . . . . . . . . . . 47
3.15. Relationships between the critical factors that condition losses whileconverting energy in the evaporator subsystem . . . . . . . . . . . . . . . 47
3.16. Critical factors that condition the losses while converting energy (a) inthe regenerator and decompressor subsystems (b) . . . . . . . . . . . . . . 48
4.1. ALFA LAVAL immersion refrigerating appliance for milk cooling and itsmain components. . . . . . . . . . . . . . . . . . . . . . . . . . . . . . . . . . 51
4.2. The energy flow balance structure for an area with a cooled liquid . . . 56
4.3. Liquid cooling (a) the relationships between the critical factors thatinfluence the processes of energy conversion in liquid cooling (b) therelationships between the critical factors that condition energy losseswhile converting energy during cooling the liquid . . . . . . . . . . . . . . 59
4.4. Itinerary calculations βm . . . . . . . . . . . . . . . . . . . . . . . . . . . . . 60
4.5. Heat transfer coefficient kp, heat absorption coefficient αPM , βm and Cpz
vs. stirrer rotational speed . . . . . . . . . . . . . . . . . . . . . . . . . . . . 61
4.6. Changes in liquid cooling rate dΘdτ0
(a), dimensionless cooling time τ0 (b),
and dependence of liquid temperature change Tm and cooling time τ (c) 61
4.7. The system of refrigerator devices and the refrigerated liquid tank withmajor sources of losses . . . . . . . . . . . . . . . . . . . . . . . . . . . . . 62
4.8. Schematic of the refrigerator studied with the selected measurementpoints corresponding to the control cross-sections of a refrigerant flow . 64
4.9. Schematic of the heads to measure temperature and pressure: a) ina single pipe, b) in a double concentric pipe . . . . . . . . . . . . . . . . . 65
4.10. Cooling unit with sensors . . . . . . . . . . . . . . . . . . . . . . . . . . . . 65
4.11. Immersion evaporator and its adiabatic tank for cooling a liquid . . . . . 66
4.12. General view of the experimental set-up . . . . . . . . . . . . . . . . . . . . 66
4.13. Schematic of the temperature and pressure measurement tracks . . . . . 67
4.14. Schematic of the methodology of experimental studies on compressionrefrigerator systems . . . . . . . . . . . . . . . . . . . . . . . . . . . . . . . . 68
5.1. Methods applied to study a single-stage refrigerating appliance . . . . . . 70
5.2. Schematic of the method for destroying evaporator cooling efficiency tocool the liquid: 1 – evaporator, 2 – tank with an adiabatic shield, 3 –cooled liquid, 4 – electric heater . . . . . . . . . . . . . . . . . . . . . . . . 71
5.3. Determining the refrigerant mass flow rate by the method of destroyingcooling efficiency . . . . . . . . . . . . . . . . . . . . . . . . . . . . . . . . . . 72
6.1. Changes in pressure and temperature during cooling, (a) point 1, (b)section 2, (c) point 3; cooling temperature set as 10oC . . . . . . . . . . . 75
98 List of Figures
6.2. Changes in pressure and temperature during cooling - continued, (d)point 4, (e) point 5, (f) a change in compressor power and compression;cooling temperature set as 10oC . . . . . . . . . . . . . . . . . . . . . . . . 76
6.3. Changes in pressure and temperature during a single cooling cycle, (a)point 1, (b)point 2, (c)point 3; the cooling temperature set as 10oC . . . . 77
6.4. Changes in pressure and temperature during a single cooling cycle -continued, (d) point 4, (e) point 5, (f) a change in power and compressorcompression; cooling temperature set as 10oC . . . . . . . . . . . . . . . . 78
6.5. Power vs. ambient temperature as a function of time for a 4oC liquidcooling temperature . . . . . . . . . . . . . . . . . . . . . . . . . . . . . . . . 79
6.6. Pressure ppa for the same amount of liquid, a) cooling temperature as of4oC , b) cooling temperature as of 10oC . . . . . . . . . . . . . . . . . . . . 79
6.7. Pressures ppa and psk during liquid cooling at varied initial temperaturesfor identical liquid mass . . . . . . . . . . . . . . . . . . . . . . . . . . . . . 80
6.8. Change in the psk/ppa ratio during liquid cooling at varied initialtemperatures for identical liquid mass . . . . . . . . . . . . . . . . . . . . . 80
6.9. Changes in (a) temperature and (b) pipeline pressure behind compressorand in front of the condenser . . . . . . . . . . . . . . . . . . . . . . . . . . 81
6.10. Changes in (a) temperature and (b) pipeline pressure between thecondenser and regenerative heat exchanger . . . . . . . . . . . . . . . . . . 81
6.11. Change in the temperature (a) and pressure (b) before and in front ofthe condenser . . . . . . . . . . . . . . . . . . . . . . . . . . . . . . . . . . . . 82
6.12. Changes in exergy efficiency ηb, thermal efficiency ηch and cycle powerNsp during operation . . . . . . . . . . . . . . . . . . . . . . . . . . . . . . . 85
6.13. Mass flow rate λ vs. compression . . . . . . . . . . . . . . . . . . . . . . . . 86
6.14. Average heat influx reaching the tank as a function of the ambienttemperature . . . . . . . . . . . . . . . . . . . . . . . . . . . . . . . . . . . . . 86
6.15. Percentage of individual parts and assemblies in the reciprocatingcompression refrigerator vs. failure frequency . . . . . . . . . . . . . . . . 87
6.16. Failure frequency in the refrigerating compressor vs. the reasons of failure 87
6.17. Energy losses referenced to the theoretical demand for powering work . 88
6.18. Average unit motive energy vs. refrigerated liquid mass for temperaturesset as 4oC and 10oC . . . . . . . . . . . . . . . . . . . . . . . . . . . . . . . 88

List of Tables2.1. Summary of major studies on vapour compressor refrigerators . . . . . . 26
4.1. Basic technical data of Alfa Laval IC/P 253 . . . . . . . . . . . . . . . . . . 50
4.2. Dimensionless relationships covered by the energy equation and theirquantities . . . . . . . . . . . . . . . . . . . . . . . . . . . . . . . . . . . . . . . 56
AbstractThe results of theoretical and experimental investigations on energy losses
which arise in small refrigerating compressors used in agriculture and food
industry have been presented in this monograph. The refrigerating compressor
has been treated as a system composed of subsystems which represent the main
parts of the set. All internal processes in each subsystem have been defined
and then relationships between the subsystems and the external environment
have been found. The model developed has enabled the main factors behind as
well as sources and localization of internal and external losses to be specified.
The experimental investigations have been done on an especially designed
experimental setup, allowing measurement of pressure and temperature in
selected characteristic points. The experimental results have been obtained
for various sets of initial temperatures of the refrigerated liquid and externalenvironment. Varied mass of the refrigerated liquid and two different sets of
cooling temperature have been investigated. The analysis has shown that the
most significant energy losses have occurred when refrigerating compressor
starts. The relationship between the amount of refrigerated liquid and energy
used in a cooling process has been determined. It has been found that energy
used to refrigerate unit mass in one cooling cycle depends essentially on the
amount of refrigerated mass. This means that it is possible to select an adiabatic
tank of an optimal size to be adequate for a chosen refrigerating compressor.
Such solution can minimize the energy supplied to the refrigerating system
with respect to the amount of refrigerated mass.


