Page 1
Accepted refereed manuscript of:
Sprague M, Walton J, Campbell P, Strachan F, Dick JR & Bell JG (2015) Replacement of fish oil with a DHA-rich algal meal derived from Schizochytrium sp. on the fatty acid and persistent organic pollutant levels in diets and flesh of Atlantic salmon (Salmo salar, L.) post-smolts, Food Chemistry, 185, pp. 413-421. DOI: 10.1016/j.foodchem.2015.03.150
© 2015, Elsevier. Licensed under the Creative Commons Attribution-
NonCommercial-NoDerivatives 4.0 International
http://creativecommons.org/licenses/by-nc-nd/4.0/
Page 2
1
Replacement of Fish Oil with a DHA-rich Algal Meal Derived from 1
Schizochytrium sp. on the Fatty Acid and Persistent Organic 2
Pollutant Levels in Diets and Flesh of Atlantic Salmon (Salmo salar, 3
L.) Post-Smolts 4
5
Sprague, M.1*
, Walton, J.2, Campbell, P.
2, Strachan, F.
1, Dick, J.R.
1 and 6
Bell, J.G.1
7
8
1Institute of Aquaculture, University of Stirling, Stirling FK9 4LA, Scotland, UK 9
2BioMar Ltd., North Shore Road,Grangemouth Docks, Grangemouth FK3 8UL, 10
Scotland, UK 11
*Corresponding author. Tel.: +44 1786 467989 12
E-mail address: [email protected] 13
14
Page 3
2
Abstract 15
The replacement of fish oil (FO) with a DHA-rich Schizochytrium sp. algal meal 16
(AM) at two inclusion levels (11% and 5.5% of diet) was tested in Atlantic salmon 17
post-smolts compared to fish fed a FO diet of northern (NFO) or southern hemisphere 18
(SFO) origin. Fish were preconditioned prior to the 19-week experimental feeding 19
period to reduce long-chain polyunsaturated fatty acid (LC-PUFA) and persistent 20
organic pollutant levels (POPs). Dietary POP levels differed significantly between 21
treatments in the order of NFO>SFO>11AM/5.5AM and were subsequently reflected 22
in the flesh. Fish fed the 11AM diet contained similar DHA levels (g.100g-1
flesh) to 23
FO-fed fish, despite percentage differences. However, the low levels of EPA in the 24
diets and flesh of algal-fed fish compromised the overall nutritional value to the final 25
consumer. Nevertheless, further developments in microalgae culture offer a 26
promising alternative lipid source of LC-PUFA to FO in salmon feeds that warrants 27
further investigation. 28
29
Key words: Atlantic salmon, Salmo salar, Schizochytrium sp. algal-meal, fish oil 30
replacement, fatty acids, persistent organic pollutants (POPs), PCDD/Fs, DL-PCBs, 31
PBDEs. 32
33
Chemical compounds studied in this article 34
Docosahexaenoic acid (PubChem CID: 445580); Eicosapentaenoic acid (PubChem 35
CID: 446284) 36
Page 4
3
1. Introduction 37
It is widely accepted that fish consumption is an excellent source of the 38
beneficial omega-3 long-chain polyunsaturated fatty acids (n-3 LC-PUFA), 39
eicosapentaenoic acid (EPA; 20:5n-3) and docosahexaenoic acid (DHA; 22:6n-3), 40
which have important roles in protecting against cardiovascular disease as well as 41
neurological and inflammatory conditions among other health benefits (Calder & 42
Yaqoob, 2009). Nevertheless, fish consumption, particularly oily fish, is also a major 43
dietary exposure route for humans to persistent organic pollutants (POPs), including 44
dioxins [polychlorinated dibenzo-p-dioxins (PCDDs) and polychlorinated 45
dibenzofurans (PCDFs)], dioxin-like polychlorinated biphenyls (DL-PCBs) and 46
polybrominated diphenyl ethers (PBDEs). These lipophilic compounds are easily 47
absorbed and rapidly distributed to lipid-rich organs and tissues which can result in 48
their bioaccumulation. Consequently, the beneficial effects may be offset by the 49
negative risks associated with fish intake. 50
In farmed fish, such as Atlantic salmon (Salmo salar), the traditional marine-51
derived components of fish feed, fish oil and fish meal, are considered to be the major 52
sources of POPs (Berntssen, Julshamn & Lundebye, 2010a; Jacobs, Covaci & 53
Schepens, 2002). Reducing the POP levels in fish oils, and ultimately the feeds and 54
flesh of fish, without affecting the LC-PUFA content, has been achieved using 55
decontamination techniques (Berntssen et al., 2010b; Sprague et al., 2010) or by 56
utilising less polluted fish oils from the southern hemisphere (Sprague et al., 2010). 57
However, the increased competition from the pharmaceutical and nutraceutical 58
industries for n-3 LC-PUFA coupled with the stagnated global supply of wild catch 59
fisheries has led to increased prices and supply pressures resulting in the aquafeed 60
sector investigating alternative lipid sources. 61
Page 5
4
The partial and complete replacement of marine ingredients with agricultural 62
plant products, mainly of oilseed origin, has been performed in salmon without any 63
detrimental effects on growth performance or fish health (e.g. Bell, Henderson, 64
Tocher & Sargent, 2004; Bell, McGhee, Dick & Tocher, 2005). Such substitution 65
reduces the levels of undesirable POPs (Bell et al., 2005; Bell, Dick, Strachan, Guy, 66
Berntssen & Sprague, 2012; Berntssen et al., 2010a). Conversely, since the fatty acid 67
composition of fish tissue reflects that of the diet (Sargent, Tocher and Bell, 2002), 68
increasing the vegetable content in aquafeeds reduces the favourable LC-PUFA levels 69
abundant in fish oils, thereby compromising the overall nutritional quality of the final 70
product. Finishing diets can be employed to restore flesh n-3 LC-PUFA levels in 71
vegetable fed fish, although this still relies upon the inclusion of fish oils (Bell et al., 72
2004; 2012), albeit at the risk of increasing POP levels in a previously low 73
contaminated product (Bell et al., 2005, 2012). Since marine fish lack the conversion 74
pathways to efficiently produce EPA and DHA at appreciable levels, these essential 75
fatty acids must be obtained through the diet (Sargent et al., 2002). 76
Marine microalgae are primary producers of n-3 LC-PUFA, and are therefore a 77
promising alternative to the traditional marine derived ingredients of fish feed. 78
Several species have been identified as potential sources, among which the 79
thraustochytrids have been preferred due to their ease for large-scale heterotrophic 80
cultivation under controlled conditions to produce a high lipid product rich in n-3 LC-81
PUFA (Lewis, Nichols & McMeekin, 1999; Ratledge, 2005). Furthermore, unlike 82
crude oils and oilseeds, algal biomass produced by fermentation is generally free 83
from environmental contaminants and heavy metals (Ratledge, 2005). Schizochytrium 84
sp. is a fast growing thraustochytrid microalgae, rich in DHA, with a relatively simple 85
culture process compared to other single-cell microalgae (Ganuza, Benítez-Santana, 86
Page 6
5
Atalah, Vega-Orellana, Ganga & Izquierdo, 2008; Lewis et al. 1999). Subsequently, 87
the aquaculture industry has investigated the potential of thraustochytrids, particularly 88
Schizochytrium sp. in either dried biomass or oil extracted form, as an alternative 89
lipid source in enriching zooplankton for feeding to finfish larvae (Barclay & Zeller, 90
1996), supplementing channel catfish diets, Ictalurus punctatus, (Li, Robinson, 91
Tucker, Manning & Khoo, 2009), or as replacement for fish oils in diets for sea 92
bream, Sparus aurata (Ganuza et al., 2008), and Atlantic salmon (Carter, Bransden, 93
Lewis & Nichols, 2003; Miller, Nichols & Carter, 2007). However, to date no such 94
studies have been performed in post-smolt salmon to assess Schizochytrium sp. 95
inclusion as a potential replacement for fish oil in grow-out feeds and its effects on 96
the nutritional quality of the final product. 97
The present study therefore evaluated the replacement of fish oil with a DHA-98
rich algal meal, derived from Schizochytrium sp., at two different inclusion levels (11 99
and 5.5% of diet) on the fatty acid and POP compositions of Atlantic salmon diets 100
and flesh compared to fish fed a fish oil diet of either northern or southern 101
hemisphere origin. 102
103
2. Materials and Methods 104
2.1. Experimental set-up and diets 105
The trial was performed at Marine Harvest’s (Scotland) Feed Trial Unit (Ardnish, 106
Inverness-shire, Scotland) using a commercial strain of 1,700 1+ Atlantic salmon 107
post-smolts. Fish (850 ± 100 g, mean ± SD) were initially stocked into four 125 m3 108
sea pens and acclimatized for 10 weeks during which they were fed a high 109
rapeseed/fish oil (6:1, w/w) preconditioning diet in order to reduce flesh POPs and 110
LC-PUFA levels. Fish (1534 ± 400 g) were then split between twelve pens (130 fish 111
Page 7
6
per pen) and acclimated for one-week prior to the enrichment phase. Triplicate pens 112
were fed one of four diets for 19 weeks consisting of either (a) northern hemisphere 113
fish oil (NFO) as control, (b) southern hemisphere fish oil (SFO), or (c/d) a DHA-rich 114
drum dried Schizochytrium sp. algal meal (AquaGrow Gold®; Advanced 115
BioNutrition, Columbia, MD, USA) at two dietary inclusion levels, 5.5% (5.5AM) or 116
11% (11AM) with 25% and 21% added rapeseed oil respectively. All diets were 117
formulated (Table 1) and produced by BioMar UK (Grangemouth, Scotland). Fish 118
were fed twice daily using automatic feeders with uneaten food collected via waste 119
uplift systems to monitor feed intake. Feed fed, waste feed and the resulting net feed 120
intake were registered daily, as were any mortalities. Fish were reared under natural 121
photoperiod and temperature (range 6.5-13.8oC) for the duration of the trial. At the 122
start and end of the enrichment phase, all fish in each pen were bulk weighed. The 123
specific growth rate (SGR) was calculated as: SGR (%bw.day-1
) = 124
100[ln(WF/WI)/d], where WF and WI are the final and initial weights (g) 125
respectively, and d is the number of days. Thermal growth coefficient (TGC) was 126
calculated as TGC = (WF1/3
-WI1/3
) (1000/DD), where WF and WI are as previously 127
addressed for SGR, and DD is the cumulative daily water temperature (oC) in SW. 128
129
2.2. Sample collection 130
Samples of the precondition and experimental feeds were collected, wrapped in 131
aluminium foil, before placing into sealable polythene bags and stored at -70oC until 132
analysis. Diets were analysed using standard methods to determine crude lipid (acid 133
hydrolysis of soxhlet samples, Teactor Soxtec method); moisture (AOAC, 2000); 134
crude protein (Kjeldahl, calculated as N6.25); Ash (AOAC, 2000) and energy 135
(bomb calorimeter: Gallenkamp Autobomb, calibrated with benzoic acid). 136
Page 8
7
At the end of the preconditioning phase (initial), 4 fish were removed from the 137
cages, anaesthetized and killed by a single blow to the head. Flesh from the 138
Norwegian Quality Cut (NQC) region was removed, wrapped in aluminium foil and 139
stored in sealable polythene bags at -70oC until analysis. Following termination of the 140
enrichment phase, 6 fish per dietary treatment were anaesthetized and killed by a 141
single blow to the head and NQC flesh removed and stored as per initial fish. Fatty 142
acid analysis was performed for individual fish, whereas flesh was pooled from each 143
pen (2 initial, 3 per enrichment treatment) for POPs analysis. The experiment was 144
subjected to ethical approval by the University of Stirling Ethics Committee and 145
carried out in accordance with the UK Animals (Scientific Procedures) Act 1986. 146
147
2.3. Lipid content and total lipid fatty acid composition 148
Total lipid content was determined gravimetrically after extraction of ~1 g tissue 149
or diet by homogenizing in 20 or 36 volumes of ice-cold chloroform/methanol (2:1 150
v/v) respectively, using an Ultra-Turrax tissue disrupter (Fisher Scientific, 151
Loughborough, UK) according to Folch, Lees and Stanley (1957). Non-lipid 152
impurities were isolated by washing with 0.88% (w/v) KCl and the upper aqueous 153
layer removed by aspiration and the lower solvent layer containing the lipid extract 154
dried under oxygen-free nitrogen. 155
Fatty acid methyl esters (FAMEs) from total lipid were prepared by acid-156
catalyzed transmethylation at 50oC for 16h (Christie, 1993). FAME were extracted 157
and purified as described previously (Tocher & Harvie, 1988) and separated and 158
quantified by GC using a Fisons GC-8160 (Thermo Scientific, Milan, Italy) equipped 159
with a 30 m x 0.32 mm i.d. x 0.25 µm ZB-wax column (Phenomenex, Cheshire, UK), 160
‘on column’ injection and flame ionization detection. Hydrogen was used as carrier 161
Page 9
8
gas with initial oven thermal gradient from 50 to 150oC at 40
oC.min
-1 to a final 162
temperature of 230oC at 2
oC.min
-1. Individual FAME were identified by comparison 163
to known standards (Supelco™ 37-FAME mix; Sigma-Aldrich Ltd., Poole, UK) and 164
published data (Tocher & Harvie, 1988). Data were collected and processed using 165
Chromcard for Windows (Version 1.19; Thermoquest Italia S.p.A., Milan, Italy). 166
Fatty acid content per g of tissue was calculated using heptadecanoic acid (17:0) as 167
internal standard. 168
169
2.4. Persistent organic pollution (POP) extraction and clean-up 170
The 29 PCDD/F and DL-PCB congeners with WHO-TEF values (Van den Berg 171
et al., 2006) and nine PBDE congeners (IUPAC numbers 28, 47, 49, 66, 99, 100, 153, 172
154, 183) were targeted in samples as previously described (Sprague, Dick, Medina, 173
Tocher, Bell & Mourente, 2012). Briefly, lipid was extracted from 25 g of diet or 174
freeze-dried tissue (ca. 65 g wet weight) by accelerated solvent extraction 175
(ASE™100; Dionex, Camberley, UK) following addition of 5 ng.ml-1
PBDE119 and 176
2 ng.ml-1
13
C-labelled PCDD/F and PCB internal standards (Wellington Laboratories, 177
Guelph, Ontario, Canada). Sample extracts were loaded for further clean-up and 178
fractionation of analytes using the automated Power-Prep™ system (Fluid 179
Management Systems Inc., Watertown, MA, USA) followed by conditioning of the 180
disposable column series, consisting of multi-layered silica (4 g acid, 2 g base, 1.5 g 181
neutral), basic alumina (8 g) and carbon (2 g). Total run time was 150 min followed 182
by a 40 min decontamination programme. The mono-ortho PCB and PBDE fraction 183
(F1) was eluted in 120 ml isohexane/dichloromethane (1:1, v/v) and the PCDD/F and 184
non-ortho PCB fraction (F2) in 120 ml toluene. Fractions underwent further clean up 185
with F1 transferred to silanized vials containing 150 µl nonane as keeper and 186
Page 10
9
evaporated to 500 or 100 µl prior to analysis for PBDE and mono-ortho PCBs, 187
respectively, and F2 transferred to conical GC autosampler vials containing 10 µl of 188
nonane as keeper and evaporated to 50 or 10 µl prior to analysis for non-ortho PCB 189
and PCDD/F, respectively. 190
191
2.5. Instrumental analysis 192
Mono-, non-ortho PCBs and PCDD/Fs extracts were analysed using a PolarisQ 193
ion trap MS/MS coupled to a Trace GC 2000 (Thermo Finnigan, Bremen, Germany) 194
equipped with a 30 m x 0.25 mm i.d. x 0.25 µm Rxi®-5ms (5% diphenyl, 95% 195
dimethyl polysiloxane) fused-silica capillary column (Thames Restek Ltd., 196
Saunderton, UK). Samples and standards (2 µl) were injected in splitless mode. The 197
GC oven temperature programmes were as reported by Sprague et al. (2012). Helium 198
was used as carrier gas at constant flow (0.8 ml.min-1
). Injector, transfer line and ion 199
source temperatures were maintained at 250, 305 and 250oC, respectively. The MS 200
operated in positive electron ionisation (EI+) mode using automatic gain control with 201
electron energy of 70 eV and emission current of 250 µA. Quantification was based 202
on US Environmental Protection Agency isotopic dilution methods (EPA, 1994, 203
1999). Relative response factors (RRFs) for individual 2,3,7,8-chlorosubstituted 204
PCDD/F and DL-PCB congeners were determined using calibration standards. 205
Xcalibar version 1.3 was used for data acquisition and results processing. 206
PBDEs (1µl) were injected in splitless mode (225oC, 1.5 min) with surge (240 207
kPa) on a Trace GC Ultra equipped with a 30 m x 0.25 mm i.d. x 0.25 m ZB5-MS 208
column (Phenomenex, Cheshire, UK) coupled to a Trace DSQ MS (Thermo 209
Finnigan, Bremen, Germany) operating in negative chemical ion mode (CI-). The GC 210
temperature programme was as previously reported (Sprague et al., 2012). Helium 211
Page 11
10
was used as carrier gas at constant flow (1.2 ml.min-1
) and methane as reagent gas 212
(2.0 ml.min-1
). The MS operated in selective ion monitoring (SIM) mode by 213
monitoring bromide isotope ions (m/z 81 and 79) with dwell time of 80 ms. 214
Quantification of PBDE congeners was performed by congener-specific linear 215
calibration curves (r2 >0.99). Xcalibar version 1.4 was used for data acquisition and 216
results processing. 217
218
2.6. Quality assurance (QA) and quality control (QC) 219
Samples were ran with a procedural blank, a duplicate sample and an ‘in-house’ 220
reference material, consisting of pooled salmon flesh, cross referenced with an 221
external laboratory. Limits of detection (LOD) were determined using a software 222
option for estimating signal-to-noise (S/N) ratio, where limit of quantification (LOQ) 223
was three times LOD (nine times S/N ratio). LOQs were in the range of 0.01-0.03 224
pg.g-1
wet weight (ww) for PCDD/Fs, 0.1-0.5 pg.g-1
ww for non-ortho PCBs, 2.1-3.9 225
pg.g-1
ww for mono-ortho PCBs and 6-48 pg.g-1
ww for PBDEs. Recovery values for 226
PCDD/Fs and DL-PCBs, based on congener-specific response factors of 13
C internal 227
surrogate standard relative to 13
C performance standards (EPA, 1994), were in the 228
range of 76-114%. Percentage recoveries for PBDEs, based on spiked sample matrix 229
with internal standards for all congeners, were in the range of 78-118%. Method 230
performance was further assessed through satisfactory participation of 231
‘Interlaboratory Comparison on Dioxins in Food’ tests organized by the Norwegian 232
Institute for Public Health. Results for PCDD/Fs and DL-PCBs are presented on a 233
WHO-TEQ basis using 2006 TEFs (Van den Berg et al., 2006), although total 234
PCDD/Fs and DL-PCB values are also expressed on 1998 TEFs (Van den Berg et al., 235
1998) for comparative purposes. 236
Page 12
11
237
2.7. Statistical analysis 238
Results are presented as mean and relative standard deviation (%RSD), unless 239
otherwise specified. Statistical analyses were performed using Minitab® v.16.1.0 240
statistical software (Minitab Inc.). Data were assessed for normality with 241
Kolmogorov-Smirnov test and for homogeneity of variances by Bartlett’s test and 242
examination of residual plots and, where necessary, transformed using the natural 243
logarithm or arcsine transformation. Data were compared by a one-way analysis of 244
variance (ANOVA), with replicate cages nested within their dietary treatment groups. 245
Post hoc comparisons were made using Tukey’s test (Zar, 1999). A significance of 246
P<0.05 was applied to all statistical tests performed. 247
248
3. Results and Discussion 249
3.1. Dietary fatty acid and POP compositions 250
The fatty acid compositions of the precondition and enrichment diets are 251
presented in Table 1. Since the aim of the present study was to investigate the effects 252
of the algal-feeds on LC-PUFA levels, fish were first fed a preconditioning feed 253
consisting mainly of rapeseed oil to decrease n-3 LC-PUFA levels. Previous studies 254
using vegetable-based diets have shown a decrease in the levels of flesh EPA and 255
DHA due to the absence of these particular fatty acids in plant-based ingredients 256
(Bell et al., 2004, 2005, 2012; Berntssen et al., 2010a). Thus, the precondition diet 257
was largely comprised of oleic (18:1n-9), linoleic (18:2n-6), palmitic (16:0) and -258
linolenic (18:3n-3) acids accounting for 46, 18, 8 and 7% of total fatty acids, 259
respectively, with relatively low levels of EPA (3.6%) and DHA (2.3%) derived from 260
the minor inclusion of fish oil and meal to maintain basic fish requirements. 261
Page 13
12
Fatty acid compositions for both algal feeds were similar to the precondition diet 262
due to the high inclusion of rapeseed oil. Commercial aquafeeds often incorporate 263
blends of vegetable and fish or other oils to meet the nutritional requirements of the 264
fish being farmed. Furthermore, the extraction of oil from the single cell biomass 265
greatly increases the overall production costs (Miller et al., 2007; Ratledge, 2005), 266
subsequently limiting its use as a sole oil source replacement for fish oil in feeds. 267
Therefore, the present study combined the dried algal biomass with rapeseed oil to 268
increase the essential n-3 LC-PUFA content resulting in a DHA content of 8.1% 269
(11AM) and 5.3% (5.5AM). Additionally, the algal inclusion resulted in higher levels 270
of the n-6 docosapentaenoic acid isomer (DPA; 22:5n-6) than the other feeds. This is 271
a common feature of Schizochytrium sp. production, where approximately 20% of the 272
DHA produced is DPA, a metabolically neutral fatty acid that has no overall effect on 273
DHA uptake (Ratledge, 2005). Dietary lipid of the fish oil treatments, NFO and SFO, 274
on the other hand contained 3-7 times lower levels of 18:1n-9, 18:2n-6 and 18:3n-3 275
than the precon and algal diets. Both diets resembled the nutritional composition of 276
their natural diets being largely characterized by 16:0, 18:1n-9, cetoleic (22:1n-11) 277
and gondoic (20:1n-9) acids. The major PUFA were DHA and EPA with the NFO 278
diet containing a lower EPA (8.0%) and a higher DHA (10.2%) level than the SFO 279
diet (12.3 and 8.4%, respectively), as is commonly observed between oils sourced 280
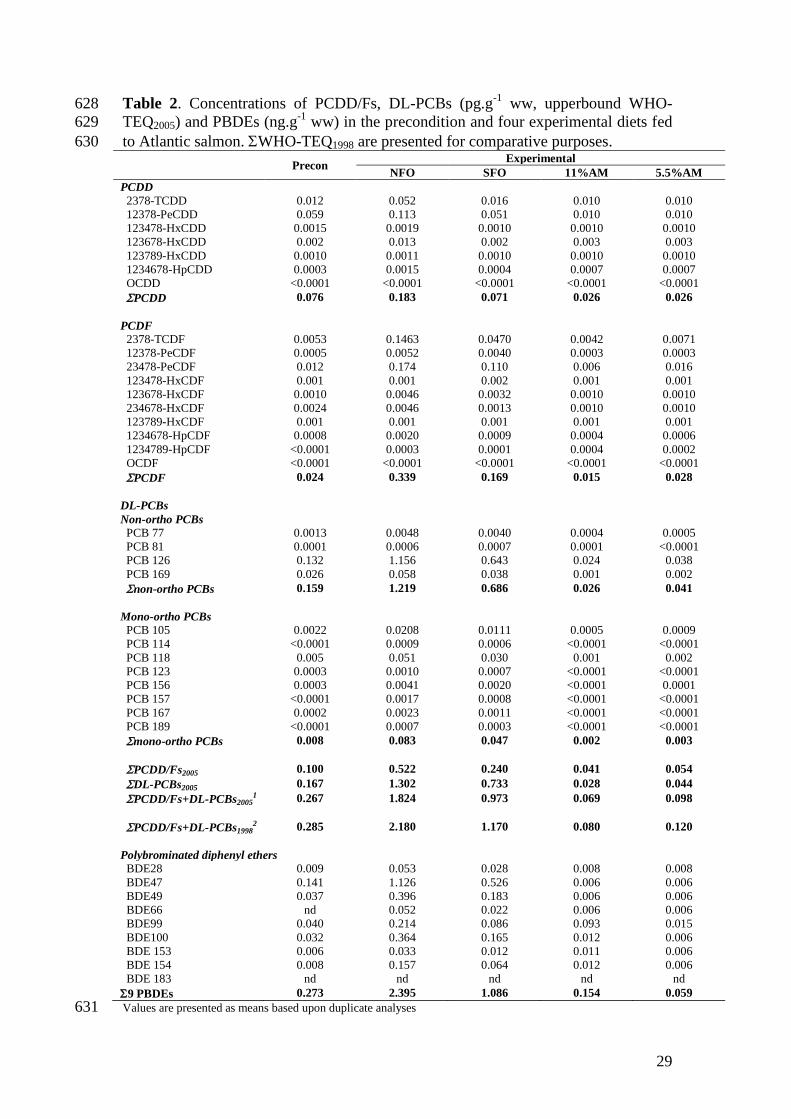
from the northern and southern hemispheres (Sargent et al., 2002). 281
In addition to decreasing LC-PUFA levels, vegetable feeds have also been shown 282
to contain lower POP levels than their fish oil counterparts (Bell et al., 2005, 2012; 283
Berntssen et al., 2010a). Consequently, the vegetable-based precon diet contained 284
lower POP levels (0.267 pgWHO-TEQ.g-1 PCDD/Fs + DL-PCBs, 0.273 ng.g
-1 ww 285
PBDEs) than both fish oil based feeds, irrespective of origin (Table 2). Furthermore, 286
Page 14
13
the SFO diet contained approximately half the level of POPs than the NFO diet 287
(0.973 against 1.824 pgWHO-TEQ.g-1
ww PCDD/Fs + DL-PCBs and 1.086 against 288
2.395 ng.g-1
ww PBDEs, respectively). Southern hemisphere fish oils typically 289
contain lower POP levels than those from the northern hemisphere (Brevik et al., 290
1990), reflecting the differences in pollution levels of marine waters between 291
hemispheres (Fowler, 1990). The NFO control feed however, is in the range reported 292
by Berntssen et al. (2010b) for a fish oil control diet, 2.31 against 2.18 pgWHO-293
TEQ1998.g-1
ww PCDD/Fs + DL-PCBs reported in this study, and is lower than 294
levels reported by Bell et al. (2005) for both a high- and low-fish oil diet (4.1 and 2.3 295
pgWHO-TEQ1998.g-1
ww PCDD/Fs + DL-PCBs respectively). This highlights the 296
awareness and efforts taken by the aquafeed industry in recent years in reducing 297
dietary POP levels. Nevertheless, the lowest POP levels were measured in the two 298
algal feeds (0.080 and 0.120 pgWHO-TEQ.g-1
ww PCDD/Fs + DL-PCBs and 0.154 299
and 0.059 ng.g-1
ww PBDEs, 11AM and 5.5AM respectively) yielding a reduction 300
of >94% compared to the NFO diet and >85% relative to SFO, similar to reductions 301
seen where fish oil based feeds have been decontaminated (Berntssen et al., 2010b; 302
Sprague et al., 2010). Since the algal biomass is produced under controlled conditions 303
the potential for contamination from environmental pollutants and heavy metals is 304
greatly reduced (Ratledge, 2005). The residual amounts of POPs measured in the 305
algal feeds from the present study are therefore most likely contributable to other feed 306
ingredients, most notably fish meal, since this along with fish oil is known to be a 307
major POP contributor in fish feeds (Berntssen et al., 2010a; Jacobs et al., 2002). 308
Equally, the utilization of rapeseed oil in both the precon and algal-based feeds may 309
have resulted in the increase of another lipophilic POP not measured in this study. 310
Polycyclic aromatic hydrocarbons (PAHs) were found to increase in fish flesh when 311
Page 15
14
vegetable oils replaced fish oils, although organochlorine pesticides along with 312
PCDD/Fs, PCBs and PBDEs decreased (Berntssen et al., 2010a). 313
314
3.2. Growth and feed intake 315
The replacement of fish oil with the algal biomass had no significant effect on 316
the overall weight gain of fish (Table 3). However, fish fed the 11AM diet exhibited a 317
minor but significantly lower growth rate than both fish oil treatments but not 5.5AM 318
fed fish. This is in contrast to Carter et al. (2003) and Miller et al. (2007) who found 319
no growth detriment when algal biomass or oil replaced fish oil in the diets of 320
Atlantic salmon parr-smolts. In addition, the food conversion ratio (FCR) for both 321
algal-fed treatments was significantly higher than NFO fed fish but similar to SFO. 322
One possible explanation, particularly at the higher inclusion of algal meal, may be 323
related to digestibility. In a similar study, Reitan, Erikson, Galloway, Berge and 324
Kjørsvik (2012) replaced fish oil with other microalgae species (Nannochloropsis sp., 325
Phaeodactylum tricornutum and Isochrysis galbana) in the diets of salmon and 326
Atlantic cod, Gadus morhua. They found that inclusion levels up to 6% gave good 327
digestibility whereas 12% microalgae inclusion resulted in a reduced digestibility, 328
although appetite remained unchanged. 329
No differences in the health status and/or immune function were recorded (data 330
not presented), consistent with the results of several previous trials where partial or 331
full replacement of fish oils were employed when using fish meal based diets (Bell et 332
al., 2004; Bell et al., 2005). 333
334
3.3. Flesh fatty acid and POP compositions 335
Page 16
15
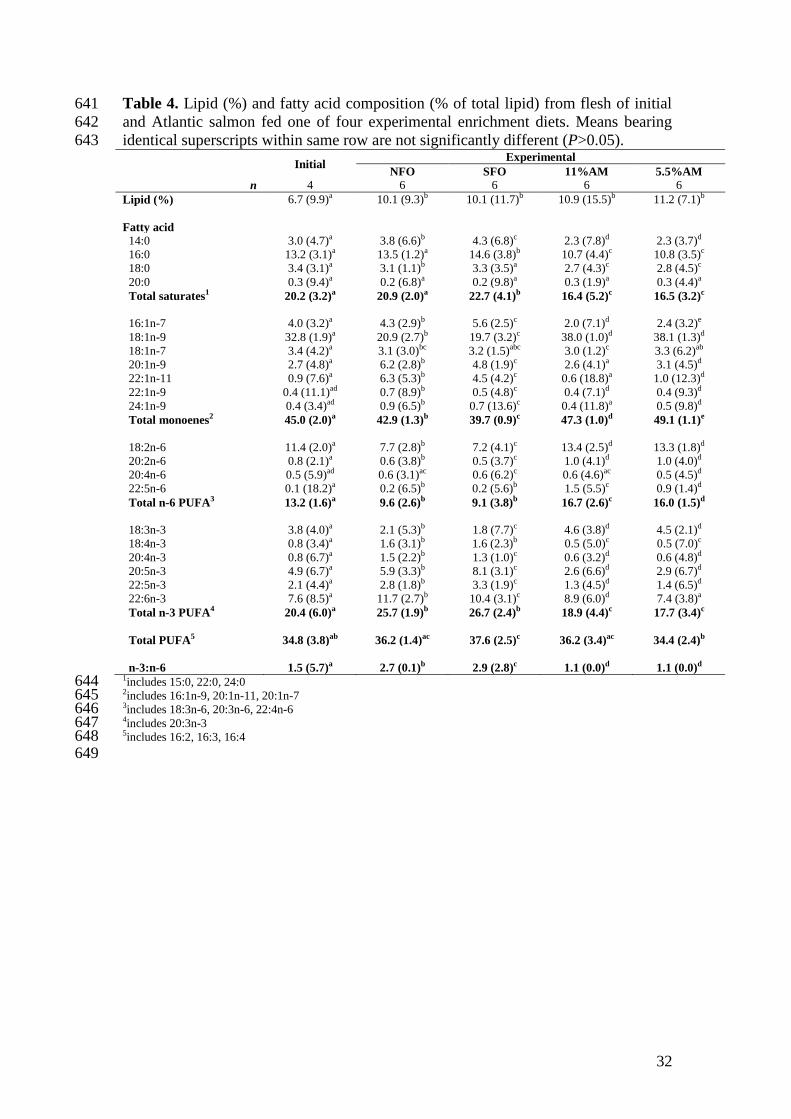
Flesh lipid levels of Atlantic salmon fed the enrichment diets significantly 336
increased from initial levels of 6.7 to 10.1-11.2%, with no significant differences 337
observed between the four dietary treatments (Table 4). Fatty acid compositions of 338
the flesh accurately reflected that of the diet fed, in accordance with results normally 339
found for salmon and other fish species (Sargent et al., 2002). The algal dietary 340
treatments shared similar fatty acid profiles with elevated fillet flesh levels of 18:2n-6 341
and 18:1n-9 compared to both fish oil treatments consistent with results where 342
salmon have been fed diets based on plant oils due to the use of rapeseed oil in the 343
diet (Bell et al., 2012; Miller et al., 2007). The major difference between the algal-fed 344
treatments was a significantly higher level of DHA in the flesh of 11AM fish (8.9%) 345
compared to 5.5AM fish (7.4%), arising from the difference in algal biomass 346
inclusion. However, there was no overall increase in DHA in fish fed 5.5AM relative 347
to initial levels (7.6%). Furthermore, percentage levels of DHA in the 11AM-fed fish 348
were still significantly lower than for fish fed a fish oil based diet (10.4% SFO, 349
11.7% NFO). This would suggest that an algal inclusion level greater than 11% is 350
required to increase flesh DHA above basal levels and to establish similar levels to 351
those found in fish oil based diets. In previous studies, Miller et al. (2007) and Carter 352
et al. (2003) observed greater flesh DHA levels in salmon parr-smolts when 353
Schizochytrium sp. replaced fish oil. However, caution should be applied when 354
comparing results since the former authors utilised the richer oil extract as the sole oil 355
source compared to a fish oil control whereas the latter authors elected to use 10% 356
algal biomass and rapeseed, as in the present study, with a control diet consisting of a 357
blend of vegetable and fish oils. While the latter control diet is more consistent with 358
the formulation of commercial diets currently used by the industry, the present study 359
sought to evaluate the dried algal biomass against a fish oil only diet to assess DHA 360
Page 17
16
levels and is, to our knowledge, the first to trial Schizochytrium sp. as a potential fish 361
oil replacement in grow-out feeds for Atlantic salmon. 362
The most significant, but not unexpected, difference in flesh fatty acid content 363
between dietary treatments is the lack of EPA in fish fed the algal diets (2.6 and 364
2.9%, 11AM and 5.5AM respectively) compared to NFO (5.9%) and SFO (8.1%). 365
This corresponds with results reported in earlier studies where a DHA-rich microalgal 366
sp. replaced fish oil (Carter et al. 2003; Eryalçin et al., 2013; Ganuza et al., 2012; 367
Miller et al., 2007). Moreover, EPA levels in the flesh of both algal treatments 368
significantly decreased as compared to initial levels (4.9%), possibly a result of a 369
dilution effect as flesh lipid increased or a depletion of this essential fatty acid. In 370
general, n-3 LC-PUFA are important for the somatic growth of marine fish with DHA 371
the most highly retained PUFA in a variety of species (Sargent et al., 2002). Ganuza 372
et al. (2012) noted that growth, survival and disease resistance of sea bream larvae 373
was unaffected when fish oil was substituted with Schizochytrium sp. but was altered 374
when all dietary lipid (i.e. fish oil and fish meal) was replaced by algal biomass, a 375
result of a dietary imbalance of fatty acids which was rectified by EPA 376
supplementation. However, the dietary requirements of EPA and DHA in fish are 377
more essential at early life stages (Sargent et al., 2002) and the inclusion of fish meal 378
in the algal feeds would most likely have contained sufficient quantities of EPA for 379
basic metabolic processes. Fish oil is still the main source of EPA, as the complex 380
characteristics of EPA-producing algal species involve high-energy, high-costs and 381
are time consuming (Ratledge, 2005). Nevertheless, since the trial was performed a 382
Schizochytrium sp. algae with a minimum EPA and DHA content of no less than 10 383
and 22%, respectively, has come on to the market (Gray, 2010), primarily targeting 384
the feed/infant formulation sectors. More recently, Ruiz-Lopez, Haslam, Napier and 385
Page 18
17
Sayanova (2014) have successfully produced an alternative transgenic plant source of 386
n-3 LC-PUFA using an oilseed crop Camelina sativa to achieve levels of 12% EPA 387
and 14% DHA, similar to levels found in fish oils which may have potential in 388
aquafeeds (Betancor et al., 2015). 389
The POP concentrations from the flesh of fish fed the experimental diets for 19-390
weeks are presented in Table 5. Berntssen et al. (2010b) stress that feeding trials of 391
short duration (e.g. 1-3 months) yield relatively lower levels of POPs compared to the 392
typical time taken to farm salmon to harvest size, due to flesh POP accumulation over 393
time. At the end of the present study significant differences in flesh POP levels 394
between treatments were observed being in the order of NFO>SFO>11AM/5.5AM 395
(0.803, 0.532, 0.247 and 0.263 pg.WHO-TEQ2005.g-1
ww PCDD/F + DL-PCBs 396
respectively, and 1.233, 0.702, 0.268 and 0.267 ng.g-1
ww PBDEs respectively), 397
reflecting the differences in dietary POP levels. Over the course of a full production 398
cycle the fillet POP levels would further increase, although differences between 399
dietary treatments would be expected to be maintained. Furthermore, the current costs 400
for the algal biomass are similar to or even higher than those for fish meal and fish oil 401
meaning that, at present, it is not practicable to feed the algal-based feeds over a full 402
production cycle. Instead, it may be more economical to include algal diets as a 403
finishing feed by first feeding a vegetable-based feed followed by a short-period of 404
feeding the algal feeds, as performed in the present study. This would help alleviate 405
costs as well as further reduce the POP levels, in contrast to fish oil finishing feeds 406
(Bell et al., 2005; 2012). 407
The lower levels of POPs, specifically PCDD/Fs and DL-PCBs, in the flesh of 408
initial fish (0.156 pg.WHO-TEQ2005.g-1
ww) compared to algal-fed fish, despite the 409
preconditioning diet containing higher POPs levels (0.267, 0.069 and 0.098 pgWHO-410
Page 19
18
TEQ2005.g-1
ww, Precon, 11AM and 5.5AM, respectively), is most likely a result of 411
differences in flesh lipid levels between initial (6.7%) and algal-fed fish (10.9 and 412
11.2%, 11AM and 5.5AM, respectively) affecting the uptake of these lipophilic 413
compounds. Thus, lipid normalized values were 2.33 (initial), 7.95 (NFO), 5.27 414
(SFO), 2.27 (11AM) and 2.35 (5.5AM) pgWHO-TEQ2005.g-1
lw. 415
416
3.4. Nutritional value from salmon consumption: risk-benefit 417
One of the major selling points cited for consuming oily fish, such as salmon, is 418
their unique source of n-3 LC PUFA, EPA and DHA, known to benefit human health 419
(Calder & Yaqoob, 2009). Replacing fish oil with Schizochytrium sp. results in a 130 420
g portion, as advised by the European Food Safety Authority (EFSA, 2005), 421
providing 1.4 and 1.3 g of EPA+DHA, 11AM and 5.5AM respectively (Figure 1), 422
equivalent to 40% (11AM) or 36% (5.5AM) of the suggested 3.5 g weekly intake of 423
EPA+DHA recommended by the International Society for the Study of Fatty Acids 424
and Lipids for optimal cardiac health in adults (ISSFAL, 2004). Nevertheless, this is 425
still significantly less than for fish oil fed salmon, supplying 2.0 g (NFO) and 1.9 g 426
(SFO) EPA+DHA or 57 and 53% of the recommended weekly intake respectively. 427
This difference is attributable to differences in EPA levels, since the Schizochytrium 428
sp. used was a DHA-rich only microalgae product and, as previously discussed, fish 429
oil is still the main source of EPA. Despite this, algal-fed fish still remain a rich 430
source of DHA when fed at the higher inclusion level, with no significant differences 431
between absolute amounts of DHA in 11AM fish (1.1 ± 0.1 g.100g-1
) compared to 432
both NFO (1.2 ± 0.2 ) and SFO (1.1 ± 0.1 g.100g-1
), despite differences in percentage 433
terms. 434
Page 20
19
Fish consumption also represents a major dietary exposure risk to humans 435
through the accumulation of POPs. Accordingly, the European Scientific Committee 436
on Food (SCF) has set a tolerable weekly intake (TWI) level of 14 pg.WHO-TEQ.kg-
437
1 body wt for PCDD/Fs + DL-PCBs (SCF, 2001), equivalent to 980 pg.WHO-TEQ 438
for an adult of 70 kg. Based on the same 130 g servings, NFO-fed fish contribute 439
104.3 ± 8.1 pg.WHO-TEQ, significantly higher than SFO-fed fish (69.1 ± 3.0 440
pg.WHO-TEQ) both of which are significantly higher than algal-fed fish (32.1 ± 2.4 441
and 34.4 ± 3.1 pg.WHO-TEQ, 11AM and 5.5AM respectively). This represents just 442
10.6% (NFO), 7.1% (SFO), 3.3% (11AM) and 3.5% (5.5AM) of the TWI for an adult 443
of 70 kg. Food health authorities typically recommend consuming two portions of 444
fish per week, one of which is oily (EFSA, 2005). From the present study, consuming 445
two portions of either fish oil- or algal-fed fish would contribute 120-130 or 80-90% 446
of the recommended EPA+DHA weekly intake and only 15-20 or 7% of the TWI for 447
PCDD/Fs and DL-PCBs, respectively. These results indicate that previously 448
identified high-risk groups such as young girls, women of child bearing age, and 449
those pregnant and/or breast-feeding can safely consume more than two portions per 450
week without exceeding their TWI, although this does not take into consideration 451
POP intake from other dietary sources. 452
At present, PBDE levels in foods are not limited by legislation although EFSA 453
have issued an advisory TWI of 0.7 g.kg-1
body wt.week-1
, equivalent to 49.0 g 454
PBDE.week-1
for a 70 kg adult (EFSA, 2005). From the present study, a 130 g 455
portion corresponds to 0.16 or 0.09 g PBDEs for the NFO and SFO treatments 456
respectively and 0.03 g PBDEs for both algal treatments, all of which are less than 457
1% of the advisory TWI for PBDEs. 458
459
Page 21
20
4. Conclusion 460
The replacement of fish oil with a DHA-rich Schizochytrium sp. microalgae 461
significantly decreases both dietary and flesh fillet POP levels compared to fish oil 462
based treatments. Moreover, flesh fillet DHA levels can be tailored to similar levels 463
in fish oil fed fish when algal biomass is included at 11% of the diet. However, the 464
absence of EPA in algal-based diets significantly impairs the overall nutritional value, 465
in terms of g EPA+DHA per serving, to the final human consumer. Current and 466
future developments in algal culture technology may provide a final affordable 467
product of nutritional quality in terms of LC-PUFA content as an alternative to fish 468
oil in aquafeeds. 469
470
Conflict of Interest Statement 471
None of the authors have a conflict of interest. 472
473
References 474
AOAC, 2000. Official methods of analysis of AOAC International. 17th
ed. AOAC 475
International, Gaithersburg, Maryland, USA. 476
Barclay, W., Zeller, S. 1996. Nutritional enhancement of n-3 and n-6 fatty acid in 477
rotifers and Artemia nauplii by feeding spray-dried Schizochytrium sp. Journal of 478
the World Aquaculture Society, 314-322. 479
Bell, J.G., Dick, J.R., Strachan, F., Guy, D.R., Berntssen, M.H.G., Sprague, M. 2012. 480
Complete replacement of fish oil with a blend of vegetable oils affects dioxin, 481
dioxin-like polychlorinated biphenyls (PCBs) and polybrominated diphenyl 482
ethers (PBDEs) in 3 Atlantic salmon (Salmo salar) families differing in flesh 483
adiposity. Aquaculture, 324-325, 118-126. 484
Page 22
21
Bell, J.G., Henderson, R.J., Tocher, D.R., Sargent, J.R. 2004. Replacement of dietary 485
fish oil with increasing levels of linseed oil: modification of flesh fatty acid 486
compositions in Atlantic salmon (Salmo salar) using a fish oil finishing diet. 487
Lipids, 39, 223-232. 488
Bell, J.G., McGhee, F., Dick, J.R., Tocher, D.R. 2005. Dioxin and dioxin-like 489
polychlorinated biphenyls (PCBs) in Scottish farmed salmon (Salmo salar): 490
effects of replacement of dietary marine fish oil with vegetable oils. Aquaculture, 491
243, 308-314. 492
Berntssen, M.H.G., Julshamn, K., Lundebye, A.-K., 2010a. Chemical contaminants in 493
aquafeeds and Atlantic salmon (Salmo salar) following the use of traditional- 494
versus alternative feed ingredients. Chemosphere, 78, 637-646. 495
Berntssen, M.H.G., Olsvik, P.A., Torstensen, B.E., Julshamn, K., Midtun, T., 496
Goksøyr, A., Johansen, J., Sigholt, T., Joerum, N., Jakobsen, J.-K., Lundebye, 497
A.-K., Lock, E.-J. 2010b. Reducing persistent organic pollutants while 498
maintaining long chain omega-3 fatty acid in farmed Atlantic salmon using 499
decontaminated fish oils for an entire production cycle. Chemosphere, 81, 242-500
252. 501
Betancor, M.B., Sprague, M., Usher, S., Sayanova, O., Campbell, P.J., Napier, J.A., 502
Tocher, D.R. 2015. A nutritionally-enhanced oil from transgenic Camelina sativa 503
effectively replaces fish oil as a source of eicosapentaenoic acid for fish. 504
Scientific Reports, 5, 8104. 505
Brevik, E.M., Biseth, A., Oehme, M. 1990. Levels of polychlorinated dibenzofurans 506
and dibenzo-p-dioxins in crude and processed fish oils in relation to origin and 507
cleaning method. Organohalogen Compounds, 1, 467-470. 508
Page 23
22
Calder, P.C., Yaqoob, P. 2009. Omega-3 polyunsaturated fatty acids and human 509
health outcomes. Biofactors, 35, 266-272. 510
Carter, C.G., Bransden, M.P., Lewis, T.E., Nichols, P.D. 2003. Potential of 511
Thraustochytrids to partially replace fish oil in Atlantic salmon feeds. Marine 512
Biotechnology, 5, 480-492. 513
Christie, W.W., 1993. Preparation of derivatives of fatty acids for chromatographic 514
analysis, in: Christie, W.W. (Ed.), Advances in Lipid Methodology Two, The 515
Oily Press, Dundee, pp. 69-111. 516
EFSA, 2005. Opinion of the scientific panel on contaminants in the food chain on a 517
request from the European Parliament related to the safety assessment of wild 518
and farmed fish. EFSA J., 236, 1-118. 519
EPA, 1994. Method 1613: Tetra-through octa-chlorinated dioxins and furans by 520
isotope dilution HRGC/HRMS, EPA no. 821B94005, October 1994. Washington 521
DC: Environmental Protection Agency. 522
EPA, 1999. Method 1668: Chlorinated biphenyl congeners in water, soil, sediment, 523
biosolids and tissue by HRGC/HRMS, EPA no. 821R00002, December 1999. 524
Washington DC: Environmental Protection Agency. 525
Eryalçin, K.M., Roo, J., Saleh, R., Atalah, E., Benítez, T., Betancor, M., Hernandez-526
Cruz, M.C., Izquierdo, M. 2013. Fish oil replacement by different microalgal 527
products in microdiets for early weaning of gilthead sea bream (Sparus aurata, 528
L.). Aquaculture Research, 44, 819-828. 529
Folch, J., Lees, M., Sloane Stanley, G.H. 1957. A simple method for the isolation and 530
purification of total lipids from animal tissues. J. Biol. Chem., 226, 497-509. 531
Page 24
23
Fowler, S.W., 1990. Critical review of selected heavy metal and chlorinated 532
hydrocarbon concentrations in the marine environment. Mar. Environ. Res., 29, 533
1-64. 534
Ganuza, E., Benítez-Santana, T., Atalah, E., Vega-Orellana, O., Ganga, R., Izquierdo, 535
M.S. 2008. Cryptocodinium cohnii and Schizochytrium sp. as potential 536
substitutes to fisheries-derived oils from seabream (Sparus aurata) microdiets. 537
Aquaculture, 277, 109-116. 538
Gray, R.J.H. 2010. Application for the authorization of DHA and EPA-rich algal oil 539
from Schizochytrium sp. 540
http://multimedia.food.gov.uk/multimedia/pdfs/dhaoapplicdossier.pdf 541
ISSFAL (2004). International Society for the Study of Fatty Acids and Lipids 542
(ISSFAL) report of the sub-committee on: Recommendations for intake of 543
polyunsaturated fatty acids in healthy adults. http://www.issfal.org/news-544
links/resources/publications/PUFAIntakeReccomdFinalReport.pdf 545
Jacobs, M.N., Covaci, A., Schepens, P. 2002. Investigation of selected persistent 546
organic pollutants in farmed Atlantic salmon (Salmo salar), salmon aquaculture 547
feed, and fish oil components of the feed. Environmental Science and 548
Technology, 36, 2797-2805. 549
Lewis, T.E., Nichols, P.D., McMeekin, T.A. 1999. The biotechnological potential of 550
Thraustochytrids. Marine Biotechnology, 1, 580-587. 551
Li, M.H., Robinson, E.H., Tucker, C.S., Manning, B.B., Khoo, L.2009. Effects of 552
dried algae Schizochytrium sp., a rich source of docosahexaenoic acid, on 553
growth, fatty acid composition, and sensory quality of channel catfish Ictalurus 554
punctatus. Aquaculture, 292, 232-236. 555
Page 25
24
Miller, M.R., Nichols, P.D., Carter, C.G. 2007. Replacement of fish oil with 556
thraustochytrid Schizochytrium sp. L oil in Atlantic salmon parr (Salmo salar L) 557
diets. Comparative Biochemistry and Physiology Part A, 148, 382-392. 558
Ratledge, C. 2005. Single cell oils for the 21st century In: Cohen, Z. and Ratledge, C. 559
(Eds), Single Cell Oils, AOCS Press, Illinois, pp. 1-20. 560
Reitan, K.I., Erikson, T., Galloway, T., Berge, G. and Kjørsvik, E. (2012). Can fish 561
meal and fish oil be replaced by microalgae in feed for Atlantic salmon and 562
Atlantic cod? Aqua 2012, European Aquaculture Society p.91. 563
Ruiz-Lopez, N., Haslam, R.P., Napier, J.A., Sayanova, O. 2014. Successful high-564
level accumulation of fish oil omega-3 long-chain polyunsaturated fatty acids in 565
a transgenic oilseed crop. The Plant Journal, 77, 198-208. 566
Sargent, J.R., Tocher, D.R., Bell, J.G., 2002. The lipids In: Halver, J.E., Hardy, R.W. 567
(Eds), Fish Nutrition, Academic Press, San Diego, pp. 182-246. 568
SACN/COT, 2004. Scientific Advisory Committee on Nutrition (SACN) and 569
Committee on Toxicity (COT). Advice on Fish Consumption: Benefits and 570
Risks. The Stationary Office, Norwich, UK. 571
SCF, 2001. European Scientific Committee on Food (SCF), Opinion of the Scientific 572
Committee on Food on the risk assessment of dioxins and dioxin-like PCBs in 573
food. http://ec.europa.eu/food/fs/sc/scf/out90_en.pdf 574
Sprague, M., Bendiksen, E.Å., Dick, J.R., Strachan, F., Pratoomyot, J., Berntssen, 575
M.H.G., Tocher, D.R., Bell, J.G. 2010. Effects of decontaminated fish oil or a 576
fish and vegetable oil blend on persistent organic pollutant and fatty acid 577
compositions in diet and flesh of Atlantic salmon (Salmo salar). British Journal 578
of Nutrition, 103, 1442-1451. 579
Page 26
25
Sprague, M., Dick, J.R., Medina, A., Tocher, D.R., Bell, J.G., Mourente, G. 2012. 580
Lipid and fatty acid composition, and persistent organic pollutant levels in tissues 581
of migrating Atlantic bluefin tuna (Thunnus thynnus, L.) broodstock. 582
Environmental Pollution, 171, 61-71. 583
Tocher, D.R., Harvie, D.G., 1988. Fatty acid compositions of the major 584
phosphoglycerides from fish neural tissues: (n-3) and (n-6) polyunsaturated fatty 585
acids in rainbow trout (Salmo gairdneri L.) and cod (Gadus morhua) brains and 586
retinas. Fish Physiol. Biochem., 5, 229-239. 587
Van den Berg, M., Birnbaum, L., Bosveld, A.T., Brunström, B., Cook, P., Freeley, 588
M., Giesy, J.P., Hanberg, A., Hasegawa, R., Kennedy, S.W., Kubiak, T., Larsen, 589
J.C., van Leeuwen, F.X., Liem, A.K., Nolt, C., Peterson, R.E., Poellinger, L., 590
Safe, S., Schrenk, D., Tillitt, D., Tysklind, M., Younes, M., Waern, F., 591
Zacharewski, T., 1998. Toxic equivalency factors (TEFs) for PCBs, PCDDs, 592
PCDFs for humans and wildlife. 1998. Environmental Health Perspectives, 106, 593
775-792. 594
Van den Berg, M., Birnbaum, L.S., Denison, M., De Vito, M., Farland, W., Feeley, 595
M., Fiedler, H., Hakansson, H., Hanberg, A., Haws, L., Rose, M., Safe, S., 596
Schrenk, D., Tohyama, C., Tritscher, A., Tuomisto, J., Tysklind, M., Walker, N., 597
Peterson, R.E. 2006. The 2005 World Health Organisation reevaluation of human 598
and mammalian toxic equivalency factors for dioxins and dioxin-like 599
compounds. Toxicological Sciences, 93, 223-241. 600
Zar, J.H. 1999. Biostatistical Analysis, 663 pp. Prentice-Hall International, New 601
Jersey. 602
603
604
Page 27
26
Legend to Figure 605
Figure 1. 606
Risk-benefit association, in terms of PCDD/F+DL-PCBsWHO-TEQ2005 and EPA+DHA 607
intake (mean ± SD), from 130 g consumption of Atlantic salmon fed one of four 608
experimental diets. Dotted line represents the 980 pgWHO-TEQ TWI for an 609
adult of 70 kg and the recommended 3.5 g EPA+DHA weekly intake for optimal 610
cardiac health. Stacked bars represent contribution of DL-PCB and PCDD/Fs and 611
EPA + DHA to respective total values. Initial data are presented for comparative 612
purposes. 613
614
Page 28
27
Figure 1. 615
616
617
Page 29
28
Table 1. Ingredients, proximate composition (g.kg-1
), energy (MJ.kg-1
) and fatty acid 618
content (% of total fatty acids) of the precondition and four experimental diets. 619
620
Precon Experimental
NFO SFO 11%AM 5.5%AM
Component (g.kg-1)
Fish meal 350 270 270 260 260
Vegetable protein concentrates 110 110 110 90 100
Oil seed meals 129 230 230 210 226
DDGS 40 - - - -
Starch sources 151 130 130 120 120
Premixes / micronutrients 7 5 5 5 5
Northern fish oil 32 270 - - -
Southern fish oil - - 270 - -
Rapeseed oil 185 - - 213 246
ABN AquaGrow® Gold - - - 110 55
Analysed Composition (as is)
Lipid 252 300 303 318 313
Protein 393 342 349 336 347
Moisture 75 71 68 59 62
Ash 74 64 64 71 68
Gross energy (MJ.kg-1) 20.6 21.1 21.3 21.4 21.4
Fatty acid (% of total)
14:0 1.7 5.3 6.4 2.6 1.7
16:0 8.4 14.1 16.0 10.3 8.2
18:0 2.2 2.6 2.8 2.0 1.9
Total saturates1 13.2 22.7 25.9 15.9 12.7
16:1n-7 2.1 4.8 6.8 0.7 1.1
18:1n-9 45.5 13.2 11.6 43.4 45.8
18:1n-7 3.5 2.6 2.8 2.5 3.1
20:1n-9 1.4 7.6 5.4 1.2 1.5
22:1n-11 0.5 12.1 8.2 0.1 0.5
Total monoenes2 53.5 43.3 36.8 48.6 52.9
18:2n-6 17.9 5.8 5.2 16.2 17.5
20:2n-6 0.1 0.3 0.2 0.1 0.1
20:4n-6 0.2 0.6 0.7 0.4 0.3
22:5n-6 0.1 0.2 0.2 2.5 1.3
Total n-6 PUFA3 18.2 7.2 6.6 19.2 19.1
18:3n-3 7.0 1.3 1.0 6.1 6.9
18:4n-3 0.5 3.1 2.9 0.2 0.3
20:5n-3 3.6 8.0 12.3 1.2 2.0
22:5n-3 0.4 1.7 1.6 0.2 0.3
22:6n-3 2.3 10.2 8.4 8.1 5.3
Total n-3 PUFA4 13.9 25.4 27.0 16.0 14.8
Total PUFA5 33.3 34.0 37.3 35.5 34.4
n-3:n-6 0.8 3.5 4.1 0.8 0.8
Values are presented as means based upon duplicate analyses 621 1includes 15:0, 20:0, 22:0, 24:0 622 2includes 16:1n-9, 20:1n-11, 20:1n-7, 22:1n-9, 24:1 623 3includes 18:3n-6, 20:2n-6, 20:3n-6, 22:4n-6 624 4includes 20:3n-3, 20:4n-3 625 5includes 16:2, 16:3, 16:4 626
627
Page 30
29
Table 2. Concentrations of PCDD/Fs, DL-PCBs (pg.g-1
ww, upperbound WHO-628
TEQ2005) and PBDEs (ng.g-1
ww) in the precondition and four experimental diets fed 629
to Atlantic salmon. WHO-TEQ1998 are presented for comparative purposes. 630
Precon Experimental
NFO SFO 11%AM 5.5%AM
PCDD
2378-TCDD 0.012 0.052 0.016 0.010 0.010
12378-PeCDD 0.059 0.113 0.051 0.010 0.010
123478-HxCDD 0.0015 0.0019 0.0010 0.0010 0.0010
123678-HxCDD 0.002 0.013 0.002 0.003 0.003
123789-HxCDD 0.0010 0.0011 0.0010 0.0010 0.0010
1234678-HpCDD 0.0003 0.0015 0.0004 0.0007 0.0007
OCDD <0.0001 <0.0001 <0.0001 <0.0001 <0.0001
PCDD 0.076 0.183 0.071 0.026 0.026
PCDF
2378-TCDF 0.0053 0.1463 0.0470 0.0042 0.0071
12378-PeCDF 0.0005 0.0052 0.0040 0.0003 0.0003
23478-PeCDF 0.012 0.174 0.110 0.006 0.016
123478-HxCDF 0.001 0.001 0.002 0.001 0.001
123678-HxCDF 0.0010 0.0046 0.0032 0.0010 0.0010
234678-HxCDF 0.0024 0.0046 0.0013 0.0010 0.0010
123789-HxCDF 0.001 0.001 0.001 0.001 0.001
1234678-HpCDF 0.0008 0.0020 0.0009 0.0004 0.0006
1234789-HpCDF <0.0001 0.0003 0.0001 0.0004 0.0002
OCDF <0.0001 <0.0001 <0.0001 <0.0001 <0.0001
PCDF 0.024 0.339 0.169 0.015 0.028
DL-PCBs
Non-ortho PCBs
PCB 77 0.0013 0.0048 0.0040 0.0004 0.0005
PCB 81 0.0001 0.0006 0.0007 0.0001 <0.0001
PCB 126 0.132 1.156 0.643 0.024 0.038
PCB 169 0.026 0.058 0.038 0.001 0.002
non-ortho PCBs 0.159 1.219 0.686 0.026 0.041
Mono-ortho PCBs
PCB 105 0.0022 0.0208 0.0111 0.0005 0.0009
PCB 114 <0.0001 0.0009 0.0006 <0.0001 <0.0001
PCB 118 0.005 0.051 0.030 0.001 0.002
PCB 123 0.0003 0.0010 0.0007 <0.0001 <0.0001
PCB 156 0.0003 0.0041 0.0020 <0.0001 0.0001
PCB 157 <0.0001 0.0017 0.0008 <0.0001 <0.0001
PCB 167 0.0002 0.0023 0.0011 <0.0001 <0.0001
PCB 189 <0.0001 0.0007 0.0003 <0.0001 <0.0001
mono-ortho PCBs 0.008 0.083 0.047 0.002 0.003
PCDD/Fs2005 0.100 0.522 0.240 0.041 0.054
DL-PCBs2005 0.167 1.302 0.733 0.028 0.044
PCDD/Fs+DL-PCBs20051 0.267 1.824 0.973 0.069 0.098
PCDD/Fs+DL-PCBs19982 0.285 2.180 1.170 0.080 0.120
Polybrominated diphenyl ethers BDE28 0.009 0.053 0.028 0.008 0.008
BDE47 0.141 1.126 0.526 0.006 0.006
BDE49 0.037 0.396 0.183 0.006 0.006
BDE66 nd 0.052 0.022 0.006 0.006
BDE99 0.040 0.214 0.086 0.093 0.015
BDE100 0.032 0.364 0.165 0.012 0.006
BDE 153 0.006 0.033 0.012 0.011 0.006
BDE 154 0.008 0.157 0.064 0.012 0.006
BDE 183 nd nd nd nd nd
9 PBDEs 0.273 2.395 1.086 0.154 0.059
Values are presented as means based upon duplicate analyses 631
Page 31
30
nd – not detected 632 1TEF2005, Van den Berg et al. (2006) 633 2TEF1998, Van den Berg et al. (1998) 634 635
Page 32
31
Table 3. Growth performance of Atlantic salmon fed experimental diets for 19 636
weeks. Means (%RSD) bearing identical superscripts are not significantly different 637
(P>0.05). 638 NFO SFO 11%AM 5.5%AM
Initial mass (g) 1544 (1.0) 1527 (1.1) 1543 (1.2) 1522 (2.9)
Final mass (g) 3245 (2.0) 3220 (2.7) 3030 (4.9) 3170 (3.7)
Weight gain (g) 1701 (3.4) 1692 (4.2) 1487 (8.9) 1648 (4.7)
SGR (% bw.day-1) 0.59 (2.0)a 0.59 (2.6)a 0.53 (5.7)b 0.58 (1.7)ab
Total feed consumption (kg) 251.2 (2.1) 258.7 (2.5) 254.5 (1.3) 248.9 (0.8)
FCR 1.28 (3.9)a 1.35 (1.9)ab 1.42 (1.9)b 1.40 (2.5)b
639
640
Page 33
32
Table 4. Lipid (%) and fatty acid composition (% of total lipid) from flesh of initial 641
and Atlantic salmon fed one of four experimental enrichment diets. Means bearing 642
identical superscripts within same row are not significantly different (P>0.05). 643
Initial Experimental
NFO SFO 11%AM 5.5%AM
n 4 6 6 6 6
Lipid (%) 6.7 (9.9)a 10.1 (9.3)b 10.1 (11.7)b 10.9 (15.5)b 11.2 (7.1)b
Fatty acid
14:0 3.0 (4.7)a 3.8 (6.6)b 4.3 (6.8)c 2.3 (7.8)d 2.3 (3.7)d
16:0 13.2 (3.1)a 13.5 (1.2)a 14.6 (3.8)b 10.7 (4.4)c 10.8 (3.5)c
18:0 3.4 (3.1)a 3.1 (1.1)b 3.3 (3.5)a 2.7 (4.3)c 2.8 (4.5)c
20:0 0.3 (9.4)a 0.2 (6.8)a 0.2 (9.8)a 0.3 (1.9)a 0.3 (4.4)a
Total saturates1 20.2 (3.2)a 20.9 (2.0)a 22.7 (4.1)b 16.4 (5.2)c 16.5 (3.2)c
16:1n-7 4.0 (3.2)a 4.3 (2.9)b 5.6 (2.5)c 2.0 (7.1)d 2.4 (3.2)e
18:1n-9 32.8 (1.9)a 20.9 (2.7)b 19.7 (3.2)c 38.0 (1.0)d 38.1 (1.3)d
18:1n-7 3.4 (4.2)a 3.1 (3.0)bc 3.2 (1.5)abc 3.0 (1.2)c 3.3 (6.2)ab
20:1n-9 2.7 (4.8)a 6.2 (2.8)b 4.8 (1.9)c 2.6 (4.1)a 3.1 (4.5)d
22:1n-11 0.9 (7.6)a 6.3 (5.3)b 4.5 (4.2)c 0.6 (18.8)a 1.0 (12.3)d
22:1n-9 0.4 (11.1)ad 0.7 (8.9)b 0.5 (4.8)c 0.4 (7.1)d 0.4 (9.3)d
24:1n-9 0.4 (3.4)ad 0.9 (6.5)b 0.7 (13.6)c 0.4 (11.8)a 0.5 (9.8)d
Total monoenes2 45.0 (2.0)a 42.9 (1.3)b 39.7 (0.9)c 47.3 (1.0)d 49.1 (1.1)e
18:2n-6 11.4 (2.0)a 7.7 (2.8)b 7.2 (4.1)c 13.4 (2.5)d 13.3 (1.8)d
20:2n-6 0.8 (2.1)a 0.6 (3.8)b 0.5 (3.7)c 1.0 (4.1)d 1.0 (4.0)d
20:4n-6 0.5 (5.9)ad 0.6 (3.1)ac 0.6 (6.2)c 0.6 (4.6)ac 0.5 (4.5)d
22:5n-6 0.1 (18.2)a 0.2 (6.5)b 0.2 (5.6)b 1.5 (5.5)c 0.9 (1.4)d
Total n-6 PUFA3 13.2 (1.6)a 9.6 (2.6)b 9.1 (3.8)b 16.7 (2.6)c 16.0 (1.5)d
18:3n-3 3.8 (4.0)a 2.1 (5.3)b 1.8 (7.7)c 4.6 (3.8)d 4.5 (2.1)d
18:4n-3 0.8 (3.4)a 1.6 (3.1)b 1.6 (2.3)b 0.5 (5.0)c 0.5 (7.0)c
20:4n-3 0.8 (6.7)a 1.5 (2.2)b 1.3 (1.0)c 0.6 (3.2)d 0.6 (4.8)d
20:5n-3 4.9 (6.7)a 5.9 (3.3)b 8.1 (3.1)c 2.6 (6.6)d 2.9 (6.7)d
22:5n-3 2.1 (4.4)a 2.8 (1.8)b 3.3 (1.9)c 1.3 (4.5)d 1.4 (6.5)d
22:6n-3 7.6 (8.5)a 11.7 (2.7)b 10.4 (3.1)c 8.9 (6.0)d 7.4 (3.8)a
Total n-3 PUFA4 20.4 (6.0)a 25.7 (1.9)b 26.7 (2.4)b 18.9 (4.4)c 17.7 (3.4)c
Total PUFA5 34.8 (3.8)ab 36.2 (1.4)ac 37.6 (2.5)c 36.2 (3.4)ac 34.4 (2.4)b
n-3:n-6 1.5 (5.7)a 2.7 (0.1)b 2.9 (2.8)c 1.1 (0.0)d 1.1 (0.0)d 1includes 15:0, 22:0, 24:0 644 2includes 16:1n-9, 20:1n-11, 20:1n-7 645 3includes 18:3n-6, 20:3n-6, 22:4n-6 646 4includes 20:3n-3 647 5includes 16:2, 16:3, 16:4 648
649
Page 34
33
Table 5. Concentrations of PCDD/Fs, DL-PCBs (pg.g-1
ww, upperbound WHO-650
TEQ2005) and PBDEs (ng.g-1
ww) in fillet flesh of initial and experimental fed 651
Atlantic salmon. mean values (%RSD) bearing identical superscript lettering within 652
same row are not statistically different (P>0.05). WHO-TEQ1998 are presented for 653
comparative purposes. 654
Initial Experimental
NFO SFO 11%AM 5.5%AM
n 2 3 3 3 3
PCDD
2378-TCDD 0.010 (0) 0.017 (19) 0.015 (26) 0.010 (0) 0.010 (0)
12378-PeCDD 0.010 (0) 0.032 (27) 0.029 (36) 0.011 (16) 0.012 (29)
123478-HxCDD 0.0015 (44) 0.0010 (0) 0.0010 (0) 0.0010 (0) 0.0010 (0)
123678-HxCDD 0.001 (0) 0.0013 (28) 0.001 (0) 0.0011 (16) 0.0013 (4)
123789-HxCDD 0.0010 (0) 0.0010 (0) 0.001 (0) 0.001 (0) 0.001 (0)
1234678-HpCDD 0.0005 (24) 0.0001 (17) 0.0001 (23) 0.0002 (54) 0.0001 (17)
OCDD <0.0001 <0.0001 <0.0001 <0.0001 <0.0001
PCDD 0.024 (3)a 0.052 (22)b 0.047 (28)b 0.024 (8)a 0.025 (13)a
PCDF
2378-TCDF 0.0015 (15) 0.049 (29) 0.025 (44) 0.015 (3) 0.018 (3)
12378-PeCDF 0.0011 (63) 0.0017 (14) 0.0009 (11) 0.0004 (44) 0.0006 (14)
23478-PeCDF 0.026 (29) 0.054 (10) 0.034 (21) 0.012 (22) 0.016 (12)
123478-HxCDF 0.001 (0) 0.001 (0) 0.001 (0) 0.001 (0) 0.001 (0)
123678-HxCDF 0.0012 (24) 0.0010 (0) 0.0010 (0) 0.0010 (0) 0.0011 (20)
234678-HxCDF 0.0010 0.0011 (16) 0.0011 (9) 0.0010 (0) 0.0010 (11)
123789-HxCDF 0.001 (0) 0.001 (0) 0.001 (0) 0.001 (0) 0.0012 (29)
1234678-HpCDF 0.0001 0.0002 (33) 0.0003 (13) 0.0007 (68) 0.0001 (9)
1234789-HpCDF 0.0002 (42) 0.0001 (0) 0.0001 (0) 0.0001 (0) 0.0001 (0)
OCDF <0.0001 <0.0001 <0.0001 <0.0001 <0.0001
PCDF 0.033 (25)a 0.109 (8)b 0.064 (28)c 0.032 (7)a 0.039 (7)ac
DL-PCBs
Non-ortho PCBs
PCB 77 0.0007 (17) 0.0020 (4) 0.0017 (9) 0.0022 (76) 0.0008 (10)
PCB 81 <0.0001 0.0002 (12) 0.0003 (24) 0.0003 (46) <0.0001
PCB 126 0.080 (37) 0.576 (9) 0.379 (5) 0.169 (7) 0.181 (9)
PCB 169 0.003 (25) 0.023 (3) 0.013 (27) 0.005 (31) 0.006 (18)
non-ortho PCBs 0.084 (36)a 0.601 (8)b 0.394 (5)c 0.177 (8)d 0.188 (9)d
Mono-ortho PCBs
PCB 105 0.0034 (6) 0.0101(4) 0.0065 (11) 0.0035 (32) 0.0027 (13)
PCB 114 0.0002 (25) 0.0005 (3) 0.0003 (11) 0.0002 (47) 0.0001 (17)
PCB 118 0.0086 (10) 0.025 (3) 0.017 (7) 0.009 (28) 0.007 (12)
PCB 123 0.0004 (15) 0.0003 (14) 0.0002 (40) 0.0002 (76) <0.0001
PCB 156 0.0011 (6) 0.0022 (9) 0.0015 (13) 0.0008 (8) 0.0007 (10)
PCB 157 0.0003 (7) 0.0009 (13) 0.0005 (8) 0.0003 (1) 0.0003 (20)
PCB 167 0.0005 (12) 0.0013 (10) 0.0008 (8) 0.0004 (9) 0.0004 (11)
PCB 189 0.0001 (2) 0.0004 (4) 0.0002 (9) <0.0001 <0.0001
mono-ortho PCBs 0.015 (8)a 0.041 (4)b 0.027 (8)c 0.014 (28)a 0.011 (11)a
PCDD/Fs2005 0.057 (16)a 0.161(8)b 0.111 (13)c 0.056 (4)ad 0.064 (8)d
DL-PCBs2005 0.099 (32)a 0.642 (8)b 0.421 (5)c 0.191 (10)a 0.199 (9)a
PCDD/Fs+DL-PCBs20051 0.156 (14)a 0.803(8)b 0.532 (4)c 0.247 (8)d 0.263 (9)d
PCDD/Fs+DL-PCBs19982 0.227 (9)a 0.963 (7)b 0.638 (4)c 0.301 (9)d 0.312 (9)d
Polybrominated diphenyl ethers BDE28 0.016 (14) 0.036 (5) 0.023 (5) 0.009 (11) 0.007 (8)
BDE47 0.250 (8) 0.610 (6) 0.365 (7) 0.141 (3) 0.144 (6)
BDE49 0.059 (10) 0.173 (5) 0.100 (9) 0.034 (5) 0.033 (3)
BDE66 0.010 (7) 0.030 (5) 0.015 (12) 0.007 (0) 0.006 (0)
BDE99 0.041 (14) 0.113 (5) 0.057 (11) 0.029 (7) 0.027 (4)
BDE100 0.047 (8) 0.176 (4) 0.090 (7) 0.027 (8) 0.028 (7)
BDE 153 0.008 (28) 0.017 (7) 0.009 (6) 0.006 (0) 0.007 (0)
Page 35
34
BDE 154 0.025 (14) 0.078 (2) 0.043 (7) 0.015 (4) 0.015 (4)
BDE 183 nd nd nd nd nd
9 PBDEs 0.456 (10)a 1.233 (5)b 0.702 (8)c 0.268 (3)d 0.267 (4)d
nd - not detected 655 1TEF2005, Van den Berg et al. (2006) 656 2TEF1998, Van den Berg et al. (1998) 657 658