31
BUSINESS PROCESS IMPROVEMENT EXAMPLES ActiveModeler Avantage Business Process Improvement Examples Business Process Improvement examples Page 1
| Date post: | 16-Apr-2018 |
| Category: |
Documents |
| Upload: | nguyenkhanh |
| View: | 218 times |
| Download: | 3 times |
B U S I N E S S P R O C E S S I M P R O V E M E N T E X A M P L E S
ActiveModeler Avantage
Business Process Improvement Examples
Business Process Improvement examples Page 1
B U S I N E S S P R O C E S S I M P R O V E M E N T E X A M P L E S
DISCLAIMER: The names of files, values and reports in this Guide may differ slightly from
those in the example files supplied with your software.
The information in this document is subject to change without notice. Companies, names and
data used in examples herein are fictitious unless otherwise noted. No part of this document may
be reproduced or transmitted in any form or by any means, electronic or mechanical, for any
purpose, without the express written permission of the copyright holder.
©2007 Kaisha-Tec Co, Ltd. All Rights Reserved.
Business Process Improvement examples Page 2

B U S I N E S S P R O C E S S I M P R O V E M E N T E X A M P L E S
Contents.
The briefing.............................................................................................................. 6
The “as-is” diagrams .............................................................................................. 7
Credit(as-is).......................... .................................................................................... 7
Receiving and Error Handling ................................................................................ 12
Card Production process ........................................................................................ 13
New Applications Stage2 ....................................................................................... 14
Credit(as-is). Volumes and Costs Report ............................................................... 15
Receiving and Error Handling. Volumes and Costs Report ................................... 17
Card Production process. Volumes and Costs Report ............................................ 19
New Applications Stage2. Volumes and Costs Report .......................................... 21
The “to-be”diagrams (improved) ....................................................................... 23
Credit(Improved) .................................................................................................... 23
Receiving and Error Handling(Improved)............................................................... 24
Other Credit diagrams ............................................................................................. 25
Credit(Improved). Volumes and Costs Report ....................................................... 26
Receiving and Error Handling(Improved). Volumes and Costs Report ................. 27
Study results .......................................................................................................... 29
Bankcorp Banking Application Processing ....... .................................................... 29
Receiving and Error Handling Sub-process ............................................................ 29
Conclusions ............................................................................................................. 30
Business Process Improvement examples Page 3
B U S I N E S S P R O C E S S I M P R O V E M E N T E X A M P L E S
The example files
This document contains examples of Business Process Improvement (BPI)
using ActiveModeler Avantage. While the examples are fictitious, they are
based on reality and situations the KAISHA-Tec team have met in the field.
This example is in a banking system, it analyses flow of work involved with
processing customer applications for Bankcorp Banking Corporation credit
cards.
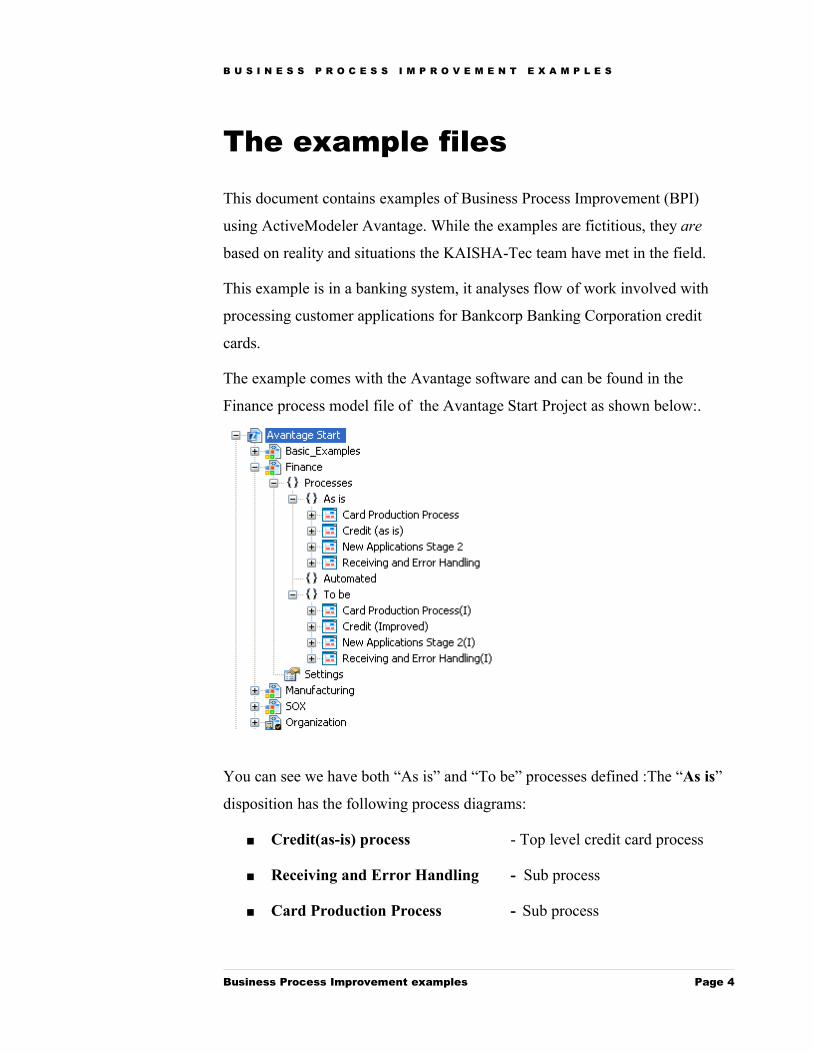
The example comes with the Avantage software and can be found in the
Finance process model file of the Avantage Start Project as shown below:.
You can see we have both “As is” and “To be” processes defined :The “As is”
disposition has the following process diagrams:
Credit(as-is) process - Top level credit card process
Receiving and Error Handling - Sub process
Card Production Process - Sub process
Business Process Improvement examples Page 4

B U S I N E S S P R O C E S S I M P R O V E M E N T E X A M P L E S
New Applications Stage2 - Sub process
The “To be” disposition has the following process diagrams:
Credit(Improved) process - Improved top level credit card
process
Receiving and Error Handling(I) - Improved receiving and error
handling process
Card Production Process(I) - Sub process
New Applications Stage2(I) - Sub process
Business Process Improvement examples Page 5

B U S I N E S S P R O C E S S I M P R O V E M E N T E X A M P L E S
Bankcorp Banking Corp.
The briefing
The Bankcorp Credit Card Processing group had been operating with a weak
management team for many years. During this time, the size of the Card Group
had increased considerably as new products were introduced. However, as old
products declined in popularity, the old processes and associated staff remained
completely as before. There was poor process visibility to management, who
didn’t really understand what was happening in the group.
In addition, the whole processing had stayed largely manual with the computer
system really only used to store data rather than helping with the actual work to
be done. The proliferation of paper due to increased business diversity had also
become difficult to manage. The final straw was a large drop in the actual card
base due to increased competition. This decrease in the number of active card
holders forced the issue and highlighted the urgent need to revitalize the Card
Business in all sectors from Marketing to actual Operational Processing. The
Directors ordered an immediate Operational Process Review, and the
development of a Business Process Improvement (BPI) plan. A BPI team was
rapidly assembled with ActiveModeler Avantage as the analysis tool. During
the analysis, many diagrams were drawn to clarify the operational procedures,
often with surprising results. Inefficiencies which had been submerged for years
were finally brought to the surface. The volume and costing findings were
equally illuminating. What follows is just one of areas which were reviewed,
namely the Card Application process.
Business Process Improvement examples Page 6
B U S I N E S S P R O C E S S I M P R O V E M E N T E X A M P L E S
The “As is” process diagrams
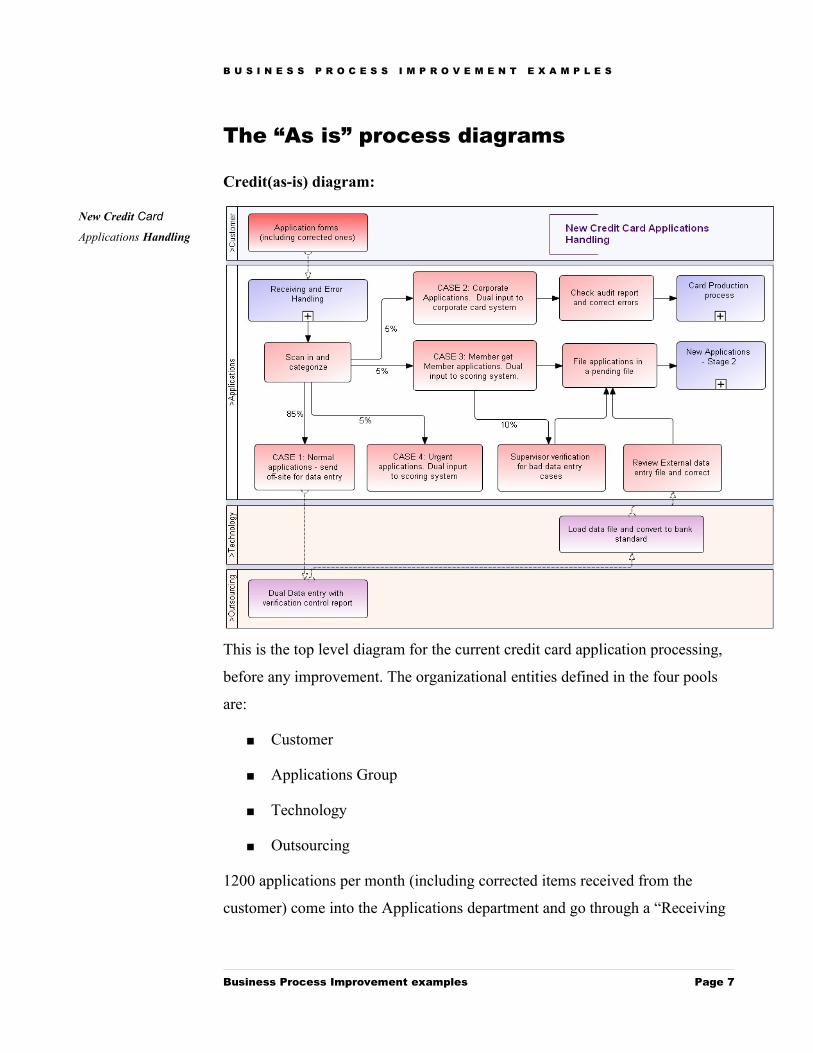
Credit(as-is) diagram:
This is the top level diagram for the current credit card application processing,
before any improvement. The organizational entities defined in the four pools
are:
Customer
Applications Group
Technology
Outsourcing
1200 applications per month (including corrected items received from the
customer) come into the Applications department and go through a “Receiving
Business Process Improvement examples Page 7
New Credit Card
Applications Handling

B U S I N E S S P R O C E S S I M P R O V E M E N T E X A M P L E S
and Error Handling” sub-process. To see this quantity, open the Credit (as is)
diagram, then from the View menu, choose Metrics Inspector. If you click on
the first task as below you will see the Internal generated volume set as 1200.
This volume of transactions now flows from task to task according to the
splitting rules defined in the diagram and any consumption due to rejects etc.
After clicking the “+” indicator of the sub-process object, the sub-process links
to another diagram which is opened, namely the Receiving and Error Handling
diagram.
This shows it is an actual input to the department and enables more informative
reporting when you request a project summary report.
Note also that the “Receiving and Error Handling” process has a monthly
Maximum Volume of 1200 units. This is the maximum volume the sub-process
Business Process Improvement examples Page 8

B U S I N E S S P R O C E S S I M P R O V E M E N T E X A M P L E S
encountered and in this case is the volume it started out. However some
applications were rejected during the subprocess.
If you click the “Scan and categorize” task you will see the volume has been set
automatically to 1080 units, showing that 120 applications were not carried
through from the “Receiving and Error Handling” sub-process. This task takes
15 seconds per item with a total monthly cost $155.17 for all volume(1080
units). The total time is 4hours 30 minutes for all the applications.
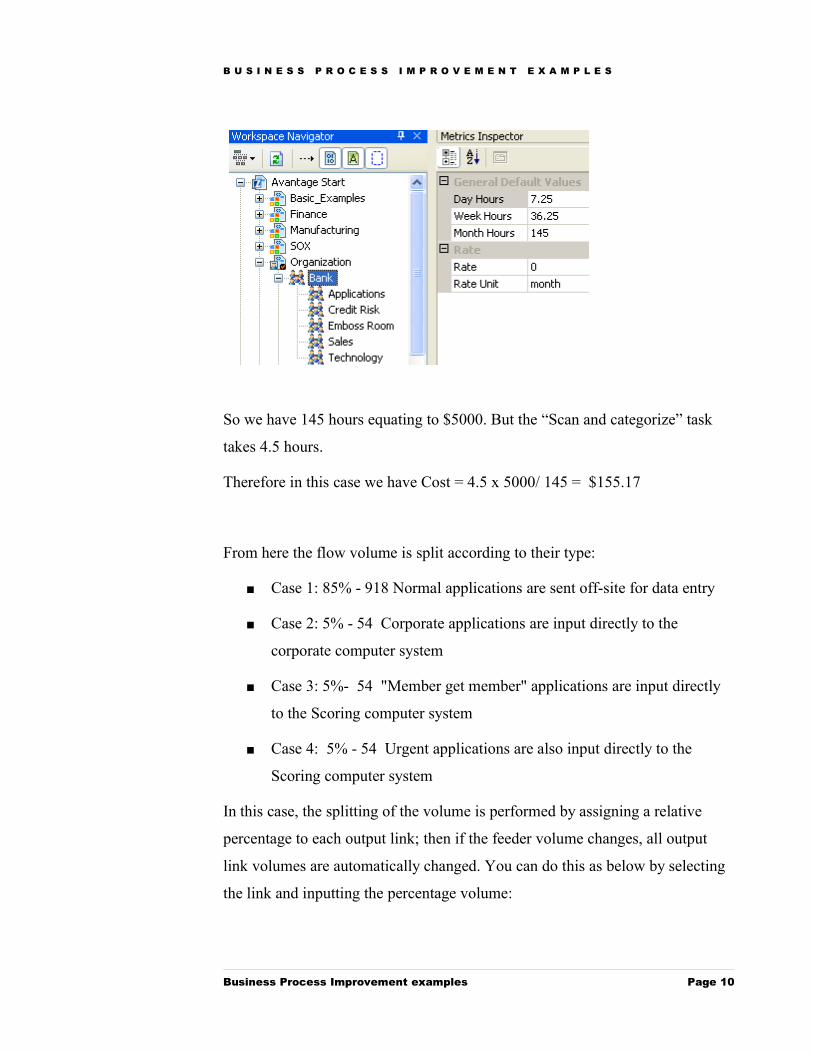
How was this cost figure calculated? We firstly need to check the Organization
tree. Here a figure for the Applications Group as a whole has been defined as
$5000 per month.
Let's know have a look at the working regime. This had been defined at the
higher Bank level, and unless it is again defined in a child entity, this value is
taken for an organization unit.
We can see that the bank operates on a 145 hours per month standard.
Business Process Improvement examples Page 9
B U S I N E S S P R O C E S S I M P R O V E M E N T E X A M P L E S
So we have 145 hours equating to $5000. But the “Scan and categorize” task
takes 4.5 hours.
Therefore in this case we have Cost = 4.5 x 5000/ 145 = $155.17
From here the flow volume is split according to their type:
Case 1: 85% - 918 Normal applications are sent off-site for data entry
Case 2: 5% - 54 Corporate applications are input directly to the
corporate computer system
Case 3: 5%- 54 "Member get member" applications are input directly
to the Scoring computer system
Case 4: 5% - 54 Urgent applications are also input directly to the
Scoring computer system
In this case, the splitting of the volume is performed by assigning a relative
percentage to each output link; then if the feeder volume changes, all output
link volumes are automatically changed. You can do this as below by selecting
the link and inputting the percentage volume:
Business Process Improvement examples Page 10
B U S I N E S S P R O C E S S I M P R O V E M E N T E X A M P L E S
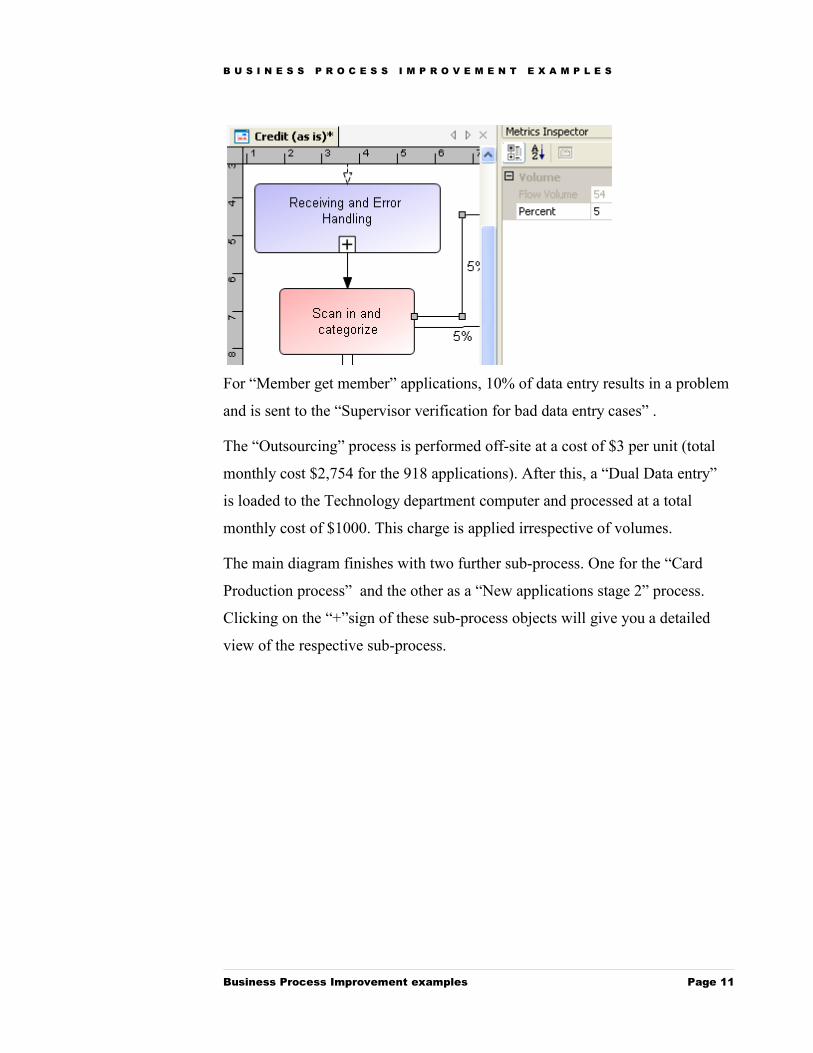
For “Member get member” applications, 10% of data entry results in a problem
and is sent to the “Supervisor verification for bad data entry cases” .
The “Outsourcing” process is performed off-site at a cost of $3 per unit (total
monthly cost $2,754 for the 918 applications). After this, a “Dual Data entry”
is loaded to the Technology department computer and processed at a total
monthly cost of $1000. This charge is applied irrespective of volumes.
The main diagram finishes with two further sub-process. One for the “Card
Production process” and the other as a “New applications stage 2” process.
Clicking on the “+”sign of these sub-process objects will give you a detailed
view of the respective sub-process.
Business Process Improvement examples Page 11
B U S I N E S S P R O C E S S I M P R O V E M E N T E X A M P L E S
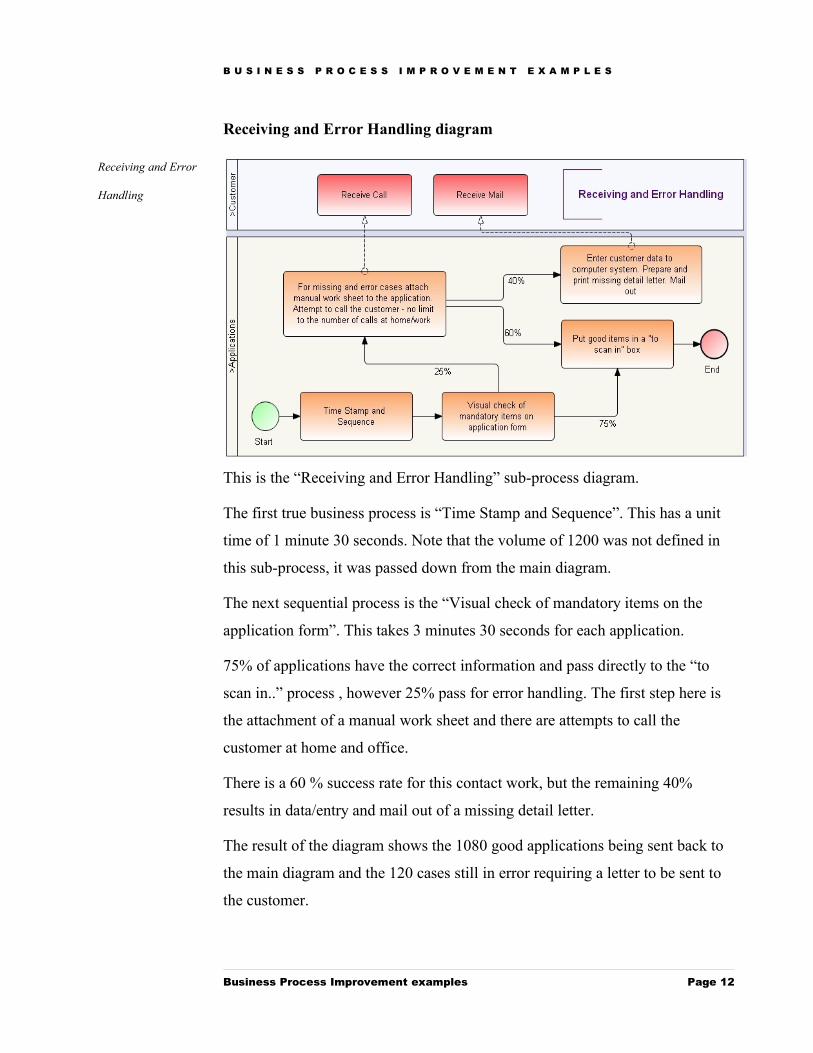
Receiving and Error Handling diagram
This is the “Receiving and Error Handling” sub-process diagram.
The first true business process is “Time Stamp and Sequence”. This has a unit
time of 1 minute 30 seconds. Note that the volume of 1200 was not defined in
this sub-process, it was passed down from the main diagram.
The next sequential process is the “Visual check of mandatory items on the
application form”. This takes 3 minutes 30 seconds for each application.
75% of applications have the correct information and pass directly to the “to
scan in..” process , however 25% pass for error handling. The first step here is
the attachment of a manual work sheet and there are attempts to call the
customer at home and office.
There is a 60 % success rate for this contact work, but the remaining 40%
results in data/entry and mail out of a missing detail letter.
The result of the diagram shows the 1080 good applications being sent back to
the main diagram and the 120 cases still in error requiring a letter to be sent to
the customer.
Business Process Improvement examples Page 12
Receiving and Error
Handling
B U S I N E S S P R O C E S S I M P R O V E M E N T E X A M P L E S
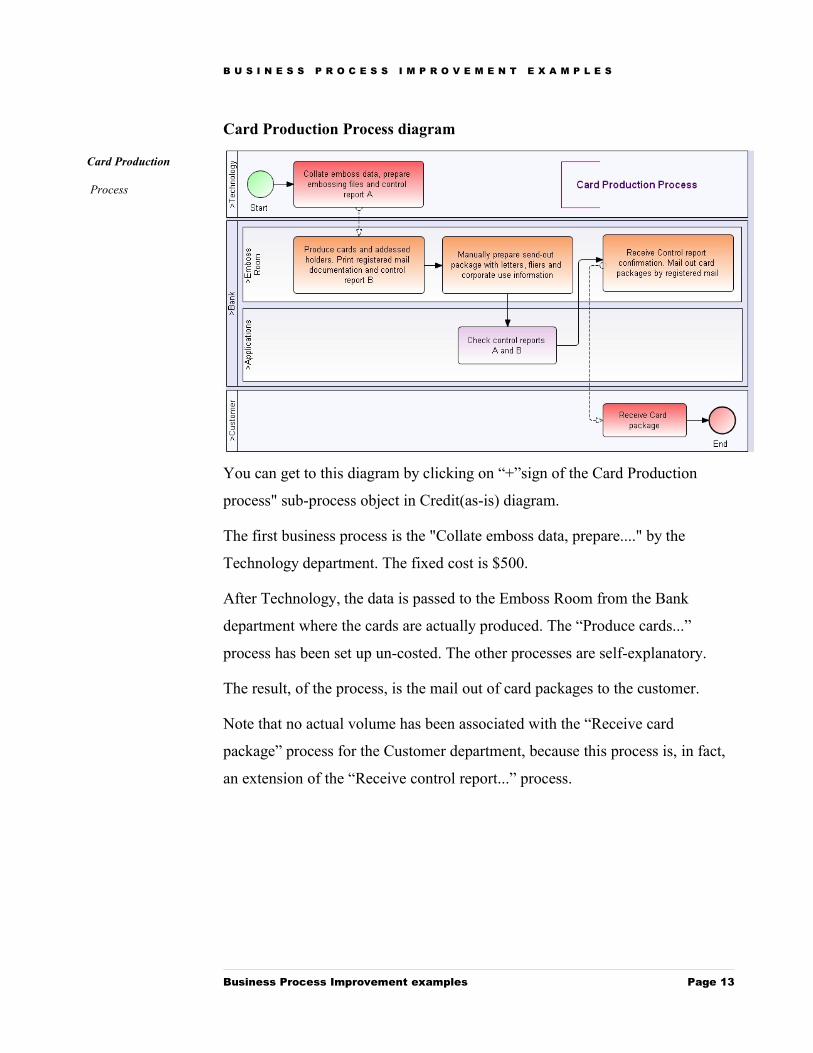
Card Production Process diagram
You can get to this diagram by clicking on “+”sign of the Card Production
process" sub-process object in Credit(as-is) diagram.
The first business process is the "Collate emboss data, prepare...." by the
Technology department. The fixed cost is $500.
After Technology, the data is passed to the Emboss Room from the Bank
department where the cards are actually produced. The “Produce cards...”
process has been set up un-costed. The other processes are self-explanatory.
The result, of the process, is the mail out of card packages to the customer.
Note that no actual volume has been associated with the “Receive card
package” process for the Customer department, because this process is, in fact,
an extension of the “Receive control report...” process.
Business Process Improvement examples Page 13
Card Production
Process
B U S I N E S S P R O C E S S I M P R O V E M E N T E X A M P L E S
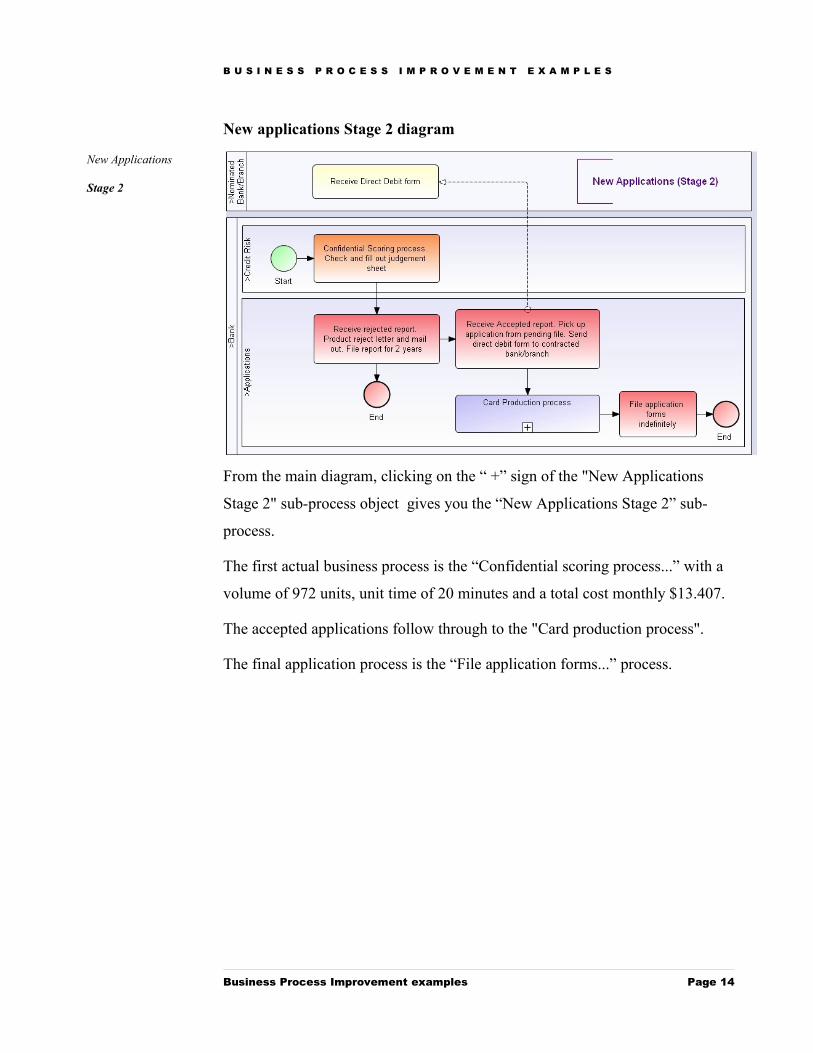
New applications Stage 2 diagram
From the main diagram, clicking on the “ +” sign of the "New Applications
Stage 2" sub-process object gives you the “New Applications Stage 2” sub-
process.
The first actual business process is the “Confidential scoring process...” with a
volume of 972 units, unit time of 20 minutes and a total cost monthly $13.407.
The accepted applications follow through to the "Card production process".
The final application process is the “File application forms...” process.
Business Process Improvement examples Page 14
New Applications
Stage 2
B U S I N E S S P R O C E S S I M P R O V E M E N T E X A M P L E S
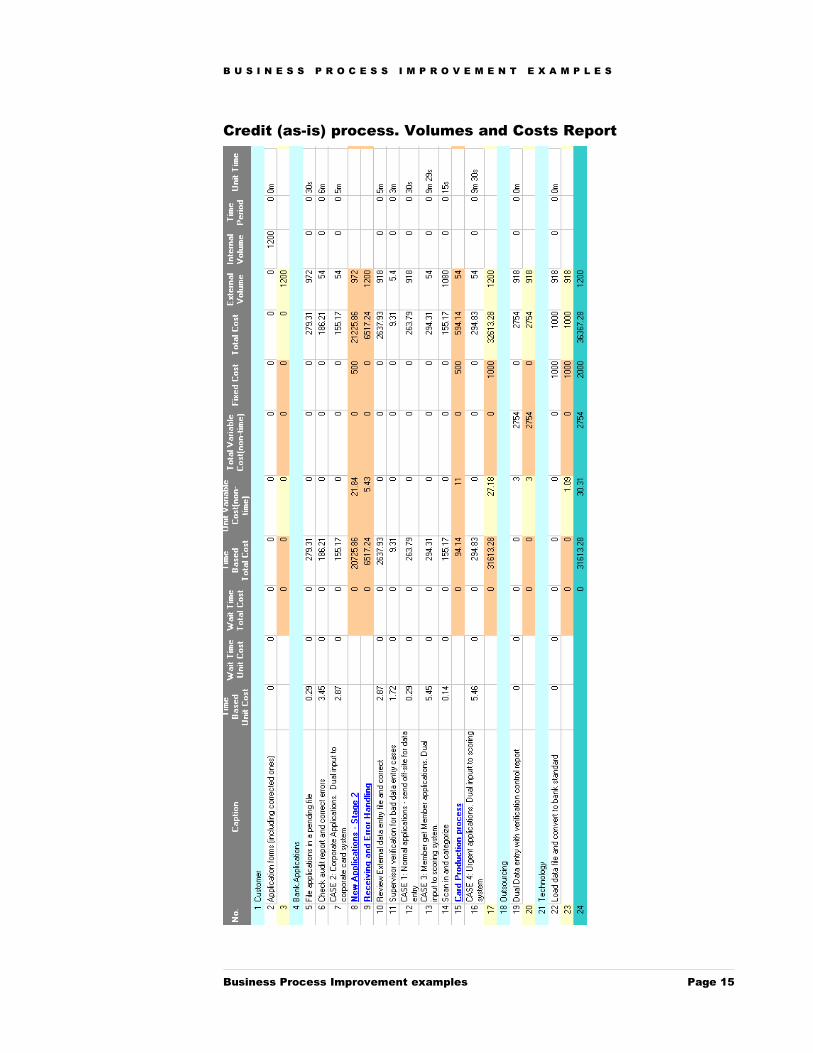
Credit (as-is) process. Volumes and Costs Report
Business Process Improvement examples Page 15

B U S I N E S S P R O C E S S I M P R O V E M E N T E X A M P L E S
You can see above the Volume and Costs report which is produced
automatically by selecting the Volume and Costs (XL)... option from the
Analysis menu. By selecting the analysis level in the process tree, you can get
the corresponding Volume and Costs report. In this case we have taken the
report by clicking on the high level Credit (as is) diagram to get an analysis of
this and all sub-processes.
The first entry in the report is for the Customer organization entity, showing the
monthly volume of 1200 application forms. There are no costs associated with
the Customer.
The next organization entity shown is Applications which has 12 activities.
The first is the “Receiving and error handling” activity. The costs for this
process originate in the sub-process and have been carried forward to this high
level diagram. You will see the entry underlined in blue. You can click on this
to see the costs for the sub-process which have been rolled up. For experience,
you should run a “volumes and costs” analysis on the sub-process (Receiving
and Error Handling) and reconcile the totals.
The maximum monthly volume for the process is 1200 units with a total cost of
$6517 per month.
All other processes in the Applications department follow a similar pattern.
After the last process in the department, a departmental total is shown,
summing all the 12 processes.
The Technology department shows one process with a volume of 918
transactions. There is a fixed cost of $1000 given for this process. A calculated
unit cost of $1.09 is also shown.
Outsourcing is the last department shown. Here there are 918 transactions with
a given unit cost of $3.00 and total fixed cost of $2,754. The final line is an “all
departments” map grand total.
Business Process Improvement examples Page 16

B U S I N E S S P R O C E S S I M P R O V E M E N T E X A M P L E S
Receiving and Error Handling process. Volumes and Costs Report
Business Process Improvement examples Page 17
B U S I N E S S P R O C E S S I M P R O V E M E N T E X A M P L E S
This report shows the “as-is” "Receiving and error handling" sub-process.
Totals are carried forward to the main diagram calling process, again called
“Receiving and Error Handling ”.
The first department shown is Customer with no associated costs.
A monthly volume of the “Receive call” :300 units.
A monthly volume of the “Receive mail”:120 units.
Next, the Applications department totals are shown. The five process totals are
given followed by the department total .
The final entry is the sub-process totals line. This can be reconciled with the
totals on the main map calling process. The total monthly cost for this sub-
process is $6,517.
Business Process Improvement examples Page 18

B U S I N E S S P R O C E S S I M P R O V E M E N T E X A M P L E S
Card Production process. Volumes and Costs Report
Business Process Improvement examples Page 19

B U S I N E S S P R O C E S S I M P R O V E M E N T E X A M P L E S
This report shows the “as-is” Card Production sub-process.
Totals are carried forward to the main map calling process.
There are four departments shown, with their respective totals
With Technology, there was no cost explicitly attributed to this process, so
costs are shown as zero.
Similarly, there are no costs shown for the Emboss Room “Produce cards +
addressed holders...” process and the Customer total.
The Final total line is the diagram total.
Business Process Improvement examples Page 20
B U S I N E S S P R O C E S S I M P R O V E M E N T E X A M P L E S
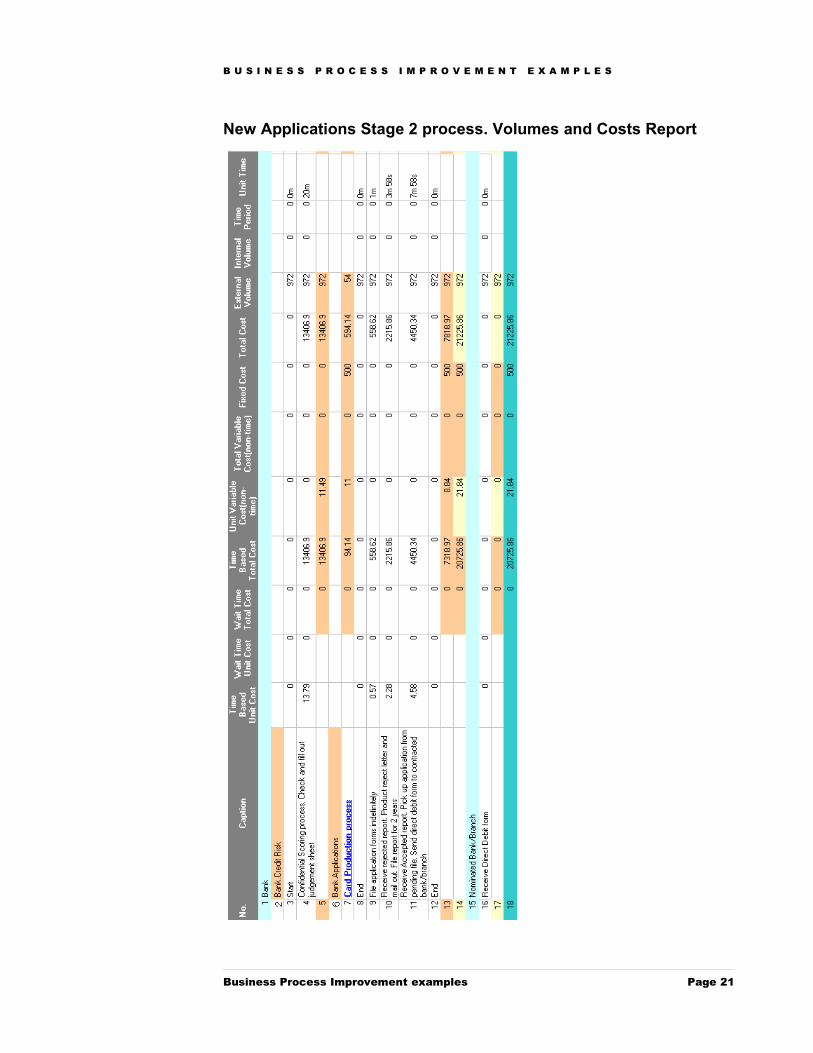
New Applications Stage 2 process. Volumes and Costs Report
Business Process Improvement examples Page 21

B U S I N E S S P R O C E S S I M P R O V E M E N T E X A M P L E S
Again, the sub-process volumes and cost figures are carried forward to the main
diagram calling process called “New Applications Stage2”.
In Applications , the “Card Production Process” itself calls another sub-process
(Card Production Process), whose costing figures are included in “New
Applications Stage2”.
The table follows a similar pattern to the tables already mentioned.
The final line is the map total line with the total cost :$21,225 .
Business Process Improvement examples Page 22
B U S I N E S S P R O C E S S I M P R O V E M E N T E X A M P L E S
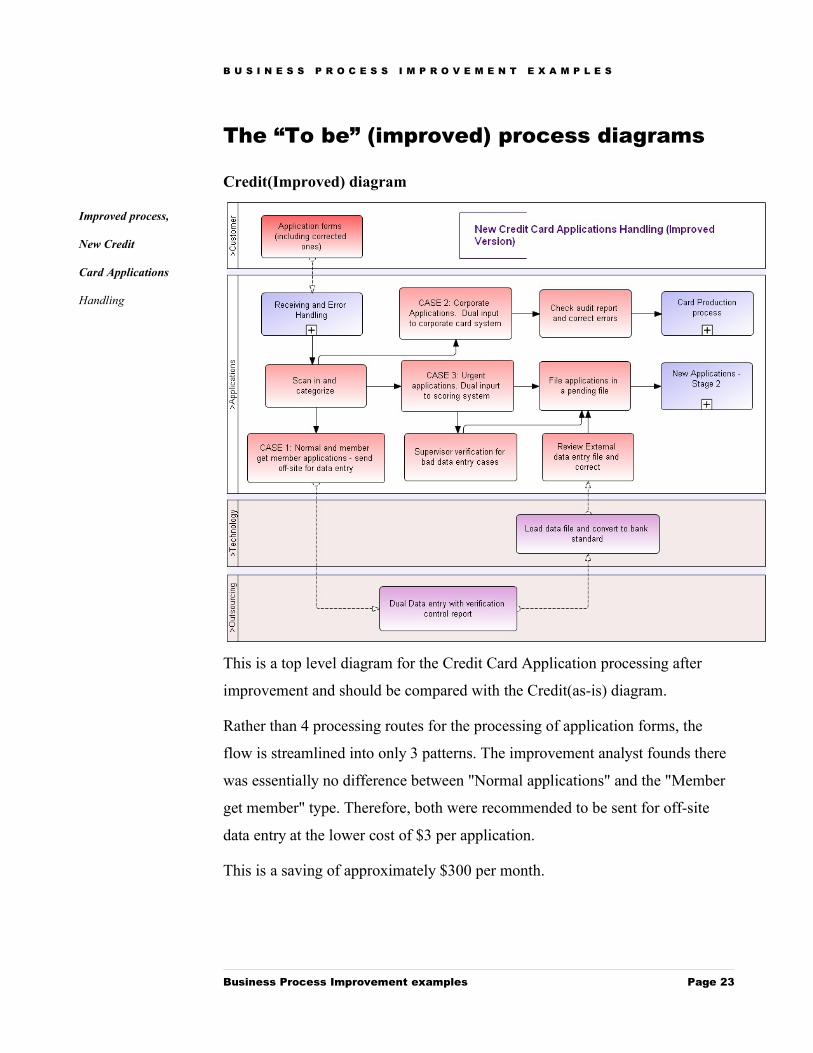
The “To be” (improved) process diagrams
Credit(Improved) diagram
This is a top level diagram for the Credit Card Application processing after
improvement and should be compared with the Credit(as-is) diagram.
Rather than 4 processing routes for the processing of application forms, the
flow is streamlined into only 3 patterns. The improvement analyst founds there
was essentially no difference between "Normal applications" and the "Member
get member" type. Therefore, both were recommended to be sent for off-site
data entry at the lower cost of $3 per application.
This is a saving of approximately $300 per month.
Business Process Improvement examples Page 23
Improved process,
New Credit
Card Applications
Handling

B U S I N E S S P R O C E S S I M P R O V E M E N T E X A M P L E S
You will notice that the volume of accepted applications coming from
“Receiving and error handling” is less. This is due to different sub-process
work practices.
Receiving and Error Handling (Improved) diagram
In this improved sub-process, the major change is the way in which the
customer is contacted for missing details. Rather than having no real limit to the
number of call attempts at home or office, a restriction of 1 call only is imposed
and no work sheet is used. This results in a Headcount saving of 0.1722 (or
$862 per month at the Headcount cost of $5000 per month).
180 more letters per month are sent out, but the monthly cost is increased only
with $70 because the processing time is reduced by not entering the details to
the computer system at this premature stage.
The monthly processing volume of 1200 (as sent down from the main map) will
in fact increase slightly if you take into account the extra 180 letters which are
sent back round the system. For simplicity this is not taken into account here.
Business Process Improvement examples Page 24
Improved process,
Receiving and Error
Handling(Improved)

B U S I N E S S P R O C E S S I M P R O V E M E N T E X A M P L E S
Other Credit diagrams
The processes were not changed, so the current diagrams are used as sub-
process.
Business Process Improvement examples Page 25
B U S I N E S S P R O C E S S I M P R O V E M E N T E X A M P L E S
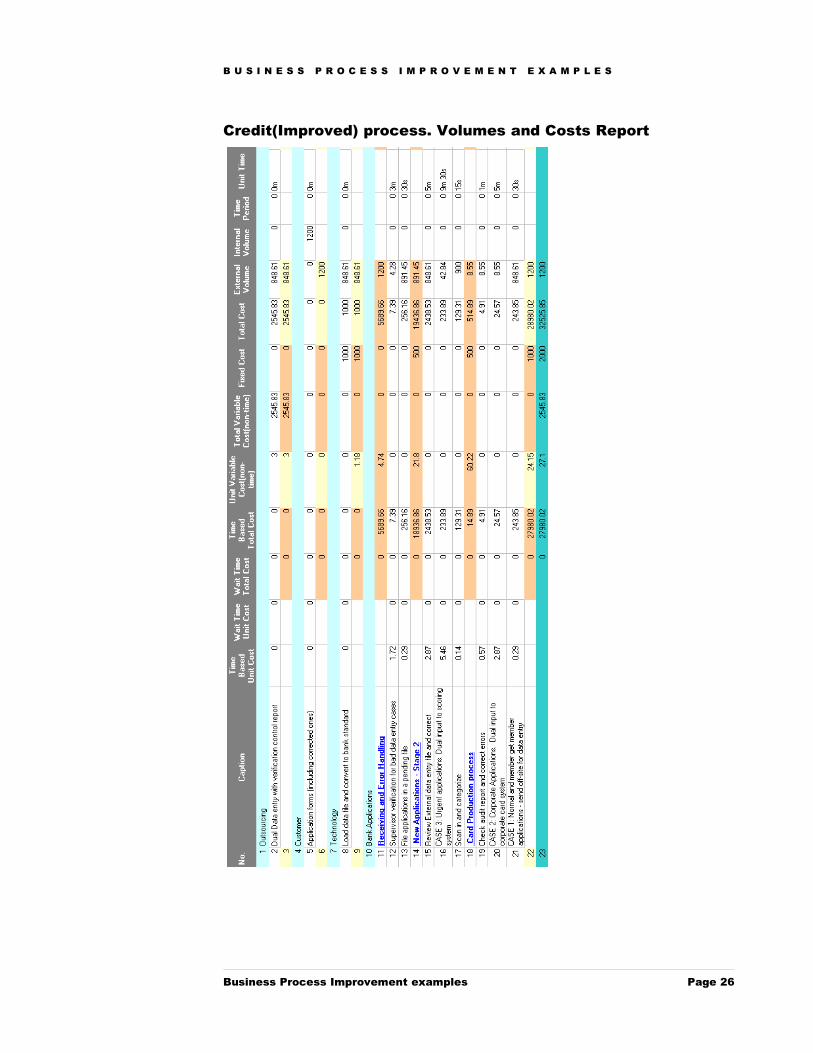
Credit(Improved) process. Volumes and Costs Report
Business Process Improvement examples Page 26

B U S I N E S S P R O C E S S I M P R O V E M E N T E X A M P L E S
This report shows the new costings after improvement. The explanations follow the “as-is” diagram. The total cost of the new process is $32,526 as compared to $36,367 before.
Receiving and Error Handling(Improved) process. Volumes and
Costs Report
Business Process Improvement examples Page 27

B U S I N E S S P R O C E S S I M P R O V E M E N T E X A M P L E S
This report shows the new costings after improvement. Again, explanations
follow the “as-is”diagram.
Business Process Improvement examples Page 28

B U S I N E S S P R O C E S S I M P R O V E M E N T E X A M P L E S
The total cost of this new sub-process is $5,689 as compared to $6,517 before.
The other processes were not changed, so they were incorporated in the
improved diagrams.
This is a good example of how AVANTAGE encourages diagram re-use to
avoid redundancy.
Study results
Business Process Improvement examples Page 29

B U S I N E S S P R O C E S S I M P R O V E M E N T E X A M P L E S
The total review of the Credit Card Operations highlighted many major
inefficiencies.
ActiveModeler Avantage was able make the “as is” processes much more
visible and enable the development of more streamlined and efficient
“improved process” flows.
In particular, the Card Application process review (considered here as an
example) yielded the following main improvement applications:
Main Bankcorp Banking Application Processing (Credit process diagram)
1. All applications except for Urgent and Corporate are now sent off-site (out-
sourced) for data entry. This allows for more standardization and allows
Bankcorp to take advantage of a good external data entry price.
Receiving and Error Handling Sub-process
2. It was found that a lot of time was spent trying to contact applicants who had
incorrectly filled in their application forms. There was no guideline as to how
many times the operations staff should call.
It was agreed to limit the telephoning to 1 attempt.
3. The use of the work sheet for contact attempt history is eliminated. The
application itself is annotated.
4. Input to the computer of applicants with missing details is eliminated. A pre-
printed form is simply sent with the missing items circled.
Conclusions
Business Process Improvement examples Page 30
B U S I N E S S P R O C E S S I M P R O V E M E N T E X A M P L E S
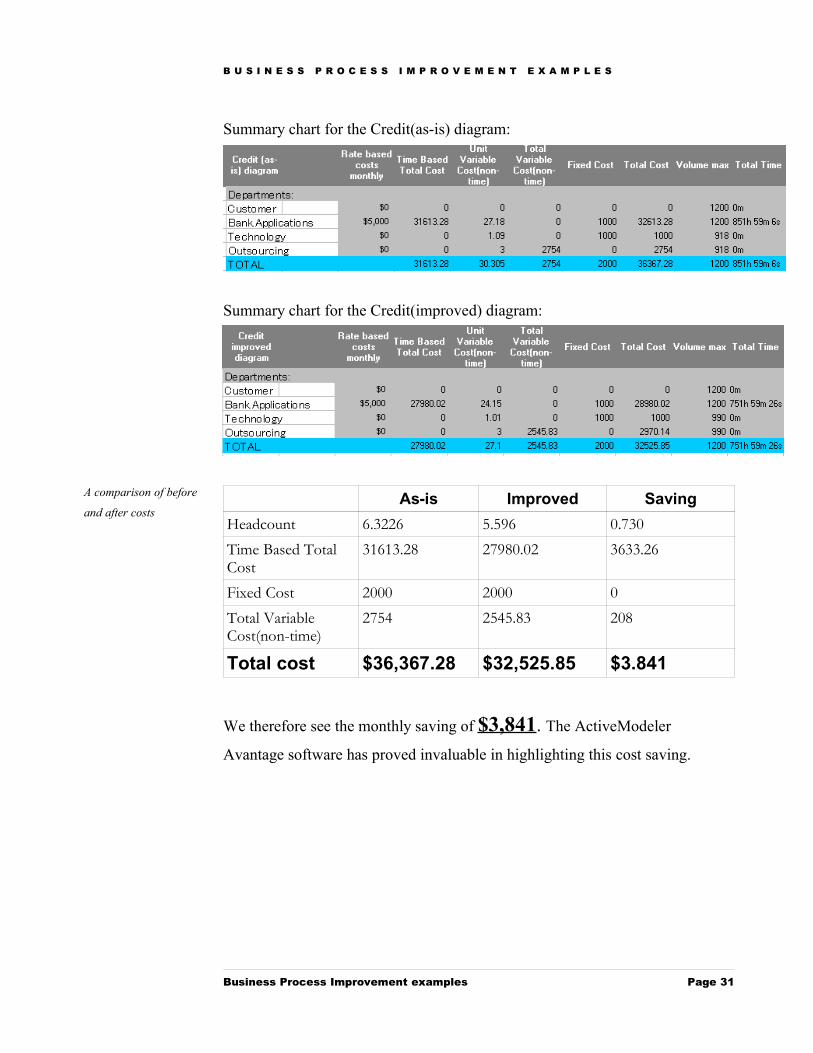
Summary chart for the Credit(as-is) diagram:
Summary chart for the Credit(improved) diagram:
As-is Improved SavingHeadcount 6.3226 5.596 0.730Time Based Total Cost
31613.28 27980.02 3633.26
Fixed Cost 2000 2000 0Total Variable Cost(non-time)
2754 2545.83 208
Total cost $36,367.28 $32,525.85 $3.841
We therefore see the monthly saving of $3,841. The ActiveModeler
Avantage software has proved invaluable in highlighting this cost saving.
Business Process Improvement examples Page 31
A comparison of before
and after costs


