86
Full-year results Twelve months ended 31 st December 2012 Adrian Ringrose, Chief Executive Tim Haywood, Group Finance Director 27 th February 2013 Capital Markets Update 30 April 2013

Full-year results
Twelve months ended 31st December 2012
Adrian Ringrose, Chief Executive
Tim Haywood, Group Finance Director
27th February 2013
Capital Markets Update
30 April 2013

Who you will be meeting
Phil Clark
Business Development
Director
George Franks
Managing Director –
Interserve International
Adrian Ringrose
Chief Executive
Tim Haywood
Group Finance Director
Lord Adonis
Ian Hayes
Operations Director
Today’s itinerary
• 2010-2015 development .Adrian Ringrose
• SustainAbilities Tim Haywood
• The healthcare market Phil Clark
• UK outsourcing and infrastructure Lord Adonis
• Support Services and Construction International George Franks
• Equipment Services Ian Hayes
• Lunch (approximately 1pm)
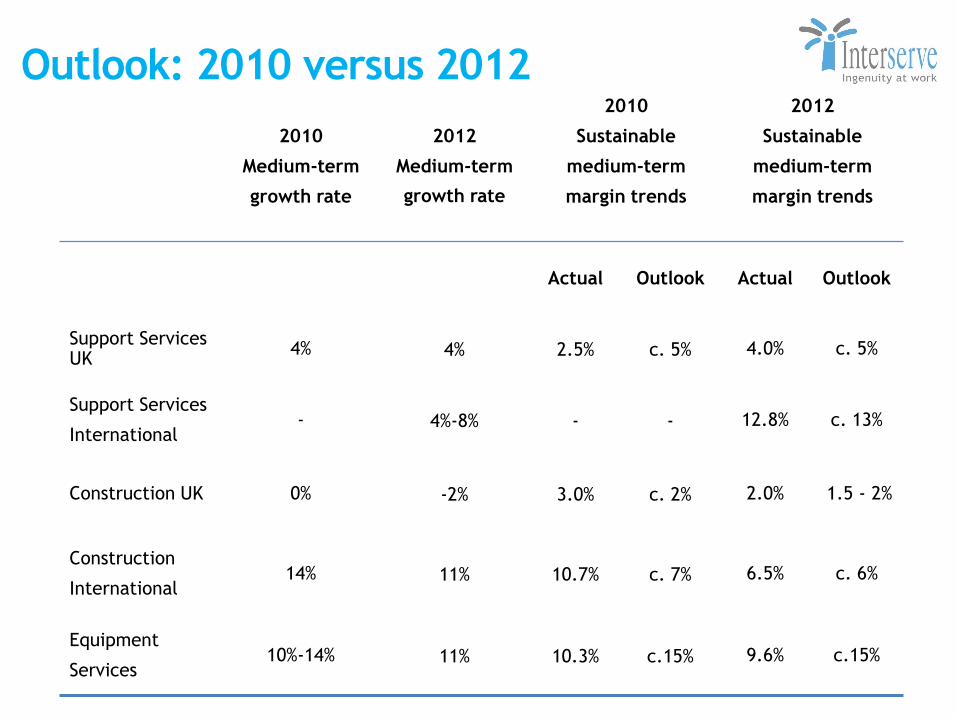
2010
Medium-term
growth rate
2012
Medium-term
growth rate
2010
Sustainable
medium-term
margin trends
2012
Sustainable
medium-term
margin trends
Actual Outlook Actual Outlook
Support Services UK
4% 4% 2.5% c. 5% 4.0% c. 5%
Support Services
International - 4%-8% - - 12.8% c. 13%
Construction UK 0% -2% 3.0% c. 2% 2.0% 1.5 - 2%
Construction
International 14% 11% 10.7% c. 7% 6.5% c. 6%
Equipment
Services 10%-14% 11% 10.3% c.15% 9.6% c.15%
Outlook: 2010 versus 2012
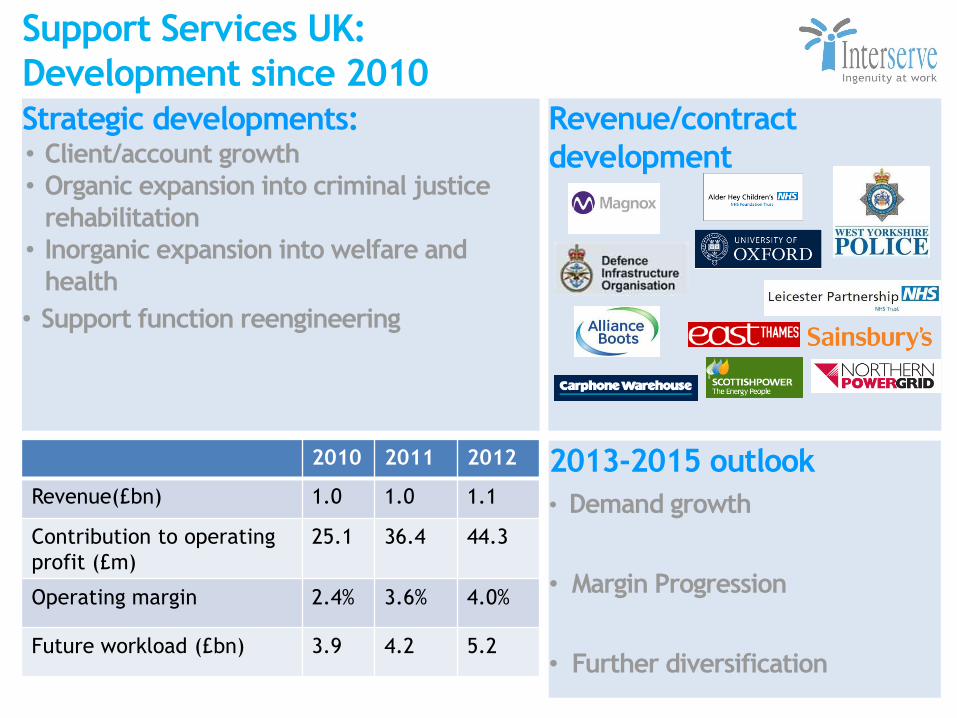
Support Services UK:
Development since 2010
Strategic developments: • Client/account growth
• Organic expansion into criminal justice
rehabilitation
• Inorganic expansion into welfare and
health
• Support function reengineering
2010 2011 2012
Revenue(£bn) 1.0 1.0 1.1
Contribution to operating
profit (£m)
25.1 36.4 44.3
Operating margin 2.4% 3.6% 4.0%
Future workload (£bn) 3.9 4.2 5.2
Revenue/contract
development
2013-2015 outlook
• Demand growth
• Margin Progression
• Further diversification
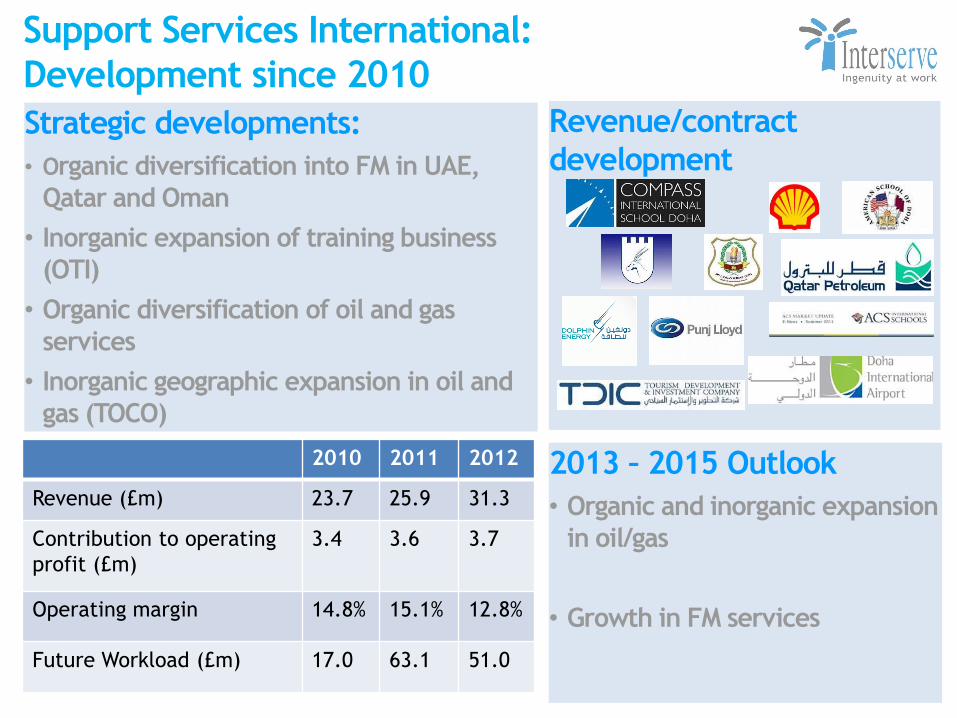
Support Services International:
Development since 2010
Strategic developments:
• Organic diversification into FM in UAE,
Qatar and Oman
• Inorganic expansion of training business
(OTI)
• Organic diversification of oil and gas
services
• Inorganic geographic expansion in oil and
gas (TOCO)
2010 2011 2012
Revenue (£m) 23.7 25.9 31.3
Contribution to operating
profit (£m)
3.4 3.6 3.7
Operating margin 14.8% 15.1% 12.8%
Future Workload (£m) 17.0 63.1 51.0
Revenue/contract
development
2013 – 2015 Outlook
• Organic and inorganic expansion
in oil/gas
• Growth in FM services
Revenue/contract
development
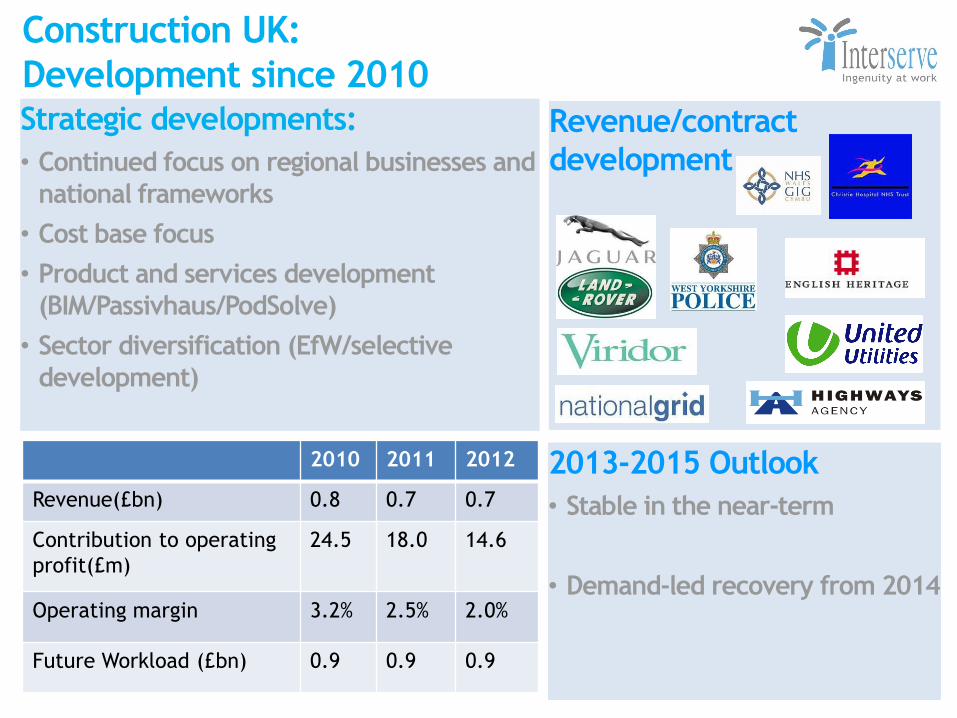
Construction UK:
Development since 2010
Strategic developments:
• Continued focus on regional businesses and
national frameworks
• Cost base focus
• Product and services development
(BIM/Passivhaus/PodSolve)
• Sector diversification (EfW/selective
development)
2010 2011 2012
Revenue(£bn) 0.8 0.7 0.7
Contribution to operating
profit(£m)
24.5 18.0 14.6
Operating margin 3.2% 2.5% 2.0%
Future Workload (£bn) 0.9 0.9 0.9
2013-2015 Outlook
• Stable in the near-term
• Demand-led recovery from 2014
Revenue/contract
development
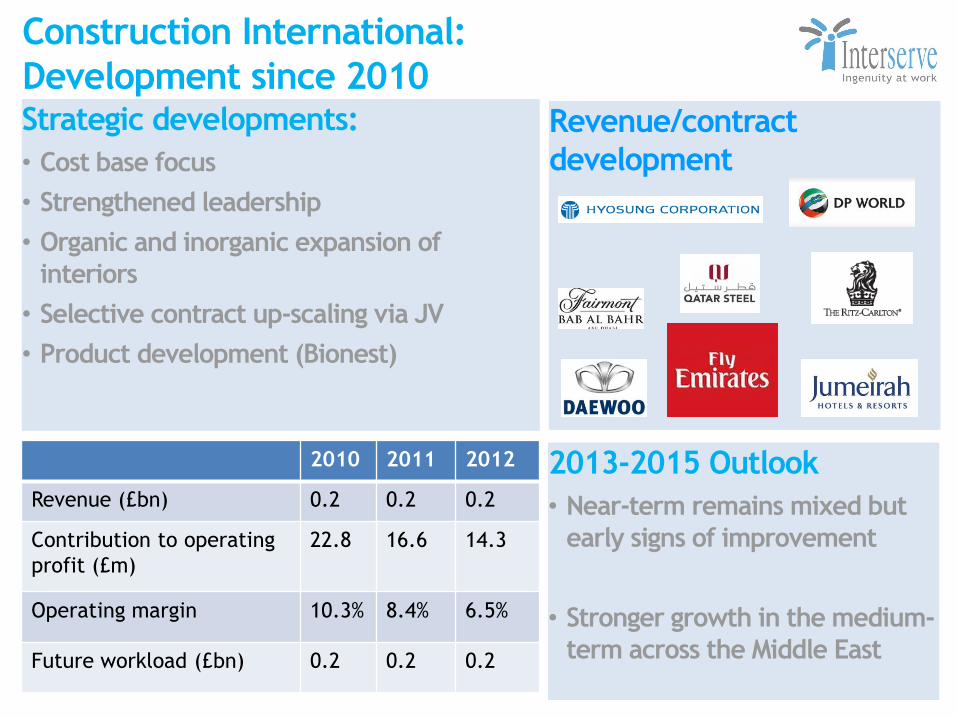
Construction International:
Development since 2010
Strategic developments:
• Cost base focus
• Strengthened leadership
• Organic and inorganic expansion of
interiors
• Selective contract up-scaling via JV
• Product development (Bionest)
2010 2011 2012
Revenue (£bn) 0.2 0.2 0.2
Contribution to operating
profit (£m)
22.8 16.6 14.3
Operating margin 10.3% 8.4% 6.5%
Future workload (£bn) 0.2 0.2 0.2
2013-2015 Outlook
• Near-term remains mixed but
early signs of improvement
• Stronger growth in the medium-
term across the Middle East
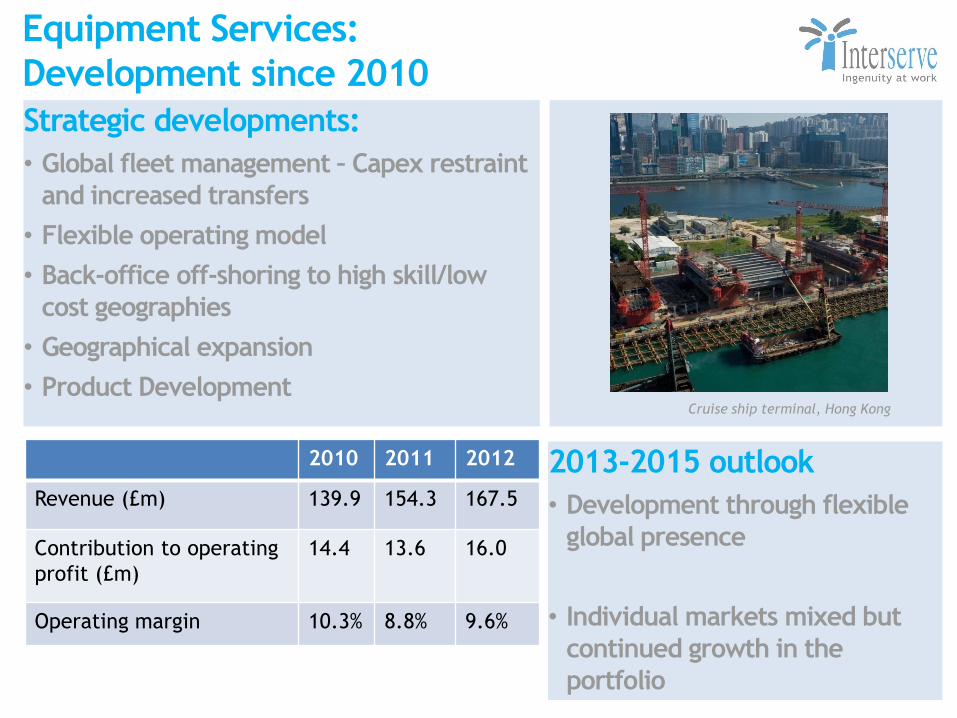
Equipment Services:
Development since 2010
Strategic developments:
• Global fleet management – Capex restraint
and increased transfers
• Flexible operating model
• Back-office off-shoring to high skill/low
cost geographies
• Geographical expansion
• Product Development
2010 2011 2012
Revenue (£m) 139.9 154.3 167.5
Contribution to operating
profit (£m)
14.4 13.6 16.0
Operating margin 10.3% 8.8% 9.6%
Cruise ship terminal, Hong Kong
2013-2015 outlook
• Development through flexible
global presence
• Individual markets mixed but
continued growth in the
portfolio
Financial position
•Strong cash conversion (117%, 3 year rolling
average)
•Disposed of the majority of our PFI portfolio for
£179.5m realising significant latent value
•Materially reduced actuarial pension deficit from
£224m to £95m
•Substantial available committed debt capacity
(£246m)
Group-wide developments
• Developing the Interserve brand
• Driving greater sustainability
• Account management
• Talent management
• Learning and development
• Health and Safety
Summary
We are delivering our aspiration by:
• Client & account development
• Good execution of contracts
• Accessing further growth markets
• Strong balance sheet
• Selective, accretive acquisitions (welfare,
oil/gas, healthcare at home services)
• Dividend progression

Tim Haywood –
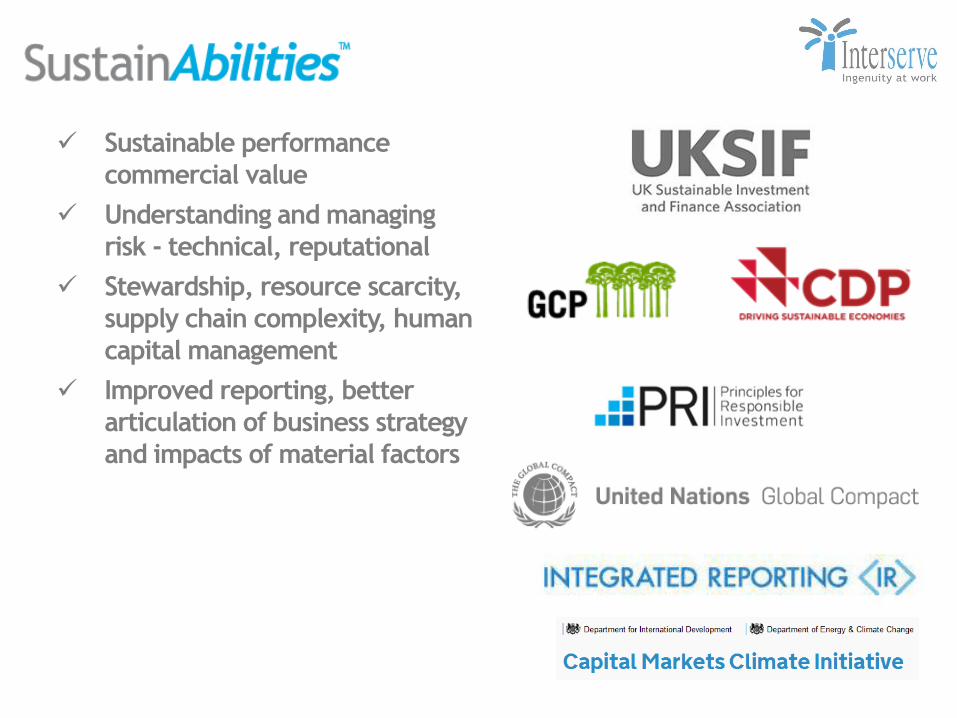
Sustainable performance
commercial value
Understanding and managing
risk - technical, reputational
Stewardship, resource scarcity,
supply chain complexity, human
capital management
Improved reporting, better
articulation of business strategy
and impacts of material factors
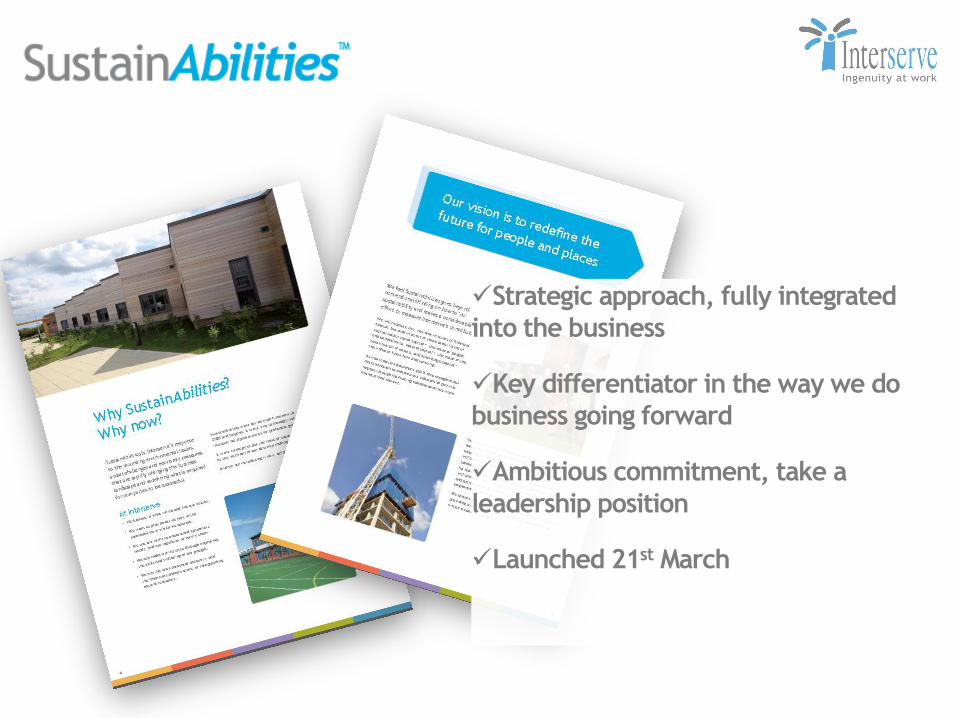
Strategic approach, fully integrated
into the business
Key differentiator in the way we do
business going forward
Ambitious commitment, take a
leadership position
Launched 21st March
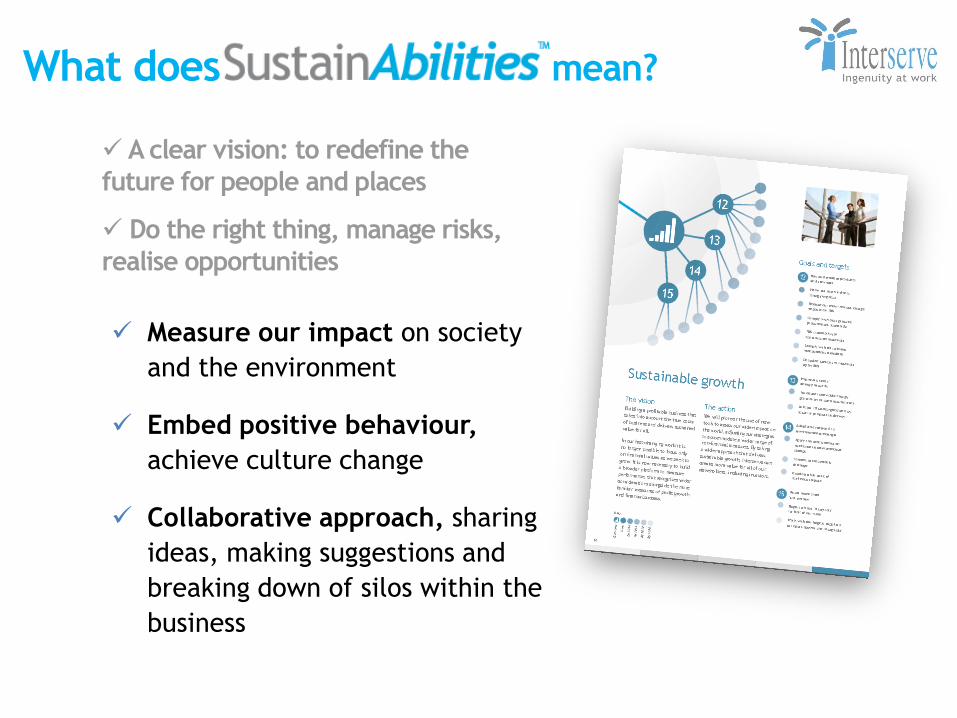
A clear vision: to redefine the
future for people and places
Do the right thing, manage risks,
realise opportunities
Measure our impact on society
and the environment
Embed positive behaviour,
achieve culture change
Collaborative approach, sharing
ideas, making suggestions and
breaking down of silos within the
business
What does mean?
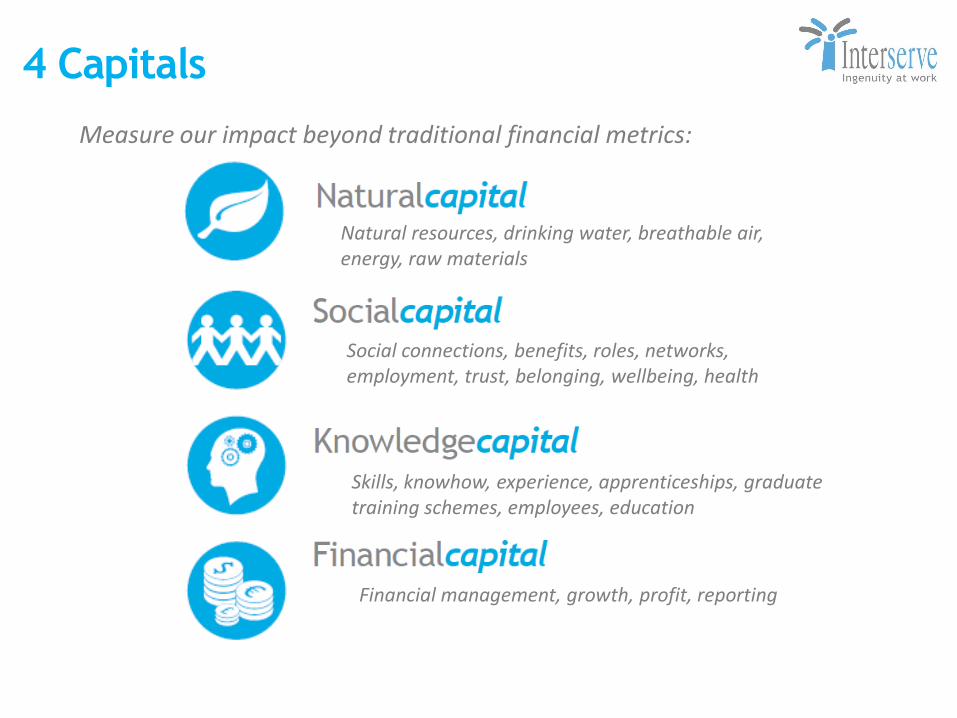
Natural resources, drinking water, breathable air, energy, raw materials
Social connections, benefits, roles, networks, employment, trust, belonging, wellbeing, health
Skills, knowhow, experience, apprenticeships, graduate training schemes, employees, education
Financial management, growth, profit, reporting
Measure our impact beyond traditional financial metrics:
4 Capitals
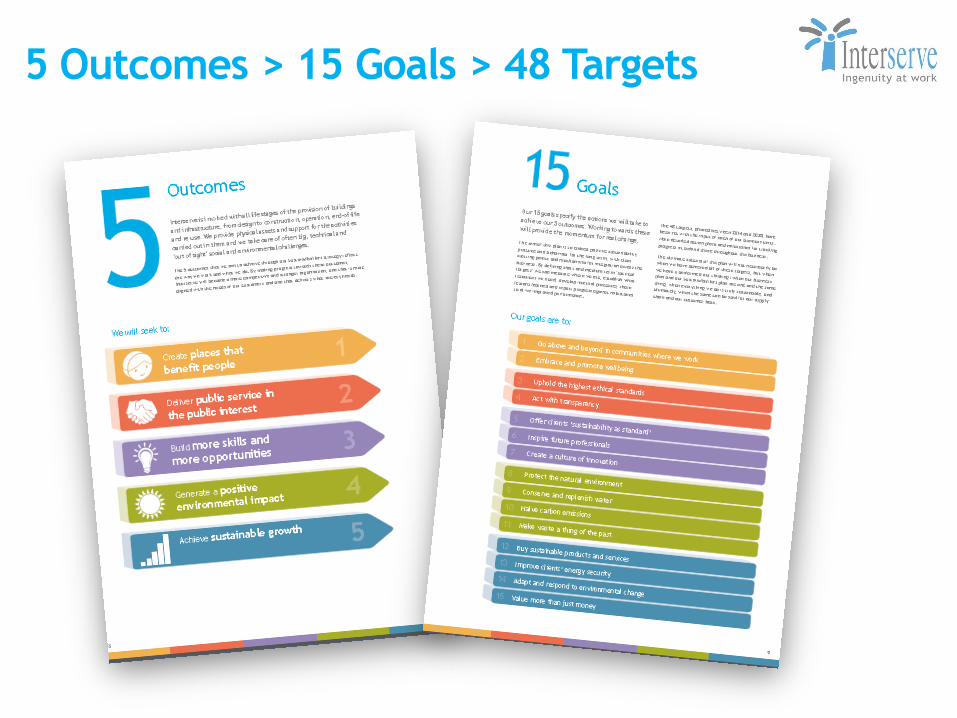
5 Outcomes > 15 Goals > 48 Targets

Phil Clark –
Healthcare market
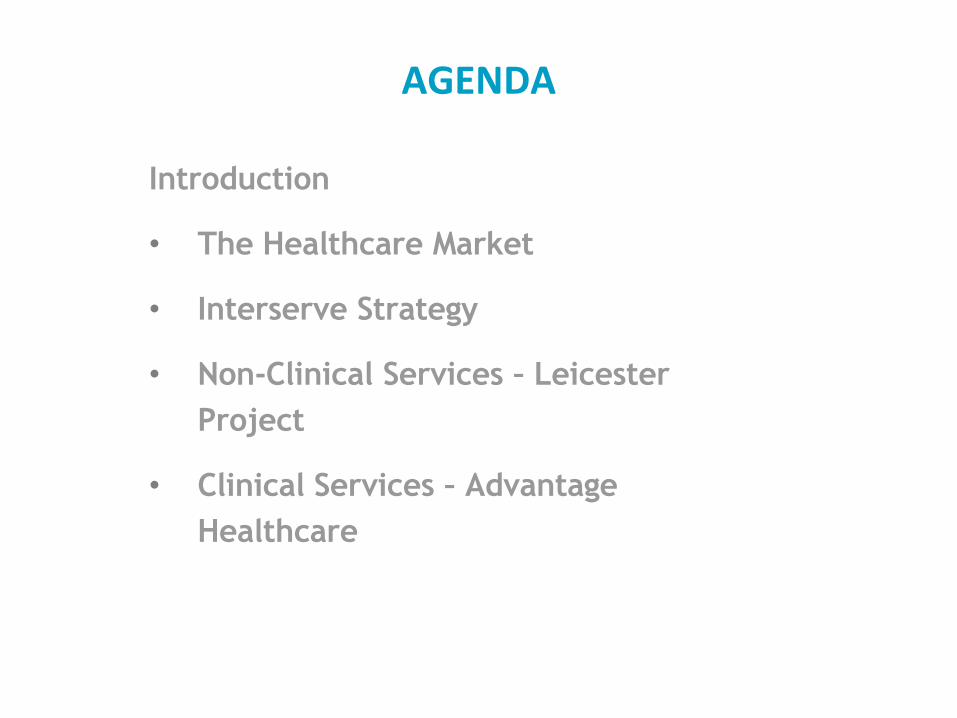
AGENDA
Introduction
• The Healthcare Market
• Interserve Strategy
• Non-Clinical Services – Leicester
Project
• Clinical Services – Advantage
Healthcare

The Healthcare Market

Legislation
Market Growth in healthcare
Regulation Compliance
Enhanced
Competition and
Market Growth
c.5-10% p.a
Health & Social
Care Act 2012
• CCG’s
• CSG’s
• Enhanced
Clinical Powers
Monitor
• Any Qualified
Provider
• NHS Provider
Licences
• NHS
Foundation
Trusts
CQC
• Inspect and
regulate
• National
Standards
• Chief
Inspectors
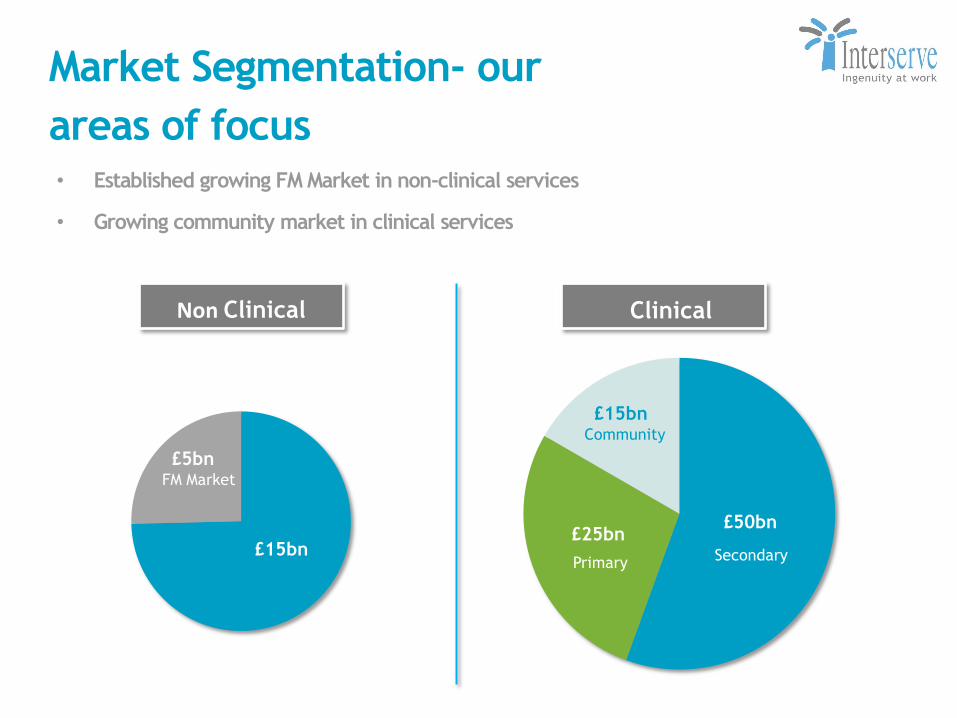
£50bn
Market Segmentation- our
areas of focus
Non Clinical Clinical
Secondary
Community
Primary
£15bn
£15bn
£5bn FM Market
£25bn
• Established growing FM Market in non-clinical services
• Growing community market in clinical services
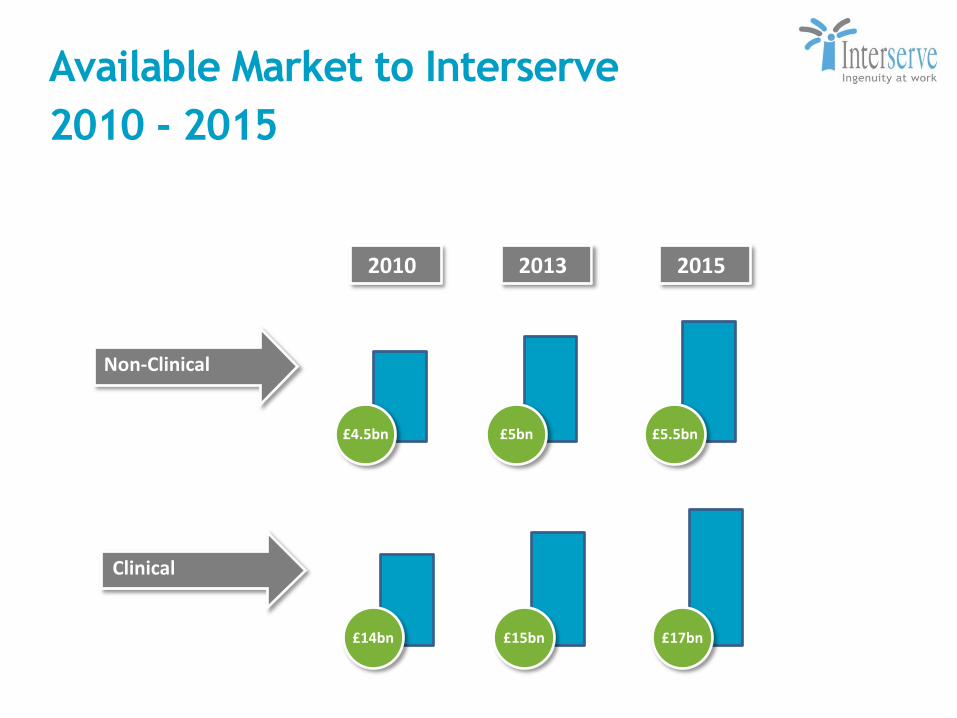
Available Market to Interserve
2010 - 2015
Non-Clinical
£4.5bn
Clinical
£14bn
£5bn
£15bn
2013
£5.5bn
£17bn
2015 2010
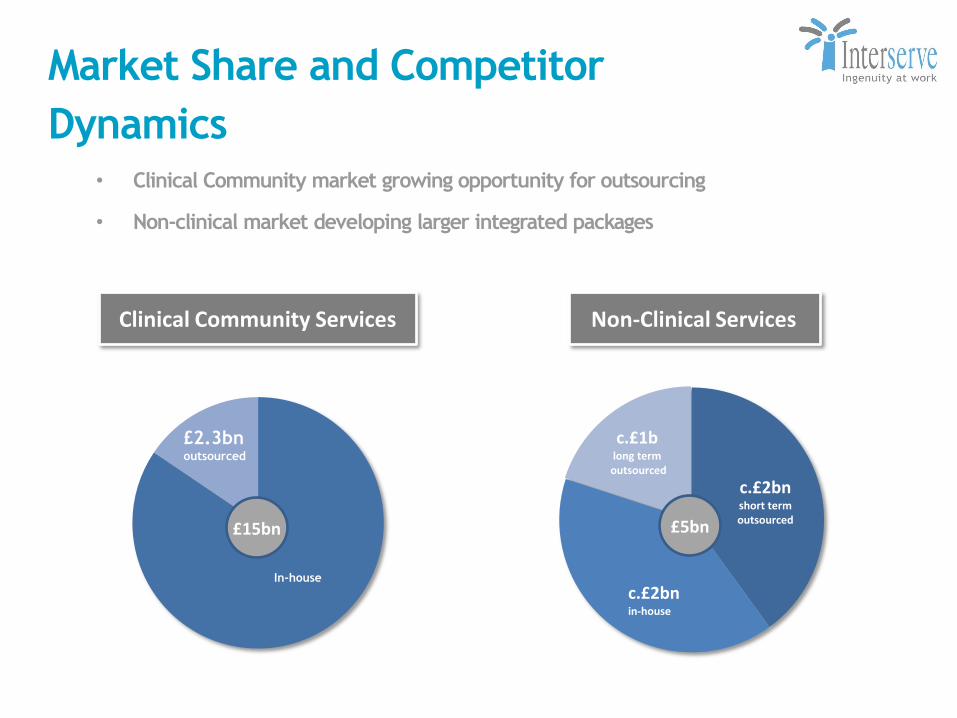
Market Share and Competitor
Dynamics
In-house
£2.3bn outsourced
Clinical Community Services Non-Clinical Services
c.£2bn short term outsourced
c.£2bn in-house
c.£1b long term
outsourced
£15bn £5bn
• Clinical Community market growing opportunity for outsourcing
• Non-clinical market developing larger integrated packages
Interserve Strategy
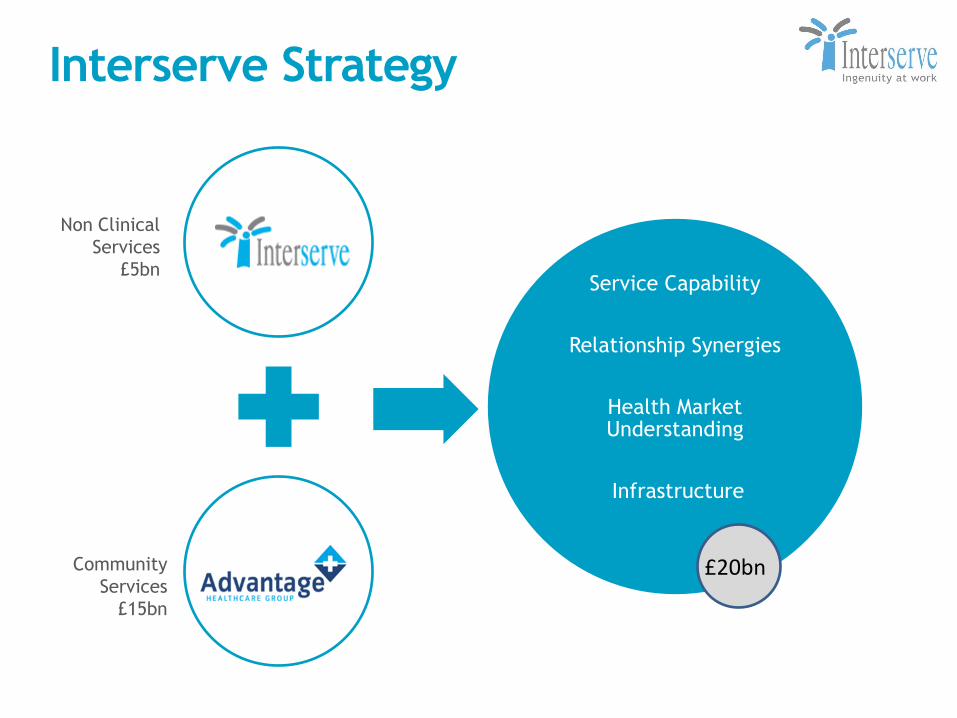
Interserve Strategy
Service Capability
Relationship Synergies
Health Market Understanding
Infrastructure
Non Clinical
Services
£5bn
Community
Services
£15bn
£20bn
Non-Clinical Services – Leicester Project
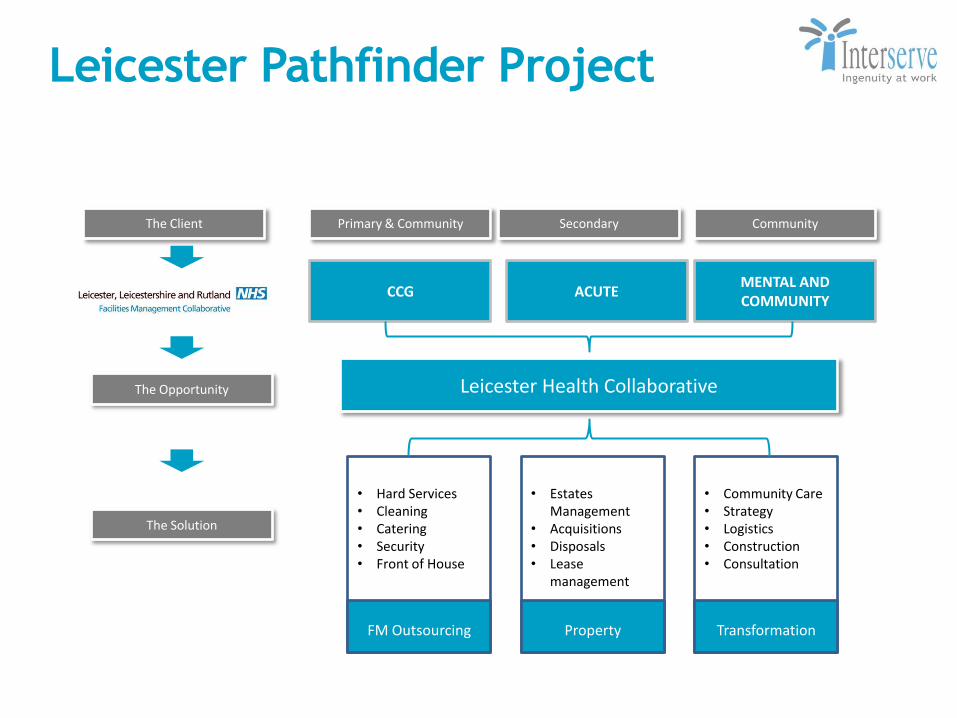
Primary & Community Secondary Community The Client
CCG ACUTE MENTAL AND COMMUNITY
Leicester Health Collaborative The Opportunity
The Solution
FM Outsourcing
• Hard Services • Cleaning • Catering • Security • Front of House
Property
• Estates Management
• Acquisitions • Disposals • Lease
management
Transformation
• Community Care • Strategy • Logistics • Construction • Consultation
Leicester Pathfinder Project
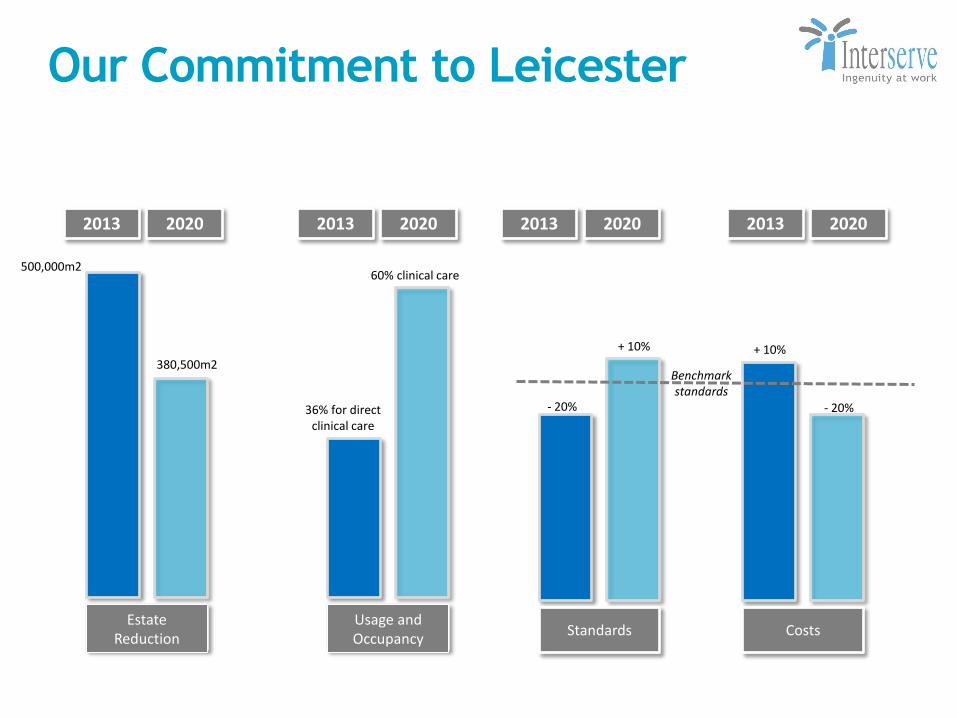
Estate Reduction
500,000m2
380,500m2
Usage and Occupancy
60% clinical care
36% for direct clinical care
Standards Costs
+ 10%
Our Commitment to Leicester
- 20%
Benchmark standards
2013 2020 2013 2020 2013 2020 2013 2020
- 20%
+ 10%
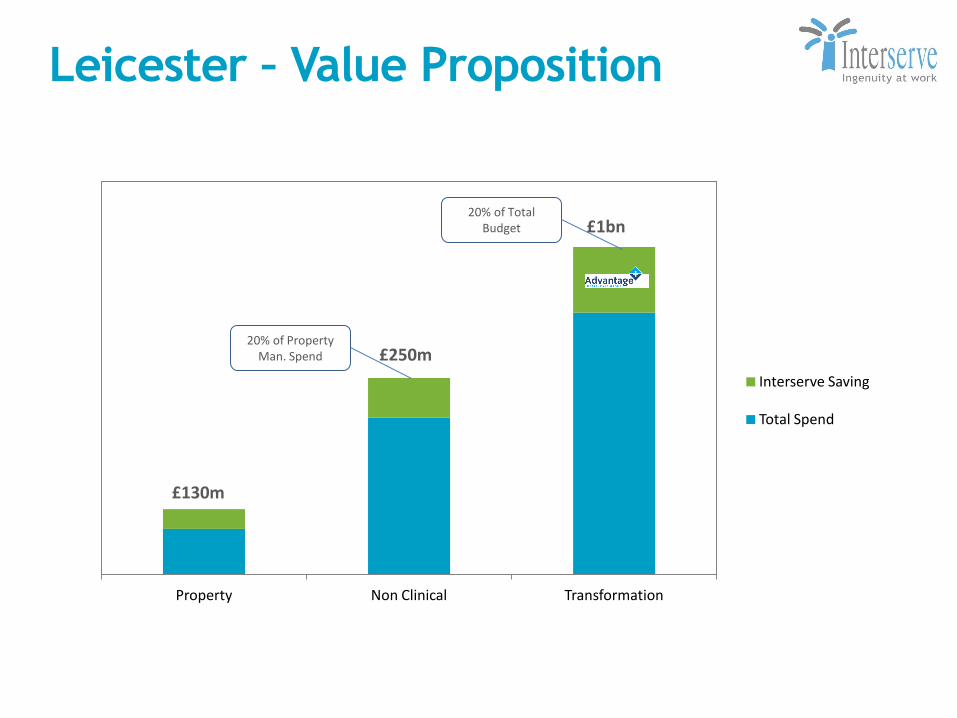
Property Non Clinical Transformation
Interserve Saving
Total Spend
Leicester – Value Proposition
20% of Total Budget
20% of Property Man. Spend
£1bn
£250m
£130m
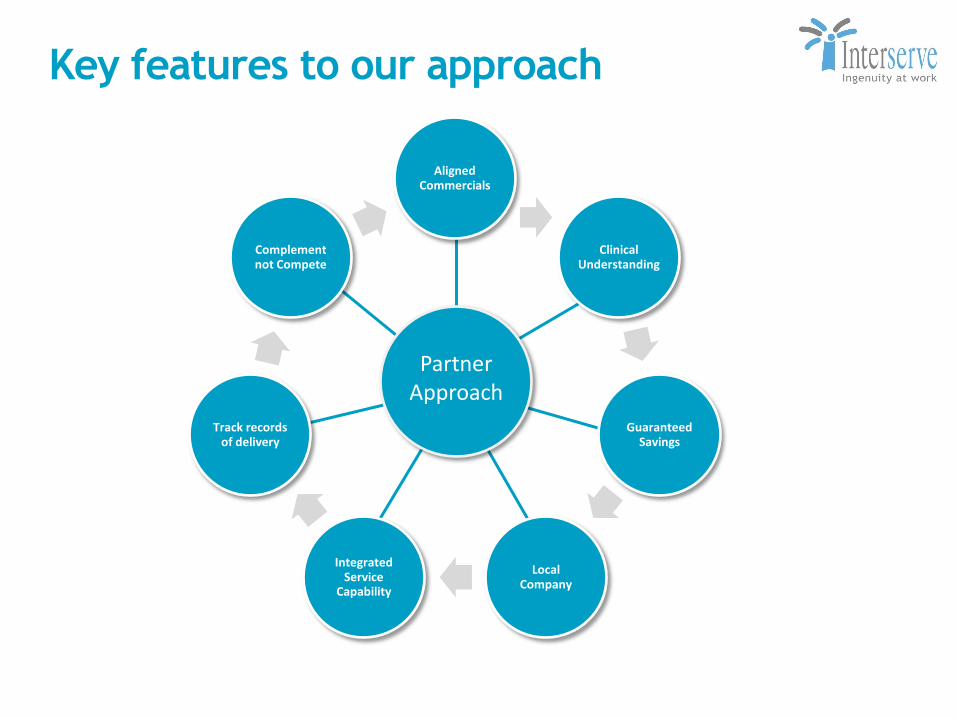
Aligned Commercials
Clinical Understanding
Guaranteed Savings
Local Company
Integrated Service
Capability
Track records of delivery
Complement not Compete
Key features to our approach
Partner Approach
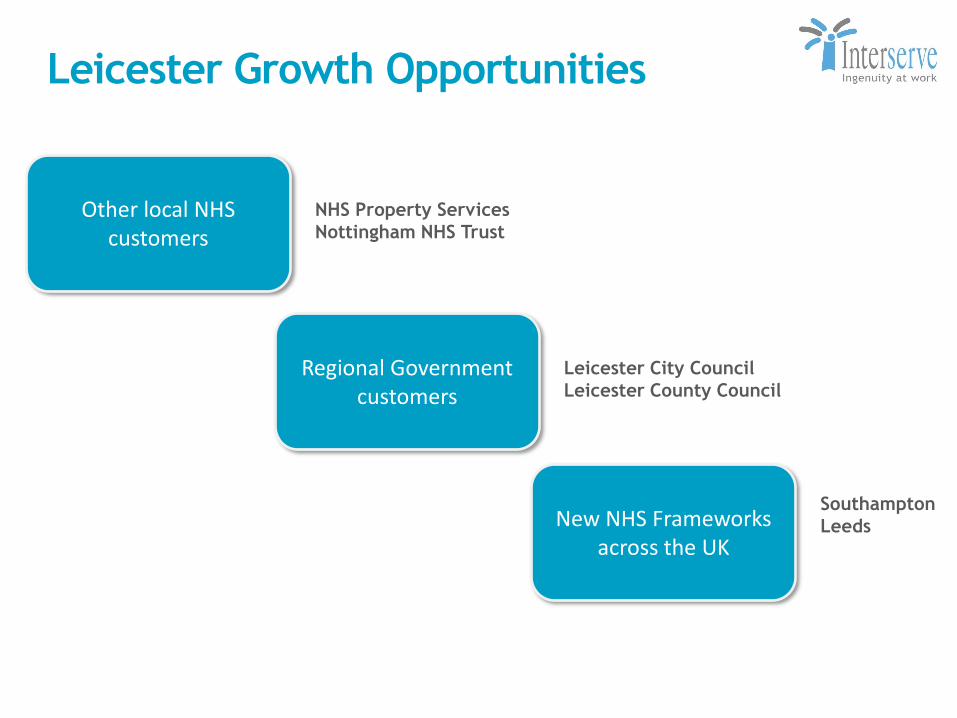
Leicester Growth Opportunities
Other local NHS customers
Regional Government customers
New NHS Frameworks across the UK
NHS Property Services
Nottingham NHS Trust
Leicester City Council
Leicester County Council
Southampton
Leeds
Clinical Services -
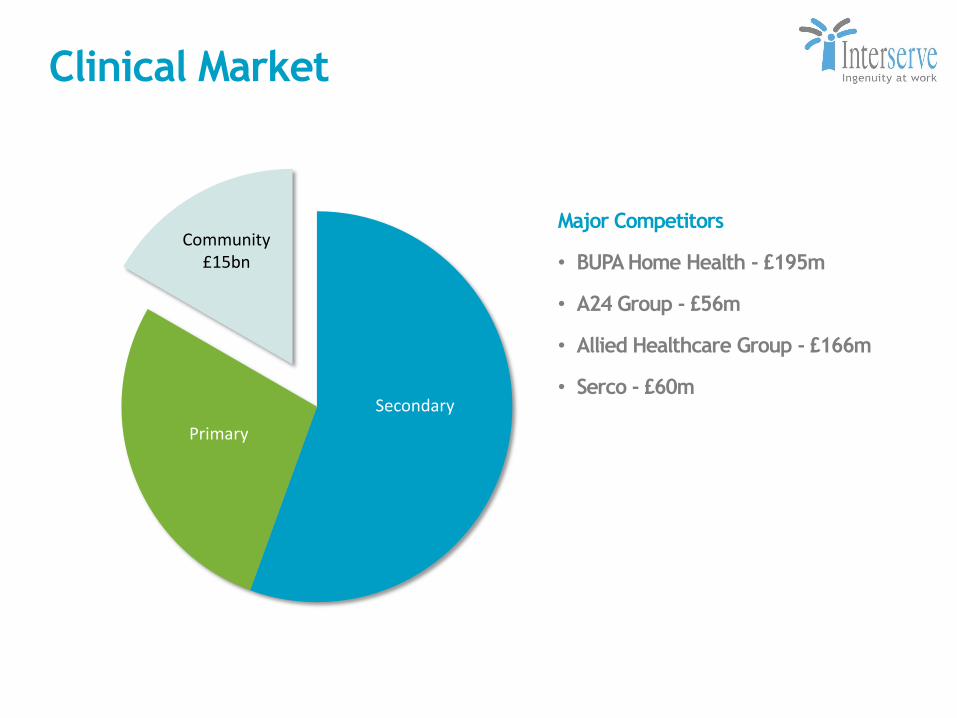
Clinical Market
Community £15bn
Secondary
Primary
Major Competitors
• BUPA Home Health - £195m
• A24 Group - £56m
• Allied Healthcare Group - £166m
• Serco - £60m
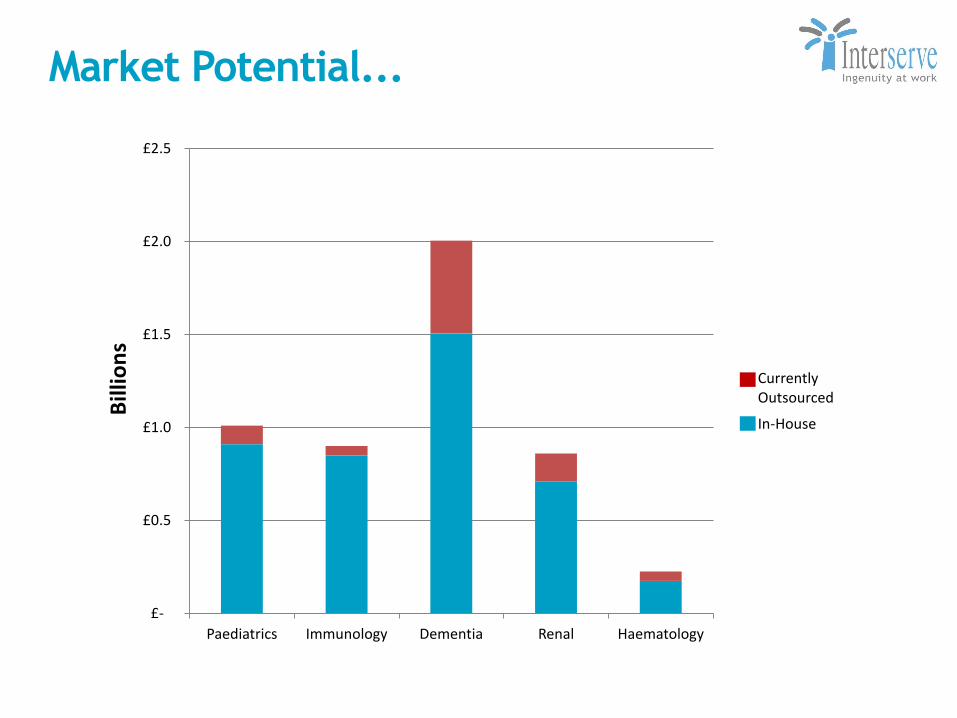
Market Potential...
£-
£0.5
£1.0
£1.5
£2.0
£2.5
Paediatrics Immunology Dementia Renal Haematology
Bill
ion
s
Currently Outsourced
In-House
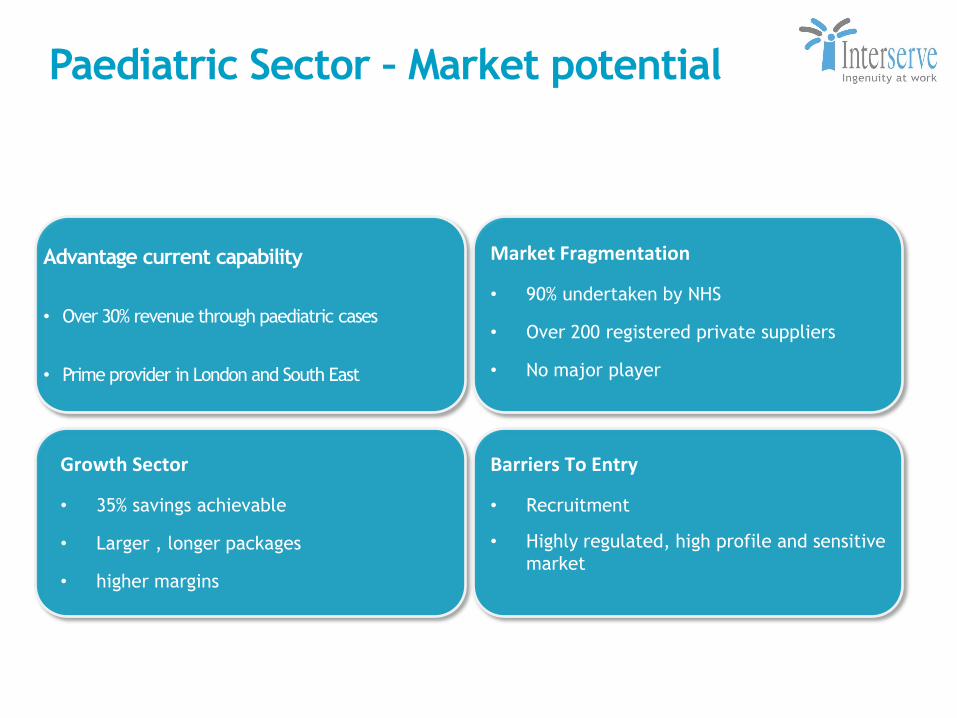
Paediatric Sector – Market potential
Advantage current capability
• Over 30% revenue through paediatric cases
• Prime provider in London and South East
Barriers To Entry
• Recruitment
• Highly regulated, high profile and sensitive
market
Market Fragmentation
• 90% undertaken by NHS
• Over 200 registered private suppliers
• No major player
Growth Sector
• 35% savings achievable
• Larger , longer packages
• higher margins
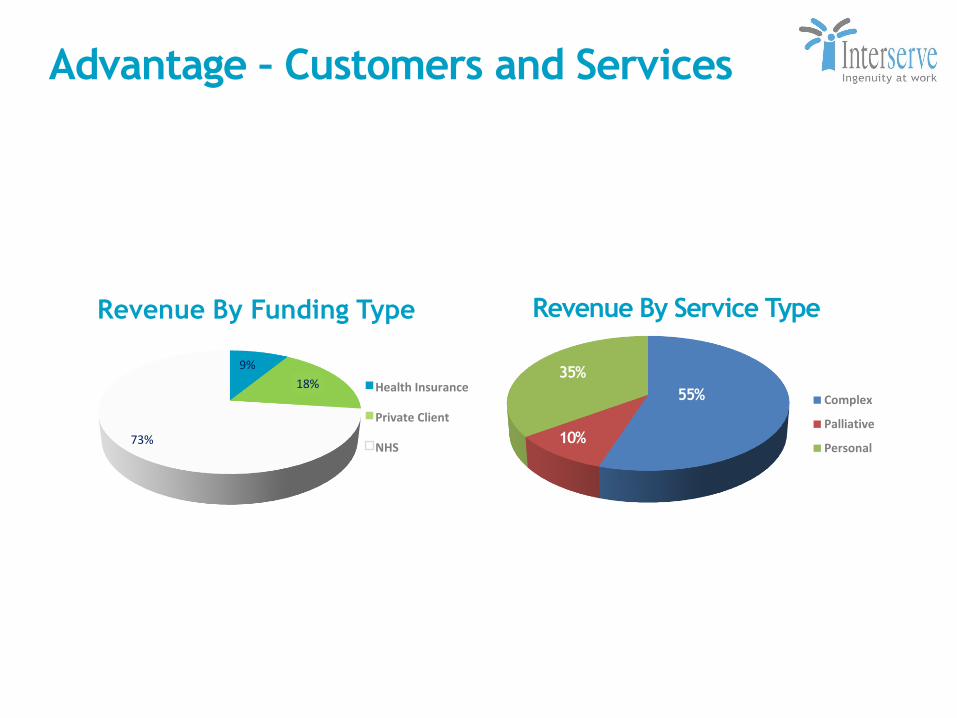
Advantage – Customers and Services
9%
18%
73%
Revenue By Funding Type
Health Insurance
Private Client
NHS
Complex
Palliative
Personal
Revenue By Service Type
55%
10%
35%
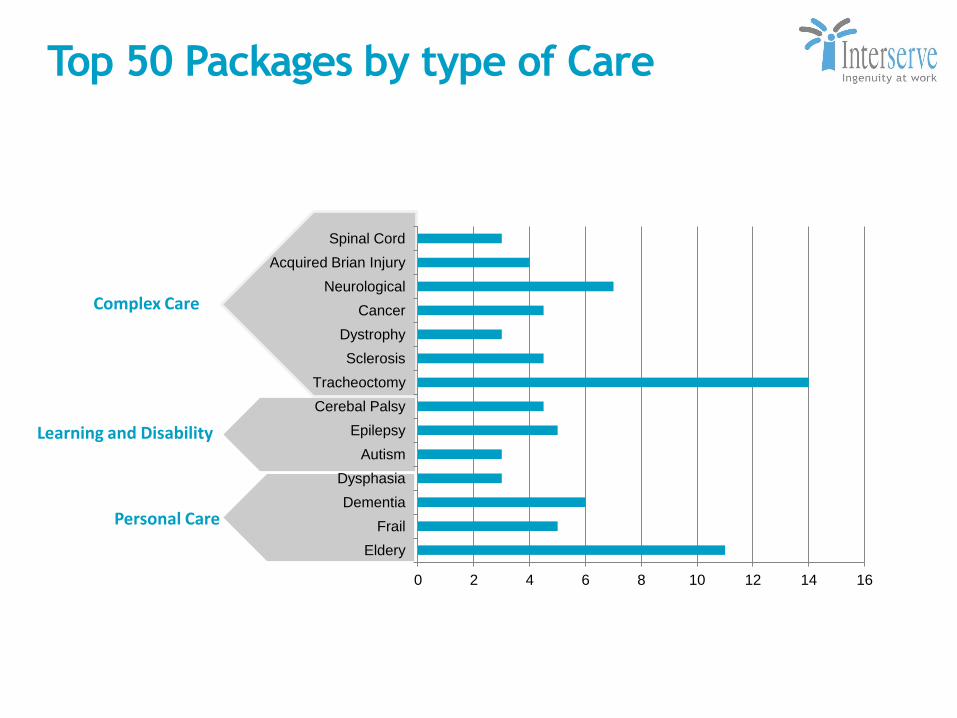
Top 50 Packages by type of Care
0 2 4 6 8 10 12 14 16
Eldery
Frail
Dementia
Dysphasia
Autism
Epilepsy
Cerebal Palsy
Tracheoctomy
Sclerosis
Dystrophy
Cancer
Neurological
Acquired Brian Injury
Spinal Cord
Complex Care
Learning and Disability
Personal Care
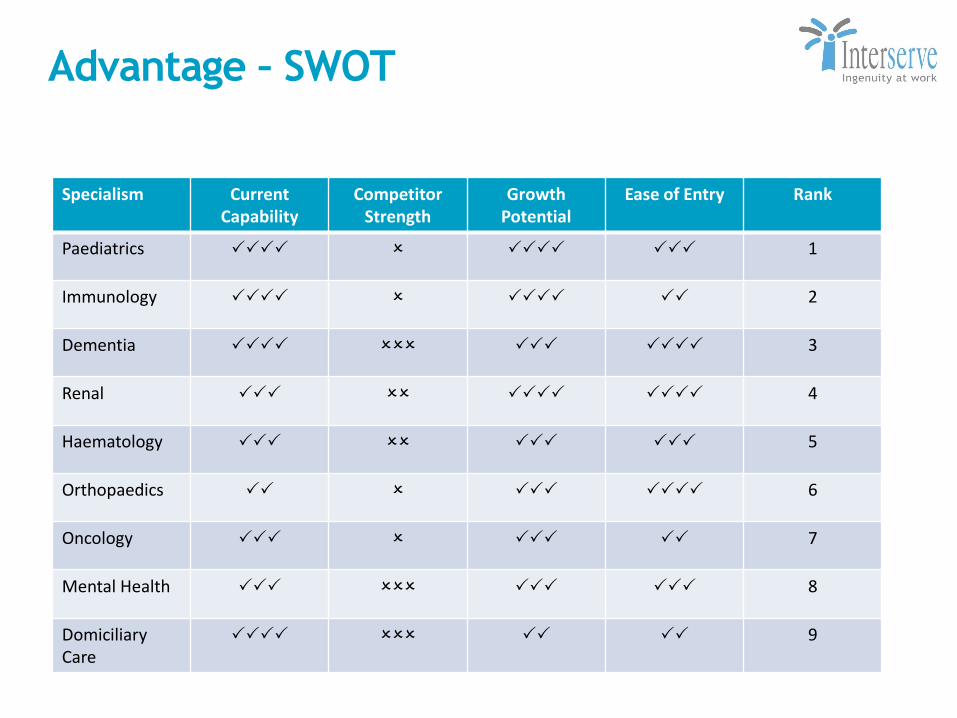
Advantage – SWOT
Specialism Current Capability
Competitor Strength
Growth Potential
Ease of Entry Rank
Paediatrics PPPP O PPPP PPP 1
Immunology PPPP O PPPP PP 2
Dementia PPPP OOO PPP PPPP 3
Renal PPP OO PPPP PPPP 4
Haematology PPP OO PPP PPP 5
Orthopaedics PP O PPP PPPP 6
Oncology PPP O PPP PP 7
Mental Health PPP OOO PPP PPP 8
Domiciliary Care
PPPP OOO PP PP 9
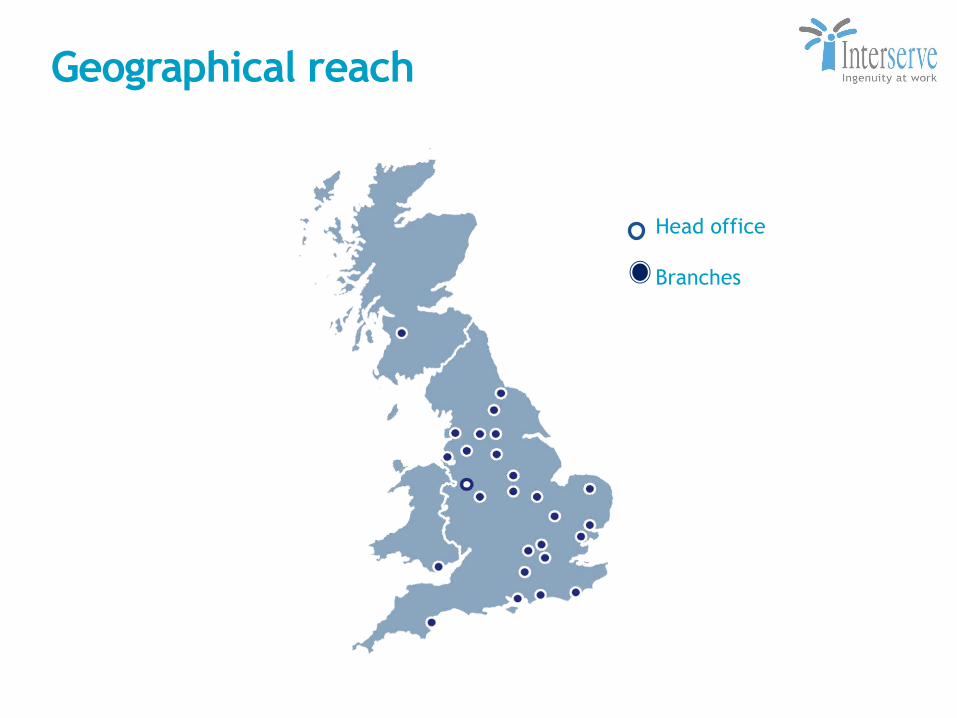
Geographical reach
Head office
Branches
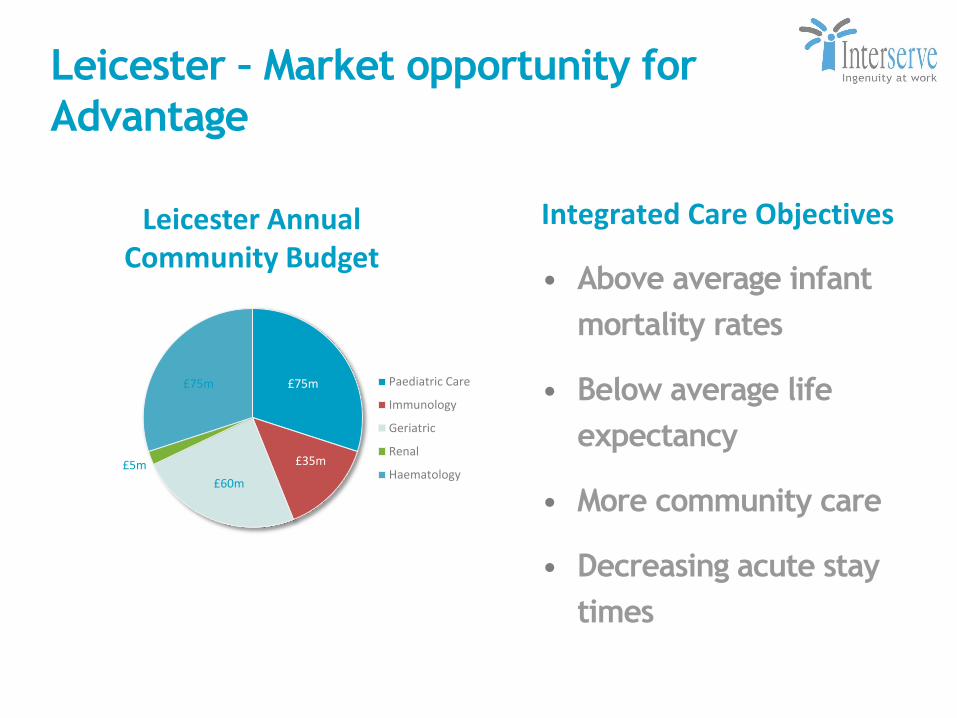
Leicester – Market opportunity for
Advantage
£75m
£35m
£60m
£5m
£75m Paediatric Care
Immunology
Geriatric
Renal
Haematology
Integrated Care Objectives
• Above average infant
mortality rates
• Below average life
expectancy
• More community care
• Decreasing acute stay
times
Leicester Annual Community Budget
Summary
• Healthcare outsourcing is a growing market (5-10%) and has significant potential for more
• Community and estate management are fastest developing
• Advantage Healthcare well positioned to take advantage of the Community market
• Leicester is a unique arrangement applicable to other estates in the UK

Questions

Lord Adonis – UK
Outsourcing and
Infrastructure

Questions

Coffee Break
Construction and
Support Services
International:
George Franks
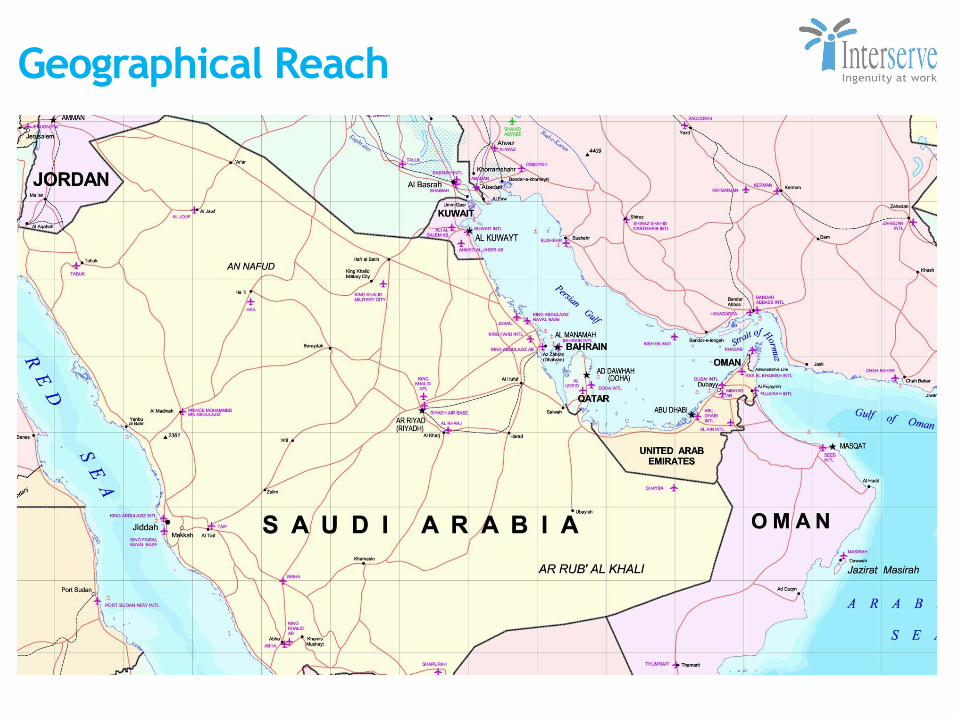
Geographical Reach
Macro Economic Issues in the Middle East
• Oil and Gas price
• Population growth (2-6% v’s UK 0.5%)
• Rapid urbanisation
• Arab Spring: Has resulted in an opening of the purse
strings.
• Spend on housing, infrastructure, education & social
care.
• Positioned well as economic might shifts towards the
east
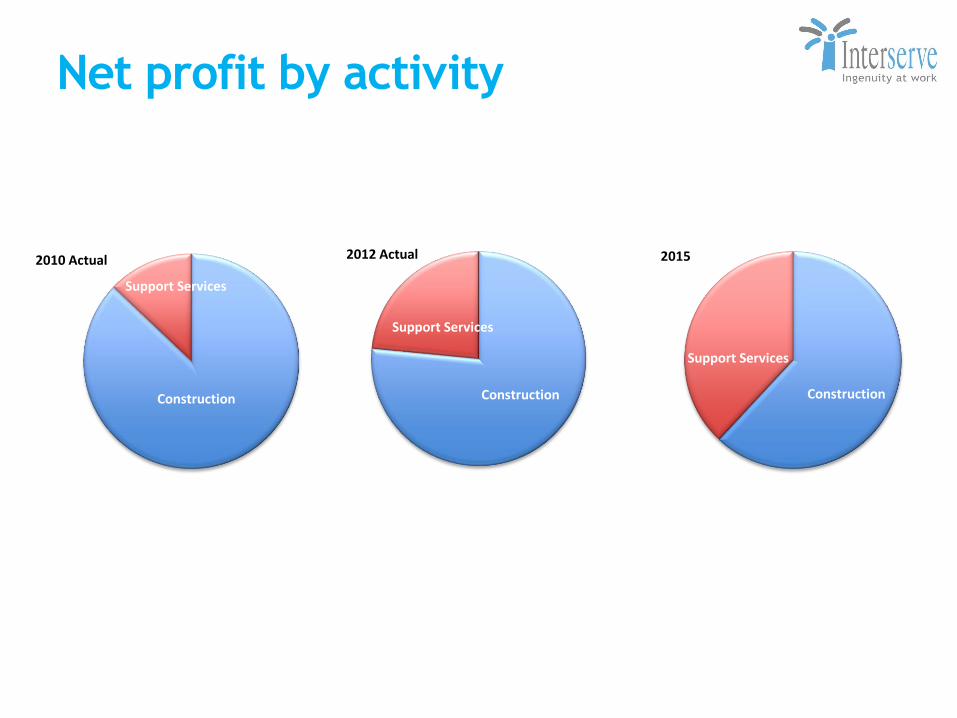
Net profit by activity
2010 Actual
Construction
Support Services
Construction
Support Services
2012 Actual
Construction
Support Services
2015
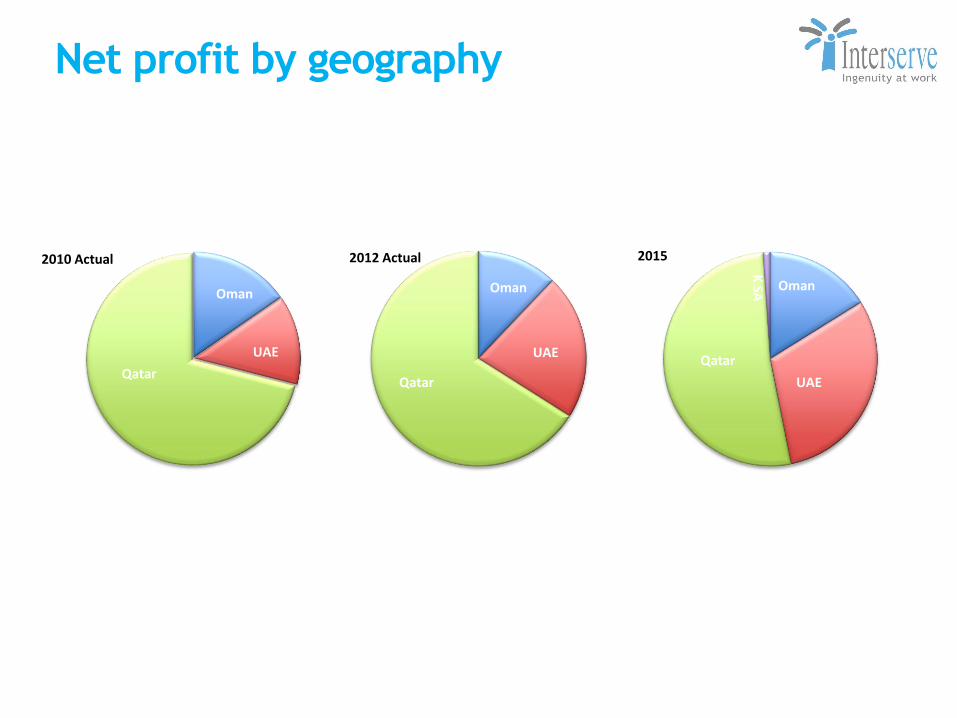
Net profit by geography
Oman
Qatar
2010 Actual 2012 Actual
Oman
UAE
Qatar
2015
Oman
UAE
Qatar
K SA
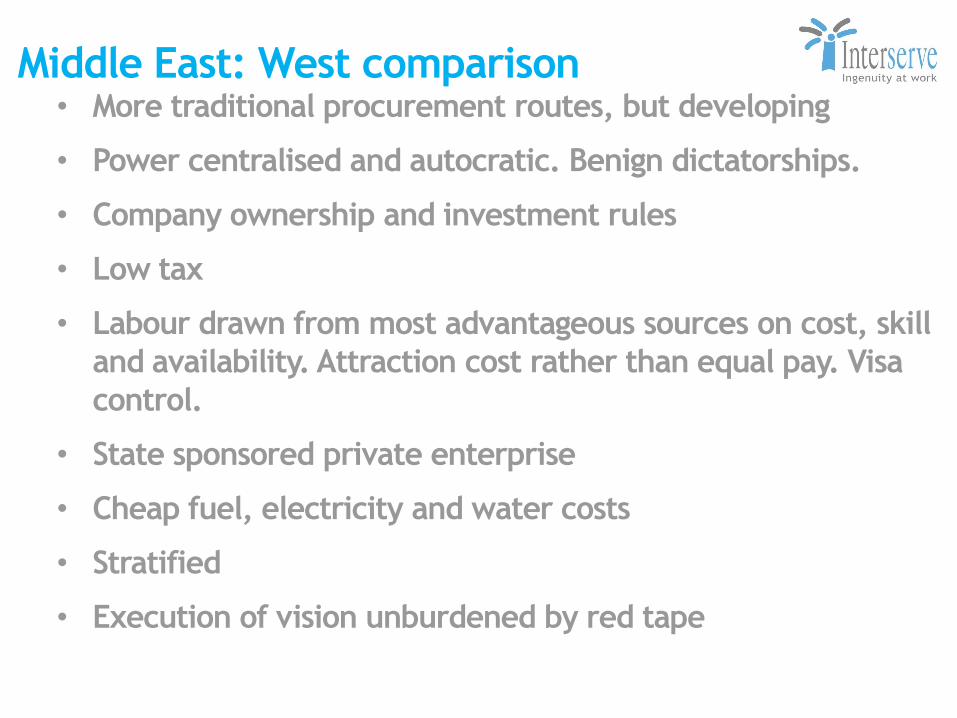
Middle East: West comparison • More traditional procurement routes, but developing
• Power centralised and autocratic. Benign dictatorships.
• Company ownership and investment rules
• Low tax
• Labour drawn from most advantageous sources on cost, skill
and availability. Attraction cost rather than equal pay. Visa
control.
• State sponsored private enterprise
• Cheap fuel, electricity and water costs
• Stratified
• Execution of vision unburdened by red tape
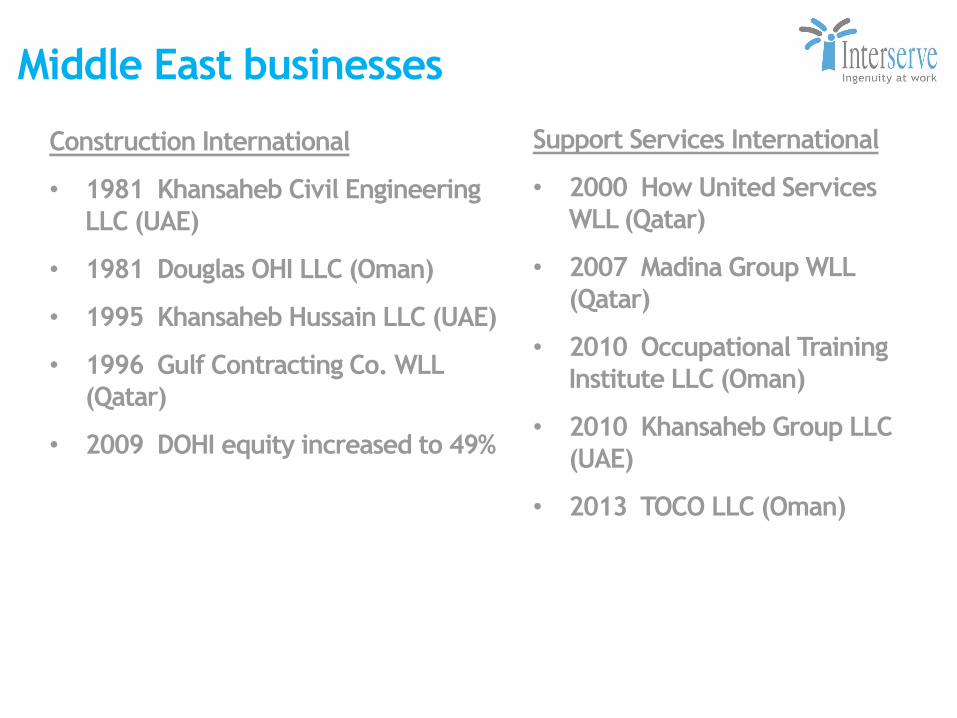
Middle East businesses
Construction International
• 1981 Khansaheb Civil Engineering
LLC (UAE)
• 1981 Douglas OHI LLC (Oman)
• 1995 Khansaheb Hussain LLC (UAE)
• 1996 Gulf Contracting Co. WLL
(Qatar)
• 2009 DOHI equity increased to 49%
Support Services International
• 2000 How United Services
WLL (Qatar)
• 2007 Madina Group WLL
(Qatar)
• 2010 Occupational Training
Institute LLC (Oman)
• 2010 Khansaheb Group LLC
(UAE)
• 2013 TOCO LLC (Oman)
Construction International
• Market still tight in all 3 countries of operation
• Strategy to hold our nerve, avoid diving in and taking low
margin/high risk work, maintain capabilities and wait for the upturn.
• UAE looks set to recover first
• Qatar will recover soon but too many new entrants to the market are
depressing prices.
• Oman remains competitive.
• We have taken time over the last three years to
• Strengthen and re-organise our businesses
• Improve efficiency
• Replace overtime with productivity schemes
• Open up new procurement routes and develop our internal
supply chain
• Grow our specialist divisions and target growth opportunities
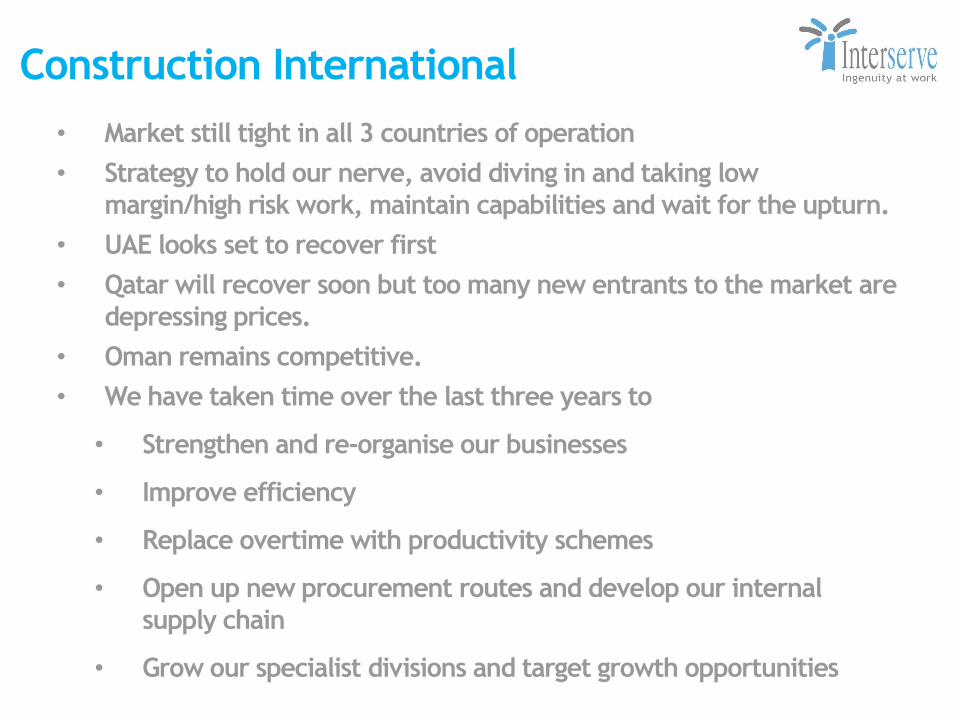
Strategy Outcomes
Buildings (Jumeirah Beach Residences) Civils (Al Furjan)
Support Services Specialist Divisions (Ritz Carlton Hotel)
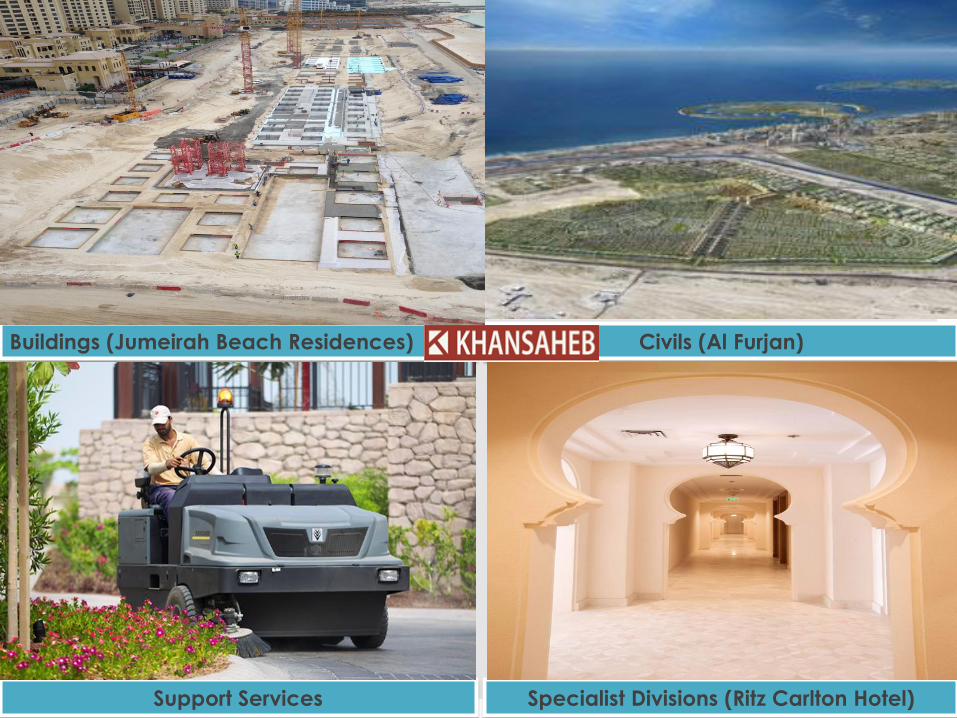
Strategy Outcomes
Construction (Sohar Court) Construction (Al Sukri)
Civils (Sur IPP) Specialist (HSBC Fit-Out)
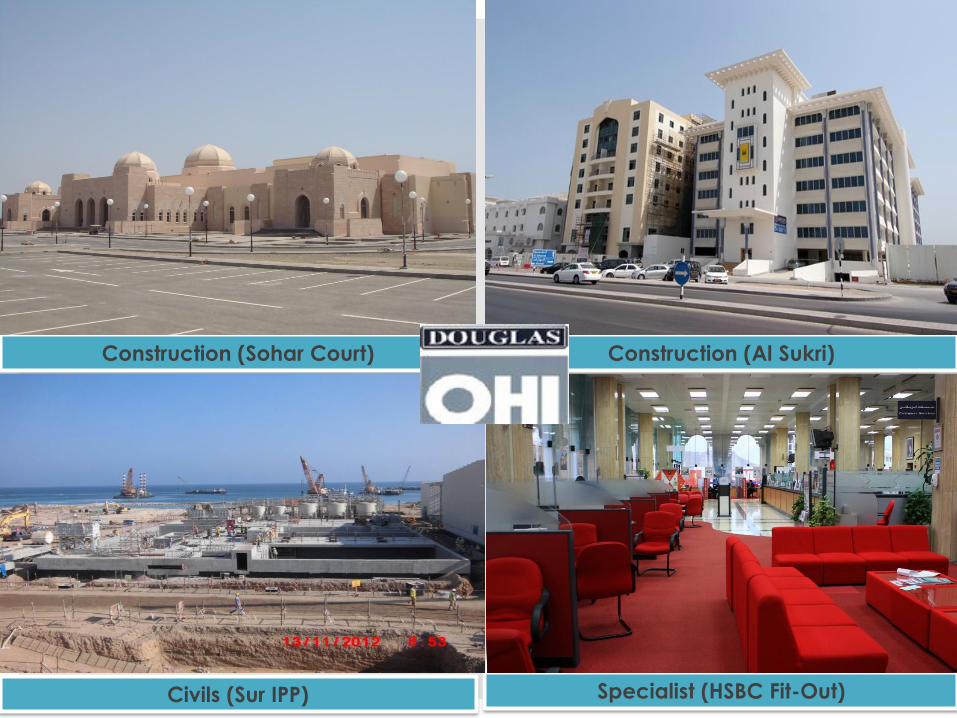
Strategy Outcomes
Construction (Barzan) Spacemaker (Barzan)
Bionest Specialist Div. (Commercial Law Court)
Support Services International: 2012
• Two principal areas of operation, engineering and
facilities services
• Expanded our reach – acquisition of TOCO
• Grown our offering – Shutdowns and increased customer
base
• Senior team seconded in to International from Interserve
UK to grow the facilities services business as a strategic
priority.
• Ability to support with resource and infrastructure from
existing businesses
• Looking for suitable acquisitions/ investments in UAE,
Oman and KSA
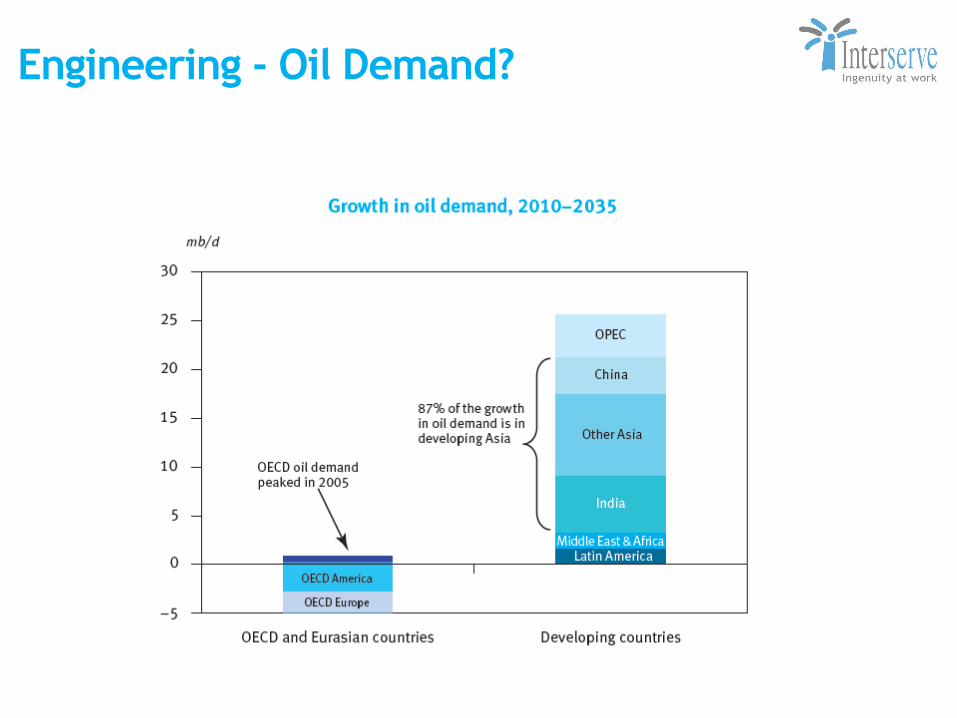
Engineering - Oil Demand?
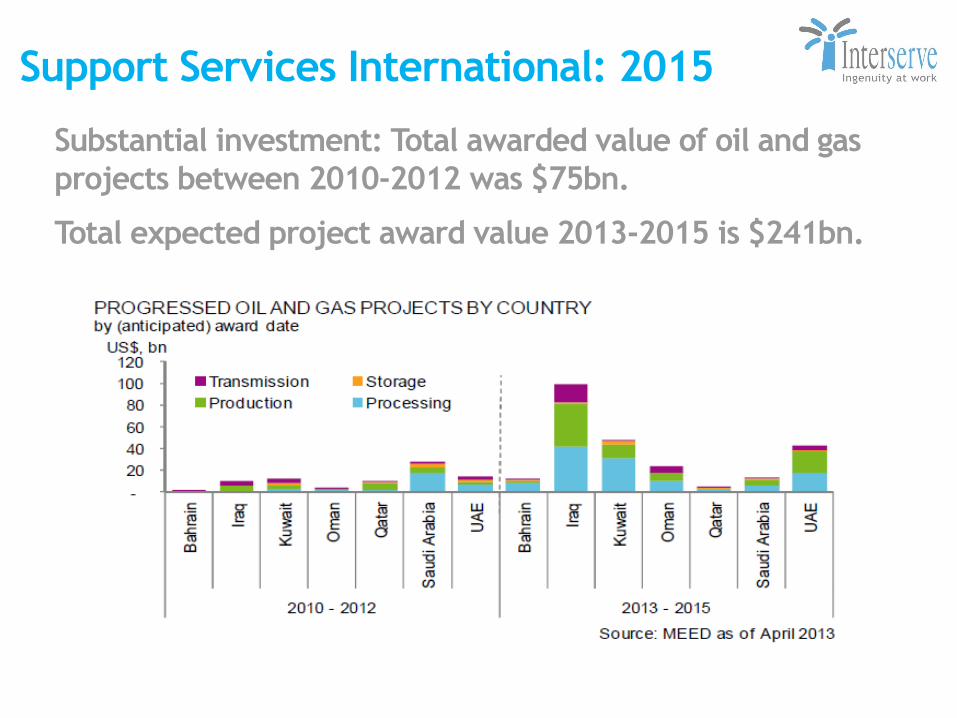
Support Services International: 2015
Substantial investment: Total awarded value of oil and gas
projects between 2010-2012 was $75bn.
Total expected project award value 2013-2015 is $241bn.
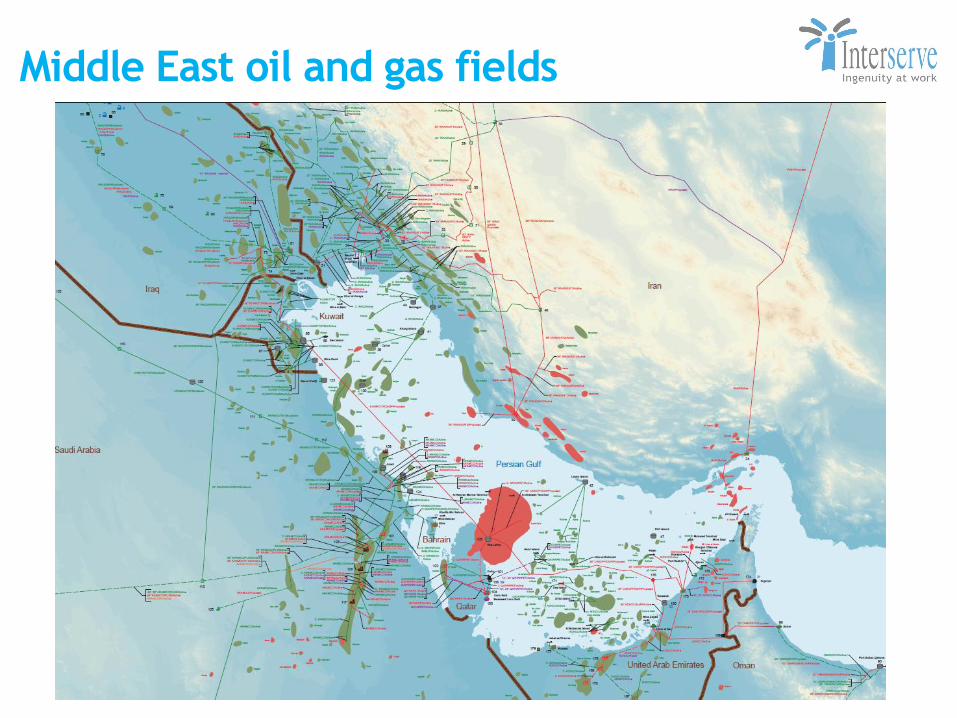
Middle East oil and gas fields
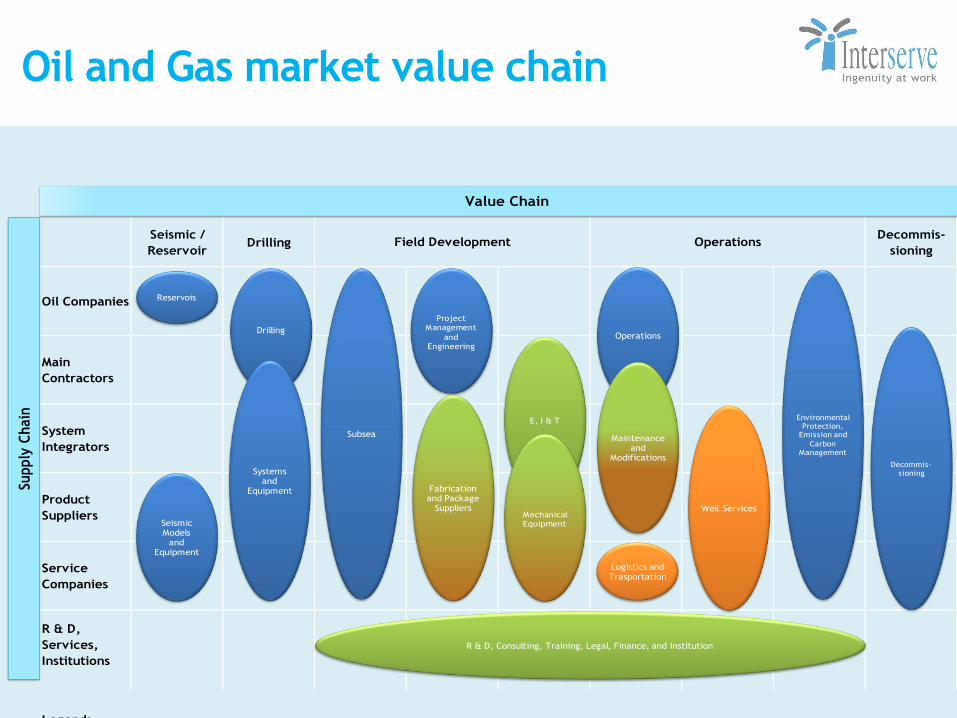
Oil and Gas market value chain
Seismic /
ReservoirDrilling
Decommis-
sioning
Oil Companies
Main
Contractors
System
Integrators
Product
Suppliers
Service
Companies
R & D,
Services,
Institutions
Legend:
Madina only
TOCO
Field Development Operations
Madina & TOCO
Supply
Chain
Value Chain
Reservois
Seismic Models
and Equipment
Drilling
Systemsand
Equipment
Subsea
Project Management
and Engineering
Fabrication and Package
Suppliers
E, I & T
Mechanical Equipment
Operations
Maintenanceand
Modifications
Logistics and Trasportation
Well Services
Environmental Protection,
Emission and
Carbon Management
Decommis-sioning
R & D, Consulting, Training, Legal, Finance, and Institution
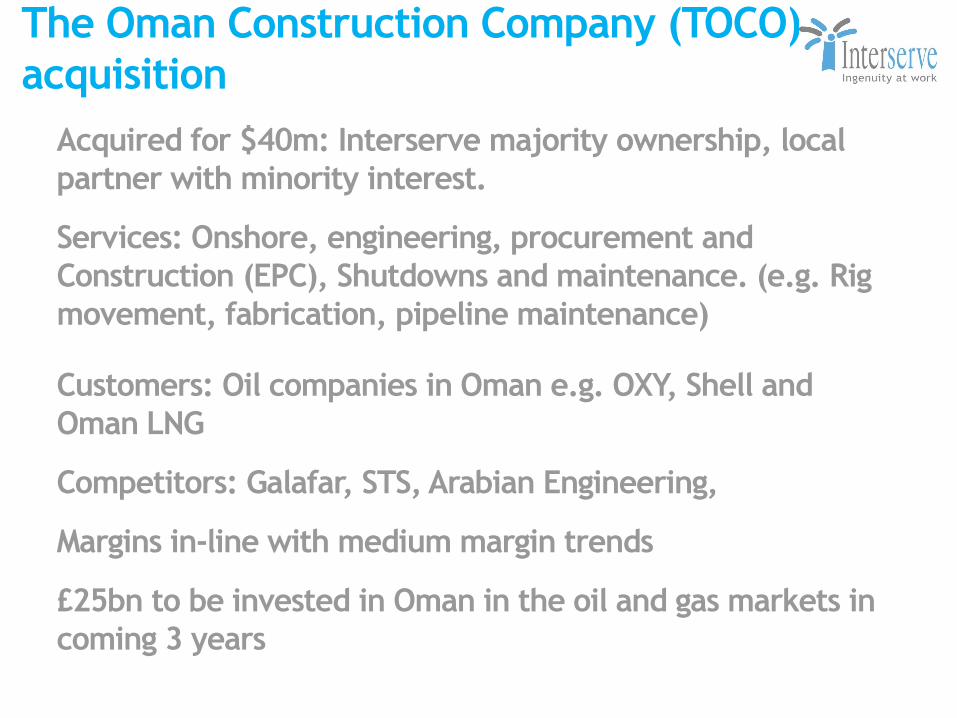
The Oman Construction Company (TOCO)
acquisition
Acquired for $40m: Interserve majority ownership, local
partner with minority interest.
Services: Onshore, engineering, procurement and
Construction (EPC), Shutdowns and maintenance. (e.g. Rig
movement, fabrication, pipeline maintenance)
Customers: Oil companies in Oman e.g. OXY, Shell and
Oman LNG
Competitors: Galafar, STS, Arabian Engineering,
Margins in-line with medium margin trends
£25bn to be invested in Oman in the oil and gas markets in
coming 3 years
65
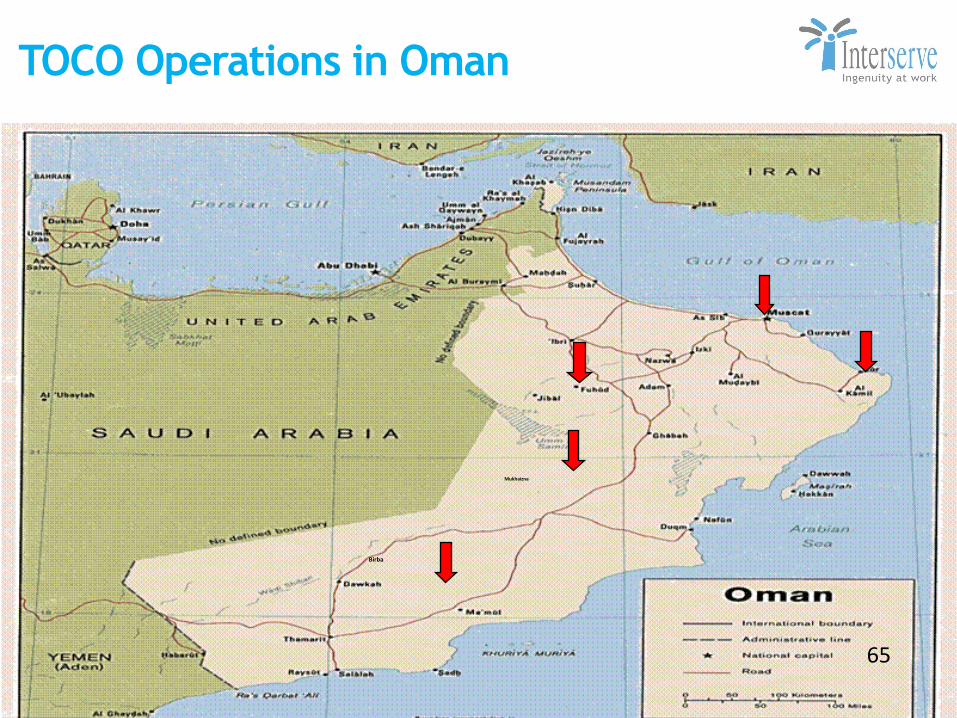
TOCO Operations in Oman
Birba
Mukhaizna
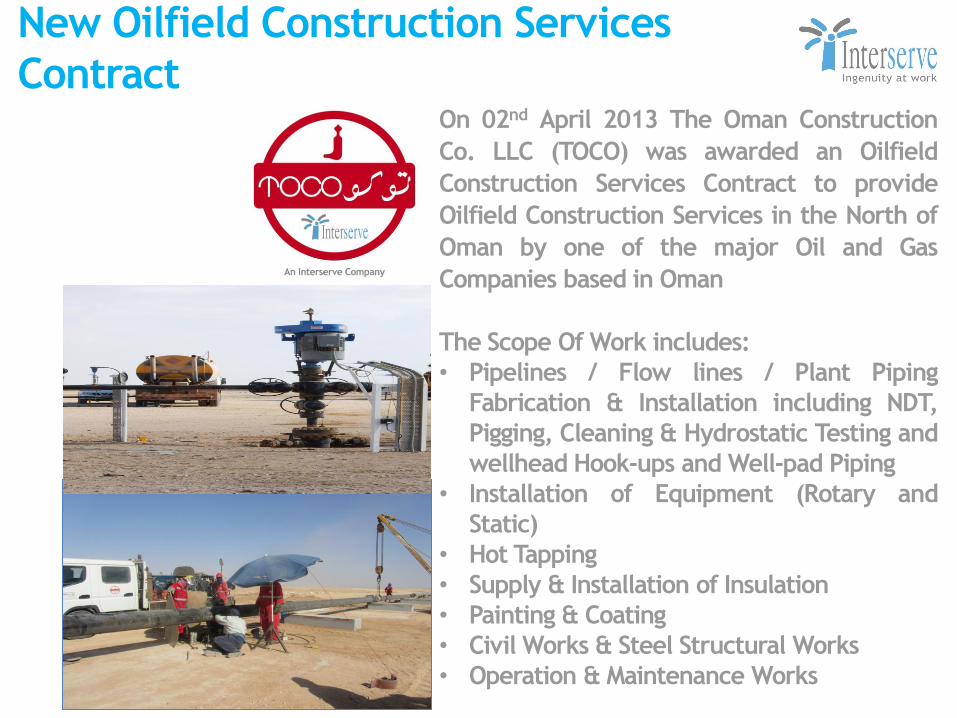
New Oilfield Construction Services
Contract On 02nd April 2013 The Oman Construction
Co. LLC (TOCO) was awarded an Oilfield
Construction Services Contract to provide
Oilfield Construction Services in the North of
Oman by one of the major Oil and Gas
Companies based in Oman
The Scope Of Work includes:
• Pipelines / Flow lines / Plant Piping
Fabrication & Installation including NDT,
Pigging, Cleaning & Hydrostatic Testing and
wellhead Hook-ups and Well-pad Piping
• Installation of Equipment (Rotary and
Static)
• Hot Tapping
• Supply & Installation of Insulation
• Painting & Coating
• Civil Works & Steel Structural Works
• Operation & Maintenance Works
Support Services International
Facilities Services market:
• Hard and soft services currently delivered through Khansaheb Group
and How United Services. T/O Circa £13m p.a.
• We are demonstrating margin of 10%, and above, deliverable at site.
• Currently sectors include; residential, education, hospitality,
industrial, retail, health, defence and commercial.
• Focus on growth through, organic means, supporting new start ups
and acquisition.
• Development support is being provided from Group centre and bid
support from Support Services in the UK for strategic bids.
• Aim to register majority owned businesses in Oman and KSA in 2013
• Sustainability becoming more important
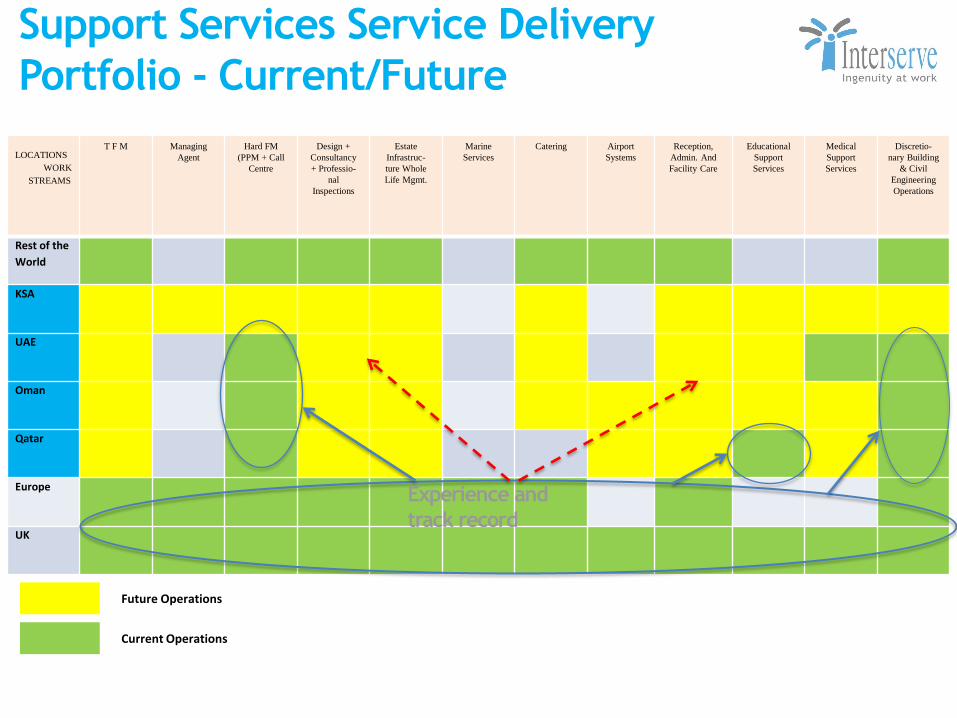
Future Operations
LOCATIONS
WORK
STREAMS
T F M Managing
Agent
Hard FM
(PPM + Call
Centre
Design +
Consultancy
+ Professio-
nal
Inspections
Estate
Infrastruc-
ture Whole
Life Mgmt.
Marine
Services
Catering Airport
Systems
Reception,
Admin. And
Facility Care
Educational
Support
Services
Medical
Support
Services
Discretio-
nary Building
& Civil
Engineering
Operations
Rest of the
World
KSA
UAE
Oman
Qatar
Europe
UK
Support Services Service Delivery
Portfolio - Current/Future
Current Operations
Experience and
track record
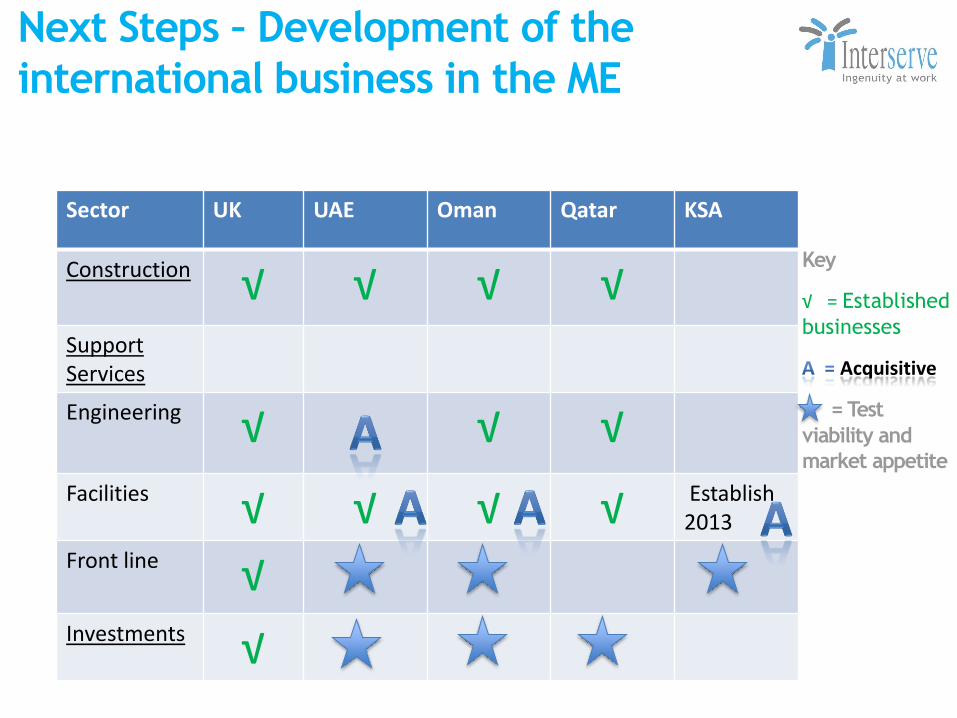
Next Steps – Development of the
international business in the ME
Sector UK UAE Oman Qatar KSA
Construction √ √ √ √ Support Services
Engineering √ √ √ Facilities √ √ √ √ Establish
2013
Front line √ Investments √
Key
√ = Established
businesses
Acquisitive
= Test
viability and
market appetite
Summary
• Recovery in construction is coming, maintain and
position to take advantage. Construction will continue to
be a major part of our business.
• Expansion of support services (engineering and facilities)
a strategic priority to become a significant player in ME
by 2015. Thus developing a more balanced portfolio.
• Look into new markets where we believe opportunities
exist at acceptable risk and we can bring value.
• Test market appetite for investment offerings and
frontline services
Equipment Services:
Ian Hayes
Building Strong Core businesses
Expand Internationally
Capturing related expansion
opportunities
H1 2012 Highlights
Disposal of PFI Assets
Frontline public services (Justice, Welfare,
Health)
Energy-from-waste (Westbury/Glasgow/
Peterborough)
[Omani industrial sector]
Equipment Services: Panama, Chile, Colombia
and export growth
Middle East interiors businesses
Expansion into Omani oil and gas services
Future Workload Growth
Revenue and profit growth
Strong Cash Conversion
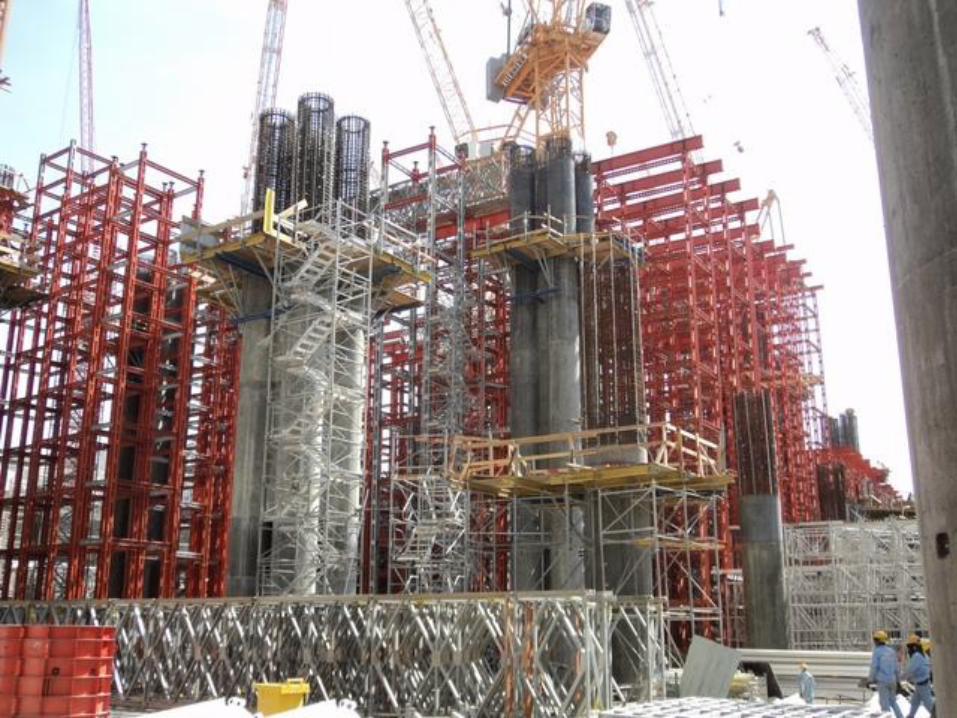
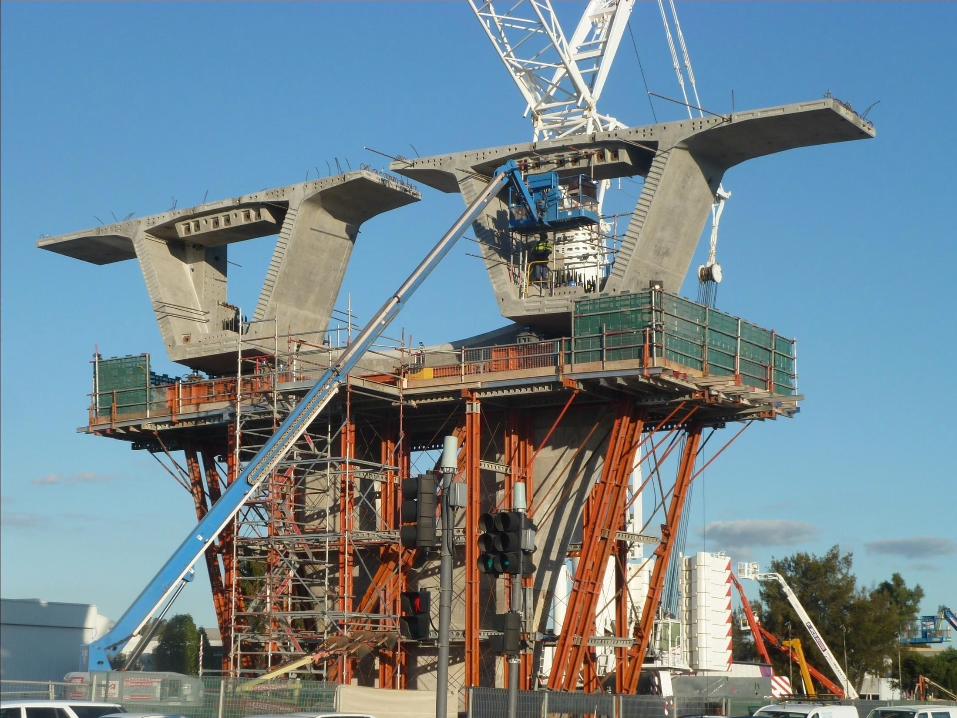
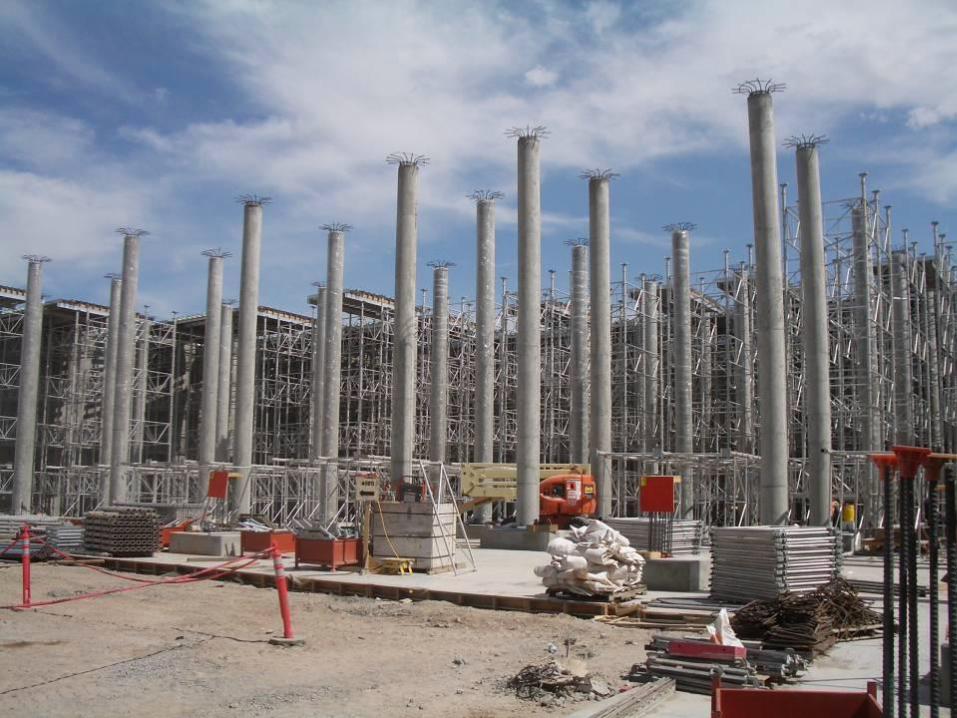
Strategy Outcomes
Interserve Equipment Services
RMD Kwikform
Vision and Strategy
We aspire to be the Best Formwork and Shoring Company in the World
To manage a de-centralised portfolio of companies with a Divisional overlay that binds them together to:
• Operate accident free
• Live our values
• Be market driven
• Seek to be in the top 3 of each of our operating markets
Financial targets - profit growth, ROCE, double digit margins
Building Strong Core businesses
Expand Internationally
Capturing related expansion
opportunities
H1 2012 Highlights
Disposal of PFI Assets
Frontline public services (Justice, Welfare,
Health)
Energy-from-waste (Westbury/Glasgow/
Peterborough)
[Omani industrial sector]
Equipment Services: Panama, Chile, Colombia
and export growth
Middle East interiors businesses
Expansion into Omani oil and gas services
Future Workload Growth
Revenue and profit growth
Strong Cash Conversion
Strategy Outcomes Note - Insert photo of Shroud / roof over Hotel in Abu Dhabi so i can talk to how we add value as part of next slide
Drivers of the Business
RMDk Value add
Utilisation
Margin
Markets / competitors
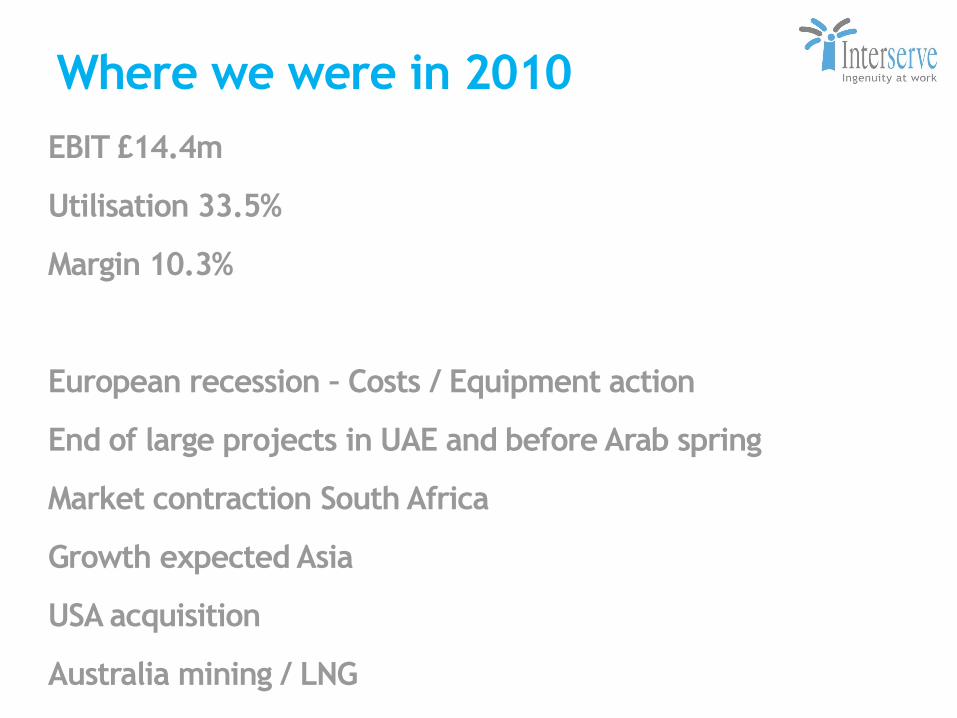
Where we were in 2010
EBIT £14.4m
Utilisation 33.5%
Margin 10.3%
European recession – Costs / Equipment action
End of large projects in UAE and before Arab spring
Market contraction South Africa
Growth expected Asia
USA acquisition
Australia mining / LNG
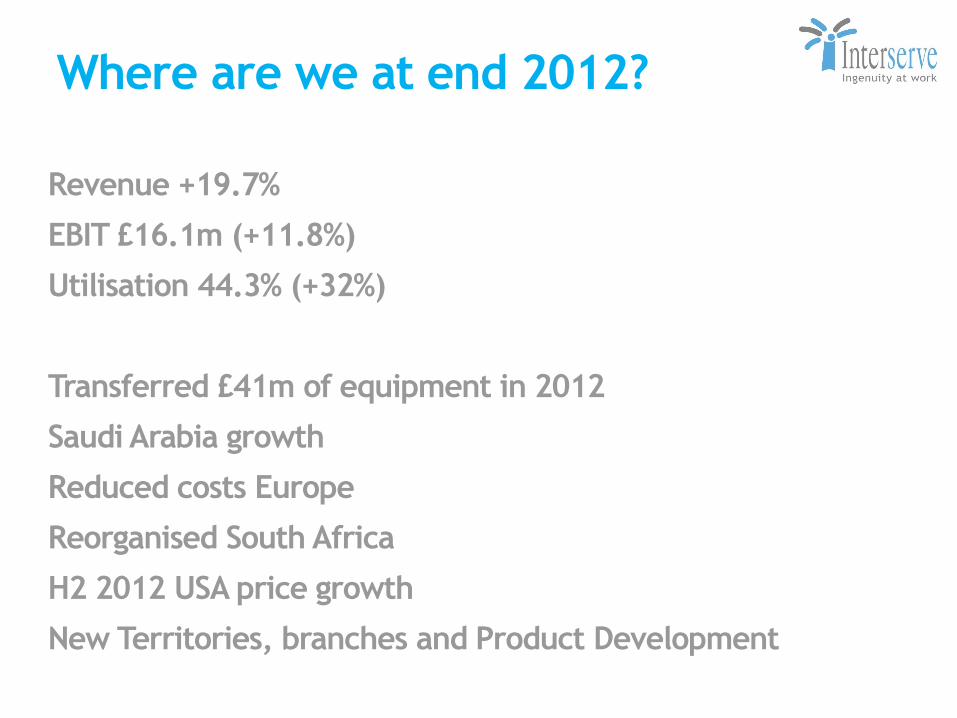
Where are we at end 2012?
Revenue +19.7%
EBIT £16.1m (+11.8%)
Utilisation 44.3% (+32%)
Transferred £41m of equipment in 2012
Saudi Arabia growth
Reduced costs Europe
Reorganised South Africa
H2 2012 USA price growth
New Territories, branches and Product Development
Building Strong Core businesses
Expand Internationally
Capturing related expansion
opportunities
H1 2012 Highlights
Disposal of PFI Assets
Frontline public services (Justice, Welfare,
Health)
Energy-from-waste (Westbury/Glasgow/
Peterborough)
[Omani industrial sector]
Equipment Services: Panama, Chile, Colombia
and export growth
Middle East interiors businesses
Expansion into Omani oil and gas services
Future Workload Growth
Revenue and profit growth
Strong Cash Conversion
Strategy Outcomes Insert Photo of ME / Saudi project

Building Strong Core businesses
Expand Internationally
Capturing related expansion
opportunities
H1 2012 Highlights
Disposal of PFI Assets
Frontline public services (Justice, Welfare,
Health)
Energy-from-waste (Westbury/Glasgow/
Peterborough)
[Omani industrial sector]
Equipment Services: Panama, Chile, Colombia
and export growth
Middle East interiors businesses
Expansion into Omani oil and gas services
Future Workload Growth
Revenue and profit growth
Strong Cash Conversion
Strategy Outcomes
Building Strong Core businesses
Expand Internationally
Capturing related expansion
opportunities
H1 2012 Highlights
Disposal of PFI Assets
Frontline public services (Justice, Welfare,
Health)
Energy-from-waste (Westbury/Glasgow/
Peterborough)
[Omani industrial sector]
Equipment Services: Panama, Chile, Colombia
and export growth
Middle East interiors businesses
Expansion into Omani oil and gas services
Future Workload Growth
Revenue and profit growth
Strong Cash Conversion
Strategy Outcomes Insert Photo – Australia project
Building Strong Core businesses
Expand Internationally
Capturing related expansion
opportunities
H1 2012 Highlights
Disposal of PFI Assets
Frontline public services (Justice, Welfare,
Health)
Energy-from-waste (Westbury/Glasgow/
Peterborough)
[Omani industrial sector]
Equipment Services: Panama, Chile, Colombia
and export growth
Middle East interiors businesses
Expansion into Omani oil and gas services
Future Workload Growth
Revenue and profit growth
Strong Cash Conversion
Strategy Outcomes
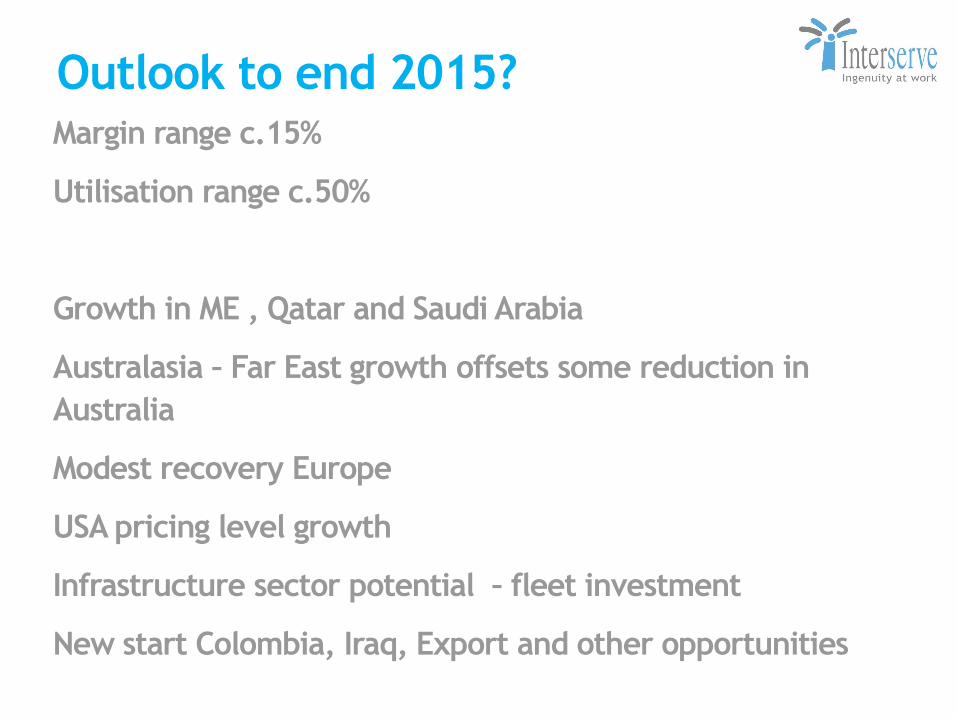
Outlook to end 2015? Margin range c.15%
Utilisation range c.50%
Growth in ME , Qatar and Saudi Arabia
Australasia – Far East growth offsets some reduction in
Australia
Modest recovery Europe
USA pricing level growth
Infrastructure sector potential – fleet investment
New start Colombia, Iraq, Export and other opportunities
Summary Building on client relationships and investing in new
opportunities
Optimising deployment of hire fleet equipment
Improved Utilisation to c50%
Pricing strength
Medium term margin trend of 15%

Questions
Investor relations contact:
Matt Hickman, Investor Relations Manager
0118 960 2280


