33
Adverse Events in Hospitals: How Many and Why Not Reported Fran Griffin Senior Manager Clinical Programs, BD
Adverse Events in Hospitals: How Many
and Why Not Reported
Fran Griffin
Senior Manager
Clinical Programs, BD

Disclosure
• Currently full time employed at BD
and faculty at The Institute for Healthcare
Improvement (IHI)
• Previously full time employee at IHI from
2002-2010

What is harm?
• Merriam Webster • physical or mental damage
• The Free Dictionary • physical or mental injury or damage
• Institute for Healthcare Improvement • unintended physical injury resulting from or
contributed to by medical care that requires additional monitoring, treatment or hospitalization, or that results in death*
*Griffin FA, Resar RK. IHI Global Trigger Tool for Measuring Adverse Events. IHI Innovation Series white paper. Cambridge,
Massachusetts: Institute for Healthcare Improvement; 2009.
(Available on www.IHI.org)

Error vs. Adverse Event (or harm)
• “Error”: process-focus, preventability
• “Adverse event”: outcome focus, harm
experienced by patient
Errors Adverse
Events

Measuring Harm
• Traditional Measurement Approaches
• Voluntary reports
• Safety indicators based on billing codes (AHRQ)
• Complications
• Morbidity & Mortality Reviews

How safe are we? Comparison Between Industries
100,000
10
1
DEFECTS 50% 31% 7% 1% 0.02% 0.0003%
•
REFERENCE: René Amalberti
Very unsafe Ultra safe
•
•
IHI GTT – 45
events per
100
admissions
JCAHO SE:
14 events
per
1,000,000
admissions*
*JCAHO sentinel events statistics 2006
AHA : hospital admissions, 2006 survey
PPM
Nuclear
Industry
Domestic
Airline Flight
Fatality Rate
(0.43 PPM)
Airline Baggage Handling
Blood transfusion
IRS - Tax Advice
(phone-in)
(140,000 PPM)
10
1000
10,000
1
10
100
1
1,000,000
Institute for Healthcare Improvement
(IHI) Trigger Tools
• Retrospective review of closed patient
records
• Check for “triggers” or clues to harm
• Examples: transfusions, Benadryl, Narcan
• Count all unintended consequences of
medical care
• Focus on events of comission – not omission
• Faster than “reading” records
• Uses sampling for measure over time

Process
• Random selection of records
• Review using trigger tool process
by 2 independent mid-level reviewers
(clinical, non-physician)
• Consensus reviewed by physician
• Determine harm from patient’s viewpoint
without regard for preventability
FOCUS: unintended
• Assign level of harm to each individual event

Categories of Harm (adapted from NCC MERP Index)
E - Temporary harm, intervention required
F - Temporary harm, initial or prolonged hospitalization
G - Permanent patient harm
H - Life sustaining intervention required
I - Contributing to death

So…..
• How much harm?
• Are there differences in methods?

Multi-center ADE Data
• 2837 charts reviewed using trigger tool
• 86 institutions
• 720 ADE’s found
• 268,796 medications doses administered
• ADE’s/1000 doses = 2.67
• Admissions with ADE’s = 24.9%
Rozich JD, Haraden CR, Resar RK The adverse drug event trigger tool: A practical methodology for measuring
medication-related harm. Journal Quality and Safety in Health Care June 2003

ICU Trigger Tool Data
1294 patient records reviewed
• 1450 events detected in 55% of patients
• 28% > 1 event
• 18% medication related
• 11% in E-codes
• LOS
• 8.9 days with events
• 4.3 day without events
Resar RK, Rozich JD, Classen D Methodology and rationale for the measurement of harm with trigger
tools. Quality and Safety in Health Care. Vol 12. December 2003

Surgical Trigger Tool Data from IHI Collaborative
• 11 hospitals
• Time period – over 1 year
• Data submitted – 1-8 months (avg 4)
• 854 charts reviewed
• 139 Adverse Events in 125 Patients
• 14.6% of patients
• 8% of events were G, H or I
Griffin FA, Classen DC. Detection of adverse events in surgical patients using the Trigger Tool approach. Qual. Saf. Health Care
2008 17: 253-258.
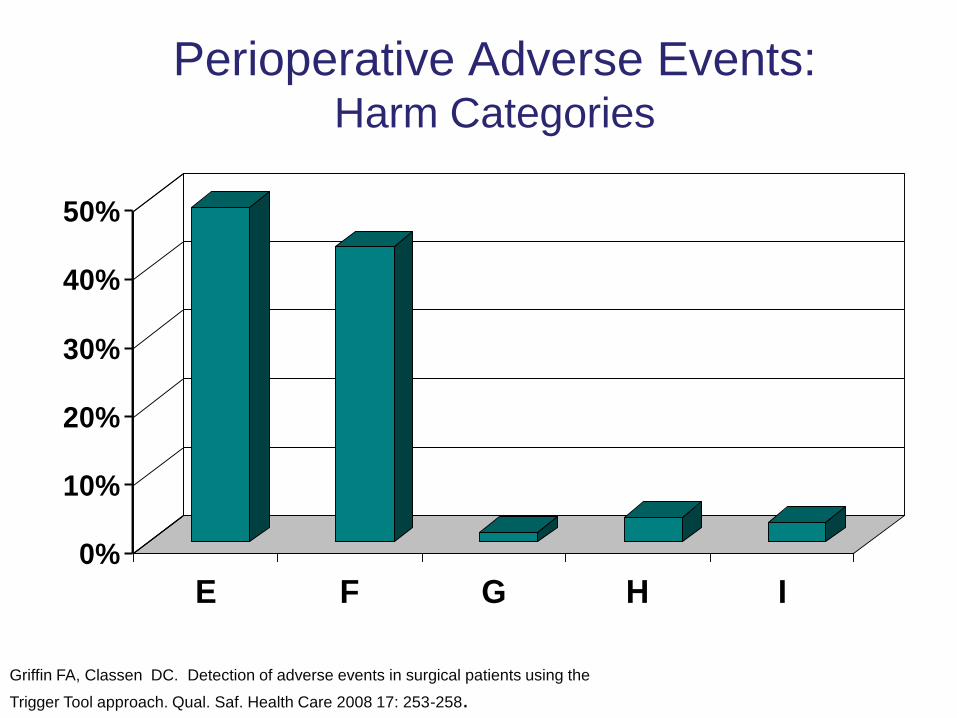
Perioperative Adverse Events: Harm Categories
0%
10%
20%
30%
40%
50%
E F G H I
Griffin FA, Classen DC. Detection of adverse events in surgical patients using the
Trigger Tool approach. Qual. Saf. Health Care 2008 17: 253-258.

0 5 10 15 20
pain
nausea/vom
anticoag
narcotic
neurologic
GI
other
pulmonary
infection
Griffin FA, Classen DC. Detection of adverse events in surgical patients using the
Trigger Tool approach. Qual. Saf. Health Care 2008 17: 253-258.
cardiac
injury
bleeding

Global Trigger Tool
• Extension from the topic & location focused trigger
tools
• Uses multiple modules of triggers • Cares
• Critical Care
• Medication
• Surgery
• L&D
• Gathers events from the whole hospital
• Establishes a global harm measure for hospital
• Resource friendly - no dependency on high tech

Considerations
• 75% of all events will be picked up by both
reviewers
(these are the G,H,I harm levels)
• 25% of events will be picked up by one or
the other reviewer (most often are E and F
levels)
• Definitions of harm become more standard
with 2 reviewers
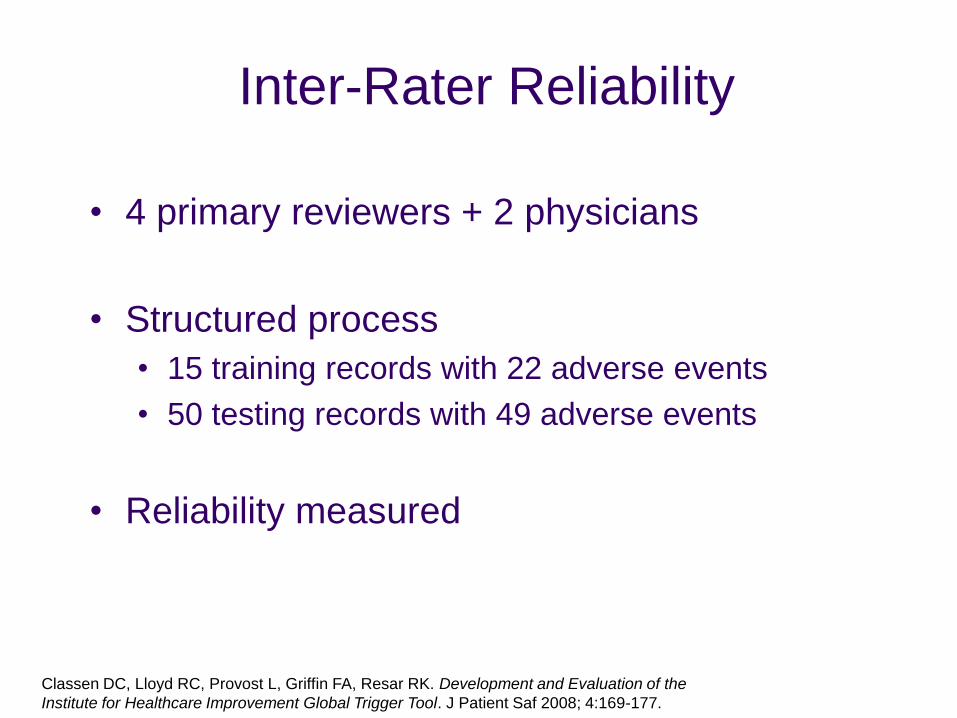
Inter-Rater Reliability
• 4 primary reviewers + 2 physicians
• Structured process
• 15 training records with 22 adverse events
• 50 testing records with 49 adverse events
• Reliability measured
Classen DC, Lloyd RC, Provost L, Griffin FA, Resar RK. Development and Evaluation of the
Institute for Healthcare Improvement Global Trigger Tool. J Patient Saf 2008; 4:169-177.

Process
1. All reviewers read GTT White Paper
2. Physicians thoroughly reviewed 15 records
3. Primary reviewers: independent GTT
reviews with 20 minute limit
4. Discussion & consensus
5. 2 hour training session
6. All reviewers completed GTT review of 50
records

Classen DC, Lloyd RC, Provost L, Griffin FA, Resar RK. Development and Evaluation of the
Institute for Healthcare Improvement Global Trigger Tool. J Patient Saf 2008; 4:169-177.

Classen DC, Lloyd RC, Provost L, Griffin FA, Resar RK. Development and Evaluation of the
Institute for Healthcare Improvement Global Trigger Tool. J Patient Saf 2008; 4:169-177.
Results & Conclusions
• High level inter-relater reliability can be
achieved
• Improved from training to testing phase
• Agreement increased with severity of events
• Greatest disagreement: category E events
• Process can be replicated
Classen DC, Lloyd RC, Provost L, Griffin FA, Resar RK. Development and Evaluation of the
Institute for Healthcare Improvement Global Trigger Tool. J Patient Saf 2008; 4:169-177.

How much harm?
Classen DC, Resar R, Griffin F, et al. Global Trigger Tool shows that adverse events in hospitals may be ten times greater than
previously measured. Health Affairs. 2011 Apr;30(4):581-589.

Amount of Harm
• 3 tertiary care hospitals in US
• 795 records from Oct 2003 reviewed
• 393 adverse events total
• 33% of admissions
• 49 / 100 admissions
• 91 adverse events / 1000 patient days
Classen DC, Resar R, Griffin F, et al. Global Trigger Tool shows that adverse events in hospitals may be ten times greater than
previously measured. Health Affairs. 2011 Apr;30(4):581-589.

Methods of Detection
Classen DC, Resar R, Griffin F, et al. Global Trigger Tool shows that adverse events in hospitals may be ten times greater than
previously measured. Health Affairs. 2011 Apr;30(4):581-589.

US Government Study

OIG Study of
Medicare Beneficiaries
• 780 patient records from October 2008
• 13.5% with adverse events
• 13.5% with temporary harm
• 44% preventable
• $234 million excess cost
28%
with
adverse
event

Are we improving in the US?
Landrigan CP, Parry GJ, Bones CB, Hackbarth AD, Goldmann DA, Sharek PJ. Temporal trends in rates of
patient harm resulting from medical care. New England Journal of Medicine. 2010 Nov; 363(22):2124-2134.

North Carolina Harm Study
• 10 hospitals
• 2341 patient records from 5 year period
• 588 harms • 25 / 100 admissions
• Conclusions: • Harms remain common
• Little evidence of improvement
Landrigan CP, Parry GJ, Bones CB, Hackbarth AD, Goldmann DA, Sharek PJ. Temporal trends in rates of patient harm
resulting from medical care. New England Journal of Medicine. 2010 Nov; 363(22):2124-2134.

Results Across Studies
IHI GTT OIG NC Harm
% Harm 33% 28% 18%
Per 100
admission
s
49 36 25
Sample
differences
• 795 patients
• Ages 18+
• October 2003
• 3 Tertiary care
hospitals –
high case mix
index
• 780 patients
• Medicare only
• October 2008
• Multiple hospitals
& types (random
sample of
beneficiaries)
• POA excluded
• 2341 patients
• Ages 18+
• Jan 02 – Dec
07
• 10 hospitals,
various types

Common Concerns & Limitations
• Lack of universal harm definition
• Subjectivity
• Preventability
• Resources
• Collecting
• Improving
• Acting

Future Directions
• Elimination of Harm
• CMS Partnership for Patients
• Value-based Purchasing
• Score based on quality, improvement and
outcome
• Conditions not Reimbursed


