Discussion Draft AGP- 11 RETURN To ~UEWA iNf aRWJT tIfuICEWCER TOWARD GREATER FOOD SECURITY FOR INDONESIA An Overview of Issues and Prospects Country Case Study Report prepared as part of the Food Security Policy Work Program AGREP Division Working Paper No. 11 Economics & Policy Division Agriculture & Rural Development Department December 1977 Public Disclosure Authorized Public Disclosure Authorized Public Disclosure Authorized Public Disclosure Authorized Public Disclosure Authorized Public Disclosure Authorized Public Disclosure Authorized Public Disclosure Authorized
Transcript
Discussion Draft
AGP- 11
RETURN To ~UEWA
iNf aRWJT tIfuICEWCER
TOWARD GREATER FOOD SECURITY FOR INDONESIA
An Overview of Issues and Prospects
Country Case Study Report prepared as part
of the Food Security Policy Work Program
AGREP Division Working Paper No. 11
Economics & Policy DivisionAgriculture & Rural Development Department
III. PROJECTIONS 10Consumption 10Production 12The Domestic Gap 13Sensitivity 14
IV. MAJOR POLICY ISSUES 15
V. OTHER POLICY ISSUES 20
ANNEX 1. BASE DATA
ANNEX 2. METHODOLOGY FOR PROJECTIONS
List of Tables
Table 1 Land Potential for Agriculture & Land Use by Regions(1974)
Table 2 Population Projections by Age GroupTable 3 1970 Population DistributionTable 4 Population Distribution and DensityTable 5 Agricultural Sector's Share in the EconomyTable 6 Farm Size Distribution by Income GroupTable 7 Calorie Conversion Table by Region & ProvinceTable 8 Daily Per Capita Calorie ConsumptionTable 9 Daily Per Capita.Cereal Calorie ConsumptionTable 10 Daily Per Capita Cassava Calorie IntakeTable 11 Monthly Average Per Capita Expenditure by
Expenditure GroupTable 12 Monthly Average Per Capita Expenditure on FoodTable 13 Proportion of Total Expenditure Spent on FoodTable 14 Human Energy Requirements in Calories .Table 15 Calorie Deficit Population with Varied Food BasketsTable 16 Malnourished Population Assuming Poor & Mode
Income Group Food BasketTable 17 Projected Total Food Needs, Market Demand &
Production, Low Income Growth Rate ProjectionTable 18 Projected Total Food Needs, Market Demand &
Production, High Income Growth Rate ProjectionTable 19 Projected Total Food Needs and Market DemandTable 20 Projected Nutritional Gap in Grain Equivalents
(1985)Table 21 Projected Nutritional Gap in Grain Equivalents
(1995)Table 22 Projected Malnourished Population (1985)Table 23 Projected Malnourished Population (1995)Table 24 Projected Income Distribution Effects on
Calorie Consumption: 1985Table 25 Projected Income Distribution Effects on Calorie
Consumption: 1995Table 26 Projected Price Change Effects on Calorie
Consumption: 1985Table 27 Projected Price Change Effects on Calorie
Consumption: 1995Table 28 Projected Income Distribution Effects on
Calorie Consumption (as % of Calorie Requirement)Table 29 Projected Price Change Effects on Calorie
Consumption (as % of Calorie Requirement)Table 30 Least Cost Diet (Per Capita Per Day)
List of Figures
Figure 1 Per Capita Production, Imports and Domestic Use of Grains.Figure 2 Projected Total Food Needs, Market Demand and ProductionFigure 3 Projected Malnourished Population 1985Figure 4 Projected Malnourished Population 1995Figure 5 Projected Nutritional Gap in Grain Equivalents 1985Figure 6 Projected Nutritional Gap in Grain Equivalents 1995Figure 7 Projected Income Distribution Effects on Calorie Consumption 1985Figure 8 Projected Income Distribution Effects on Calorie Consumption 1995Figure 9 Projected Price Change Effects on Calorie Consumption 1985Figure 10 Projected Price Change Effects on Calorie Consumption 1995Figure 11 Projected Food Needs and Market Demand 1985Figure 12 Projected Food Needs and Market Demand 1995
SUMMARY AND CONCLUSIONS
i. In Indonesia the most visible food security problem - rapid rises
in retail prices - has been avoided with costly rice imports, estimated to
reach 2.8 million tons in 1977. However, the less obvious problem of malnutrition
is serious. Over half the children under two years of age are 25%-40% below
the WHO norm body weight; infant mortality resulting from protein-calorie
malnutrition ranges from 110-150 per 1,000; 65% of the total population suffers
from iron anemia. This paper reviews these general issues of food and nutrition.
It should be seen as an interim study which draws partly on advanced reports
from the FY78 rural sector work program of the East Asia and Pacific Projects
Department.l/ It examines Indonesia's resources, its agriculture, and its
nutritional problems and then presents food projections for 1985 and 1995
which focus on the size of the malnourished population and the size of the
domestic food gap. The paper closes with a discussion of policy changes which
might bring improved food security to Indonesia by 1995.
ii. The projections show that if Indonesia's GDP were to continue its
real growth rate of nearly 8% 2 per annum, while maintaining the relative
prices and income distribution of 1970, the malnourished population could
decline from about 80 million people in 1970 to less than 30 million in 1985 and
6 million in 1995 - only 3% of the population. However, under these same
conditions the domestic food gap would grow from a deficit of just over 1 million
ton grain equivalents (TGE) in 1970 to 6 million TGE in 1985 and nearly 8 TGE
in 1995. Sensitivity analysis shows these results to be little affected by
changes in income distribution, but very sensitive to changes in prices and
income growth rates.
1/ A draft report integrating the work of four sub-sector missions will be availablein June 1978.
2/ The current best estimate of the Country Programs Division.
-ii-
iii. The study recommends two policies to reduce the projected food gaps.
First, more effective use of the price mechanism could influence the pattern of
food consumption in Indonesia. While protecting the welfare of the poor
with imports of low quality rice (e.g., 35% broken), the prices of medium
quality rice might be raised to world market levels and the prices of the
best quality rice allowed to rise above world market prices, with the cost-
price surplus going to help finance imports for the poor. This would shift
consumption towards domestically-produced foods for which large increases in
production are still possible. The second policy focuses on employment.
Java's traditional system of allocating employment rights in agriculture re-
quires that efforts to stimulate agricultural growth through technological change
be accompanied by programs to accelerate the growth of non-farm rural employment.
The paper concludes with a discussion of the effectiveness of Indonesia's
system of agricultural support services. Indonesia's food security may hinge.
on the ability of the system to reach small farmers - the 50% who own less than
0.5 ha.
I. BACKGROUND
Land Resources
1.1 Indonesia, the world's largest and most populous archipelago com-
prising over 13,000 islands, stretches 5,000 km from the tip of Malaysia to
Papua New Guinea. Many of Indonesia's current policy issues derive from the
ecological differences between Central Indonesia - Java, Madura and Bali -
and the Other Islands - Sumatera, Kalimantan, Sulawesi and the islands of
Eastern Indonesia. I/ Rich volcanic soils from the spine of volcanoes down
the centers of Java and Bali have formed a fertile environment with high
yields and high population concentrations. In the Other Islands highly
erodable yellow podzolic soils subject to serious weed infestation once the
vegetation cover is removed have contributed to low population densities and
a subsistence agriculture.
1.2 Approximately 14.2 million ha of Indonesia's arable land is culti-
vated and harvested for food crops, of which 9.2 million are on the islands
of Central Indonesia. Cultivated lands here account for 70% of the total
land area and in many years the cropping intensity is said to exceed ecologi-
cally safe limits, particularly in the densely populated areas. Recent data
suggest that nearly all the land classified as marginal has been brought into
production. On the other hand, in the Other Islands where only 25% of the-
1/ See C. Geertz, Agricultural Involution: The Process of Ecological Changein Indonesia (Berkeley, California, 1964).
- 2 -
40 million ha. of land suitable or marginally suitable for cultivation is
currently in use, great increases in food production are technically possi-
ble, provided effective agricultural support services can be provided eco-
nomically (see Table 1).
Population
1.3 Indonesia's population was recorded as 119.2 million by the 1971
census, making it the fifth largest in the world. By 1976 the population 1/
had reached a level of about 136 million. Between 1961 and 1971 the annual
population growth rate was 2.1%; since then it has been estimated to be about
2.2% per annum. However, preliminary results from a recently completed inter-
censal survey indicate a decline in fertility. But even under the most opti-
mistic assumptions the population will be about 195 million in the year 1995
(see Table 2).
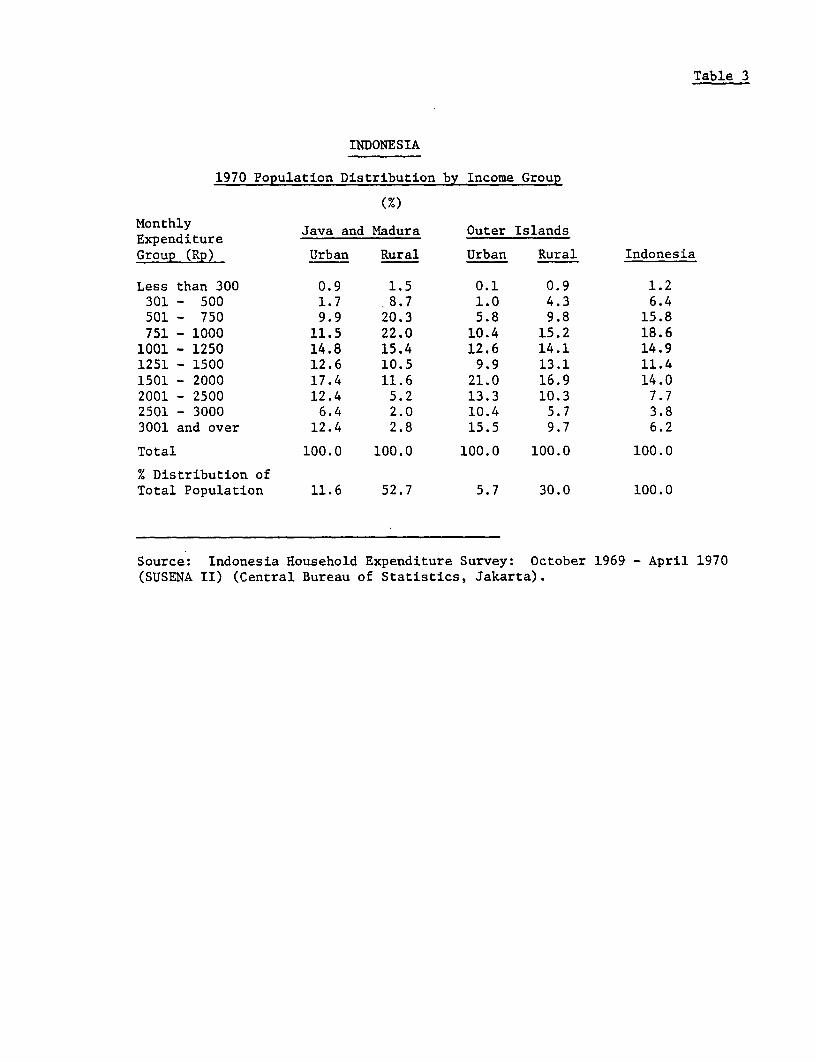
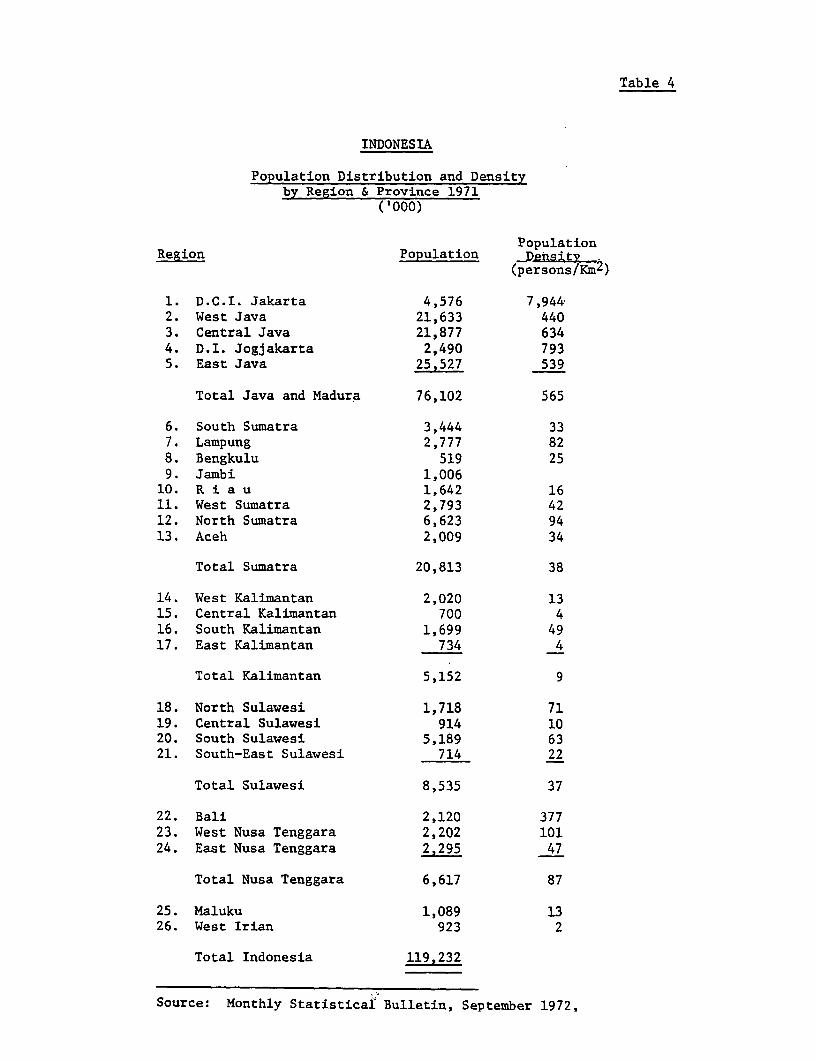
1.4 The most striking demographic characteristic of Indonesia is its
uneven population distribution. In Central Indonesia 64% of the total popu-
lation live on Java-Madura which accounts for less than 7% of the land area.
2In 1971 it had an average density of 565 persons per km , almost twice that
of the densely-populated countries in Northwest Europe - Netherlands (326)
or Belgium (318) - and higher than that of Bangladesh (510). In the Special
2Province of Yogyakarta the density reached nearly 800 persons per km . In
contrast the rates for the Other Islands are very low (Table 4). Kalimantan,
which comprises 27% of Indonesia's land area, has only 4% of the population
and a density of 9 persons per km . Similarly, the 1971 census recorded only
1/ For the most recent description see Indonesia: Appraisal of a SecondPopulation, Report No. 1534b-IND.
-3-
17% of the population as living in urban areas. This relatively low degree
of urbanization, coupled with a high population in Central Indonesia, results
in heavy population pressure on arable land.
The Agricultural Sector 1/
1.5 The importance of agriculture, in terms of its contribution to
total GDP, has declined steadily over the last 15 years from about 55% to
30%. The decline in the relative importance of agriculture has been asso-
ciated with significant increases in the growth of the mining, manufacturing,
construction and transport, and communications sectors (see Table 5). Never-
theless, excluding income generated by the oil industry, which provides few
benefits to most households, agriculture and associated rural activities
probably account -for some 45% of GDP.
1.6 With the rising importance of oil exports, the importance of the
rural sector as a contributor to total export earnings has also been declin-
ing. During the years when the value of oil exports was increasing rapidly,
the aggregate value of rural exports declined. Despite the drop in the value
of lumber and rubber exports (due largely to lower prices), they remain as
the most prominent rural exports with palm oil increasing in importance.
1.7 Agriculture still dominates the life and welfare of the Indonesian
people. It supports some 80% of the country's total population and provides
part or full-time employment for about 65% of the country's total labor force.
Moreover, the potential of agriculture, forestry and fishing to provide grow-
ing employment opportunities and the extent to which other rural activities
1/ This summarizes Indonesia: Agricultural and Rural Development SectorMemorandum Draft, September 28, 1977.
- 4 -
can contribute to the utilization of the enormous labor force is the subject
of anxious debate in Indonesia.
1.8 Indonesian agriculture is dominated by 14.4 million smallholders
cultivating field crops on some 14.2 million ha; there are also about 1,800
estates (concentrated in North and South Sumatera and West Java) covering
about 2.2 million ha. In Java 80% of all farms are less than I ha and 30%
are less than 0.25 ha 1/ (see Table 6). Smallholders dominate the produc-
tion of annual crops, of which rice is by far the most important. Estate
enterprises account for most of the production of perennial crops such as
palm oil and tea. The important exception is rubber production, some 70%
of which originates from smallholders.
1.9 Agricultural activities in Indonesia are, not surprisingly, dis-
tributed broadly according to the quality of the available natural resources.
About 70% of the quantity and value of field crops are produced in Central
Indonesia. On the other hand some 70% of the tree crop production is to be
found in the Other Islands, with Sumatera accounting for about 85% of rubber
production and almost all of the palm oil.
1.10 While the relative importance of the agricultural sector in the
economy is expected to continue to decline, the structure of agriculture is
likely to change with a greater degree of part-time farming, more diversified
farming and a vertical integration of production and processing activities.
1/ A recent study estimates that the official census on which these figuresare based omitted 2 million farms which were excluded from the censusbecause they were too small - less than 0.05 hectares.
-5-
Despite these changes the traditional elements of the sector will continue
to be important, but with an increasing emphasis on development in the
Other Islands.
Policy 1/
1.11 The Government's first five-year plan (Repelita I - 1969 to 1974)
concentrated on increasing agricultural output, with the main emphasis on the
expansion of rice production. During this period the volume of rice output
increased at a rate of 3.5% to 4.0% per year. At the same time the economy
as a whole grew at an average rate of about 7% per annum.
1.12 Encouraged by the steady growth of rice production and the high
total growth rate, the Government moved towards giving increasing priority
in Repelita II (1974 to 1979) to employment creation and equitable income
distribution between regions and between occupational groups. Within the
agricultural sector the Government's objectives are achievement of self-
sufficiency in rice, improved employment and incomes in rural areas, in-
creased transmigration from Central Indonesia to the Other Islands, and
increased production of exportables.
1.13 In its identifiable investment planning the Government has allo-
cated about one eighth of its current development expenditures to agricul-
ture and, of that amount, has used most for the food crop and estate sub-
sectors. Nearly half of the US$4 billion rural investment budget from
1/ See IBRD Report No. 1187-IND, "Public Sector Investment and FinancialResources," May 24, 1976, for a discussion of these issues and the GOIinvestment program. A more up-to-date examination of the Indonesianeconomy and government policy is contained in IBRD Report No. 1516-IND,"Indonesia: Recent Developments and Medium-Term Perspectives," March 8,1977.
- 6 -
Repelita II is nominally allocated to increasing food crop production. The
program includes irrigation development, river control, swampland development
and research and extension, but with a heavy emphasis on rice and much less
support to increase production of upland crops - corn, cassava and soybeans.
Research and extension activities are also heavily oriented to rice as are
marketing and pricing policies. In particular, the Government has evolved
a well-established rice marketing authority which exerts control on market
prices; it also has set maximum fertilizer prices. While the major food
crop production program (BIMAS) is not now limited to rice, its operation
beyond rice production is of little significance. It is also apparent that
the Government's efforts to increase food crop production have heavily favored
Central Indonesia.
1.14 Concise plans or strategies for employment creation and income dis-
tribution are more difficult to discern. The only explicit action has been
the Inpres Programs which provide funding to regional and local governments
for labor-intensive public works.
1.15 While specific policies aimed at improving income distribution do
not stand out, a number of government actions may well have had an impact.
One is the government's policy on prices and subsidies in agriculture. The
GOI has for many years used various price and input subsidy (10% of the
development budget) programs to stabilize prices and stimulate the produc-
tion of rice and other major food crops. 1/ A fundamental policy instrument
1/ See Saleh Afiff and C. Peter Timmer, "Rice Policy in Indonesia," in FoodResearch Institute Studies, Vol. X; 1971, for a discussion of governmentpolicy in Indonesia up to 1970.
-7-
has been its fertilizer/pesticide credit package (BIMAS). 1/ At first, it
appeared that BIMAS was a successful program. Farmer response improved enor-
mously (area coverage of up to 60% in Java and almost 20% in the Other Islands
was achieved in the wet season of 1974-75). However, recent reports show re-
duced repayments and a substantial drop in the coverage of the program. 2/
The Government has gradually amended the BIMAS Program since its inception
to include other major food crops, has increased prescribed fertilizer levels,
liberalized credit conditions, removed restrictions on fertilizer supplies to
estates, and introduced other administrative arrangements to facilitate fer-
tilizer use by farmers. 3/
1.16 A second part of the GOI effort to sustain an increase in foodgrain
production has been through the powers vested in the National Logistics Organi-
zation (BULOG), which is responsible for rice marketing, imports and price sup-
ports. Farmers can sell their rice to cooperatives (BUUD and KUD) which in turn
must sell at minimum prices to BULOG. Retail prices are also controlled with
a view to keeping prices to consumers within a predetermined ceiling. In
1/ Various documents are available which summarize the past and currentBIMAS, and the related INMAS programs; for example, see Annex 1 of BankReport No. 1105a-IND, Appraisal of the National Food Crops ExtensionProject, Indonesia, May 7, 1976. See also a recently-prepared Bankreport entitled "A Review of the Support Services for Food Production,"December 13, 1977.
2/ There is some uncertainty concerning the reasons for the decline inrepayment performance recently. It has been suggested that governmentpressure on collection has slackened because of national elections.
3/ In November 1976 the Government reversed its policy which before thattime had given cooperatives virtual monopoly in the sale of fertilizer.After this date private enterprise was also allowed to participate;however, the policy has not yet been implemented in East Java, whichaccounts for 40% of total fertilizer consumption.
-8-
recent years, the GOI has raised domestic support prices for paddy which,
with declining world prices, are now very close to world market levels on a
farm-gate basis. At the same time, fertilizer prices have also been raised,
reducing the GOI subsidy.
1.17 It is difficult to determine the exact impact of government poli-
cies on the rural sector. Nevertheless, it would be fair to conclude that
the combination of programs in irrigation rehabilitation and development,
BIMAS, Inpres and the maintenance of a rice/fertilizer price ratio aimed at
stimulating production have, together, improved farm incomes. However, the
impact has probably been most pronounced in Central Indonesia and on larger
than average tarms.
Nutrition
1.18 According to information in The Appraisal Report of the Bank-
supported Nutrition Project, Indonesia's daily average per capita availabil-
ity of food is about 1,880 calories and 43 grams of protein, compared to a
recommended requirement of 2,130 calories and 40 grams of protein. However,
given the existing income distribution, almost two-thirds of the population
is getting well below the required amounts. The most severe nutrition prob-
lems - protein-calorie malnutrition (PCM) and vitamin A deficiencies - are
widespread throughout Indonesia. Close to one-third of all children under
the age of five (about 7 million) are estimated to suffer from moderate to
severe PCM. Existing surveys show that PCM among Indonesian children below
the age of two is particularly severe: over 50% of these children in Java
suffer from second and third degree malnutrition (i.e. body-weights less
than 75% and 60% respectively of the WHO norm). PCM is also a imajor cause
- 9 -
of Indonesia's high rate of infant mortality - between 110 and 150 per thous-
and live births, compared with 139 in India and 38 in neighboring Malaysia.
The incidence of vitamin A deficiency among Indonesia's population, particu-
larly among children, is one of the highest in the world, reaching 4-5% in
rural Java and up to 22% in urban squatter areas. These problems are the
result of a combination of factors, the foremost of which are inadequate
food production, widespread poverty and insufficient understanding of nutri-
tional requirements.
II. METHODOLOGY 1/
2.1 A calorie consumption function was estimated, based on household
expenditure data from the 1969 National Economic and Social Survey 2/ (Tables
7 to 10) and FAO estimates of food composition in East Asia. 3/ The consump-
tion data have been converted from a per capita weekly basis to a daily basis
in order that the results are comparable with the other country studies. In
the absence of per capita income estimates, the consumption function has been
based on total expenditure.
1/ See Annex 2 for a complete description of the methodology used for theprojection given in this brief.
2/ Survey Social Ekonomi Nasional, Oktober 1969 - December 1969,Statistik, Jakarta, Indonesia..
3/ At the time of this writing, the advanced tabulation of the 1976 Surveybeing processed by the Bank's Programs Division was not yet available.The 1976 data will be used for projection purposes by the Food SupplyMission scheduled for January, 1978, and will provide a useful checkon the projections given here which are based on 1969 data.
- 10 -
2.2 The average per capita calorie requirement for Indonesia is based
on age specific requirements calculated by a special FAO/WHO committee and on
estimates of average body weights in Indonesia - 50 kg for males and 44 kg
for females (Table 14). The body weight adjusted requirements have been
weighted by the most recent estimate of the age distribution in Indonesia
and increased 10% to allow for waste and seasonal fluctuations. The estimate
of the per capita calorie requirement is approximately 2130.
2.3 Population projections are taken from the Bank report, Indonesia:
Appraisal of a Second Population Project. The assumed high and low income
growth rates of 8% and 5% were supplied by the Indonesia Programs Division.
III. PROJECTIONS
Consumption
3.1 Consumption data obtained from the 1969-70 Economic and Social Sur-
veys suggest that in 1970 Indonesia's average daily per capita calorie con-
sumption fell below the minimum daily requirement level by 12% 1/ and that
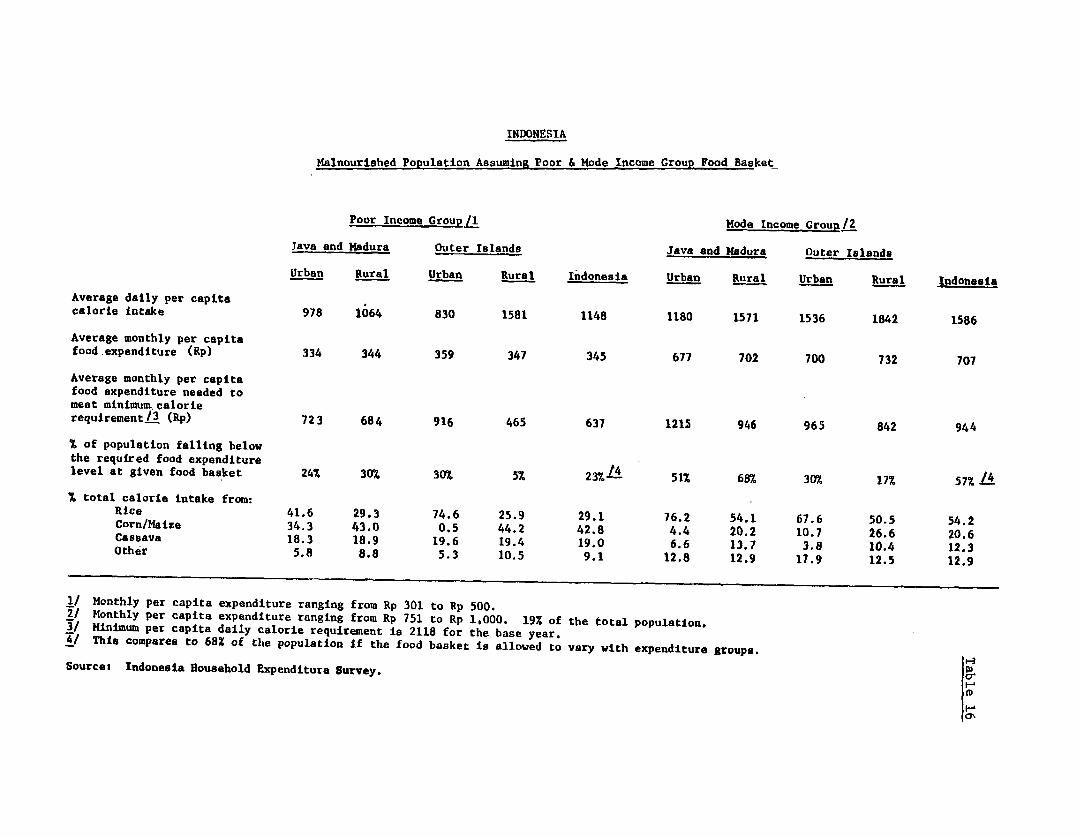
some 69% of Indonesia's population (81.2 million) suffered malnourishment.
However, ignoring the higher-quality, higher-cost consumption baskets of the
upper income groups and using the basket of the poor as a standard would
reduce the estimated malnourished population to only 23% (see
Tables 15 and 16). Yet even this estimate may overstate the malnourished
population because the expenditure data appear to understate the consumption
of the poorest.
1/ 1864 calories per capita compared 2118 calories after 10% allowancefor waste and seasonal fluctuations.
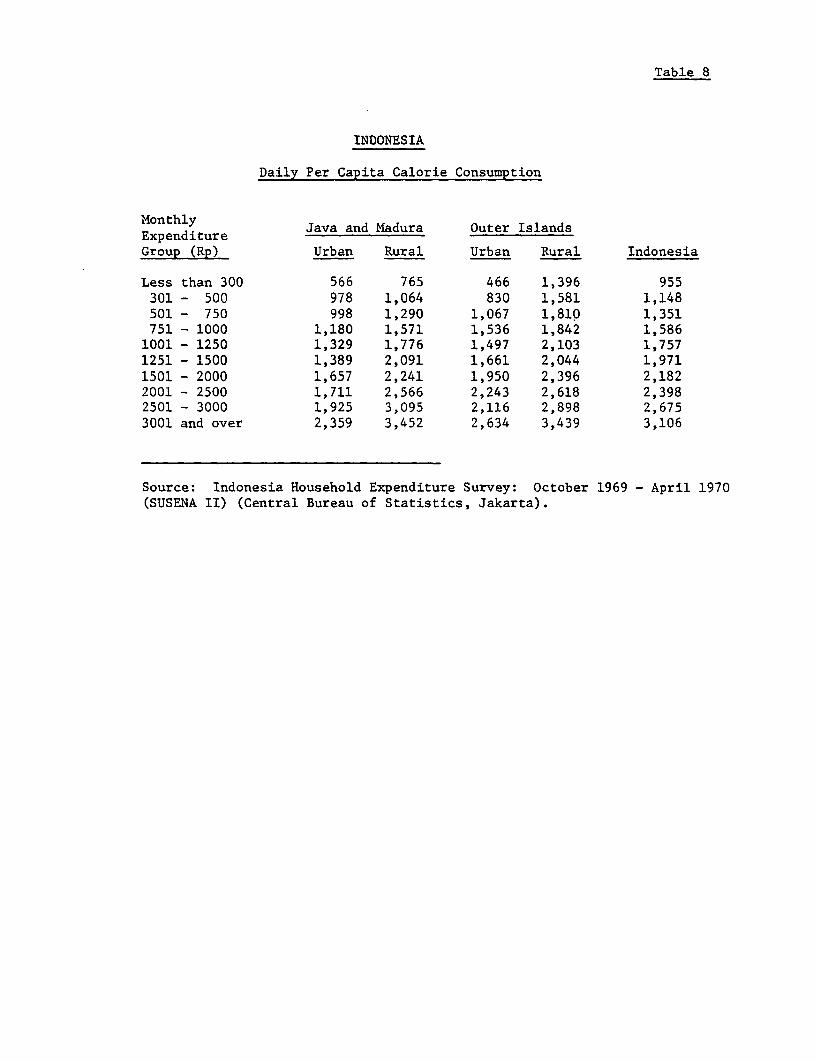
3.2 In the base year (1970) rice featured more prominently in urban
diets while cassava was the important food item for the rural population.
Average total per capita calorie consumption was lower in urban than in
rural areas (Table 16). The food expenditures necessary to achieve minimum
daily requirements were higher for the urban population owing to their nutri-
tionally-inefficient dietary habits as well as to the higher prices in urban
areas.
3.3 Total calorie consumption (market demand) at the national level
has been measured in tons of grain equivalents (TGE), using a 3.5 million
calories/metric ton conversion rate. Nutritional gap.-/ has been aggregated
'rbbo'the average daily per capita deficit for each income class multiplied by
the population in the class. Where consumption exceeded requirements, the
deficit was taken as zero.
3.4 For the base year (1970) total market demand was 22.3 million TGE;
the nutritional gap was 4.5 million TGE. Assuming low per capita income
growth rates, 2/ total market demand would increase to 38.0 million TGE by
1985 (3.4% p.a.) and to 50.5 million TGE by 1995 (2.8% p.a.). The nutrition-
al gap would decline to 1.4 million TGE by 1995, a 4.6% reduction per annum.
1/ Nutritional gap refers to theshorfall'be'ween actuaorconsumption and thelevel needed to meet minimum calorie requirements.
2/ 2.8% and 3.0% p.a. for 1970-85 and 1985-95, respectively. For a morecomplete explanation see Annex II.
- 12 -
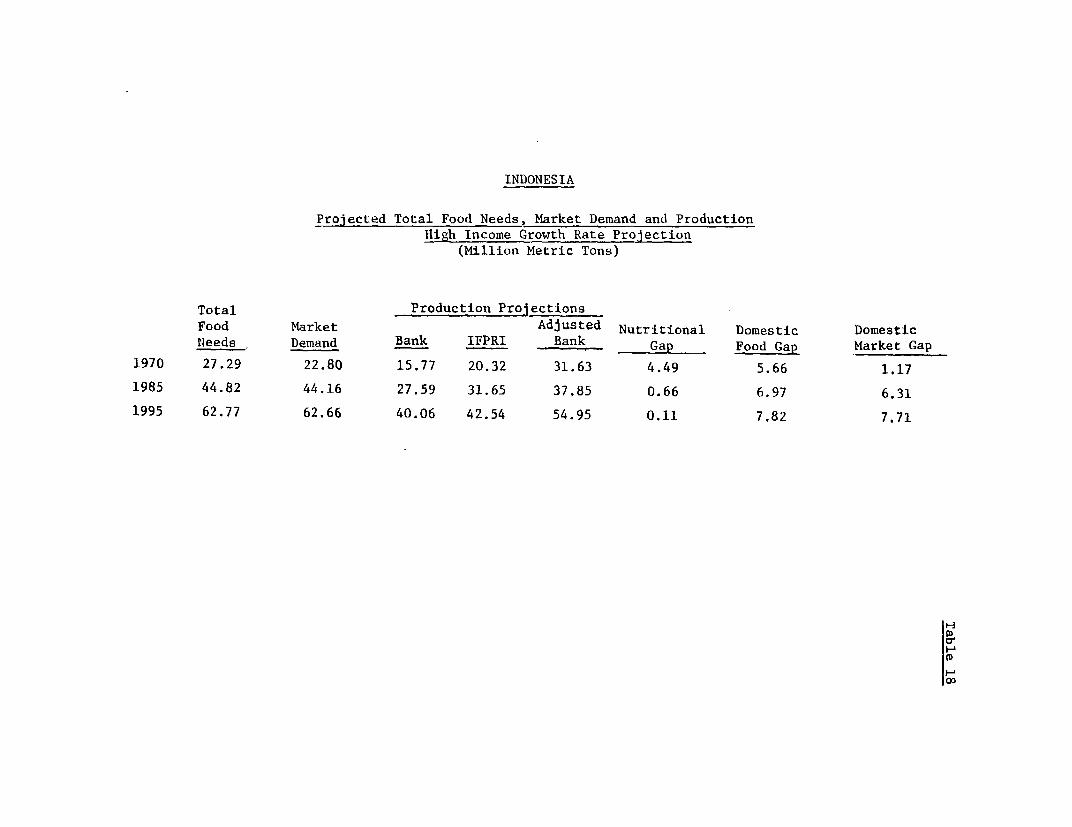
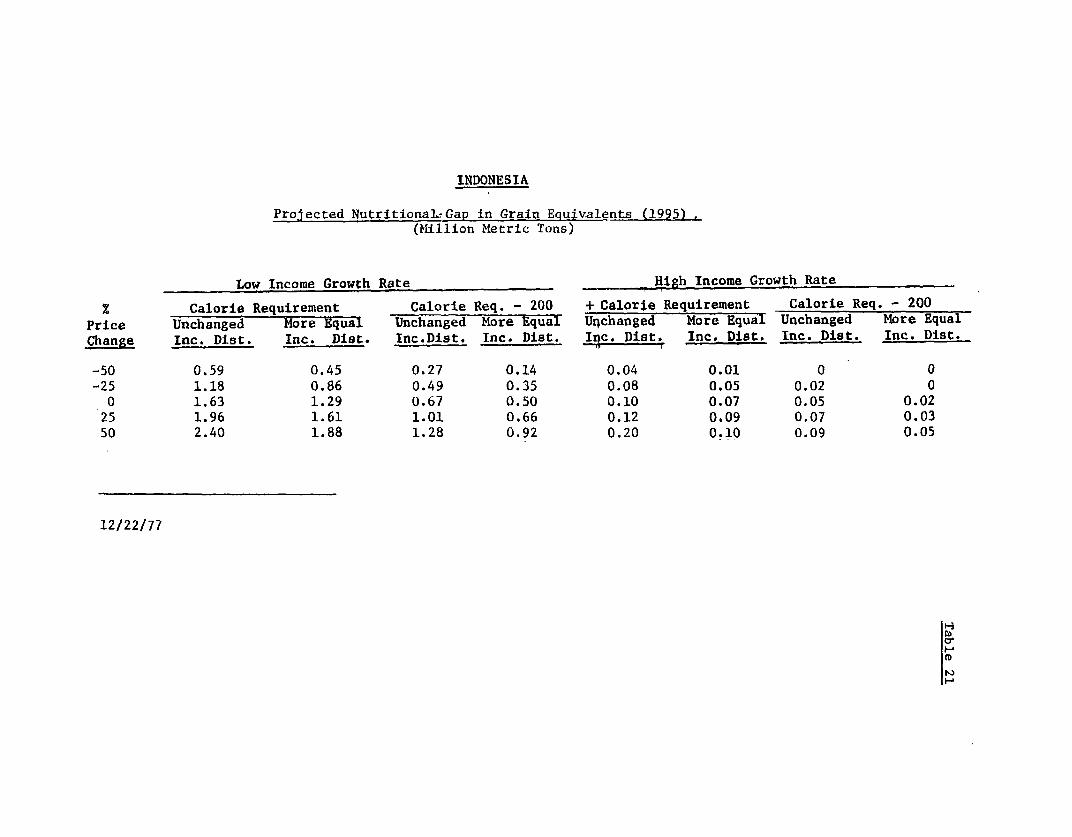
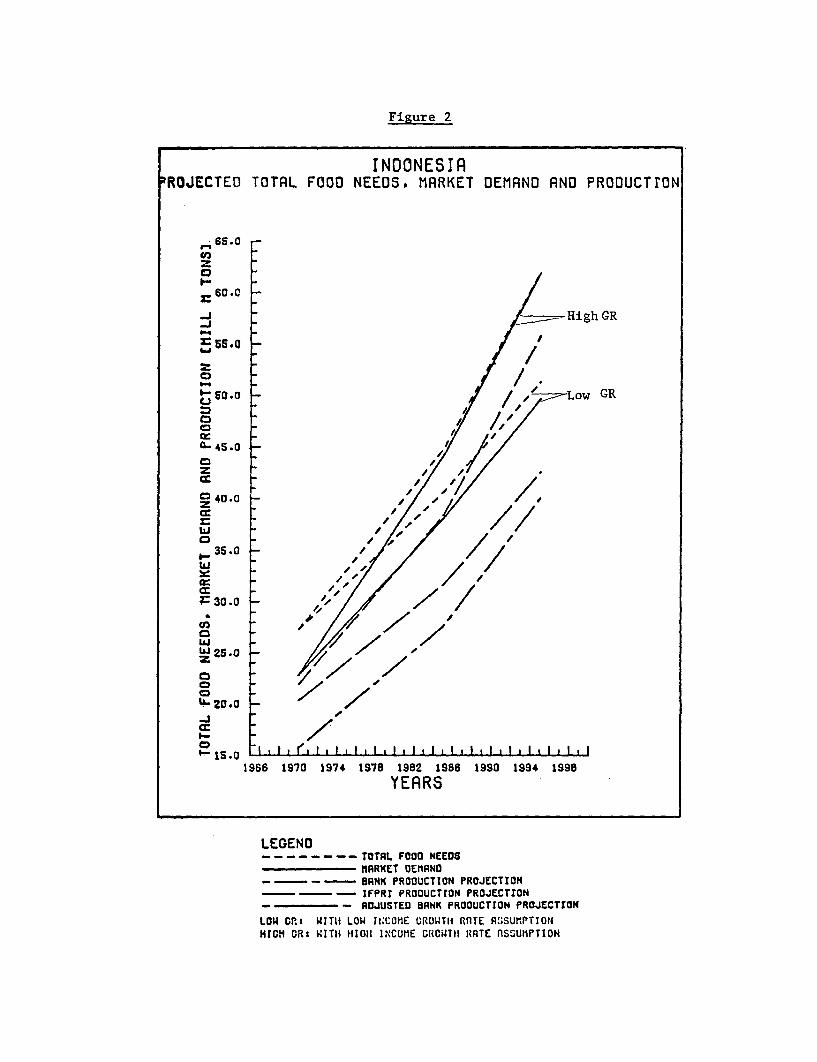
At higher per capita income growth rates, 1/ demand would increase much
more rapidly (4.4% p.a. to 1985 and 3.5% to 1995), reaching 44.2 million
and 62.7 million TGE respectively (Tables 17 and 18, and Figure 2). The
nutritional gap would decline to an insignificant level of about 100,000
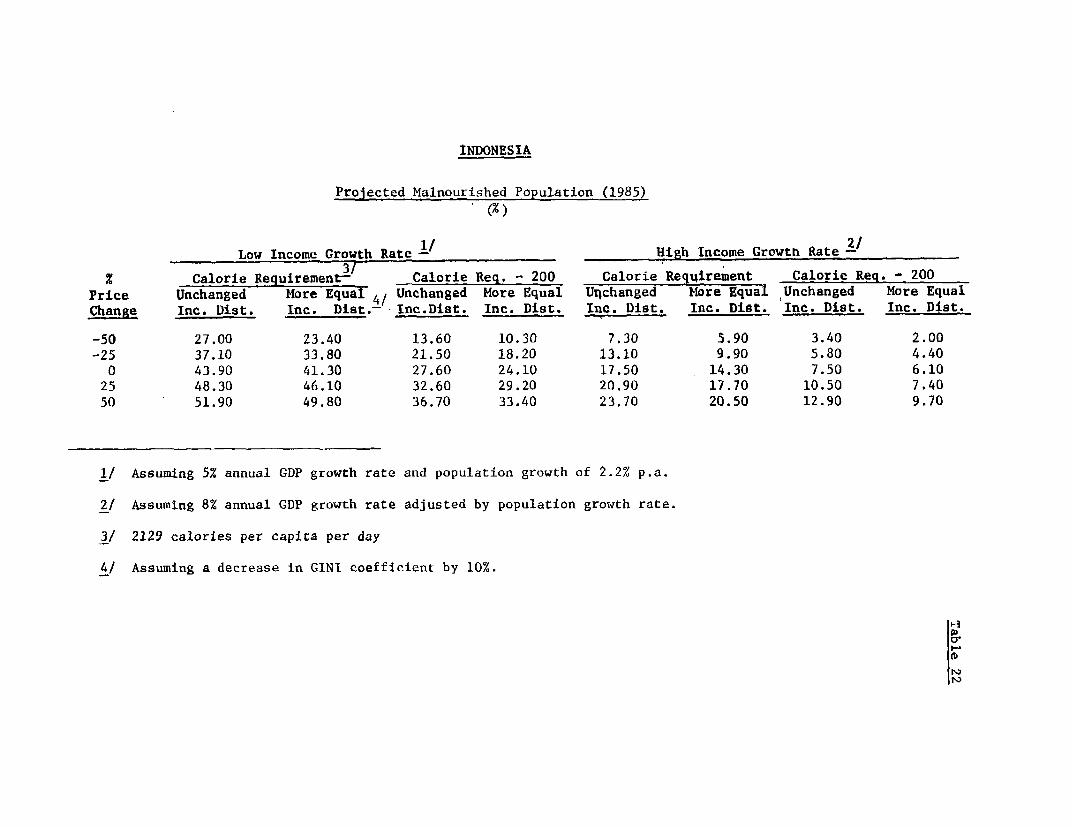
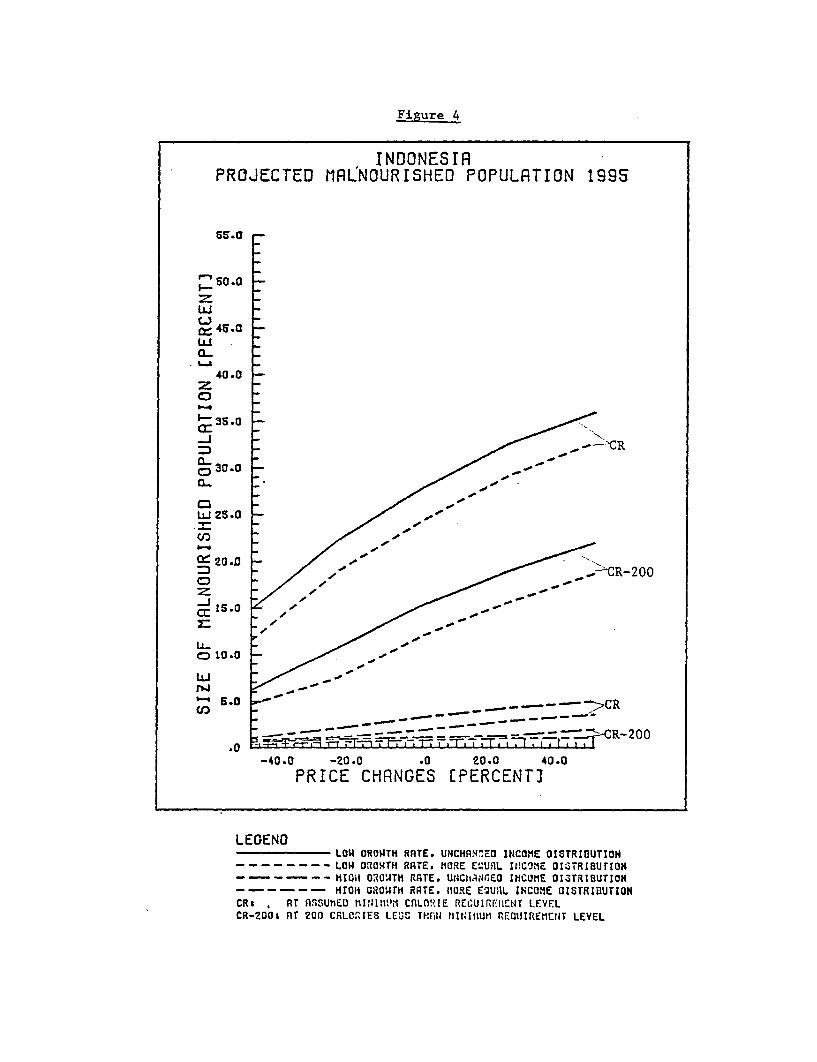
TGE. At low income growth rates the malnourished population is expected
to decline to 44% (71.8 million) by 1985 and to 28% (54.6 million) by 1995
(Tables 22 and 23; Figures 3 and 4). At higher income growth rates the
malnourished population would decline further to 18% (28.6 million) in
1985 and to 3% (6.4 million) in 1995.
Production
3.5 Projections of food production for Indonesia focus on the avail-
ability of foodgrains. 2/ The most recent Bank foodgrain production projec-
tion for 1985 3/ of 27.5 million metric tons has been projected to 1995 by
assuming the same annual growth rate of 3.8% per annum. The projected food-
grain production growth rate is somewhat lower than 3.99% average annual
growth rate achieved during 1961-1974. An earlier study within the Bank, 4/
based on careful reviews of growth rates in harvested areas, cropping inten-
sities, and yields, projects a much lower level of 25.3 million tons (high
1/ 5.8% and 6.0% p.a. for 1970-85 and 1985-95, respectively.
2/ S. Hadler, Developing Country Foodgrain Projections for 1985, WorldBank Staff Working Paper No. 247, November 1976. Ms. Hadler will berevising these estimates during the upcoming Food Supply Mission toIndonesia.
3/ Om Nijhawan, "Indonesia: Estimate of Foodgrain Production 1973-1990,"Draft, July-2, 1976.-
- 13 -
growth assumption) in 1985 and 29.0 million tons in 1990. Professor Leon
Mears, a student of Indonesia's agriculture since the early 1950s, has pro-
jected 1/ an input constrained level of 20.8 million tons of rice for 1985
which, when added to Nijhawan's high projection of 3.6 million tons of corn,
implies a foodgrain production level of 24.4 million tons in 1985.
3.6 The calorie intake from foodgrains is estimated to account for
about 73% of Indonesia's average total daily per capita calorie consumption
(Table 15). Since the total market demand for food and food gap estimates
are based on the total daily per capita calorie consumption which encom-
passes other food items not included in the production data, an upward
adjustment by a factor of 1.37 was made. Adjusting for consumption which
originates from sources other than foodgrains should put the data relating
to consumption, deficits and production on more comparable grounds.
The Domestic Food Gap
3.7 For the base year 1970, the actual gap between market demand and
production was estimated to be 1.17 million TGE. A low income growth rate
would suppress growth in demand sufficiently to eliminate this domestic food
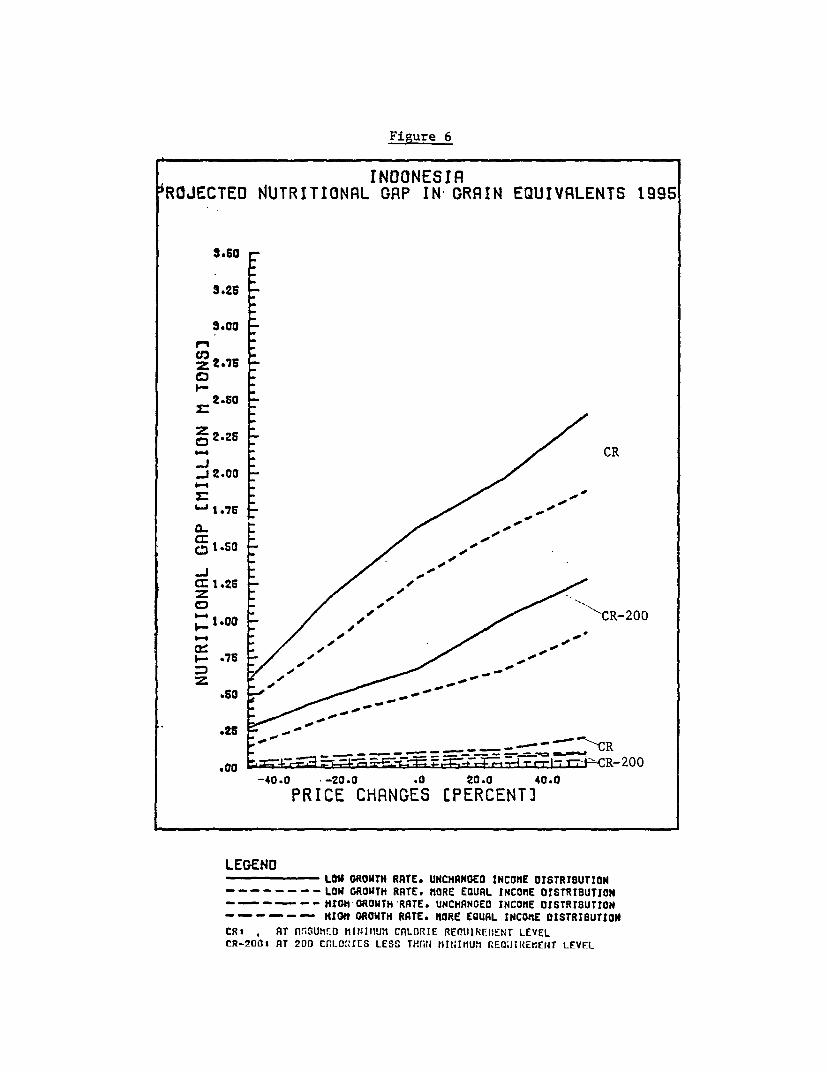
gap by 1995. However, high income growth rates result in a domestic gap of
6.3 TGE in 1985 and 7.7 in 1995 (Tables 20 and 21, Figures 5 and 6). Because
current expectations are for the per capita income growth rate to remain near
its recent historical rate of 5.8%, the upper estimates of shortages are more
likely to occur. The 1976 FAO projection shown in Figure 1 presents a similar
1/ Leon Mears, "Indonesia's Food Problems, Pelita II/III," Ekonomi danKeuangan Indonesia, June, 1976.
-14-
-~~ _
INDONESIA TaL.mo W3 GRAM (Ritum J.
PER CAPrrA PRODUCTION. DIPORTS andDOMESTIC USE of GRAINS ,,I
1961 to 1975 with PROJECTIONS to 1980 (kg/ye) , I
4 ,* is sors
Ito~~~~~~~~~~~~~~~~~~~~I
100
S S
IO ,L , , , 140 (DCE MAII as Whn EA 77t0
Figure 1
conclusion. Mears' estimate of the domestic food gap for rice in 1985 of
between 2 and 4 million metric tons is consistent with the high-growth gap
forecast by this study. The most recent USDA estimate of rice imports for
1977 is 2.8 million tons.
Sensitiyity
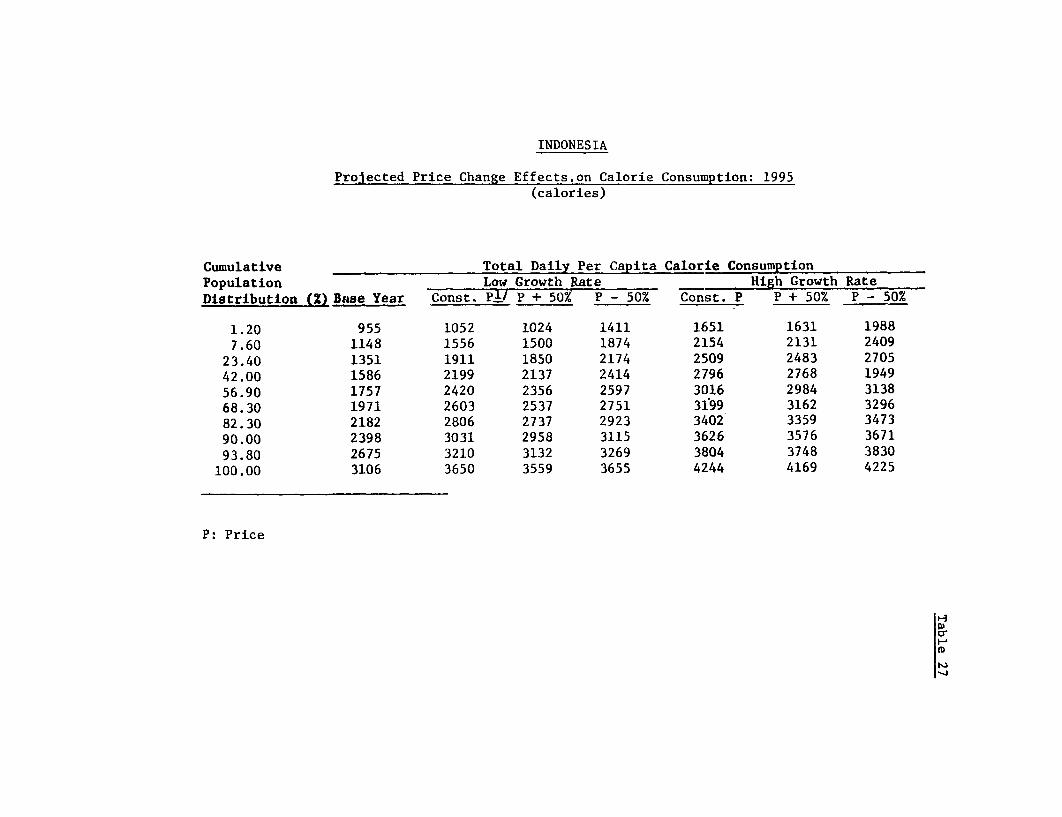
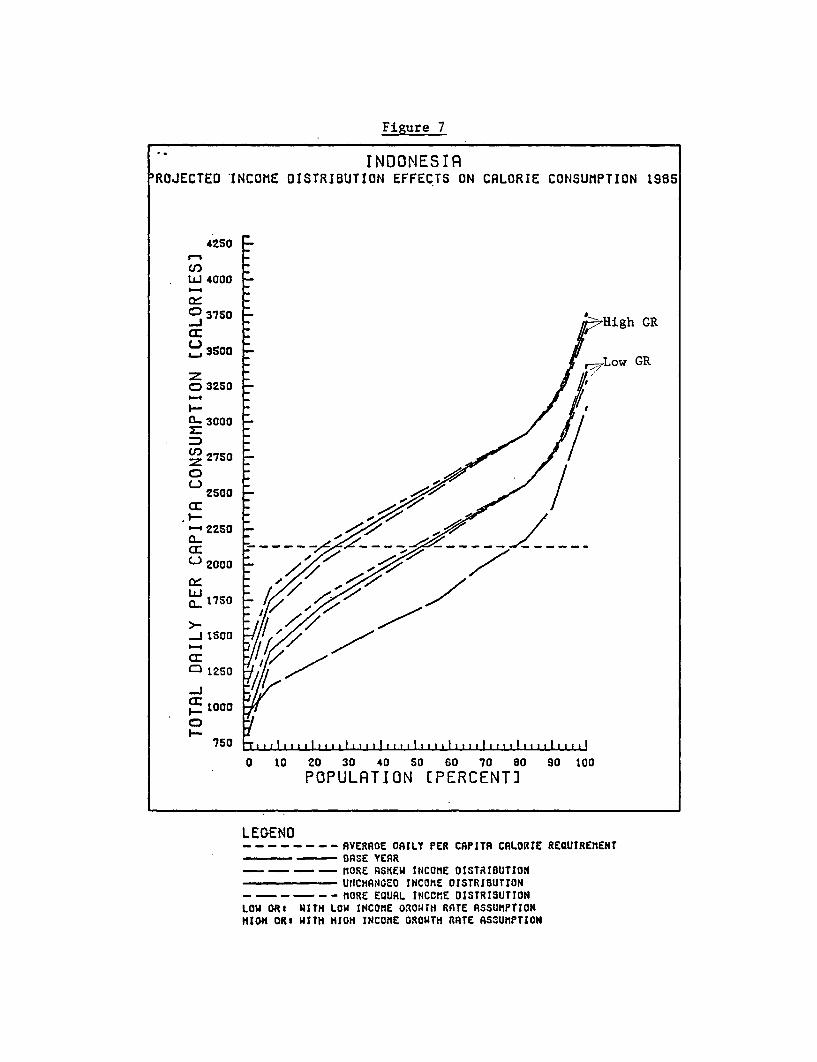
3.8 The number of malnourished, the size of the nutritional gap and
market demand appear to be little affected by changes in income distribu-
tion but they are sensitive to changes in prices and in assumed income
growth rates (Tables 24 to 27, Figures 7 to 10). A 50% reduction in price
of foodgrains from the base year results, on the average, in a 40% decrease
in the numbers of malnourished while a 50% increase in price increases these
numbers by 20%. Increasing the annual per capita income growth rate by three
percentage points reduces the numbers of malnourished by 25 percentage points
-15 -
and the nutritional gap by approximately 80%. Though the impact of change
varies from 1985 and 1995, it is of the similar order of magnitude and in the
same direction for both years. Demand is particularly sensitive to changes
in income growth rates (Table 19 and Figures 11 and 12). An increase of
three percentage points in the income growth rate will increase total demand
in 1985 from 38.1 million to 44.2 million TGE and in 1995 from 50.5 million
to 62.7 million TGE. The food gap is also most sensitive to changes in in-
come growth rates: in 1985 the gap increases from 0.2 million to 6.3 million
TGE and, in 1995, from a domestic balance to a gap of 7.7 million TGE.
IV. MAJOR POLICY ISSUES
4.1 Two major policy areas are examined below. The first section dis-
cusses the related issues pf the composition of the consumption "basket" and
the structure of rice prices. It recommends a larger price differential for
different qualities of rice, with the price of the highest grade rising above
world market levels. The second section looks at the sources and location of
growth in agricultural production. Because the technology to produce the
required growth is also likely to lead to a steady deterioration in rural
employment, the section calls for, inter alia, a heavy emphasis on efforts
to expand non-farm rural employment as part of Indonesia's strategy for food
security. These issues are likely to be explored more fully by the Bank's
Food Supply Mission to Indonesia in early 1978.
4.2 Food policy discussions in the Indonesian context must take into
account the importance of rice in consumption and trade. First, rice accounts
for more than half of the calorie intake in the existing diet. Second, gaps
- 16 -
between market demand and supply cannot exist. They are solved by a combi-
nation of imports and price rises. Latest estimates indicate that as end
of 1977 Indonesia will import 2.8 million tons of rice, or approximately 30%
of a world market of 8.8 million tons. If rice imports grow at a rate greater
than 4%, they will exceed 4 million tons by 1985.
4.3 Given these magnitudes, Indonesia is likely to have considerable
influence on prices in the world rice market. Efforts to increase imports
during short-term declines in domestic production are likely to increase world
prices and greatly increase the foreign exchange costs of food imports. Fur-
thermore, problems of bad weather or pests in Indonesia are likely to affect
simultaneously rice production throughout Southeast Asia. Thailand might
not be able to supply rice when it is most needed. Long-term contracts with
producers in other parts of the world may reduce the risks of shortfalls in
rice imports, but long-term food security will require other measures. The
projections above have shown consumption to be most sensitive to changes in
income growth and to changes in prices, but a low income growth policy is
incompatible with the Indonesian Government's desire to achieve rapid economic
development. Consequently, price policy is probably the only macro instrument
available.
4.4 Objections to raising the price of rice are based on the argument
that rice is the major wage good; increasing its "price" would be inflationary
and would seriously reduce the living standards of the urban poor. This need
not be the case. There are many qualities of rice, each with its own price.
Furthermore, household expenditure data show that rice is not a major item
in the diet of the poor (Table 15). They can hardly afford to buy it. The
- 17 -
welfare of the poor could be protected by imports of low quality rice (e.g.,
35% brokens) - marketed by BULOG at subsidized prices. The prices of medium
quality rice should be raised to world market levels and the prices of the
best quality rice allowed to rise above world market prices, with the cost-
price surplus going to help finance imports for the poor.
4.5 The benefits of adjusting the structure of rice prices along these
lines are many. Increasing prices of all but the lowest grade of rice would
shift the composition of the food basket towards other domestically-produced
foods and wheat. This would reverse the secular rise experienced since 1965
in the rice relative price of soy beans, maize, cassava and sweet potatoes.
4.6 Because rainfed crops have been given much less emphasis than rice
in existing crop intensification programs, Indonesian yields are among the
lowest in Southeast Asia. Consequently, large increases in their production
are still possible whereas increases in rice production are more difficult
to achieve because its production level is closer to its potential under pres-
ent technology.
4.7 Encouraging the consumption of bread - perhaps made in part from
cassava flour - and the consumption of noodles made from wheat flour would
shift the pattern of Indonesian diets towards those of the more developed
Asian nations, causing the substitution of wheat imports for rice imports.
Not only would the exchange costs of importing foodgrains decline - wheat
currently costs Indonesia approximately one-third as much as rice - but
Indonesian purchasers would command a smaller portion of the world rice
market, if most of the future foodgrains imports were to be purchased in
wheat.
- 18 -
4.8 Finally, Indonesia could help to alleviate its nutrition problems
if changes in price signals were accompanied with a nutrition education pro-
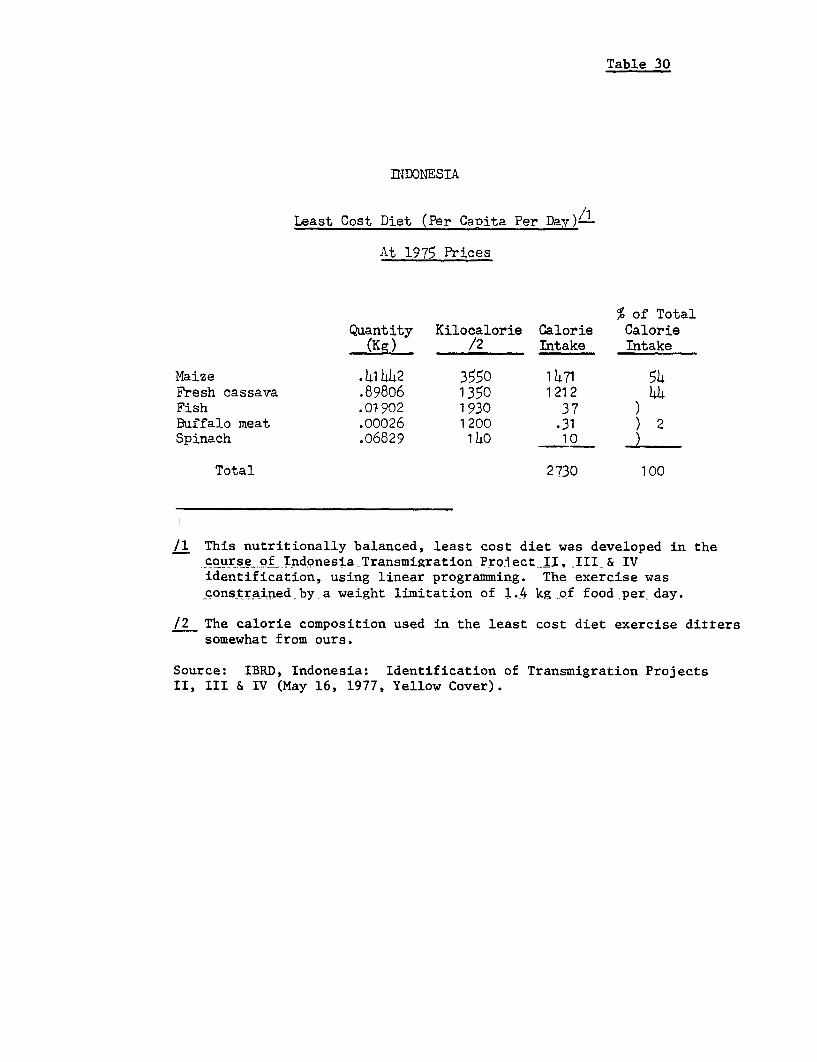
gram. A recent study 1/ has shown that in 1975 prices a least-cost nutri-
tionally-balanced diet derives 98% of calorie requirements from maize (54%)
and cassava (44%) (Table 28). The price of rice would need to fall 78% before
it would be included in the least-cost diet. Many of the poor could afford
the nutritionally balanced diet if only they knew what to buy. For example,
a simple campaign to increase the consumption of spinach 2/ could have a
major impact on iron anemia, estimated to affect 55% of the total population.
Similar rapid gains in the nutritional standards of children might be achieved
by the Health Guidance Card Program (see attachment 1) developed by the Min-
istry of Health. 3/ This effort to improve the health and nutrition of babies
whose mothers participate in the family planning program may lead to a further
reduction in Indonesia's child mortality and fertility rate, and further lessen
Indonesia's nutrition problems.
4.9 The second set of issues concerns the sources and location of future
agricultural growth. Java's combination of physical ecology and social history
has produced a system of agricultural production in which access to employment
is in part determined by a complex of social rights and obligations. But the
1/ IBRD, Indonesian Transmigration Projection II. III and IV Identification,May, 1977.
2/ A major ingredient of gado-gado.
3/ Apparently the US$3.5 million UNICEF grant to finance this.program hasbeen held up by a jurisdictional dispute between the Ministry of Healthand the National Family Planning Coordinating Body.
- 19 -
system is rapidly eroding as technical changes in agriculture foster the
growth of commercialization. 1/ The problem facing Indonesia today is how
to take advantage of the modern technology required for agricultural growth
without creating unmanageable employment problems.
4.10 Professor Strout has simulated three different growth strategies
for Indonesia: 2/
(a) high growth on Java;
(b) low growth on Java;
(c) even lower growth on Java with a focus on theOther Islands.
He concludes that only strategy (c) is possible:
"The objectives of such a policy of relative neglectwould be to slow down the pace of change in Javaneseagriculture, to reduce social tensions accompanyingtheir change, to isolate at least some rural popula-tion segments from the rapid changes occurring inurban areas, and to limit the out-migration of ruralpopulation to levels compatible with the expansionof non-agricultural employment."
4.11 It is clear that the Other Islands must provide much of the re-
quired growth in agriculture. But technological change and commercializa-
tion of peasant agriculture in Java has already gained momentum and is
unlikely to be impeded by a low growth policy, a policy which is politically
non-feasible.
1/ For a model of this process of change see Gordon Temple, "MudurnjaInvolusi Pertanian," Prisma, 1975.
2/ Alan M. Strout, "Agricultural Growth, Employment and Income Distribu-tion: Dilemmas for Indonesia's Next Five Year Plans," April 28, 1977.
- 20 -
4.12 Food security for the lowest income groups requires that efforts
to stimulate agricultural growth be accompanied by programs to accelerate
the growth of non-farm rural employment. Such rural development efforts can
help to reduce the social tensions which invariably accompany the disruptions
caused by technological change in a labor-surplus environment. They will
provide sources of income to members of the calorie-deficit target group who
now suffer from undernourishment while working 12 to 14 hours a day to earn
as little as US$0.15 per day.
V. OTHER POLICY ISSUES
5.1 As with other countriees, the introduction of HYVs in the late six-
ties and the application of other improved technology have made peasant agri-
cultural production dependent on the timely arrival of inputs - particularly
water and fertilizer - and on a dependable marketing system. Thus, the
achievement of food security has come to hinge upon the effectiveness of
10.00-15.00 47 0.3 11.7 4 0.1 11.015.00 and over 37 0.3 24.5 2 - 22.0
Total 14374 100.0 1.0 8970 100.0 0.6
/1 Private or public estates are not included.
Source: IBRD Report, Indonesia Agricultural and Rural Development SectorMemorandum (September 28, 1977).
Table 7
INDONESIA
Caloric Conversion Table
Unit Calories
Rice (Milled) kg 3660(Flour) kg 3720
Corn (on the cob) 698(Grain) kg 3490(Flour) kg 3550
Cassava (Root) kg 980(Dried) kg 3330(Flour) kg 3630
Sweet Potatoes kg 1000Fresh Fish kg 460Dried Fish (Salted) kg 1820Cumi-cumi kg 490Beef kg 2180Lamb kg 2470Pork kg 3330Dried Meat kg 3090Poultry kg 1930Eggs # 72Milk (Fresh) Liter 1152
(Powder) kg 3630Vegetables kg 190Coconut 595Peanut kg 1970Beans kg 3360Sugar (Brown) ons 389
(Granulated) ons 351Cooking Oil Liter 8840Margarines/Fat ons 739
Source: FAO & USHEW, Food Composition Table for Use in East Asia(Bethesda, Md., 1972) and IBRD, Indonesia: Development Prospects &Needs, Basic Economic Report (Washington, D. C. April 15, 1975).
Table 8
INDONESIA
Daily Per Capita Calorie Consumption
Monthly Java and Madura Outer IslandsExpenditureGroup (Rp) Urban Rural Urban Rural Indonesia
1/ Monthly per capita expenditure ranging from Rp 301 to Rp 500.21 Monthly per capita expenditure ranging from Rp 751 to Rp 1,000. 19% of the total population.3/ Hinimum per capita daily calorie requirement is 2118 for the base year.4/ This compares to 68% of the population if the food basket is allowed to vary with expenditure groups.
Source: Indonesia Household Expenditure Survey. H4(5
INDONESIA
Projected Total Food Needs, Market Demand and ProductionLow Income Growth Rate Projection
(Million Metric Tons)
Total Production ProjectionsFood Market Adjusted - Nutritional Domestic4, DomesticI/ 4/ ~~~~~~~~~~~~~~~~~4/Needs Demand Bank IFPRI Bank Gap Food Gap- Harket Gap-
1/ Supply needed to raise consumption to the minimum requirement level.
2/ Projected consumption level with unchanged income distribution.
0m
I-
INDONESIA
Projected Nutritional Gap in Grain Equivalents- /(1985)(million Mletric Tons)
Low Income Growth Rate - High Income Growth Rate
Calorie Requirement Calorie Req. - 200 Calorie Requirement Calorie Req. - 200Price Unchanged More Equal Unchanged More Equal Unchanged More Equal Unchanged More EqualChange Inc. Dist. Inc. Dist. Inc.Dist. Inc. Dist. Inc. Dist. Inc. Dist. Inc. Dist. Inc. Dist.
1/ Assuming 3.5 million calories per metric ton of cereal.
I-.0b
INDONESIA
Projected NutritionaL-Gap in Grain Equivalents (1995) ,(Million Metric Tons)
Low Income Growth Rate High Income Growth Rate% Calorie Requirement Calorie Req. - 200 + Calorie Requirement Calorie Req. - 200
Price Unchanged More Equal Unchanged More Equal U4changed More Equal Unchanged More EqualChange Inc. Dist. Inc. Dist. Inc.Dist. Inc. Dist. Inc. Dist. Inc. Dist. Inc. Dist. Inc. Dist.
Low Income Growth Rate I/ High Income Growth Rate3/
X Calorie Requirement- Calorie Req. - 200 Calorie Requirement Calorie Req. - 200Price Unchanged Mlore Equal 4/ Unchanged More Equal Urchanged tore Equal Unchanged More EqualChange Inc. Dist. Inc. Dist.- Inc.Dist. Inc. Dist. Inc. Dist. Inc. Dist. Inc. Dist. Inc. Dist.
1/ Assuming 5% annual CDP growth rate and population growth of 2.2% p.a.
2/ Assuming 8% annual GDP growth rate adjusted by population growth rate.
3/ 2129 calories per capita per day
4/ Assuming a decrease in GINI coefficient by 10%.
F3
NN
INDONESIA
Projected Malpourished Population (1995)
Low Income Growth Rate High Income Growth Rate
X Calorie Requirement Calorie Req. - 200 Calorie Requirement Calorie Req. - 200Price Unchanged More Equal Unchanged More Equal Unchanged More Equal Unchanged More EqualChange Inc. Dist. Inc. Dist. Inc.Dist. Inc. Dist. Inc. Dist. Inc. Dist. Inc. Dist. Inc. Dist.
Projected Price Change Effects on Calorie Consumption: 1985
Cumulative Total Daily Per Capita Calorie ConsumptionPopulation Low Growth Rate High Growth RateDistribution (X2 Base Year Const. Pi/ P + 50% P - 50% Const. P P + 50% P - 50%
/1 This nutritionally balanced, least cost diet was developed in thecourse of Indonesia Transmigration PrQiect II, III & IVidentification, using linear programming. The exercise wasconstrained by,a weight limitation of 1.4 kg of food per day.
/2 The calorie composition used in the least cost diet exercise ditterssomewhat from ours.
Source: IBRD, Indonesia: Identification of Transmigration ProjectsII, III & IV (May 16, 1977, Yellow Cover).
Figure 2
INDONESIAROJECTED TOTAL FOOD NEEOS. MRRKET OEMAND ANO PROOUCTrON
,,65.0
60C
X -
55.a-High GR
55.0
z t_10. 6 1719417192l819094 Low GR
C)C~~~~~~~~~~~~~~~
0.. 45.0
:40.0-
- nRRKET OERN
-* ~~ -IFR/ROUTO ROE/O-i - RJSE RK,OOCtNPOETO
P 30 .0/77
ul2D.0
I- 70-
LO c r. W I T I LO INO* CROUI *t R, T R';U T ,
1966 1970 1974 1978 1982 1986 1990 1994 1998YERRS
LEGENO… ---- TOTAL FOOO NEEDS
MiARKET OEMlANO-- - - ~BANK PRODUCTION PROJECTION
IFPR? PRODUCTrON PROJECTrON- - AD~RJUSTEa BANK PRODUCTION PROJECTION
------ HICH C-ROWTH RATE. MoRE EQURL INCOME DISTRIBUTION
CRi , AT f1SuNJhU 1NI!; CAL(lRIE RrouifFAWlNT l.fEVELCR-200i AT 200 C .i!-OilEli LE.S Tl2ll.l Mi 0lIIUtl REOIJl 0iE.0 LEVEL
Figure 6
INDONESIR'ROJECTED NUTRITIONAL GAP IN GRRIN EQUIVRLENTS 1995
5.60:
5.25
9.00v-:cr4
z: 2.75cz0-5
2.50
2.25- 2.uO - / CR
* 2.00r~~~~~~~~~~~~~~~
* 1.75
0-
CC 1.25
LG0 N
--0 - LO4COtCRRT.-2EEuL 00E ST18TO
.750
- ~~~CR.00 ~~~~~ ~~ ~2 2- CR- 200
-40.0 -20.0 .a 20.0 40.0
PRICE CHANGES [PERCENT]
LEGENDLOW GROWTH RATE. UNCHANGED INCOME OrsTRrsurToN
------ -LOW GROWTH RATE. MORE EQUAL INCOME DXSTRIBUTION- --- - -Ht0Gt OROIJTH RATE. UNCHANGED INCOME DISTRIBUTION- -- -- -NEOn GROWTH RATE. M1ORE EQUAL INCOME DISTRIBUTION
CRt, RT nssUth.o hl?411UNl1 CA1LORIE REOUIRElI1ENT LEVELCR-20DI AT 200 CSLQfUES LESS THFRl HtI:UflUM REffiltIfEMENT LEVFL
Figure 7
INDONESIR'ROJECTED INCOME OISTRIBUTION EFFECTS ON CALORIE COtNSUMPTION 1985
4250
LU 4000b-"
° 3750 . EHigh GRc-Ju~~~~~~~~~~~~
3500 ~~~~~~~~~~~,~ow GR
O 3250
a. 3000
2750 /
oCtooo
1-- 2250a- - - -ER
r-I
1) 000
1750
-i1 0 1 0 3 0 S 0 7 o 9 0
-- - ItORE ASKEIJ INCOZIE OISTR16UTbONUNCHcNOED tNCOII£ OISTRIBUT Ot
INOONESIRROJECTED TOTAL FOOO NEEDS AND MARKET DEMANO IN GRAIN EGUIVALENTS 1995
Z EO.o
-J_.J 57.5
65.0
50.5
0 O-
cc
CC 4S.0
i 42.5
c 40.0C,,3S0
o 40.
.J 97.6_
-40.0 -20.0 .0 20.0 40.0
PRICE CHRNGES [PERCENT]
LEGENOTOTAL fOOO NEEDS WITH LOW GROUTH RRIE
-…------ -nRRKET OEIIRNa WITH LOW QROUfIH RATE- - - - - - TOTAL FOOO NEEDS WITH HIOII 0ROUTH RATE
MARKET DEh1R.IO UtTH HIOH GROWTH RRTE
- PE TUNJUK-PETUNIUK UNTUKUmur 3-4 lahun Umur 4-S tahun IMUNISASIANTITUBERKULOSA(SCG 1-* PEMBERIAN MAKANAN YANG SEHAT20 TaiA imunKM SJ20 _ _ _ _ __ _ _ __ _ _ _ _ _ _ _ _ Tvngail panaikluan hasilES M
IMUNIAS CefukACAR Iui
18 _ _ _ _ _ _ _ _ _ _ _ _ _ _ _ _ e IMUNISASIcacAR *{1 1i m Selain KARTU MENUJU SEHATTAnUAJI imfurlfiJ I ) Air Susu lbuhr.ui pcme,.ikiwn hatilI berika'ntah
17 _ _ _ _ _ _ _ __ _ _ _ _ _ _ __ _ _ _ Tan nuniuiAnpn makanan tambahan
16 _______________________________ ~~um ur 4 Bulan-- iMUNISASI POLIOMYELITIS A (,
15 Tanggai gmutnitl ke- I
1 ke-3 bubur teptng buuh t
Tanggi imunisai ulainpn umur 6 Bulan I
IMUNISASI VIPTERIAA PERTUSSIS, TETANUS AQPTI ' berIBU a 3
| ALASANIJNTUKKRliATIANKHUSUS ~ ~ ~ ~ ~ ~ ~ ~ ns I | | ja i tu & 2 aa aknnby
12 ~~~~~~~~~~~~~~Tsnuggimuniu,i ket
ke-3
IP4+1~~~~~~~~~~~~~ np 1zd"
*IMUNISASI KOLERA, TYPHUS A PARA-TYPHUS IENIS SAYUR-SYRN AKPU
(KOTIPAI DAN BUAH-BUAHAN SEHAT .
TanSal imunha,i ke I
8 -38- 40 42 44- 46.48 30 32- 34 56 3805 .k6i-
TanUaj Imunisasi ulInang~ - ~ AKPUVITAMIN A -DOSIS TLNGGI (-j
ALASAN ~~~~ PERHATIAN KHTngoUdUS ikn ke- AIRSUSU IBUALASAN UNTUK PERHATIAN KHLISUS it.3 ~~~ialah makanan bayi
yang terbaik____ ____ ___ ____ ___ ____ ___ ____ ___ ____ ___ ____ d d . I8 I~. k e q w.IL. n4U .w
UNTUK DOISI OLEU PETUGAS Kalau anak anda mencret, berikan dengan segera: ORALITKlinik/Pos Pcnimbingan Kalau lidak ada, bisa membual sendiri. Campurlahs Umur 2-3 tahun
Tanggal PendAfai + Ilu3kl 4 - W - H -
No. PendaCtar n 2aIauIkali -_ _t wndok.teh gula I ujung wndokdtdh goain. I gdas tch 1 - ……_
Setelah Ila; umur 1-2 un __seliap kali i rmencret berikan tgi: 14… … … __ _ -14-_ _ _ . ._
.L. . ke=l a k i t * Jangal Lah------_r_ _-1kaIi 3 -_ _ ._ __- - - _Laki-14ki l~~~~~~~tendok-tth l ujungwsnduk..Ich I