_____________________________________________________________________________________________ Source: JEC Democratic Staff. Data from CDC, Kaiser Family Foundation, IMSHealth, ACS 2015, CBO. Note: Premium increases are based on the second lowest cost silver tax plan and CBO projections. Premiums are before tax credits. Premiums for each state are based on the premium for a major city in each state. Decreases in coverage assume that the projected decreases in coverage are divided proportionally along with the current size of the insured population for each category. Number losing private coverage just looks at those losing coverage on the individual market and through their employers. Alabama Opioids Epidemic Fact Sheet • The drug overdose death rate in Alabama is 15.7 per 100,000 population. In 2015, 736 people died from drug overdoses in Alabama. o The opioid overdose death rate in Alabama is 6.1. In 2015, 282 people died from opioid overdoses in Alabama. • Doctors in Alabama prescribe 142.9 opioid pain relievers per 100 persons, compared to the national rate of 82.5 per 100 persons. • Medicaid covers 19 percent of people in Alabama. • Medicaid covers 6 percent of medication-assisted substance abuse treatment in Alabama. • The uninsured rate in Alabama is 10.1percent. • Under TrumpCare, 135,456 people in Alabama would lose private insurance coverage. • Next year under TrumpCare, premiums would increase by $1,181 in Alabama. 0 1 2 3 4 5 6 7 1999 2001 2003 2005 2007 2009 2011 2013 2015 Alabama Opioid Overdose Death Rate, 1999-2015 Age-Adjusted Death Rate, per 100,000 Population Source: CDC/NCHS, National Vital Statistics System, Mortality. CDC WONDER
Transcript
_____________________________________________________________________________________________ Source: JEC Democratic Staff. Data from CDC, Kaiser Family Foundation, IMSHealth, ACS 2015, CBO. Note: Premium increases are based on the second lowest cost silver tax plan and CBO projections. Premiums are before tax credits. Premiums for each state are based on the premium for a major city in each state. Decreases in coverage assume that the projected decreases in coverage are divided proportionally along with the current size of the insured population for each category. Number losing private coverage just looks at those losing coverage on the individual market and through their employers.
Alabama Opioids Epidemic Fact Sheet
• The drug overdose death rate in Alabama is 15.7 per 100,000 population. In 2015, 736 people died from drug overdoses in Alabama.
o The opioid overdose death rate in Alabama is 6.1. In 2015, 282 people died from opioid overdoses in Alabama.
• Doctors in Alabama prescribe 142.9 opioid pain relievers per 100 persons, compared to the national rate of 82.5 per 100 persons.
• Medicaid covers 19 percent of people in Alabama.
• Medicaid covers 6 percent of medication-assisted substance abuse treatment in Alabama.
• The uninsured rate in Alabama is 10.1percent.
• Under TrumpCare, 135,456 people in Alabama would lose private insurance coverage.
• Next year under TrumpCare, premiums would increase by $1,181 in Alabama.
0
1
2
3
4
5
6
7
1999 2001 2003 2005 2007 2009 2011 2013 2015
Alabama Opioid Overdose Death Rate, 1999-2015Age-Adjusted Death Rate, per 100,000 Population
Source: CDC/NCHS, National Vital Statistics System, Mortality. CDC WONDER
_____________________________________________________________________________________________ Source: JEC Democratic Staff. Data from CDC, Kaiser Family Foundation, IMSHealth, ACS 2015, CBO. Note: Premium increases are based on the second lowest cost silver tax plan and CBO projections. Premiums are before tax credits. Premiums for each state are based on the premium for a major city in each state. Decreases in coverage assume that the projected decreases in coverage are divided proportionally along with the current size of the insured population for each category. Number losing private coverage just looks at those losing coverage on the individual market and through their employers.
Alaska Opioids Epidemic Fact Sheet
• The drug overdose death rate in Alaska is 16 per 100,000 population. In 2015, 122 people died from drug overdoses in Alaska.
o The opioid overdose death rate in Alaska is 11. In 2015, 86 people died from opioid overdoses in Alaska.
• Doctors in Alaska prescribe 65.1 opioid pain relievers per 100 persons, compared to the national rate of 82.5 per 100 persons.
• Medicaid covers 18 percent of people in Alaska.
• Medicaid covers 34 percent of medication-assisted substance abuse treatment in Alaska.
• The uninsured rate in Alaska is 14.9 percent.
• Under TrumpCare, 12,764 people in Alaska would lose private insurance coverage.
• Next year under TrumpCare, premiums would increase by $2,170 in Alaska.
0
2
4
6
8
10
12
14
1999 2001 2003 2005 2007 2009 2011 2013 2015
Alaska Opioid Overdose Death Rate, 1999-2015Age-Adjusted Death Rate, per 100,000 Population
Source:Note:
CDC/NCHS, National Vital Statistics System, Mortality. CDC WONDER. Dotted line represents gaps in data due to data availability.
_____________________________________________________________________________________________ Source: JEC Democratic Staff. Data from CDC, Kaiser Family Foundation, IMSHealth, ACS 2015, CBO. Note: Premium increases are based on the second lowest cost silver tax plan and CBO projections. Premiums are before tax credits. Premiums for each state are based on the premium for a major city in each state. Decreases in coverage assume that the projected decreases in coverage are divided proportionally along with the current size of the insured population for each category. Number losing private coverage just looks at those losing coverage on the individual market and through their employers.
Arizona Opioids Epidemic Fact Sheet
• The drug overdose death rate in Arizona is 19 per 100,000 population. In 2015, 1,274 people died from drug overdoses in Arizona.
o The opioid overdose death rate in Arizona is 10.2. In 2015, 671 people died from opioid overdoses in Arizona.
• Doctors in Arizona prescribe 82.4 opioid pain relievers per 100 persons, compared to the national rate of 82.5 per 100 persons.
• Medicaid covers 25 percent of people in Arizona.
• Medicaid covers 15 percent of medication-assisted substance abuse treatment in Arizona.
• The uninsured rate in Arizona is 10.8 percent.
• Under TrumpCare, 139,103 people in Arizona would lose private insurance coverage.
• Next year under TrumpCare, premiums would increase by $1,217 in Arizona.
0
3
6
9
12
1999 2001 2003 2005 2007 2009 2011 2013 2015
Arizona Opioid Overdose Death Rate, 1999-2015Age-Adjusted Death Rate, per 100,000 Population
Source: CDC/NCHS, National Vital Statistics System, Mortality. CDC WONDER
_____________________________________________________________________________________________ Source: JEC Democratic Staff. Data from CDC, Kaiser Family Foundation, IMSHealth, ACS 2015, CBO. Note: Premium increases are based on the second lowest cost silver tax plan and CBO projections. Premiums are before tax credits. Premiums for each state are based on the premium for a major city in each state. Decreases in coverage assume that the projected decreases in coverage are divided proportionally along with the current size of the insured population for each category. Number losing private coverage just looks at those losing coverage on the individual market and through their employers.
Arkansas Opioids Epidemic Fact Sheet
• The drug overdose death rate in Arkansas is 13.8 per 100,000 population. In 2015, 392 people died from drug overdoses in Arkansas.
o The opioid overdose death rate in Arkansas is 7.2. In 2015, 203 people died from opioid overdoses in Arkansas.
• Doctors in Arkansas prescribe 115.8 opioid pain relievers per 100 persons, compared to the national rate of 82.5 per 100 persons.
• Medicaid covers 22 percent of people in Arkansas.
• Medicaid covers 8 percent of medication-assisted substance abuse treatment in Arkansas.
• The uninsured rate in Arkansas is 9.5 percent.
• Under TrumpCare, 90,844 people in Arkansas would lose private insurance coverage.
• Next year under TrumpCare, premiums would increase by $754 in Arkansas.
0
1
2
3
4
5
6
7
8
1999 2001 2003 2005 2007 2009 2011 2013 2015
Arkansas Opioid Overdose Death Rate, 1999-2015Age-Adjusted Death Rate, per 100,000 Population
Source: CDC/NCHS, National Vital Statistics System, Mortality. CDC WONDER
_____________________________________________________________________________________________ Source: JEC Democratic Staff. Data from CDC, Kaiser Family Foundation, IMSHealth, ACS 2015, CBO. Note: Premium increases are based on the second lowest cost silver tax plan and CBO projections. Premiums are before tax credits. Premiums for each state are based on the premium for a major city in each state. Decreases in coverage assume that the projected decreases in coverage are divided proportionally along with the current size of the insured population for each category. Number losing private coverage just looks at those losing coverage on the individual market and through their employers.
California Opioids Epidemic Fact Sheet
• The drug overdose death rate in California is 11.3 per 100,000 population. In 2015, 4,659 people died from drug overdoses in California.
o The opioid overdose death rate in California is 4.9. In 2015, 2,018 people died from opioid overdoses in California.
• Doctors in California prescribe 57 opioid pain relievers per 100 persons, compared to the national rate of 82.5 per 100 persons.
• Medicaid covers 26 percent of people in California.
• Medicaid covers 16 percent of medication-assisted substance abuse treatment in California.
• The uninsured rate in California is 8.6 percent.
• Under TrumpCare, 1,492,532 people in California would lose private insurance coverage.
• Next year under TrumpCare, premiums would increase by $619 in California.
0
1
2
3
4
5
6
1999 2001 2003 2005 2007 2009 2011 2013 2015
California Opioid Overdose Death Rate, 1999-2015Age-Adjusted Death Rate, per 100,000 Population
Source: CDC/NCHS, National Vital Statistics System, Mortality. CDC WONDER
_____________________________________________________________________________________________ Source: JEC Democratic Staff. Data from CDC, Kaiser Family Foundation, IMSHealth, ACS 2015, CBO. Note: Premium increases are based on the second lowest cost silver tax plan and CBO projections. Premiums are before tax credits. Premiums for each state are based on the premium for a major city in each state. Decreases in coverage assume that the projected decreases in coverage are divided proportionally along with the current size of the insured population for each category. Number losing private coverage just looks at those losing coverage on the individual market and through their employers.
Colorado Opioids Epidemic Fact Sheet
• The drug overdose death rate in Colorado is 15.4 per 100,000 population. In 2015, 869 people died from drug overdoses in Colorado.
o The opioid overdose death rate in Colorado is 8.7. In 2015, 495 people died from opioid overdoses in Colorado.
• Doctors in Colorado prescribe 71.2 opioid pain relievers per 100 persons, compared to the national rate of 82.5 per 100 persons.
• Medicaid covers 19 percent of people in Colorado.
• Medicaid covers 25 percent of medication-assisted substance abuse treatment in Colorado.
• The uninsured rate in Colorado is 8.1 percent.
• Under TrumpCare, 162,644 people in Colorado would lose private insurance coverage.
• Next year under TrumpCare, premiums would increase by $751 in Colorado.
0
1
2
3
4
5
6
7
8
9
10
1999 2001 2003 2005 2007 2009 2011 2013 2015
Colorado Opioid Overdose Death Rate, 1999-2015Age-Adjusted Death Rate, per 100,000 Population
Source: CDC/NCHS, National Vital Statistics System, Mortality. CDC WONDER
_____________________________________________________________________________________________ Source: JEC Democratic Staff. Data from CDC, Kaiser Family Foundation, IMSHealth, ACS 2015, CBO. Note: Premium increases are based on the second lowest cost silver tax plan and CBO projections. Premiums are before tax credits. Premiums for each state are based on the premium for a major city in each state. Decreases in coverage assume that the projected decreases in coverage are divided proportionally along with the current size of the insured population for each category. Number losing private coverage just looks at those losing coverage on the individual market and through their employers.
Connecticut Opioids Epidemic Fact Sheet
• The drug overdose death rate in Connecticut is 22.1 per 100,000 population. In 2015, 800 people died from drug overdoses in Connecticut.
o The opioid overdose death rate in Connecticut is 19.2. In 2015, 685 people died from opioid overdoses in Connecticut.
• Doctors in Connecticut prescribe 72.4 opioid pain relievers per 100 persons, compared to the national rate of 82.5 per 100 persons.
• Medicaid covers 19 percent of people in Connecticut.
• Medicaid covers 44 percent of medication-assisted substance abuse treatment in Connecticut.
• The uninsured rate in Connecticut is 6 percent.
• Under TrumpCare, 133,252 people in Connecticut would lose private insurance coverage.
• Next year under TrumpCare, premiums would increase by $970 in Connecticut.
0
5
10
15
20
25
1999 2001 2003 2005 2007 2009 2011 2013 2015
Connecticut Opioid Overdose Death Rate, 1999-2015Age-Adjusted Death Rate, per 100,000 Population
Source: CDC/NCHS, National Vital Statistics System, Mortality. CDC WONDER
_____________________________________________________________________________________________ Source: JEC Democratic Staff. Data from CDC, Kaiser Family Foundation, IMSHealth, ACS 2015, CBO. Note: Premium increases are based on the second lowest cost silver tax plan and CBO projections. Premiums are before tax credits. Premiums for each state are based on the premium for a major city in each state. Decreases in coverage assume that the projected decreases in coverage are divided proportionally along with the current size of the insured population for each category. Number losing private coverage just looks at those losing coverage on the individual market and through their employers.
Delaware Opioids Epidemic Fact Sheet
• The drug overdose death rate in Delaware is 22 per 100,000 population. In 2015, 198 people died from drug overdoses in Delaware.
o The opioid overdose death rate in Delaware is 14.8. In 2015, 133 people died from opioid overdoses in Delaware.
• Doctors in Delaware prescribe 90.8 opioid pain relievers per 100 persons, compared to the national rate of 82.5 per 100 persons.
• Medicaid covers 18 percent of people in Delaware.
• Medicaid covers 40 percent of medication-assisted substance abuse treatment in Delaware.
• The uninsured rate in Delaware is 5.9 percent.
• Under TrumpCare, 24,065 people in Delaware would lose private insurance coverage.
• Next year under TrumpCare, premiums would increase by $1,015 in Delaware.
0
2
4
6
8
10
12
14
16
1999 2001 2003 2005 2007 2009 2011 2013 2015
Deleware Opioid Overdose Death Rate, 1999-2015Age-Adjusted Death Rate, per 100,000 Population
Source: CDC/NCHS, National Vital Statistics System, Mortality. CDC WONDER
_____________________________________________________________________________________________ Source: JEC Democratic Staff. Data from CDC, Kaiser Family Foundation, IMSHealth, ACS 2015, CBO. Note: Premium increases are based on the second lowest cost silver tax plan and CBO projections. Premiums are before tax credits. Premiums for each state are based on the premium for a major city in each state. Decreases in coverage assume that the projected decreases in coverage are divided proportionally along with the current size of the insured population for each category. Number losing private coverage just looks at those losing coverage on the individual market and through their employers.
District of Columbia Opioids Epidemic Fact Sheet
• The drug overdose death rate in D.C. is 18.6 per 100,000 population. In 2015, 125 people died from drug overdoses in D.C.
o The opioid overdose death rate in D.C. is 14.5. In 2015, 98 people died from opioid overdoses in D.C.
• Doctors in D.C. prescribe 85.7 opioid pain relievers per 100 persons, compared to the national rate of 82.5 per 100 persons.
• Medicaid covers 26 percent of people in D.C.
• Medicaid covers 45 percent of medication-assisted substance abuse treatment in D.C.
• The uninsured rate in D.C. is 3.8 percent.
0
2
4
6
8
10
12
14
16
1999 2001 2003 2005 2007 2009 2011 2013 2015
DC Opioid Overdose Death Rate, 1999-2015Age-Adjusted Death Rate, per 100,000 Population
Source: CDC/NCHS, National Vital Statistics System, Mortality. CDC WONDER
_____________________________________________________________________________________________ Source: JEC Democratic Staff. Data from CDC, Kaiser Family Foundation, IMSHealth, ACS 2015, CBO. Note: Premium increases are based on the second lowest cost silver tax plan and CBO projections. Premiums are before tax credits. Premiums for each state are based on the premium for a major city in each state. Decreases in coverage assume that the projected decreases in coverage are divided proportionally along with the current size of the insured population for each category. Number losing private coverage just looks at those losing coverage on the individual market and through their employers.
Florida Opioids Epidemic Fact Sheet
• The drug overdose death rate in Florida is 16.2 per 100,000 population. In 2015, 3,228 people died from drug overdoses in Florida.
o The opioid overdose death rate in Florida is 9.4. In 2015, 1,838 people died from opioid overdoses in Florida.
• Doctors in Florida prescribe 72.7 opioid pain relievers per 100 persons, compared to the national rate of 82.5 per 100 persons.
• Medicaid covers 18 percent of people in Florida.
• Medicaid covers 5 percent of medication-assisted substance abuse treatment in Florida.
• The uninsured rate in Florida is 13.3 percent.
• Under TrumpCare, 812,666 people in Florida would lose private insurance coverage.
• Next year under TrumpCare, premiums would increase by $734 in Florida.
0
1
2
3
4
5
6
7
8
9
10
1999 2001 2003 2005 2007 2009 2011 2013 2015
Florida Opioid Overdose Death Rate, 1999-2015Age-Adjusted Death Rate, per 100,000 Population
Source: CDC/NCHS, National Vital Statistics System, Mortality. CDC WONDER
_____________________________________________________________________________________________ Source: JEC Democratic Staff. Data from CDC, Kaiser Family Foundation, IMSHealth, ACS 2015, CBO. Note: Premium increases are based on the second lowest cost silver tax plan and CBO projections. Premiums are before tax credits. Premiums for each state are based on the premium for a major city in each state. Decreases in coverage assume that the projected decreases in coverage are divided proportionally along with the current size of the insured population for each category. Number losing private coverage just looks at those losing coverage on the individual market and through their employers.
Georgia Opioids Epidemic Fact Sheet
• The drug overdose death rate in Georgia is 12.7 per 100,000 population. In 2015, 1,302 people died from drug overdoses in Georgia.
o The opioid overdose death rate in Georgia is 8.4. In 2015, 858 people died from opioid overdoses in Georgia.
• Doctors in Georgia prescribe 90.7 opioid pain relievers per 100 persons, compared to the national rate of 82.5 per 100 persons.
• Medicaid covers 19 percent of people in Georgia.
• Medicaid covers 7 percent of medication-assisted substance abuse treatment in Georgia.
• The uninsured rate in Georgia is 13.9 percent.
• Under TrumpCare, 276,854 people in Georgia would lose private insurance coverage.
• Next year under TrumpCare, premiums would increase by $686 in Georgia.
0
1
2
3
4
5
6
7
8
9
1999 2001 2003 2005 2007 2009 2011 2013 2015
Georgia Opioid Overdose Death Rate, 1999-2015Age-Adjusted Death Rate, per 100,000 Population
Source: CDC/NCHS, National Vital Statistics System, Mortality. CDC WONDER
_____________________________________________________________________________________________ Source: JEC Democratic Staff. Data from CDC, Kaiser Family Foundation, IMSHealth, ACS 2015, CBO. Note: Premium increases are based on the second lowest cost silver tax plan and CBO projections. Premiums are before tax credits. Premiums for each state are based on the premium for a major city in each state. Decreases in coverage assume that the projected decreases in coverage are divided proportionally along with the current size of the insured population for each category. Number losing private coverage just looks at those losing coverage on the individual market and through their employers.
Hawaii Opioids Epidemic Fact Sheet
• The drug overdose death rate in Hawaii is 11.3 per 100,000 population. In 2015, 169 people died from drug overdoses in Virginia.
o The opioid overdose death rate in Hawaii is 4.1. In 2015, 62 people died from opioid overdoses in Hawaii.
• Doctors in Hawaii prescribe 52 opioid pain relievers per 100 persons, compared to the national rate of 82.5 per 100 persons.
• Medicaid covers 18 percent of people in Hawaii.
• Medicaid covers 25 percent of medication-assisted substance abuse treatment in Hawaii.
• The uninsured rate in Hawaii is 4 percent.
• Under TrumpCare, 23,198 people in Hawaii would lose private insurance coverage.
• Next year under TrumpCare, premiums would increase by $833 in Hawaii.
0
1
2
3
4
5
6
1999 2001 2003 2005 2007 2009 2011 2013 2015
Hawaii Opioid Overdose Death Rate, 1999-2015Age-Adjusted Death Rate, per 100,000 Population
Source: CDC/NCHS, National Vital Statistics System, Mortality. CDC WONDER
_____________________________________________________________________________________________ Source: JEC Democratic Staff. Data from CDC, Kaiser Family Foundation, IMSHealth, ACS 2015, CBO. Note: Premium increases are based on the second lowest cost silver tax plan and CBO projections. Premiums are before tax credits. Premiums for each state are based on the premium for a major city in each state. Decreases in coverage assume that the projected decreases in coverage are divided proportionally along with the current size of the insured population for each category. Number losing private coverage just looks at those losing coverage on the individual market and through their employers.
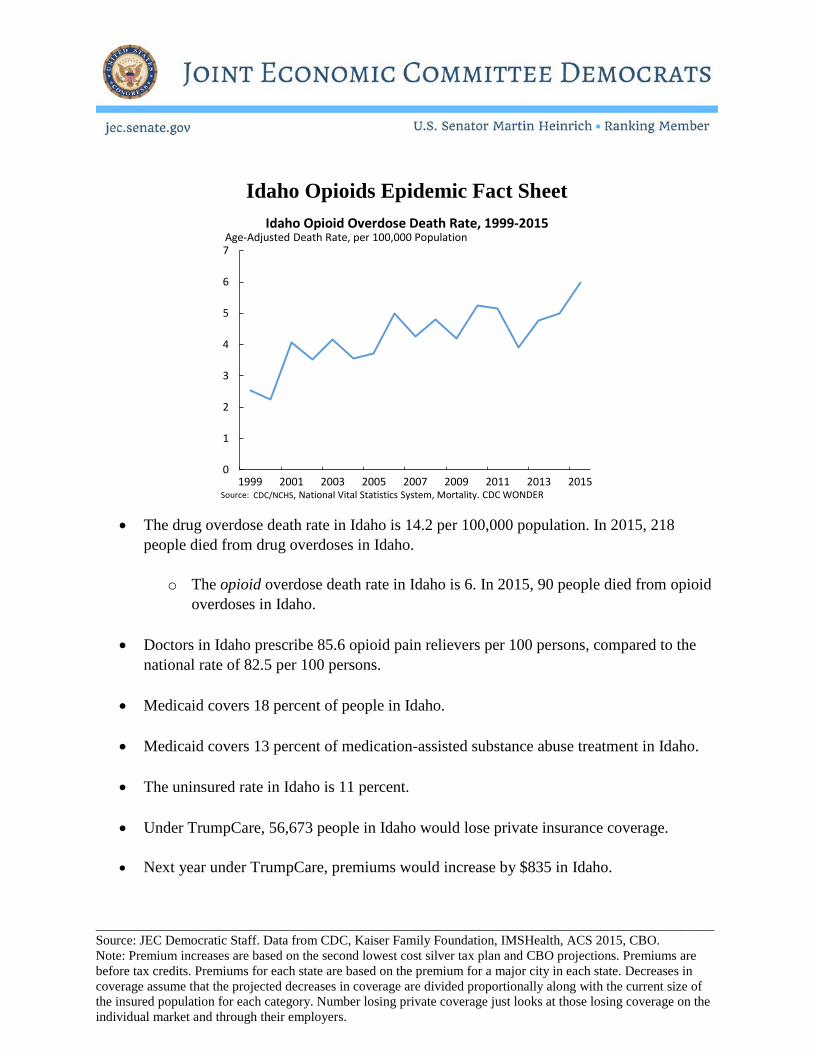
Idaho Opioids Epidemic Fact Sheet
• The drug overdose death rate in Idaho is 14.2 per 100,000 population. In 2015, 218 people died from drug overdoses in Idaho.
o The opioid overdose death rate in Idaho is 6. In 2015, 90 people died from opioid overdoses in Idaho.
• Doctors in Idaho prescribe 85.6 opioid pain relievers per 100 persons, compared to the national rate of 82.5 per 100 persons.
• Medicaid covers 18 percent of people in Idaho.
• Medicaid covers 13 percent of medication-assisted substance abuse treatment in Idaho.
• The uninsured rate in Idaho is 11 percent.
• Under TrumpCare, 56,673 people in Idaho would lose private insurance coverage.
• Next year under TrumpCare, premiums would increase by $835 in Idaho.
0
1
2
3
4
5
6
7
1999 2001 2003 2005 2007 2009 2011 2013 2015
Idaho Opioid Overdose Death Rate, 1999-2015Age-Adjusted Death Rate, per 100,000 Population
Source: CDC/NCHS, National Vital Statistics System, Mortality. CDC WONDER
_____________________________________________________________________________________________ Source: JEC Democratic Staff. Data from CDC, Kaiser Family Foundation, IMSHealth, ACS 2015, CBO. Note: Premium increases are based on the second lowest cost silver tax plan and CBO projections. Premiums are before tax credits. Premiums for each state are based on the premium for a major city in each state. Decreases in coverage assume that the projected decreases in coverage are divided proportionally along with the current size of the insured population for each category. Number losing private coverage just looks at those losing coverage on the individual market and through their employers.
Illinois Opioids Epidemic Fact Sheet
• The drug overdose death rate in Illinois is 14.1 per 100,000 population. In 2015, 1,835 people died from drug overdoses in Illinois.
o The opioid overdose death rate in Illinois is 10.7. In 2015, 1,381 people died from opioid overdoses in Illinois.
• Doctors in Illinois prescribe 67.9 opioid pain relievers per 100 persons, compared to the national rate of 82.5 per 100 persons.
• Medicaid covers 19 percent of people in Illinois.
• Medicaid covers 15 percent of medication-assisted substance abuse treatment in Illinois.
• The uninsured rate in Illinois is 7.1 percent.
• Under TrumpCare, 385,456 people in Illinois would lose private insurance coverage.
• Next year under TrumpCare, premiums would increase by $698 in Illinois.
0
2
4
6
8
10
12
1999 2001 2003 2005 2007 2009 2011 2013 2015
Illinois Opioid Overdose Death Rate, 1999-2015Age-Adjusted Death Rate, per 100,000 Population
Source: CDC/NCHS, National Vital Statistics System, Mortality. CDC WONDER
_____________________________________________________________________________________________ Source: JEC Democratic Staff. Data from CDC, Kaiser Family Foundation, IMSHealth, ACS 2015, CBO. Note: Premium increases are based on the second lowest cost silver tax plan and CBO projections. Premiums are before tax credits. Premiums for each state are based on the premium for a major city in each state. Decreases in coverage assume that the projected decreases in coverage are divided proportionally along with the current size of the insured population for each category. Number losing private coverage just looks at those losing coverage on the individual market and through their employers.
Indiana Opioids Epidemic Fact Sheet
• The drug overdose death rate in Indiana is 19.5 per 100,000 population. In 2015, 1,245 people died from drug overdoses in Indiana.
o The opioid overdose death rate in Indiana is 8.5. In 2015, 535 people died from opioid overdoses in Indiana.
• Doctors in Indiana prescribe 109.1 opioid pain relievers per 100 persons, compared to the national rate of 82.5 per 100 persons.
• Medicaid covers 19 percent of people in Indiana.
• Medicaid covers 17 percent of medication-assisted substance abuse treatment in Indiana.
• The uninsured rate in Indiana is 9.6 percent.
• Under TrumpCare, 158,408 people in Indiana would lose private insurance coverage.
• Next year under TrumpCare, premiums would increase by $686 in Indiana.
0
1
2
3
4
5
6
7
8
9
1999 2001 2003 2005 2007 2009 2011 2013 2015
Indiana Opioid Overdose Death Rate, 1999-2015Age-Adjusted Death Rate, per 100,000 Population
Source: CDC/NCHS, National Vital Statistics System, Mortality. CDC WONDER
_____________________________________________________________________________________________ Source: JEC Democratic Staff. Data from CDC, Kaiser Family Foundation, IMSHealth, ACS 2015, CBO. Note: Premium increases are based on the second lowest cost silver tax plan and CBO projections. Premiums are before tax credits. Premiums for each state are based on the premium for a major city in each state. Decreases in coverage assume that the projected decreases in coverage are divided proportionally along with the current size of the insured population for each category. Number losing private coverage just looks at those losing coverage on the individual market and through their employers.
Iowa Opioids Epidemic Fact Sheet
• The drug overdose death rate in Iowa is 10.3 per 100,000 population. In 2015, 309 people died from drug overdoses in Iowa.
o The opioid overdose death rate in Iowa is 5.8. In 2015, 170 people died from opioid overdoses in Iowa.
• Doctors in Iowa prescribe 72.8 opioid pain relievers per 100 persons, compared to the national rate of 82.5 per 100 persons.
• Medicaid covers 17 percent of people in Iowa.
• Medicaid covers 18 percent of medication-assisted substance abuse treatment in Iowa.
• The uninsured rate in Iowa is 5 percent.
• Under TrumpCare, 114,077 people in Iowa would lose private insurance coverage.
• Next year under TrumpCare, premiums would increase by $722 in Iowa.
0
1
2
3
4
5
6
7
2001 2003 2005 2007 2009 2011 2013 2015
Iowa Opioid Overdose Death Rate, 2001-2015Age-Adjusted Death Rate, per 100,000 Population
Source: CDC/NCHS, National Vital Statistics System, Mortality. CDC WONDER
_____________________________________________________________________________________________ Source: JEC Democratic Staff. Data from CDC, Kaiser Family Foundation, IMSHealth, ACS 2015, CBO. Note: Premium increases are based on the second lowest cost silver tax plan and CBO projections. Premiums are before tax credits. Premiums for each state are based on the premium for a major city in each state. Decreases in coverage assume that the projected decreases in coverage are divided proportionally along with the current size of the insured population for each category. Number losing private coverage just looks at those losing coverage on the individual market and through their employers.
Kansas Opioids Epidemic Fact Sheet
• The drug overdose death rate in Kansas is 11.8 per 100,000 population. In 2015, 329 people died from drug overdoses in Kansas.
o The opioid overdose death rate in Kansas is 5.4. In 2015, 150 people died from opioid overdoses in Kansas.
• Doctors in Kansas prescribe 93.8 opioid pain relievers per 100 persons, compared to the national rate of 82.5 per 100 persons.
• Medicaid covers 13 percent of people in Kansas.
• Medicaid covers 8 percent of medication-assisted substance abuse treatment in Kansas.
• The uninsured rate in Kansas is 9.1 percent.
• Under TrumpCare, 94,840 people in Kansas would lose private insurance coverage.
• Next year under TrumpCare, premiums would increase by $866 in Kansas.
0
1
2
3
4
5
6
7
1999 2001 2003 2005 2007 2009 2011 2013 2015
Kansas Opioid Overdose Death Rate, 1999-2015Age-Adjusted Death Rate, per 100,000 Population
Source: CDC/NCHS, National Vital Statistics System, Mortality. CDC WONDER
_____________________________________________________________________________________________ Source: JEC Democratic Staff. Data from CDC, Kaiser Family Foundation, IMSHealth, ACS 2015, CBO. Note: Premium increases are based on the second lowest cost silver tax plan and CBO projections. Premiums are before tax credits. Premiums for each state are based on the premium for a major city in each state. Decreases in coverage assume that the projected decreases in coverage are divided proportionally along with the current size of the insured population for each category. Number losing private coverage just looks at those losing coverage on the individual market and through their employers.
Kentucky Opioids Epidemic Fact Sheet
• The drug overdose death rate in Kentucky is 29.9 per 100,000 population. In 2015, 1,273 people died from drug overdoses in Kentucky.
o The opioid overdose death rate in Kentucky is 21. In 2015, 885 people died from opioid overdoses in Kentucky.
• Doctors in Kentucky prescribe 128.4 opioid pain relievers per 100 persons, compared to the national rate of 82.5 per 100 persons.
• Medicaid covers 22 percent of people in Kentucky.
• Medicaid covers 44 percent of medication-assisted substance abuse treatment in Kentucky.
• The uninsured rate in Kentucky is 6 percent.
• Under TrumpCare, 166,581 people in Kentucky would lose private insurance coverage.
• Next year under TrumpCare, premiums would increase by $550 in Kentucky.
0
5
10
15
20
25
1999 2001 2003 2005 2007 2009 2011 2013 2015
Kentucky Opioid Overdose Death Rate, 1999-2015Age-Adjusted Death Rate, per 100,000 Population
Source: CDC/NCHS, National Vital Statistics System, Mortality. CDC WONDER
_____________________________________________________________________________________________ Source: JEC Democratic Staff. Data from CDC, Kaiser Family Foundation, IMSHealth, ACS 2015, CBO. Note: Premium increases are based on the second lowest cost silver tax plan and CBO projections. Premiums are before tax credits. Premiums for each state are based on the premium for a major city in each state. Decreases in coverage assume that the projected decreases in coverage are divided proportionally along with the current size of the insured population for each category. Number losing private coverage just looks at those losing coverage on the individual market and through their employers.
Louisiana Opioids Epidemic Fact Sheet
• The drug overdose death rate in Louisiana is 19 per 100,000 population. In 2015, 861 people died from drug overdoses in Louisiana.
o The opioid overdose death rate in Louisiana is 6.3. In 2015, 287 people died from opioid overdoses in Louisiana.
• Doctors in Louisiana prescribe 118 opioid pain relievers per 100 persons, compared to the national rate of 82.5 per 100 persons.
• Medicaid covers 20 percent of people in Louisiana.
• Medicaid covers 8 percent of medication-assisted substance abuse treatment in Louisiana.
• The uninsured rate in Louisiana is 11.9 percent.
• Under TrumpCare, 142,930 people in Virginia would lose private insurance coverage.
• Next year under TrumpCare, premiums would increase by $895 in Louisiana.
0
1
2
3
4
5
6
7
1999 2001 2003 2005 2007 2009 2011 2013 2015
Louisiana Opioid Overdose Death Rate, 1999-2015Age-Adjusted Death Rate, per 100,000 Population
Source: CDC/NCHS, National Vital Statistics System, Mortality. CDC WONDER
_____________________________________________________________________________________________ Source: JEC Democratic Staff. Data from CDC, Kaiser Family Foundation, IMSHealth, ACS 2015, CBO. Note: Premium increases are based on the second lowest cost silver tax plan and CBO projections. Premiums are before tax credits. Premiums for each state are based on the premium for a major city in each state. Decreases in coverage assume that the projected decreases in coverage are divided proportionally along with the current size of the insured population for each category. Number losing private coverage just looks at those losing coverage on the individual market and through their employers.
Maine Opioids Epidemic Fact Sheet
• The drug overdose death rate in Maine is 21.2 per 100,000 population. In 2015, 269 people died from drug overdoses in Maine.
o The opioid overdose death rate in Maine is 19.3. In 2015, 238 people died from opioid overdoses in Maine.
• Doctors in Maine prescribe 85.1 opioid pain relievers per 100 persons, compared to the national rate of 82.5 per 100 persons.
• Medicaid covers 23 percent of people in Maine.
• Medicaid covers 38 percent of medication-assisted substance abuse treatment in Maine.
• The uninsured rate in Maine is 8.4 percent.
• Under TrumpCare, 33,455 people in Maine would lose private insurance coverage.
• Next year under TrumpCare, premiums would increase by $818 in Maine.
0
5
10
15
20
25
1999 2001 2003 2005 2007 2009 2011 2013 2015
Maine Opioid Overdose Death Rate, 1999-2015Age-Adjusted Death Rate, per 100,000 Population
Source: CDC/NCHS, National Vital Statistics System, Mortality. CDC WONDER
_____________________________________________________________________________________________ Source: JEC Democratic Staff. Data from CDC, Kaiser Family Foundation, IMSHealth, ACS 2015, CBO. Note: Premium increases are based on the second lowest cost silver tax plan and CBO projections. Premiums are before tax credits. Premiums for each state are based on the premium for a major city in each state. Decreases in coverage assume that the projected decreases in coverage are divided proportionally along with the current size of the insured population for each category. Number losing private coverage just looks at those losing coverage on the individual market and through their employers.
Maryland Opioids Epidemic Fact Sheet
• The drug overdose death rate in Maryland is 20.9 per 100,000 population. In 2015, 1,285 people died from drug overdoses in Maryland.
o The opioid overdose death rate in Maryland is 17.7. In 2015, 1,087 people died from opioid overdoses in Maryland.
• Doctors in Maryland prescribe 74.3 opioid pain relievers per 100 persons, compared to the national rate of 82.5 per 100 persons.
• Medicaid covers 15 percent of people in Maryland.
• Medicaid covers 39 percent of medication-assisted substance abuse treatment in Maryland.
• The uninsured rate in Maryland is 6.6 percent.
• Under TrumpCare, 181,204 people in Maryland would lose private insurance coverage.
• Next year under TrumpCare, premiums would increase by $742 in Maryland.
0
2
4
6
8
10
12
14
16
18
20
1999 2001 2003 2005 2007 2009 2011 2013 2015
Maryland Opioid Overdose Death Rate, 1999-2015Age-Adjusted Death Rate, per 100,000 Population
Source: CDC/NCHS, National Vital Statistics System, Mortality. CDC WONDER
_____________________________________________________________________________________________ Source: JEC Democratic Staff. Data from CDC, Kaiser Family Foundation, IMSHealth, ACS 2015, CBO. Note: Premium increases are based on the second lowest cost silver tax plan and CBO projections. Premiums are before tax credits. Premiums for each state are based on the premium for a major city in each state. Decreases in coverage assume that the projected decreases in coverage are divided proportionally along with the current size of the insured population for each category. Number losing private coverage just looks at those losing coverage on the individual market and through their employers.
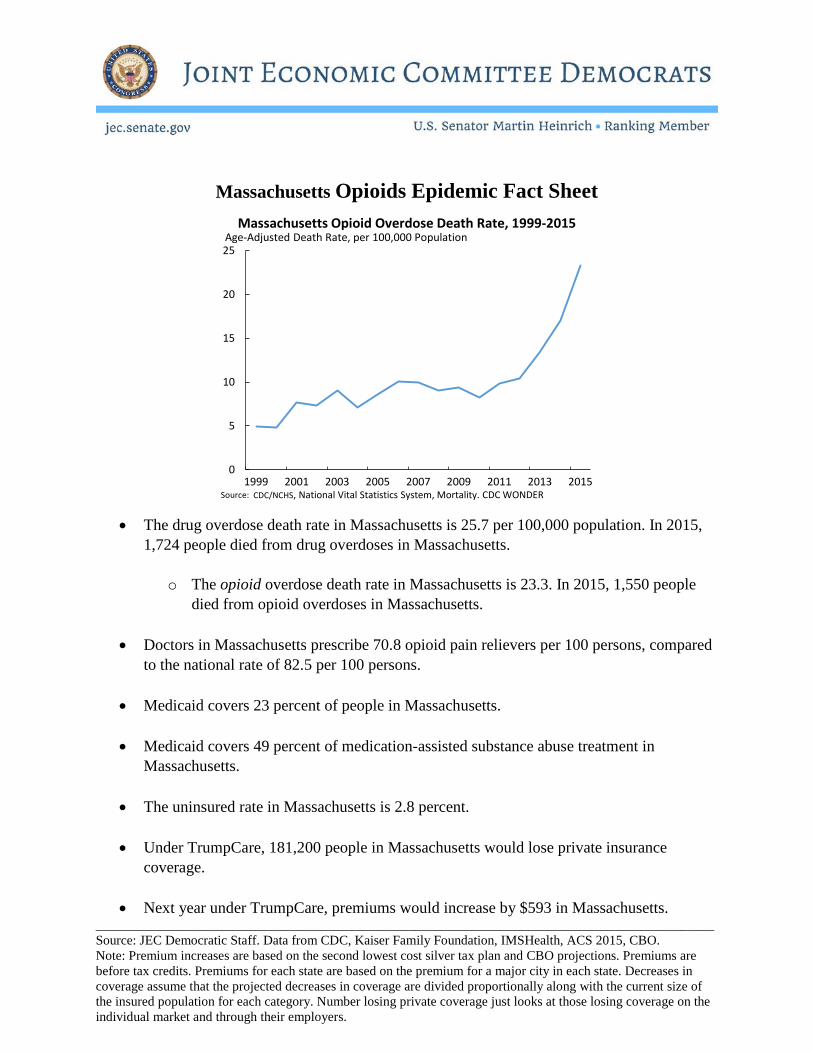
Massachusetts Opioids Epidemic Fact Sheet
• The drug overdose death rate in Massachusetts is 25.7 per 100,000 population. In 2015, 1,724 people died from drug overdoses in Massachusetts.
o The opioid overdose death rate in Massachusetts is 23.3. In 2015, 1,550 people died from opioid overdoses in Massachusetts.
• Doctors in Massachusetts prescribe 70.8 opioid pain relievers per 100 persons, compared to the national rate of 82.5 per 100 persons.
• Medicaid covers 23 percent of people in Massachusetts.
• Medicaid covers 49 percent of medication-assisted substance abuse treatment in Massachusetts.
• The uninsured rate in Massachusetts is 2.8 percent.
• Under TrumpCare, 181,200 people in Massachusetts would lose private insurance coverage.
• Next year under TrumpCare, premiums would increase by $593 in Massachusetts.
0
5
10
15
20
25
1999 2001 2003 2005 2007 2009 2011 2013 2015
Massachusetts Opioid Overdose Death Rate, 1999-2015Age-Adjusted Death Rate, per 100,000 Population
Source: CDC/NCHS, National Vital Statistics System, Mortality. CDC WONDER
_____________________________________________________________________________________________ Source: JEC Democratic Staff. Data from CDC, Kaiser Family Foundation, IMSHealth, ACS 2015, CBO. Note: Premium increases are based on the second lowest cost silver tax plan and CBO projections. Premiums are before tax credits. Premiums for each state are based on the premium for a major city in each state. Decreases in coverage assume that the projected decreases in coverage are divided proportionally along with the current size of the insured population for each category. Number losing private coverage just looks at those losing coverage on the individual market and through their employers.
Michigan Opioids Epidemic Fact Sheet
• The drug overdose death rate in Michigan is 20.4 per 100,000 population. In 2015, 1,980 people died from drug overdoses in Michigan.
o The opioid overdose death rate in Michigan is 13.6. In 2015, 1,309 people died from opioid overdoses in Michigan.
• Doctors in Michigan prescribe 107 opioid pain relievers per 100 persons, compared to the national rate of 82.5 per 100 persons.
• Medicaid covers 19 percent of people in Michigan.
• Medicaid covers 13 percent of medication-assisted substance abuse treatment in Michigan.
• The uninsured rate in Michigan is 6.1 percent.
• Under TrumpCare, 275,280 people in Michigan would lose private insurance coverage.
• Next year under TrumpCare, premiums would increase by $569 in Michigan.
0
2
4
6
8
10
12
14
16
1999 2001 2003 2005 2007 2009 2011 2013 2015
Michigan Opioid Overdose Death Rate, 1999-2015Age-Adjusted Death Rate, per 100,000 Population
Source: CDC/NCHS, National Vital Statistics System, Mortality. CDC WONDER
_____________________________________________________________________________________________ Source: JEC Democratic Staff. Data from CDC, Kaiser Family Foundation, IMSHealth, ACS 2015, CBO. Note: Premium increases are based on the second lowest cost silver tax plan and CBO projections. Premiums are before tax credits. Premiums for each state are based on the premium for a major city in each state. Decreases in coverage assume that the projected decreases in coverage are divided proportionally along with the current size of the insured population for each category. Number losing private coverage just looks at those losing coverage on the individual market and through their employers.
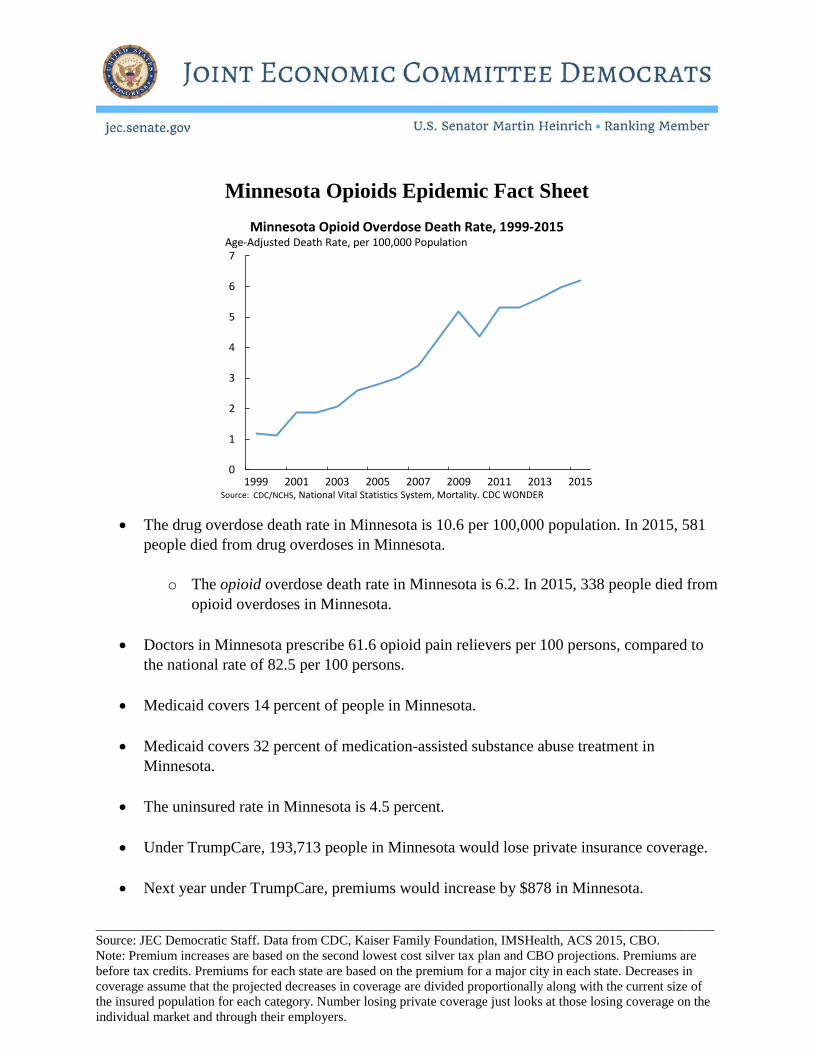
Minnesota Opioids Epidemic Fact Sheet
• The drug overdose death rate in Minnesota is 10.6 per 100,000 population. In 2015, 581 people died from drug overdoses in Minnesota.
o The opioid overdose death rate in Minnesota is 6.2. In 2015, 338 people died from opioid overdoses in Minnesota.
• Doctors in Minnesota prescribe 61.6 opioid pain relievers per 100 persons, compared to the national rate of 82.5 per 100 persons.
• Medicaid covers 14 percent of people in Minnesota.
• Medicaid covers 32 percent of medication-assisted substance abuse treatment in Minnesota.
• The uninsured rate in Minnesota is 4.5 percent.
• Under TrumpCare, 193,713 people in Minnesota would lose private insurance coverage.
• Next year under TrumpCare, premiums would increase by $878 in Minnesota.
0
1
2
3
4
5
6
7
1999 2001 2003 2005 2007 2009 2011 2013 2015
Minnesota Opioid Overdose Death Rate, 1999-2015Age-Adjusted Death Rate, per 100,000 Population
Source: CDC/NCHS, National Vital Statistics System, Mortality. CDC WONDER
_____________________________________________________________________________________________ Source: JEC Democratic Staff. Data from CDC, Kaiser Family Foundation, IMSHealth, ACS 2015, CBO. Note: Premium increases are based on the second lowest cost silver tax plan and CBO projections. Premiums are before tax credits. Premiums for each state are based on the premium for a major city in each state. Decreases in coverage assume that the projected decreases in coverage are divided proportionally along with the current size of the insured population for each category. Number losing private coverage just looks at those losing coverage on the individual market and through their employers.
Mississippi Opioids Epidemic Fact Sheet
• The drug overdose death rate in Mississippi is 12.3 per 100,000 population. In 2015, 351 people died from drug overdoses in Mississippi.
o The opioid overdose death rate in Mississippi is 5.3. In 2015, 150 people died from opioid overdoses in Mississippi.
• Doctors in Mississippi prescribe 120.3 opioid pain relievers per 100 persons, compared to the national rate of 82.5 per 100 persons.
• Medicaid covers 23 percent of people in Mississippi.
• Medicaid covers 4 percent of medication-assisted substance abuse treatment in Mississippi.
• The uninsured rate in Mississippi is 12.7 percent.
• Under TrumpCare, 75,235 people in Mississippi would lose private insurance coverage.
• Next year under TrumpCare, premiums would increase by $845 in Mississippi.
0
1
2
3
4
5
6
2001 2003 2005 2007 2009 2011 2013 2015
Mississippi Opioid Overdose Death Rate, 2001-2015Age-Adjusted Death Rate, per 100,000 Population
Source: CDC/NCHS, National Vital Statistics System, Mortality. CDC WONDER
_____________________________________________________________________________________________ Source: JEC Democratic Staff. Data from CDC, Kaiser Family Foundation, IMSHealth, ACS 2015, CBO. Note: Premium increases are based on the second lowest cost silver tax plan and CBO projections. Premiums are before tax credits. Premiums for each state are based on the premium for a major city in each state. Decreases in coverage assume that the projected decreases in coverage are divided proportionally along with the current size of the insured population for each category. Number losing private coverage just looks at those losing coverage on the individual market and through their employers.
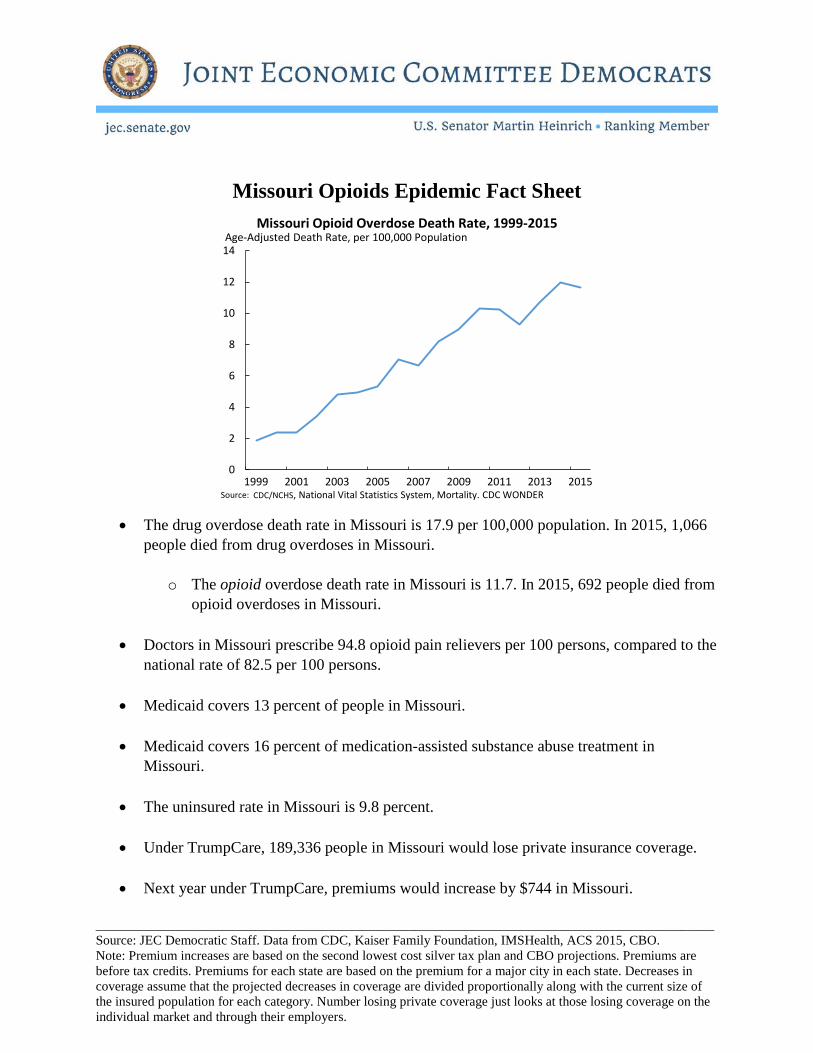
Missouri Opioids Epidemic Fact Sheet
• The drug overdose death rate in Missouri is 17.9 per 100,000 population. In 2015, 1,066 people died from drug overdoses in Missouri.
o The opioid overdose death rate in Missouri is 11.7. In 2015, 692 people died from opioid overdoses in Missouri.
• Doctors in Missouri prescribe 94.8 opioid pain relievers per 100 persons, compared to the national rate of 82.5 per 100 persons.
• Medicaid covers 13 percent of people in Missouri.
• Medicaid covers 16 percent of medication-assisted substance abuse treatment in Missouri.
• The uninsured rate in Missouri is 9.8 percent.
• Under TrumpCare, 189,336 people in Missouri would lose private insurance coverage.
• Next year under TrumpCare, premiums would increase by $744 in Missouri.
0
2
4
6
8
10
12
14
1999 2001 2003 2005 2007 2009 2011 2013 2015
Missouri Opioid Overdose Death Rate, 1999-2015Age-Adjusted Death Rate, per 100,000 Population
Source: CDC/NCHS, National Vital Statistics System, Mortality. CDC WONDER
_____________________________________________________________________________________________ Source: JEC Democratic Staff. Data from CDC, Kaiser Family Foundation, IMSHealth, ACS 2015, CBO. Note: Premium increases are based on the second lowest cost silver tax plan and CBO projections. Premiums are before tax credits. Premiums for each state are based on the premium for a major city in each state. Decreases in coverage assume that the projected decreases in coverage are divided proportionally along with the current size of the insured population for each category. Number losing private coverage just looks at those losing coverage on the individual market and through their employers.
Montana Opioids Epidemic Fact Sheet
• The drug overdose death rate in Montana is 13.8 per 100,000 population. In 2015, 138 people died from drug overdoses in Montana.
o The opioid overdose death rate in Montana is 5. In 2015, 48 people died from opioid overdoses in Montana.
• Doctors in Montana prescribe 82 opioid pain relievers per 100 persons, compared to the national rate of 82.5 per 100 persons.
• Medicaid covers 16 percent of people in Montana.
• Medicaid covers 7 percent of medication-assisted substance abuse treatment in Montana.
• The uninsured rate in Montana is 11.6 percent.
• Under TrumpCare, 30,289 people in Montana would lose private insurance coverage.
• Next year under TrumpCare, premiums would increase by $1,020 in Montana.
0
1
2
3
4
5
6
7
8
9
10
2001 2003 2005 2007 2009 2011 2013 2015
Montana Opioid Overdose Death Rate, 2001-2015Age-Adjusted Death Rate, per 100,000 Population
Source: CDC/NCHS, National Vital Statistics System, Mortality. CDC WONDER
_____________________________________________________________________________________________ Source: JEC Democratic Staff. Data from CDC, Kaiser Family Foundation, IMSHealth, ACS 2015, CBO. Note: Premium increases are based on the second lowest cost silver tax plan and CBO projections. Premiums are before tax credits. Premiums for each state are based on the premium for a major city in each state. Decreases in coverage assume that the projected decreases in coverage are divided proportionally along with the current size of the insured population for each category. Number losing private coverage just looks at those losing coverage on the individual market and through their employers.
Nebraska Opioids Epidemic Fact Sheet
• The drug overdose death rate in Nebraska is 6.9 per 100,000 population. In 2015, 126 people died from drug overdoses in Nebraska.
o The opioid overdose death rate in Nebraska is 3.1. In 2015, 55 people died from opioid overdoses in Nebraska.
• Doctors in Nebraska prescribe 79.4 opioid pain relievers per 100 persons, compared to the national rate of 82.5 per 100 persons.
• Medicaid covers 13 percent of people in Nebraska.
• Medicaid covers 10 percent of medication-assisted substance abuse treatment in Nebraska.
• The uninsured rate in Nebraska is 8.2 percent.
• Under TrumpCare, 61,967 people in Nebraska would lose private insurance coverage.
• Next year under TrumpCare, premiums would increase by $883 in Nebraska.
0.0
0.5
1.0
1.5
2.0
2.5
3.0
3.5
4.0
2001 2003 2005 2007 2009 2011 2013 2015
Nebraska Opioid Overdose Death Rate, 2001-2015Age-Adjusted Death Rate, per 100,000 Population
Source:Note:
CDC/NCHS, National Vital Statistics System, Mortality. CDC WONDER.Dotted line represents gaps in data due to data availability.
_____________________________________________________________________________________________ Source: JEC Democratic Staff. Data from CDC, Kaiser Family Foundation, IMSHealth, ACS 2015, CBO. Note: Premium increases are based on the second lowest cost silver tax plan and CBO projections. Premiums are before tax credits. Premiums for each state are based on the premium for a major city in each state. Decreases in coverage assume that the projected decreases in coverage are divided proportionally along with the current size of the insured population for each category. Number losing private coverage just looks at those losing coverage on the individual market and through their employers.
Nevada Opioids Epidemic Fact Sheet
• The drug overdose death rate in Nevada is 20.4 per 100,000 population. In 2015, 619 people died from drug overdoses in Nevada.
o The opioid overdose death rate in Nevada is 13.8. In 2015, 419 people died from opioid overdoses in Nevada.
• Doctors in Nevada prescribe 94.1 opioid pain relievers per 100 persons, compared to the national rate of 82.5 per 100 persons.
• Medicaid covers 17 percent of people in Nevada.
• Medicaid covers 12 percent of medication-assisted substance abuse treatment in Nevada.
• The uninsured rate in Nevada is 12.3 percent.
• Under TrumpCare, 89,455 people in Nevada would lose private insurance coverage.
• Next year under TrumpCare, premiums would increase by $677 in Nevada.
0
2
4
6
8
10
12
14
16
18
1999 2001 2003 2005 2007 2009 2011 2013 2015
Nevada Opioid Overdose Death Rate, 1999-2015Age-Adjusted Death Rate, per 100,000 Population
Source: CDC/NCHS, National Vital Statistics System, Mortality. CDC WONDER
_____________________________________________________________________________________________ Source: JEC Democratic Staff. Data from CDC, Kaiser Family Foundation, IMSHealth, ACS 2015, CBO. Note: Premium increases are based on the second lowest cost silver tax plan and CBO projections. Premiums are before tax credits. Premiums for each state are based on the premium for a major city in each state. Decreases in coverage assume that the projected decreases in coverage are divided proportionally along with the current size of the insured population for each category. Number losing private coverage just looks at those losing coverage on the individual market and through their employers.
New Hampshire Opioids Epidemic Fact Sheet
• The drug overdose death rate in New Hampshire is 34.3 per 100,000 population. In 2015, 422 people died from drug overdoses in New Hampshire.
o The opioid overdose death rate in New Hampshire is 31.3. In 2015, 380 people died from opioid overdoses in New Hampshire.
• Doctors in New Hampshire prescribe 71.7 opioid pain relievers per 100 persons, compared to the national rate of 82.5 per 100 persons.
• Medicaid covers 13 percent of people in New Hampshire.
• Medicaid covers 18 percent of medication-assisted substance abuse treatment in New Hampshire.
• The uninsured rate in New Hampshire is 6.3 percent.
• Under TrumpCare, 34,078 people in New Hampshire would lose private insurance coverage.
• Next year under TrumpCare, premiums would increase by $641 in New Hampshire.
0
5
10
15
20
25
30
35
1999 2001 2003 2005 2007 2009 2011 2013 2015
New Hampshire Opioid Overdose Death Rate, 1999-2015Age-Adjusted Death Rate, per 100,000 Population
Source: CDC/NCHS, National Vital Statistics System, Mortality. CDC WONDER
_____________________________________________________________________________________________ Source: JEC Democratic Staff. Data from CDC, Kaiser Family Foundation, IMSHealth, ACS 2015, CBO. Note: Premium increases are based on the second lowest cost silver tax plan and CBO projections. Premiums are before tax credits. Premiums for each state are based on the premium for a major city in each state. Decreases in coverage assume that the projected decreases in coverage are divided proportionally along with the current size of the insured population for each category. Number losing private coverage just looks at those losing coverage on the individual market and through their employers.
New Jersey Opioids Epidemic Fact Sheet
• The drug overdose death rate in New Jersey is 16.3 per 100,000 population. In 2015, 1,454 people died from drug overdoses in New Jersey.
o The opioid overdose death rate in New Jersey is 9.9. In 2015, 862 people died from opioid overdoses in New Jersey.
• Doctors in New Jersey prescribe 62.9 opioid pain relievers per 100 persons, compared to the national rate of 82.5 per 100 persons.
• Medicaid covers 18 percent of people in New Jersey.
• Medicaid covers 22 percent of medication-assisted substance abuse treatment in New Jersey.
• The uninsured rate in New Jersey is 8.7 percent.
• Under TrumpCare, 249,524 people in New Jersey would lose private insurance coverage.
• Next year under TrumpCare, premiums would increase by $847 in New Jersey.
0
2
4
6
8
10
12
1999 2001 2003 2005 2007 2009 2011 2013 2015
New Jersey Opioid Overdose Death Rate, 1999-2015Age-Adjusted Death Rate, per 100,000 Population
Source: CDC/NCHS, National Vital Statistics System, Mortality. CDC WONDER
_____________________________________________________________________________________________ Source: JEC Democratic Staff. Data from CDC, Kaiser Family Foundation, IMSHealth, ACS 2015, CBO. Note: Premium increases are based on the second lowest cost silver tax plan and CBO projections. Premiums are before tax credits. Premiums for each state are based on the premium for a major city in each state. Decreases in coverage assume that the projected decreases in coverage are divided proportionally along with the current size of the insured population for each category. Number losing private coverage just looks at those losing coverage on the individual market and through their employers.
New Mexico Opioids Epidemic Fact Sheet
• The drug overdose death rate in New Mexico is 25.3 per 100,000 population. In 2015, 501 people died from drug overdoses in New Mexico.
o The opioid overdose death rate in New Mexico is 17.9. In 2015, 351 people died from opioid overdoses in New Mexico.
• Doctors in New Mexico prescribe 73.8 opioid pain relievers per 100 persons, compared to the national rate of 82.5 per 100 persons.
• Medicaid covers 27 percent of people in New Mexico.
• Medicaid covers 30 percent of medication-assisted substance abuse treatment in New Mexico.
• The uninsured rate in New Mexico is 10.9 percent.
• Under TrumpCare, 44,856 people in New Mexico would lose private insurance coverage.
• Next year under, TrumpCare premiums would increase by $619 in New Mexico.
0
5
10
15
20
25
1999 2001 2003 2005 2007 2009 2011 2013 2015
New Mexico Opioid Overdose Death Rate, 1999-2015Age-Adjusted Death Rate, per 100,000 Population
Source: CDC/NCHS, National Vital Statistics System, Mortality. CDC WONDER
_____________________________________________________________________________________________ Source: JEC Democratic Staff. Data from CDC, Kaiser Family Foundation, IMSHealth, ACS 2015, CBO. Note: Premium increases are based on the second lowest cost silver tax plan and CBO projections. Premiums are before tax credits. Premiums for each state are based on the premium for a major city in each state. Decreases in coverage assume that the projected decreases in coverage are divided proportionally along with the current size of the insured population for each category. Number losing private coverage just looks at those losing coverage on the individual market and through their employers.
New York Opioids Epidemic Fact Sheet
• The drug overdose death rate in New York is 13.6 per 100,000 population. In 2015, 2,754 people died from drug overdoses in New York.
o The opioid overdose death rate in New York is 10.8. In 2015, 2,166 people died from opioid overdoses in New York.
• Doctors in New York prescribe 59.5 opioid pain relievers per 100 persons, compared to the national rate of 82.5 per 100 persons.
• Medicaid covers 24 percent of people in New York.
• Medicaid covers 38 percent of medication-assisted substance abuse treatment in New York.
• The uninsured rate in New York is 7.1 percent.
• Under TrumpCare, 651,933 people in New York would lose private insurance coverage.
• Next year under TrumpCare, premiums would increase by $1,094 in New York.
0
2
4
6
8
10
12
1999 2001 2003 2005 2007 2009 2011 2013 2015
New York Opioid Overdose Death Rate, 1999-2015Age-Adjusted Death Rate, per 100,000 Population
Source: CDC/NCHS, National Vital Statistics System, Mortality. CDC WONDER
_____________________________________________________________________________________________ Source: JEC Democratic Staff. Data from CDC, Kaiser Family Foundation, IMSHealth, ACS 2015, CBO. Note: Premium increases are based on the second lowest cost silver tax plan and CBO projections. Premiums are before tax credits. Premiums for each state are based on the premium for a major city in each state. Decreases in coverage assume that the projected decreases in coverage are divided proportionally along with the current size of the insured population for each category. Number losing private coverage just looks at those losing coverage on the individual market and through their employers.
North Carolina Opioids Epidemic Fact Sheet
• The drug overdose death rate in North Carolina is 15.8 per 100,000 population. In 2015, 1,567 people died from drug overdoses in North Carolina.
o The opioid overdose death rate in North Carolina is 11.9. In 2015, 1,171 people died from opioid overdoses in North Carolina.
• Doctors in North Carolina prescribe 96.6 opioid pain relievers per 100 persons, compared to the national rate of 82.5 per 100 persons.
• Medicaid covers 18 percent of people in North Carolina.
• Medicaid covers 21 percent of medication-assisted substance abuse treatment in North Carolina.
• The uninsured rate in North Carolina is 11.2 percent.
• Under TrumpCare, 321,129 people in North Carolina would lose private insurance coverage.
• Next year under TrumpCare, premiums would increase by $1,373 in North Carolina.
0
2
4
6
8
10
12
14
1999 2001 2003 2005 2007 2009 2011 2013 2015
North Carolina Opioid Overdose Death Rate, 1999-2015Age-Adjusted Death Rate, per 100,000 Population
Source: CDC/NCHS, National Vital Statistics System, Mortality. CDC WONDER
_____________________________________________________________________________________________ Source: JEC Democratic Staff. Data from CDC, Kaiser Family Foundation, IMSHealth, ACS 2015, CBO. Note: Premium increases are based on the second lowest cost silver tax plan and CBO projections. Premiums are before tax credits. Premiums for each state are based on the premium for a major city in each state. Decreases in coverage assume that the projected decreases in coverage are divided proportionally along with the current size of the insured population for each category. Number losing private coverage just looks at those losing coverage on the individual market and through their employers.
North Dakota Opioids Epidemic Fact Sheet
• The drug overdose death rate in North Dakota is 8.6 per 100,000 population. In 2015, 61 people died from drug overdoses in North Dakota.
o The opioid overdose death rate in North Dakota is 4.8. In 2015, 34 people died from opioid overdoses in North Dakota.
• Doctors in North Dakota prescribe 74.7 opioid pain relievers per 100 persons, compared to the national rate of 82.5 per 100 persons.
• Medicaid covers 10 percent of people in North Dakota.
• Medicaid covers 17 percent of medication-assisted substance abuse treatment in North Dakota.
• The uninsured rate in North Dakota is 7.8 percent.
• Under TrumpCare, 28,245 people in North Dakota would lose private insurance coverage.
• Next year under TrumpCare, premiums would increase by $794 in North Dakota.
0
1
2
3
4
5
6
2008 2010 2012 2014
North Dakota Opioid Overdose Death Rate, 2008-2015Age-Adjusted Death Rate, per 100,000 Population
Source:Note:
CDC/NCHS, National Vital Statistics System, Mortality. CDC WONDER. Dotted line represents gaps in data due to data availability.
_____________________________________________________________________________________________ Source: JEC Democratic Staff. Data from CDC, Kaiser Family Foundation, IMSHealth, ACS 2015, CBO. Note: Premium increases are based on the second lowest cost silver tax plan and CBO projections. Premiums are before tax credits. Premiums for each state are based on the premium for a major city in each state. Decreases in coverage assume that the projected decreases in coverage are divided proportionally along with the current size of the insured population for each category. Number losing private coverage just looks at those losing coverage on the individual market and through their employers.
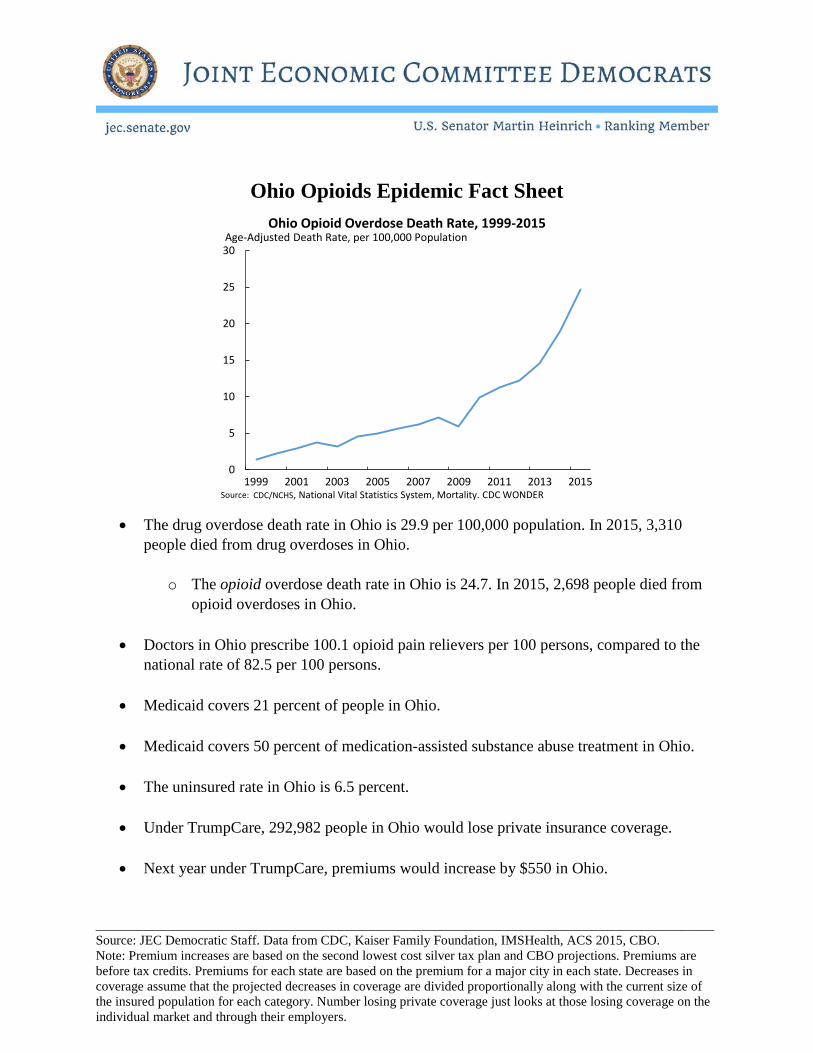
Ohio Opioids Epidemic Fact Sheet
• The drug overdose death rate in Ohio is 29.9 per 100,000 population. In 2015, 3,310 people died from drug overdoses in Ohio.
o The opioid overdose death rate in Ohio is 24.7. In 2015, 2,698 people died from opioid overdoses in Ohio.
• Doctors in Ohio prescribe 100.1 opioid pain relievers per 100 persons, compared to the national rate of 82.5 per 100 persons.
• Medicaid covers 21 percent of people in Ohio.
• Medicaid covers 50 percent of medication-assisted substance abuse treatment in Ohio.
• The uninsured rate in Ohio is 6.5 percent.
• Under TrumpCare, 292,982 people in Ohio would lose private insurance coverage.
• Next year under TrumpCare, premiums would increase by $550 in Ohio.
0
5
10
15
20
25
30
1999 2001 2003 2005 2007 2009 2011 2013 2015
Ohio Opioid Overdose Death Rate, 1999-2015Age-Adjusted Death Rate, per 100,000 Population
Source: CDC/NCHS, National Vital Statistics System, Mortality. CDC WONDER
_____________________________________________________________________________________________ Source: JEC Democratic Staff. Data from CDC, Kaiser Family Foundation, IMSHealth, ACS 2015, CBO. Note: Premium increases are based on the second lowest cost silver tax plan and CBO projections. Premiums are before tax credits. Premiums for each state are based on the premium for a major city in each state. Decreases in coverage assume that the projected decreases in coverage are divided proportionally along with the current size of the insured population for each category. Number losing private coverage just looks at those losing coverage on the individual market and through their employers.
Oklahoma Opioids Epidemic Fact Sheet
• The drug overdose death rate in Oklahoma is 19 per 100,000 population. In 2015, 725 people died from drug overdoses in Oklahoma.
o The opioid overdose death rate in Oklahoma is 11.2. In 2015, 427 people died from opioid overdoses in Oklahoma.
• Doctors in Oklahoma prescribe 127.8 opioid pain relievers per 100 persons, compared to the national rate of 82.5 per 100 persons.
• Medicaid covers 17 percent of people in Oklahoma.
• Medicaid covers 7 percent of medication-assisted substance abuse treatment in Oklahoma.
• The uninsured rate in Oklahoma is 13.9 percent.
• Under TrumpCare, 120,055 people in Oklahoma would lose private insurance coverage.
• Next year under TrumpCare, premiums would increase by $1,183 in Oklahoma.
0
2
4
6
8
10
12
14
16
18
1999 2001 2003 2005 2007 2009 2011 2013 2015
Oklahoma Opioid Overdose Death Rate, 1999-2015Age-Adjusted Death Rate, per 100,000 Population
Source: CDC/NCHS, National Vital Statistics System, Mortality. CDC WONDER
_____________________________________________________________________________________________ Source: JEC Democratic Staff. Data from CDC, Kaiser Family Foundation, IMSHealth, ACS 2015, CBO. Note: Premium increases are based on the second lowest cost silver tax plan and CBO projections. Premiums are before tax credits. Premiums for each state are based on the premium for a major city in each state. Decreases in coverage assume that the projected decreases in coverage are divided proportionally along with the current size of the insured population for each category. Number losing private coverage just looks at those losing coverage on the individual market and through their employers.
Oregon Opioids Epidemic Fact Sheet
• The drug overdose death rate in Oregon is 12 per 100,000 population. In 2015, 505 people died from drug overdoses in Oregon.
o The opioid overdose death rate in Oregon is 7.9. In 2015, 331 people died from opioid overdoses in Oregon.
• Doctors in Oregon prescribe 89.2 opioid pain relievers per 100 persons, compared to the national rate of 82.5 per 100 persons.
• Medicaid covers 24 percent of people in Oregon.
• Medicaid covers 24 percent of medication-assisted substance abuse treatment in Oregon.
• The uninsured rate in Oregon is 7 percent.
• Under TrumpCare, 123,840 people in Oregon would lose private insurance coverage.
• Next year under TrumpCare, premiums would increase by $749 in Oregon.
0
2
4
6
8
10
12
1999 2001 2003 2005 2007 2009 2011 2013 2015
Oregon Opioid Overdose Death Rate, 1999-2015Age-Adjusted Death Rate, per 100,000 Population
Source: CDC/NCHS, National Vital Statistics System, Mortality. CDC WONDER
_____________________________________________________________________________________________ Source: JEC Democratic Staff. Data from CDC, Kaiser Family Foundation, IMSHealth, ACS 2015, CBO. Note: Premium increases are based on the second lowest cost silver tax plan and CBO projections. Premiums are before tax credits. Premiums for each state are based on the premium for a major city in each state. Decreases in coverage assume that the projected decreases in coverage are divided proportionally along with the current size of the insured population for each category. Number losing private coverage just looks at those losing coverage on the individual market and through their employers.
Pennsylvania Opioids Epidemic Fact Sheet
• The drug overdose death rate in Pennsylvania is 26.3 per 100,000 population. In 2015, 3,264 people died from drug overdoses in Pennsylvania.
o The opioid overdose death rate in Pennsylvania is 11.2. In 2015, 1,362 people died from opioid overdoses in Pennsylvania.
• Doctors in Pennsylvania prescribe 88.2 opioid pain relievers per 100 persons, compared to the national rate of 82.5 per 100 persons.
• Medicaid covers 18 percent of people in Pennsylvania.
• Medicaid covers 29 percent of medication-assisted substance abuse treatment in Pennsylvania.
• The uninsured rate in Pennsylvania is 6.4 percent.
• Under TrumpCare, 331,339 people in Pennsylvania would lose private insurance coverage.
• Next year under TrumpCare, premiums would increase by $1,003 in Pennsylvania.
0
2
4
6
8
10
12
1999 2001 2003 2005 2007 2009 2011 2013 2015
Pennsylvania Opioid Overdose Death Rate, 1999-2015Age-Adjusted Death Rate, per 100,000 Population
Source: CDC/NCHS, National Vital Statistics System, Mortality. CDC WONDER
_____________________________________________________________________________________________ Source: JEC Democratic Staff. Data from CDC, Kaiser Family Foundation, IMSHealth, ACS 2015, CBO. Note: Premium increases are based on the second lowest cost silver tax plan and CBO projections. Premiums are before tax credits. Premiums for each state are based on the premium for a major city in each state. Decreases in coverage assume that the projected decreases in coverage are divided proportionally along with the current size of the insured population for each category. Number losing private coverage just looks at those losing coverage on the individual market and through their employers.
Rhode Island Opioids Epidemic Fact Sheet
• The drug overdose death rate in Rhode Island is 28.2 per 100,000 population. In 2015, 310 people died from drug overdoses in Rhode Island.
o The opioid overdose death rate in Rhode Island is 23.5. In 2015, 254 people died from opioid overdoses in Rhode Island.
• Doctors in Rhode Island prescribe 89.6 opioid pain relievers per 100 persons, compared to the national rate of 82.5 per 100 persons.
• Medicaid covers 17 percent of people in Rhode Island.
• Medicaid covers 50 percent of medication-assisted substance abuse treatment in Rhode Island.
• The uninsured rate in Rhode Island is 5.7 percent.
• Under TrumpCare, 34,040 people in Rhode Island would lose private insurance coverage.
• Next year under TrumpCare, premiums would increase by $626 in Rhode Island.
0
5
10
15
20
25
1999 2001 2003 2005 2007 2009 2011 2013 2015
Rhode Island Opioid Overdose Death Rate, 1999-2015Age-Adjusted Death Rate, per 100,000 Population
Source: CDC/NCHS, National Vital Statistics System, Mortality. CDC WONDER
_____________________________________________________________________________________________ Source: JEC Democratic Staff. Data from CDC, Kaiser Family Foundation, IMSHealth, ACS 2015, CBO. Note: Premium increases are based on the second lowest cost silver tax plan and CBO projections. Premiums are before tax credits. Premiums for each state are based on the premium for a major city in each state. Decreases in coverage assume that the projected decreases in coverage are divided proportionally along with the current size of the insured population for each category. Number losing private coverage just looks at those losing coverage on the individual market and through their employers.
South Carolina Opioids Epidemic Fact Sheet
• The drug overdose death rate in South Carolina is 15.7 per 100,000 population. In 2015, 761 people died from drug overdoses in South Carolina.
o The opioid overdose death rate in South Carolina is 11.4. In 2015, 554 people died from opioid overdoses in South Carolina.
• Doctors in South Carolina prescribe 101.8 opioid pain relievers per 100 persons, compared to the national rate of 82.5 per 100 persons.
• Medicaid covers 19 percent of people in South Carolina.
• Medicaid covers 12 percent of medication-assisted substance abuse treatment in South Carolina.
• The uninsured rate in South Carolina is 10.9 percent.
• Under TrumpCare, 130,398 people in South Carolina would lose private insurance coverage.
• Next year under TrumpCare, premiums would increase by $970 in South Carolina.
0
2
4
6
8
10
12
1999 2001 2003 2005 2007 2009 2011 2013 2015
South Carolina Opioid Overdose Death Rate, 1999-2015Age-Adjusted Death Rate, per 100,000 Population
Source: CDC/NCHS, National Vital Statistics System, Mortality. CDC WONDER
_____________________________________________________________________________________________ Source: JEC Democratic Staff. Data from CDC, Kaiser Family Foundation, IMSHealth, ACS 2015, CBO. Note: Premium increases are based on the second lowest cost silver tax plan and CBO projections. Premiums are before tax credits. Premiums for each state are based on the premium for a major city in each state. Decreases in coverage assume that the projected decreases in coverage are divided proportionally along with the current size of the insured population for each category. Number losing private coverage just looks at those losing coverage on the individual market and through their employers.
South Dakota Opioids Epidemic Fact Sheet
• The drug overdose death rate in South Dakota is 8.4 per 100,000 population. In 2015, 65 people died from drug overdoses in South Dakota.
o The opioid overdose death rate in South Dakota is 3.5. In 2015, 27 people died from opioid overdoses in South Dakota.
• Doctors in South Dakota prescribe 66.5 opioid pain relievers per 100 persons, compared to the national rate of 82.5 per 100 persons.
• Medicaid covers 14 percent of people in South Dakota.
• Medicaid covers 11 percent of medication-assisted substance abuse treatment in South Dakota.
• The uninsured rate in South Dakota is 10.2 percent.
• Under TrumpCare, 32,260 people in South Dakota would lose private insurance coverage.
• Next year under TrumpCare, premiums would increase by $1,075 in South Dakota.
0.0
0.5
1.0
1.5
2.0
2.5
3.0
3.5
4.0
4.5
5.0
2004 2006 2008 2010 2012 2014
South Dakota Opioid Overdose Death Rate, 2004-2015Age-Adjusted Death Rate, per 100,000 Population
Source: CDC/NCHS, National Vital Statistics System, Mortality. CDC WONDER
_____________________________________________________________________________________________ Source: JEC Democratic Staff. Data from CDC, Kaiser Family Foundation, IMSHealth, ACS 2015, CBO. Note: Premium increases are based on the second lowest cost silver tax plan and CBO projections. Premiums are before tax credits. Premiums for each state are based on the premium for a major city in each state. Decreases in coverage assume that the projected decreases in coverage are divided proportionally along with the current size of the insured population for each category. Number losing private coverage just looks at those losing coverage on the individual market and through their employers.
Tennessee Opioids Epidemic Fact Sheet
• The drug overdose death rate in Tennessee is 22.2 per 100,000 population. In 2015, 1,457 people died from drug overdoses in Tennessee.
o The opioid overdose death rate in Tennessee is 16. In 2015, 1,038 people died from opioid overdoses in Tennessee.
• Doctors in Tennessee prescribe 142.8 opioid pain relievers per 100 persons, compared to the national rate of 82.5 per 100 persons.
• Medicaid covers 19 percent of people in Tennessee.
• Medicaid covers 10 percent of medication-assisted substance abuse treatment in Tennessee.
• The uninsured rate in Tennessee is 10.3 percent.
• Under TrumpCare, 191,956 people in Tennessee would lose private insurance coverage.
• Next year under TrumpCare, premiums would increase by $1,006 in Tennessee.
0
2
4
6
8
10
12
14
16
18
1999 2001 2003 2005 2007 2009 2011 2013 2015
Tennessee Opioid Overdose Death Rate, 1999-2015Age-Adjusted Death Rate, per 100,000 Population
Source: CDC/NCHS, National Vital Statistics System, Mortality. CDC WONDER
_____________________________________________________________________________________________ Source: JEC Democratic Staff. Data from CDC, Kaiser Family Foundation, IMSHealth, ACS 2015, CBO. Note: Premium increases are based on the second lowest cost silver tax plan and CBO projections. Premiums are before tax credits. Premiums for each state are based on the premium for a major city in each state. Decreases in coverage assume that the projected decreases in coverage are divided proportionally along with the current size of the insured population for each category. Number losing private coverage just looks at those losing coverage on the individual market and through their employers.
Texas Opioids Epidemic Fact Sheet
• The drug overdose death rate in Texas is 9.4 per 100,000 population. In 2015, 2,588 people died from drug overdoses in Texas.
o The opioid overdose death rate in Texas is 4.7. In 2015, 1,287 people died from opioid overdoses in Texas.
• Doctors in Texas prescribe 74.3 opioid pain relievers per 100 persons, compared to the national rate of 82.5 per 100 persons.
• Medicaid covers 16 percent of people in Texas.
• Medicaid covers 6 percent of medication-assisted substance abuse treatment in Texas.
• The uninsured rate in Texas is 17.1 percent.
• Under TrumpCare, 831,460 people in Texas would lose private insurance coverage.
• Next year under TrumpCare, premiums would increase by $691 in Texas.
0.0
0.5
1.0
1.5
2.0
2.5
3.0
3.5
4.0
4.5
5.0
1999 2001 2003 2005 2007 2009 2011 2013 2015
Texas Opioid Overdose Death Rate, 1999-2015Age-Adjusted Death Rate, per 100,000 Population
Source: CDC/NCHS, National Vital Statistics System, Mortality. CDC WONDER
_____________________________________________________________________________________________ Source: JEC Democratic Staff. Data from CDC, Kaiser Family Foundation, IMSHealth, ACS 2015, CBO. Note: Premium increases are based on the second lowest cost silver tax plan and CBO projections. Premiums are before tax credits. Premiums for each state are based on the premium for a major city in each state. Decreases in coverage assume that the projected decreases in coverage are divided proportionally along with the current size of the insured population for each category. Number losing private coverage just looks at those losing coverage on the individual market and through their employers.
Utah Opioids Epidemic Fact Sheet
• The drug overdose death rate in Utah is 23.4 per 100,000 population. In 2015, 646 people died from drug overdoses in Utah.
o The opioid overdose death rate in Utah is 15.9. In 2015, 448 people died from opioid overdoses in Utah.
• Doctors in Utah prescribe 85.8 opioid pain relievers per 100 persons, compared to the national rate of 82.5 per 100 persons.
• Medicaid covers 12 percent of people in Utah.
• Medicaid covers 4 percent of medication-assisted substance abuse treatment in Utah.
• The uninsured rate in Utah is 10.5 percent.
• Under TrumpCare, 99,711 people in Utah would lose private insurance coverage.
• Next year under TrumpCare, premiums would increase by $701 in Utah.
0
2
4
6
8
10
12
14
16
18
1999 2001 2003 2005 2007 2009 2011 2013 2015
Utah Opioid Overdose Death Rate, 1999-2015Age-Adjusted Death Rate, per 100,000 Population
Source: CDC/NCHS, National Vital Statistics System, Mortality. CDC WONDER
_____________________________________________________________________________________________ Source: JEC Democratic Staff. Data from CDC, Kaiser Family Foundation, IMSHealth, ACS 2015, CBO. Note: Premium increases are based on the second lowest cost silver tax plan and CBO projections. Premiums are before tax credits. Premiums for each state are based on the premium for a major city in each state. Decreases in coverage assume that the projected decreases in coverage are divided proportionally along with the current size of the insured population for each category. Number losing private coverage just looks at those losing coverage on the individual market and through their employers.
Vermont Opioids Epidemic Fact Sheet
• The drug overdose death rate in Vermont is 16.7 per 100,000 population. In 2015, 99 people died from drug overdoses in Vermont.
o The opioid overdose death rate in Vermont is 13.4. In 2015, 79 people died from opioid overdoses in Vermont.
• Doctors in Vermont prescribe 67.4 opioid pain relievers per 100 persons, compared to the national rate of 82.5 per 100 persons.
• Medicaid covers 20 percent of people in Vermont.
• Medicaid covers 68 percent of medication-assisted substance abuse treatment in Vermont.
• The uninsured rate in Vermont is 3.8 percent.
• Under TrumpCare, 20,250 people in Vermont would lose private insurance coverage.
• Next year under TrumpCare, premiums would increase by $1,181 in Vermont.
0
2
4
6
8
10
12
14
16
2000 2002 2004 2006 2008 2010 2012 2014
Vermont Opioid Overdose Death Rate, 2000-2015Age-Adjusted Death Rate, per 100,000 Population
Source: CDC/NCHS, National Vital Statistics System, Mortality. CDC WONDER
_____________________________________________________________________________________________ Source: JEC Democratic Staff. Data from CDC, Kaiser Family Foundation, IMSHealth, ACS 2015, CBO. Note: Premium increases are based on the second lowest cost silver tax plan and CBO projections. Premiums are before tax credits. Premiums for each state are based on the premium for a major city in each state. Decreases in coverage assume that the projected decreases in coverage are divided proportionally along with the current size of the insured population for each category. Number losing private coverage just looks at those losing coverage on the individual market and through their employers.
Virginia Opioids Epidemic Fact Sheet
• The drug overdose death rate in Virginia is 12.4 per 100,000 population. In 2015, 1,039 people died from drug overdoses in Virginia.
o The opioid overdose death rate in Virginia is 9.9. In 2015, 820 people died from opioid overdoses in Virginia
• Doctors in Virginia prescribe 77.5 opioid pain relievers per 100 persons, compared to the national rate of 82.5 per 100 persons.
• Medicaid covers 11 percent of people in Virginia.
• Medicaid covers 13 percent of medication-assisted substance abuse treatment in Virginia.
• The uninsured rate in Virginia is 9.1 percent.
• Under TrumpCare, 291,770 people in Virginia would lose private insurance coverage.
• Next year under TrumpCare, premiums would increase by $710 in Virginia.
0
2
4
6
8
10
12
1999 2001 2003 2005 2007 2009 2011 2013 2015
Virginia Opioid Overdose Death Rate, 1999-2015Age-Adjusted Death Rate, per 100,000 Population
Source: CDC/NCHS, National Vital Statistics System, Mortality. CDC WONDER
_____________________________________________________________________________________________ Source: JEC Democratic Staff. Data from CDC, Kaiser Family Foundation, IMSHealth, ACS 2015, CBO. Note: Premium increases are based on the second lowest cost silver tax plan and CBO projections. Premiums are before tax credits. Premiums for each state are based on the premium for a major city in each state. Decreases in coverage assume that the projected decreases in coverage are divided proportionally along with the current size of the insured population for each category. Number losing private coverage just looks at those losing coverage on the individual market and through their employers.
Washington Opioids Epidemic Fact Sheet
• The drug overdose death rate in Washington is 14.7 per 100,000 population. In 2015, 1,094 people died from drug overdoses in Washington.
o The opioid overdose death rate in Washington is 9.3. In 2015, 692 people died from opioid overdoses in Washington.
• Doctors in Washington prescribe 77.3 opioid pain relievers per 100 persons, compared to the national rate of 82.5 per 100 persons.
• Medicaid covers 22 percent of people in Washington.
• Medicaid covers 26 percent of medication-assisted substance abuse treatment in Washington.
• The uninsured rate in Washington is 6.6 percent.
• Under TrumpCare, 196,680 people in Washington would lose private insurance coverage.
• Next year under TrumpCare, premiums would increase by $571 in Washington.
0
2
4
6
8
10
12
1999 2001 2003 2005 2007 2009 2011 2013 2015
Washington Opioid Overdose Death Rate, 1999-2015Age-Adjusted Death Rate, per 100,000 Population
Source: CDC/NCHS, National Vital Statistics System, Mortality. CDC WONDER
_____________________________________________________________________________________________ Source: JEC Democratic Staff. Data from CDC, Kaiser Family Foundation, IMSHealth, ACS 2015, CBO. Note: Premium increases are based on the second lowest cost silver tax plan and CBO projections. Premiums are before tax credits. Premiums for each state are based on the premium for a major city in each state. Decreases in coverage assume that the projected decreases in coverage are divided proportionally along with the current size of the insured population for each category. Number losing private coverage just looks at those losing coverage on the individual market and through their employers.
West Virginia Opioids Epidemic Fact Sheet
• The drug overdose death rate in West Virginia is 41.5 per 100,000 population. In 2015, 725 people died from drug overdoses in West Virginia.
o The opioid overdose death rate in West Virginia is 36. In 2015, 629 people died from opioid overdoses in West Virginia.
• Doctors in West Virginia prescribe 137.6 opioid pain relievers per 100 persons, compared to the national rate of 82.5 per 100 persons.
• Medicaid covers 29 percent of people in West Virginia.
• Medicaid covers 45 percent of medication-assisted substance abuse treatment in West Virginia.
• The uninsured rate in West Virginia is 6 percent.
• Under TrumpCare, 38,604 people in West Virginia would lose private insurance coverage.
• Next year under TrumpCare, premiums would increase by $1,006 in West Virginia.
0
5
10
15
20
25
30
35
40
1999 2001 2003 2005 2007 2009 2011 2013 2015
West Virginia Opioid Overdose Death Rate, 1999-2015Age-Adjusted Death Rate, per 100,000 Population
Source: CDC/NCHS, National Vital Statistics System, Mortality. CDC WONDER
_____________________________________________________________________________________________ Source: JEC Democratic Staff. Data from CDC, Kaiser Family Foundation, IMSHealth, ACS 2015, CBO. Note: Premium increases are based on the second lowest cost silver tax plan and CBO projections. Premiums are before tax credits. Premiums for each state are based on the premium for a major city in each state. Decreases in coverage assume that the projected decreases in coverage are divided proportionally along with the current size of the insured population for each category. Number losing private coverage just looks at those losing coverage on the individual market and through their employers.
Wisconsin Opioids Epidemic Fact Sheet
• The drug overdose death rate in Wisconsin is 15.5 per 100,000 population. In 2015, 878 people died from drug overdoses in Wisconsin.
o The opioid overdose death rate in Wisconsin is 11.2. In 2015, 622 people died from opioid overdoses in Wisconsin.
• Doctors in Wisconsin prescribe 76.1 opioid pain relievers per 100 persons, compared to the national rate of 82.5 per 100 persons.
• Medicaid covers 17 percent of people in Wisconsin.
• Medicaid covers 37 percent of medication-assisted substance abuse treatment in Wisconsin.
• The uninsured rate in Wisconsin is 5.7 percent.
• Under TrumpCare, 158,794 people in Wisconsin would lose private insurance coverage.
• Next year under TrumpCare, premiums would increase by $910 in Wisconsin.
0
2
4
6
8
10
12
1999 2001 2003 2005 2007 2009 2011 2013 2015
Wisconsin Opioid Overdose Death Rate, 1999-2015Age-Adjusted Death Rate, per 100,000 Population
Source: CDC/NCHS, National Vital Statistics System, Mortality. CDC WONDER
_____________________________________________________________________________________________ Source: JEC Democratic Staff. Data from CDC, Kaiser Family Foundation, IMSHealth, ACS 2015, CBO. Note: Premium increases are based on the second lowest cost silver tax plan and CBO projections. Premiums are before tax credits. Premiums for each state are based on the premium for a major city in each state. Decreases in coverage assume that the projected decreases in coverage are divided proportionally along with the current size of the insured population for each category. Number losing private coverage just looks at those losing coverage on the individual market and through their employers.
Wyoming Opioids Epidemic Fact Sheet
• The drug overdose death rate in Wyoming is 16.4 per 100,000 population. In 2015, 96 people died from drug overdoses in Wyoming.
o The opioid overdose death rate in Wyoming is 7.9. In 2015, 46 people died from opioid overdoses in Wyoming.
• Doctors in Wyoming prescribe 69.6 opioid pain relievers per 100 persons, compared to the national rate of 82.5 per 100 persons.
• Medicaid covers 10 percent of people in Wyoming.
• Medicaid covers 19 percent of medication-assisted substance abuse treatment in Wyoming.
• The uninsured rate in Wyoming is 11.5 percent.
• Under TrumpCare, 18,594 people in Wyoming would lose private insurance coverage.
• Next year under TrumpCare, premiums would increase by $1,114 in Wyoming.
0
1
2
3
4
5
6
7
8
9
10
2007 2009 2011 2013 2015
Wyoming Opioid Overdose Death Rate, 2007-2015Age-Adjusted Death Rate, per 100,000 Population
Source: CDC/NCHS, National Vital Statistics System, Mortality. CDC WONDER