NREL is a national laboratory of the U.S. Department of Energy, Office of Energy Efficiency and Renewable Energy, operated by the Alliance for Sustainable Energy, LLC. Chris Gearhart APS March Meeting Energy Research Opportunities Workshop March 2, 2014 Alternative Energy Vehicles Challenges and Opportunities
Transcript
NREL is a national laboratory of the U.S. Department of Energy, Office of Energy Efficiency and Renewable Energy, operated by the Alliance for Sustainable Energy, LLC.
Chris GearhartAPS March MeetingEnergy Research Opportunities WorkshopMarch 2, 2014
Alternative Energy VehiclesChallenges and Opportunities
2
Historical Perspective on Energy
“We are like tenant farmers, chopping down the fence around our house for fuel, when we should be using nature’s inexhaustible sources of energy – sun, wind and tide. . . . I’d put my money on the sun and solar energy. What a source of power! I hope we don’t have to wait till oil and coal run out before we tackle that.”
Thomas Edison Speaking with Henry Ford and Harvey Firestone, 1931Source: Uncommon Friends: Life with Thomas Edison, Henry Ford, Harvey Firestone, Alexis Carrel & Charles Lindbergh, James Newton, 1987, pg. 31
Thomas Edison and electric car. Photo: Courtesy of National Museum of American History, Smithsonian Institution
I always like to start with a statement of the problem. The earth is getting warmer. Current best estimates of climate change indicate that in order to keep temperature rises down to something on the order of two to two and a half degrees the word needs to reduce its CO2 emissions to 50-85% of 2000 levels by 2050.
4
GHG Projections by Transportation Market Segment
Source: Melaina, M.W.; Heath, G.; Sandor, D.; Steward, D.; Vimmerstedt, L.; Warner, E.; Webster, K.W. (2013). Alternative Fuel Infrastructure Expansion: Costs, Resources, Production Capacity, and Retail Availability for Low-Carbon Scenarios. Transportation Energy Futures Series.
U.S. GHG Emissions Reduction Target
Presenter
Presentation Notes
The DOE has adopted a 2050 GHG emissions target of 80% of 2005 levels. This is show here along with business as usual assumptions for GHG emissions by transportation market segment. This business-as-usual scenario is extrapolated from the Energy Information Administration’s 2011 Annual Energy Outlook. These projections suggest an increase in GHG emissions of 17% from the 2,698 million metric tons of carbon dioxide equivalents (MMTCO2e) in 2005 to the estimated 3,148 MMTCO2e in 2050. There is considerable uncertainty as to whether the reference case represents the most likely future outcome, and side cases in the AEO explore future conditions, such as higher or lower oil prices, that might result in different energy use and GHG emission profiles. As indicated in the figure, the 80% reduction goal is 540 MMTCO2e, which is an 83% reduction below the 2005 BAU GHG estimate.
5
Divide the problem into three pieces:1. Energy consumption of the vehicles2. Carbon intensity of the energy source3. Distance driven
Implications for Vehicles
Presenter
Presentation Notes
If I look at this problem I can divide it into 3 pieces. How much energy is consumed to move a vehicle a given distance How much CO2 is put into the atmosphere to deliver a unit of energy to the vehicle. The total distance driven by vehicles. The first is a property of the vehicles, which is what I am here to talk about today. The second is a property of the energy source used to propel the vehicles. – I am not here to talk about energy sources, but the properties of the vehicle depend critically on what energy carrier is used by the vehicle so I can’t completely separate the two. The third is a question of behavior, urban design, policy etc. – I am not really going to talk about this either, but obviously it has a big impact, particularly if we look at the problem globally and see the numbers of emerging countries in which vehicle miles traveled are likely to explode in the next few decades.
6
Emission Reduction Targets
CO2 Emission Target• 540 million metric tons for entire transportation
sector• Assume light-duty vehicles (LDVs) get same
percentage of budget in 2050 as in 2005 (~57%)• 308 million metric tons (3.08 x10¹⁴ g).
Vehicle Miles Traveled (VMT)• Business-as-usual (BAU) VMT continues to increase.• Estimate about 8 x 10¹² kilometers by 2050.
Emissions per Kilometer — 38 g/km.
Presenter
Presentation Notes
Now lets put some numbers against this problem. First recall that DOE 2050 GHG goal is mitigate the most significant effects of climate change is 540 Million Metric Tons of CO2 per year. Lets assume that light duty transportation will continue to contribute 57% to this total in 2050. This gives us a target of 308 million metric tones for LDV travel. Second lets assume that society continues to increase the number of miles that it drives. Business as usual projections from a 2013 study (Melenia et. al. 2013 Alternative fuels infrastructure expansion) estimate LD Vehicle miles traveled will be around 8 trillion kilometers. This gives us a GHG emissions target of 38 grams of CO2 equivalent per kilometer driven.
7
What Does the Solution Look Like?
Typical Car Today
Lower Carbon Energy
Mor
e E
ffici
ent V
ehic
les.
38 gm/km
Need to get over this line!
Presenter
Presentation Notes
Carbon emissions per kilometer driven must be less than 38 gm/km. This is the green line on the graph. Vehicle and Energy sources combinations that meet the 2050 target are below and left of the green line. (click for text box) Combinations that emit too much CO2 are above and to the right of the green line. (click for text box) The blue dot is a typical sedan today. (click for text box) Notice that it is on the wrong side of the green line. We need to do two things – Make vehicles more efficient which moves us down on this graph(click for arrow) Or use energy sources that put less CO2 into the atmosphere (click for arrow)] Or both (click for arrow)
8
Low-Carbon Energy Carriers
C
He-
Only Three Options
Batteries to store electricity generated
from renewable sources, or fossil
sources combined with carbon sequestration.
Hydrocarbons generated from
“atmospheric” carbon (e.g., biofuels).
Hydrogen generated from renewable sources, or fossil
sources combined with carbon sequestration.
Presenter
Presentation Notes
I am here to talk about vehicle technologies, but in order to classify these we need to understand that there are only three energy carriers available. Hydrocarbons -- generated using non-fossil “atmospheric” carbon Hydrogen Electrons
9
Three Pathways
• Figure shows rough estimates of energy consumption potential of each pathway • Does not show the carbon intensity of each pathway.
Presenter
Presentation Notes
So we have three types of vehicle we need to discuss. Vehicles using biofuels will likely be Hybridized Internal Combustion Engines. This is shown by the black trajectory on this plot. The green trajectory represents hydrogen vehicles that use a fuel cell to convert hydrogen to electricity. The blue trajectory shows battery electric vehicles. In all three trajectories, the Energy consumption at which they level off is representative of energy consumptions considered to be “Feasible” by 2050. This according to a recent NAS study. This doesn’t mean we know how to do it in an economical way, just that it probably isn’t impossible. The trajectories don’t show the likely carbon intensity associated with energy carrier. Rather these trajectories show the relative intensity that is required for each energy carrier. Biofuels will have to have a lower carbon intensity than hydrogen which will have to have a lower carbon intensity then electricity.
10
How Long Will it Take to Replace the U.S. LDV Fleet?
Photo: Warren Gretz/NREL
Presenter
Presentation Notes
Another aspect of the problem. How fast will we need to slide down these trajectories to cross the goal line by 2050?
11
240 Million LDVs
16 Million Sales/Year
15 Years to Replace LDV Fleet
2050 GHG target is really a 2035
technology target.
Photos (left to right): Ken Kelly/NREL, Willie B. Thomas/iStock, Dennis Schroeder/NREL
How Long Will it Take to Replace the U.S. LDV Fleet?
Presenter
Presentation Notes
So, technologies needed to meet 2050 target need to start being sold at high volume by 2035. Technologies need to start being introduced into the market a decade or more earlier. Efforts to increase the rate of market penetration including development of needed infrastructure will be critical.
12
Strategies
Reduce VMT• Mass transit, rideshare, telecommute, walk, bike.
• Reduce vehicle mass• Very efficient internal-combustion engines (ICEs)• Conventional powertrain to hybrid electric vehicle (HEV) to plug-
in-hybrid electric vehicle (PHEV) to fully electric vehicle (EV).
Shift to Renewable Energy• Biofuels• Renewable hydrogen• Renewable electricity.
Presenter
Presentation Notes
So we need some combination of these three strategies. Reduce Vehicle miles traveled. Improve the vehicles. Shift to renewable fuels Today I am going to talk about the second strategy.
13
Vehicle-Level Research Opportunities
• Hydrogen fuel cell electric vehicles• Battery electric vehicles• Biofuel combustion/ICE efficiency
improvement• General vehicle energy consumption
reduction• Transportation system efficiency gains
Presenter
Presentation Notes
I’ll talk about opportunities unique to each of the three trajectories. I’ll talk about opportunities general to all three trajectories. And if there is time I will talk a little bit about some system level opportunities that depend on the development of specific vehicle technologies.
NREL is a national laboratory of the U.S. Department of Energy, Office of Energy Efficiency and Renewable Energy, operated by the Alliance for Sustainable Energy, LLC.
Hydrogen Fuel Cell Electric Vehicles
15
Fuel Cell Market Overview
Source: S. Satyapal, 2013 DOE AMRhttp://www.hydrogen.energy.gov/pdfs/review12/joint_plenary_satyapal_2012_o.pdf
Presenter
Presentation Notes
There have been mixed opinions and messages regarding fuel cells and hydrogen in the past few years. These first few slides are meant to highlight the current status and potential within the market. Sunita Satyapal is the Program manager of the Fuel Cell Technologies Office, and these facts are taken from here presentation at the 2013 Annual Merit Review. I include it to highlight the number of fuel cell systems shipped, the growth rate of the market, and the potential size of the market. 2 markets where fuel cells already have some level of commercial competitiveness are fork lifts/materials handling, and back-up power for telecom (particularly in the developing world). The slide also notes the commitment of specific automakers to commercial fuel cell vehicles in the 2015-2017 timeframe. Honda, GM, Hyundai Toyota, Ford, Daimler and Nissan have all made public statement regarding selling commercial vehicles in 2015.
Historically cost has been the biggest barrier to implementation of fuel cell vehicles. But the cost has dropped dramatically over the last decade.
17
Total Cost of Ownership for Future LDVs
Source: F. Joseck, 2013 DOE AMRhttp://www.hydrogen.energy.gov/pdfs/review13/2013_h2_amr_plenary_analysis_joseck.pdf
Multiple technologies are cost competitive, supporting portfolio approach.
Presenter
Presentation Notes
This slide compares the projected cost of ownership of various future drive train/fuel platforms on a cents per mile driven basis. The take away message from this slide is that all the technologies really fall within a fairly narrow range, and the fuel cell EV is projected to be near parity with other competing technologies.
18
Barriers to Implementation
Cost• Mostly due to catalyst activity.
Durability• Mostly due to catalyst durability.
Hydrogen storage energy density
Cost and durability are linked.
What improves one tends to make
the other worse.
Presenter
Presentation Notes
The primary barriers to implementation (at the vehicle level) are cost, durability and hydrogen storage energy density. Although cost are dropping they are still a problem. In particular the technology is now at a point were manufactures must make a cost vs. durability trade off.
MembranesNREL R&D focus is heavily directed towards critical materials needs and novel materials development, with a specific focus on electrode design and fabrication. The primary goal is to reduce Pt, make systems higher performing and more durable.
Presenter
Presentation Notes
PEFC = Polymer Electrolyte Fuel Cell Slide animated to discuss technology needs first and then NREL’s portfolio. Low Pt- Extended surfaces, WOx/HPA, N-doping C; Alkaline – BES, PF AEM; Electrodes – RDE, Extended surfaces; Membranes – PF AEM, HPA. The most significant advantage of Alkaline Membrane Fuel Cells is that under alkaline conditions, electrode reaction kinetics are much more facile, allowing use of inexpensive, non-noble metal catalysts such as nickel for the fuel electrode and silver, iron phthalocyanines etc. for the oxygen electrode. Corrosion problems are also substantially reduced under alkaline conditions. An alkaline medium accelerates oxidation of methanol making it an attractive fuel to be used. Methanol has an advantage of easier storage and transportation and has higher volumetric energy density compared to hydrogen.
20
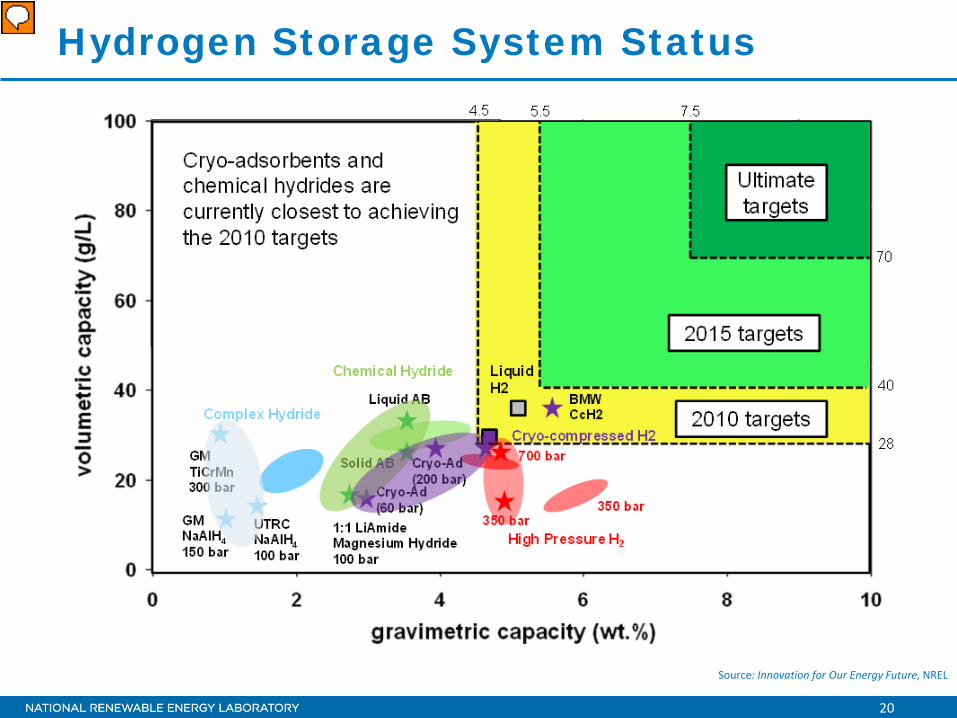
Hydrogen Storage System Status
Source: Innovation for Our Energy Future, NREL
Presenter
Presentation Notes
Energy Density for Hydrogen Storage is a problem. Current vehicles can travel about 300 miles on a tank full of hydrogen using 700 bar compressed gas storage. But it takes a very large tank.
21
Solid/Condensed State Storage
Physical Storage-Compressed Gas (350-700 bar), Cold Gas, or Liquid• Known technology and infrastructure• High-pressure operation• High material costs for storage vessel• Low volumetric capacity.
Solid/Condensed State Storage-Metal Hydrides, Chemical Hydrides, and Adsorbents• Low-pressure operation• Ambient storage temperature• High hydrogen capacity• Fluid phase or solid phase• Flexibility of material space• Lower cost?
Source: Innovation for Our Energy Future, NREL
Presenter
Presentation Notes
700 bar compressed gas is “easy” and is the current industry standard, but a suitable material based hydrogen storage solution would make everything better.
22
Resource
Hydrogen Storage Material
Spent Storage Material
Hydrogen Storage Material
H2
Spent Storage Material
Hydrogen Release
H2
Regeneration/Processing Cycle
(T, P)
(T1, P1)
(To, Po)
Refueling/Transfer Station
H2 Utilization
Hydrogen ReleaseHydrogen
Uptake
(T1, P1) (T2, P2)
2
4
2H SourceH O
BiomassCH
H2
H2
Fuel and Water H2 and CO2
2
4
C SourceCO
BiomassCHCoal
DMEMeOHFT DieselFT GasolineEtOH
H2
(T, P)
Chem
ical H
ydrid
esAd
sorb
ents
/Met
al H
ydrid
esCa
rbon
Bas
ed C
hem
ical
Hydr
ide
Refo
rmin
g
H2, CO, CO2
(T, P)
Three Material Classes: Chemical Hydrides, Metal Hydrides, and Adsorbents
Solid/Condensed State Storage
Chemical Hydrides,
Metal Hydrides and Adsorbents
MOF-5
Source: Innovation for Our Energy Future, NREL
Presenter
Presentation Notes
So there are research opportunities in chemical hydrides, metal hydrides and adsorbents.
NREL is a national laboratory of the U.S. Department of Energy, Office of Energy Efficiency and Renewable Energy, operated by the Alliance for Sustainable Energy, LLC.
Battery Electric Vehicles
24
Barriers to Implementation
• Cost• Lifetime• Energy density• Power• Infrastructure/charger
access• Safety.
EV Battery Development Challenges
25
Reducing Battery Size & Cost
DOE GOALS: Reduce Battery Cost from $1,000/kWh to $150/kWh by 2020
Batteries 1/2 Today's Price in 2015, 1/4 Today's Price in 2020
Progress:• 35% reduction in HEV/PEV battery cost • 50%-100% more energy capacity.
EV Battery Choices: Energy and Power
Figure: DOE
Presenter
Presentation Notes
NREL’s real-world solutions have direct applications for industry, consumers, policymakers and environment. We place the emphasis on “development” in R & D – plus the additional “D” of deployment. Credible research grounded in real-world data produces solutions that are feasible in terms of technical, operational and economic requirements. Here are 2 examples of this real world approach: On this slide… Our leading thermal management research feeds directly into new energy storage technology… Increasing performance, reliability and safety of batteries… And bringing down prices to help put more plug-in electric vehicles on the road.
26
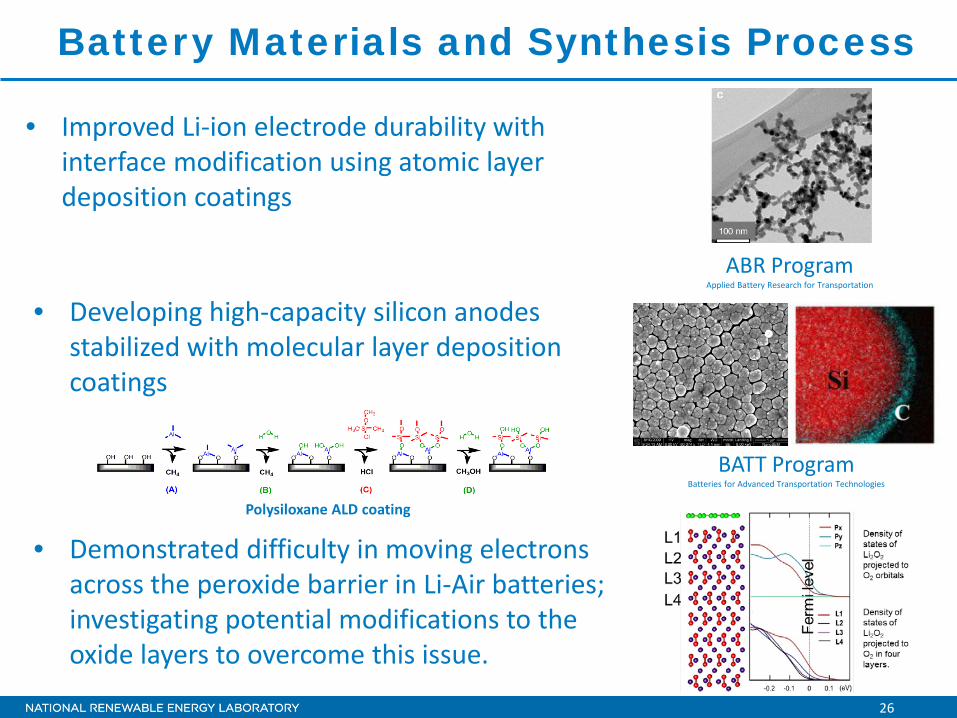
• Improved Li-ion electrode durability with interface modification using atomic layer deposition coatings
ABR ProgramApplied Battery Research for Transportation
Polysiloxane ALD coating
BATT ProgramBatteries for Advanced Transportation Technologies
• Demonstrated difficulty in moving electrons across the peroxide barrier in Li-Air batteries; investigating potential modifications to the oxide layers to overcome this issue.
Battery Materials and Synthesis Process
27
Physics of Li-Ion Battery Systems in Different Length Scales
Li diffusion in solid phaseInterface physicsParticle deformation & fatigueStructural stability
Charge balance and transportElectrical network in composite electrodesLi transport in electrolyte phase
Electronic potential ¤t distributionHeat generation and transferElectrolyte wettingPressure distribution
Atomic Scale
Particle Scale
Electrode Scale Cell Scale
System ScaleSystem operating conditionsEnvironmental conditionsControl strategy
NREL is a national laboratory of the U.S. Department of Energy, Office of Energy Efficiency and Renewable Energy, operated by the Alliance for Sustainable Energy, LLC.
Biofuel ICE Vehicles
29
Barriers to Implementation
• Suitable biofuels• Very efficient internal combustion engines.
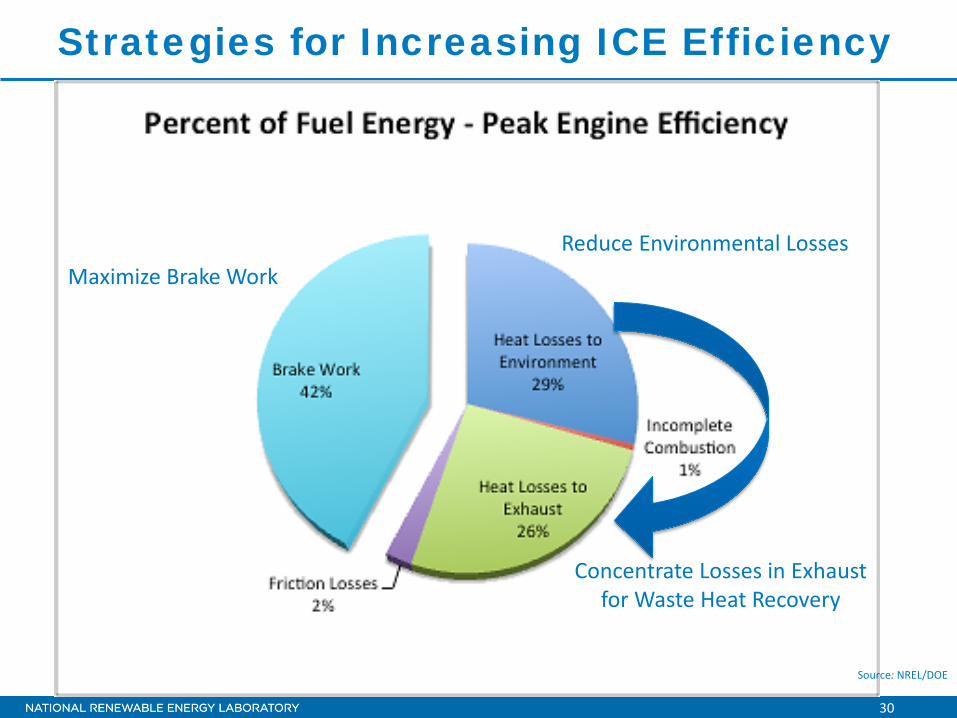
Source: NREL/DOE
30
Strategies for Increasing ICE Efficiency
Maximize Brake WorkReduce Environmental Losses
Concentrate Losses in Exhaustfor Waste Heat Recovery
Source: NREL/DOE
31
Maximize Brake Work
• Increase work by o Increasing change in pressure and volumeo Increasing gamma
• Increase compression ratio• Over-expanded cycle (Atkinson cycle)• Turbocharging• Fuel selection to provide high gamma
W=∆(PV)/(1-γ)
32
Research Opportunities
• Advanced materials that can withstand high temperatures o Reduces the amount of heat that has to be
extracted through coolant.
• Advanced combustion techniques• Exhaust energy recovery
o Efficient turbo machineryo Thermo-electrics
33
Research challenges for internal combustion engines
• Efficiency can be increased with high pressure, low temperature combustion, using high compression ratios, boost, lean mixtures, and dilution…o But these make ignition control difficult, so
technologies such as plasma ignition may be requiredo Other strategies rely on controlled autoignition through
chemical kinetics
Image sequence from U. Michigan, M.S. Wooldridge research group, http://www-personal.umich.edu/~mswool/researchimagelibrary.htm
34
Research challenges for internal combustion engines
• Computational models must be improved to simultaneously study reacting flows with fluid dynamics and chemical kinetics
Matsumoto, et al., Spray Characterization of Ethanol Gasoline Blendsand Comparison to a CFD Model for a Gasoline Direct InjectorSAE 2010-01-0601
o Fuel spray dynamics
o Fundamental understanding of flame structure
35
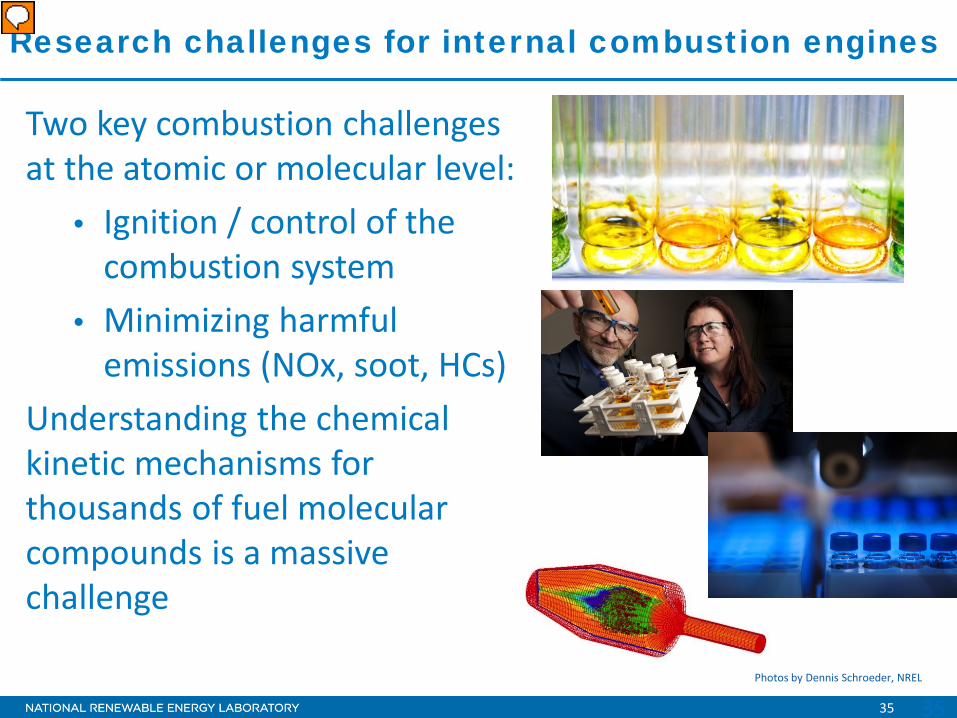
Photos by Dennis Schroeder, NREL
Two key combustion challenges at the atomic or molecular level:
• Ignition / control of the combustion system
• Minimizing harmful emissions (NOx, soot, HCs)
Understanding the chemical kinetic mechanisms for thousands of fuel molecular compounds is a massive challenge
Research challenges for internal combustion engines
35
Presenter
Presentation Notes
The Fuels Performance Group focuses on advanced biofuels and advanced combustion & fuels. Our research in these areas involves investigating utilization issues and combustion for renewable and alternative fuels and blending components, with a focus on fuel and blend component quality, quality test methods, performance in and compatibility with engines, combustion, and impacts on emission control equipment and tailpipe emissions. The overall objective is to eliminate technical barriers to expanding markets for new fuels and to identify opportunities for engine/combustion optimization that take advantage of unique fuel properties. Our work in the advanced biofuels arena involves assessing the performance of new biofuels, assisting with the development of ASTM standards, and developing a new capability for measuring certain toxic compounds. In addition to performing fuel chemistry and performance tests related to biodiesel, ethanol, and fuels from cellulosic biomass, we investigate issues associated with: Infrastructure compatibility, storage, and handling – including ASTM specification and test methods for biofuel/petroleum blends Engine compatibility with fuels and lubricants Engine and catalyst durability Emissions and air quality
NREL is a national laboratory of the U.S. Department of Energy, Office of Energy Efficiency and Renewable Energy, operated by the Alliance for Sustainable Energy, LLC.
Vehicle Efficiency
37
Vehicle Efficiency: Where Are the Losses?Power Required to Move the Vehicle• Inertia – reduce vehicle mass• Overcome aerodynamic drag – reduce drag coefficient of frontal area
Reclaiming Lost Energy• Use regenerative braking to reclaim kinetic energy lost as heat through braking• Recover heat – exhaust gases or engine coolant• Use turbochargers – recover pressure in exhaust stream.
38
Vehicle Losses: City Driving
Illustration courtesy of U.S. Department of Energyhttp://www.fueleconomy.gov/feg/atv.shtml
39
Vehicle Losses: Highway Driving
Illustration courtesy of U.S. Department of Energyhttp://www.fueleconomy.gov/feg/atv.shtml
40
Vehicle Losses: Comparison
Compared with City Driving
Illustration courtesy of U.S. Department of Energyhttp://www.fueleconomy.gov/feg/atv.shtml
41
Vehicle Losses: Opportunities
Illustration courtesy of U.S. Environmental Protection Agency
42
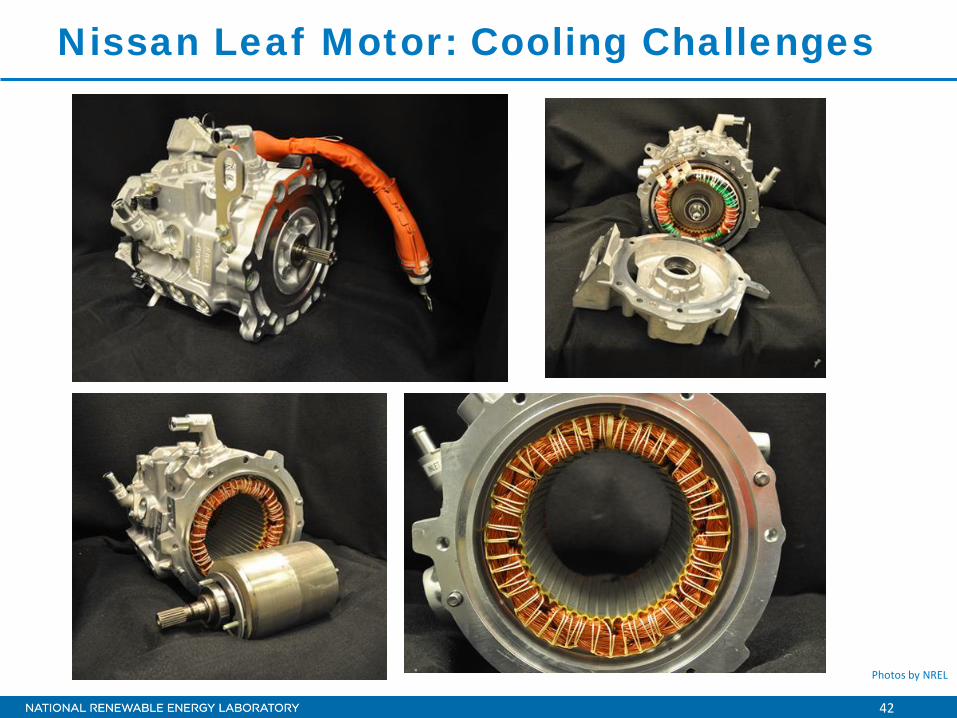
Nissan Leaf Motor: Cooling Challenges
Photos by NREL
43
Typical Channel Flow Cooling for an Inverter
2007 Toyota Camry
Photos by NREL
44
• Reduced thermal resistance ~20% for same pumping power
• Increased coefficient of performance
• 50% weight reduction of the heat exchanger.
Prototype inverter-scale heat exchanger
Jet Impingement in a Plastic Heat Exchanger
Photos by NREL
Presenter
Presentation Notes
This slide shows the results of implementation of the Wolverine microfinned surface on the base plate of an inverter-scale plastic heat exchanger with liquid WEG jets impinging on the copper base plate. The baseline case is the conventional channel-flow configuration. Significant enhancements in performance are expected.
45
0
50,000
100,000
150,000
0 25 50 75 100
Hea
t Tra
nsef
er C
oeffi
cien
ts (
W/m
2 -K
)
Heat Flux (W/cm2)
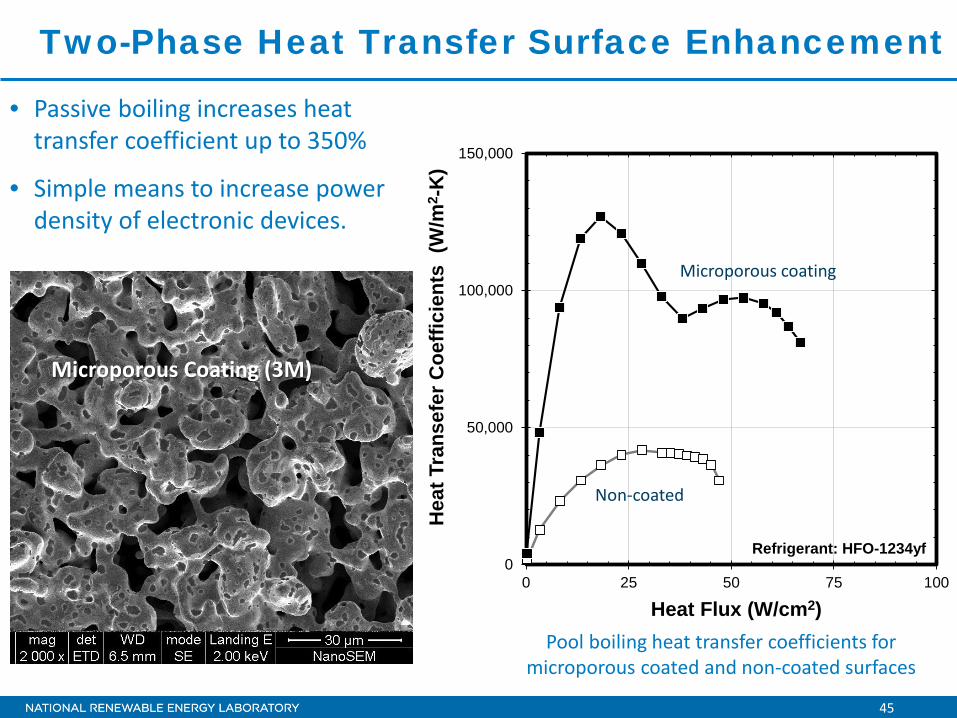
Refrigerant: HFO-1234yf
Two-Phase Heat Transfer Surface Enhancement
• Passive boiling increases heat transfer coefficient up to 350%
• Simple means to increase power density of electronic devices.
Microporous coating
Non-coated
Microporous Coating (3M)
Pool boiling heat transfer coefficients for microporous coated and non-coated surfaces
46
Reducing Electric-Drive Vehicle Climate Control Loads
Presenter
Presentation Notes
Outdoor vehicle thermal testing Two Ford Focus Electric vehicles (Ford CRADA) Side-by-side testing Thermal manikin Thermal Analysis CFD/RadTherm/Human Model Virtual manikin Assessing strategies to reduce climate control loads Zonal approach Thermal load reduction High performance computing
47
• Degree of electrification (power electronics and energy storage)
• Start/stop• Regenerative braking• Low rolling resistance tires• Electric powered steering• Electric infrastructure• Light weighting• Batteries and cooling systems• Turbo-charging, direct fuel injection, advanced
combustion, 8-speed transmissions• Variable cylinder management• Improved aerodynamics• Diesel, alternative fuels, hydrogen, etc.
R&D Solutions Leading to 54.5 MPG
NREL is a national laboratory of the U.S. Department of Energy, Office of Energy Efficiency and Renewable Energy, operated by the Alliance for Sustainable Energy, LLC.
Transportation System Efficiency
49
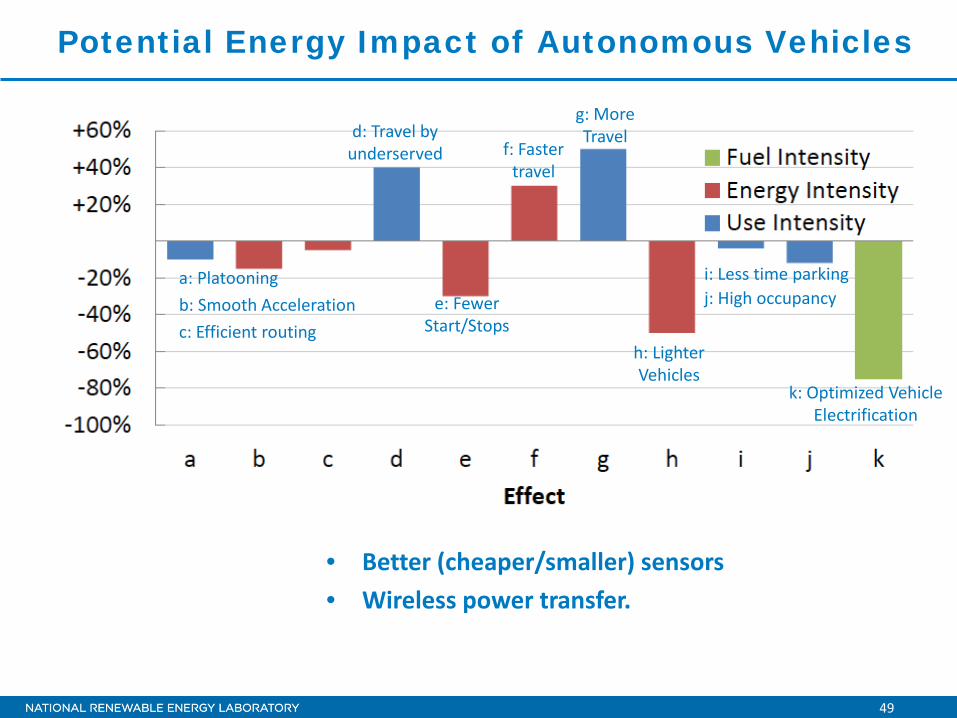
Potential Energy Impact of Autonomous Vehicles
• Better (cheaper/smaller) sensors• Wireless power transfer.