38
FINANCIAL REPORT April 2010 March 2011
FINANCIAL REPORTApril 2010 March 2011
1
1. Basic Management Policy
Throughout its history, Amano has adhered to a basic policy of putting the customer fi rst. This has meant paying heed to what its customers say, based on the corporate themes of “people and time” and “people and the environment,” and giving pivotal im-portance to customer satisfaction throughout its business activities, particularly in sales, production, and development activities.
In accordance with this fundamental policy, Amano continues to undertake business activities with the goal of earning the trust and high regard of all those who support it: customers, employees, shareholders, suppliers and other entities with which it does business, and the local community. It achieves this by providing a variety of products, systems, services, and solutions that match the needs of customers in relation to the themes of “people and time” and “people and the environment.”
Amano and its Group companies direct their efforts toward maximizing corporate val-ue by fostering innovation in management and by ensuring a strong earnings structure and sustained growth in business performance.
2. New Medium-Term Business Plan
Amano and its Group companies each continue the tradition of evolving continuously in response to changes in the times, while maintaining the following four immutable strategies of the Amano Group.
1) Emphasis on Time & Ecology business fi elds, and enhancement of core business2) Being a niche leader in the business fi elds in which we excel3) Ceaseless restructuring4) Management based on cash fl ow
Based on these four fundamental strategies, Amano inaugurated a new medium-term business plan.
An outline of the plan is set out below.
[1] Basic Policies
Under the new medium-term business plan, the Group seeks to be a global niche leader by exploring new market frontiers (advancing aggressively into emerging and untapped markets), developing multi-disciplinary business operations on a location-by-location basis, and establishing new businesses domains. We are pursuing a new global growth strategy designed to achieve the maximization of corporate value.
Priority issues under the new plan are listed below.
Management Policy

2
1. North American and European markets
North America: In the parking system business, we will merge Amano McGann’s park-ing management software with Amano Group’s software and hardware, introduce new parking systems into the market, and strengthen direct sales structures to work closely with customers when proposing solutions. These efforts are designed to build upon our business foundations that are second to none in North America. In our time informa-tion system business, we will continue to scale up our operations by adding new prod-ucts alongside a wide array of time information management terminals and a blue-chip customer base that Accu-Time Systems enjoys. By commencing the local production and distribution of mist collectors through Amano Pioneer Eclipse, we will take a new step toward fortifying and expanding our operations in the environment system busi-ness.
Europe: In the time information system business, we will continue to enhance Horosmart’s ability to offer holistic solutions, and to expand its blue-chip customer base. These efforts are aimed at cementing our number one position at the high end of the market in France and at increasing our visibility and expanding further into other markets across Europe. In the parking system business, we will step up sales of low-priced system products, focusing on the UK and the three Benelux countries, in order to build a stronger operations foundation.
2. Asian, Latin American and other emerging markets
Asia: In the environment system business, we will enhance our capabilities to offer products and render services to Japanese companies operating in Asia outside Japan by deepening ties between our group companies across Asia and our head offi ce in Japan. We will also expand our local production capabilities in order to enhance our cost competitiveness. In the parking system business, we will seek to further scale up our South Korean and Malaysian operations as well as to aggressively promote the develop-ment of business operations in China, Singapore, and other Asian countries.
Latin America: In anticipation of the local market’s future growth potential, we will ag-gressively allocate a higher proportion of our managerial resources there, including those toward the commencement of local production, in order to explore market fron-tiers in each of the information system, parking system, and environment system busi-nesses.
3. Japanese market
Japan: We will reinforce ties among group companies and develop high-quality com-prehensive service offerings (combining products and services) across all business fi elds to expand our business domain, create new markets, and enhance our cost competi-tiveness. These efforts should align our entire group to work cohesively towards maxi-mizing its corporate value.
[2] Numerical Targets
Under the new business plan, we aim to achieve ¥100 billion or more in net sales and ¥10 billion or more in operating profi t in the fi nal year of the plan, which ends March 31, 2014.Numerical targets.
3
Izumi NAKAJIMAPresidentRepresentative Director
3. Basic Policy on Distribution of Profi ts, and Dividend for This and Next Term
Amano places great importance on its policy for dividends to shareholders. Fundamental to this is its policy for the return of profi t to shareholders, based on maintaining a stable ordinary dividend of ¥26 annually (¥13 interim and ¥13 year-end), together with appro-priate results-based distributions and fl exible purchasing of treasury stock. The Company aims to maintain a payout ratio of at least 35% on a consolidated basis and a ratio of dividend to net assets of at least 2.5%.
In line with this policy, taking into account our current-year operations results, we plan to pay a year-end dividend of ¥13 per share, unchanged from the amount paid at the end of the previous year. As a result, the annual per-share dividend will be ¥26 (including the ¥13 per share paid as the interim dividend). This corresponds to a dividend payout ratio of 65.0% and a 2.7% ratio of dividends to net assets on a consolidated basis.
With regard to the dividend for the next fi scal year, in line with our Basic Policy on Dis-tribution of Profi ts and in view of our Outlook for the Fiscal Ending March 31, 2012, we will aim to pay a dividend for the year of ¥26 (interim dividend of ¥13, and year-end dividend of ¥13).
Retained earnings will be earmarked for fund effective investment aimed at the fun-damental enhancement of the Company’s capacity to conduct its business operations. This will include the expansion and strengthening of existing business fi elds, strategic investment in growth fi elds, and spending on research and development, as well as the rationalization of production plant and equipment for the purpose of reducing costs and further improving product quality.
4
Analysis of Business ResultsBusiness Results in the Year Ended March 31, 2011
During the fi scal year ended March 31, 2011, the Japanese economy saw industrial production and cor-porate earnings rebound and the unemployment rate improve slightly, as expor ts increased suppor ted by economic growth in Asian and other countries. These and other in-dicators showed that the economy overcame the business doldrums that prevailed in the latter half of last year and was beginning to recover gradually. Yet, in the aftermath of the
Great East Japan Ear thquake, cur-rent domestic economic activity as a whole now seems to be signifi cantly depressed.
Amid this business environment, the Amano Group worked on global market and product development as well as enhancement of its capac-ity to provide holistic solutions, in accordance with the consolidated growth strategy in its new medium-term business plan, formulated in April 2008. The entire organization also concentrated on thoroughly un-covering customer needs and strove to reduce cost of sales and selling, general and administrative expenses.
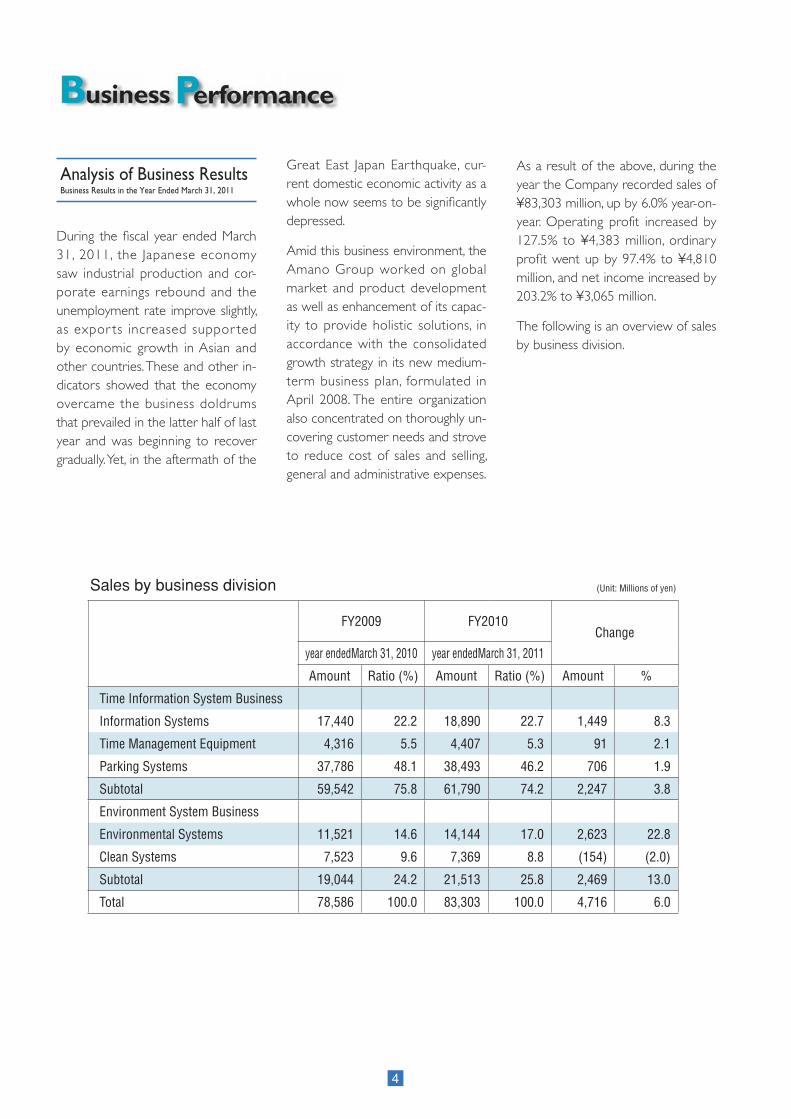
As a result of the above, during the year the Company recorded sales of ¥83,303 million, up by 6.0% year-on-year. Operating profit increased by 127.5% to ¥4,383 million, ordinary profi t went up by 97.4% to ¥4,810 million, and net income increased by 203.2% to ¥3,065 million.
The following is an overview of sales by business division.
Sales by business division (Unit: Millions of yen)
FY2009 FY2010Change
year endedMarch 31, 2010 year endedMarch 31, 2011
Amount Ratio (%) Amount Ratio (%) Amount %
Time Information System Business
Information Systems 17,440 22.2 18,890 22.7 1,449 8.3
Time Management Equipment 4,316 5.5 4,407 5.3 91 2.1
Parking Systems 37,786 48.1 38,493 46.2 706 1.9
Subtotal 59,542 75.8 61,790 74.2 2,247 3.8
Environment System Business
Environmental Systems 11,521 14.6 14,144 17.0 2,623 22.8
Clean Systems 7,523 9.6 7,369 8.8 (154) (2.0)
Subtotal 19,044 24.2 21,513 25.8 2,469 13.0
Total 78,586 100.0 83,303 100.0 4,716 6.0
5
Time Information System Business• Information Systems: Time & attendance (T&A), payroll,
human-resource management,access control, and cafeteria sys-tems
• Time Management Equipment: Time recorders, and time stamps• Parking Systems: Parking and bicycle-parking space
management systems, and parking management services
Information Systems
This business division continued to struggle under diffi cult conditions in Japan including a prolonged reduc-tion in information-related invest-ments and intensifying competition in the market, though there were also signs of recovery in capital in-vestments. On the other hand, fast growing markets for cloud com-puting services reflect the growing needs of companies wishing to uti-lize systems as a service without the burden of ownership.In this market environment, the Company continued to provide corporate customers with effective solutions for compliance and cost reduction, including work schedule optimization and total personnel expense control, to accommodate initiatives to improve their work environments. The Company also concentrated on uncovering poten-tial demand by intensifying efforts to make new proposals for cloud com-puting services.During the year, in Japan hardware sales increased by ¥344 mil l ion (6.9%) year-on-year, software sales decreased by ¥259 million (7.2%),
and sales generated by maintenance contracts and supplies ser vices increased by ¥170 million (5.7%). Decreased software sales refl ected a setback in demand stemming from compliance with the Revised Labor Standards Act, which came into ef-fect in April last year. By product area, T&A system sales were up by ¥527 million (6.3%), while access control system sales increased by ¥71 million (7.0%).Overall overseas sales increased by ¥1,077 million (20.1%) year-on-year. Sales for North America grew as Accu-Time Systems became a newly consolidated subsidiar y of Amano Corporation this fi scal year. Sales for Europe continued to be strong, as the sales of Horosmart S.A. increased on a local currency basis. However, sales revenues in terms of Japanese yen showed a decrease due to fluctuations in exchange rates. Sales for Asia decreased slight-ly.As a net result of the above, overall sales in this business division totaled ¥18,889 million, representing a in-crease of 8.3% from the previous year.
Time Management Equipment
In Japan, this business division contin-ued to struggle under diffi cult condi-tions, as the tight employment situa-tion and uncertain future economic prospects kept a lid on demand.In this market environment, the Company concentrated on expand-ing new markets and attracting a growing base of new customers by enhancing the functionality of PC-interfaced time recorders and step-ping up sales promotions.
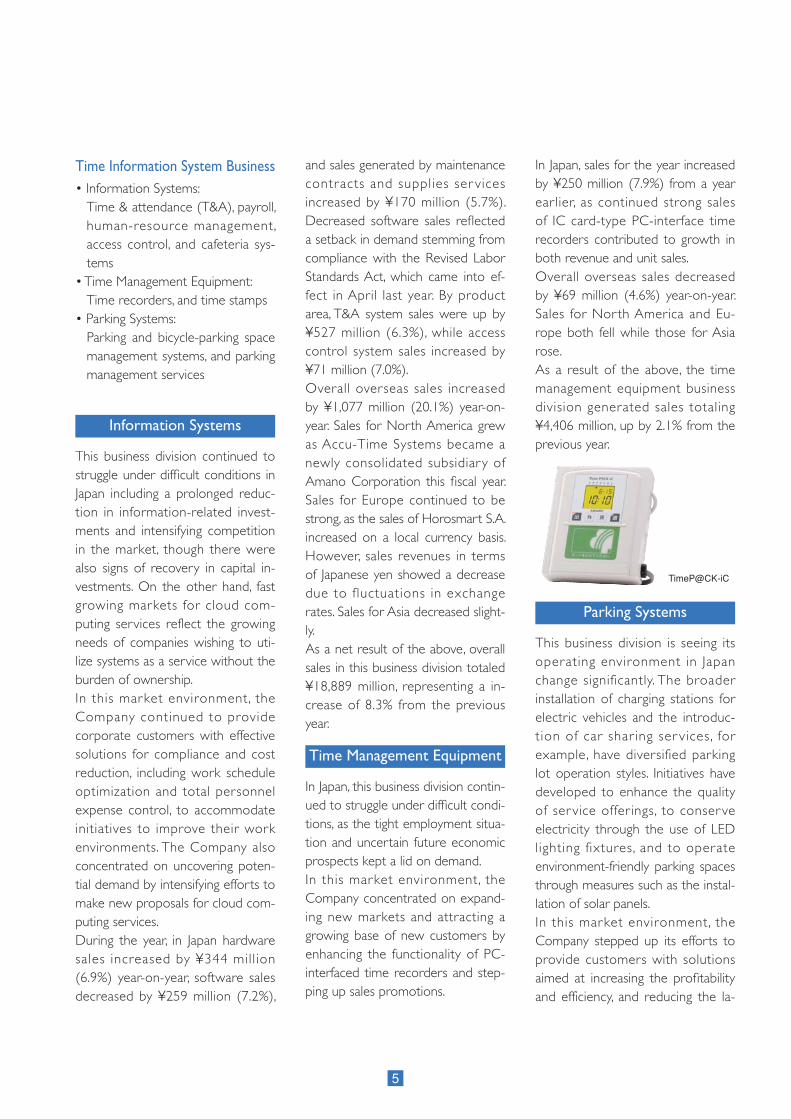
In Japan, sales for the year increased by ¥250 million (7.9%) from a year ear lier, as continued strong sales of IC card-type PC-interface time recorders contributed to growth in both revenue and unit sales.Overall overseas sales decreased by ¥69 million (4.6%) year-on-year. Sales for Nor th America and Eu-rope both fell while those for Asia rose.As a result of the above, the time management equipment business division generated sales totaling ¥4,406 million, up by 2.1% from the previous year.
Parking Systems
This business division is seeing its operating environment in Japan change significantly. The broader installation of charging stations for electric vehicles and the introduc-tion of car shar ing ser vices, for example, have diversified parking lot operation styles. Initiatives have developed to enhance the quality of ser vice offerings, to conser ve electricity through the use of LED lighting fixtures, and to operate environment-friendly parking spaces through measures such as the instal-lation of solar panels.In this market environment, the Company stepped up its efforts to provide customers with solutions aimed at increasing the profi tability and efficiency, and reducing the la-
TimeP@CK-iC

6
bor intensiveness, of parking lot op-erations from a customer perspec-tive, as well as with holistic solutions for the operation and management of parking lot services. These efforts were focused on uncovering new demand for replacement projects and on growing new markets includ-ing for bicycle parking systems and exclusive gate systems.In Japan, sales of car and bicycle parking system devices during the year increased by ¥1,506 million yen (11.9%) from a year earlier, due to an increased number of small and medium-sized system renewal proj-ects. Revenues from maintenance contracts and supplies services in-creased by ¥93 million (1.1%).The number of parking spaces man-aged by Group subsidiary Amano Management Service Corporation in its commissioned parking lot management business increased by 13,600 (7.4%) from the end of the previous fi scal year.Overall overseas sales decreased by ¥1,182 million (10.6%) year-on-year. Sales for North America declined substantially, suffering from stagnat-ing demand as the economic climate deteriorated. Those for Europe grew due to greater efforts in selling low-priced parking systems, while Asian operations saw sales grow due to the continued strength of the Ko-rean market.As a net result of the above, the Parking Systems business division provided sales totaling ¥38,493 mil-lion, an increase of 1.9% from the previous year.
Environment System Business• Environmental Systems: Standard dust collectors, large
dust collection systems, pneumatic powder conveyance systems, high-temperature hazardous-gas removal systems, deodorization systems, and electrolytic water generators
• Clean Systems: Cleaning equipment, dr y-care
cleaning systems, and cleaning management services
Environmental Systems
This division benefited from con-tinued recover y in the business environment in Japan. Although manufacturers accelerated their shift to overseas countries, driven by re-covery in capital investment and by strong orders for machine tools for emerging markets, particularly China and other Asian countries, demand overseas, par ticularly for standard dust collectors, improved.In this market environment, the Company shifted its managerial re-sources to markets where demand is growing, concentrating on the Asian market. The Company’s efforts included the bolstering of systems to sell products and ser vices to businesses operating overseas, the establishment of closer cooperation with overseas group companies, and the expansion of production in China. These efforts were focused on stimulating further growth in de-mand.During the year, in Japan sales of
standard equipment and large-scale systems increased by ¥1,359 million (37.9%) and ¥140 million (3.5%) year-on-year, respectively, while rev-enue from maintenance contracts and supplies services increased by ¥449 million (15.9%).Overall overseas sales increased by ¥733 million (106.8%) year-on-year, due to continuing strong orders refl ecting recovery in capital invest-ments by Japanese-affi liated compa-nies in Asian markets.As a result of the above, sales of this business division totaled ¥14,144 million, up by 22.8% year-on-year.
Clean Systems
This business division continued to struggle under diffi cult conditions in Japan. It suffered from a reduction in new shopping centers opened, re-duced total cleaning costs, and other factors, although it benefited from increased demand in the factory market refl ecting recovery in capital investment by manufacturers.In this market environment, the Company focused on uncovering new demand by stepping up its ef-forts to promote solutions for total cost reductions using new floor treatment systems and maintenance
VF-5HG

7
Analysis of Financial Condition
(i) Assets, Liabilities, and Net Assets
• Assets
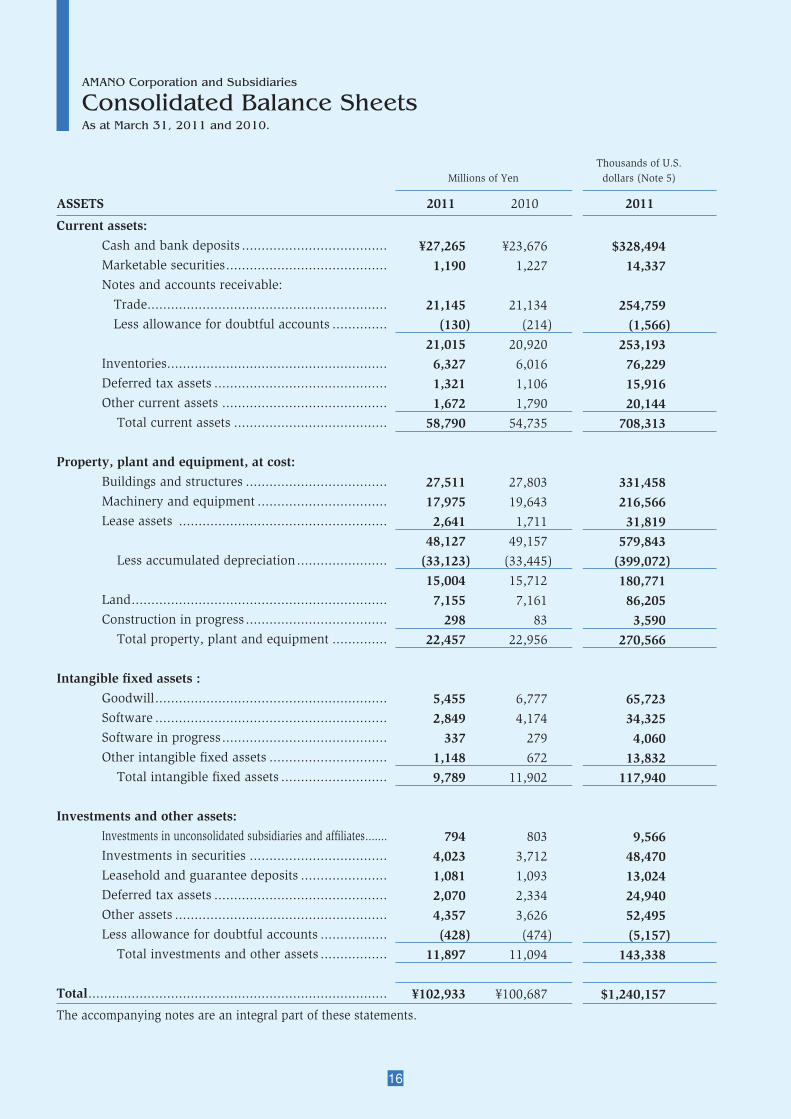
Total assets at March 31, 2011, amounted to ¥102,933 million, up by ¥2,246 million from the previous fi s-cal year-end. Current assets increased by ¥4,055 million year-on-year. This was chiefly due to a ¥3,589 million increase in cash and bank deposits. Fixed assets decreased by ¥1,809 mil-lion year-on-year. This was attributable primarily to a reduction of ¥2,113 mil-lion in intangible fi xed assets.
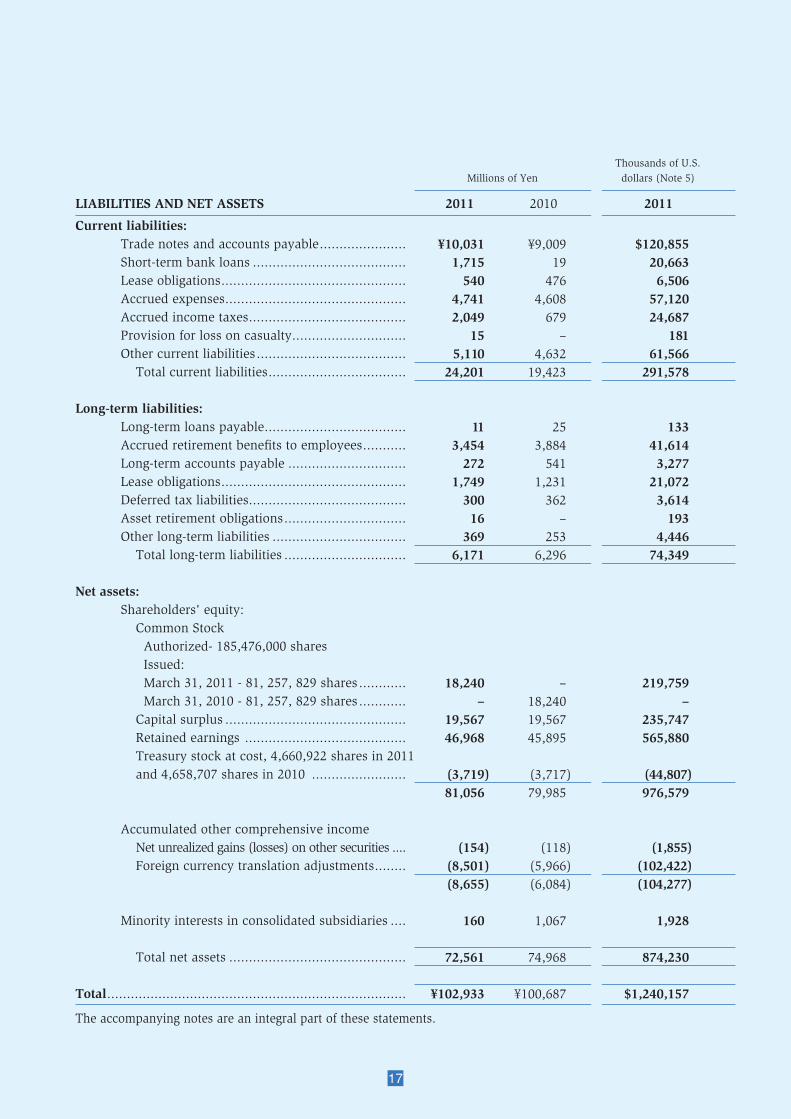
• Liabilities
Total liabilities at the fiscal year-end amounted to ¥30,372 million, up by ¥4,653 million year-on-year. Current liabilities increased ¥4,778 million year-on-year. This was chiefl y due to an in-
crease of ¥1,696 million in short-term bank loans, an increase of ¥1,370 million in accrued income taxes, and an increase of ¥1,022 million in trade notes and accounts payable. Fixed liabilities decreased by ¥125 million year-on-year. The principal factors behind this were a decrease of ¥430 million in accrued retirement benefi ts for employees and a decrease of ¥269 million in other long-term ac-counts payable, despite an increase of ¥518 million in lease obligations.
• Net Assets
Total net assets at March 31, 2011 amounted to ¥72,561 million, down by ¥2,407 million from the previous fi scal year-end. This was primarily due to a decrease of ¥2,571 million in to-tal accumulated other comprehensive income resulting from a decrease in foreign currency translation adjust-ments.
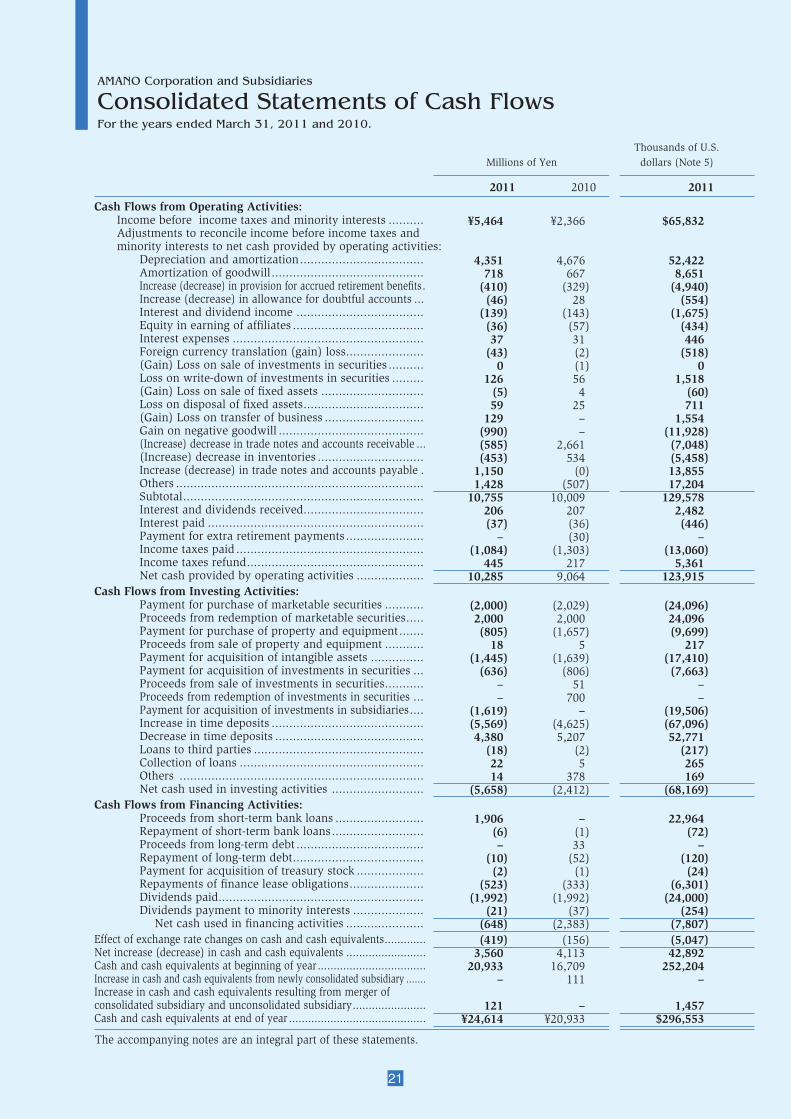
(ii) Cash Flows
Consolidated cash and cash equiva-lents increased by ¥3,681 million from the previous fi scal year-end, to a total of ¥24,614 million on March 31, 2011. More specifi cally, a description of the status of each type of cash fl ow at the year-end and the underlying factors are as follows.
(1) Cash fl ow from operating activities
Net cash provided by operating activi-ties totaled ¥10,285 million. This was attributable primarily to income be-fore income taxes, which amounted to ¥5,464 million, and depreciation and amortization, which amounted to ¥4,351 million, despite income taxes payments, which amounted to ¥1,084 million.
services.In Japan, sales of cleaning equipment during the year increased by ¥22 million (1.1%) year-on-year, due to improved demand for fl oor cleaning machines for factory facilities. Rev-enue from maintenance contracts and supplies services decreased by ¥77 million (2.6%).Overall overseas sales decreased by ¥67 million (4.0%) year-on-year. Sales for Nor th America grew in terms of local currencies but, de-
creased in yen due to fl uctuations in exchange rates, and sales for Europe and Asia continued to remain slug-gish.As a result of the above, sales in this segment totaled ¥7,368 million, down by 2.0% from the previous year.
SE-840eSW

8
Notes : Equity ratio: Equity capital/Total assets Fair value equity ratio: Gross market capitalization/Total assets Ratio of cash fl ow to interest-bearing liabilities: Interest-bearing liabilities/Cash fl ow from operating activities Interest coverage ratio: Cash fl ow from operating activities/Interest payments
Assumptions * All indicators are calculated on the basis of consolidated fi nancial values. * Gross market capitalization is calculated by multiplying the closing price of the Company’s shares at the year-end by the
number of shares of common stock issued and outstanding at the year-end (less treasury stock).v * Cash fl ow from operating activities refers to cash fl ow from operating activities posted under the consolidated statements
of cash fl ows. Interest-bearing liabilities refers to those of the liabilities stated in the consolidated balance sheets on which interest is paid. Interest payments equate with interest paid stated in the consolidated statements of cash fl ows.
Reference: Trend of cash fl ow indicators
At Mar. 31, 2007 At Mar. 31, 2008 At Mar. 31, 2009 At Mar. 31, 2010 At Mar. 31, 2011
Equity ratio (%) 74.4 73.0 72.9 73.4 70.3
Fair value equity ratio (%) 103.6 70.6 58.8 64.7 59.3
Ratio of cash fl ow to interest-bearing liabilities (%) 36.2 17.5 24.1 17.1 31.4
Interest coverage ratio 125.3 166.6 200.7 250.6 275.2
Outlook for the Fiscal Year Ending March 31, 2012
The Japanese economy, which has been depressed significantly in the aftermath of the Great East Japan Earthquake, is likely to see a gradual rebound in economic activity during the next fi scal year. Still, the effects of reduced industrial production and other factors may put a temporary dent in corporate earnings and in employment and personal income conditions. Despite persistent high growth in China and other emerg-
(2) Cash fl ow from investing activities
Net cash used in investing activities to-taled −¥5,658 million. This was largely due to expenditures of ¥5,569 million for the placement of time deposits, ¥2,000 million for the acquisition of securities, ¥1,560 million for the acqui-sition of subsidiaries’ shares resulting in a change in the scope of consolidation,
ing countries, given the continuing commodity price rises in reaction to the unsettled situation in the Middle East and other circumstances, the Japanese economy’s future pros-pects seem to becoming increasingly uncertain.Amid this business environment, Amano Corporation and its group companies continue to emphasize the following strategies: 1) Emphasis on Time & Ecology business fields, and enhancement of core business; 2) Being a niche leader in the busi-ness fields in which we excel; 3) Ceaseless restructuring; and 4) Man-agement based on cash fl ow. In line
with these four fundamental strate-gies, we will pursue our consolidated growth strategy on a global scale to ensure sustainable growth and con-tinually improving profitability with a view to maximizing the corporate value of Amano Corporation.The following business results are projected for the fi scal year ending March 31, 2012: Net sales ¥88,700 million, operating profi t ¥5,800 mil-lion, ordinary profit ¥6,200 million, and net income ¥3,100 million. The above projections assume currency exchange rates of US$1 to ¥82 and € 1 to ¥115.
¥1,445 million for the acquisition of intangible fi xed assets, and ¥805 mil-lion for the purchase of tangible fi xed assets. These outfl ows more than off-set proceeds of ¥4,380 million from the withdrawal of time deposits and ¥2,000 million from the redemption of securities.
(3) Cash fl ow from fi nancing activities
Net cash used in financing activities totaled −¥648 million. This was chiefl y due to expenditures of ¥1,992 million for the payment of cash dividends by the parent company and ¥523 million for the repayment of fi nance lease ob-ligations, despite proceeds of ¥1,906 million from the borrowing of short-term bank loans.

9
Operating and Other Risk
Among the matters relating to the qualitative information contained in these summary fi nancial statements and relating to the consolidated financial statements, the following are those that could be envisaged as having a possible material impact on investors.Matters that are considered to be potential risk factors in the under-taking of business by the Amano Group either now or in the future are estimated to the greatest extent possible, and the risk factors are then addressed and eliminated in the course of business activities.Matters relating to the future are those that are adjudged to be so as of the date of the release of these fi nancial results (May 9 , 2011).
( i ) Impact on earnings due to changes in the business environ ment
The Amano Group uses its accumu-lation of unique technologies and know-how to provide customers with high-quality products, services and solutions, gaining large market shares in each sphere of business in Japan, North America, Europe, and Asia, and developing business glob-ally.In the year ended March 31, 2011, the time information system busi-ness accounted for 74.2% of total sales, and the environment system
business accounted for 25.8%. Be-fore deduction of unallocated ex-penses the time information system business contributed 79.5% to oper-ating profit, while the environment system business contributed 20.5%. In terms of weighted average sales over the most recent five years, time information system business accounted for 70.3% of total sales and for 71.9% of operating profi t.With respect to future risk factors, in each business activity within the time information system business segment, which accounts for a large proportion of the Group’s business, if market expansion is expected for such reasons as a signifi cant change in the demand structure or the creation of a new market, it can be expected that this will attract entry by entities in other industries or by other powerful competitors. In that event, if a competitor were to enter with innovative products or solutions that surpass Amano’s, the Amano Group’s market advantage would decline, and that may have a material impact on its business per-formance.
(ii) Fluctuations in exchange rates
The Group engages in business activities on a global scale and has production and sales bases overseas. In view of this, the Group’s busi-ness results may be impacted by fl uctuations in exchange rates when transaction amounts overseas are converted into yen.
(iii) Information security
In order to offer system solutions and undertake the application ser-vice provider business, the Amano Group handles confi dential informa-tion such as personal information concerning customers or provided by customers. In view of this, the Group has developed a structure for the management of confi dential information, implements thorough staff training, and uses software to prevent leaks of information for the purpose of preventing network ac-cess to confi dential information and of preventing leaks of confidential information through the physical removal of data and information. To that end it has also established an Information Security Management Committee to ensure a foolproof structure. Nevertheless, in the event that an unforeseen situation were to arise, and information of the kind described above were to be dis-closed externally, resultant factors such as loss of confi dence may have a material impact on the Group’s business performance.

10
Issues to Be Addressed
The Company will take the following steps
to achieve the goals set out in its new medi-
um-term management plan.
1) Time information systems
•Information systems business
Amid continuing efforts by the labor au-
thorities to more strictly monitor unpaid
overtime and long working hours (overwork)
in order to eradicate these practices as well
as an increasing need to deal with risks sur-
rounding employment, such as industrial
court cases resulting from deteriorating em-
ployment conditions, there is strong poten-
tial demand among companies to establish
or rebuild T&A systems. The aim is to create
a company-wide labor time management
system to optimize business operations by
reducing working hours, improving work ef-
fi ciency cutting costs, etc. In addition, we will
aim to strengthen measures for compliance
toward appropriately managing working
hours. However, market conditions remain
tough reflecting prolonged reductions in
information related investments, intensifying
competition in the market, and other factors.
Meanwhile, the environment surrounding
the business in this segment has been facing
a significant shift from a period of owning
systems to a period of utilizing them, with
an increasingly prominent movement in the
industry toward cloud computing .
In this market environment, we will focus
on spurring latent demand in our solutions
business targeted at large companies by
strengthening our competitive advantage
with enhanced software functions, and re-
inforcing our marketing structures with col-
laboration between sales staff and systems
engineers. In addition, we will aim to expand
our Application Service Provider (ASP)
services business by reinforcing alliances
with Group companies in Japan in order to
respond to the changes of the times.
To enhance the profi tability of this business,
we will strictly manage revenue from our so-
lutions business targeted at large companies,
enhance our project management systems,
cut costs by standardizing system software,
and expand sales of standard software pack-
ages to small and medium-scale business
establishments, so as to boost earnings ca-
pacity.
Overseas, we aim to strengthen our custom-
er base and expand distribution channels in
North America, leveraging the strengths of
Accu-Time Systems, Inc. which we acquired
in February 2011 in the U.S. In addition, we
will work on establishing a global supply
system and reducing development costs by
expanding our hardware lineup. As a means
of expanding our business, we will also ex-
tend sales channels for software products
of Horosmart, S.A. (France) across Europe
and reinforce our organizational structures
toward globalization.
•Parking systems business
The parking system business is seeing its sur-
rounding operating conditions change signifi -
cantly. For example, the broader installation
of charging stations for electric vehicles, pro-
grams to reduce greenhouse gas emissions,
and the introduction of car sharing services
designed to ease traffi c congestion have led
to a diversifi cation of parking lot operation
styles. Meanwhile, initiatives have developed
to enhance the quality of customer service
offerings, to conserve electricity through the
use of LED lighting, and to operate environ-
ment-friendly parking spaces through mea-
sures such as the installation of solar panels.
In this environment we will focus on making
proposals from the customer’s perspective
with an emphasis on areas such as higher
profi tability and effi ciency of parking space
management. We will steadily meet the
needs of existing customers by offering high
value-added products with network capa-
bilities and inbuilt IT functions and forging
ahead with the holistic solutions business,
including maintenance and parking lot man-
agement services in close collaboration with
Group companies.
In the market for bicycle parking that has
arisen as a result of the problem of aban-
doned bicycles, we will seek to revitalize and
expand the market by proactively making
proposals on ecology-oriented initiatives in-
cluding rent-a-cycles and community bicycle
systems. In the market for exclusive gate sys-
tems controlling entry and exit to and from
sites such as factories, we aim to expand the
new market with the emphasis on safety
and security in addition to making proposals
on labor-savings and rationalization.
Overseas, we aim to expand business and
establish ourselves as the top manufacturer
of parking systems in the North American
market, leveraging the strengths of Amano
McGann, Inc. to further boost sales by build-
ing closer relationships with customers.
With an establishment of Amano UK Ltd.
in England, we aim to capture demand for
replacement from existing customers and
cultivate the new market in Europe by lever-
aging direct distribution networks. In addition,
we will strive to further expand our business
in Asia with the main focus on South Korea.
2) Environment systems
•Environment systems business
The environment system business sees con-
tinued recovery in its surrounding operating
conditions in Japan. While Japanese manu-
facturers continue to accelerate their shift
to overseas countries, driven by recovery
in capital investment and by strong orders
for machine tools for emerging markets,
particularly China and other Asian countries,
demand overseas, particularly for standard
dust collectors, has picked up.
3) Human resource development
Recognizing that people are the most im-
portant management resource for the op-
eration of our business, we have positioned
human resource development as a priority
issue and will focus on developing employ-
ees who have no fear of change and are
willing to meet the challenges.

11
Information Systems:Time Management Equipment
Increased Installations in the Public Sector MarketShifting to electronic T&A control using IC / ID Cards from the conventional attendance sheetsIn view of “preventing health prob-lems (including mental health) as-sociated with prolonged working hours” and “optimum control of working time”, regional Govern-mental bodies, public corporations (associations, foundations) are taking steps to review their conventional T&A control methods. The use of time recorders and IC cards, which accurately logs the in-times and out-times associated with attendance, is being adopted as the solution. At Amano, backed by the exten-sive delivery track record of such
systems, is actively working to expand this market demand by providing IC / ID cards and optimum electronic T&A solu-tions depending on the size and opera-tional environment.
TimePro-UGPayroll, HR, Accounting – various software
packages
Core system
Door security
DataDatacommunicationcommunication
LinkedLinkedLinked
Datacommunication
Various time recorders
A New Style in T&A System Package “Time P@CK-WL”Industry’s fi rst! The whole “TimeP@CK” range now comes with Bluetooth® wireless capabilitiesAmano’s long run product, the “PC interface Time Recorder TimeP@CK“ series, has now adopted Bluetooth®*.The conventional method of trans-ferring data from the time record-ers to personal computers relied on the use of cables or USB thumb drives, which limited the physical positioning of the time recorder unit. By using Bluetooth® wireless
communication, the time recorder can now be placed anywhere within the maximum communication range. Another user-friendly feature. The “TimeP@CK-WL” is the ad-vanced version of the “TimeP@CK”. The features such as ”ease-of use”, “high functionality” and “accuracy”, which has made “TimeP@CK” so popular, is inherited and since its launch in February, is gaining popu-larity among customers who are installing time recorders for the fi rst time.*Bluetooth®: “Bluetooth” is a communication standard for exchanging data over short dis-tances (several meters) between fi xed and/or mobile devices. If there is a Time Recorder positioned within the maximum range, there will be no need to connect cables and data collection is possible without leaving your desk.”Bluetooth®”is the registered Trademark of Bluetooth SIG, Inc., and Amano Corporation is a licensed user.
1.Time Punch 2.Wireless 3.Edit & Data aggregation
Max 10m
Beep!
Parking Systems
The Key Word is “Hospitality”Japan’s fi rst “Next Generation Parking Service” is now operationalJanuary 2011, Amano installed Japan’s first “Next Generation Parking Service” in a large shopping com-plex in Narashino-shi, Chiba prefec-ture. In general, administration costs for car parks in large shopping facilities are high in order to alleviate traffi c congestions and to maintain safety. This fi rst “Next Generation Parking Service” not only reduces such costs, but it also has the following features that enable smooth vehicle guid-ance from arrival to departure. This new “hospitality” service is drawing attention as an effective method to alleviate congestions; (i) On arrival, the driver can check the electronic guidance displays near the ceiling for vacancies, (ii) the guidance displays will guide the vehicle smoothly to the vacant park-ing space, (iii) the KIOSK terminals*,
located at various points within the shopping center, will provide the visitor with shop information, and is capable of “locate-your-vehicle” by keying-in the registration number, (iv) the guidance displays will guide the vehicle to the exit on departure. *KIOSK terminal: The “KIOSK terminal” refers to liquid crystal touch panel displays, often located on street corners and shopping centers to ob-tain information through visual search.
Information terminal (KIOSK terminal)
Visitors are guided smoothly and promptly with the combination of electronic displays, guiding signs, and vacancy indicators.
Guiding signVacancy indicator
Guidance display
Each parking space is equipped with an ultrasonic sensor which monitors the vacancy status. The guidance display and the vacancy indicators will show the visitor the vacant area and guiding sign pin-points the vacant parking space.
Guidancedisplay
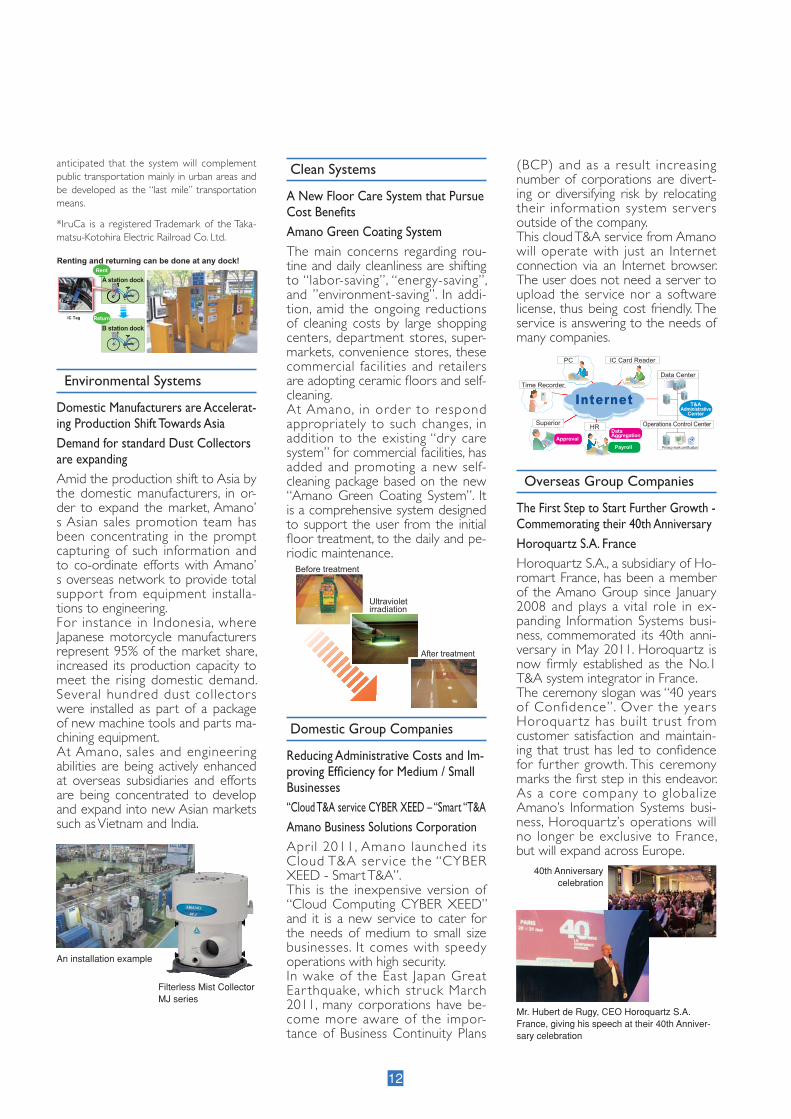
New Developments in “Rent-a-cycles”Nationwide expansion of “Bicycle parking systems for community bicycle programs”An increasing number of regional Government bodies are reusing abandoned bicycles as rent-a-cycles. In order to improve convenience for its users, “Community Bicycle Pro-grams”* are seen as a new develop-ment and it is expanding nationwide. March 2011, Amano instal led a “Bicycle Parking System” for a com-munity bicycle program in Takamatsu city, which is so far the largest of its kind, in Japan. Parking gate systems (UT-1500 series) were installed at each of the 7 rent-a-cycle docks around the city. By fi tting identifi ca-tion IC tags on all of the rent-a-cycles (1.250 units), and by linking all the docks to a communication network, circulation and inventory can be controlled at a central point. In addition, by interfacing the bicycle parking system with the local trans-por tation system, railway prepaid IC cards “IruCa”, can be used to pay the rent-a-cycle fees. This will provide a seamless environment for rent-a-cycle users and train users.* Community Bicycle Programs: “Community Bicycle Programs” are a type of a rent-a-cycle where the renting and return can be done at any of the multiple bicycle docks. In Japan, it is
Business Activities
TimeP@CK-iC
12
anticipated that the system will complement public transportation mainly in urban areas and be developed as the “last mile” transportation means.
*IruCa is a registered Trademark of the Taka-matsu-Kotohira Electric Railroad Co. Ltd.
Renting and returning can be done at any dock!Rent
Return
B station dock
A station dock
IC Tag
Environmental Systems
Domestic Manufacturers are Accelerat-ing Production Shift Towards AsiaDemand for standard Dust Collectors are expandingAmid the production shift to Asia by the domestic manufacturers, in or-der to expand the market, Amano’s Asian sales promotion team has been concentrating in the prompt capturing of such information and to co-ordinate efforts with Amano’s overseas network to provide total suppor t from equipment installa-tions to engineering.For instance in Indonesia, where Japanese motorcycle manufacturers represent 95% of the market share, increased its production capacity to meet the rising domestic demand. Several hundred dust collectors were installed as part of a package of new machine tools and parts ma-chining equipment. At Amano, sales and engineering abilities are being actively enhanced at overseas subsidiaries and efforts are being concentrated to develop and expand into new Asian markets such as Vietnam and India.
Filterless Mist Collector MJ series
An installation example
Clean Systems
A New Floor Care System that Pursue Cost Benefi tsAmano Green Coating SystemThe main concerns regarding rou-tine and daily cleanliness are shifting to “labor-saving”, “energy-saving”, and ”environment-saving”. In addi-tion, amid the ongoing reductions of cleaning costs by large shopping centers, department stores, super-markets, convenience stores, these commercial facilities and retailers are adopting ceramic fl oors and self-cleaning. At Amano, in order to respond appropriately to such changes, in addition to the existing “dry care system” for commercial facilities, has added and promoting a new self-cleaning package based on the new “Amano Green Coating System”. It is a comprehensive system designed to support the user from the initial fl oor treatment, to the daily and pe-riodic maintenance.
Before treatment
After treatment
Ultravioletirradiation
Domestic Group Companies
Reducing Administrative Costs and Im-proving Effi ciency for Medium / Small Businesses “Cloud T&A service CYBER XEED – “Smart “T&AAmano Business Solutions CorporationApril 2011, Amano launched its Cloud T&A ser vice the “CYBER XEED - Smart T&A”. This is the inexpensive version of “Cloud Computing CYBER XEED” and it is a new service to cater for the needs of medium to small size businesses. It comes with speedy operations with high security. In wake of the East Japan Great Ear thquake, which struck March 2011, many corporations have be-come more aware of the impor-tance of Business Continuity Plans
(BCP) and as a result increasing number of corporations are divert-ing or diversifying risk by relocating their information system servers outside of the company. This cloud T&A service from Amano will operate with just an Internet connection via an Internet browser. The user does not need a server to upload the service nor a software license, thus being cost friendly. The service is answering to the needs of many companies.
Superior
PC IC Card Reader
HR
Time Recorder
Internet
Data Center
Operations Control Center
Privacy mark certification
AdministrativeT&A
Center
DataAggregation
Payroll
Approval
Overseas Group Companies
The First Step to Start Further Growth - Commemorating their 40th AnniversaryHoroquartz S.A. FranceHoroquartz S.A., a subsidiary of Ho-romart France, has been a member of the Amano Group since January 2008 and plays a vital role in ex-panding Information Systems busi-ness, commemorated its 40th anni-versary in May 2011. Horoquartz is now fi rmly established as the No.1 T&A system integrator in France. The ceremony slogan was “40 years of Confidence”. Over the year s Horoquar tz has built trust from customer satisfaction and maintain-ing that trust has led to confi dence for fur ther growth. This ceremony marks the fi rst step in this endeavor. As a core company to globalize Amano’s Information Systems busi-ness, Horoquartz’s operations will no longer be exclusive to France, but will expand across Europe.
40th Anniversary celebration
Mr. Hubert de Rugy, CEO Horoquartz S.A. France, giving his speech at their 40th Anniver-sary celebration

13
Amano USA Holdings, Inc.
Amano Cincinnati Inc. – Amano Time Business Unit New Product LaunchThe New Time Guardian Series is an expandable employee time management system that automates the collection, calculation, and preparation of time data for processing payroll. This scalable time & attendance software provides businesses add-on options such as employee upgrade, user upgrade, web interface, advanced scheduling, advanced overtime and the ability to integrate with Amano’s Nexus Lite, Nexus 220 and AmanoNet.PIX Series marks a new generation in time recorders. This electronic time recorder has the ability to synchronize to the Atomic Clock and provides voice activated programming for easy setup! The PIX-75 automatically adjusts year, month, date and Daylight Sav-ings. This clocks prints in regular or military time, with minutes, hundredths, twentieths or tenths, you choose! Three year bat-tery backup for program…”set it and forget it”.
Next Generation in Access ControlACI has successfully launched the Nexus Lite to various mar-kets including healthcare, professional offi ces, retail, locksmiths, education and security. Nexus Lite was designed with real-
time web based access control. This system manages up to 8 doors (expandable), 16 readers with anti-pass back, supports 1,000 users (3 cards per user) with the capacity to buffer the last 5,000 event transactions.
Success StoriesACI adopted a new business strategy to effectively improve our Dealer Network Channel. In doing so we have success-fully aligned our Time Business Unit with Intuit, Inc to market QuickBooks Pro, Payroll and Merchant Services combined with Amano’s Time and Attendance Solutions. A C I p a r t n e r e d w i t h S P Richards, the world’s leading wholesaler of offi ce and com-puter supplies to the retail stationery dealer. SP Richards distributes over 30,000 busi-ness products to a network of over 7,000 resellers in the United States and Canada. ACI currently has 32 sku’s online.The TS-3000i made headway in the financial market and now has taken a life of its own in the Health care industry. Hospital Corporation of America (HCA), one of the nation’s fi rst hospital companies has sought out Amano for 200 units of the TS-3000i. HCA has approximately 164 hospitals and 106 freestanding surgery centers in 20 states, including Great Britain. The TS-3000i is being used for emergency entrance areas and chest pain trauma centers. Black Box Corporation, a world leader in communications and infrastructure products and solutions has agreed to distribute Amano’s TS-3000i under private label. Black Box’s Auto-Sync Time Clock (ASTC3000) is being sold to numerous markets including banks, investment brokers, casinos, hospitals and 911 call centers. The PoE version is also available through Black Box. Time Guardian Pro made a tremendous mark in 2010. Surgi-cal Care Affiliates, LLC (SCA) purchased the easy-to-use workforce management suite to operate in their headquarters
in Birmingham, AL. The MTX-15 termina ls were insta l led in 150 ambulatory surgical centers and surgi-cal hospitals. Pacific Health Corp in Tustin, CA has sought Amano for a comprehensive time & attendance system that will accommodate their 4 locations.
ACCU-TIME SYSTEMS, INCATS joins Amano GroupA c c u - T i m e S y s t e m s , I n c . (ATS), a trusted global leading developer, manufacturer, and supplier of biometric and non-biometric terminals to the Time and Attendance and Workforce Management industry, based in Ellington CT joined Amano Group in March, 2010. ATS will provide a good synergy effect to Amano’s sales channels for time and workforce management.
New Product LaunchAccu-Time Systems antici-pates growth opportunities in expanding markets with its introduction of three new products . The PAYmate™ t ime and at tendance terminal is targeted at small companies requiring fast
installation and ease-of-use. The AccuTouch™ offers a new biometric optical fi ngerprint reader designed to read fi ngers previously unreadable by conventional sensors. Cesium™, an Oracle Validated Product, is a total hardware and software so-lution that allows ATS terminals to seamlessly integrate directly with Oracle PeopleSoft Enterprise software in use around the world. IMS Research, a supplier of market research and consultancy services, recently ranked ATS as the second largest workforce management hardware vendor in the Americas market at nearly 10% market share.
Success StoriesA major fast food restaurant chain in the United Kingdom chose Accu-Time Systems’ Maximus workforce management terminal for its 1200 locations. ATS supplied the Maximus with certain custom modifi cations that meet the restaurant chain’s strict specifi cations. Also in The UK, a hospitality group chose Maximus for its 1100 public house chain. This application is one of the largest biometric implementations in ATS history.A major mass merchandise retailer with locations around the world has renewed its service and support agreement with Accu-Time Systems for its Optimus workforce management terminals. Also renewing its maintenance agreement with ATS is a multi-national pharmacy and consumer products chain that also uses ATS’ Optimus terminal.
Amano McGann, Inc. – ParkingGeneralThe economy stabilized a bit in 2010 but unfortunately new construction did not rebound which had a nega-tive impact on the parking systems business. Even with these challenges the organization as a whole worked hard to win new customers and to maintain our existing base. This was accomplished through the strong management of our
established channels of Branch, Dealer, National Accounts, and Vertical Markets resulting in another profi table year. The focus on vertical markets expanded in 2010 to included several advancements in not only new product development but also the successful launch of several strategic alliances. Both the development and alliances enhanced the core AMI product offering and are now fully integrated.
Strategic AlliancesPark AssistPark Assist, the world leader of parking guidance, has joined forces with AMI as the exclusive representation in the US and Canadian markets. Unique features of the Park Assist solution include the use of imaging to recognize an occupied space as well as reading the license plate of the vehicle. Patrons have the ability to fi nd their car by entering a license plate number at the kiosk or the AMI Pay Station. When integrated with LPR, the M3 can relate the location of the vehicle to the ticket allowing the operator to charge different rates based on location without the need for nesting lanes. The partnership between AMI and Park Assist was strengthened with the in-stallation of the fi rst M3 products in the United States in 2010.
AVPMThe partnership with Automated Valet adds the advantage of combining the leader of valet automation with the strength of the AMI distribution net-work. The AVPM advantage includes the unique feature of collecting images
of vehicle damage automatically at the entrance or manually with an iPod touch, iPad, or iPhone with the Amano Valet application. The application can scan 2D barcode tickets with the iPhone / iPod camera or linear barcode with the scanner / credit card attachment for the iPod touch. Other key features of the Valet system include the convenience of requesting your vehicle via text message, email, or cell phone; employee time and attendance tracking, and populating vehicle information when scanning the VIN barcode. Development has started on integration for the processing of bar code valet tickets and validations in the AMI Pay Station.
Product DevelopmentiConnect®
Development of the iConnect® Software was completed and launched which allowed the integration with on-line partners to sell prepaid parking and discounts at the exit. For example, an integrated solution with a third party operator allows a pa-tron to purchase parking online and gain access to the facility with a barcode printed at their convenience. The iConnect® application has also been integrated with third party web sites to allow bar code coupons to be distributed on-line and used at the exit.
PCI / PA-DSSNow listed on the PCI website, AMI continues to provide secure products where electronic security is of the utmost importance. Through countless hours of working with our PCI certifi ed assessor, AMI has achieved PA-DSS validation for all of our software and hardware products. The major card brands and the PCI council have created a very rigorous process to insure credit card security and AMI will continue to stay in front on PCI security issues to ensure client satisfaction.
Success StoriesAmano McGann continues to employ new technology and industry leading products to secure success with major projects across the country. Significant installations include: Westchester’s Ridge Hill in Yonkers with multiple Pay Stations and a custom re-entry feature, over fi fty AMI credit card read-ers for DC’s transportation authority with another seventy slated in the coming year, and Chicago’s Prentice Hospital
14
barcode tickets. Ease of integra-tion and remote serviceability are two of the several great and innovative benefits this system offers.With Astrow 2013, the next ver-sion of the proven T&A software for small and medium sized busi-nesses with an installed base of more than 5.000 customers in Europe, Amano Europe resolutely goes for the SaaS and cloud computing business concept, incorporating WEB2.0 technolo-gies. Astrow 2013 will continue to be the pan-European T&A solution for the SME market. The ability to integrate to 3rd party solutions, the ease of installation and the introduction of mobile solutions are key objectives in order to suite the modern and complex market needs.
Horoquartz, S.A.In France the major event of the past twelve months was the celebration of the 40th anniversary of Horoquartz. Customers and staff were separately invited on the banks of the Seine River in Paris, next to the Eiffel tower, under the slogan “40 years of confi dence”.Keep customers and staff loyal is indeed the key for a company that offers services (70% of sales) and expertise.Customers themselves made presentations to explain how the Workforce Management solutions of Horoquartz did contrib-ute to create new values in their companies: added value (cost reduction) and human value (user satisfaction).The day after the 330 staff members and 10 group delegates from Japan and Europe gathered for the private celebration. In his speech Mr. Haruta congratulated the teams for their com-mitment and results and Mr. Nakajima expressed his confi -dence in the international expansion of Horoquartz integrated solutions.For a moment the teams became actors and showed through short theater scenes how the human values in the company could help bringing satisfaction and added value to the cus-tomers.
Scopus-Omnibadges,S.A.For Scopus Omnibadges this fi scal year was a year of expan-sive growth. In January 2010 Scopus Omnibadges acquired Prescard. This company was able to meet the requirements of customers in market segments such as fashion houses, perfumes, jewelers, and airline companies. Printing technologies like silk screen and hot stamping met the demands that Scopus Omnibadges could not accommodate untill now. Especially the ability to print metallic paint, like gold, and the ability to print holograms on the cards allow Scopus Omnibadges to approach and serve new markets. In January 2011 Scopus Omnibadges acquired the ID solutions division of Sogedex. With this acquisition Scopus Omnibadges clearly expanded its service offering by having now the ability to offer, implement and support its own software packages for creating and manipulating card data. As such Scopus Omni-badges has reached the unique position in France and Europe of being a one-stop-shop that can both create cards and offer integrated card and data security solutions at the same time. Scopus Omnibadges is now ready to pursue its international strategy.As a result of these two acquisitions and of a steady growth in the core business, Scopus Omnibadges will double its turnover in 2012, compare to the turnover in 2010.
Amano UK. LTD.“The set-up of the direct business in the UK is well underway with new offi ces established for both Time and Parking Divi-sions. The Time Division has recruited a sales team of 8, now starting to take regular orders of the newly refreshed Astrow
which features both valet and FlexScan integration with the AMG-7800 to allow valet payments and automatic vehicle call down through the Central Pay Station.The company continued to expand its reach in the Airport market with major installations at Van Nuys Airport in Los Angeles, Lynden Pindling International Airport in Nassau, Bahamas, and Denver Green Park which included FlexScan integration with pre-pay application and the Frequent Parker Program.AMI is also fi nding success through its strategic partnerships. Installation of the M³ system at Santa Monica Place in Cali-fornia gained national press coverage for state-of-the-art parking guidance technology and the first Find Your Car solution in the US.
Parking Summit The fi scal year of 2010 ended on a high note by hosting the Amano Parking Summit in Las Vegas, Nevada. Amano Mc-Gann personnel and distribu-tion teams from all around the country joined forces to get up to speed on the AMI corpo-
rate vision, improved sales techniques, and the latest product introductions. The Summit was an action packed event that included two full days of information rich presentations, hands on breakout sessions to increase product familiarity, and the announcement of the iPad 2 as a sales tool.Each Summit attendee received pre-loaded iPad 2’s contain-ing various sales related content and videos. Use of the iPad 2 in the fi eld puts knowledge and power into the hands of each sales professional resulting in a more enticing sales pitch with marketing materials available in several new and exciting formats.The sales meeting provided an opportunity to connect with the sales team and distribution partners, reinforce goals and promote sales strategies. The Summit was received positively by all who were present, so much so that many agreed that the Summit was the best seminar they had ever attended. At-tendees left Las Vegas feeling energized, highly motivated and full of knowledge. “This was one of the most informative, educational, positive meetings that I’ve ever attended.” -Greg Brewer, Carolina Time. “The information provided including presentations, breakout sessions and networking with colleagues was invalu-able.” -Curtis Bateson, Parking Systems Division - Western Canada, Amano Cincinnati Canada Inc.
Best In Show IIAMI raised the bar by earning the prestigious “Best in Show” award once again at both the Canadian Parking Show and the parking industry’s major trade show, The International Parking Institute. AMI brightened up the parking shows with a neon theme to compliment the IPI’s Las Vegas location. The neon elements were created by local artist Matt Thomp-son and added to a display that was fabricated by AMI personnel.
Amano Europe Holdings, N.V.
Also in this fi scal year Amano Europe continued to invest in both parking solutions and new time and attendance products. The X-Parc parking solution has now been installed success-fully in 18 different countries, including Malaysia and Australia. With X-Parc Amano Europe is able to offer a robust, fl exible and network centric solution based on Linux technology and
Suite as well as Access Control and ID Card management. The Time Division has developed a webshop and ever-increasing network of independent dealers for traditional time recorder sales. In the Car Parking Division Amano is focussing on introducing a rental solution into the market place and is already winning sizeable installations at local councils as well as private car parks. The team is focussed on providing
excellence in Customer Care and through the sa les and engineer ing team is quickly migrating maintenance agreements for Customers so that they can now deal with Amano.”
Amano Korea Corporation
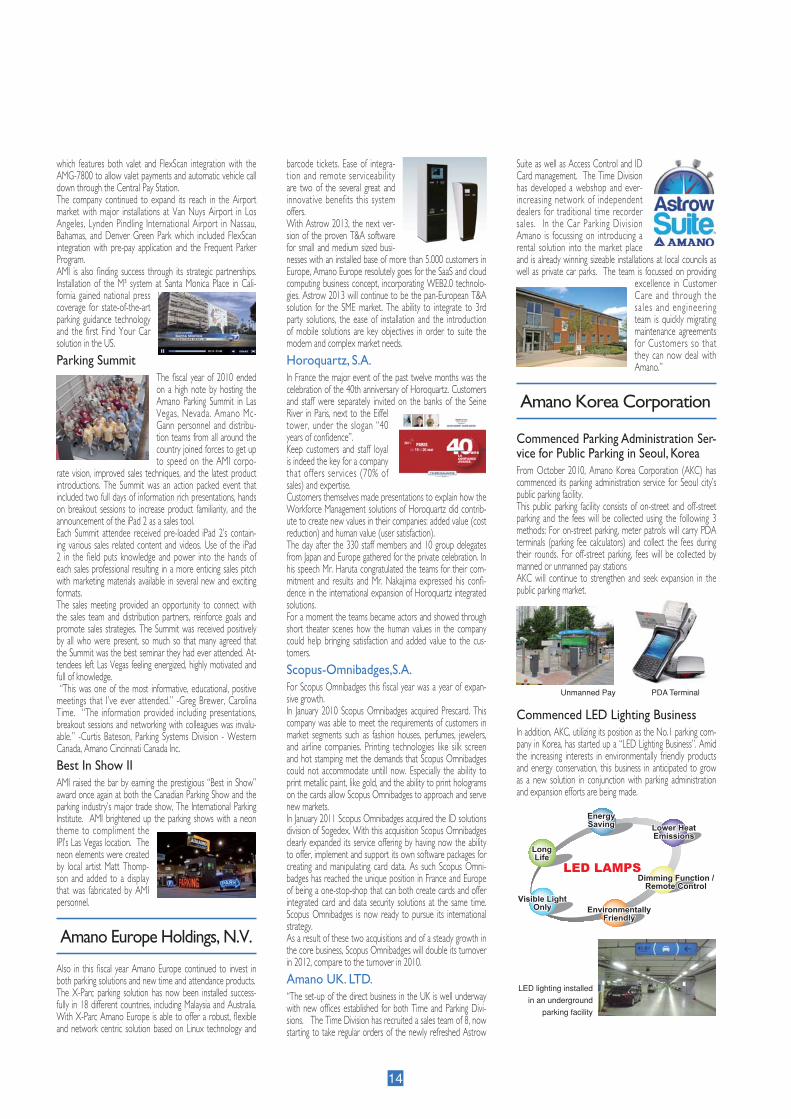
Commenced Parking Administration Ser-vice for Public Parking in Seoul, KoreaFrom October 2010, Amano Korea Corporation (AKC) has commenced its parking administration service for Seoul city’s public parking facility.This public parking facility consists of on-street and off-street parking and the fees will be collected using the following 3 methods: For on-street parking, meter patrols will carry PDA terminals (parking fee calculators) and collect the fees during their rounds. For off-street parking, fees will be collected by manned or unmanned pay stationsAKC will continue to strengthen and seek expansion in the public parking market.
Commenced LED Lighting BusinessIn addition, AKC, utilizing its position as the No.1 parking com-pany in Korea, has started up a “LED Lighting Business”. Amid the increasing interests in environmentally friendly products and energy conservation, this business in anticipated to grow as a new solution in conjunction with parking administration and expansion efforts are being made.
LED LAMPSLED LAMPS
EnergyEnergySavingSaving Lower HeatLower Heat
EmissionsEmissions
Dimming Function /Dimming Function /Remote ControlRemote Control
EnvironmentallyEnvironmentallyFriendlyFriendly
Visible LightVisible LightOnlyOnly
LongLongLifeLife
LED LAMPS
EnergySaving Lower Heat
Emissions
Dimming Function /Remote Control
EnvironmentallyFriendly
Visible LightOnly
LongLife
PDA TerminalUnmanned Pay
LED lighting installed
in an underground
parking facility
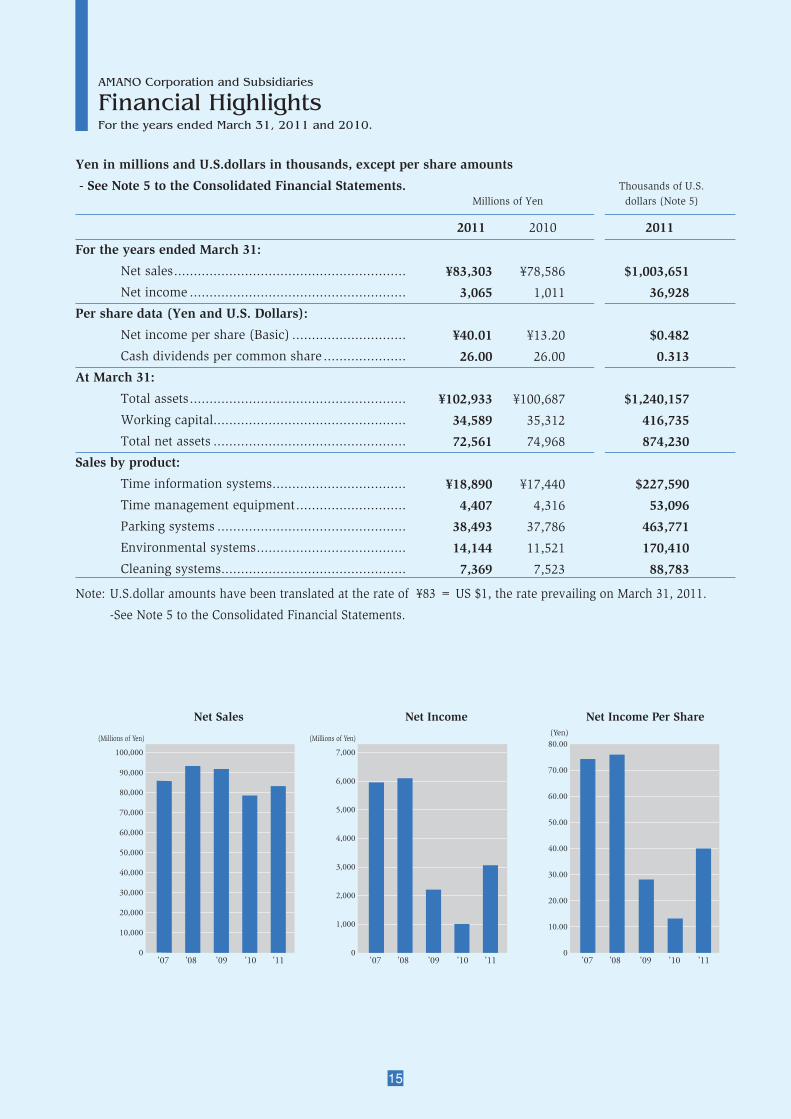
Yen in millions and U.S.dollars in thousands, except per share amounts
- See Note 5 to the Consolidated Financial Statements.
Note: U.S.dollar amounts have been translated at the rate of ¥83 = US $1, the rate prevailing on March 31, 2011.
-See Note 5 to the Consolidated Financial Statements.
15
AMANO Corporation and Subsidiaries
Financial HighlightsFor the years ended March 31, 2011 and 2010.
2011 2010 2011
For the years ended March 31:
Net sales ...........................................................
Net income .......................................................
Per share data (Yen and U.S. Dollars):
Net income per share (Basic) .............................
Cash dividends per common share .....................
At March 31:
Total assets .......................................................
Working capital .................................................
Total net assets .................................................
Sales by product:
Time information systems ..................................
Time management equipment ............................
Parking systems ................................................
Environmental systems ......................................
Cleaning systems ...............................................
'10'08 '09'07 '11
Net Sales Net Income Net Income Per Share
'10'08 '09'07 '11 '10'08 '09'07 '11
(Millions of Yen) (Millions of Yen)(Yen)
0
10,000
20,000
30,000
40,000
50,000
60,000
70,000
80,000
90,000
100,000
0
1,000
2,000
3,000
4,000
5,000
6,000
7,000
0
10.00
20.00
30.00
40.00
50.00
60.00
70.00
80.00
¥83,303
3,065
¥40.01
26.00
¥102,933
34,589
72,561
¥18,890
4,407
38,493
14,144
7,369
¥78,586
1,011
¥13.20
26.00
¥100,687
35,312
74,968
¥17,440
4,316
37,786
11,521
7,523
Millions of Yen dollars (Note 5)Thousands of U.S.
$1,003,651
36,928
$0.482
0.313
$1,240,157
416,735
874,230
$227,590
53,096
463,771
170,410
88,783
16
AMANO Corporation and Subsidiaries
Consolidated Balance SheetsAs at March 31, 2011 and 2010.
ASSETS 2011 2010 2011
Current assets:
Cash and bank deposits .....................................
Marketable securities .........................................
Notes and accounts receivable:
Trade .............................................................
Less allowance for doubtful accounts ..............
Inventories........................................................
Deferred tax assets ............................................
Other current assets ..........................................
Total current assets .......................................
Property, plant and equipment, at cost:
Buildings and structures ....................................
Machinery and equipment .................................
Lease assets .....................................................
Less accumulated depreciation .......................
Land .................................................................
Construction in progress ....................................
Total property, plant and equipment ..............
Intangible fi xed assets :
Goodwill ...........................................................
Software ...........................................................
Software in progress ..........................................
Other intangible fi xed assets ..............................
Total intangible fi xed assets ...........................
Investments and other assets:
Investments in unconsolidated subsidiaries and affi liates .......
Investments in securities ...................................
Leasehold and guarantee deposits ......................
Deferred tax assets ............................................
Other assets ......................................................
Less allowance for doubtful accounts .................
Total investments and other assets .................
Total ............................................................................
¥27,265
1,190
21,145
(130)
21,015
6,327
1,321
1,672
58,790
27,511
17,975
2,641
48,127
(33,123)
15,004
7,155
298
22,457
5,455
2,849
337
1,148
9,789
794
4,023
1,081
2,070
4,357
(428)
11,897
¥102,933
¥23,676
1,227
21,134
(214)
20,920
6,016
1,106
1,790
54,735
27,803
19,643
1,711
49,157
(33,445)
15,712
7,161
83
22,956
6,777
4,174
279
672
11,902
803
3,712
1,093
2,334
3,626
(474)
11,094
¥100,687
$328,494
14,337
254,759
(1,566)
253,193
76,229
15,916
20,144
708,313
331,458
216,566
31,819
579,843
(399,072)
180,771
86,205
3,590
270,566
65,723
34,325
4,060
13,832
117,940
9,566
48,470
13,024
24,940
52,495
(5,157)
143,338
$1,240,157
Millions of Yen dollars (Note 5)Thousands of U.S.
The accompanying notes are an integral part of these statements.
17
LIABILITIES AND NET ASSETS 2011 2010 2011
Current liabilities:Trade notes and accounts payable ......................Short-term bank loans .......................................Lease obligations ...............................................Accrued expenses ..............................................Accrued income taxes ........................................Provision for loss on casualty .............................Other current liabilities ......................................
Total current liabilities ...................................
Long-term liabilities:Long-term loans payable ....................................Accrued retirement benefi ts to employees ...........Long-term accounts payable ..............................Lease obligations ...............................................Deferred tax liabilities ........................................Asset retirement obligations ...............................Other long-term liabilities ..................................
Total long-term liabilities ...............................
Net assets:Shareholders' equity:
Common Stock Authorized- 185,476,000 shares Issued: March 31, 2011 - 81, 257, 829 shares ............ March 31, 2010 - 81, 257, 829 shares ............Capital surplus ..............................................Retained earnings .........................................Treasury stock at cost, 4,660,922 shares in 2011and 4,658,707 shares in 2010 ........................
Accumulated other comprehensive incomeNet unrealized gains (losses) on other securities ....Foreign currency translation adjustments ........
Minority interests in consolidated subsidiaries ....
Total net assets .............................................
Total ............................................................................
¥10,031 1,715 540 4,741 2,049 15 5,110 24,201
11 3,454 272 1,749 300 16 369 6,171
18,240 – 19,567 46,968
(3,719) 81,056
(154) (8,501) (8,655)
160
72,561
¥102,933
$120,855 20,663 6,506 57,120 24,687 181 61,566 291,578
133 41,614 3,277 21,072 3,614 193 4,446 74,349
219,759 – 235,747 565,880
(44,807) 976,579
(1,855) (102,422) (104,277)
1,928
874,230
$1,240,157
Millions of Yen dollars (Note 5)Thousands of U.S.
The accompanying notes are an integral part of these statements.
¥9,009 19 476 4,608 679 – 4,632 19,423
25 3,884 541 1,231 362 – 253 6,296
– 18,240 19,567 45,895 (3,717) 79,985
(118) (5,966) (6,084)
1,067
74,968
¥100,687

18
AMANO Corporation and Subsidiaries
Consolidated Statements of Income, andConsolidated Statement of Comprehensive IncomeFor the years ended March 31, 2011 and 2010.
2011 2010 2011
Net sales ..................................................................... Cost of sales ................................................................
Gross profi t ...................................................Selling, general and administrative expenses ..............
Operating income ..........................................Other income ( expenses ) :
Interest and dividend income ............................Interest expense ...............................................Equity in earnings of affi liates ...........................Foreign exchange losses ...................................Gain on sale of fi xed assets ...............................Loss on disposal of fi xed assets .........................Loss on sale of fi xed assets ...............................Gain on sale of investments in securities ...........Loss on sale of investments in securities ............Loss on write-down of investments in securities .Gain on negative goodwill ................................Loss on transfer of business ...............................Other, net ........................................................
Income before income taxes and minority interests ....Income taxes :
Current .............................................................Deferred ...........................................................
Income before minority interests ....................Minority interests in net income of consolidated subsidiaries
Net income
Net income per share, basic .........................................Cash dividends per common share ..............................
¥83,303 46,692 36,611 32,228 4,383
139 (37) 36 (170) 8 (59) (3) – 0 (126) 990 129 174 5,464
2,274 (31) 3,221 (156) ¥3,065
¥40.01 26.00
¥78,586 44,654 33,932 32,005 1,927
143 (31) 57 – 4 (25) (8) 1 – (56) – – 354 2,366
938 250 1,178 (167) ¥1,011
¥13.20 26.00
Millions of Yen dollars (Note 5)Thousands of U.S.
The accompanying notes are an integral part of these statements.
U.S. dollars (Note 5)Yen
$1,003,651 562,554 441,097 388,289 52,808 1,675 (446) 434 (2,048) 96 (711) (36) – 0 (1,518) 11,928 1,554 2,096 65,832 27,398 (373) 38,807 (1,879) $36,928
$0.482 0.313
2011 2011
Income before minority interests .................................
Other comprehensive incomeNet unrealized gains (losses) on other securities ....Translation adjustments ....................................Share of other comprehensive income of companiesaccounted for by the equity-method ........................
Total other comprehensive income ..................Comprehensive income ...............................................
Total comprehensive income attributable to:Shareholders of the Company ............................Minority interests ..............................................
Millions of Yen dollars (Note 5)Thousands of U.S.
¥3,221 (36) (2,539)
(8)
(2,583) ¥638
¥494 ¥144
$38,807
(434) (30,590)
(96) (31,120) $7,687
$5,952 $1,735
Consolidated Statement of Comprehensive Income
Consolidated Statements of Income

19
AMANO Corporation and Subsidiaries
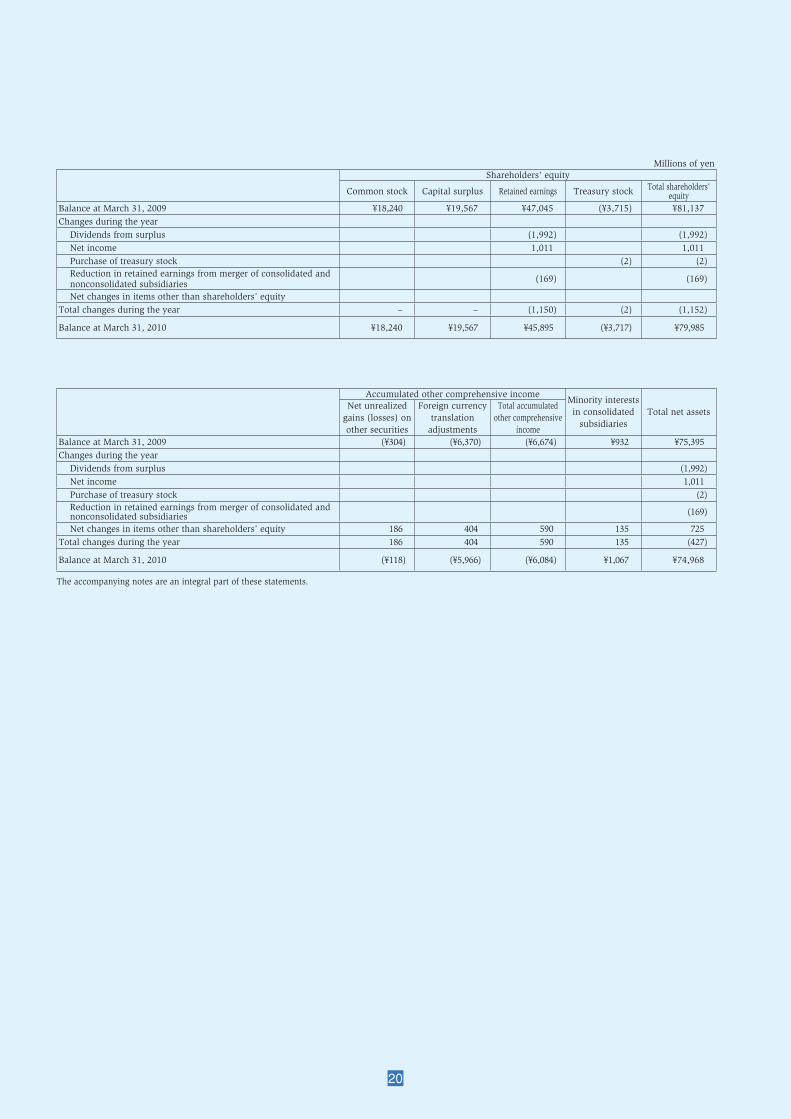
Consolidated Statements of Net AssetsFor the years ended March 31, 2011 and 2010.
Millions of yen Shareholders’ equity
Common stock Capital surplus Retained earnings Treasury stock Total shareholders’equity
Balance at March 31, 2010 ¥18,240 ¥19,567 ¥45,895 (¥3,717) ¥79,985Changes during the year
Dividends from surplus (1,992) (1,992)Net income 3,065 3,065Purchase of treasury stock (2) (2)Net changes in items other than shareholders’ equity
Total changes during the year – – 1,073 (2) 1,071
Balance at March 31, 2011 ¥18,240 ¥19,567 ¥46,968 (¥3,719) ¥81,056
Accumulated other comprehensive incomeMinority interests in consolidated
subsidiariesTotal net assets
Net unrealized gains (losses) on other securities
Foreign currency translation
adjustments
Total accumulated other comprehensive
incomeBalance at March 31, 2010 (¥118) (¥5,966) (¥6,084) ¥1,067 ¥74,968Changes during the year
Dividends from surplus (1,992)Net income 3,065Purchase of treasury stock (2)Net changes in items other than shareholders’ equity (36) (2,535) (2,571) (907) (3,478)
Total changes during the year (36) (2,535) (2,571) (907) (2,407)
Balance at March 31, 2011 (¥154) (¥8,501) (¥8,655) ¥160 ¥72,561
Accumulated other comprehensive incomeMinority interests in consolidated
subsidiariesTotal net assets
Net unrealized gains (losses) on other securities
Foreign currency translation
adjustments
Total accumulated other comprehensive
incomeBalance at March 31, 2010 ($1,421) ($71,880) ($73,301) $12,855 $903,229
Changes during the yearDividends from surplus (24,000)
Net income 36,928
Purchase of treasury stock (24)
Net changes in items other than shareholders’ equity (434) (30,542) (30,976) (10,927) (41,903)
Total changes during the year (434) (30,542) (30,976) (10,927) (28,999)
Balance at March 31, 2011 ($1,855) ($102,422) ($104,277) $1,928 $874,230
Thousands of U.S. dollars (Note 5)Shareholders' equity
Common stock Capital surplus Retained earnings Treasury stock Total shareholders' equity
Balance at March 31, 2010 $219,759 $235,747 $552,952 ($44,783) $963,675 Changes during the year
Dividends from surplus (24,000) (24,000)Net income 36,928 36,928 Purchase of treasury stock (24) (24)Net changes in items other than shareholders’ equity
Total changes during the year – – 12,928 (24) 12,904
Balance at March 31, 2011 $219,759 $235,747 $565,880 ($44,807) $976,579
The accompanying notes are an integral part of these statements.
20
Millions of yen Shareholders' equity
Common stock Capital surplus Retained earnings Treasury stock Total shareholders' equity
Balance at March 31, 2009 ¥18,240 ¥19,567 ¥47,045 (¥3,715) ¥81,137Changes during the year
Dividends from surplus (1,992) (1,992)Net income 1,011 1,011 Purchase of treasury stock (2) (2)Reduction in retained earnings from merger of consolidated and nonconsolidated subsidiaries (169) (169)
Net changes in items other than shareholders’ equityTotal changes during the year – – (1,150) (2) (1,152)
Balance at March 31, 2010 ¥18,240 ¥19,567 ¥45,895 (¥3,717) ¥79,985
Accumulated other comprehensive incomeMinority interests in consolidated
subsidiariesTotal net assets
Net unrealized gains (losses) on other securities
Foreign currency translation
adjustments
Total accumulated other comprehensive
incomeBalance at March 31, 2009 (¥304) (¥6,370) (¥6,674) ¥932 ¥75,395 Changes during the year
Dividends from surplus (1,992)Net income 1,011 Purchase of treasury stock (2)Reduction in retained earnings from merger of consolidated and nonconsolidated subsidiaries (169)
Net changes in items other than shareholders’ equity 186 404 590 135 725 Total changes during the year 186 404 590 135 (427)
Balance at March 31, 2010 (¥118) (¥5,966) (¥6,084) ¥1,067 ¥74,968
The accompanying notes are an integral part of these statements.
21
AMANO Corporation and Subsidiaries
Consolidated Statements of Cash FlowsFor the years ended March 31, 2011 and 2010.
2011 2010 2011
Cash Flows from Operating Activities:Income before income taxes and minority interests ..........Adjustments to reconcile income before income taxes andminority interests to net cash provided by operating activities:
Depreciation and amortization ...................................Amortization of goodwill ...........................................Increase (decrease) in provision for accrued retirement benefi ts .Increase (decrease) in allowance for doubtful accounts ...Interest and dividend income ....................................Equity in earning of affi liates .....................................Interest expenses ......................................................Foreign currency translation (gain) loss ......................(Gain) Loss on sale of investments in securities ..........Loss on write-down of investments in securities .........(Gain) Loss on sale of fi xed assets .............................Loss on disposal of fi xed assets ..................................(Gain) Loss on transfer of business ............................Gain on negative goodwill .........................................(Increase) decrease in trade notes and accounts receivable ...(Increase) decrease in inventories ..............................Increase (decrease) in trade notes and accounts payable .Others ......................................................................Subtotal ....................................................................Interest and dividends received ..................................Interest paid .............................................................Payment for extra retirement payments ......................Income taxes paid .....................................................Income taxes refund ..................................................Net cash provided by operating activities ...................
Cash Flows from Investing Activities:Payment for purchase of marketable securities ...........Proceeds from redemption of marketable securities .....Payment for purchase of property and equipment .......Proceeds from sale of property and equipment ...........Payment for acquisition of intangible assets ...............Payment for acquisition of investments in securities ...Proceeds from sale of investments in securities ...........Proceeds from redemption of investments in securities ...Payment for acquisition of investments in subsidiaries ....Increase in time deposits ...........................................Decrease in time deposits ..........................................Loans to third parties ................................................Collection of loans ....................................................Others .....................................................................Net cash used in investing activities ..........................
Cash Flows from Financing Activities:Proceeds from short-term bank loans .........................Repayment of short-term bank loans ..........................Proceeds from long-term debt ....................................Repayment of long-term debt .....................................Payment for acquisition of treasury stock ...................Repayments of fi nance lease obligations .....................Dividends paid ..........................................................Dividends payment to minority interests ....................
Net cash used in fi nancing activities ......................Effect of exchange rate changes on cash and cash equivalents .............Net increase (decrease) in cash and cash equivalents .........................Cash and cash equivalents at beginning of year ..................................Increase in cash and cash equivalents from newly consolidated subsidiary .......Increase in cash and cash equivalents resulting from merger ofconsolidated subsidiary and unconsolidated subsidiary .......................Cash and cash equivalents at end of year ...........................................
¥5,464
4,351 718 (410) (46) (139) (36) 37 (43) 0 126 (5) 59 129 (990) (585) (453) 1,150 1,428 10,755 206 (37) – (1,084) 445 10,285
(2,000) 2,000 (805) 18 (1,445) (636) – – (1,619) (5,569) 4,380 (18) 22 14 (5,658) 1,906 (6) – (10) (2) (523) (1,992) (21) (648) (419) 3,560 20,933 –
121 ¥24,614
$65,832
52,422 8,651 (4,940) (554) (1,675) (434) 446 (518) 0 1,518 (60) 711 1,554 (11,928) (7,048) (5,458) 13,855 17,204 129,578 2,482 (446) – (13,060) 5,361 123,915
(24,096) 24,096 (9,699) 217 (17,410) (7,663) – – (19,506) (67,096) 52,771 (217) 265 169 (68,169) 22,964 (72) – (120) (24) (6,301) (24,000) (254) (7,807) (5,047) 42,892 252,204 –
1,457 $296,553
Millions of Yen dollars (Note 5)Thousands of U.S.
The accompanying notes are an integral part of these statements.
¥2,366
4,676 667 (329) 28 (143) (57) 31 (2) (1) 56 4 25 – – 2,661 534 (0) (507) 10,009 207 (36) (30) (1,303) 217 9,064 (2,029) 2,000 (1,657) 5 (1,639) (806) 51 700 – (4,625) 5,207 (2) 5 378 (2,412) – (1) 33 (52) (1) (333) (1,992) (37) (2,383) (156) 4,113 16,709 111 – ¥20,933
22
AMANO Corporation and Subsidiaries
Notes to the Consolidated Financial Statements For the years ended March 31, 2011 and 2010
1. Basis of Consolidated Financial Statements
The accompanying consolidated financial statements of AMANO Corporation [hereinafter called "the Company"] and its subsidiaries have been prepared in accordance with the provisions set forth in the Japanese Financial Instruments and Exchange Act and its related ac-counting regulations in Japan. The accounts of the Company and do-mestic subsidiaries included in the consolidation are based on the ac-counting records maintained in ac-cordance with accounting principles generally accepted in Japan, which are different in certain respects as to the application and the disclo-sure requirements of International Financial Reporting Standards. The information in the consolidated fi nancial statements is derived from the original text, scope, and the nature of that information, and is therefore limited to that contained in the original text. However, cer-tain reclassifi cations or summariza-tions of accounts have been made to present the consolidated fi nancial statements in a form which is more familiar to the readers outside Ja-pan.* Supplementary explanation:Effective the year ended March 31, 2011, the Company has applied ASBJ Statement No.25, “Accounting Standard for Presentation of Com-prehensive Income”. In accordance with this new standard, consoli-dated statement of comprehensive income for the year ended March 31, 2010 is not presented. The com-parative information for the year ended March 31, 2010 is disclosed in Note 11, page 27.
7) Amano Pioneer Eclipse Corp. 100% US$ 4,6068) Amano Europe Holdings N.V. 100% EUR 73,8249) Amano Europe N.V. 100% EUR 17,85010) Horosmart S.A. 100% EUR 16,00011) Horoquartz S.A. 100% EUR 20,00012) Horoquartz Marocco S.A. 100% DH 20013) Pial Technologies S.A. 100% EUR 65014) Scopus-Omnibadges S.A.S. 67% EUR 82015) Amano Time & Parking Spain, S.A. 100% EUR 2,51816) Amano Malaysia Sdn.Bhd. 100% MR 2,50017) Amano Cleantech Malaysia Sdn.Bhd. 90% MR 20018) ATAS E & C Services(M) Sdn. Bhd. 100% MR 15019) Amano Time & Air Singapore Pte. Ltd. 100% S$70020) PT. Amano Indonesia 100% US$ 25021) Amano Thai International Co., Ltd. 43% THB 8,00022) Amano International Trading (Shanghai)Co., Ltd. 100% US$ 20023)Amano Korea Corp. 100% W 4,500,00024) Amano Agency Corp. 100% ¥10,00025) Environmental Technology Company 100% ¥20,00026) Amano Management Service Corp. 100% ¥205,00027) Amano Maintenance Engineering Corp. 100% ¥30,00028) Amano Business Solutions Corp. 100% ¥300,00029) Amano Musashi Electric Corp. 100% ¥10,000
2. Principles of Consolidation
(1) Scope of ConsolidationThe Company had 29 consolidated subsidiaries at March 31, 2011; The accompanying consolidated fi nancial statements include the ac-counts of the Company and those of its subsidiaries that are controlled by the Company. Under the con-trol concept, major subsidiaries in which the Company is able to exer-cise control over operations are to be fully consolidated.The accounts of the overseas con-solidated subsidiaries are prepared on the basis of a December 31 fi s-cal year-end, and are consolidated accordingly with the Company at March 31, 2011 and 2010, and for the years then ended. The consolidated subsidiaries that have been consolidated with the Company for the year ended March 31, 2011 are as follows:
Company Name Paid In Capital (Thousands)
Equity ownership
%
1) Amano USA Holdings, Inc. 100% US$ 111,7022) Amano Cincinnati, Inc. 100% US$ 23,1723) Amano Cincinnati Canada, Inc. 100% C$ 4394) Accu-Time Systems, Inc. * 100% US$ 0.83
*The company was newly con-solidated in March 2011.
5) Accu-Tech Systems, Ltd. * 100% £ 0.002
*The company was newly con-solidated in March 2011.
6) Amano McGann, Inc. 100% US$ 46,418
23
Note: Investment in Parkinsys Technology Co., Ltd., a Tai-wanese company, over which the Company has the ability to exercise significant influ-ence (the Company owns 36.6 percent) is accounted for using the equity method.
(2) Accounting for Investments in Unconsolidated Subsid-iaries and Affi liates
None of the 6 unconsolidated sub-sidiaries are accounted for by the equity method, because the effect of their net income or losses and retained earnings on the accompa-nying Consolidated Financial State-ments are immaterial.
(3) Consolidation and EliminationFor the purpose of preparing the consolidated financial statements, all significant intercompany trans-actions, account balances, and unrealized profi ts among the group companies have been eliminated from the consolidated financial statements. Intercompany profit included in the assets sold from the Company to the consolidated subsidiaries has been entirely eliminated and charged against the consolidated earnings of the group companies. Intercompany profit included in the assets sold from the consolidated subsidiaries to the Company has been entirely elimi-nated and the portion applicable to minority interests has been charged against them.
3. Summary of Signifi cant Accounting Policies
(1) Cash and Cash EquivalentsCash and cash equivalents include time deposits whose expiration
dates are within three months.
(2) InventoriesInventories are stated at cost (write-down due to reduced profi tability). Cost is determined principally using the periodic average method.
(3) Property, Plant and EquipmentProperty, plant and equipment are stated at cost, less accumulated de-preciation. Depreciation is comput-ed on the declining balance method, except for buildings acquired from April 1, 1998, computed on the straight -line method based on the estimated useful lives. The ranges of the useful lives of assets are :Buildings 7-50 yearsMachinery and equipment 7-17 yearsCost of property, plant and equip-ment, retired or otherwise disposed of, and related accumulated de-preciation, is eliminated from the respective accounts, and the result-ing gain or loss is reflected in in-come during the applicable period. Normal repairs and maintenance, including minor renewals and im-provements, are charged to income as incurred.
(4) Intangible AssetsIntangible assets are amortized us-ing the straight-line method. Soft-ware costs for internal use are am-ortized by the straight-line method over their expected useful lives (fi ve years). Goodwill is amortized over the estimated useful life, or where the amount of goodwill is immate-rial, is charged to income in the year of acquisition.
(5) Lease AssetsLease assets in fi nance lease trans-actions not involving transfer of ownership are depreciated by the
straight-line method over the term of the lease, with a residual value of zero. Finance lease transactions not involving transfer of owner-ship made prior to the beginning of the first year of application of the revised Accounting Standard for Lease Transaction have been accounted for using the method ap-plied to rental transactions.
(6) Accounting for Financial Instruments
(a) DerivativesAll derivatives are stated at their fair values, with changes in fair value included in net profi t or loss for the period in which they arise.(b) SecuritiesSecurities held by the Company and its subsidiaries are classifi ed into four categories;Trading securities, which are held for the purpose of generating profi ts on short-term differences in prices, are stated at their fair values, with changes in fair values included in net profit or loss for the period in which they arise. Additionally, securities held in trusts for trading purposes are accounted for in the same manner as trading securities.Held-to-maturity debt securities, that the Company and its subsidiaries have intent to hold to maturity, are stated at their costs after accounting for premium or discount on acquisi-tion, which are amortized over the period to maturity. Investments of the Company in equity securities issued by uncon-solidated subsidiaries and affi liates are accounted for by the equity method. Exceptionally, investments in certain unconsolidated subsidiar-ies and affi liates are stated at cost because the effect of application of
24
the equity method would be imma-terial.Other securities for which market quotations are available are stated at fair value. Net unrealized gains or losses on these securities are re-ported as a separate item in the net assets at a net-of-tax amount.Other securities for which market quotations are unavailable are stat-ed at cost, except as stated in the paragraph below. In cases where the fair value of held-to-maturity debt securities, equity securities issued by uncon-solidated subsidiaries and affi liates, or other securities had declined sig-nificantly and such impairment of the value is not deemed temporary, those securities are written down to the fair value and the resulting losses are included in net profi t or loss for the period.
(7) Foreign Currency TranslationForeign currency transactions are translated using foreign exchange rates prevailing at the respective transaction dates. Receivables and payables in foreign currencies are translated at the foreign exchange rates prevailing at the respective balance sheet dates and the result-ing transaction gains or losses are taken into income currently.
(8) Translation of ForeignCurrency FinancialStatements (Accounts of Overseas Subsidiaries)
Foreign currency denominated statements of overseas consolidated subsidiaries have been translated into Japanese yen using the method prescribed by the Business Ac-counting Deliberation Council of Japan. All the balance sheet ac-counts of foreign and affi liates are
translated at the foreign exchange rates prevailing at the respective balance sheet date expect common stock and capital surplus. On the other hand, all the profit and loss accounts are translated at the aver-age foreign exchange rates for the respective periods. Differences aris-ing from translation are presented as “Foreign currency translation ad-justments” and “Minority interests in consolidated subsidiaries” in the accompanying consolidated finan-cial statements.
(9) Income TaxesThe Company recognizes tax effect of temporary differences between the carrying amounts and the tax basis of assets and liabilities. The provision for income taxes is com-puted based on the pretax income included in the consolidated state-ments of income. The asset and lia-bility approach is used to recognize deferred tax assets and liabilities for the expected future tax consequenc-es of temporary differences.
(10) Allowance for Doubtful Accounts
In general, the Company and its subsidiaries provide the allowance based on the past receivables loss experience for a certain reference period. Furthermore, for receiv-ables with fi nancial diffi culty which could affect the debtors' ability to perform their obligations, the allow-ance is provided for estimated unre-coverable amounts individually.
(11) Accrued Retirement Benefi ts to Employees
The Company and some of its Japa-nese subsidiaries recognize accrued pension and severance costs to em-ployees based on the actuarial valu-
ation of projected benefi t obligation and plan assets at fair value. Prior service costs are amortized based on the straight-line method over a period of ten years. Actuarial gains and losses are amortized based on the straight-line method over a pe-riod of ten years starting from the beginning of the subsequent year.
(12) Provision for Loss on Ca-sualty
The Company and its Japanese sub-sidiaries provided for the expenses to reconstruct assets suffered from the Tohoku-Pacific Ocean Earth-quake on March 11, 2011. The ex-penses were estimated based on the extent of the damages.
(13) Research and Develop-ment Expenses
Research and development ex-penses are charged to income as incurred.
(14) Net Income and Dividends per Share
Basic net income per share is com-puted based on the weighted aver-age number of shares of common stock outstanding during each peri-od. Diluted net income per share is computed based on the net income available for distribution to the shareholders and the weighted-av-erage number of shares of common stock outstanding during each year after giving effect to the dilutive po-tential of shares of common stock to be issued upon the exercise of stock subscription rights and stock options. Cash dividends per share shown for each fi scal period in the accompanying consolidated state-ments of income represent actual dividends declared as applicable to the respective fi scal period.
25
(15) Revenue from Construc-tion Contracts
Revenues and costs of construc-tion contracts are recognized by the percentage-of-completion method in case the percentage of completion for each contract can be reliably estimated. The percentage of completion is mea-sured by the percentage of total costs incurred to date to estimated total costs for each contract. The completed-con-tract method is applied to the contracts in case the percentage of completion cannot be reliably estimated.
4. Changes in Accounting Policy
(1) Recognizing Revenues and Costs of Construction Con-tracts
Until the year ended March 31, 2009, revenues and costs of construction contracts were recognized by the completed-contract method. Effective April 1, 2009, the Company and its consolidated subsidiaries have applied ASBJ No.15, “Accounting Standard for Construction Contracts”, and its Guid-ance No.18, “Guidance on Accounting Standard for Construction Contracts”, which was issued on December 27, 2007, to the construction contracts. In accordance with ASBJ No.15 and its Guidance No.18, revenues and costs of construction contracts that commenced on and after April 1, 2009 are recog-nized by the percentage-of-completion method in case the percentage of completion for each contract can be reliably estimated. The percentage of completion is measured by the percent-age of total costs incurred to date to estimated total costs for each contract. The completed-contract method con-tinues to be applied to the contracts in case the percentage of completion can-not be reliably estimated. The effect
of this change was immaterial to the consolidated financial statements for the year ended March 31, 2010.
(2) Translation of Foreign Cur-rency Financial Statements (Accounts of Overseas Sub-sidiaries)
The Company applied the aver-age foreign exchange rates to the translation of all the profit and loss account. More specifically; all the profit and loss accounts are translated at the average foreign exchange rates for the respective periods. On the other hand, all the balance sheet accounts of foreign and affiliates are translated at the foreign exchange rates prevailing at the respective balance sheet date except common stock and capital surplus.
(3) Asset Retirement ObligationsEffective April 1, 2010, the Com-pany and its consolidated subsidiar-ies have applied ASBJ Statement No.18, “Accounting Standard for Asset Retirement Obligations”, and its Guidance No.21, “Implementa-tion Guidance on Accounting Stan-dard for Asset Retirement Obliga-tions”. The effect was immaterial to its consolidated fi nancial statements for the year ended March 31, 2011.
5. United States Dollar Amounts
The Company maintains its ac-counting records in Japanese yen. The U.S. dollar amounts included in the consolidated financial state-ments and notes thereto represent the arithmetical results of translat-ing Japanese yen to U.S. dollars at a rate of ¥83=US $1, the approximate effective rate of exchange prevailing on March 31, 2011. The inclusion of U.S. dollar amounts is solely for
the convenience of readers outside Japan and is not intended to imply that yen amounts could be con-verted, realized, or settled in U.S. dollars at that, or any other rate.
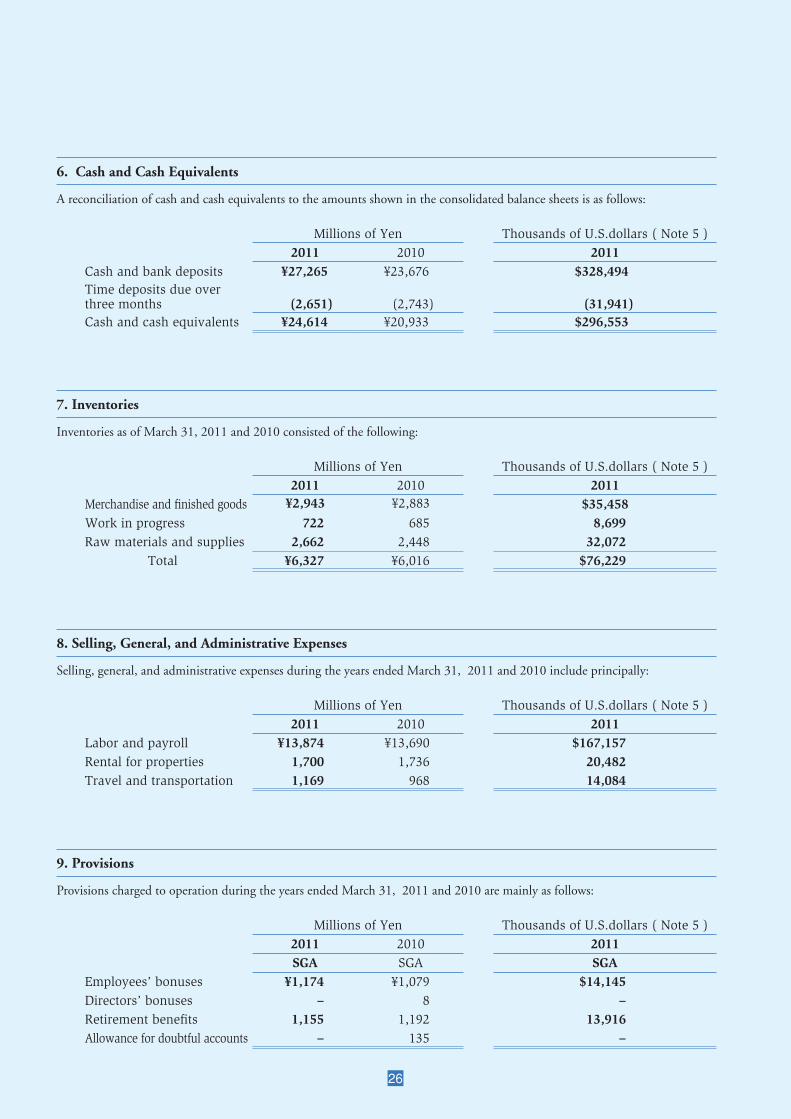
26
6. Cash and Cash Equivalents
A reconciliation of cash and cash equivalents to the amounts shown in the consolidated balance sheets is as follows:
Millions of Yen Thousands of U.S.dollars ( Note 5 )2011 2010 2011
Cash and bank deposits ¥27,265 ¥23,676 $328,494 Time deposits due over three months (2,651) (2,743) (31,941)Cash and cash equivalents ¥24,614 ¥20,933 $296,553
9. Provisions
Provisions charged to operation during the years ended March 31, 2011 and 2010 are mainly as follows:
Millions of Yen Thousands of U.S.dollars ( Note 5 )2011 2010 2011SGA SGA SGA
Employees’ bonuses ¥1,174 ¥1,079 $14,145Directors’ bonuses – 8 –Retirement benefi ts 1,155 1,192 13,916Allowance for doubtful accounts – 135 –
8. Selling, General, and Administrative Expenses
Selling, general, and administrative expenses during the years ended March 31, 2011 and 2010 include principally:
Millions of Yen Thousands of U.S.dollars ( Note 5 )2011 2010 2011
Labor and payroll ¥13,874 ¥13,690 $167,157Rental for properties 1,700 1,736 20,482Travel and transportation 1,169 968 14,084
7. Inventories
Inventories as of March 31, 2011 and 2010 consisted of the following:
Millions of Yen Thousands of U.S.dollars ( Note 5 )2011 2010 2011
Merchandise and fi nished goods ¥2,943 ¥2,883 $35,458 Work in progress 722 685 8,699Raw materials and supplies 2,662 2,448 32,072 Total ¥6,327 ¥6,016 $76,229
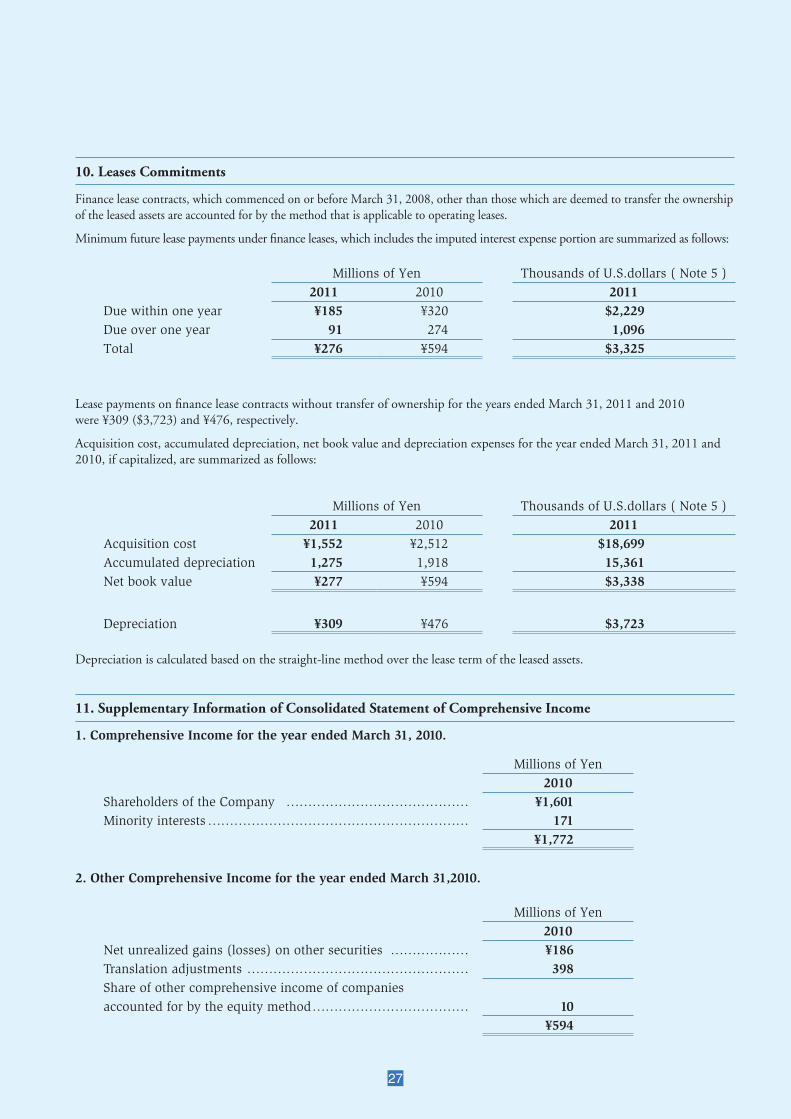
27
10. Leases Commitments
Finance lease contracts, which commenced on or before March 31, 2008, other than those which are deemed to transfer the ownership of the leased assets are accounted for by the method that is applicable to operating leases.
Minimum future lease payments under fi nance leases, which includes the imputed interest expense portion are summarized as follows:
Millions of Yen Thousands of U.S.dollars ( Note 5 )2011 2010 2011
Due within one year ¥185 ¥320 $2,229Due over one year 91 274 1,096Total ¥276 ¥594 $3,325
Lease payments on fi nance lease contracts without transfer of ownership for the years ended March 31, 2011 and 2010 were ¥309 ($3,723) and ¥476, respectively.
Acquisition cost, accumulated depreciation, net book value and depreciation expenses for the year ended March 31, 2011 and 2010, if capitalized, are summarized as follows:
Millions of Yen Thousands of U.S.dollars ( Note 5 )2011 2010 2011
Acquisition cost ¥1,552 ¥2,512 $18,699Accumulated depreciation 1,275 1,918 15,361Net book value ¥277 ¥594 $3,338
Depreciation ¥309 ¥476 $3,723
Depreciation is calculated based on the straight-line method over the lease term of the leased assets.
11. Supplementary Information of Consolidated Statement of Comprehensive Income
1. Comprehensive Income for the year ended March 31, 2010.
Millions of Yen2010
Shareholders of the Company …………………………………… ¥1,601Minority interests …………………………………………………… 171
¥1,772
2. Other Comprehensive Income for the year ended March 31,2010.
Millions of Yen2010
Net unrealized gains (losses) on other securities ……………… ¥186Translation adjustments …………………………………………… 398Share of other comprehensive income of companiesaccounted for by the equity method ……………………………… 10
¥594

28
12. Financial Instruments
Millions of Yen Thousands of U.S.dollars ( Note 5 )2011 2011
Carryingvalue
Estimatedfair value
Differencein amounts
Carryingvalue
Estimatedfair value
Differencein amounts
(1) Cash and bank deposits ¥27,265 ¥27,265 – $328,494 $328,494 –(2) Notes and accounts receivable 21,145 21,145 – 254,759 254,759 –(3) Marketable securities and investments in securities ① Held-to-maturity 1,489 1,487 (2) 17,940 17,916 (24) ② Other securities 3,195 3,195 – 38,494 38,494 – Total (Asset) ¥53,094 ¥53,092 (¥2) $639,687 $639,663 ($24)
(4) Trade notes and accounts payable ¥10,031 ¥10,031 – $120,855 $120,855 – Total (Liability) ¥10,031 ¥10,031 – $120,855 $120,855 –
Millions of Yen2010
Carryingvalue
Estimatedfair value
Differencein amounts
(1) Cash and bank deposits ¥23,676 ¥23,676 –(2) Notes and accounts receivable 21,134 21,134 –(3) Marketable securities and investments in securities ① Held-to-maturity 1,426 1,422 (4) ② Other securities 2,953 2,953 – Total (Asset) ¥49,189 ¥49,185 (¥4)
(4) Trade notes and accounts payable ¥9,009 ¥9,009 – Total (Liability) ¥9,009 ¥9,009 –
Overview(1) Management policyThe management policy of the Company is that temporary surplus fund should be invested in low-risk fi nancial instruments. The Company has not held any high-risk fi nancial instruments.
(2) Financial instrument and its riskBoth notes receivable and accounts receivable as operating receivable are exposed to credit-related losses in the event of nonperformance by counterparties. Both notes payable and accounts payable as trade liability are due and payable within one year. Marketable securities and investments in securities are exposed to changes in its market price. The Company holds marketable securities and investments in securities mainly as held-to-maturity or due to relationship-building with counterparties.
(3) Risk management policiesa) Management policy for credit risk (losses in the event of nonperformance by counterparties)The Company has a credit management policy. In accordance with the credit management policy, the exposure to credit risk of both notes re-ceivable and accounts receivable is monitored on an ongoing basis in order to detect unrecoverable credits in early stages as well as minimiz-ing them. The Company has operated Fund Operation Council in place. In accordance with the examination and decision of the fund opera-tion council, the Company has made an investment in held-to-maturity securities, which consist largely of negotiable deposits and securities graded at high credit rating. The Company has expected that no held-to-maturity securities can fail to meet their obligations.
b) Management policy for market risk (foreign currency exchange and interest rates)The Company has monitored not only fair market value of held-to-maturity securities and investment in securities but also fi nancial condi-tions of their counterparties on an ongoing basis. The Company has reviewed the securities other than held-to-maturity securities based on the relationship with its counterparties on an ongoing basis.
c) Management policy for liquidity risk (in default on its fi nancial obligations) The Company has managed liquidity risk by holding appropriate reserves based on the forecasts and actual cash fl ows, which are continu-ously monitored by management department.
(4) Supplementary explanation on the fair value of fi nancial instruments The fair values of fi nancial instruments are based on quoted market prices. Unless quoted market prices are available, the fair values are esti-mated based on the prices reasonably assessed by the Company. Since the Company takes contingent variable factors into accounts in order to estimate the fair value, it would vary depending on the different preconditions.
Estimated fair value of fi nancial instrumentsDifferences between carrying value and estimated fair value as of March 31, 2011 and 2010 are as follows:Financial instruments whose fair values are hardly estimated are not stated on the following chart; refer to (* 2).

29
Millions of Yen2011
Duewithin 1 year
Due after 1 yearbut within 5 years
Due after 5 yearsbut within 10 years
Due after 10 years
Cash and bank deposits ¥27,265 – – –Notes and accounts receivable 21,145 – – –Marketable securities and investments in securities: Held-to-maturity securities 1,190 300 – – Other securities with maturity date – 600 100 –
Total ¥49,600 ¥900 ¥100 –
Thousands of U.S.dollars ( Note 5 )2011
Duewithin 1 year
Due after 1 yearbut within 5 years
Due after 5 yearsbut within 10 years
Due after 10 years
Cash and bank deposits $328,494 – – –Notes and accounts receivable 254,759 – – –Marketable securities and investments in securities: Held-to-maturity securities 14,337 3,614 – – Other securities with maturity date – 7,229 1,205 –
Total $597,590 $10,843 $1,205 –
Millions of Yen Thousands of U.S.dollars ( Note 5 )2011 2010 2011
Unlisted stocks (Carrying value) ¥1,321 ¥1,361 $15,916
The unlisted stocks as stated above are not included in (3) Marketable securities and investments in securities because it is diffi cult to estimate the fair value based on the quoted market prices in active markets.
(*3) Redemption schedule for monetary claim, and securities with maturities as of March 31, 2011 and 2010 is as follows:
(NOTES)(* 1): Methods to determine the estimated fair value of fi nancial instruments and other matters related to securities and derivative transactions. Asset:(1) Cash and bank deposits, and (2) Trade notes and accounts receivable:
Since these items are settled in a short period of time, their carrying value approximates fair value.(3) Marketable securities and investments in securities:
The fair value of stocks is based on quoted market prices. The fair value of debt securities is based on either quoted market prices or prices provided by the fi nancial institutions making markets in these securities. For information on securities classifi ed by holding purpose, please refer to (*5) Held-to-maturity and other securities with readily determinable fair value as of March 31, 2011 and 2010.
Liability:(4) Trade notes and accounts payable:
Since these items are settled in a short period of time, their carrying value approximates fair value.
(*2): Financial instruments, whose fair values are hardly estimated, are as follows:
Millions of Yen2010
Duewithin 1 year
Due after 1 yearbut within 5 years
Due after 5 yearsbut within 10 years
Due after 10 years
Cash and bank deposits ¥23,676 – – –Notes and accounts receivable 21,134 – – –Marketable securities and investments in securities: Held-to-maturity securities 1,226 200 – – Other securities with maturity date – 300 100 –
Total ¥46,036 ¥500 ¥100 –

30
Millions of Yen2011
Due within 1 year The second year The third year The fourth year The fi fth year ThereafterLong-term loan payable – ¥3 ¥3 ¥3 – –Lease obligations ¥539 570 521 380 169 109
Total ¥539 ¥573 ¥524 ¥383 ¥169 ¥109
(*4) Repayment schedule for long-term loan payable and lease obligations at the balance sheet dates:
Thousands of U.S.dollars ( Note 5 )2011
Due within 1 year The second year The third year The fourth year The fi fth year ThereafterLong-term loan payable – $36 $36 $36 – –Lease obligations $6,494 6,867 6,277 4,578 2,036 1,313
Total $6,494 $6,903 $6,313 $4,614 $2,036 $1,313
Millions of Yen Thousands of U.S.dollars ( Note 5 )2011 2011
Carrying value Fair value Unrealized
gains (losses)Carrying
value Fair value Unrealized gains (losses)
Held-to-maturity ¥1,489 ¥1,487 (¥2) $17,940 $17,916 ($24)
Carrying value Fair value Unrealized
gains (losses)Carrying
value Fair value Unrealized gains (losses)
Other securities with carryingvalue exceeding acquisition cost Stocks ¥817 ¥563 ¥254 $9,844 $6,783 $3,061 Other 305 300 5 3,675 3,614 61 Subtotal 1,122 863 259 13,519 10,397 3,122 Other securities with carryingvalue not exceeding acquisition cost Stocks 1,684 2,192 (508) 20,289 26,410 (6,121) Other 387 400 (13) 4,663 4,819 (156) Subtotal 2,071 2,592 (521) 24,952 31,229 (6,277)
Total ¥3,193 ¥3,455 (¥262) $38,471 $41,626 ($3,155)
(*5) Held-to-maturity and other securities with readily determinable fair value as of March 31, 2011 and 2010, are as follows:
Millions of Yen2010
Carrying value Fair value Unrealized
gains (losses)Held-to-maturity ¥1,427 ¥1,423 (¥4)
Carrying value Fair value Unrealized
gains (losses)Other securities with carryingvalue exceeding acquisition cost Stocks ¥952 ¥731 ¥221 Other 302 300 2 Subtotal 1,254 1,031 223 Other securities with carryingvalue not exceeding acquisition cost Stocks 1,603 2,021 (418) Other 97 100 (3) Subtotal 1,700 2,121 (421)
Total ¥2,954 ¥3,152 (¥198)
Millions of Yen2010
Due within 1 year The second year The third year The fourth year The fi fth year ThereafterLong-term loan payable – ¥10 ¥6 ¥4 ¥4 –Lease obligations ¥476 327 325 319 197 60
Total ¥476 ¥337 ¥331 ¥323 ¥201 ¥60
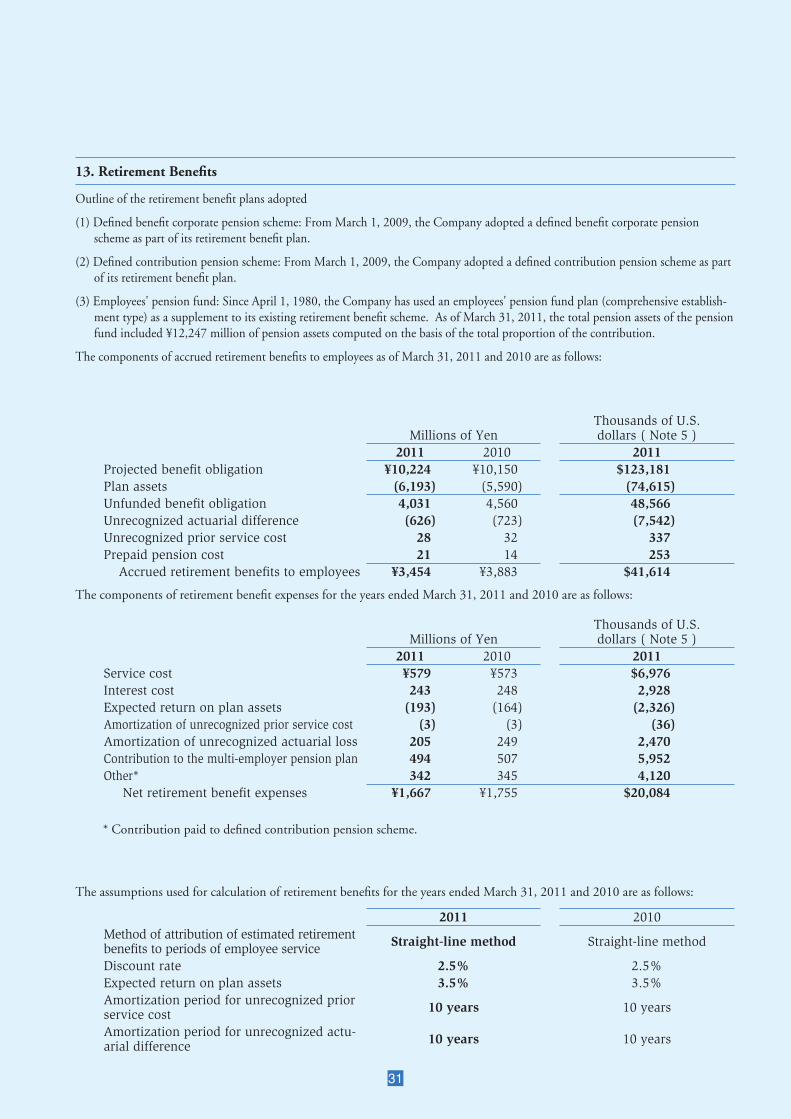
31
13. Retirement Benefi ts
Outline of the retirement benefi t plans adopted
(1) Defi ned benefi t corporate pension scheme: From March 1, 2009, the Company adopted a defi ned benefi t corporate pension scheme as part of its retirement benefi t plan.
(2) Defi ned contribution pension scheme: From March 1, 2009, the Company adopted a defi ned contribution pension scheme as part of its retirement benefi t plan.
(3) Employees' pension fund: Since April 1, 1980, the Company has used an employees' pension fund plan (comprehensive establish-ment type) as a supplement to its existing retirement benefi t scheme. As of March 31, 2011, the total pension assets of the pension fund included ¥12,247 million of pension assets computed on the basis of the total proportion of the contribution.
The components of accrued retirement benefi ts to employees as of March 31, 2011 and 2010 are as follows:
Millions of YenThousands of U.S.dollars ( Note 5 )
2011 2010 2011Projected benefi t obligation ¥10,224 ¥10,150 $123,181 Plan assets (6,193) (5,590) (74,615)Unfunded benefi t obligation 4,031 4,560 48,566Unrecognized actuarial difference (626) (723) (7,542)Unrecognized prior service cost 28 32 337Prepaid pension cost 21 14 253 Accrued retirement benefi ts to employees ¥3,454 ¥3,883 $41,614
The components of retirement benefi t expenses for the years ended March 31, 2011 and 2010 are as follows:
2011 2010Method of attribution of estimated retirement benefi ts to periods of employee service Straight-line method Straight-line method
Discount rate 2.5% 2.5%Expected return on plan assets 3.5% 3.5%Amortization period for unrecognized prior service cost 10 years 10 years
Amortization period for unrecognized actu-arial difference 10 years 10 years
The assumptions used for calculation of retirement benefi ts for the years ended March 31, 2011 and 2010 are as follows:
Millions of YenThousands of U.S.dollars ( Note 5 )
2011 2010 2011Service cost ¥579 ¥573 $6,976Interest cost 243 248 2,928Expected return on plan assets (193) (164) (2,326)Amortization of unrecognized prior service cost (3) (3) (36)Amortization of unrecognized actuarial loss 205 249 2,470Contribution to the multi-employer pension plan 494 507 5,952Other* 342 345 4,120 Net retirement benefi t expenses ¥1,667 ¥1,755 $20,084
* Contribution paid to defi ned contribution pension scheme.
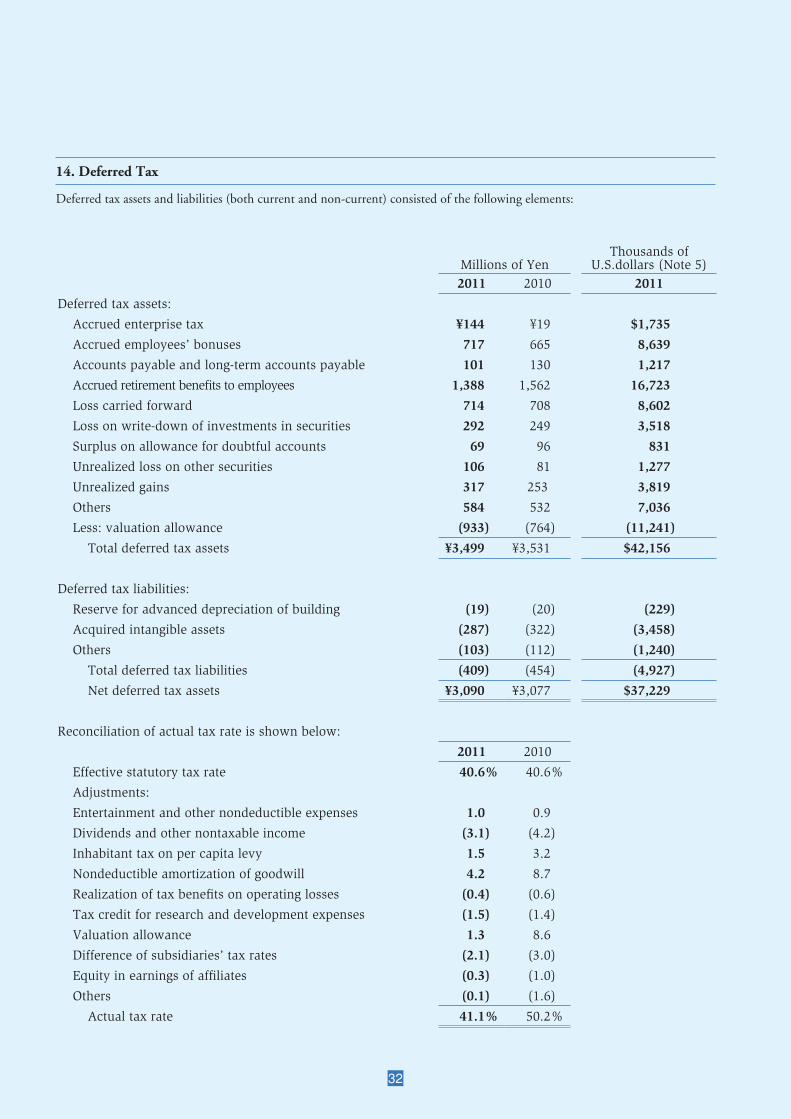
32
14. Deferred Tax
Deferred tax assets and liabilities (both current and non-current) consisted of the following elements:
Millions of YenThousands of
U.S.dollars (Note 5)2011 2010 2011
Deferred tax assets:
Accrued enterprise tax ¥144 ¥19 $1,735
Accrued employees’ bonuses 717 665 8,639
Accounts payable and long-term accounts payable 101 130 1,217
Accrued retirement benefi ts to employees 1,388 1,562 16,723
Loss carried forward 714 708 8,602
Loss on write-down of investments in securities 292 249 3,518
Surplus on allowance for doubtful accounts 69 96 831
Unrealized loss on other securities 106 81 1,277
Unrealized gains 317 253 3,819
Others 584 532 7,036
Less: valuation allowance (933) (764) (11,241)
Total deferred tax assets ¥3,499 ¥3,531 $42,156
Deferred tax liabilities:
Reserve for advanced depreciation of building (19) (20) (229)
Acquired intangible assets (287) (322) (3,458)
Others (103) (112) (1,240)
Total deferred tax liabilities (409) (454) (4,927)
Net deferred tax assets ¥3,090 ¥3,077 $37,229
Reconciliation of actual tax rate is shown below:
2011 2010
Effective statutory tax rate 40.6% 40.6%
Adjustments:
Entertainment and other nondeductible expenses 1.0 0.9
Dividends and other nontaxable income (3.1) (4.2)
Inhabitant tax on per capita levy 1.5 3.2
Nondeductible amortization of goodwill 4.2 8.7
Realization of tax benefi ts on operating losses (0.4) (0.6)
Tax credit for research and development expenses (1.5) (1.4)
Valuation allowance 1.3 8.6
Difference of subsidiaries’ tax rates (2.1) (3.0)
Equity in earnings of affi liates (0.3) (1.0)
Others (0.1) (1.6)
Actual tax rate 41.1% 50.2%

33
15. Segment Information
Effective the fi scal year ended March 31, 2011, the Company has adopted new accounting standards for disclosures about seg-ments of an enterprise and related information. Segment information for the year ended March 31, 2010 has been restated in accordance with such accounting standards for comparative purposes.
The reportable segments of the Company are components for which discrete fi nancial information is available and whose operat-ing results are regularly reviewed by the Executive Committee to make decisions about resource allocation and to assess perfor-mance.The reportable segments are as follows:1.Time information2.Environmental equipment
Millions of Yen2011
Reportable segments Adjustments/EliminationsTime Information Environment Total Consolidated
Net sales:Sales to third parties ¥61,790 ¥21,513 ¥83,303 – ¥83,303Intersegment sales and transfers – – – – – Total 61,790 21,513 83,303 – 83,303Segment profi t or loss ¥5,717 ¥1,474 ¥7,191 (¥2,808) ¥4,383Segment assets ¥34,549 ¥27,519 ¥62,068 ¥40,865 ¥102,933Depreciation and amortization 3,455 488 3,943 408 4,351Investments accounted for by the equity method 259 – 259 – 259Capital expenditures 2,864 119 2,983 46 3,029
Millions of Yen2010
Reportable segments Adjustments/EliminationsTime Information Environment Total Consolidated
Net sales:Sales to third parties ¥59,542 ¥19,044 ¥78,586 – ¥78,586Intersegment sales and transfers – – – – – Total 59,542 19,044 78,586 – 78,586Segment profi t or loss ¥4,292 ¥156 ¥4,448 (¥2,521) ¥1,927Segment assets ¥46,754 ¥16,265 ¥63,019 ¥37,668 ¥100,687Depreciation and amortization 3,627 623 4,250 426 4,676Investments accounted for by the equity method 308 – 308 – 308Capital expenditures 3,115 215 3,330 10 3,340
Thousands of U.S. dollars (Note 5)2011
Reportable segments Adjustments/EliminationsTime Information Environment Total Consolidated
Net sales:Sales to third parties $744,458 $259,193 $1,003,651 – $1,003,651 Intersegment sales and transfers – – – – – Total 744,458 259,193 1,003,651 – 1,003,651 Segment profi t or loss $68,880 $17,759 $86,639 ($33,831) $52,808 Segment assets $416,253 $331,555 $747,808 $492,349 $1,240,157 Depreciation and amortization 41,626 5,880 47,506 4,916 52,422 Investments accounted for by the equity method 3,120 – 3,120 – 3,120Capital expenditures 34,506 1,434 35,940 554 36,494
(1) Sales, profi ts or losses, assets and other items by reportable segments

34
(b) Overseas sales
Overseas sales for the years ended March 31, 2011 and 2010 are summarized as follows:
Overseas sales represents the total amount of export sales of the Company and domestic subsidiaries and sales of the overseas subsidiaries.
Millions of Yen Thousands of U.S.dollars (Note 5)2011 2010 2011
Overseas salesAsia ¥5,728 ¥4,354 $69,012North America 10,041 10,527 120,976Europe 5,365 5,679 64,639Others 146 171 1,759
Total ¥21,280 ¥20,731 $256,386
Percentage of overseas sales to consolidated net sales 25.5% 26.4%
16. Per Share Data
Net assets and net income per share as of and for the years ended March 31, 2011 and 2010:
Yen U.S.dollars (Note 5)2011 2010 2011
Amounts per shareNet assets ¥945.23 ¥964.78 $11.388Net income: Basic 40.01 13.20 0.482
(2)Supplementary Information
(a) Geographic segments
Information by geographic areas based on location for the years ended March 31, 2011 and 2010, issummarized as follows:
Millions of Yen2011
Domestic Overseas Total Eliminations/Corporate
Consolidated Total(in Japan) Asia North America Europe
Net sales: Customers ¥62,407 ¥5,495 ¥10,036 ¥5,365 ¥83,303 – ¥83,303 Intersegment 1,629 76 148 32 1,885 (¥1,885) – Total 64,036 5,571 10,184 5,397 85,188 (1,885) 83,303 Operating income ¥6,868 ¥592 (¥108) (¥195) ¥7,157 (¥2,774) ¥4,383
Millions of Yen2010
Domestic Overseas Total Eliminations/Corporate
Consolidated Total(in Japan) Asia North America Europe
Net sales: Customers ¥58,182 ¥4,207 ¥10,518 ¥5,679 ¥78,586 – ¥78,586 Intersegment 1,265 12 162 31 1,470 (¥1,470) – Total 59,447 4,219 10,680 5,710 80,056 (1,470) 78,586 Operating income ¥4,465 ¥309 (¥58) (¥328) ¥4,388 (¥2,461) ¥1,927
Thousands of U.S. dollars (Note 5)2011
Domestic Overseas Total Eliminations/Corporate
Consolidated Total(in Japan) Asia North America Europe
Net sales: Customers $751,891 $66,205 $120,916 $64,639 $1,003,651 – $1,003,651 Intersegment 19,627 916 1,783 386 22,712 ($22,712) – Total 771,518 67,121 122,699 65,025 1,026,363 (22,712) 1,003,651 Operating income $82,747 $7,133 ($1,301) ($2,348) $86,231 ($33,423) $52,808
35
Corporate Data
Board of Directors
Chairman & Representative Director
Kaoru Haruta
President & Representative Director
Izumi Nakajima
Executive Offi cer & Representative Director
Haruhiko Yamaguchi
Director & Managing Operating Offi cers
Minoru Koyama
Nobuyuki Tabata
Hiroshi Shiraishi
Naoki Nakata
Director & Operating Offi cers
Kenji Kohori
Toru Ueno
Corporate Auditors
Kazuo Unno
Toshio Kusanagi
Satoru Ueno
Yoshiyuki Sato
Managing Operating Offi cer
Masamiki Konno
Operating Offi cers
Bungo Nogawa
Takeshi Akagi
Yutaka Kaneko
Isao Terasaki
Kunihiro Ihara
Morio Kaneko
Osamu Otani
Yuhiko Hashidume
Minoru Yonezawa
Susumu Ikoma
SALES OFFICES
74 Sales Offi cers Located in major cities,
including
TOKYO Offi ce
YOKOHAMA Offi ce
NAGOYA Offi ce
OSAKA Offi ce
SAPPORO Offi ce
SENDAI Offi ce
OMIYA Offi ce
NAGANO Offi ce
NIIGATA Offi ce
HAMAMATSU Offi ce
KANAZAWA Offi ce
KYOTO Offi ce
OKAYAMA Offi ce
HIROSHIMA Offi ce
TAKAMATSU Offi ce
FUKUOKA Offi ce
Domestic Operations
HEAD OFFICE
275 Mamedocho, Kohoku-ku, Yokohama,
Kanagawa, JAPAN 222-8558
FACILITIES
YOKOHAMA Facility
TSUKUI Facility
HOSOE Facility
MIYAKODA Facility
SYSTEM CENTERS
TOKYO System Center
KANAGAWA System Center
NAGOYA System Center
OSAKA System Center
SENDAI System Center
SAPPORO System Center
OMIYA System Center
SHINJUKU System Center
SHINAGAWA System Center
TACHIKAWA System Center
SHIZUOKA System Center
NAGANO System Center
NIIGATA System Center
KANAZAWA System Center
HIROSHIMA System Center
TAKAMATSU System Center
FUKUOKA System Center
DOMESTIC SUBSIDIARIES
AMANO BUSINESS SOLUTIONS CORPORATION
ENVIRONMENTAL TECHNOLOGY CO., LTD.
AMANO MANAGEMENT SERVICE CORPORATION
AMANO MAINTENANCE ENGINEERING CORPO-
RATION
AMANO MUSASHI ELECTRIC CORPORATION
AMANO AGENCY CORPORATION
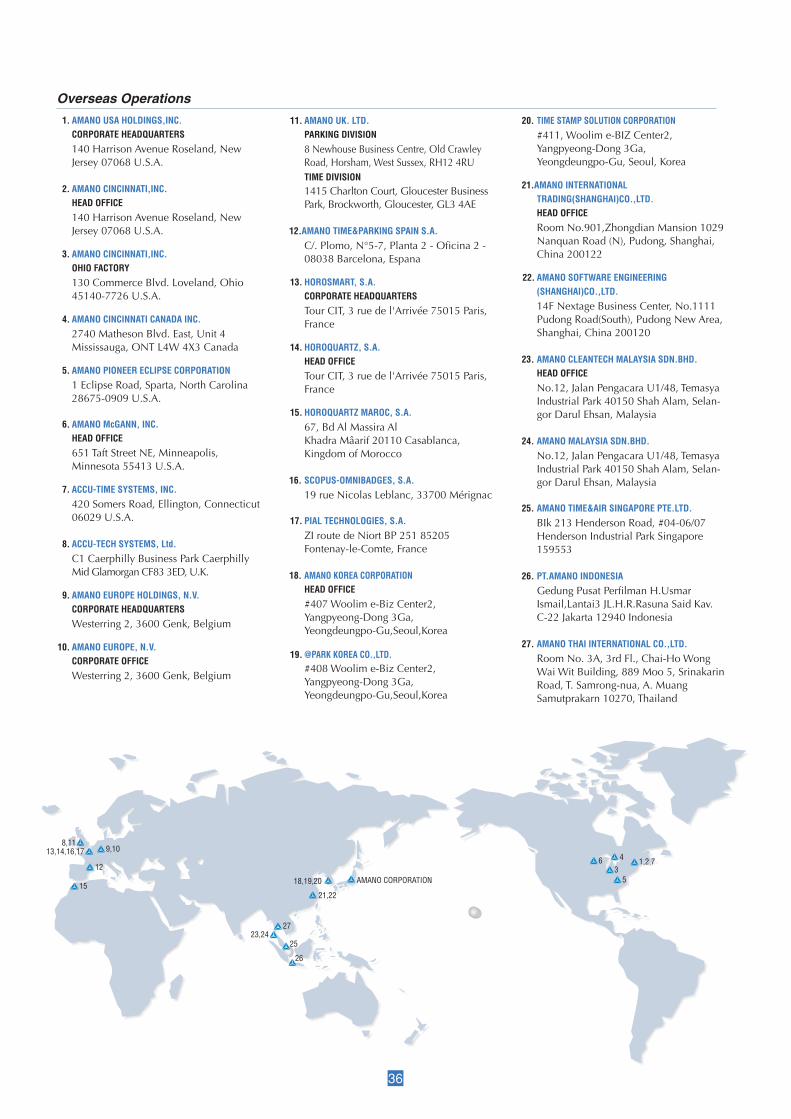
36
20. TIME STAMP SOLUTION CORPORATION
#411, Woolim e-BIZ Center2, Yangpyeong-Dong 3Ga, Yeongdeungpo-Gu, Seoul, Korea
21. AMANO INTERNATIONALTRADING(SHANGHAI)CO.,LTD.
HEAD OFFICE
Room No.901,Zhongdian Mansion 1029 Nanquan Road (N), Pudong, Shanghai, China 200122
22. AMANO SOFTWARE ENGINEERING(SHANGHAI)CO.,LTD.
14F Nextage Business Center, No.1111 Pudong Road(South), Pudong New Area, Shanghai, China 200120
23. AMANO CLEANTECH MALAYSIA SDN.BHD. HEAD OFFICE
No.12, Jalan Pengacara U1/48, Temasya Industrial Park 40150 Shah Alam, Selan-gor Darul Ehsan, Malaysia
24. AMANO MALAYSIA SDN.BHD.
No.12, Jalan Pengacara U1/48, Temasya Industrial Park 40150 Shah Alam, Selan-gor Darul Ehsan, Malaysia
25. AMANO TIME&AIR SINGAPORE PTE.LTD.
BIk 213 Henderson Road, #04-06/07 Henderson Industrial Park Singapore 159553
26. PT.AMANO INDONESIA
Gedung Pusat Perfi lman H.Usmar Ismail,Lantai3 JL.H.R.Rasuna Said Kav.C-22 Jakarta 12940 Indonesia
27. AMANO THAI INTERNATIONAL CO.,LTD.
Room No. 3A, 3rd Fl., Chai-Ho Wong Wai Wit Building, 889 Moo 5, Srinakarin Road, T. Samrong-nua, A. Muang Samutprakarn 10270, Thailand
1,2,7
5
463
9,1013,14,16,178,11
2723,24
18,19,20
21,22
AMANO CORPORATION
25
26
12
15
Overseas Operations
1. AMANO USA HOLDINGS,INC. CORPORATE HEADQUARTERS
140 Harrison Avenue Roseland, New Jersey 07068 U.S.A.
2. AMANO CINCINNATI,INC. HEAD OFFICE
140 Harrison Avenue Roseland, New Jersey 07068 U.S.A.
3. AMANO CINCINNATI,INC. OHIO FACTORY
130 Commerce Blvd. Loveland, Ohio 45140-7726 U.S.A.
4. AMANO CINCINNATI CANADA INC.
2740 Matheson Blvd. East, Unit 4 Mississauga, ONT L4W 4X3 Canada
5. AMANO PIONEER ECLIPSE CORPORATION
1 Eclipse Road, Sparta, North Carolina 28675-0909 U.S.A.
6. AMANO McGANN, INC. HEAD OFFICE
651 Taft Street NE, Minneapolis, Minnesota 55413 U.S.A.
7. ACCU-TIME SYSTEMS, INC.
420 Somers Road, Ellington, Connecticut 06029 U.S.A.
8. ACCU-TECH SYSTEMS, Ltd.
C1 Caerphilly Business Park Caerphilly Mid Glamorgan CF83 3ED, U.K.
9. AMANO EUROPE HOLDINGS, N.V. CORPORATE HEADQUARTERS
Westerring 2, 3600 Genk, Belgium
10. AMANO EUROPE, N.V. CORPORATE OFFICE
Westerring 2, 3600 Genk, Belgium
11. AMANO UK. LTD. PARKING DIVISION
8 Newhouse Business Centre, Old Crawley Road, Horsham, West Sussex, RH12 4RU
TIME DIVISION 1415 Charlton Court, Gloucester Business
Park, Brockworth, Gloucester, GL3 4AE 12. AMANO TIME&PARKING SPAIN S.A.
C/. Plomo, N°5-7, Planta 2 - Ofi cina 2 - 08038 Barcelona, Espana
13. HOROSMART, S.A. CORPORATE HEADQUARTERS
Tour CIT, 3 rue de l'Arrivée 75015 Paris, France
14. HOROQUARTZ, S.A. HEAD OFFICE
Tour CIT, 3 rue de l'Arrivée 75015 Paris, France
15. HOROQUARTZ MAROC, S.A.
67, Bd Al Massira Al Khadra Mâarif 20110 Casablanca, Kingdom of Morocco
16. SCOPUS-OMNIBADGES, S.A.
19 rue Nicolas Leblanc, 33700 Mérignac 17. PIAL TECHNOLOGIES, S.A.
ZI route de Niort BP 251 85205 Fontenay-le-Comte, France
18. AMANO KOREA CORPORATION HEAD OFFICE
#407 Woolim e-Biz Center2,Yangpyeong-Dong 3Ga,Yeongdeungpo-Gu,Seoul,Korea
19. @PARK KOREA CO.,LTD. #408 Woolim e-Biz Center2,
Yangpyeong-Dong 3Ga,Yeongdeungpo-Gu,Seoul,Korea

275 MAMEDOCHO, KOHOKU-KU , YOKOHAMA, KANAGAWA,
JAPAN 222-8558
PHONE : +81 (45) 401-1441
FAX : +81 (45) 439-1150
HOME PAGE : http://www.amano.co.jp/English/
CAT-114900K9606A2-2011.6


