44
FINANCIAL REPORT April 2015 - March 2016

FINANCIALREPORT
April 2015 - March 2016

1
1. Basic Management Policy
Throughout its history, Amano has adhered to a basic policy of putting the customer first. This has meant paying heed to what its customers say—based on its corporate themes of “people and time” and “people and the environment”—and giving pivotal importance to customer satisfaction throughout its business activities, particularly in sales, production, and development.
In accordance with this fundamental policy, Amano continues to undertake business activities with the goal of earning the trust and high regard of all those who support it: the customers, employees, shareholders, suppliers and other entities with which it does business, and the local community. It achieves this by providing a variety of products, systems, services, and solutions that match the needs of its customers in relation to the themes of “people and time” and “people and the environment.”
Amano and its Group companies direct their efforts toward maximizing corporate val-ue by fostering innovation in management and by ensuring a strong earnings structure and sustained growth in business performance.
2. New Medium-Term Business Plan
Amano and all of its Group companies continue to pursue the Group’s tradition of con-tinuing to evolve in response to the changes of the times, while remaining committed to the following four immutable strategies of the Amano Group.
(i) Emphasis on the Time & Ecology business fields and enhancement of our core business (ii) Being a niche leader in the business fields in which we excel (iii) Ceaseless restructuring (iv) Management based on cash flow
In accordance with these four fundamental strategies, Amano launched a new medi-um-term business plan. An outline of the plan is set out below.
[1] Basic Policies
Under its new medium-term business plan, aiming to become a 100-year Company, the Group will work to address the following four priority challenges with “Challenge Ourselves to Advance to a New Stage” as its management concept:
(i) Expansion of business: Increase sales and achieve an operating profit ratio of 10%(ii) Improvement in management efficiency: Increase earnings capacity aiming to
achieve an ROE (return on equity) of 10%(iii) Reinforcement of consolidated business management: Increase the ratio of con-
solidated operating profit to non-consolidated operating profit by 10% by grow-ing group companies based in Japan and abroad (*)
(iv) Evolution of corporate governance: Enhance the environment for internal con-trols for the entire Amano Group(*) Starting from the fiscal year ending March 31, 2017, the ratio of consolidated net sales to
non-consolidated net sales will be replaced with the ratio of consolidated operating profit to non-consolidated operating profit.
Under these basic policies, the Company will carry out the following measures.
Management Policy

2
1. North American and European markets
North America: In the Parking Systems business, we will further expand business by stepping up sales of Amano McGann’s new systems and by improving our ability to propose solutions through enhancement of peripheral services. In the Information Sys-tem business, we will strive to expand operations by increasing sales of a new series of devices by Accu-Time Systems Inc. in North America and by developing cloud ser-vices. In the Clean Systems business, we will strengthen the business foundation and scale up operations of the wooden floor sanding equipment division of Amano Pioneer Eclipse Corp. In the Environmental Systems business, we will boost sales of standard equipment to Japanese companies operating outside Japan, centering on automobile-related businesses.
Europe: In the Information Systems business, we will continue to enhance Horoquartz’s French customer base and will strive to permeate and expand the markets in Belgium and Germany. In the Parking Systems business, we will strive to expand operations by accelerating the deployment of bar code system products and newly providing com-missioned parking lot management service.
2. Asian, Latin American and other emerging markets
In the Asian region, we will aim to expand Parking Systems operations by acquiring new customers in the low-end market segment and bolstering commissioned parking lot man-agement services. In the Environmental Systems business, we will strengthen our engineer-ing capabilities as well as sales and service systems for Japanese companies operating in Asia by making use of the ties between our Group companies across Asia and our head office in Japan. We will also expand our local production capabilities in order to enhance cost competitiveness.
In Central and South America, we will continue to develop markets for the Information Sys-tems, Parking Systems, and Environment System businesses by setting up a local subsidiary in Mexico with a view to expanding operations in these regions in the future.
3. Japanese market
Japan: We will reinforce ties among Group companies and strengthen our capacity to provide holistic solutions (which cover hardware, software, and services) across all business fields both qualitatively and quantitatively. We will also increase our stable of customers by locking in existing customers as well as our flow of customers by acquir-ing new customers.
[2] Numerical targets
We are aiming to achieve ¥122.0 billion in net sales and ¥13.0 billion in operating profit for the fiscal year ending March 31, 2017, which is the final year of the plan.
Numerical targets (Millions of yen)
FY 2014(ending March 2015)
Results
FY 2015(ending March 2016)
AmendmentFY 2016
(ending March 2017)
Amount YoY (%) Amount YoY (%) Amount YoY (%)Net sales 109,837 7.5% 119,506 8.8% 122,000 2.1%Operating profit 9,357 6.0% 12,942 38.3% 13,000 0.4%Operating profit ratio (%) 8.5% – 10.8% – 10.7% –Ordinary profit 10,189 8.1% 13,665 34.1% 13,500 (1.2%)Net income attributable to owners of the parent company 6,794 28.2% 8,405 23.7% 8,800 4.7%
3
Izumi NAKAJIMAPresidentRepresentative Director
3. Basic Policy on Distribution of Profits and Payment of Dividends for This Fiscal Year and the Next
Amano places great importance on its policy for the payment of dividends to sharehold-ers. Fundamental to this is its policy for the return of profit to shareholders, based on maintaining a stable ordinary dividend of ¥26 annually (interim dividend of ¥13 and year-end dividend of ¥13), together with appropriate results-based distributions of profits and flexible purchasing of treasury stock. The Company aims to maintain a payout ratio of at least 40% on a consolidated basis and a ratio of dividend to net assets of at least 2.5%.
In line with this policy, taking into account our current-year operations results, we plan to pay a year-end dividend of ¥28 per share, an increase of ¥5 per share compared with the amount paid at the end of the previous year. As a result, the annual per-share dividend will be ¥48 (including the ¥20 per share paid as the interim dividend). This corresponds to a dividend payout ratio of 43.7% and a 3.9% ratio of dividends to net assets on a con-solidated basis.
With regard to the dividend for the next fiscal year, in line with our Basic Policy on Dis-tribution of Profits and in view of our Outlook for Fiscal Year Ending March 31, 2017, we aim to pay an annual per-share dividend of ¥46 (with an interim dividend of ¥23 and a year-end dividend of ¥23).
Retained earnings will be earmarked to fund effective investment aimed at the fundamen-tal enhancement of the Company’s capacity to conduct its business operations. This will include the expansion and strengthening of existing business fields, strategic investment in growth fields, and spending on research and development, as well as the rationaliza-tion of production plants and equipment for the purpose of reducing costs and further improving product quality.

4
Analysis of Business Results Business Results in the Year Ended March 31, 2016
During the fiscal year under review, although overseas economies re-mained unstable due to the slow-downs in emerging market econo-mies and fluctuations in the price of crude oil, the Japanese economy appeared to be on a firm footing as corporate profits and conditions in the jobs market improved steadily, thanks partly to the weak yen, while capital investment continued to be robust.
Amid this business environment, the Amano Group worked on global marketing and product deployment as well as the enhancement of its capacity to provide holistic solutions, based on its new medium-term business plan launched in April 2014. Under this plan, the Group set forth the management concept of “Chal-lenge to a New Stage,” a concept aimed at making the organization a “100-year company.” The Amano Group also concentrated on thor-oughly uncovering customer needs and strove to reduce the costs of goods sold (COGS) and sell ing, general, and administrative (SG&A) expenses.
As a result of the above, during the fiscal year under review, the Com-pany recorded sales of ¥119,506 million, up by 8.8% year-on-year. Op-erating profit increased by 38.3% to ¥12,942 million, ordinary profit went up by 34.1% to ¥13,665 million, and net income, which is attributable to parent company shareholders, in-creased by 23.7% to ¥8,405 million, resulting in increases in both income and profit.
The following is a breakdown of sales by business division.
Sales by business division (Unit: Millions of yen)
Category
FY2014 FY2015Change
(April 1, 2014–March 31, 2015) (April 1, 2015–March 31, 2016)
Amount Ratio (%) Amount Ratio (%) Amount %
Time Information System business:
Information Systems 23,558 21.5 25,512 21.3 1,953 8.3
Time Management Products 4,100 3.7 4,165 3.5 64 1.6
Parking Systems 51,817 47.2 55,784 46.7 3,966 7.7
Subtotal 79,477 72.4 85,462 71.5 5,984 7.5
Environment System business:
Environmental Systems 20,639 18.8 21,830 18.3 1,190 5.8
Clean Systems 9,720 8.8 12,213 10.2 2,493 25.6
Subtotal 30,360 27.6 34,044 28.5 3,683 12.1
Total 109,837 100.0 119,506 100.0 9,668 8.8

5
Time Information System business• Information Systems: Time & attendance (T&A), payroll,
human-resource management, access control, and cafeteria systems
• Time Management Products: Time recorders and time stamps
• Parking Systems: Parking and bicycle-parking space
management systems, and com-missioned parking lot manage-ment service
Information Systems
This business division, against the backdrop of improved corporate performance domestically, saw a growing trend of investment in in-formation systems in relation to the Social Security & Tax Number (“My Number”) system and measures to prevent leaks of personal informa-tion.In response to these market condi-tions, the Company added access control and security to the list of its “3-in-1” proposal comprising time & attendance (T&A), payroll, and human-resource management, thus striving to bolster its activities to provide total solutions from system ownership to system use.Domestic sales for the current term were as follows. Terminal device sales increased by ¥633 mil l ion (10.0%) year-on-year and software sales increased by ¥159 mil l ion (4.5%). The increase in terminal de-vice sales was a result of multiple or-ders for large replacement projects, while the higher software sales was attributable to the increased orders of T&A systems for the small- and medium-sized enterprise markets.
Overall overseas sales increased by ¥713 million year-on-year (7.9%) as the sales of Accu-Time Systems Inc. in North America increased while the sales of Horosmart S.A. in Eu-rope decreased due to the disposal of a group company.As a result of the above, sales in this business division totaled ¥25,512 million, representing an increase of 8.3% year-on-year.
Time Management Products
This business division continues to cope with the current trend toward lower prices as well as the need for improved functions, al-though there is a constant demand for standard machines.In this market environment, the Company has been working on ex-panding its customer base through the “Use r- c l ub” ( a fee -ba sed service for members), as well as concentrating on expanding sales of time recorders equipped with aggregation software compatible with PCs, which offers improved usability and functionality.Domestic sales of standard ma-chines for the current term de-creased by ¥31 million year-on-year (2.5%), and domestic sales of supply goods increased by ¥85 million (10.5%). Overall overseas sa les increased by ¥15 mi l l ion (1.2%) as sales in North America rose , par t ly due to foreign-ex-change effects.
As a result of the above , sa les in this business division totaled ¥4,165 million, representing an in-crease of 1.6% year-on-year.
Parking Systems
To respond to the increasingly di-verse needs of parking lot manage-ment in Japan, the Parking Systems business division has been working on improving the efficiency and reducing the cost of parking lot management, increasing the level of convenience for parking lot users, and ensuring safety and security in parking lots.In response to these market con-d i t ions , the Company fu r ther strengthened its cooperation with major parking lot management firms and, at the same time, concentrated on offering various services to small to medium-sized parking lot man-agement firms through its parking lot data centers. The Company also worked to improve the functionality and usability of its system equip-ment and made efforts to expand into new markets, such as bicycle parking systems, security-gate sys-tems and toll road systems, as well as making new proposals for parking lot management in cooperation with a domestic Group company.Domestic parking equipment sales decreased by ¥679 million (3.7%). Domest ic revenue from main -tenance contracts and suppl ies services increased by ¥366 million (4.0%). The commissioned parking lot management business of Group subsidiary Amano Management Ser-vice Corporation has been steadily expanding, and the number of park-ing spaces under management in-creased by 31,500 (10.1%) from the end of the previous fiscal year.Overall overseas sales increased by ¥3,592 mil l ion year-on-year
6
(23.4%). Sales for Amano McGann, Inc. in North America rose due to the increased orders of new sys-tems, sales in Europe increased due to the strong performance of bar code systems, and sales in the Asian region increased as sales in Korea and Hong Kong grew alongside the steady expansion in the com-missioned parking lot management business.As a net result of the above, the Parking Systems business division provided sales totaling ¥55,784 mil-lion, up by 7.7% year-on-year.
Environment System business• Environmental Systems: Standard dust collectors, large
dust collection systems, pneumatic powder conveyance systems, high-temperature hazardous-gas re-moval systems, and deodorization systems
• Clean Systems: Cleaning equipment, dr y-care
cleaning systems, cleaning man-agement services, and electrolytic water generators
Environmental Systems
For this business division, capital in-vestment by Japanese companies re-mained firm domestically and strong aboard.In this market environment, the Company focused on captur ing demand for its standard equipment by strengthening proposals in Japan, while seeking to win increased or-ders from customers in the phar-maceutical, foods, and cosmetics markets. Meanwhile, with the aim of attracting demand from Japanese
companies operating overseas, the Company enhanced cooperation with overseas Group companies; reinforced its platforms for engi-neering, sales and services; and fur-thermore, endeavored to achieve greater cost competitiveness by expanding its local procurement.During the current term, domestic sales of standard equipment in-creased by ¥1,021 million (15.7%), sales of large-scale systems in-creased by ¥300 million (4.8%) and sales of maintenance contracts and supplies services increased by ¥192 million (5.3%) year-on-year.Overall overseas sales decreased by ¥313 million year-on-year (7.5%) as sales in the Asian region declined, affected by the slowdown in the Chinese economy.As a result of the above, sales of this business division totaled ¥21,830 million, up by 5.8% year-on-year.
Clean Systems
This business division is seeing a growing need for high-value-added cleaning equipment and peripheral cleaning work, as well as aesthetic maintenance services in Japan, al-though the prolonged corporate restraints on cleaning management costs still continue.To cope with this market environ-ment, the Company focused on strengthening holistic cleanliness so-lutions by incorporating peripheral cleaning work and on strengthening proposals for the factory market. In addition, the division worked on ex-panding sales of scrubbers that real-ize higher safety levels and improved usability with higher work efficiency.Domestic sales for cleaning equip-
ment increased by ¥270 mill ion (14.3%) year-on-year, revenue from maintenance contracts and supplies services decreased by ¥346 million (11.3%), and revenue from commis-sioned cleaning services decreased by ¥633 million (41.3%).Overall overseas sales increased by ¥2,243 million year-on-year (53.8%), as sales for Nor th America grew owing to the continued contribu-tion from the wooden floor sanding equipment business.As a net result of the above, sales of this business division totaled ¥12,213 million, up by 25.6% year-on-year.
7
Analysis of Financial Condition
(i) Assets, liabilities, and net assets
• AssetsTotal assets as of March 31, 2016 amounted to ¥136,965 million, up by ¥5,405 million from the previous fiscal year-end. Current assets increased by ¥4,242 million year-on-year. This was attributable primarily to an increase of ¥1,715 million in trade notes and ac-counts receivable, an increase of ¥684 million in other current assets resulting from higher advance expenses, among other factors, and an increase of ¥330 million in raw materials and supplies. Fixed assets increased by ¥1,163 mil-lion year-on-year. The principal factors behind this was an increase of ¥997 million in intangible fixed assets result-ing from higher software in progress, among other factors, which exceeded the decrease of ¥431 million in tan-gible fixed assets.
• LiabilitiesTotal liabilities as of March 31, 2016 amounted to ¥41,359 million, up by ¥1,947 million year-on-year. Current liabilities increased by ¥3,153 million year-on-year. This was attributable primarily to an increase of ¥1,036 mil-
lion in accrued income taxes and an increase of ¥922 million in short-term bank loans. Fixed liabilities decreased by ¥1,205 million year-on-year. This was mainly due to a decrease of ¥1,482 million in long-term bank loans.
• Net AssetsTotal net assets as of March 31, 2016 amounted to ¥95,606 million, up by ¥3,457 million from the previous fiscal year-end. This was attributable primar-ily to an increase of ¥5,109 million in shareholders’ equity resulting from the recording of net income attributable to owners of the parent company, despite a decrease of ¥1,692 million in accumulated other comprehensive income owing to lower foreign cur-rency translation adjustments, among other factors.
(ii) Cash FlowsConsolidated cash and cash equiva-lents decreased by ¥2,199 million from the previous fiscal year-end to a total of ¥32,725 million as of March 31, 2016. The status of each type of cash flow at year-end and the under-lying factors are as follows.
(1) Cash flow from operating activitiesNet cash provided by operating ac-tivities totaled ¥13,420 million. This
was attributable primarily to income before income taxes amounting to ¥13,314 million, and depreciation and amortization amounting to ¥4,415 million, despite income taxes pay-ments amounting to ¥4,214 million and an increase in trade notes and ac-counts receivable of ¥2,049 million.
(2) Cash flow from investing activitiesNet cash used in investing activities totaled −¥6,608 million. This was mainly because, despite the record-ing of ¥10,364 million in proceeds from withdrawal of time deposits and ¥2,400 million in proceeds from re-demption of securities, the Company recorded expenditures amounting to ¥10,133 million in time deposits, ¥3,270 million to purchase intangible fixed assets, ¥2,906 million to pur-chase tangible fixed assets, and ¥2,000 million to purchase securities.
(3) Cash flow from financing activitiesNet cash used in financing activities amounted to −¥4,308 million. This was chiefly due to the recording of expenditures amounting to ¥3,293 mill ion in payment of dividends, ¥1,643 million in repayment of fi-nance lease obligations, and ¥341 mil-lion in repayment of short-term bank loans, despite the recording of ¥1,227 million in proceeds from sale and leaseback.
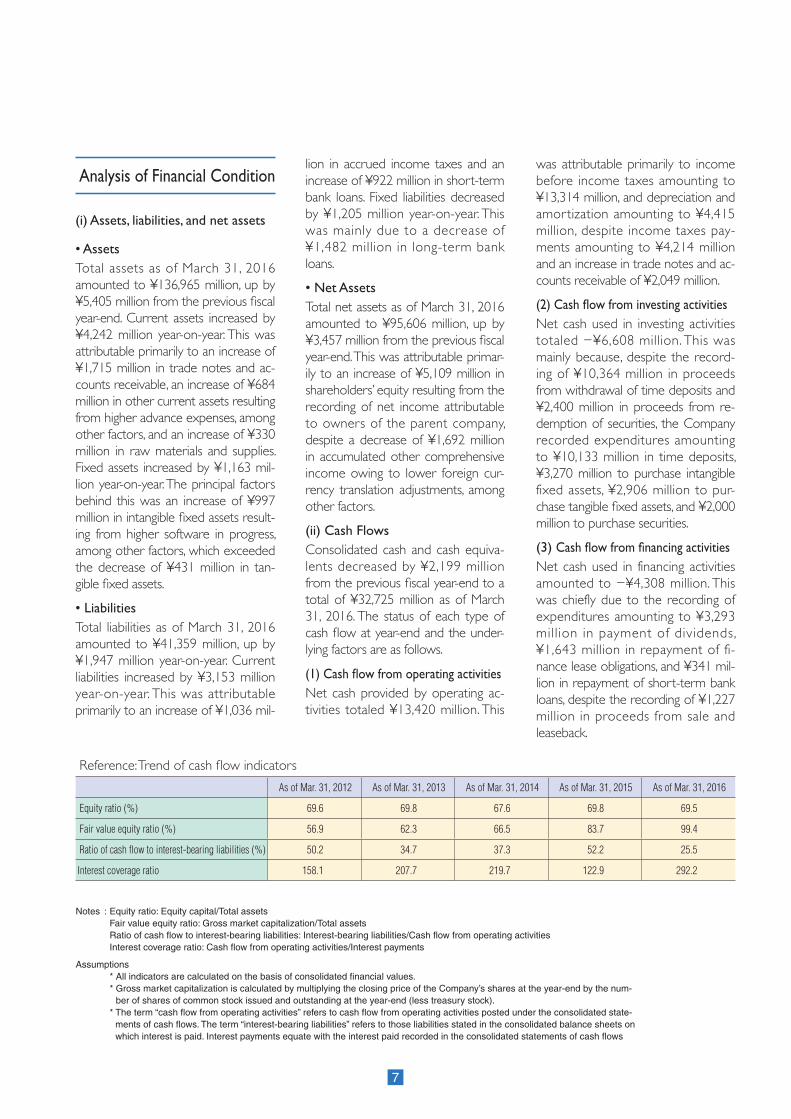
Notes : Equity ratio: Equity capital/Total assets Fair value equity ratio: Gross market capitalization/Total assets Ratio of cash flow to interest-bearing liabilities: Interest-bearing liabilities/Cash flow from operating activities Interest coverage ratio: Cash flow from operating activities/Interest payments
Assumptions * All indicators are calculated on the basis of consolidated financial values. * Gross market capitalization is calculated by multiplying the closing price of the Company’s shares at the year-end by the num-
ber of shares of common stock issued and outstanding at the year-end (less treasury stock). * The term “cash flow from operating activities” refers to cash flow from operating activities posted under the consolidated state-
ments of cash flows. The term “interest-bearing liabilities” refers to those liabilities stated in the consolidated balance sheets on which interest is paid. Interest payments equate with the interest paid recorded in the consolidated statements of cash flows
Reference: Trend of cash flow indicatorsAs of Mar. 31, 2012 As of Mar. 31, 2013 As of Mar. 31, 2014 As of Mar. 31, 2015 As of Mar. 31, 2016
Equity ratio (%) 69.6 69.8 67.6 69.8 69.5
Fair value equity ratio (%) 56.9 62.3 66.5 83.7 99.4
Ratio of cash flow to interest-bearing liabilities (%) 50.2 34.7 37.3 52.2 25.5
Interest coverage ratio 158.1 207.7 219.7 122.9 292.2

8
Outlook for the next fiscal year ending March 31, 2017
In the next fiscal year ending March 31, 2017, the Japanese economy will likely be characterized by a grow-ing uncer tainty about the future, with capital spending and personal consumption remaining lackluster, emerging market economies such as China experiencing a slowdown, and foreign exchange markets continuing to be unstable.Amid this business environment, Amano Corporation and its Group companies continue to emphasize the following strategies: 1) emphasis on Time & Ecology business do-mains, and enhancement of core business; 2) becoming a niche leader in the business domain in which we excel; 3) ceaseless restructuring; and 4) management based on cash flow. In line with these four fundamental strategies, we will work to address the impor tant challenges in the new medium-term business plan described in “Management Policy” on page 1 with a view to maximiz-ing the corporate value of Amano Corporation while aiming to be-come a 100-year Company having “Challenge to a New Stage” as its management concept.The following business results are projected for the next fiscal year ending March 31, 2017: net sales of ¥122,000 million, operating profit of ¥13,000 million, ordinary profit of ¥13,500 million, and net income
attr ibutable to parent company shareholder s of ¥8,800 mil l ion. These projections assume currency exchange rates of ¥109 to the US dollar and ¥122 to the euro.
Operating and Other Risk Factors
Matters relating to the qualitative information contained in these summary financial statements and relating to the consolidated financial statements that could be envisaged as having a possible material impact on investors are described below.Every effor t are made to identify factors that may now or in the fu-ture pose a risk to the undertaking of business by the Amano Group, and these risk factors are then elimi-nated or otherwise managed in the course of business.Forward-looking statements are cur-rent as of the date of the release of these financial results (April 25, 2016).
( i ) Impact on earnings due to changes in the business environ-ment
The Amano Group uses the unique technologies and know-how it has accumulated to provide customers with high-quality products, services and solutions, thereby gaining large market shares in each sphere of business in Japan, North America, Europe, and Asia, and developing its business globally.In the year ended March 31, 2016,
the Time Information System busi-ness accounted for 71.5% of total sales, and the Environment System business accounted for 28.5%. Be-fore the deduction of unallocated expenses, the Time Information Sys-tem business contributed 72.6% to operating profit, while the Environ-ment System business contributed 27.4%. In terms of weighted average sales over the last five years, the Time Information System business accounted for 72.7% of total sales and 75.3% of operating profit.
One future r isk factor is that i f market expansion is forecast for a business activity within the Time In-formation System business segment (which accounts for a large propor-tion of the Group’s business) for such reasons as a significant change in the demand structure or the creation of a new market, entities in other industries or other power-ful competitors may be tempted to enter the market. In such an event, if a competitor were to enter with innovative products or solutions that surpass Amano’s, the Amano Group’s market advantage would decline, which may have a material impact on its business performance.
(ii) Fluctuations in exchange rates
The Group engages in business activities on a global scale and has production and sales bases overseas. In view of this, the Group’s business results may be impacted by fluctua-tions in exchange rates when the

9
proceeds for overseas transactions are converted into yen.
(iii) Information security
In the course of providing system solutions and developing cloud busi-ness services (e.g., ASP, SaaS, and hosting services), the Amano Group handles confidential information, such as personal information con-cerning, or provided by, customers. In view of this, the Company has strengthened and thoroughly imple-mented security control measures based on the Information Security Management Rules. Specifically, the Company has implemented mea-sures to protect confidential infor-mation (e.g., encrypting hard disk drives and external media) as well as provided periodic staff training through e-learning. Furthermore, the Company obtained the Privacy Mark certification in February 2014 and has implemented all possible mea-sures to ensure information security, including super vision of ser vice providers and thorough compliance with internal rules. Nevertheless, the occurrence of an unforeseen situ-ation that results in loss or leakage of confidential or personal informa-tion as described above could have an adverse material impact on the Group’s business performance due to factors such as loss of confidence.
(iv) Natural disasters
Natural disasters (e.g., large-scale earthquakes, windstorms, or floods) may damage human lives or prop-
erty. The Amano Group continues to take necessary measures at ordi-nary times comprising: 1) imposition of requirement for employees to carry a disaster emergency contact card at all times; 2) development of emergency contact networks and personnel safety check system; 3) relocation of file servers to external data centers; 4) development of a preparedness for setting up the disaster management headquarters at the time an emergency occurs. However, in the event of a natural disaster, the Group may temporar-ily lose the ability to continue to perform its operating activities due to damage to its sales business sites and production bases, or to employ-ees experiencing difficulties in carry-ing out their duties.
(v) Overseas business development
The Amano Group has been devel-oping its business globally in Japan, Nor th America, Europe, and Asia. Therefore, there is a possibility that a situation may arise in which busi-ness operations are disrupted due to the application of unique laws, or-dinances, or regulations or social dis-order due to political disturbances, war, or terrorism, etc. in countries or regions where the Group conducts business, which may adversely im-pact the Group’s business perfor-mance.
Issues to Be Addressed
The Company will take the following steps to achieve the goals set out in its new medi-um-term business plan.
1) Time Information System business
•Information SystemsThe Information Systems business has seen potential demand for the time- and attendance-management system becoming actual demand. This system enables the em-ployer to develop or establish a work time management framework as an initiative to comply with “Perform Optimal Work Time Management” at a time when the Japanese government is leading the efforts to moni-tor companies with the aim of eliminating “Unpaid Overtime Work” and “Extended Work Hours (Overwork).” Moreover, against the background of the revision to the Labor Standards Act, which aims to facilitate diverse ways of working to improve labor productivity, we are likely to experience a growth in demand for corporate system replacements, as well as cloud- and smart device-based systems.In response to these market conditions, we will roll-out the new software product “Next-Generation Human Resource and Labor Management Package TimePro-NX,” as a product targeting the small- to medium-sized enterprise market, to further step up our holistic solutions covering not only time and attendance management, but also hu-man resource and payroll management. In such ways, we will expand our customer base through providing a “One Stop Ser-vice,” from hardware services through to software and cloud services. In the medium-
10
sized enterprise market, we will enter the financial accounting market by tying up with CREO CO., LTD. and work to expand op-erations with the aim of becoming a “mini-ERP vendor” by enhancing software for T&A, human resources, payroll, and accounting as well as strengthening our consulting sales activities.In overseas markets, we will expand and im-prove our cloud services in Europe and the United States. Moreover, Horoquartz, S.A. of France is aiming to expand into other mar-kets in Europe, while Accu-Time Systems Inc. of North America intends to bolster its customer base by expanding sales of its new series of devices.
•Parking SystemsThe Parking Systems business is witnessing a growth in the nation’s parking lot market owing to the real estate market becoming buoyant in advance of the 2020 Olympics. In addition to the need for parking lot manage-ment cost reduction, ensuring of safety and security in parking lots, and consideration of the environment, the need to propose solu-tions to improve user convenience has been increasing.Given this market environment, we aim to become a “parking facility service provider” by further strengthening tie-ups with major parking lot management companies while improving the functions and operability of system equipment as well as providing vari-ous services through our parking lot data center for small- and medium-sized parking lot management companies. In addition, we will strengthen and expand our efforts related to facilities such as security gates, toll roads, and bicycle parking lots in order to expand our business.
As for overseas markets, in the United States, Amano McGann, Inc. will step up sales of new systems and strengthen solu-tion proposals by expanding and improving peripheral services to enlarge the market. In Europe, we will accelerate the deployment of bar code system products while seeking to expand operations through newly engag-ing in the commissioned parking lot manage-ment services business. In Asia, we will aim to expand operations by developing new markets and bolstering the commissioned parking lot management service business.
2) Environment System business
•Environmental SystemsIn Environmental Systems, companies’ capital investment has remained solid in Japan and strong abroad.Given this market environment, in Japan we will aggressively capture demand mainly for standard equipment and expand sales in the pharmaceutical, food, and cosmetics markets, which are expected to grow steadily. We will also work to strengthen our engineering ca-pabilities and comprehensive sales, including that of peripheral equipment, by tie-ups with industrial equipment manufacturers with the aim of becoming a “global engineering multi-vendor.”In the overseas markets, we will further uti-lize the Philippines branch of Amano Time & Air Singapore Pte. Ltd. (ATAS) to strengthen and enhance our overseas network, step-up capabilities to provide engineering services to Japanese-owned corporate customers by strengthening the marketing and service framework for them through collaborations with Japan side and group companies, and improve cost competitiveness by expanding local procurement and assembly activities. In
North, Central and South America, we have established a local subsidiary in Mexico to continue expanding sales of standard equip-ment products to Japanese-owned corpo-rate customers operating locally, which are mainly automobile-related companies.
•Clean SystemsIn the Clean Systems, while the trend of companies trying to reduce cleaning costs continues, amid the aging of sanitary workers and an increase in the number of inexperi-enced workers, needs to improve safety and operability of cleaning equipment have been increasing. At the same time, the need for maintaining building aesthetics at low cost has also been increasing.In response to these market conditions, we will develop new markets for cleaning-robot products in Japan, develop the factory market more rigorously and expand sales of small-sized cleaning equipment targeting mini-sized supermarkets that have opened in urban areas and convenience store eat-in corners that are growing in number, thus bolstering our customer base in the country. With the aim of becoming a “total cleanli-ness service provider,” we also promote comprehensive proposals, including those for commissioned cleaning services and aes-thetic maintenance.In overseas markets, we will capitalize on the demand of Japanese-affiliated distribution companies opening up stores in the Asian region and further scale up our business by strengthening the operational foundation for the wooden floor sanding equipment division of Amano Pioneer Eclipse Corp. in North America.

11
Information Systems
Accelerating information terminal sales in the SME market Strengthening Proposals for Cloud solutions globallyIn Japan, amid the stronger Government-led initiatives encouraging companies to tighten their monitoring of employee work time, Amano’s information terminals and T&A software for the mid-sized companies market, the “TimePro-VG”, is selling well. With the aim to provide the latest human resource management solution, in April 2016, Amano released a new T&A soft-ware, “TimePro-NX” for the SME market, after a 10-year blank. The “TimePro-NX” complies with the latest rules and is com-patible to the various enterprise sizes, the industries along with the varying system environments, In addition, for Cloud services, regional ef-forts to meet the local market needs are underway globally. In Japan the T&A / HR ASP business by Amano Business Solu-tions Corp. is expanding steadily. In North America, Accu-Time Systems Inc. is provid-ing a Cloud-based data collection service through their information terminals and ERP vendor systems. And in Europe, Horo-quar tz S.A. is making progress with the SaaS version of their Workforce Manage-ment software.
Parking Systems
The “OPUS” series for the North American market is strong! Large projects increasing towards the 2020 Tokyo Olympics yearThe new “OPUS” series of North America is steadily winning orders for airpor ts, universities, and shopping centers etc. The new system is highly rated for its ability to support both online and offline applica-tions, 2-dimensional bar code tickets and a variety of payment methods. On the other hand, in Japan, large-scale development projects towards the 2020 Tokyo Olympics are increasing. In January 2016, the shopping center industry held a trade show “SC Business Fair 2016”, at which Amano exhibited the latest parking solutions such as the gate-type parking sys-tems, vehicle guidance systems, new park-ing fee discount systems, and LPR systems along with a case model of an installation at one of the latest large-scale shopping
center. The exhibits were well received and attracted much attention from the visitors. For parking management services, Amano will endeavor to strengthen its ability to provide comprehensive solutions including hardware, software and services placing particular emphasis on the “Parking Web”, a data service provided by the parking data center.
Environmental Systems
Standard equipment and large-scale systems continue to be firm The Mexican subsidiary is up and runningCapital expenditures by Japanese domestic companies remains firm and sales for stan-dard dust collectors along with large-scale systems are positive. Amano has renewed its flammable dust collectors specially designed for explosive dust such as aluminum and has introduced electric dust collectors dedicated for metal 3-D printers. By responding to new market needs, Amano shall continue its ef-forts to expand the market. As for overseas, in January 2016, Amano established a new subsidiary in Mexico, AMANO TIME & ECOLOGY DE MEXICO S.A. DE C.V. (abbr. AMX) in response to the rapidly expanding auto industry. AMX is situ-ated in Leon City Guanajuanto, which is the geographical center of many Japanese com-panies located in the region. AMX plans to enhance its engineering capabilities, strength-en its sales and service regime, and strive to improve cost competitiveness by increasing local procurement, assembly and to build a local supply chain.
Clean Systems
North American Market: Wooden Floor Sanding Business is the per-formance driver! Strengthening Sales of Robotic CleanersIn light of the strong housing and building market in Nor th America, the wooden
floor sanding business is steadily expanding. In addition, the strong wooden floor sand-ing business is creating a synergistic effect with other businesses such as cleaning ma-chines and chemicals, boosting the cleaning business as a whole.In Japan, the cleaning industry is struggling with aging workers and labor shortage and against this background, Amano is strength-ening its efforts to expand the sales of safe and efficient robotic vacuum cleaners and scrubbers. Amano plans to enhance its lineup of robotic cleaners and develop the series as mainstream products that reflect the market needs.
Social Contribution Activities
Signed up for a partner member-ship to the “Kodomo Eco-Club”!The “Kodomo Eco-Club” is a program sponsored by a public interest incorpo-rated foundation the Japan Environment Association which promotes environmen-tal activities for children from 3 to 18 years of age. With the support from local mu-nicipalities, private companies and various organizations, the association implements environmental activities through their na-tionwide office network. Since the business theme of Amano is “Time” and “Ecology”, it is important for Amano that children have a broad un-derstanding of how people relate to the environment, to foster the feeling that na-ture is precious, and to nurture the abilities to think and act autonomously in order to solve environmental problems. Amano believes that such programs will broaden regional environmental protection activi-ties and intends to support it as part of Amano’s CSR.
“Kodomo Eco-Club”
SC Business Fair 2016
Guanajuanto AMANO TIME & ECOLOGYDE MEXICO S.A. DE C.V.
Sanding Machine
Robotic Floor Scrubber
“SE-500iX II”
Commercial Robotic Vacuum Cleaner “RcDC”
Topics

12
Amano USA Holdings, Inc.
Amano Cincinnati, Inc.The ACI time division had a successful launch of its latest side printer time clock line. This allowed for the discontinuation of some older models and the consolidation of new models which increase the economies in our produc-tion environment. The release was well received by all sales chan-nels. The new product is currently in stores at our largest retail customer and is selling well. This new clock was designed with the custom-ers’ needs in mind, with its simplistic program-
ing functions it allows the customer to change the time, print configu-ration and other setting wi th the touch of a button. This new user friendly programming
design is sure to provide a positive customer experience and reduce calls to our support center. The next generation of PIX-3000x and TS-3000i are now in the early stages of develop-ment. The PIX-3000 has been a staple in our time clock product portfolio for many years. It is one of the bestselling and most robust side printers on the market. The PIX-3000 was sold in our domestic market as well as the interna-tional market and was available in many power configurations.T h e T S - 3 0 0 0 i w a s originally developed as a replacement for the P IX-3000xn and xnt and was designed to meet the needs of the financial trading market. However, we have seen the need for synchronized time reporting expand to other markets like health care, trans-portation, casino among others. The TS-3000i continues to be a strong product in our time clock line. The features and durability of this product continue to dominate the market. The development and manufacturing for this new series will be done in our Ohio factory and will incorporate the latest technology available. The consolidation of our administrative team to the Ohio factory has proven to be benefi-cial to both our customers and our internal technical team. Our administrative staff has been trained on time clock support and is able to assist our customers quickly. We are able to provide valuable customer feedback to our development and manufacturing team which
allows for prompt root cause analysis and cor-rective actions.
Accu-Time Systems, Inc.During 2015, Accu-Time Systems, Inc. (ATS) began preparations to celebrate its 25th year in business with the release of four new Work-force Management (WFM) data collection terminals. These terminals were developed in response to reseller demands for faster termi-nals with greater screen real estate, a full-color
display and a greater variety of biometric and other reader options. The new and improved terminals, members of the PeoplePoint family of ATS products, have garnered immediate acceptance by our value added resellers as demonstrated by the 11,000 units that shipped during the first year of production.
ATS’s TimeCom business, which in-tegrates our time clocks to a variety of enterprise re-source planning
(ERP) and human capital management (HCM) systems through the utilization of our cloud based integration middleware, grew steadily in 2015. Revenue from TimeCom business increased 280% over 2014 primarily due to a 42% increase in the number of TimeCom cus-tomers. These new customers resulted in an 86% increase in terminal sales with correspond-ing warranty products, professional services, and monthly hosting fees for our SaaS solution. The growth in the TimeCom business is largely attributed to our close relationships with our partners, our ability to further penetrate the ERP/HCM market space, and making gains in specific industries, including retail, manufactur-ing, higher education, and healthcare. Growth in the TimeCom segment of ATS’s business can be seen in the expansion of our hosted solution and terminal sales out-side of the United States. Worldwide, over 100,000,000 transactions per year are captured by ATS’s PeoplePoint products. A big factor in our TimeCom success is our ability to give our customers greater visibility and transparency into their employee activity taking place at the terminal through the use of our TimeCom Monitor. The TimeCom Monitor is an easy to use web portal that is customer facing and allows Accu-Time’s customers to gain visibility
into the health and status of their em-ployee t ime clock deployment, as well as the integrat ion with their ERP system. With the TimeCom Monitor, users can gain insight into average up time for all devices across the entire clock deployment, as well as information about the employees such as their badge numbers or employee demographic data that’s interfacing with the ERP system. The TimeCom Monitor allows our customers to get ahead of potential problems before they occur. TimeCom Moni-tor gives customers with global, regionalized or localized IT support the ability to monitor their clock deployment and see problems that may occur with user behavior, the integration, or the network infrastructure. Having access to this information allows them to solve these problems before they have a negative impact on the payroll process. ATS is committed to listening to the demands of the market and providing quality and value to our customers. The evolution of the PeoplePoint family of terminals, TimeCom and the TimeCom Monitor have successfully dem-onstrated our commitment in 2015.
Amano McGann, Inc.
General OverviewAmano McGann, Inc. (AMI) reported record numbers for revenue and pre-tax profit for 2015, surpassing all planned and prior year financial performance by a significant margin. The key drivers for 2015 financial performance include the dealer network, with new repre-sentative ITR (GA) and the Northeast and Southeast U.S. region branches. Dealers sur-passed the prior year’s revenue by 39%, while the Northeast and Southeast regions exceeded 2015 revenue by 20% and 40% respectively. In addition, the Metric On-Street direct product sales doubled from the prior year.It’s noteworthy that, in 2015, OPUS produc-tion was forecast at 40% and magstripe at 60%. The actual product mix indicates the strong market acceptance of OPUS with almost 60% of the production dedicated to OPUS.Core ProductsThe OPUSeries® line of parking devices were designed using the latest system architecture and communication platforms, leveraging the advanced features of AMI’s industry leading software solutions, iParcProfessional® and OPUSuite®.iParcProfessional is AMI’s on-premise pow-erhouse application that has evolved over 20
Sends employeedemographic data
TimeCom Hosted Solution
ERP/HCM SolutionEngine XML
TM
Validates employeedemographic data
Sends employeedemographic data,software updates,
clock configurationsto terminal
Sends raw datafrom terminalin/out, lunch,
break, transfer
Receives raw datafrom terminal
in near real-timein/out, lunch,
break, transfer( ) ( )

13
dressable market segment for the future.Major Project AwardsAMI continues to see a steady rise in the sale of OPUSeries equipment. The advanced barcode technology and extensive feature set have secured the award of major projects across the country. AMI was awarded the Lam-bert-St. Louis International Airport contract in July 2015 which includes 64 lanes of OPUSe-ries equipment in two parking garages and five surface lots. The City of Sacramento contract marked another significant award in November 2015 and includes 34 lanes of OPU-Series terminals to be installed in five parking facilities. The system wi l l offer patrons vis-ibility to available parking, options to prepay for parking, and the ability enter and exit facilities with relatively no delay. This project also provides a platform to develop new features and functions that will expand AMI’s product offerings and competi-tive advantage.
Amano Pioneer Eclipse CorporationAmano Pioneer Eclipse Corporation (APEC) grew 26.5% in 2015, continuing a string of six consecutive years of growth. APEC, which manufactures and sells products under the Pioneer Eclipse, American Sanders, and Amano Environmental Americas brands, enjoyed reve-nue growth in every product category in 2015, led by an impressive 109% growth in cleaning machines.APEC’s Pioneer Eclipse cleaning business had an unprecedented year of success, finish-ing 2015 with growth of 41%. The cleaning
machine category led the way as Pioneer Eclipse was awarded private label man-ufacturing contracts with three major cleaning equip-ment OEMs. Additionally, the Strategic Accounts sales team landed the propane burnisher business at a ma-jor US grocery store chain
and the propane burnisher business at one of the world’s largest big-box retailers. This was aided by a small April 2015 acquisition, allow-ing Pioneer Eclipse to improve its product position at a major US retailer while also im-proving its product portfolio and gross margins in the high volume floor machine category. In the cleaning chemical category, Pioneer Eclipse
years to become the most feature rich and successful parking software in the industry. OPU-Suite is AMI’s next generation of cloud-based solutions designed to provide advanced fea-tures, functionality and expansion to iParcPro-fessional’s current install base as well as future projects. These advanced and stylish solutions are per-fect for both medium and high-volume loca-tions where a superior customer experience with flexible payment options is a must. AMI’s unique, encrypted 2D barcode ticket technol-ogy is more secure than traditional magstripe tickets with the added value of lower consum-able costs. Expanded ProductsOverture™ has established itself as an international player in over 30 countries as Xparc. I t h a s now been enhanced to meet the unique require-ments of the small and medium-volume locations in North America. Overture was released for sale in November of 2015 at the Dealer Conference in Japan.The Overture product line was featured at the Parking Industry Exhibition in Las Vegas in Feb-ruary where it was well-received. It will also be highlighted at various parking industry shows in 2016, including the Expo Seguridad in Mexico City, International Parking Institute (IPI) Exposi-tion in Nashville, National Parking Association show in Atlanta and the Canadian Parking As-sociation in Ottawa, Canada.Overture was installed in its first North Ameri-can location in February with two additional installations scheduled for April and June. We look forward to a successful 2016 with the Overture product line. The Amano Multi-Space-Meter (MSM) Pow-ered by Metric continues to be deployed in expanded geographic areas across the U.S. with continued growth in Ontario, Canada. New installations include the states of Califor-nia, Texas, Minnesota and Alabama. The New Jersey account base continues to grow organi-cally. In addition, the On-Street maintenance service business via NowCare® grew by 35%. Metric will be launching a new MSM pay sta-tion, SPRITE, which was debuted at the IPI Expo in May 2016. SPRITE is a product that was developed specifically to capture the On-Street market which will create a larger ad-
posted its third consecutive year of growth in the private label segment of the market. Invest-ments in new labeling equipment helped grow this category 86% in 2015. Private label now represents 13% of APEC’s annual chemical sales.T h e A m e r i c a n S a nde r s wood f l o o r b u s i n e s s has continued to grow into an im-portant part of APEC’s overall portfolio. Origi-nally acquired in March, 2014, American Sand-ers contributed 31% growth in 2015. While the continued strength of the US housing and construction markets contributed to the strong sales year, R&D investments in product improvements and new product introductions were well received in the marketplace. One example is the HydraSand Multi-Head Sanding disc which exceeded its 2015 sales forecast by 120%.
APEC’s Amano Environ-mental Americas (AEA) business grew 13% in 2015. The business was led by 25% growth in the equipment category, its
fourth consecutive year of double digit equip-ment growth. The performance of this business was further highlighted by a 27% improvement in gross margins, which was the result of im-proved manufacturing processes and pricing strategies.In 2015, APEC continued to improve its sales and marketing presence. The company par-ticipated in a record number of trade shows in 2015, both in the US and internationally. These trade shows included four major US shows as well as international shows in Canada, Mexico and Brazil. Additionally, new sales personnel were hired in Northern Europe, Canada, and the United States.
Amano Europe Holdings, N.V.
Amano Europe, N.V.I n 2 0 1 5 A m a n o Europe continued to grow both rev-enue and profit in the main business segments; parking solutions and time and at-tendance. The X-Parc parking solution has been installed successfully in 30 different countries worldwide. With X-Parc Amano offers a robust, flexible

14
and network centric solution. The traditional VALUE-Line has been extended with an ECO-Line to serve niche markets and a SMART-line focusing on cloud- and mobile services. Ease of integration, low cost of ownership, fast time to market and quality assurance are the four cor-nerstones to drive success. With X-Parc range, Amano is positioning itself in the global mobil-ity market as a solution and service provider.
Astrow Cloud, the next genera-tion of the proven T&A software solution for small and medium sized businesses, is getting widely accepted in several European countries with around 10,000 actual users. The key drivers to
success are mobility, flexibility and appeal. iTR-100 is now sold all over Europe through different channels. iTR-100 stretches on the typical time recorder functionality by offering new and compelling cloud services, like online support , payro l l and reporting. Ultimately, iTr-100 is also the entry point for a further and seamless upgrade towards Astrow Cloud.
Amano Time & Parking Spain, S.A.It is commonly known that Gibraltar is a British overseas territory, although it is geographically located on the southern end of the Iberian Peninsula. It has an area of 6,7km2 and 32.000
people live there. The offi-cial language of Gibraltar is English, but most locals are bilingual, speaking Spanish. Its currency is Gibraltar Pound.This Gibraltar market is our sales territory, where
7 car parks use AMANO machines. One of them is a large and emblematic car park with approximately 1.000 parking lots. Last year 2015, we won this project and our X-Parc ma-chines were installed. By penetrating into the Gibraltar market, we keep a high reputation in Gibraltar and a good relation with a governmental company who manages car parks there. Thanks to such a presence, a potential new project is now under negotiation. We wish it become the 8th. car park in Gibraltar with AMANO machines.
Horoquartz, S.A.During 2015 Horoquartz observed a steady growth of its activities in the major business lines as the market leader in France. In Octo-ber 2015 Horoquartz acquired ARGOSSE, a
French company specialized in access control and related services, in order to enforce the access control division of Horoquartz. The workforce management division was reorga-nized geographically in order to be able to serve the customers better and faster, more specifically the big accounts, which constitute a growing part of the business of Horoquartz not only in the French market but also worldwide. Horoquartz continued to invest in optimization software, like planning solutions, as this is a key driver of the workforce management busi-ness. Specific attention is given to the growing demand of cloud solutions. All Horoquartz
solutions are part of an in-tegrated solution, which al-lows Horoquartz to act like Single Point of Contact in a wide range of HR manage-ment needs.
Amano International Trading (Shanghai) Co., Ltd.
AITS has achieved the first installation of AMANO QR code Parking system in China.The distinctive feature of the system is that it operates by recognizing license plates and printing QR code tickets.Once a license plate is recognized, drivers can freely enter the parking lot without extracting the tickets.On the other hand, ticket extracting entry is also available when license plates are not rec-ognized.Customers can make payment on the auto-matic pay station before they exit. The charges can be referred by using QR code ticket or typing their car numbers on the machine.Furthermore, customers can also make a pay-
ment via smartphones.No matter where customer is, they can make electronic payment by scanning their QR code on the ticket.If they terminate the payment, the drivers can exit without halting.We will vigorously promote this QR code parking system hereafter.
Amano Malaysia Sdn. Bhd.
AMANO MALAYSIA has set up Park-ing management service department to diversify and expand the business.We have employed an experienced staff member in management service field, and we manage four parking systems so far. These facts show that we are entirely involved in this new business. In June 2016, we received the order of parking management service from TESCO PUCHONG, the first outlet of TESCO in Malaysia, who is the third world’s largest retail company.This parking lot has 745 car spaces and has three lanes for each exit and entry way. The parking lot was for free before, however, they have started being troubled with illegal park-ing from two months ago, derived from the new-establishment of LRT station next to the store. Therefore, they decided to charge some amount of money in parking in order to exclude those illegal parking by introducing the parking system. They sought the parking management company which provides the system installation and parking management. As a result of competition, AMANO Malaysia was able to receive the order. The manage-ment service will start on 7th of July and we are preparing in a rush for opening under Ramadan month. The parking system will open for 24 hours and we will place the staff(s) at each management office from 8 A.M. to 11 P.M. TESCO has already opened over 20 stores in Malaysia, and we expect to make the next management contract in rest stores.The parking management business in Malaysia is very competitive as there exist about 30 rival companies including both small and large. Nevertheless, we set our goal of No.1 Park-ing management service company in Malaysia equivalent to Parking equipments sales in near future. We will be implementing the strong marketing continuously.Our sales in Parking equipment also increases well as time goes. This year, AMANO X-Parc system will be installed in Empire city, the new
eTemptationSuite
WORKFORCE MANAGE-
MENT
EMPLOYEE SELF-SERVICE
JOB COSTING
ACTIVITYMANAGEMENT
WORKFORCE SCHEDULING
ADVANCED WORKFORCE SCHED-
ULING
MEDIUM AND LONG-TERM SCHEDULING
COMMUNI-CATION
INTERFACE
TimeManagementWORKFORCE
MANAGE-MENT
EMPLOYEE SELF-SERVICE
ACCESSCONTROL
JOB COSTING
ACTIVITYMANAGEMENT
WORKFORCE SCHEDULING
ADVANCED WORKFORCE SCHEDULING
MEDIUM AND LONG-TERM
SCHEDULING
COMMUNI-CATION
INTERFACE

15
Promoted by the Shinsegae Group, the Starfield FIRST HAMAM project is the largest of its kind in Korea. The complex was named with the hope that it will be adored by all, like a “star field”, and that it will attract many people. In addition, there are sever-al new constructions of community-based shopping malls such as Dangdaegu Complex T.C and Samsung Shinsegae mall (marketing already underway with an estimated value of approximately 250 million yen). AKC is placing all efforts not to miss such opportu-nities and win orders by demonstrating its unique expertise in this field. “LPR begins to evolve! Cargate, Electronic display and LPR has become an all-in-one unit.”
Combi LPR (Combination LPR)As part of AKC’s efforts to reduce costs and strengthen competitiveness, AKC has con-tinued its research and development of LPR (License Plate Recognition) products. Recently AKC has developed and launched an all-in-one LPR product called the “Combi LPR”, which is particularly suited for places with limited space for installation such as on slopes and plinths. This unique feature is well received by the market and proving effective in winning com-petitive tenders.
“On-street parking system meets the EV charger”
Flapless LPR & Charger systemAKC is a joint participation company in an IOT venture project promoted by the Information Planning Team of Seoul city and has intro-duced the flapless LPR system. This system was installed as an on-street parking system at the resident-priority street parking in Bukchon Hanok Village with the collaboration of Modu Company. In addition, AKC plans to install flap-less LPR systems equipped with EV chargers
allowing EV owners to charge their vehicles while parking.
The EV charging unit will be housed inside the casing of the flapless LPR unit itself so that it remains compact and does not interfere with pedestrians.
AKC believes that its ability to accurately grasp market changes and customer needs forms the foundation of its product appeal and market-ing strengths. As such, AKC will continue and refine its customer-oriented management by expanding its branch network to fuel devel-opment of products that will enable AKC to achieve sustained growth.
commercial large facility in Kuala Lumpur. The parking lot has 10,000 car spaces and hold 20 entry, 18 exit lanes and 37 units of entry pay station. This parking system will be the largest scale in AMANO Malaysia history. The facility is under construction and it is presumed that it will open within this year.
Amano Korea Corporation
AKC’s first time ever exclusive orders for large-scale projects!
Starfield FIRST HANAM & Dongdaegu Complex transfer centerThe competition in the parking control systems market is becoming increasingly fierce and amid such a market, the only way to stay ahead is to possess parking systems utilizing cameras which are still rare among the rivals. AKC possessing such systems, succeeded in winning two large projects this year.
Installation site 1. Installation site 2.
Starfield FIRST HANAM
Dongdaegu Complex T.C
1 Total area 459,498m2 338,194m2
2 Ground area 117,990m2 162,881m2
3 Scheduled opening Sept 2016 Dec 20164 Parking capacity 5,000 cars 2,678 cars
5 TenantsDepartment store, multiplex, hotel, shop-ping malll
Department store, multiplex, shopping mall, metro station, express train station(KTX)
6 Building 4 stories above and 4 stories below
9 stories above and 7 stories below
7 AKC sales value 5.6 billion KRW( 510 million JPY)
2.6 billion KRW (240 million JPY)
Outline:
Starfield FIRST HANAM
Dongdaegu Complex T.C
1License plate recogni-tion unit (recognizes the front and rear)
18 6
2License plate recogni-tion unit (recognizes
the front)22 5
3 Automatic pay station(KIOSK type) 41 14
4 Exit automatic pay station 16 5
5Fixed camera guid-
ance system(for 4 car spaces)
1723 1020
6 Indicator light 415 2887 Car gate 53 118 CCTV camera 546 269
Per/unitThe components of notable parking system
Installation example Front
Image
LPR Part Electronic display Gate partPower supply AC220V, 60Hz AC220V, 60Hz AC220V, 60Hz
Powerconsumption 200W (Max.) 75W (Max.) 110W (Max.)
Camera 1.3 MegapixelCMOS sensor GigE
Communication:Eternet
Driving mecha-nism:BLDC motor
LED 64×64 2 lines, 6 letters per line
Opening and closing time 1.5~3 seconds
Main specifications
Dongdaegu Complex transfer center
Starfield FIRST HANAM

Yen in millions and U.S.dollars in thousands, except per share amounts - See Note 4 to the Consolidated Financial Statements.
Note: U.S. dollar amounts have been translated at the rate of ¥113 = US $1, the rate prevailing on March 31, 2016. - See Note 4 to the Consolidated Financial Statements.
16
AMANO Corporation and Subsidiaries
Financial HighlightsFor the years ended March 31, 2016
0
1000
2000
3000
4000
5000
6000
7000
8000
9000
'15'13 '14'12 '16
Net Sales Net Income Net Income Per Share
'15'13 '14'12 '16 '15'13 '14'12 '16
(Millions of Yen) (Millions of Yen) (Yen)
0
10000
20000
30000
40000
50000
60000
70000
80000
90000
100000
110000
120000
130000
0.00
20.00
40.00
60.00
80.00
100.00
120.00
Millions of Yen Thousands of U.S.dollars(Note 4)
2016 2015 2016
For the years ended March 31:
Net sales .................................................................. ¥119,506 ¥109,837 $1,057,578
Net income ............................................................... 8,405 6,794 74,386
Per share data (Yen and U.S. Dollars):
Net income per share (Basic) ..................................... ¥109.75 ¥88.71 $0.971
Cash dividends per common share ............................. 48.00 38.00 0.425
At March 31:
Total assets............................................................... ¥136,965 ¥131,560 $1,212,087
Working capital ........................................................ 51,741 50,653 457,890
Total net assets ......................................................... 95,606 92,148 846,077
Sales by product:
Time information systems ......................................... ¥25,512 ¥23,558 $225,778
Time management equipment.................................... 4,165 4,100 36,859
Parking systems ........................................................ 55,784 51,817 493,665
Environmental systems ............................................. 21,830 20,639 193,189
Cleaning systems ...................................................... 12,213 9,720 108,087
17
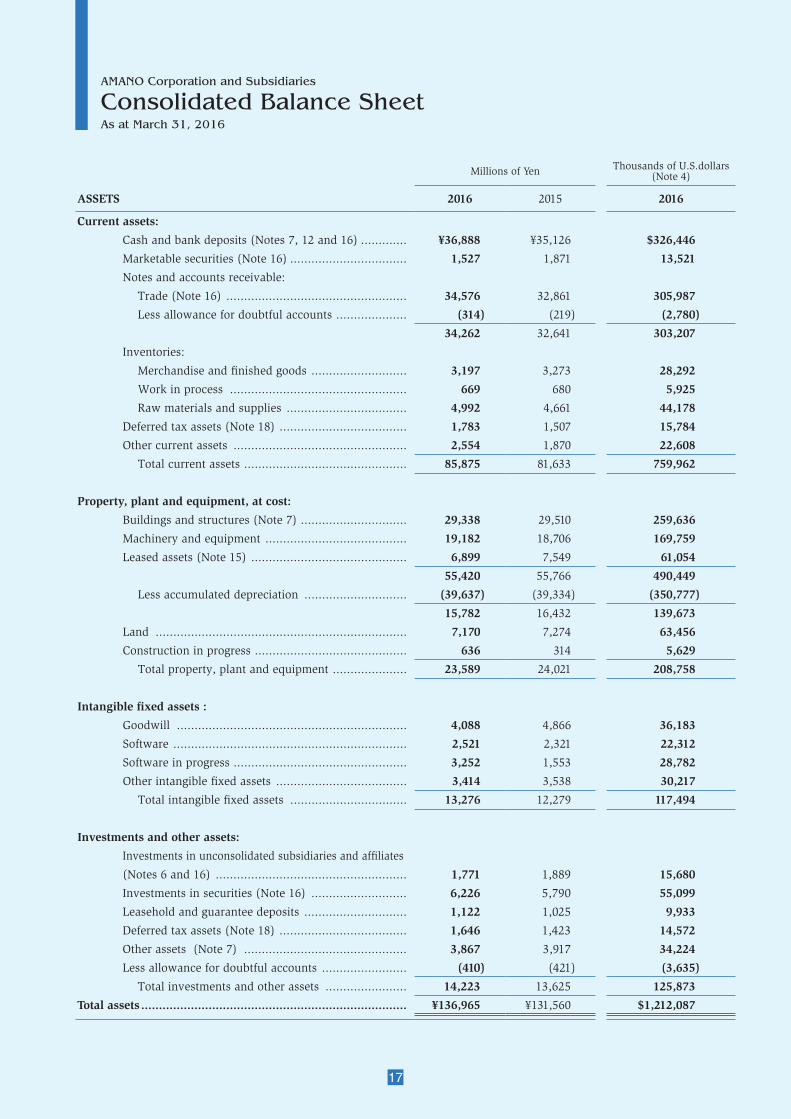
AMANO Corporation and Subsidiaries
Consolidated Balance SheetAs at March 31, 2016
Millions of Yen Thousands of U.S.dollars(Note 4)
ASSETS 2016 2015 2016
Current assets:
Cash and bank deposits (Notes 7, 12 and 16) ............. ¥36,888 ¥35,126 $326,446
Marketable securities (Note 16) ................................. 1,527 1,871 13,521
Notes and accounts receivable:
Trade (Note 16) ................................................... 34,576 32,861 305,987
Less allowance for doubtful accounts .................... (314) (219) (2,780)
34,262 32,641 303,207
Inventories:
Merchandise and finished goods ........................... 3,197 3,273 28,292
Work in process .................................................. 669 680 5,925
Raw materials and supplies .................................. 4,992 4,661 44,178
Deferred tax assets (Note 18) .................................... 1,783 1,507 15,784
Other current assets ................................................. 2,554 1,870 22,608
Total current assets .............................................. 85,875 81,633 759,962
Property, plant and equipment, at cost:
Buildings and structures (Note 7) .............................. 29,338 29,510 259,636
Machinery and equipment ........................................ 19,182 18,706 169,759
Leased assets (Note 15) ............................................ 6,899 7,549 61,054
55,420 55,766 490,449
Less accumulated depreciation ............................. (39,637) (39,334) (350,777)
15,782 16,432 139,673
Land ....................................................................... 7,170 7,274 63,456
Construction in progress ........................................... 636 314 5,629
Total property, plant and equipment ..................... 23,589 24,021 208,758
Intangible fixed assets :
Goodwill ................................................................. 4,088 4,866 36,183
Software .................................................................. 2,521 2,321 22,312
Software in progress ................................................. 3,252 1,553 28,782
Other intangible fixed assets ..................................... 3,414 3,538 30,217
Total intangible fixed assets ................................. 13,276 12,279 117,494
Investments and other assets:
Investments in unconsolidated subsidiaries and affiliates
(Notes 6 and 16) ...................................................... 1,771 1,889 15,680
Investments in securities (Note 16) ........................... 6,226 5,790 55,099
Leasehold and guarantee deposits ............................. 1,122 1,025 9,933
Deferred tax assets (Note 18) .................................... 1,646 1,423 14,572
Other assets (Note 7) .............................................. 3,867 3,917 34,224
Less allowance for doubtful accounts ........................ (410) (421) (3,635)
Total investments and other assets ....................... 14,223 13,625 125,873
Total assets ........................................................................... ¥136,965 ¥131,560 $1,212,087
18
The accompanying notes are an integral part of these statements.
Millions of Yen Thousands of U.S.dollars(Note 4)
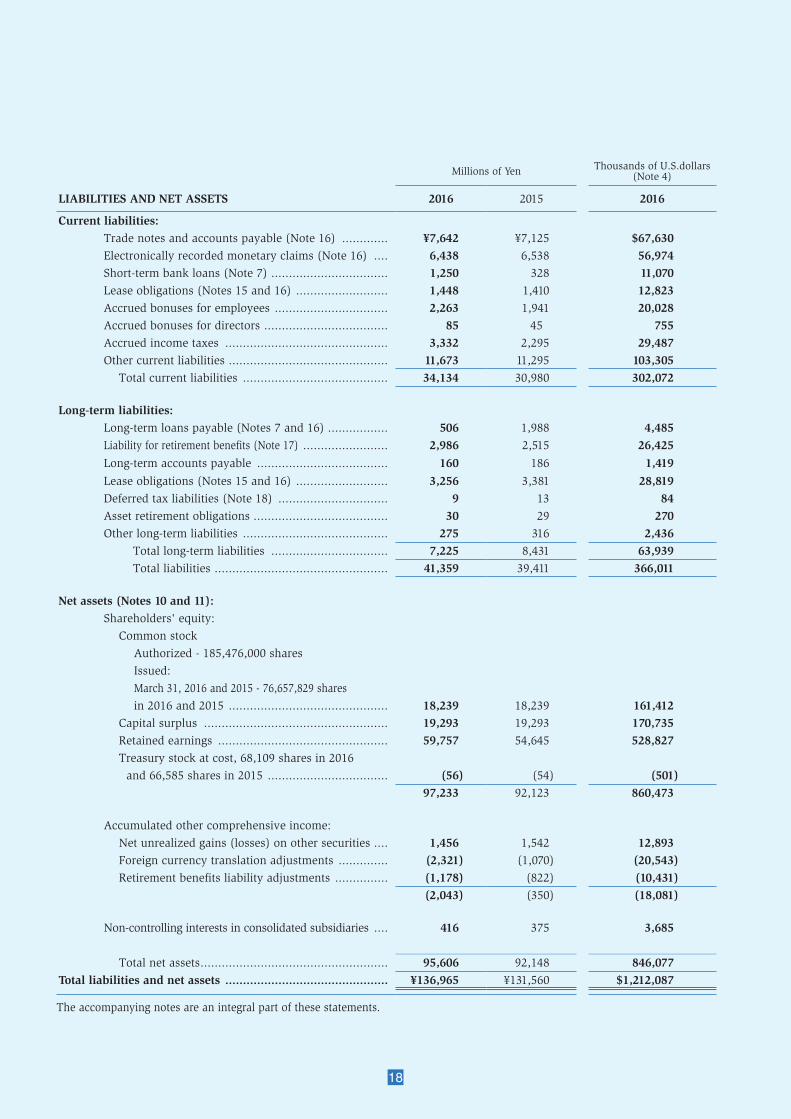
LIABILITIES AND NET ASSETS 2016 2015 2016
Current liabilities:Trade notes and accounts payable (Note 16) ............. ¥7,642 ¥7,125 $67,630 Electronically recorded monetary claims (Note 16) .... 6,438 6,538 56,974 Short-term bank loans (Note 7) ................................. 1,250 328 11,070 Lease obligations (Notes 15 and 16) .......................... 1,448 1,410 12,823 Accrued bonuses for employees ................................ 2,263 1,941 20,028 Accrued bonuses for directors ................................... 85 45 755 Accrued income taxes .............................................. 3,332 2,295 29,487 Other current liabilities ............................................. 11,673 11,295 103,305
Total current liabilities ......................................... 34,134 30,980 302,072
Long-term liabilities:Long-term loans payable (Notes 7 and 16) ................. 506 1,988 4,485 Liability for retirement benefits (Note 17) ........................ 2,986 2,515 26,425
Long-term accounts payable ..................................... 160 186 1,419
Lease obligations (Notes 15 and 16) .......................... 3,256 3,381 28,819 Deferred tax liabilities (Note 18) ............................... 9 13 84 Asset retirement obligations ...................................... 30 29 270 Other long-term liabilities ......................................... 275 316 2,436
Total long-term liabilities ................................. 7,225 8,431 63,939 Total liabilities ................................................. 41,359 39,411 366,011
Net assets (Notes 10 and 11):Shareholders' equity:
Common stock
Authorized - 185,476,000 shares
Issued:
March 31, 2016 and 2015 - 76,657,829 shares
in 2016 and 2015 ............................................. 18,239 18,239 161,412 Capital surplus .................................................... 19,293 19,293 170,735 Retained earnings ................................................ 59,757 54,645 528,827 Treasury stock at cost, 68,109 shares in 2016
and 66,585 shares in 2015 .................................. (56) (54) (501)97,233 92,123 860,473
Accumulated other comprehensive income:
Net unrealized gains (losses) on other securities .... 1,456 1,542 12,893 Foreign currency translation adjustments .............. (2,321) (1,070) (20,543)Retirement benefits liability adjustments ............... (1,178) (822) (10,431)
(2,043) (350) (18,081)
Non-controlling interests in consolidated subsidiaries .... 416 375 3,685
Total net assets ..................................................... 95,606 92,148 846,077 Total liabilities and net assets .............................................. ¥136,965 ¥131,560 $1,212,087

19
AMANO Corporation and Subsidiaries
Consolidated Statement of Income, and Consolidated Statement of Comprehensive IncomeFor the years ended March 31, 2016
The accompanying notes are an integral part of these statements.
Consolidated Statement of Comprehensive Income
Consolidated Statement of Income
Millions of Yen Thousands of U.S.dollars(Note 4)
2016 2015 2016
Net sales ¥119,506 ¥109,837 $1,057,578 Cost of sales (Note 9) ........................................................... 66,575 62,221 589,162
Gross profit 52,930 47,616 468,416 Selling, general and administrative expenses (Notes 8 and 9) 39,988 38,259 353,877
Operating income 12,942 9,357 114,539 Other income ( expenses ):
Interest and dividend income .................................... 249 291 2,211 Interest expense ....................................................... (46) (61) (409)Equity in earnings of affiliates ................................... 148 59 1,315 Foreign exchange gain (loss) .................................... (80) 151 (714)Gain on sale of fixed assets ....................................... 5 7 49 Loss on disposal of fixed assets ................................. (71) (61) (637)Loss on sale of fixed assets ....................................... (28) (0) (249)Extra retirement payments ......................................... – (38) –Gain (loss) on sale of shares of consolidated subsidiaries and affiliates (Note 19) ........................... (8) 385 (77)Impairment loss on fixed assets (Note 13) .................. (236) (175) (2,093)Other, net ................................................................ 439 391 3,890
Income before income taxes and non-controlling interests ....... 13,314 10,307 117,825 Income taxes (Note 18):
Current .................................................................... 5,208 3,921 46,094 Deferred .................................................................. (411) (555) (3,642)
Income before non-controlling interests ............... 8,517 6,941 75,374 Non-controlling interests in net income of consolidated subsidiaries .... (111) (146) (988)
Net income ........................................................... ¥8,405 ¥6,794 $74,386
Millions of Yen Thousands of U.S.dollars(Note 4)
2016 2015 2016
Income before non-controlling interests ............................... ¥8,517 ¥6,941 $75,374
Other comprehensive income (loss) (Note 14):Net unrealized gains (losses) on other securities ........ (82) 958 (731)Translation adjustments ........................................... (1,267) 2,442 (11,215)Retirement benefits liability adjustments ................... (356) (10) (3,152)Share of other comprehensive income (loss) of companies
accounted for by the equity method ........................ (17) 22 (154)
Total other comprehensive income (loss) ................ (1,723) 3,414 (15,253)Comprehensive income ....................................................... ¥6,793 ¥10,355 $60,121
Total comprehensive income attributable to:Shareholders of the Company ................................... ¥6,713 ¥10,162 $59,409 Non-controlling interests .......................................... ¥80 ¥192 $713

20
AMANO Corporation and Subsidiaries
Consolidated Statement of Changes in Net AssetsFor the years ended March 31, 2016
Millions of Yen Shareholders’ equity
Common stock Capital surplus Retained earnings Treasury stock Total shareholders’ equity
Balance at April 1, 2015 ¥18,239 ¥19,293 ¥54,645 (¥54) ¥92,123 Changes during the year
Dividends from surplus (3,293) (3,293)Net income 8,405 8,405 Purchase of treasury stock (2) (2)Retirement of treasury stock –Change in the scope of consolidation –Net changes in items other than shareholders' equity
Total changes during the year – – 5,112 (2) 5,109
Balance at March 31, 2016 ¥18,239 ¥19,293 ¥59,757 (¥56) ¥97,233
Accumulated other comprehensive income Non-controlling interests in
consolidated subsidiaries
Total net assetsNet unrealized gains (losses) on other securities
Foreign currency translation
adjustments
Retirement benefits liability
adjustments
Total accumulated other comprehensive
income (loss)Balance at April 1, 2015 ¥1,542 (¥1,070) (¥822) (¥350) ¥375 ¥92,148 Changes during the year
Dividends from surplus (3,293)Net income 8,405 Purchase of treasury stock (2)Retirement of treasury stock –Change in the scope of consolidation –Net changes in items other than shareholders' equity (85) (1,250) (356) (1,692) 40 (1,651)
Total changes during the year (85) (1,250) (356) (1,692) 40 3,457
Balance at March 31, 2016 ¥1,456 (¥2,321) (¥1,178) (¥2,043) ¥416 ¥95,606
Accumulated other comprehensive income Non-controlling interests in
consolidated subsidiaries
Total net assetsNet unrealized gains (losses) on other securities
Foreign currency translation
adjustments
Retirement benefits liability
adjustments
Total accumulated other comprehensive
income (loss)Balance at April 1, 2015 $13,652 ($9,477) ($7,278) ($3,104) $3,325 $815,475
Changes during the yearDividends from surplus (29,145)
Net income 74,386
Purchase of treasury stock (22)
Retirement of treasury stock –
Change in the scope of consolidation –
Net changes in items other than shareholders' equity (759) (11,065) (3,152) (14,977) 360 (14,618)
Total changes during the year (759) (11,065) (3,152) (14,977) 360 30,601
Balance at March 31, 2016 $12,893 ($20,543) ($10,431) ($18,081) $3,685 $846,077
Thousands of U.S. dollars (Note 4)Shareholders’ equity
Common stock Capital surplus Retained earnings Treasury stock Total sharehold-ers’ equity
Balance at April 1, 2015 $161,412 $170,735 $483,586 ($480) $815,254 Changes during the year
Dividends from surplus (29,145) (29,145)Net income 74,386 74,386 Purchase of treasury stock (22) (22)Retirement of treasury stock –Change in the scope of consolidation –Net changes in items other than shareholders' equity
Total changes during the year – – 45,241 (22) 45,219
Balance at March 31, 2016 $161,412 $170,735 $528,827 ($501) $860,473

21
Millions of Yen Shareholders’ equity
Common stock Capital surplus Retained earnings Treasury stock Total shareholders’ equity
Balance at April 1, 2014 ¥18,239 ¥19,293 ¥49,298 (¥52) ¥86,778 Cumulative effect of change in accounting principle 1,012 1,012 Restated balance at April 1, 2014 18,239 19,293 50,310 (52) 87,791 Changes during the year
Dividends from surplus (2,450) (2,450)Net income 6,794 6,794 Purchase of treasury stock (2) (2)Retirement of treasury stock –Change in the scope of consolidation (9) (9)Net changes in items other than shareholders' equity
Total changes during the year – – 4,334 (2) 4,332
Balance at March 31, 2015 ¥18,239 ¥19,293 ¥54,645 (¥54) ¥92,123
Accumulated other comprehensive income Non-controlling interests in
consolidated subsidiaries
Total net assets
Net unrealized gains (losses) on other securities
Foreign currency translation
adjustments
Retirement benefits liability
adjustments
Total accumulated other comprehen-sive income (loss)
Balance at April 1, 2014 ¥574 (¥3,481) (¥812) (¥3,718) ¥422 ¥83,482 Cumulative effect of change in accounting principle 1,012 Restated balance at April 1, 2014 574 (3,481) (812) (3,718) 422 84,495 Changes during the year
Dividends from surplus (2,450)Net income 6,794 Purchase of treasury stock (2)Retirement of treasury stock –Change in the scope of consolidation (9)Net changes in items other than shareholders' equity 967 2,410 (10) 3,367 (46) 3,320
Total changes during the year 967 2,410 (10) 3,367 (46) 7,653
Balance at March 31, 2015 ¥1,542 (¥1,070) (¥822) (¥350) ¥375 ¥92,148
The accompanying notes are an integral part of these statements.

22
AMANO Corporation and Subsidiaries
Consolidated Statement of Cash FlowsFor the years ended March 31, 2016
The accompanying notes are an integral part of these statements.
Millions of Yen Thousands of U.S.dollars(Note 4)
2016 2015 2016
Cash Flows from Operating Activities: Income before income taxes and non-controlling interests .. ¥13,314 ¥10,307 $117,825
Depreciation and amortization .................................. 4,415 4,137 39,075 Amortization of goodwill .......................................... 789 765 6,986 Impairment loss on fixed assets ................................ 236 175 2,093 Increase (decrease) in liability for retirement benefits ..... 19 (15) 170Increase (decrease) in allowance for doubtful accounts ...... 105 (54) 938 Interest and dividend income .................................... (249) (291) (2,211)Equity in earnings of affiliates .................................. (148) (59) (1,315)Interest expenses ..................................................... 46 61 409 Foreign currency translation (gain) loss ..................... 3 (101) 30 Extra retirement payments ......................................... – 38 –(Gain) loss on sale of shares of consolidated subsidiaries .... – (385) –(Gain) loss on sale of fixed assets ............................. 22 (7) 199 Loss on disposal of fixed assets ................................. 71 61 637 (Increase) decrease in trade notes and accounts receivable ...... (2,049) (3,494) (18,140)(Increase) decrease in inventories ............................. (297) (1,007) (2,629)Increase (decrease) in trade notes and accounts payable ..... 544 973 4,817 Others ....................................................................... 513 787 4,546 Subtotal ..................................................................... 17,337 11,889 153,430 Interest and dividends received ................................. 308 280 2,734 Interest paid ............................................................ (45) (61) (406)Payment for extra retirement payments ...................... – (38) –Income taxes paid .................................................... (4,214) (4,585) (37,295)Income taxes refunded .............................................. 34 32 301
Net cash provided by operating activities .............. 13,420 7,518 118,763 Cash Flows from Investing Activities:
Payment for purchase of marketable securities .......... (2,000) (2,000) (17,699)Proceeds from redemption of marketable securities ........... 2,400 2,300 21,239 Payment for purchase of property, plant and equipment ..... (2,906) (2,238) (25,721)Proceeds from sale of property, plant and equipment ......... 73 20 654 Payment for acquisition of intangible assets .............. (3,270) (1,738) (28,945)Payment for acquisition of investments in securities .......... (603) (56) (5,339)Proceeds from sale of investments in securities .......... 216 – 1,916 Increase in time deposits .......................................... (10,133) (7,541) (89,675)Decrease in time deposits ......................................... 10,364 6,299 91,725 Payment for acquisition of investments in subsidiaries resulting in change in scope of consolidation ............ (410) – (3,636)Proceeds from sales of investments in subsidiaries resulting in change in scope of consolidation ............ – 394 –Payment for business acquisition .............................. (235) (2,044) (2,085)Loans to third parties ............................................... – (10) –Collection of loans ................................................... 5 4 51 Others ..................................................................... (109) 92 (968)
Net cash used in investing activities ..................... (6,608) (6,519) (58,482)Cash Flows from Financing Activities:
Repayment of short-term bank loans ......................... (341) (445) (3,021)Repayment of long-term debt .................................... (215) – (1,905)Payment for acquisition of treasury stock .................. (2) (2) (22)Repayments of finance lease obligations .................... (1,643) (1,668) (14,547)Proceeds from sale and leaseback ............................. 1,227 1,622 10,866 Dividends paid ......................................................... (3,293) (2,450) (29,145)Dividends paid to non-controlling interests ................. (39) (25) (353)
Net cash used in financing activities ..................... (4,308) (2,969) (38,126)Effect of exchange rate changes on cash and cash equivalents ...... (304) 719 (2,692)Net increase (decrease) in cash and cash equivalents .............. 2,199 (1,250) 19,463 Cash and cash equivalents at beginning of year ....................... 30,526 31,674 270,146 Increase due to inclusion in consolidation ............................... – 102 –Cash and cash equivalents at end of year (Note 12) ................ ¥32,725 ¥30,526 $289,609

23
AMANO Corporation and Subsidiaries
Notes to the Consolidated Financial Statements
1. Basis of Consolidated Financial Statements
The accompanying consolidated finan-cial statements of AMANO Corporation [hereafter, “the Company”] and its subsidiaries have been prepared in ac-cordance with the provisions set forth in the Japanese Financial Instruments and Exchange Act and its related ac-counting regulations in Japan. The ac-counts of the Company and domestic subsidiaries included in the consolida-tion are based on the accounting records maintained in accordance with account-ing principles generally accepted in Ja-pan, which are different in certain re-spects as to the application and the disclosure requirements of Interna-tional Financial Reporting Standards. The information in the consolidated fi-nancial statements is derived from the original text, scope, and the nature of that information, and is therefore lim-ited to that contained in the original text. As permitted by the Financial Instru-ments and Exchange Act, amounts of less than one million yen have been rounded off. As a result, the totals shown in the accompanying consoli-dated financial statements (both in yen and U.S. dollars) do not necessarily agree with the sums of the individual amounts. Certain amounts in the prior year’s financial statements have been reclassified to conform to the current year’s presentation.
2. Principles of Consolidation
(1) Scope of Consolidation
The Company had 26 consolidated subsidiaries at March 31, 2016. The accompanying consolidated financial statements include the accounts of the Company and those of its subsidiaries that are controlled by the Company. Under the control concept, major sub-sidiaries in which the Company is able to exercise control over operations are to be fully consolidated. The accounts of the overseas consolidated subsidiar-
on the declining balance method, based on the estimated useful lives, except for buildings acquired on or after April 1, 1998 computed on the straightline method. The ranges of the useful lives of assets are:Buildings and structures 5-50 yearsMachinery and vehicles 7-17 yearsNormal repairs and maintenance, including minor renewals and im-provements, are charged to income as incurred.
(4) Intangible Assets
Intangible assets are amortized using the straight-line method. Software costs for internal use are amortized by the straight-line method over their expected useful lives (five years). Software devel-oped for external sale is amortized over the estimated sales period, 3 years.Goodwill is amortized over the esti-mated useful life, or where the amount of goodwill is immaterial, is charged to income in the year of acquisition.
(5) Leased Assets
Leased assets in finance lease transac-tions not involving transfer of ownership are depreciated by the straight-line method over the term of the lease, with a residual value of zero.
(6) Accounting for Financial Instruments
(a) DerivativesAll derivatives are stated at their fair values, with changes in fair value in-cluded in net profit or loss for the period in which they arise.(b) SecuritiesSecurities held by the Company and its subsidiaries are classified into four cat-egories;Trading securities, which are held for the purpose of generating profits on short-term differences in prices, are stated at their fair values, with changes in fair values included in net profit or loss for the period in which they arise. Additionally, securities held in trusts for trading purposes are accounted for in the same manner as trading securities.
ies are consolidated using their financial statements as of their respective fiscal year end, which falls on December 31, 2015 and necessary adjustments are made to their financial statements to reflect any significant transactions from January 1 to March 31, 2016. All sig-nificant intercompany balances and transactions have been eliminated in consolidation.
(2) Accounting for Investments in Unconsolidated Subsidiaries and Affiliates
None of the 5 unconsolidated subsidiar-ies are accounted for by the equity method, because the effect of their net income or losses and retained earnings on the accompanying consolidated fi-nancial statements is immaterial. The affiliates accounted for by the equity method are listed below:- Creo Co., Ltd.In addition, Parkinsys Technology Co., Ltd. was excluded from the scope of the appli- cation of the equity method due to the sale of Amano’s sharehold-ing in the Company during the year ended March 31, 2016.
3. Summary of Significant Accounting Policies
(1) Cash and Cash Equivalents
Cash and cash equivalents consist of cash on hand, cash in banks which can be withdrawn at any time and short-term investments with a maturity of three months or less when purchased which can easily be converted to cash and are subject to little risk of change in value.
(2) Inventories
Inventories are stated at cost (write-down due to reduced profitability). Cost is determined principally using the pe-riodic average method.
(3) Property, Plant and Equipment
Property, plant and equipment are stated at cost, less accumulated de-preciation. Depreciation is computed

24
Held-to-maturity debt securities, that the Company and its subsidiaries have in-tent to hold to maturity, are stated at their costs after accounting for any premium or discount on acquisition, which are amortized over the period to maturity. Investments of the Company in equity securities issued by uncon-solidated subsidiaries and affiliates are accounted for by the equity method. Exceptionally, investments in certain unconsolidated subsidiaries and affili-ates are stated at cost because the effect of application of the equity method would be immaterial. Other securities for which market quotations are avail-able are stated at fair value. Net unreal-ized gains or losses on these securities are reported as a separate item in the net assets section at a net-of-tax amount. Other securities for which market quota-tions are unavailable are stated at cost, except as stated in the paragraph below. In cases where the fair value of held-to-maturity debt securities, equity securi-ties issued by unconsolidated subsidiar-ies and affiliates, or other securities had declined significantly and such impair-ment of the value is not deemed tempo-rary, those securities are written down to the fair value and the resulting losses are included in net profit or loss for the period.
(7) Foreign Currency Translation
Foreign currency transactions are trans-lated using foreign exchange rates pre-vailing at the respective transaction dates. Receivables and payables in foreign currencies are translated at the foreign exchange rates prevailing at the respective balance sheet dates and the resulting transaction gains or losses are included in net profit or loss for the period.
(8) Translation of Foreign Currency Financial Statements (Accounts of Overseas Subsidiaries)
Foreign currency denominated state-ments of overseas consolidated sub-
sidiaries have been translated into Japanese yen using the method pre-scribed by the Business Accounting Deliberation Council of Japan. All the balance sheet accounts of foreign subsidiaries and affiliates are trans-lated at the foreign exchange rates prevailing at the respective balance sheet dates except for common stock and capital surplus. On the other hand, all the profit and loss accounts are translated at the average foreign exchange rates for the respective pe-riods. Differences arising from transla-tion are presented as “Foreign cur-rency translation adjustments” and “Non-controlling interests in consoli-dated subsidiaries” in the accompany-ing consolidated financial statements.
(9) Income Taxes
The Company recognizes the tax effect of temporary differences between the carrying amounts and the tax basis of assets and liabilities. The provision for income taxes is computed based on the pretax income included in the consoli-dated statement of income. The asset and liability approach is used to recog-nize deferred tax assets and liabilities for the expected future tax consequenc-es of temporary differences.
(10) Allowance for Doubtful Accounts
In general, the Company and its subsid-iaries provide the allowance based on the past receivables loss experience for a certain reference period. Furthermore, for receivables from companies with financial difficulty, which could affect the debtors’ ability to perform their obligations, the allowance is provided for estimated unrecoverable amounts individually.
(11) Retirement Benefits
The Company and some of its subsidiar-ies recognize accrued pension and severance costs to employees based on the actuarial valuation of projected
benefit obligation and plan assets at their value. The retirement benefit ob-ligation for employees is attributed to each period by the benefit formula method. Prior service costs are amor-tized based on the straight-line method over a period of ten years. Actuarial gains and losses are amortized based on the straight-line method over a pe-riod of ten years starting from the begin-ning of the subsequent year.
(12) Accrued Employees’ Bonuses
Accrued employees’ bonuses at the bal-ance sheet date are based on an estimate of the amounts to be paid as bonuses for services rendered by employees by that date.
(13) Accrued Directors’ Bonuses
Accrued directors’ bonuses at the bal-ance sheet date are based on an estimate of the amounts to be paid as bonuses for servises rendered by directors by that date.
(14) Research and Development Expenses
Research and development expenses are charged to income as incurred.
(15) Net Income and Dividends per Share
Basic net income per share is computed based on the net income and the weight-ed average number of shares of common stock outstanding during each period. Diluted net income per share is com-puted based on the net income available for distribution to the shareholders and the weighted-average numbers of shares of common stock outstanding during each year after giving effect to the dilutive potential of shares of common stock to be issued upon the exercise of stock subscription rights and stock options. Cash dividends per share shown for each fiscal period in the accompanying con-solidated statement of income represent actual dividends declared as applicable to a common stock during the respective fiscal period.

25
(16) Revenue from Construction Contracts
Revenues and costs of construction contracts are recognized by the percent-age-of-completion method in case the percentage of completion for each con-tract can be reliably estimated. The percentage of completion is measured by the percentage of total costs incurred to date to estimated total costs for each contract. The completed-contract meth-od is applied to the contracts in case the percentage of completion cannot be reli-ably estimated.
(17) Accounting for Consump-tion Taxes
Transactions subject to consumption taxes are recorded at amounts exclusive of consumption taxes.
(18) Accounting Changes
Effective the fiscal year ended March 31, 2016, the Company began to apply the Revised Accounting Standard for Busi-ness Combinations (Accounting Stan-dards Board of Japan (ASBJ) Statement No. 21 of September 13, 2013, hereinaf-ter referred to as the Business Combina-tions Accounting Standard), the Revised Accounting Standard for Consolidated Financial Statements (ASBJ Statement No. 22 of September 13, 2013, hereinaf-ter referred to as the Consolidation Ac-counting Standard), and the Revised Accounting Standard for Business Dives-titures (ASBJ Statement No. 7 of Sep-tember 13, 2013, hereinafter referred to as the Business Divestitures Accounting Standard). The Company changed to an accounting method in which it records as capital surplus any differences arising from changes to its equity in subsidiaries that remain under the Company’s con-trol, and it records the corresponding acquisition-related costs as expenses for the fiscal year in which the costs were incurred. For business combinations implemented from April, 2015, the com-pany has changed to an accounting method in which revised acquisition cost allocation amounts are reflected in the
consolidated financial statements for the fiscal year in which the business combi-nation occurs, based on the finalization of provisional accounting treatment. In addition, the Company changed its pre-sentation method for net income, replac-ing the term “minority interests” with the term “non-controlling interests.” To re-flect this change in presentation, the Company reclassified its consolidated financial statements for the fiscal year ended March 31, 2015.
Cash flows for the cost of the acquisition of shares of a subsidiary involving a change in the scope of consolidation were categorized in the consolidated statement of cash flows for the fiscal year ended March 31, 2016 within “Cash Flows from Operating Activities.”
The Company applied the accounting standards for business combinations effective from the April, 2015 pursuant to the transitional treatment stipulated in Article 58-2 (4) of the Business Combina-tions Accounting Standard, Article 44-5 (4) of the Consolidation Accounting Standard, and Article 57-4 (4) of the Business Divestitures Accounting Stan-dard.
The above-mentioned changes to ac-counting policies had only a negligible effect on the consolidated financial state-ments of the Company for the fiscal year ended March 31, 2016.
4. United States Dollar Amounts
The Company maintains its accounting records in Japanese yen. The U.S. dollar amounts included in the consolidated financial statements and notes thereto represent the arithmetical results of translating Japanese yen to U.S. dollars at a rate of ¥ 113 = US$1, the approxi-mate effective rate of exchange prevail-ing on March 31, 2016. The inclusion of U.S. dollar amounts is solely for convenience of readers outside Japan and is not intended to imply that yen amounts could be converted, realized,
or settled in U.S. dollars at that, or any other rate.
5. Standards Issued but Not Yet Effective
On March 28, 2016, the ASBJ issued “Revised Implementation Guidance on Recoverability of Deferred Tax Assets “ (ASBJ Guidance No. 26).
(1) Overview
Regarding the treatment of the recover-ability of deferred tax assets, a review was conducted following the framework of the Japanese Institute of Certified Public Accountants Audit Committee Report No. 66 “Audit Treatment on Determining the Recoverability of De-ferred Tax Assets, “whereby companies are categorized into five categories and deferred tax assets are calculated based on each of these categories.* Treatment of companies that do not
satisfiy any of the category require-ments for (Category 1) through (Cat-egory 5)
* Category requirements for (Category 2) and (Category 3)
* Treatment related to future deductible temporary differences which cannot be scheduled in companies that qualify as (Category 2)
* Treatment related to the reasonable estimable period of future pre-adjust-ed taxable income in companies that qualify as (Category 3)
* Treatment in cases that companies that satisfy the category requirements for (Category 4) but qualify as (Category 2) or (Category 3)
(2) Scheduled date of adoption
The Company expects to adopt the re-vised implementation guidance from the beginning of the fiscal year ending March 31, 2017.
(3) Impact of adopting revised implementation and guid-ance
The Company is currently evaluating the effect of adopting this revised implemen-tation guidance on its consolidated finan-cial statements.

26
6. Investments in Unconsolidated Subsidiaries and Affiliates
Among investments in securities, the amount in aggregate corresponding to unconsolidated subsidiaries and affiliates at March 31, 2016 and 2015 is as follows:
Millions of Yen Thousands of U.S.dollars ( Note 4 )
2016 2015 2016Investments in equity securities ¥1,633 ¥1,750 $14,451 Others 138 138 1,221
8. Selling, General and Administrative Expenses
Selling, general and administrative expenses during the years ended March 31, 2016 and 2015 principally include:
Millions of Yen Thousands of U.S.dollars ( Note 4 )
2016 2015 2016Employees' bonuses ¥1,615 ¥1,371 $14,292 Directors' bonuses 65 45 575 Retirement benefits 1,283 1,232 11,354 Salaries and allowances 17,799 16,795 157,513 Allowance for doubtful accounts 71 (30) 628
7. Assets Pledged as Collateral and Obligations Secured by Collateral
As at March 31, 2016 and 2015, the following assets were pledged as collateral:
As at March 31, 2016 and 2015, such collateral secured the following obligations:
Millions of Yen Thousands of U.S.dollars ( Note 4 )
2016 2015 2016Cash and bank deposits ¥61 ¥65 $540 Buildings and structures 32 35 283 Long-term bank deposits 2 2 18
Millions of Yen Thousands of U.S.dollars ( Note 4 )
2016 2015 2016Short-term bank loans ¥5 ¥16 $44 Long-term loans payable – 5 –
¥5 ¥21 $44
9. Research and Development Costs
Research and development costs included in selling, general and administrative expenses and manufacturing cost for the years ended March 31, 2016 and 2015 are as follows:
Millions of Yen Thousands of U.S.dollars ( Note 4 )
2016 2015 2016Research and development costs ¥1,374 ¥1,465 $12,159

27
10. Changes in Shareholders’ Equity
Changes in “Shares issued and outstanding” and “Shares of treasury stock” during the period from April 1, 2015 to March 31, 2016 are as follows:
(1) Shares issued and outstanding Share type As of April 1, 2015 Increase Decrease As of March 31, 2016
Common stock (shares) 76,657,829 – – 76,657,829
(2) Shares of treasury stock Share type As of April 1, 2015 Increase Decrease As of March 31, 2016
Common stock (shares) 66,585 1,524 – 68,109
(Reason of change) The increase in the number of shares is due to the purchases of shares less than one unit.
Changes in “Shares issued and outstanding” and “Shares of treasury stock” during the period from April 1, 2014 to March 31, 2015 are as follows:
(1) Shares issued and outstanding Share type As of April 1, 2014 Increase Decrease As of March 31, 2015
Common stock (shares) 76,657,829 – – 76,657,829
(Reason of change) The decrease in the number of shares is due to the retirement of treasury stock.
(2) Shares of treasury stock Share type As of April 1, 2014 Increase Decrease As of March 31, 2015
Common stock (shares) 64,808 1,777 – 66,585
(Reason of change) The increase in the number of shares is due to the purchases of shares less than one unit.
11. Dividends
Information on dividends for the fiscal year ended March 31, 2016 is as follows:
(1) Dividends paid
Resolution Share type Total dividend(Millions of Yen)
Total dividend(Thousands of U.S.dollars)
Dividend per share(Yen)
Dividend per share(U.S.dollars) Date of record Effective date
Ordinary general meeting of shareholders, June 26, 2015 Common stock ¥1,761 $15,589 ¥23 $0.204 March 31, 2015 June 29, 2015
Board of directors meeting, October 29, 2015 Common stock ¥1,531 $13,556 ¥20 $0.177 September 30,
2015"December 2,
2015
(2) Dividends for which the date of record falls in the fiscal year, but the effective date is after the end of the fiscal year.
Resolution Share type Dividendfunding
Total dividend(Millions of Yen)
Total dividend(Thousands of U.S.dollars)
Dividend per share(Yen)
Dividend per share(U.S.dollars)
Date of record
Effective date
Ordinary general meeting of shareholders, June 29, 2016
Common stock
Retained earnings ¥2,144 $18,973 ¥28 $0.248 March 31, 2016 June 30, 2016
Information on dividends for the fiscal year ended March 31, 2015 is as follows:
(1) Dividends paid
Resolution Share type Total dividend(Millions of Yen)
Dividend per share(Yen) Date of record Effective date
Ordinary general meeting of shareholders, June 27, 2014 Common stock ¥1,302 ¥17 March 31, 2014 June 30, 2014
Board of directors meeting, November 5, 2014 Common stock ¥1,148 ¥15 September 30, 2014 December 2, 2014
(2) Dividends for which the date of record falls in the fiscal year, but the effective date is after the end of the fiscal year.
Resolution Share type Dividendfunding
Total dividend(Millions of Yen)
Dividend per share(Yen) Date of record Effective date
Ordinary general meeting of shareholders, June 26, 2015 Common stock Retained earnings ¥1,761 ¥23 March 31, 2015 June 29, 2015

28
12. Cash and Cash Equivalents
Reconciliations of cash and cash equivalents to the amounts shown in the consolidated balance sheet as at March 31, 2016 and 2015 are as follows:
Millions of Yen Thousands of U.S.dollars( Note 4 )
2016 2015 2016Leased assets ¥1,377 ¥1,117 $12,186 Lease obligations 1,278 1,707 11,310
(Supplemental disclosure of non-cash transactions) The significant non-cash transactions for the years ended March 31, 2016 and 2015 are as follows:
Current assets ¥ 420 millionNon-current assets ¥ 188 millionTotal assets ¥ 608 millionCurrent liabilities ¥ 124 millionNon-current liabilities ¥ 34 millionTotal liabilities ¥ 158 million
For the year ended March 31, 2016, the carrying value at the time of sale of the assets and liabilities of the former subsidiary, Scopus-Omnibadges, S.A.S., which was deconsolidated as a result of its sale, was as follows:
Millions of Yen Thousands of U.S.dollars( Note 4 )
2016 2015 2016Cash and bank deposits ¥36,888 ¥35,126 $326,446 Marketable securities 1,527 1,871 13,521
Sub total 38,416 36,998 339,967 Time deposits due over three months (4,589) (5,070) (40,616)Marketable securities due over three months (1,100) (1,401) (9,742)Cash and cash equivalents ¥32,725 ¥30,526 $289,609
Method to Group Assets:
The Company and its subsidiaries group assets according to minimum units that generate cash flows essentially independent from the cash flows of other assets or groups of assets.
Recognition of Impairment Losses: In the year ended March 31, 2015, certain idle assets related to the manufacturing integration of parking management equipment in Amano Corporation were identified. In addition, the total amount of projected future cash flows from the business-use assets of Accu-Time Systems, Inc. fell below the book value. As a result, the book values of these assets were reduced to the recoverable amounts, and the reductions were recognized as impairment losses based on US-GAAP.
In the year ended March 31, 2016, the remarkable change of using method occured in Amano USA Holdings, Inc. As a result, the book values of these assets were reduced to the recoverable amounts, and the reductions were recognized as impairment losses based on US-GAAP.
Calculation of Recoverable Amount: In the year ended March 31, 2015, the recoverable amount for the idle assets of Amano Corporation is reasonably estimated based on the value in use. Future cash flows were determined to be zero.
In the year ended March 31, 2016, the recoverable amount for the buildings and structures of Amano USA Holdings, Inc. is a net sale value based on a real estate judgment valuation.
13. Impairment Loss on Fixed Assets
Impairment loss on fixed assets for the years ended March 31, 2016 and 2015 is summarized as follows:
Location Purpose of use CategoryMillions of Yen Thousands of U.S.dollars
( Note 4 )
2016 2015 2016Amano Corporation (Japan) Idle assets Buildings and structures – ¥155 –
Idle assets Machinery and equipment – 0 –Amano USA Holdings, Inc. (U.S.A.) Head office Buildings and structures ¥236 – $2,093 Accu-Time Systems, Inc. (U.S.A.) Business use Other intangible fixed assets – 18 –
Total ¥236 ¥175 $2,093
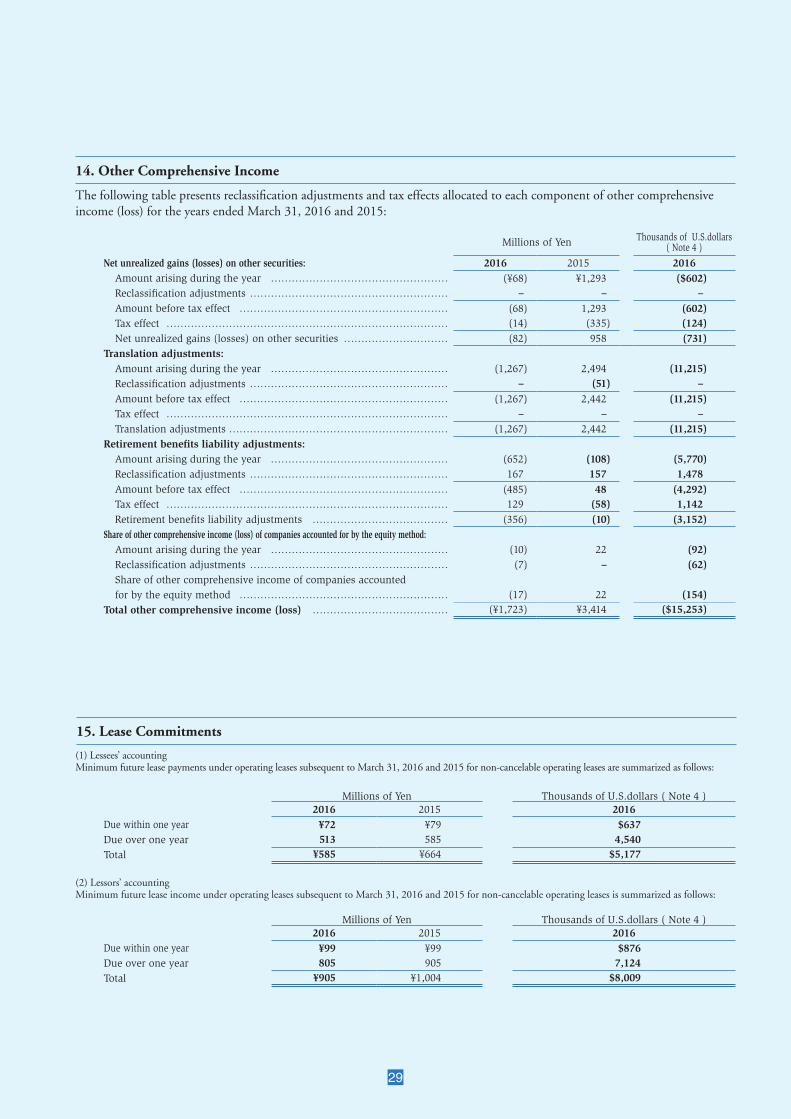
29
14. Other Comprehensive Income
The following table presents reclassification adjustments and tax effects allocated to each component of other comprehensive income (loss) for the years ended March 31, 2016 and 2015:
Millions of Yen Thousands of U.S.dollars( Note 4 )
Net unrealized gains (losses) on other securities: 2016 2015 2016Amount arising during the year …………………………………………… (¥68) ¥1,293 ($602)Reclassification adjustments ………………………………………………… – – –Amount before tax effect …………………………………………………… (68) 1,293 (602)Tax effect ……………………………………………………………………… (14) (335) (124)Net unrealized gains (losses) on other securities ………………………… (82) 958 (731)
Translation adjustments:Amount arising during the year …………………………………………… (1,267) 2,494 (11,215)Reclassification adjustments ………………………………………………… – (51) –Amount before tax effect …………………………………………………… (1,267) 2,442 (11,215)Tax effect ……………………………………………………………………… – – –Translation adjustments ……………………………………………………… (1,267) 2,442 (11,215)
Retirement benefits liability adjustments:Amount arising during the year …………………………………………… (652) (108) (5,770)Reclassification adjustments ………………………………………………… 167 157 1,478 Amount before tax effect …………………………………………………… (485) 48 (4,292)Tax effect ……………………………………………………………………… 129 (58) 1,142 Retirement benefits liability adjustments ………………………………… (356) (10) (3,152)
Share of other comprehensive income (loss) of companies accounted for by the equity method:Amount arising during the year …………………………………………… (10) 22 (92)Reclassification adjustments ………………………………………………… (7) – (62)Share of other comprehensive income of companies accounted for by the equity method …………………………………………………… (17) 22 (154)
Total other comprehensive income (loss) ………………………………… (¥1,723) ¥3,414 ($15,253)
15. Lease Commitments
(1) Lessees’ accountingMinimum future lease payments under operating leases subsequent to March 31, 2016 and 2015 for non-cancelable operating leases are summarized as follows:
(2) Lessors’ accountingMinimum future lease income under operating leases subsequent to March 31, 2016 and 2015 for non-cancelable operating leases is summarized as follows:
Millions of Yen Thousands of U.S.dollars ( Note 4 )2016 2015 2016
Due within one year ¥72 ¥79 $637 Due over one year 513 585 4,540 Total ¥585 ¥664 $5,177
Millions of Yen Thousands of U.S.dollars ( Note 4 )2016 2015 2016
Due within one year ¥99 ¥99 $876 Due over one year 805 905 7,124 Total ¥905 ¥1,004 $8,009

30
16. Financial Instruments
Millions of Yen Thousands of U.S.dollars ( Note 4 )2016 2016
Carryingvalue
Estimatedfair value
Differencein amounts
Carryingvalue
Estimatedfair value
Differencein amounts
(1) Cash and bank deposits ¥36,888 ¥36,888 – $326,446 $326,446 –(2) Notes and accounts receivable 34,576 34,576 – 305,987 305,987 –(3) Marketable securities and investments in securities
① Held-to-maturity 1,350 1,348 (¥1) 11,947 11,929 ($9)② Subsidiaries and affiliates 1,582 1,005 (577) 14,000 8,894 (5,106)③ Other securities 6,026 6,026 – 53,327 53,327 –
Total (Assets) ¥80,423 ¥79,844 (¥578) $711,708 $706,584 ($5,115)(4) Trade notes and accounts payable ¥7,642 ¥7,642 – $67,630 $67,630 –(5) Electronically recorded monetary claims 6,438 6,438 – 56,974 56,974 –
Total (Liabilities) ¥14,080 ¥14,080 – $124,602 $124,602 –
Millions of Yen2015
Carryingvalue
Estimatedfair value
Differencein amounts
(1) Cash and bank deposits ¥35,126 ¥35,126 –(2) Notes and accounts receivable 32,861 32,861 –(3) Marketable securities and investments in securities
① Held-to-maturity 1,350 1,348 (¥1)
② Subsidiaries and affiliates 1,472 991 (480)
③ Other securities 5,934 5,934 –Total (Assets) ¥76,744 ¥76,262 (¥482)
(4) Trade notes and accounts payable ¥7,125 ¥7,125 –(5) Electronically recorded monetary claims 6,538 6,538 –
Total (Liabilities) ¥13,664 ¥13,664 –
Overview(1) Management policyThe management policy of the Company is to invest surplus funds into low-risk financial instruments. The Company has not held any high-risk financial instruments.
(2) Financial instruments and their risksBoth notes receivable and accounts receivable as operating receivables are exposed to credit-related losses in the event of nonperformance by counterparties. Trade notes, accounts pay-able and electronically recorded monetary claims as trade liabilities are due and payable within one year. Marketable securities and investments in securities are exposed to changes in market price. The Company holds marketable securities and investments in securities mainly as held-to-maturity or due to relationship-building with counterparties.
(3) Risk management policies
a) Management policy for credit risk (losses in the event of nonperformance by counterparties)The Company has an established credit management policy, whereby credit risk exposure arising from both notes and accounts receivable is monitored on an ongoing basis in order to detect credit deterioration as well as to trigger appropriate minimizing measures at its early stages. Held-to-maturity investments are subject to the examination and decision of the Funds Management Review Committee and accordingly, investments largely consist of negotiable deposits and high graded securities, which are considered to have minimal credit risk.
b) Management policy for market risk (foreign currency exchange and interest rates)Marketable securities and investment securities are marked to market and the financial condition of the issuer (client company) is monitored periodically. In addition, the holdings of bonds and securities, other than held-to-maturity investments, are reviewed on an ongoing basis, taking into consideration the relationship, and other fac-tors, with the issuer.
c) Management policy for liquidity risk (in default on its financial obligations)The Company has managed liquidity risk by holding appropriate funds based on the forecasts, and actual cash flow is continuously monitored by the management.
(4) Supplementary explanation on the fair value of financial instruments The fair values of financial instruments are based on quoted market prices. If quoted market prices are unavailable, the fair values are estimated based on the prices which are assessed as reasonable by the Company. Since the Company takes contingent variable factors into account when estimating the fair value, it would vary depending on the different preconditions.
Estimated fair value of financial instruments
Differences between carrying value and estimated fair value as of March 31, 2016 and 2015 are as follows: Financial instruments whose fair values are difficult to estimate are not stated in the following table; refer to (* 2).

31
Millions of Yen Thousands of U.S.dollars ( Note 4 )2016 2015 2016
Unlisted securities (Carrying value) ¥428 ¥655 $3,788
The unlisted securities as stated above are not included in (3) Marketable securities and investments in securities because it is difficult to estimate the fair value based on the quoted market prices in active markets.
(*2): Financial instruments whose fair values are difficult to estimate are as follows:
(NOTES)
(* 1): Methods to determine the estimated fair value of financial instruments and other matters related to securities and derivative transactions.
Assets:
(1) Cash and bank deposits, and (2) Notes and accounts receivable: Since these items are settled in a short period of time, their carrying value approximates fair value.
(3) Marketable securities and investments in securities: Since negotiable certificate of deposits are settled in a short period of time, their carrying values approximate fair value. The fair value of the other stocks is based on quoted market prices. The fair value of debt securities is based on either quoted market prices or prices pro-vided by the financial institutions making markets in these securities. For information on securities classified by holding purpose, please refer to (*5) Held-to-maturity and other securities with readily determinable fair value as at March 31, 2016 and 2015.
Liabilities:
(4) Trade notes and accounts payable, and (5) Electronically recorded monetary claims: Since these items are settled in a short period of time, their carrying value approximates fair value.
Millions of Yen2016
Duewithin 1 year
Due after 1 yearbut within 5 years
Due after 5 yearsbut within 10 years
Due after 10 years
Cash and bank deposits ¥36,888 – – –Notes and accounts receivable 34,576 – – –Marketable securities and investments in securities:
Held-to-maturity securities 1,000 ¥250 ¥100 –Other securities with maturities 100 – – –
Total ¥72,564 ¥250 ¥100 –
Thousands of U.S.dollars ( Note 4 )2016
Duewithin 1 year
Due after 1 yearbut within 5 years
Due after 5 yearsbut within 10 years
Due after 10 years
Cash and bank deposits $326,446 – – –Notes and accounts receivable 305,987 – – –Marketable securities and investments in securities:
Held-to-maturity securities 8,850 $2,212 $885 –Other securities with maturities 885 – – –
Total $642,159 $2,212 $885 –
(*3) Redemption schedule for monetary claims and securities with maturities subsequent to the balance sheet date is as follows:
Millions of Yen2015
Duewithin 1 year
Due after 1 yearbut within 5 years
Due after 5 yearsbut within 10 years
Due after 10 years
Cash and bank deposits ¥35,126 – – –Notes and accounts receivable 32,861 – – –Marketable securities and investments in securities:
Held-to-maturity securities 1,100 ¥250 – –Other securities with maturities 300 100 – –
Total ¥69,387 ¥350 – –

32
Millions of Yen Thousands of U.S.dollars ( Note 4 )2016 2016
Carrying value Fair value Unrealized gains (losses) Carrying value Fair value Unrealized
gains (losses)
Held-to-maturity ¥1,350 ¥1,348 (¥1) $11,947 $11,929 ($9)
Carrying value Acquisition cost
Unrealized gains (losses) Carrying value Acquisition
costUnrealized
gains (losses)Other securities with carryingvalue exceeding acquisition cost Stocks ¥4,617 ¥2,550 ¥2,067 $40,858 $22,566 $18,292 Other 525 519 5 4,646 4,593 44 Subtotal 5,143 3,070 2,072 45,513 27,168 18,336 Other securities with carryingvalue not exceeding acquisition cost Stocks 881 927 (46) 7,796 8,204 (407) Other 2 2 – 18 18 – Subtotal 883 930 (46) 7,814 8,230 (407) Total ¥6,026 ¥4,000 ¥2,026 $53,327 $35,398 $17,929
(*5) Held-to-maturity and other securities with readily determinable fair value as at March 31, 2016 and 2015 are as follows:
Millions of Yen2015
Carryingvalue
Fairvalue
Unrealized gains (losses)
Held-to-maturity ¥1,350 ¥1,348 (¥1)
Carryingvalue
Acquisitioncost
Unrealized gains (losses)
Other securities with carryingvalue exceeding acquisition cost Stocks ¥5,064 ¥2,975 ¥2,089 Other 685 679 6 Subtotal 5,749 3,654 2,095 Other securities with carryingvalue not exceeding acquisition cost Stocks – – – Other 184 185 (1) Subtotal 184 185 (1) Total ¥5,934 ¥3,840 ¥2,094
(*4) Repayment schedule for bonds payable, long-term loans payable, lease obligations and other interest-bearing liabilities subsequent to the balance sheet date:
Millions of Yen2016
Due within 1 year The second year The third year The fourth year The fifth year ThereafterLong-term loans payable – ¥37 ¥469 – – –Lease obligations ¥1,448 1,185 917 ¥554 ¥359 ¥239
Total ¥1,448 ¥1,222 ¥1,387 ¥554 ¥359 ¥239
Thousands of U.S.dollars ( Note 4 )2016
Due within 1 year The second year The third year The fourth year The fifth year ThereafterLong-term loans payable – $333 $4,152 – – –Lease obligations $12,823 10,488 8,123 $4,909 $3,179 $2,121
Total $12,823 $10,821 $12,275 $4,909 $3,179 $2,121
Millions of Yen
2015Due within 1 year The second year The third year The fourth year The fifth year Thereafter
Long-term loans payable – ¥1,282 ¥66 ¥500 ¥31 ¥107 Lease obligations ¥1,410 1,195 930 668 307 279
Total ¥1,410 ¥2,478 ¥997 ¥1,168 ¥339 ¥386

33
17. Retirement Benefits
Outline of the retirement benefit plans adopted(1) Defined benefit corporate pension scheme: From March 1, 2009, the Company adopted a defined benefit corporate pension scheme as part of its retirement benefit plan.(2) Defined contribution pension scheme: From March 1, 2009, the Company adopted a defined contribution pension scheme as part of its retirement benefit plan.(3) Employees’ pension fund: Since April 1, 1980, the Company has used an multi-employer contributory funded pension plan as a supplement to its existing
retirement benefit scheme.
Multi-employer scheme The required contributions for the employees’ pension fund system, which is a multi-employer pension scheme that is accounted for in the same manner as a defined contribution plan, were ¥ 490 million and ¥ 550 million in the years ended March 31, 2016 and 2015, respectively.
In addition, certain subsidiaries have lump-sum payment plans and a defined benefit corporate pension plan. They calculate the retirement benefit expenses, and assets and liabilities for retirement benefits by means of a simplified method.
Millions of Yen Thousands of U.S.dollars( Note 4 )
As of March 31, 2015
As of March 31, 2014
As of March 31, 2015
Amount of pension assets ¥63,738 ¥60,068 $564,053 Total of amount of pension obligations based on amount of pension financing calculations in the scheme and minimum reserve amount 75,343 75,422 666,752 Net amount (¥11,605) (¥15,354) ($102,699)
(1) Most recent funded status of the multi-employer plan
Millions of Yen Thousands of U.S.dollars( Note 4 )
2016 2015 2016Balance at the beginning of the year ¥10,999 ¥11,834 $97,336 Cumulative effect of change in accounting principle – (1,571) –Restated balance at the beginning of the year 10,999 10,263 97,336
Service cost 814 749 7,204 Interest cost 80 93 708 Actuarial loss 725 397 6,416 Retirement benefits paid (588) (495) (5,204)Prior service cost – – –Other (35) (9) (310)
Balance at the end of the year ¥11,996 ¥10,999 $106,159
The changes in the retirement benefit obligation for the years ended March 31, 2016 and 2015 are as follows:
Millions of Yen Thousands of U.S.dollars( Note 4 )
2016 2015 2016Balance at the beginning of the year ¥8,675 ¥7,876 $76,770 Expected return on plan assets 216 196 1,912 Actuarial loss 19 283 168
Contributions by the Company 771 758 6,823 Retirement benefits paid (500) (440) (4,425)Other (0) 0 (0)
Balance at the end of the year ¥9,181 ¥8,675 $81,248
The changes in plan assets for the years ended March 31, 2016 and 2015 are as follows:
For the year ended March 31, 2014: 22.6%For the year ended March 31, 2015: 23.0%
(2) Amount paid by the Company as a percentage of contributions to the multi-employer plan
The net amount in (1) above was mainly due to a prior service obligation in pension financing (As of March 31, 2014: ¥ 9,040 million; As of March 31, 2015: ¥ 8,925 million). The method of amortizing the prior service obligation in this plan is to evenly amortize the principal and inter-est over a period of 20 years, and special contributions of ¥ 187 million and ¥ 185 million were expensed in the Company’s consolidated financial statements in the years ended March 31, 2016 and 2015, respectively. The percentage of the Company’s contribution in (2) above does not match the percentage of its actual pension obligation.
(3) Supplemental information

34
Millions of Yen Thousands of U.S.dollars( Note 4 )
2016 2015 2016Funded retirement benefit obligation ¥11,873 ¥10,880 $105,071 Plan assets at fair value (9,181) (8,675) (81,248)
2,692 2,204 23,823 Unfunded retirement benefit obligation 123 119 1,088 Net liability for retirement benefits in the balance sheet 2,815 2,324 24,912
Liability for retirement benefits 2,815 2,324 24,912 Asset for retirement benefits – – –Net liability for retirement benefits in the balance sheet ¥2,815 ¥2,324 $24,912
The following table sets forth the funded status of the plans and the amounts recognized in the consolidated balance sheet as of March 31, 2016 and 2015 for the Company’s and the consolidated subsidiaries’ defined benefits plans:
Millions of Yen Thousands of U.S.dollars( Note 4 )
2016 2015 2016Service cost ¥814 ¥749 $7,204 Interest cost 80 93 708 Expected return on plan assets (216) (196) (1,912)Amortization of actuarial loss 224 166 1,982 Amortization of prior service cost (3) (3) (27)Retirement benefit expense ¥899 ¥808 $7,956
The components of retirement benefit expense for the years ended March 31, 2016 and 2015 are as follows:
Millions of Yen Thousands of U.S.dollars( Note 4 )
2016 2015 2016Prior service cost (¥3) (¥3) ($27)Actuarial gain (481) 52 (4,257)Total (¥485) ¥48 ($4,292)
The components of retirement benefits liability adjustments included in other comprehensive income (before tax effect) for the years ended March 31, 2016 and 2015 are as follows:
Millions of Yen Thousands of U.S.dollars( Note 4 )
2016 2015 2016Unrecognized prior service cost ¥10 ¥14 $88 Unrecognized actuarial loss (1,708) (1,226) (15,115)Total (¥1,697) (¥1,212) ($15,018)
The components of retirement benefits liability adjustments included in accumulated other comprehensive income (before tax effect) as of March 31, 2016 and 2015 are as follows:
Millions of Yen2016 2015
General accounts 10% 9%Bonds 76% 77%Stocks 12% 12%Other 2% 2%Total 100% 100%
The fair value of plan assets, by major category, as a percentage of total plan assets as of March 31, 2016 and 2015 is as follows:
2016 2015Discount rate 0.6% 1.0%Expected long-term rate of return on plan assets 2.5% 2.5%Expected rates of salary increases 5.1% 5.1%
The expected return on plan assets has been estimated based on the anticipated allocation to each asset class and the expected long-term returns on assets held in each category.The assumptions used in accounting for the above plans were as follows:* *They are calculated by the weighted average method.

35
Millions of Yen Thousands of U.S.dollars( Note 4 )
2016 2015 2016Balance at the beginning of the year ¥109 ¥126 $965
Retirement benefit expense 43 33 381 Retirement benefits paid (38) (28) (336)Contributions to plans (25) (23) (221)Other (0) 0 (3)
Balance at the end of the year ¥89 ¥109 $788
For defined benefit plans to which the simplified method is applied, the changes in the retirement benefit obligation for the years ended March 31, 2016 and 2015 are as follows:
Millions of Yen Thousands of U.S.dollars( Note 4 )
2016 2015 2016 Retirement benefit expenses ¥43 ¥33 $381
Retirement benefit expenses calculated using the simplified method for the years ended March 31, 2016 and 2015 are as follows:
Millions of Yen Thousands of U.S.dollars( Note 4 )
2016 2015 2016 Contributions to defined contribution plans ¥379 ¥357 $3,354
Contributions to defined contribution plans of the Company and its consolidated subsidiaries for the years ended March 31, 2016 and 2015 are as follows:
Millions of Yen Thousands of U.S.dollars( Note 4 )
2016 2015 2016Funded retirement benefit obligation ¥176 ¥158 $1,558 Plan assets at fair value (210) (193) (1,858)
(34) (35) (301)Unfunded retirement benefit obligation 123 144 1,088 Net liability for retirement benefits in the balance sheet 89 109 788
Liability for retirement benefits 170 191 1,504 Asset for retirement benefits (81) (81) (717)Net liability for retirement benefits in the balance sheet ¥89 ¥109 $788
The following table sets forth the funded status of the plans and the amounts recognized in the consolidated balance sheet as of March 31, 2016 and 2015 for the Company’s and the consolidated subsidiaries’ defined benefits plans:

36
18. Income Taxes
Deferred tax assets and liabilities (both current and non-current) as at March 31, 2016 and 2015 consisted of the following ele-ments:
Millions of YenThousands of U.S.dollars
(Note 4)
2016 2015 2016Deferred tax assets:
Accrued enterprise tax ¥184 ¥122 $1,628 Accrued employees' bonuses 828 691 7,327 Accounts payable and long-term accounts payable 52 57 460 Net liability for retirement benefits 879 778 7,779 Loss carried forward 1,073 1,227 9,496 Loss on write-down of investments in securities 296 311 2,619 Surplus on allowance for doubtful accounts 125 106 1,106 Unrealized gains 650 645 5,752 Others 1,207 1,207 10,681 Less: valuation allowance (1,466) (1,524) (12,973)
Total deferred tax assets ¥4,103 ¥3,624 $36,310
Deferred tax liabilities:Reserve for advanced depreciation of building (11) (12) (97)Acquired intangible assets (11) (19) (97)Unrealized loss on other securities (573) (559) (5,071)Others (85) (115) (752)
Total deferred tax liabilities (682) (706) (6,035)Net deferred tax assets ¥3,420 ¥2,918 $30,265
Reconciliation of the effective statutory tax rate and the actual tax rate is shown below:
2016 2015Effective statutory tax rate 33.0% 35.6%Adjustments:Entertainment and other nondeductible expenses 0.6 0.5 Dividends and other nontaxable income (1.4) (3.9)Inhabitant tax on per capita levy 0.6 0.8 Nondeductible amortization of goodwill 2.2 2.0 Eliminated dividend received from subsidiaries 2.1 3.1 Realization of tax benefits on operating losses (1.7) (0.6)Tax credit for research and development expenses (0.4) (0.5)Valuation allowance (0.1) (4.6)Deferred tax assets reduced by change of taxation rates 0.5 1.2 Difference of foreign subsidiaries' taxation rates (0.2) (1.3)Equity in earnings of affiliates (0.4) (0.2)Others 1.2 0.6
Actual tax rate 36.0% 32.7%
The “Act for Partial Amendment of the Income Tax Act, etc.” (Act No. 15 of 2016) and the “Act for Partial Amendment of the Local Tax Act, etc.” (Act No.13 of 2016) were promulgated on March 29, 2016. As a result, the effective statutory tax rate used to measure the Company’s deferred tax assets and liabilities was changed from 32.2% to 30.8% and 30.6% for the temporary differences expected to be realized or settled in the years beginning April 1, 2016 and 2017 and for the temporary differences expected to be realized or settled from April 1, 2018, respectively. The effect of the announced reduction of the effective statutory tax rate was to decrease deferred tax assets, after offsetting deferred tax liabilities, by ¥ 11 million ($ 97 thousand), increase deferred income taxes by ¥ 68 million ($ 601 thousand) and unrealized gain on other securities by ¥ 29 million ($ 256 thousand) and decrease retirement benefits liability adjustments by ¥ 27 million ($ 238 thousand) as of and for the year ended March 31, 2016.

37
19. Segment Information
The reportable segments of the Company are components for which discrete financial information is available and whose operat-ing results are regularly reviewed by the Executive Committee to make decisions about resource allocation and to assess perfor-mance.
The reportable segments are as follows:1. Time information system business2. Environment system business
Millions of Yen
2015Reportable segments
Adjustments/EliminationsTime information
system businessEnvironment
system business Total Consolidated
Net sales: –Sales to third parties ¥79,477 ¥30,360 ¥109,837 – ¥109,837Intersegment sales and transfers – – – – – Total 79,477 30,360 109,837 – 109,837Segment profit or loss 8,961 3,363 12,325 (¥2,967) 9,357Segment assets 60,217 26,007 86,224 45,335 131,560Depreciation and amortization 3,203 538 3,742 394 4,137Impairment loss for fixed assets 175 – 175 – 175Investment in equity-method affiliates 1,695 – 1,695 – 1,695Increase in tangible and intangible fixed assets 5,711 1,022 6,733 42 6,775
Thousands of U.S. dollars (Note 4)2016
Reportable segmentsAdjustments/EliminationsTime information
system businessEnvironment
system business Total Consolidated
Net sales:Sales to third parties $756,302 $301,276 $1,057,578 – $1,057,578Intersegment sales and transfers – – – – – Total 756,302 301,276 1,057,578 – 1,057,578Segment profit or loss 107,072 40,497 147,569 ($33,030) 114,539Segment assets 566,045 246,402 812,447 399,641 1,212,087Depreciation and amortization 29,606 4,578 34,184 4,891 39,075Impairment loss for fixed assets – – – 2,093 2,093Investment in equity-method affiliates 14,001 – 14,001 – 14,001Increase in tangible and intangible fixed assets 47,756 3,743 51,499 7,322 58,821
Millions of Yen2016
Reportable segmentsAdjustments/EliminationsTime information
system businessEnvironment
system business Total Consolidated
Net sales:Sales to third parties ¥85,462 ¥34,044 ¥119,506 – ¥119,506Intersegment sales and transfers - - - – - Total 85,462 34,044 119,506 – 119,506Segment profit or loss 12,099 4,576 16,675 (¥3,732) 12,942Segment assets 63,963 27,843 91,806 45,159 136,965Depreciation and amortization 3,345 517 3,862 552 4,415Impairment loss for fixed assets – – – 236 236Investment in equity-method affiliates 1,582 – 1,582 – 1,582Increase in tangible and intangible fixed assets 5,396 422 5,819 827 6,646
(1) Sales, profits or losses, assets and other items by reportable segments
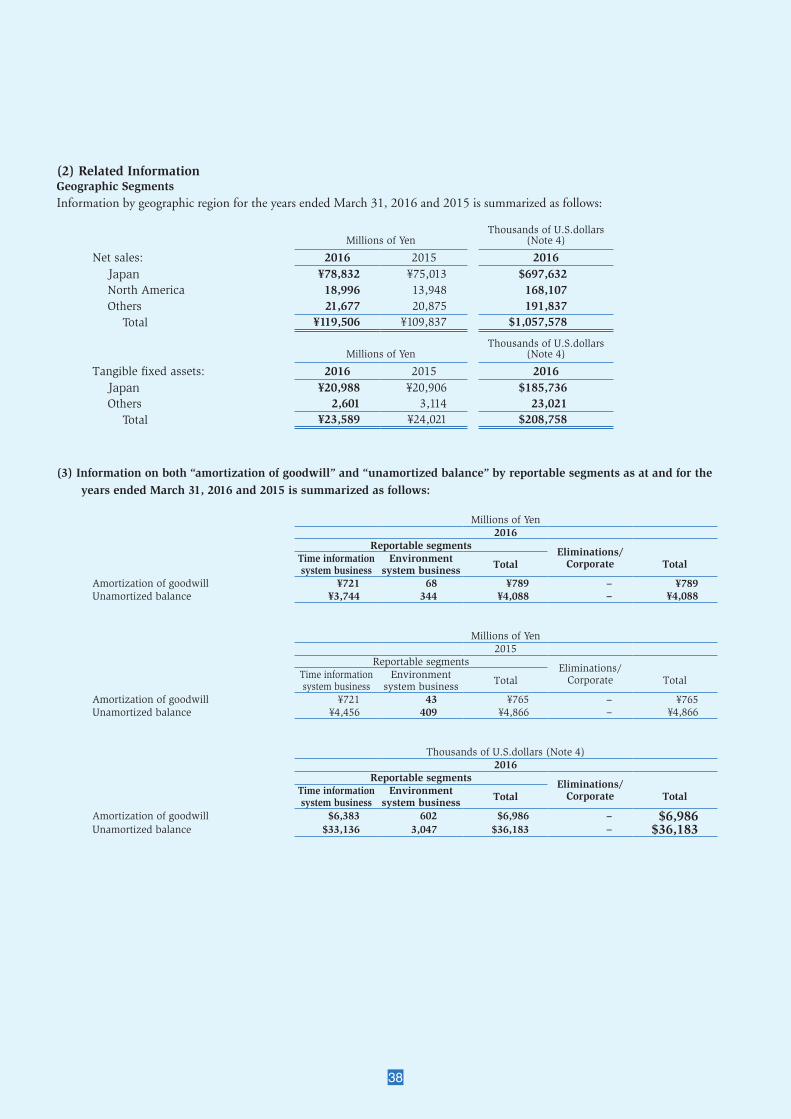
38
(2) Related InformationGeographic SegmentsInformation by geographic region for the years ended March 31, 2016 and 2015 is summarized as follows:
(3) Information on both “amortization of goodwill” and “unamortized balance” by reportable segments as at and for the years ended March 31, 2016 and 2015 is summarized as follows:
Millions of Yen2016
Reportable segmentsEliminations/
CorporateTime information system business
Environmentsystem business Total Total
Amortization of goodwill ¥721 68 ¥789 – ¥789 Unamortized balance ¥3,744 344 ¥4,088 – ¥4,088
Millions of Yen2015
Reportable segmentsEliminations/
CorporateTime information system business
Environmentsystem business Total Total
Amortization of goodwill ¥721 43 ¥765 – ¥765 Unamortized balance ¥4,456 409 ¥4,866 – ¥4,866
Thousands of U.S.dollars (Note 4)2016
Reportable segmentsEliminations/
CorporateTime information system business
Environmentsystem business Total Total
Amortization of goodwill $6,383 602 $6,986 – $6,986 Unamortized balance $33,136 3,047 $36,183 – $36,183
Millions of YenThousands of U.S.dollars
(Note 4)
Net sales: 2016 2015 2016Japan ¥78,832 ¥75,013 $697,632 North America 18,996 13,948 168,107 Others 21,677 20,875 191,837
Total ¥119,506 ¥109,837 $1,057,578
Millions of YenThousands of U.S.dollars
(Note 4)
Tangible fixed assets: 2016 2015 2016Japan ¥20,988 ¥20,906 $185,736 Others 2,601 3,114 23,021
Total ¥23,589 ¥24,021 $208,758
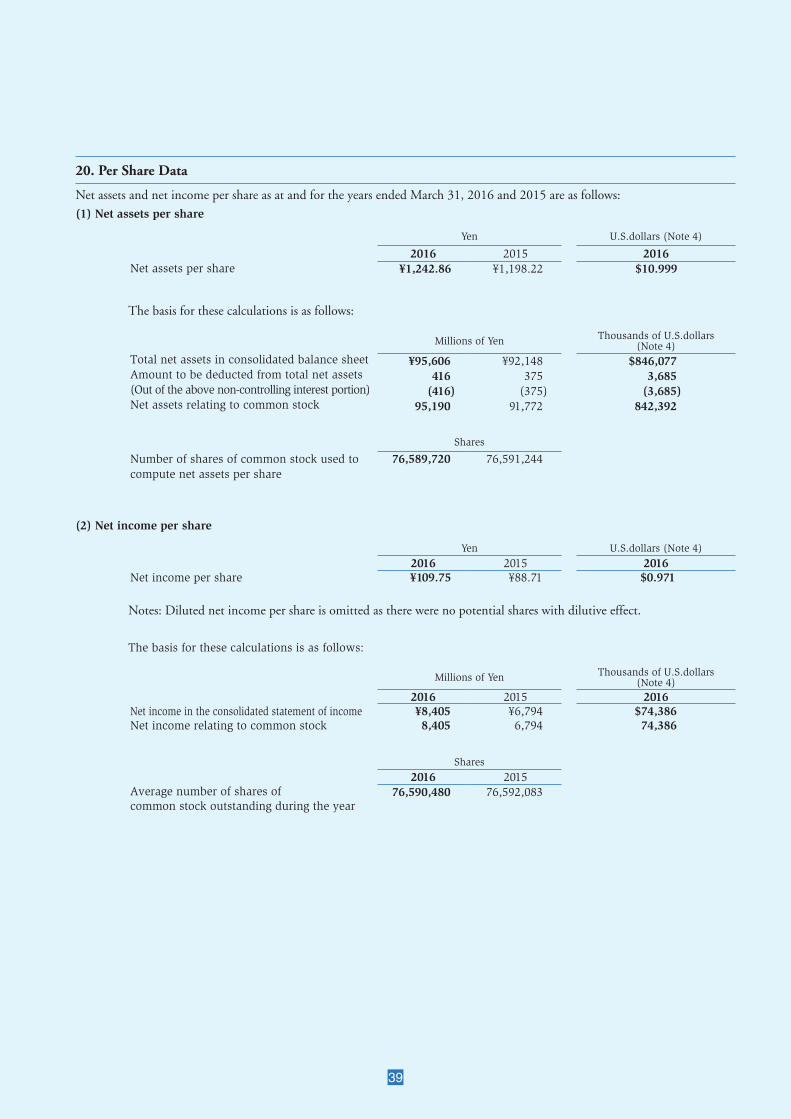
39
Shares
Number of shares of common stock used to 76,589,720 76,591,244 compute net assets per share
Millions of Yen Thousands of U.S.dollars(Note 4)
Total net assets in consolidated balance sheet ¥95,606 ¥92,148 $846,077 Amount to be deducted from total net assets 416 375 3,685 (Out of the above non-controlling interest portion) (416) (375) (3,685)Net assets relating to common stock 95,190 91,772 842,392
The basis for these calculations is as follows:
Yen U.S.dollars (Note 4)
2016 2015 2016Net income per share ¥109.75 ¥88.71 $0.971
(2) Net income per share
Notes: Diluted net income per share is omitted as there were no potential shares with dilutive effect.
Yen U.S.dollars (Note 4)
2016 2015 2016Net assets per share ¥1,242.86 ¥1,198.22 $10.999
20. Per Share Data
Net assets and net income per share as at and for the years ended March 31, 2016 and 2015 are as follows:
(1) Net assets per share
Shares
2016 2015Average number of shares of common stock outstanding during the year
76,590,480 76,592,083
Millions of Yen Thousands of U.S.dollars(Note 4)
2016 2015 2016Net income in the consolidated statement of income ¥8,405 ¥6,794 $74,386Net income relating to common stock 8,405 6,794 74,386
The basis for these calculations is as follows:

40
1,2,7
5
8
463
10,1113,149
2421
16
17,18,1920
AMANO CORPORATION
22
23
12
15
Corporate Data
Board of Directors
Domestic Operations
Chairman & Representative Director
Kaoru HARUTA
President & Representative Director
Izumi NAKAJIMA
Director & Managing Operating Officers
Hiroshi SHIRAISHI Isao TERASAKI Kenji KOHORI
Director & Operating OfficersTakeshi AKAGI Yasuhiro SASAYA Kunihiro IHARA
(Outside) Directors
Isao KISHI Kiyoshi KAWASHIMA
(Full-time) Audit & Supervisory Board Members
Haruhiko YAMAGUCHI Toru UENO
(Outside) Audit & Supervisory Board MembersYoshiyuki SATO Takehide ITONAGA
Operating Officers
Minoru YONEZAWA Tatsuo NIIHO Masahiko MORITA Myeong-Jin JEON Tetsuhiro KONDO Jun NAKAKURO Hiroyuki TSUDA Yoshikazu TOAKE Masahiro SAWADA Sachio OTAKA Takashi KASAI Manabu YAMAZAKI
HEAD OFFICE
275 Mamedocho, Kohoku-ku, Yokohama, Kanagawa, JAPAN 222-8558
FACILITIES
SAGAMIHARA Factory HOSOE Factory
SALES OFFICES
73 Sales Offices Located in major cities, including
SAPPORO Office, SENDAI Office OMIYA Office, TOKYO Office NAGANO Office, NIIGATA Office YOKOHAMA Office, HAMAMATSU Office NAGOYA Office, KANAZAWA Office KYOTO Office, OSAKA Office OKAYAMA Office, HIROSHIMA Office TAKAMATSU Office, FUKUOKA Office
DOMESTIC SUBSIDIARIES
AMANO MANAGEMENT SERVICE CORPORATION AMANO MAINTENANCE ENGINEERING CORPORATION AMANO BUSINESS SOLUTIONS CORPORATION ENVIRONMENTAL TECHNOLOGY CO., LTD. AMANO MUSASHI ELECTRIC CORPORATION AMANO AGENCY CORPORATION
17. AMANO INTERNATIONAL TRADING(SHANGHAI)CO.,LTD.18. AMANO SOFTWARE ENGINEERING (SHANGHAI)CO.,LTD.19. AMANO MANUFACTURING(SHANGHAI)CO.,LTD.20. AMANO PARKING SERVICE LTD.21. AMANO MALAYSIA SDN.BHD.22. AMANO TIME&AIR SINGAPORE PTE.LTD.23. PT.AMANO INDONESIA24. AMANO THAI INTERNATIONAL CO.,LTD.
Overseas Operations
1. AMANO USA HOLDINGS,INC. 2. AMANO CINCINNATI,INC. 3. AMANO CINCINNATI,INC. OHIO FACTORY 4. AMANO McGANN CANADA INC. 5. AMANO PIONEER ECLIPSE CORPORATION 6. AMANO McGANN, INC. 7. ACCU-TIME SYSTEMS, INC. 8. AMANO TIME&ECOLOGY DE MEXICO S.A. DE C.V.
9. ACCU-TECH SYSTEMS, Ltd. 10. AMANO EUROPE HOLDINGS, N.V. 11. AMANO EUROPE, N.V. 12. AMANO TIME&PARKING SPAIN S.A. 13. HOROSMART, S.A. 14. HOROQUARTZ, S.A. 15. HOROQUARTZ MAROC, S.A. 16. AMANO KOREA CORPORATION

275 Mamedocho, Kohoku-ku, Yokohama, Kanagawa, 222-8558 JAPAN.
PHONE : +81 (45) 401-1441
FAX : +81 (45) 439-1150
HOME PAGE : http://www.amano.co.jp/English/


