48
America SWAF December 3, 2004 Presented by: Serhat Guven Dimension Reduction
| Date post: | 13-Dec-2015 |
| Category: |
Documents |
| Upload: | william-hoover |
| View: | 219 times |
| Download: | 0 times |
America
SWAFDecember 3, 2004Presented by: Serhat Guven
Dimension Reduction

2
Dimension Reduction Agenda
Background
Definition
Rationale
Techniques
Conclusion

3
Dimension Reduction Special Features of P&C Insurance
Low frequency
Skewed loss distributions
Often large coefficients of variation
No natural categories – need continuous estimate of risk rates
Predictive Models used must recognize these features
• Background
• Definition
• Rationale
• Techniques
• Conclusion
4
Dimension Reduction Goal of a Predictive ModelDimension Reduction
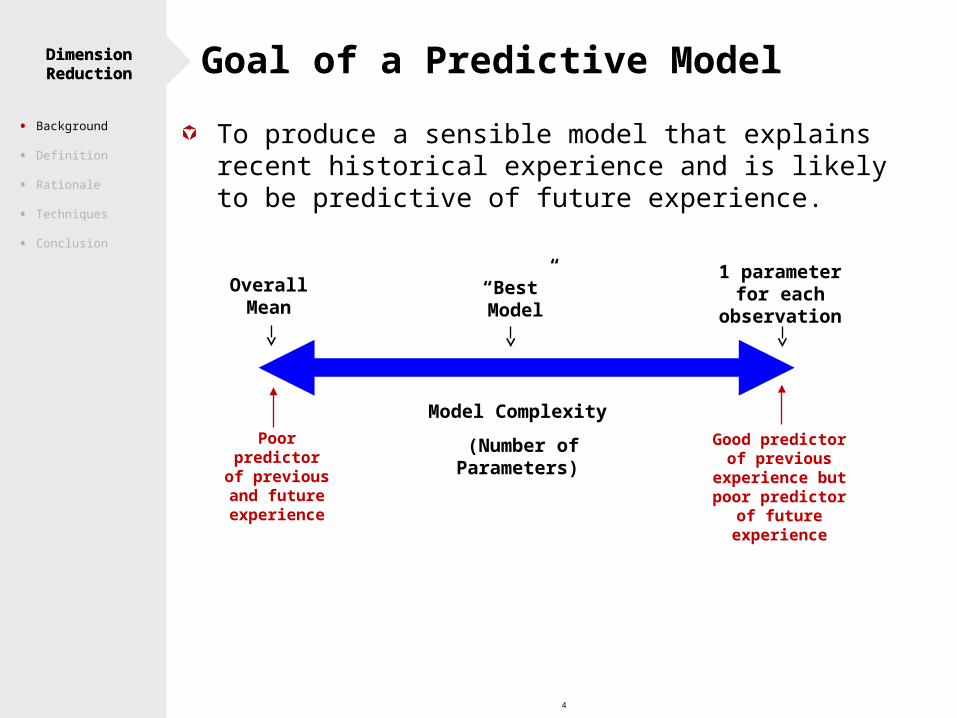
Poor predictor of
previous and future
experience
Good predictor of previous
experience but poor predictor of future experience
Overall Mean
“Best” Model
1 parameter for each
observation
Model Complexity
(Number of Parameters)
To produce a sensible model that explains recent historical experience and is likely to be predictive of future experience.
• Background
• Definition
• Rationale
• Techniques
• Conclusion
5
Dimension Reduction
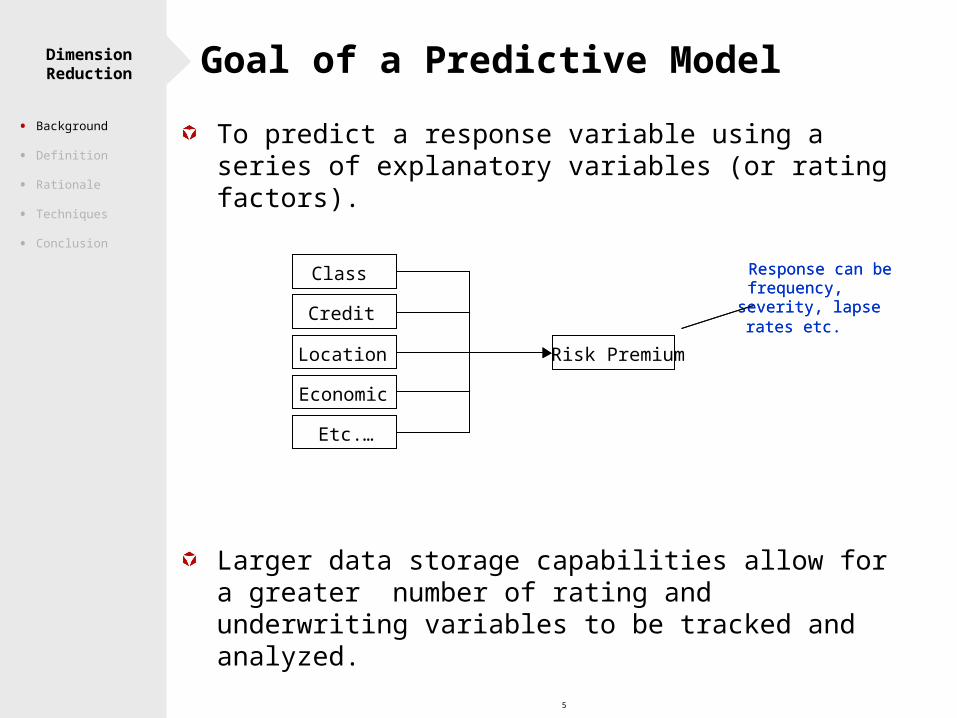
Class
Credit
Location
Economic
Etc.…
Risk Premium
Response can be frequency, severity, lapse rates etc.
Response can be frequency, severity, lapse rates etc.
To predict a response variable using a series of explanatory variables (or rating factors).
Larger data storage capabilities allow for a greater number of rating and underwriting variables to be tracked and analyzed.
Goal of a Predictive Model
• Background
• Definition
• Rationale
• Techniques
• Conclusion

6
Dimension Reduction Multitude of Factors
Many factors have been found to be predictive of frequency and/or loss severity. Here are a few for auto…
Annual Mileage
Age
Major Convictions
Minor Convictions
DW
I
# Veh
icle
s
# Driv
ers
Good StudentHousehold
Driv
ing R
ecord
Model
Yea
r
Mak
e/M
odel
Territory
Traffic DensityUrb
an v
. Rura
lGender
Marital Status
Other Products Coverage
Limits/D
eductibles
Usa
ge
Driver
Training
Inexperienced Operator
Tie
r
GaragedSafety Features
Credit Score
Prior Insurance
Occupation
Sales Channel
Method of Payment
Lifestyle
Factors
An
ti-t
hef
t D
evic
es
Not-at-F
ault Accidents
Comp Claims
# Renewals
Homeownership
Many of these have a significant number of levels.
• Background
• Definition
• Rationale
• Techniques
• Conclusion
7
Dimension Reduction Multitude of Factors
Advanced techniques and technology enable the analyst to look at more explanatory variables than previously imagined.
There still are limitations associated with multivariate approaches.
Low volumes of data across dimensions
Variables with a large number of rating levels
Amount of Insurance
Postcode
Age
Highly collinear variables
Incorporate Dimension Reduction techniques into the multivariate solution.
• Background
• Definition
• Rationale
• Techniques
• Conclusion
8
Dimension Reduction What is Dimension Reduction
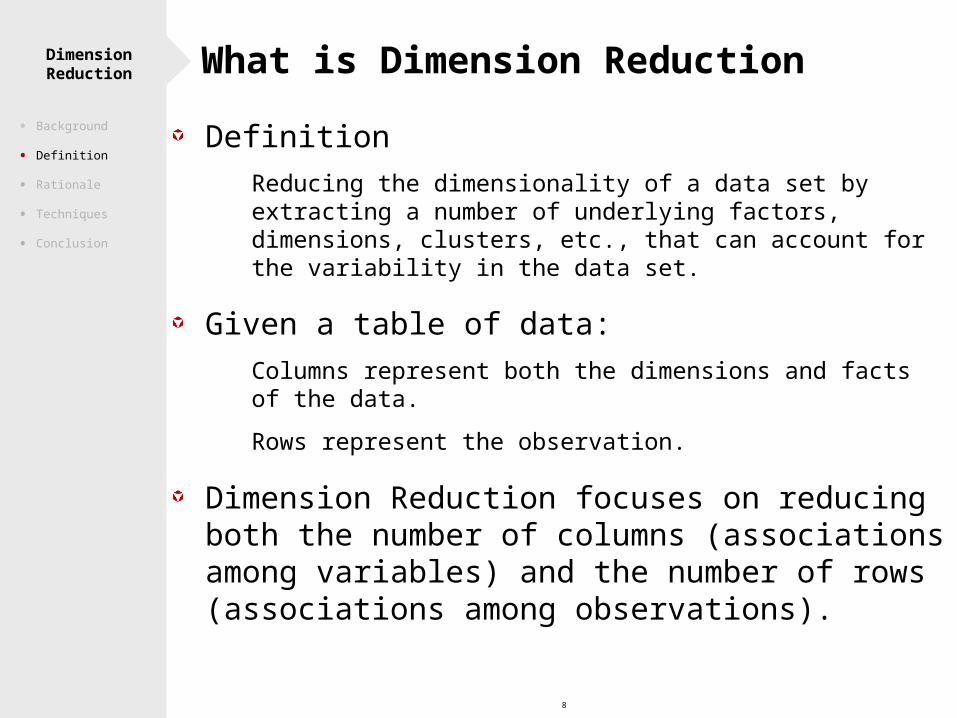
Definition Reducing the dimensionality of a data set by extracting a
number of underlying factors, dimensions, clusters, etc., that can account for the variability in the data set.
Given a table of data: Columns represent both the dimensions and facts of the data.
Rows represent the observation.
Dimension Reduction focuses on reducing both the number of columns (associations among variables) and the number of rows (associations among observations).
• Background
• Definition
• Rationale
• Techniques
• Conclusion
9
Dimension Reduction What is Dimension Reduction
Multivariate
Analysis
Hypothesis
Testing
Data
Collection
Results
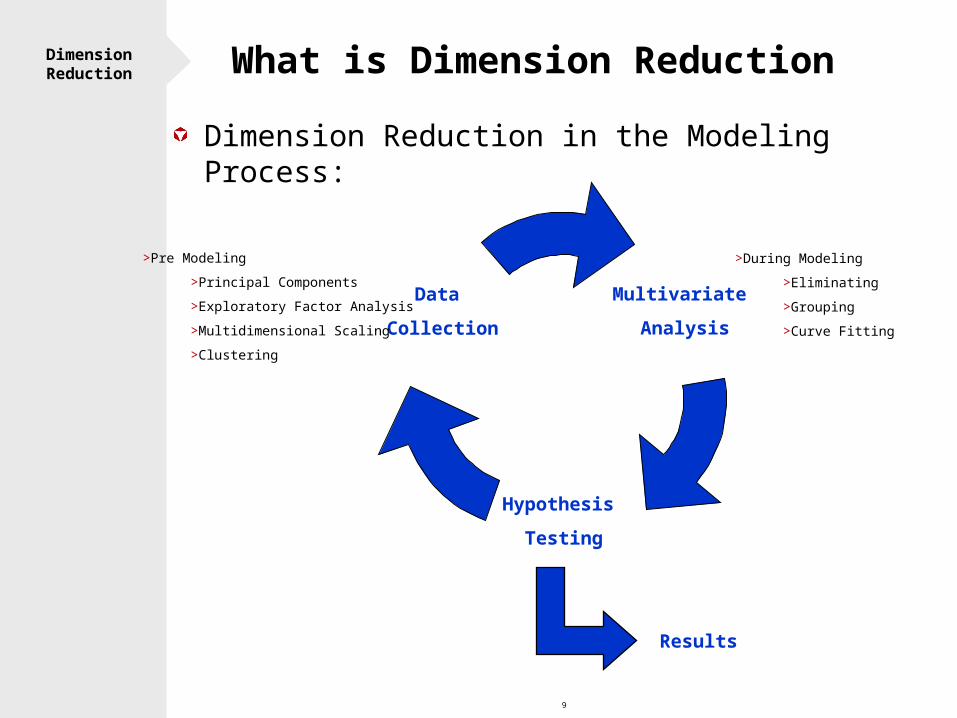
Dimension Reduction in the Modeling Process:
>Pre Modeling
>Principal Components
>Exploratory Factor Analysis
>Multidimensional Scaling
>Clustering
>During Modeling
>Eliminating
>Grouping
>Curve Fitting
10
Dimension Reduction Rationale for Dimension Reduction
Data Storage
Advances in warehousing has led to large quantities of data to process.
Ease of Interpretation
Difficulty in Visualizing an n-dimensional rating structure space.
Collinearity
Some degree of redundancy or overlap among rating variables (e.g. Multi Car discounts and # of Vehicles on Policy).
Causes a loss in explanatory power.
Makes interpretation more difficult.
Requires more data to disentangle the individual effects of each variable.
• Background
• Definition
• Rationale
• Techniques
• Conclusion
11
Dimension Reduction Rationale for Dimension Reduction
Curse of Dimensionality Cartesian product of the number of rating levels grows
exponentially with the inclusion of each rating level.
Exposure distribution is not large enough to cover the entire space.
Principle of Parsimony When two models have the same degree of explanatory
power then the simpler model should be selected.
• Background
• Definition
• Rationale
• Techniques
• Conclusion
12
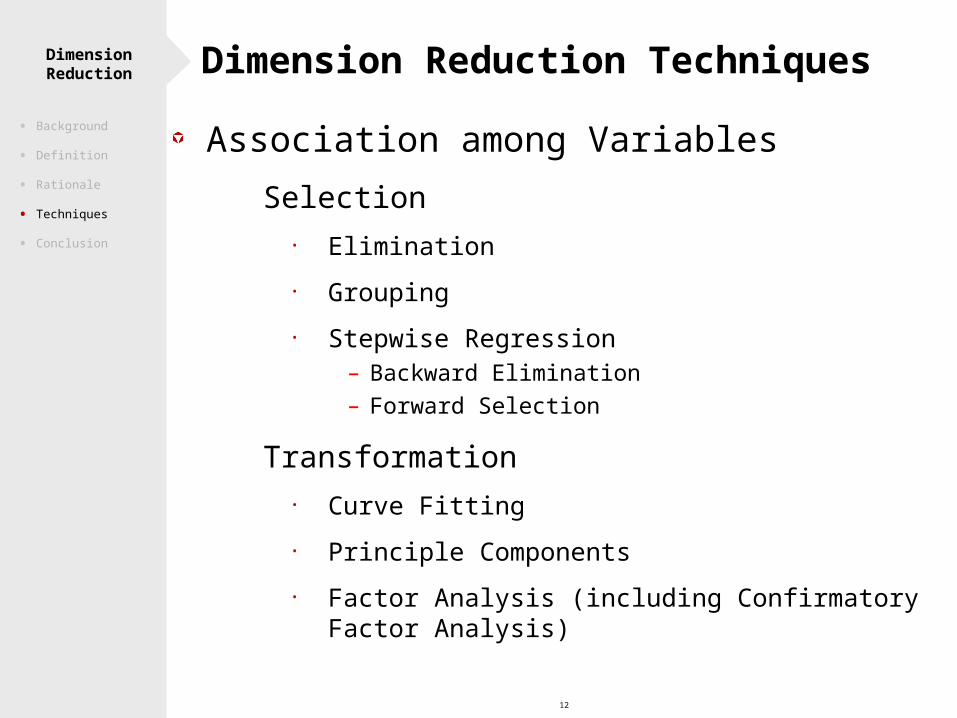
Dimension Reduction Dimension Reduction Techniques
Association among Variables Selection
• Elimination
• Grouping
• Stepwise Regression– Backward Elimination
– Forward Selection
Transformation• Curve Fitting
• Principle Components
• Factor Analysis (including Confirmatory Factor Analysis)
• Background
• Definition
• Rationale
• Techniques
• Conclusion
13
Dimension Reduction Dimension Reduction Techniques
Association among Observations
Multidimensional Scaling
Clustering
Forced Dimension Reduction
• Background
• Definition
• Rationale
• Techniques
• Conclusion

14
Dimension Reduction Data Description
Type Descriptions
Dimensions Sex Duration
Policyholder Age Garaged
Rating Area Installment Indicator
Vehicle Age Use
Vehicle Group Non standard Indicator
Driver Restrictions Major Convictions
NCD Minor Convictions
Protected MTA Indicator
Experience Time
Facts Exposures
Claims
Losses
• Background
• Definition
• Rationale
• Techniques
• Conclusion
15
Dimension Reduction Association Among Variables: Selection
Elimination
Excluding factors entirely is the easiest and most straight-forward way to simplify a model.
Things to look for: Parameter estimates
• All parameter estimates are small.
• All parameter estimates are within two standard errors of zero (i.e., the standard error percentages are all > 50%).
• Sensible Patterns.
Consistency Over Time
Models with and without the factor are not significantly different.
• Chi Square Tests
• Background
• Definition
• Rationale
• Techniques
• Conclusion

16
Dimension Reduction Elimination Example
Parameter estimates
Name ValueStandard Error
Standard Error (%)
Weight (%) Exp(Value)
Driver Restrictions (Any) 0.0198 0.0424 214.3% 1.6% 1.0200 Driver Restrictions (Any >25) 0.0184 0.0440 238.9% 1.4% 1.0186 Driver Restrictions (Named >50) (0.0768) 0.0816 -106.3% 0.4% 0.9261 Driver Restrictions (Named 25-50) 0.0323 0.0222 68.7% 6.3% 1.0328 Driver Restrictions (Insured Only) 59.3%Driver Restrictions (Insured & Spouse) 0.0270 0.0129 47.8% 27.0% 1.0274 Driver Restrictions (Named <25) 0.0056 0.0276 489.4% 4.1% 1.0056
Rescaled Predicted Values - Driver Restrictions
0.70
0.75
0.80
0.85
0.90
0.95
1.00
1.05
1.10
1.15
0%
10%
20%
30%
40%
50%
60%
70%
80%
90%
100%
110%
120%
130%
Any Any >25 Named >50 Named 25-50 Insured Only Insured &Spouse
Named <25
Model Prediction at Base levels
Model Prediction + 2 Standard Errors
Model Prediction - 2Standard Errors
All close to 0, except
Named>50
Lowest standard error
% is 48%
• Background
• Definition
• Rationale
• Techniques
• Conclusion
17
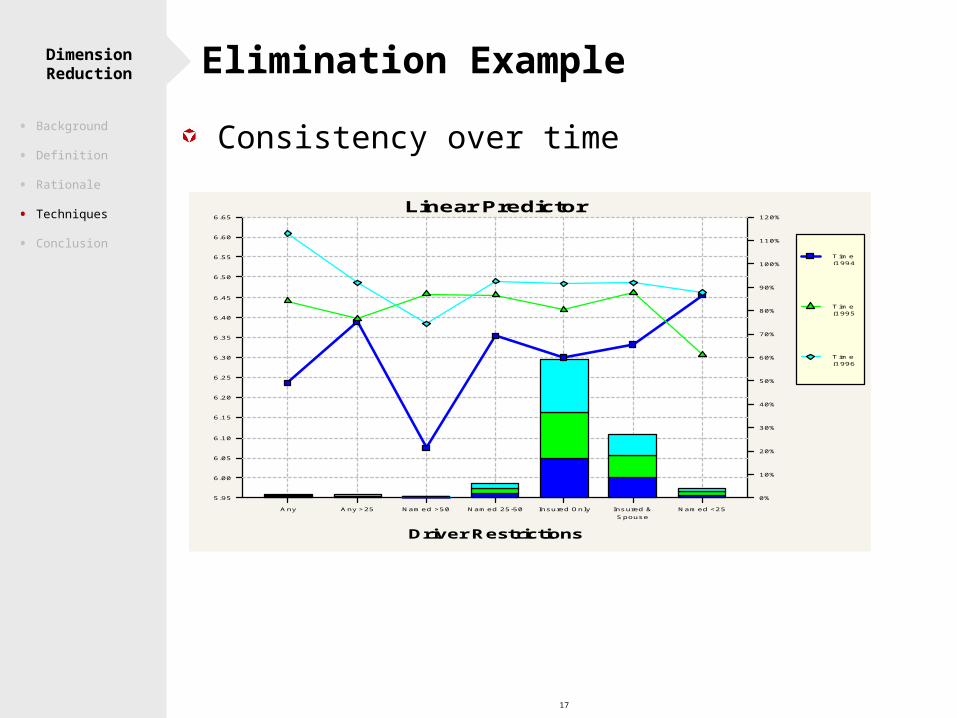
Dimension Reduction
Linear Predictor
5.95
6.00
6.05
6.10
6.15
6.20
6.25
6.30
6.35
6.40
6.45
6.50
6.55
6.60
6.65
0%
10%
20%
30%
40%
50%
60%
70%
80%
90%
100%
110%
120%
Any Any >25 Named >50 Named 25-50 Insured Only Insured &Spouse
Named <25
Driver Restrictions
Time (1994)
Time (1995)
Time (1996)
Consistency over time
Elimination Example
• Background
• Definition
• Rationale
• Techniques
• Conclusion

18
Dimension Reduction
Models with and without the factor are not significantly different.
Elimination Example
Model With Without
Deviance 8,906.4414 8,909.6226 Degrees of Freedom 18,469 18,475 Scale Parameter 0.4822 0.4823
Chi Square Test 78.6%
Increase in deviance is due to a decrease in the number of parameters.
H0: The two models under consideration are not significantly different.
• Background
• Definition
• Rationale
• Techniques
• Conclusion

19
Dimension Reduction Association Among Variables: Selection
Grouping
While a factor might be significant, it may be possible to band certain levels within a factor to create a more parsimonious model.
Things to look for:
Parameter estimates
• Parameter estimates that are not significantly different from each other.
• Levels where there is low exposure.
• Sensible Patterns.
Consistency Over Time
Models with and without the factor are not significantly different.
• Chi Square Tests
• Background
• Definition
• Rationale
• Techniques
• Conclusion

20
Dimension Reduction Grouping Example
Standard error of the parameter differences help identify potential groupings
• Background
• Definition
• Rationale
• Techniques
• Conclusion
21
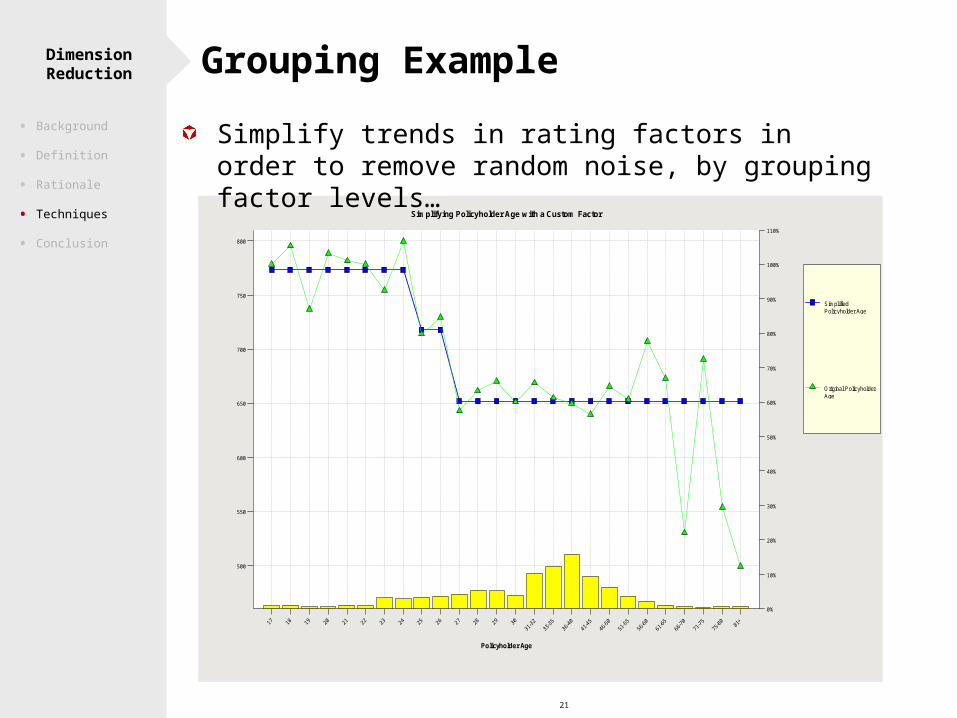
Dimension Reduction
Simplifying Policyholder Age with a Custom Factor
500
550
600
650
700
750
800
0%
10%
20%
30%
40%
50%
60%
70%
80%
90%
100%
110%
Policyholder Age
Simplified Policyholder Age
Original Policyholder Age
Grouping Example
Simplify trends in rating factors in order to remove random noise, by grouping factor levels…
• Background
• Definition
• Rationale
• Techniques
• Conclusion

22
Dimension Reduction
Models with and without the factor are not significantly different.
Grouping Example
Model Ungrouped Grouped
Deviance 8,906.4414 8,934.1620 Degrees of Freedom 18,469 18,493 Scale Parameter 0.4822 0.4823
Chi Square Test 27.2%
Increase in deviance is due to a decrease in the number of parameters.
H0: The two models under consideration are not significantly different.
• Background
• Definition
• Rationale
• Techniques
• Conclusion
23
Dimension Reduction Association Among Variables: Selection
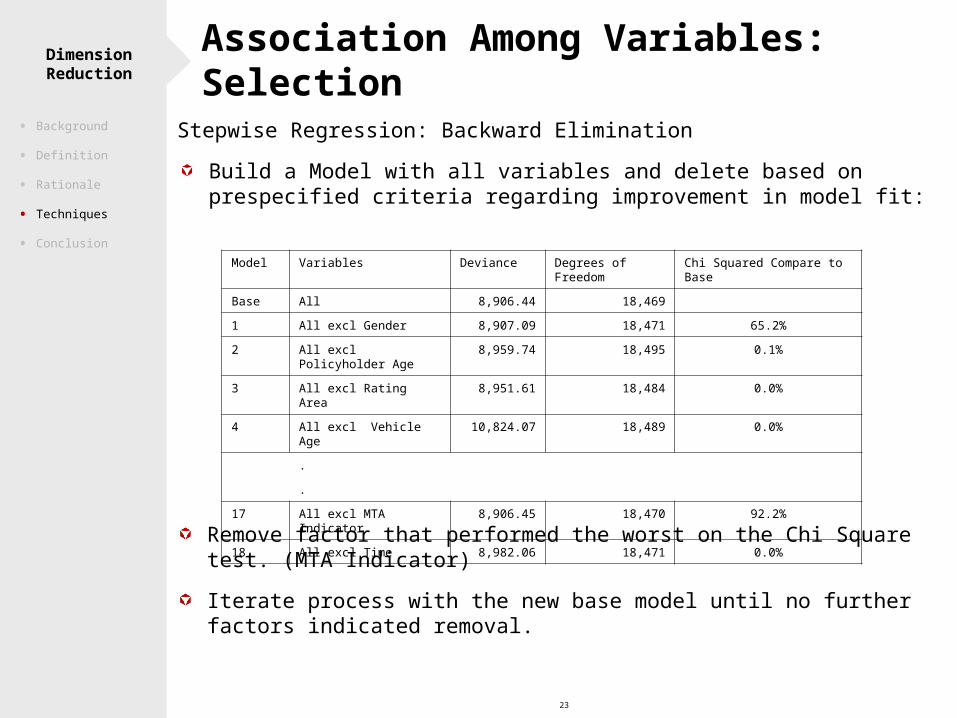
Stepwise Regression: Backward Elimination
Build a Model with all variables and delete based on prespecified criteria regarding improvement in model fit:
Model Variables Deviance Degrees of Freedom Chi Squared Compare to Base
Base All 8,906.44 18,469
1 All excl Gender 8,907.09 18,471 65.2%
2 All excl Policyholder Age 8,959.74 18,495 0.1%
3 All excl Rating Area 8,951.61 18,484 0.0%
4 All excl Vehicle Age 10,824.07 18,489 0.0%
.
.
17 All excl MTA Indicator 8,906.45 18,470 92.2%
18 All excl Time 8,982.06 18,471 0.0%
Remove factor that performed the worst on the Chi Square test. (MTA Indicator)
Iterate process with the new base model until no further factors indicated removal.
• Background
• Definition
• Rationale
• Techniques
• Conclusion

24
Dimension Reduction Association Among Variables: Selection
Stepwise Regression: Forward Selection
Build a Model with no factors and add based on prespecified criteria regarding improvement in model fit:
Model Variables Deviance Degrees of Freedom Chi Squared Compare to Base
Base Mean 12,380.23 18,596
1 Mean + Gender 12,377.02 18,594 20.1%
2 Mean + Policyholder Age 12,214.88 18,570 0.0%
3 Mean + Rating Area 12,365.50 18,581 47.1%
4 Mean + Vehicle Age 9,997.75 18,576 0.0%
.
.
17 Mean + MTA Indicator 12,370.30 18,595 0.2%
18 Mean + Time 12,371.45 18,594 0.1%
Add the factor that performed the best on the Chi Square test. (Policyholder Age)
Iterate process with the new base model until no further factors indicated removal.
• Background
• Definition
• Rationale
• Techniques
• Conclusion
25
Dimension Reduction Association Among Variables: Selection
Drawbacks to Stepwise Regression:
Tendency to Overfit the data.
Short cuts the exploratory process through which the researcher gains an intuitive feel for the data.
Problems in the presence of collinearity.
• Background
• Definition
• Rationale
• Techniques
• Conclusion
26
Dimension Reduction
Association Among Variables: Transformation
Curve Fitting
While a factor might be significant, it may be desirable to smooth adjacent levels to create a more parsimonious model.
Things to look for:
Factors which have a natural x-axis that can be converted to a continuous scale.
Factors with a sufficient number of levels to justify curve fitting.
Factors with a definite trend or progression.
Models with and without the factor are not significantly different.
• Chi Square Tests
• Background
• Definition
• Rationale
• Techniques
• Conclusion
27
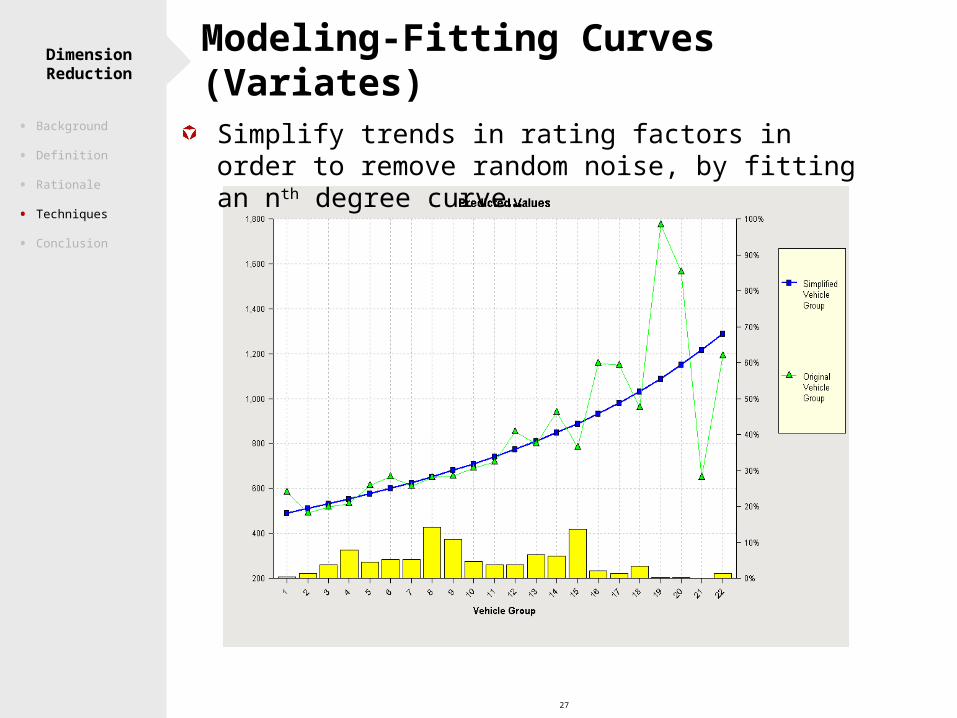
Dimension Reduction Modeling-Fitting Curves (Variates)
Simplify trends in rating factors in order to remove random noise, by fitting an nth degree curve…
• Background
• Definition
• Rationale
• Techniques
• Conclusion

28
Dimension Reduction Modeling-Fitting Curves (Variates)
Additional Curve Fitting Options
Degree of the Polynomial
Multiple curves across the same variable
Splines
• Background
• Definition
• Rationale
• Techniques
• Conclusion
29
Dimension Reduction
Association Among Variables:Transformation
Principle Components Analysis
Goal: Identify a smaller number of dimensions as a linear combination of the original dimensions that will account for a sufficient amount of information exhibited in the original set.
Potential Applications Helpful in eliminating collinearity among rating variables
Creation of indices from multiple dimensions
Identifying patterns of Association among variables
Linearly combining existing rating factors into a single rating factor.
• Background
• Definition
• Rationale
• Techniques
• Conclusion
30
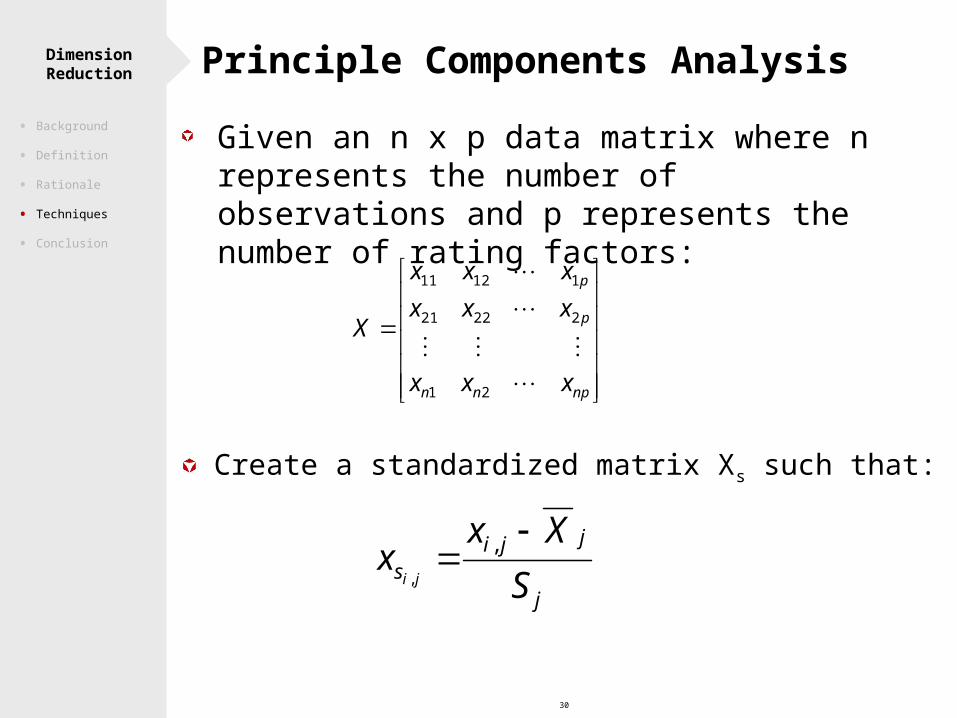
Dimension Reduction Principle Components Analysis
Given an n x p data matrix where n represents the number of observations and p represents the number of rating factors:
npnn
p
p
xxx
xxx
xxx
X
21
22221
11211
Create a standardized matrix Xs such that:
j
jjis S
Xxx
ji
,
,
• Background
• Definition
• Rationale
• Techniques
• Conclusion
31
Dimension Reduction
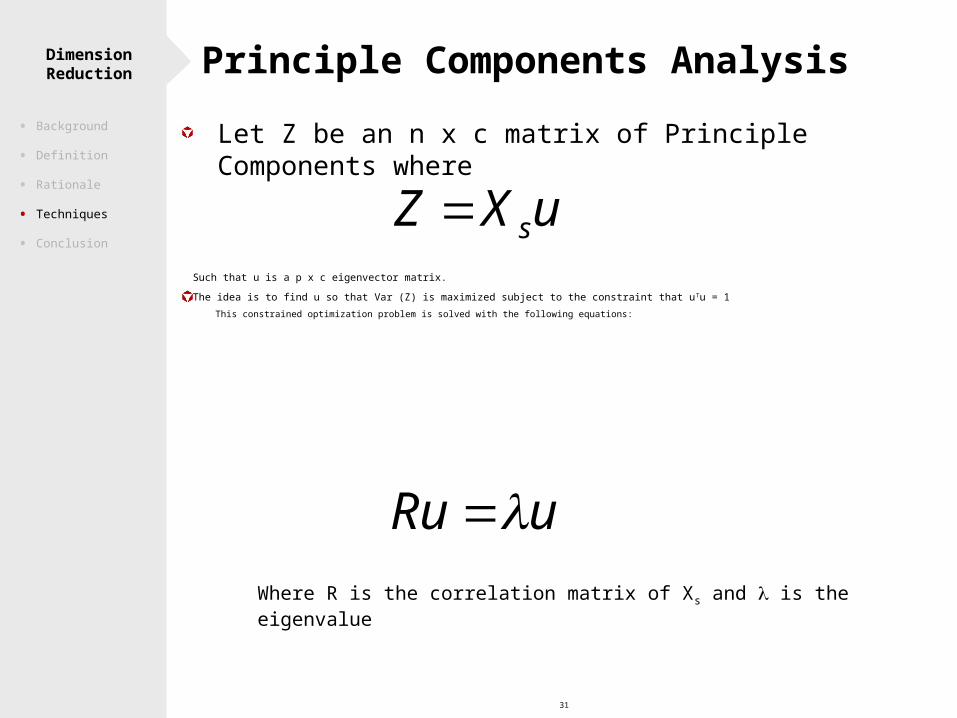
Let Z be an n x c matrix of Principle Components where
uXZ sSuch that u is a p x c eigenvector matrix.
The idea is to find u so that Var (Z) is maximized subject to the constraint that uTu = 1
This constrained optimization problem is solved with the following equations:
uRu Where R is the correlation matrix of Xs and is the eigenvalue
Principle Components Analysis
• Background
• Definition
• Rationale
• Techniques
• Conclusion

32
Dimension Reduction
Example: PCA performed on the following factors
Vehicle Age (VA)
NCD
Major Convictions (MJ)
Minor Convictions (MN)
First Principle Component
Z1 = 0.0687 VA + -0.7036 NCD + 0.7038 MJ + -0.0699 MN
Z1 explains about half of the underlying variance in the underlying factors
Potential Applications
Insurance Scores
Vehicle Symboling
Principle Components Analysis
• Background
• Definition
• Rationale
• Techniques
• Conclusion
33
Dimension Reduction
Association Among Variables:Transformation
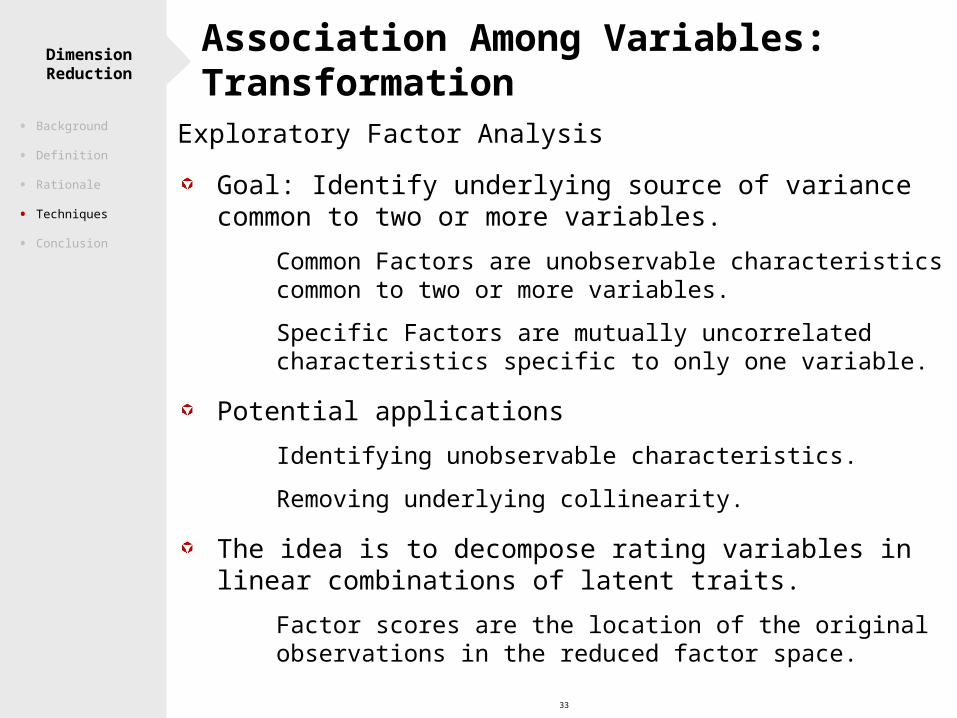
Exploratory Factor Analysis
Goal: Identify underlying source of variance common to two or more variables.
Common Factors are unobservable characteristics common to two or more variables.
Specific Factors are mutually uncorrelated characteristics specific to only one variable.
Potential applications
Identifying unobservable characteristics.
Removing underlying collinearity.
The idea is to decompose rating variables in linear combinations of latent traits.
Factor scores are the location of the original observations in the reduced factor space.
• Background
• Definition
• Rationale
• Techniques
• Conclusion

34
Dimension Reduction Exploratory Factor Analysis
Given the n x p standardized matrix defined earlier then the common factor model is defined as follows:
TcsX
Such that
cppp
c
c
c
p
c
,2,1,
,22,21,2
,12,11,1
21
21
Where j is the jth factor that is common to all observed variables, i,j is the coefficient and i is the ith factor specific to the ith rating variable.
• Background
• Definition
• Rationale
• Techniques
• Conclusion
35
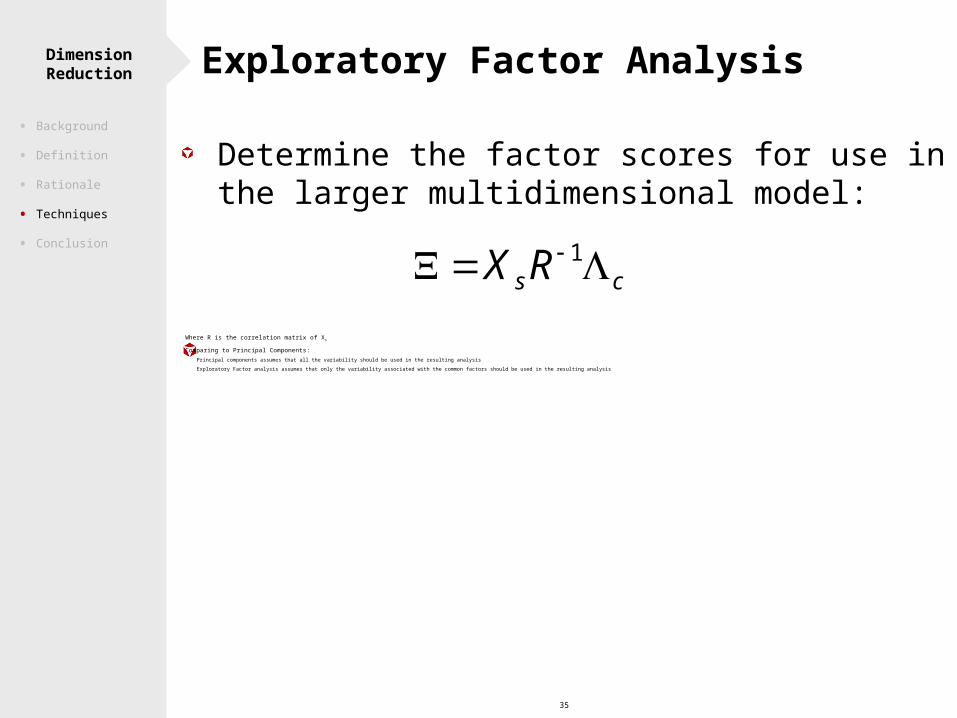
Dimension Reduction Exploratory Factor Analysis
Determine the factor scores for use in the larger multidimensional model:
csRX 1
Where R is the correlation matrix of Xs
Comparing to Principal Components: Principal components assumes that all the variability should be used in the resulting analysis
Exploratory Factor analysis assumes that only the variability associated with the common factors should be used in the resulting analysis
• Background
• Definition
• Rationale
• Techniques
• Conclusion

36
Dimension Reduction Exploratory Factor Analysis
Potential Applications
Generating new rating variables
Simplifying existing rating structures
• Background
• Definition
• Rationale
• Techniques
• Conclusion
37
Dimension Reduction Association Among Observations
Multidimensional Scaling
Goal: Detect meaningful underlying dimensions that allow one to explain observed similarities between objects.
Approach is to arrange objects in a space with a particular number of dimensions so as to produce the observed distances.
Types
Metric
Nonmetric
Multidimensional Analysis of Preference
Potential Applications: Perceptual Mappings
Identify and model customers premium expectations.
Map the importance and influence of various insurance operations based on customer surveys.
• Background
• Definition
• Rationale
• Techniques
• Conclusion

38
Dimension Reduction
Clustering
Goal: Minimize within-group heterogeneity.
Maximize cross-group heterogeneity.
Produce groupings which are predictive in future.
Basic Methods Quantiles
Equal Weight
Similarity Methods
K-means Clustering
Association Among Observations
• Background
• Definition
• Rationale
• Techniques
• Conclusion

39
Dimension Reduction
Quantiles Create groups with equal numbers of observations.
Equal Weight Create groups which have an equal amount of weight.
Clustering
• Background
• Definition
• Rationale
• Techniques
• Conclusion
40
Dimension Reduction
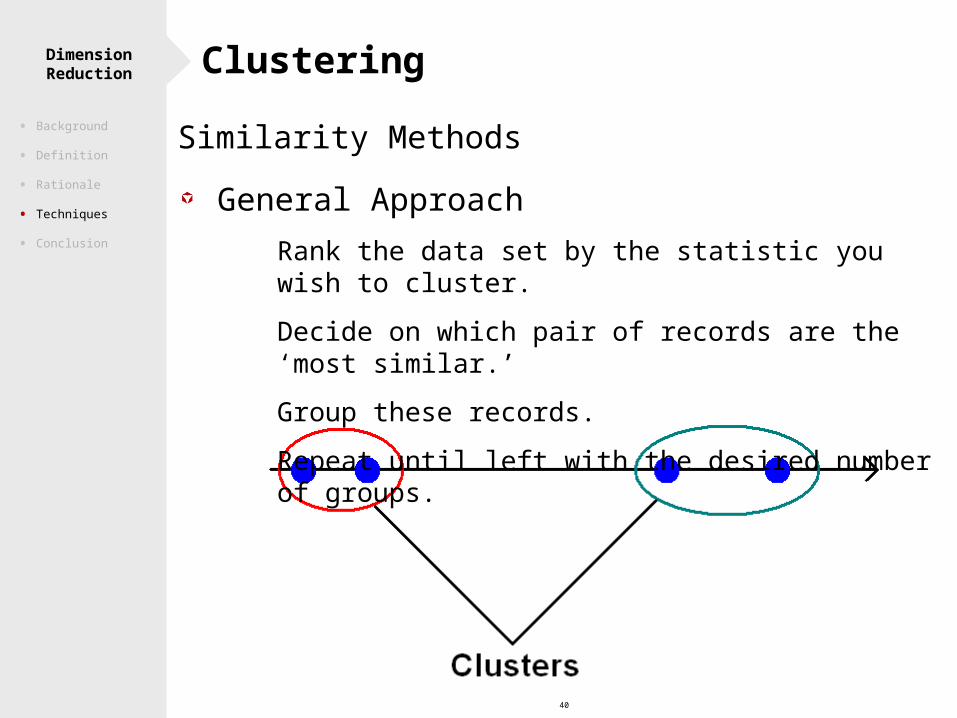
Similarity Methods
General Approach Rank the data set by the statistic you wish to cluster.
Decide on which pair of records are the ‘most similar.’
Group these records.
Repeat until left with the desired number of groups.
Clustering
• Background
• Definition
• Rationale
• Techniques
• Conclusion

41
Dimension Reduction
Similarity Methods
Average Linkage Distance between clusters is the average distance
between pairs of observations, one in each cluster.
Tends to join clusters with small variances.
0.04
0.06
0.08
0.1
0.12
0.14
1 2 3 4 5 6 7 8 9 10 11 12 13 14 15 16 17 18 19 20
Band
Sta
tis
tic
0
0.05
0.1
0.15
0.2
0.25
Pe
rce
nta
ge
of
We
igh
t
PercentageofWeight
Statistic
Clustering
• Background
• Definition
• Rationale
• Techniques
• Conclusion
42
Dimension Reduction
0.04
0.06
0.08
0.1
0.12
0.14
1 2 3 4 5 6 7 8 9 10 11 12 13 14 15 16 17 18 19 20
Band
Sta
tis
tic
0
0.02
0.04
0.06
0.08
0.1
0.12
0.14
0.16
Pe
rce
nta
ge
of
We
igh
t
PercentageofWeight
Statistic
Clustering
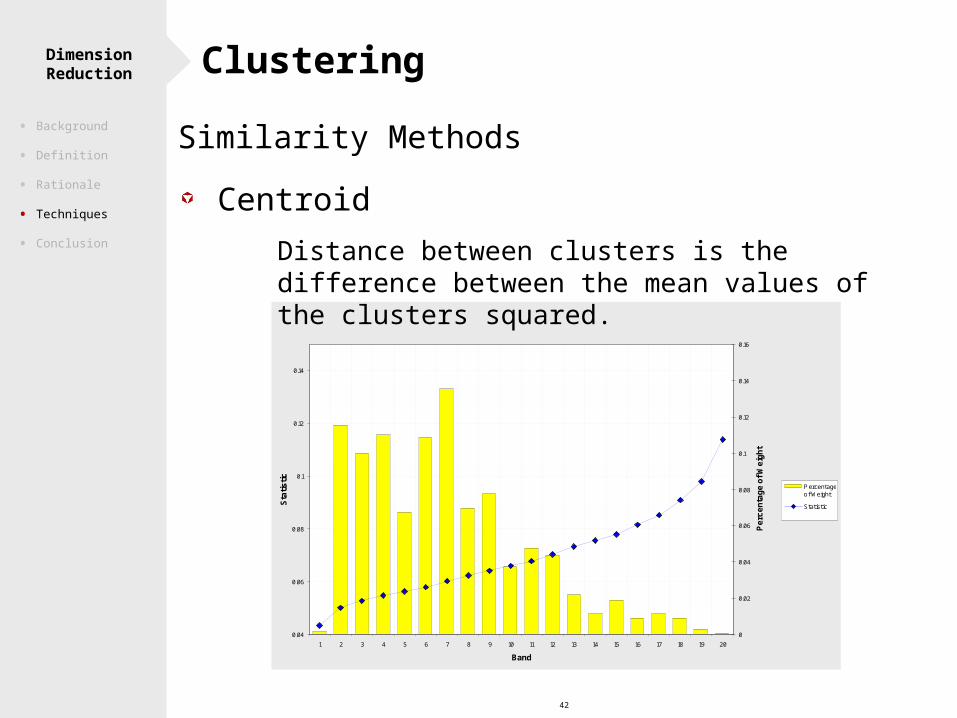
Similarity Methods
Centroid Distance between clusters is the difference between
the mean values of the clusters squared.
• Background
• Definition
• Rationale
• Techniques
• Conclusion

43
Dimension Reduction
K-means
Rank the observations.
Split into k groups e.g. using quantile method.
Calculate the mean value of each group.
Define group start/end-points as being half-way between adjacent mean values.
Reallocate each observation.
Repeat until group start and end-points converge.
Clustering
• Background
• Definition
• Rationale
• Techniques
• Conclusion
44
Dimension Reduction Forced Dimension Reduction
Regulatory disallows credit {undesirable subsidy} Include in modeling of frequency and severity to get
most predictive pure premium
Model rating algorithm without credit variable
Try to adjust for lack of credit
Business dimension {desirable subsidy} Model rating algorithm without adjustments as if factor
fully included
Otherwise, model will try to “correct” for excluded variable
• Background
• Definition
• Rationale
• Techniques
• Conclusion

45
Dimension Reduction Conclusion
How many variables are available? Rating plan vs. available in warehouse.
Credit factors.
Socio demographic.
Objective is to identify factors which are predictive
Which are best at differentiating risks?
Understand all predictive variables before building in any constraints.
• Background
• Definition
• Rationale
• Techniques
• Conclusion

46
Dimension Reduction Conclusion
How many levels do we have in our predictive variables?
Driver age.
Zipcode.
Numbers of levels and nature of variable will determine most appropriate measure.
Objective is to identify underlying signal and represent it in our models.
• Background
• Definition
• Rationale
• Techniques
• Conclusion
47
Dimension Reduction Conclusion
Available factors.
Identify predictive variables.
Extract signal from predictive variables.
Use models to build rating plan.
• Background
• Definition
• Rationale
• Techniques
• Conclusion

48
Dimension Reduction
Questions?


