MoDOl lE 5092 .M8A3 no.74-4 c.2 SOURI COOPERATIVE HIGHWAY RESEARCH PROGRAM FINAL REPORT AN INVESTIGATION OF SKID RESISTANT ASPHALTIC MIX DESIGNS MISSOURI STATE HIGHWAY DEPARTMENT Property of MoDOl TRANSPORTATION liBRARY ·
Transcript
MoDOl
lE 5092 .M8A3
no.74-4 c.2
SOURI COOPERATIVE HIGHWAY RESEARCH PROGRAM
FINAL REPORT
AN INVESTIGATION OF SKID RESISTANT ASPHALTIC MIX DESIGNS
MISSOURI STATE HIGHWAY DEPARTMENT
Property of
MoDOl TRANSPORTATION liBRARY ·
)
1 1 1 }
1 ]
1 J
I J
1
1
1 J
AN INVESTIGATION OF SKID RESIST ANT ASPHALTIC MIX DESIGNS
STUDY NO. 74-4
FINAL REPORT
Prepared by
MISSOURI STATE HIGHWAY DEPARTMENT
DIVISION OF MATERIALS AND RESEARCH
November, 1978
In Cooperation With
U. S. Department of Transportation
Federal Highway Administration
The OpInIOnS, findings, and conclusions expressed in this publication are not necessarily those of the Department of Transportation, Federal Highway Administration. This report does not constitute a standard, specification, or regulation.
48
I 1 1 I 1 1 1 ]
J
1 I 1 j
J
I I 1 I
ABSTRACT
This report discusses the durability of skid resistance of some flexible pavement
surface mixes constructed using special aggregates which have been found to produce
surface with improved skid resistance . . The ability of these mixes to maintain an improved
level of skid resistance is unknown. Evaluation of this ability involved determining the
influence of traffic volumes and accumulated traffic on the improved frictional
characteristics.
Special aggregates utilized were flint chat (Joplin Flint chat), lightweight
limestone and Black River gravel . Twenty sections with various
limestones . . . . . . . . . . . .
Skid Trailer
mix type:
39.304 miles
0.680 mile
1.100 miles 4.458 miles
2.461 miles
10.110 miles
28.467 miles
10.948 miles
57.981 miles
Frictional properties of pavements on these projects were determined using a
locked wheel skid trailer which substantially complies with ASTM E 274. The skid testing
system was calibrated at the Field Test and Evaluation Center, located at Texas
Transportation Institute, College Station, Texas, in April, 1974, and again in February,
1977. Prior to April, 1974, the trailer was equipped with 7.75 x 14 standard test tires
conforming to the requirements of ASTM E 249. After April, 1974, G78-l5 tires
conforming to the requirements of ASTM E 501 were used.
During the evaluation period in February, 1977, water nozzles were changed
to the Penn State type to obtain a wider water stream.
Testing Procedures
Generally, each test section was tested for skid resistance in five locations per
direction at each test speed. There were cases where the test section was not of sufficient
length to permit five tests. Some projects were tested in more than one lane. In order
to simplify wheelpath indication, a method of numbering was devised. Test positions
(wheelpaths) were numbered consecutively from right to left beginning with the right
wheelpath of the first traffic lane. Most of the testing was performed in "position 2"
(inner wheelpath).
-7-
Data Analysis
For analyzing changes in SN due to traffic, AADLT and age at time of testing
were used to calculate TR.
It has been found, when correlating SN and TR, a log-log relationship is the
most meaningful The slope of the line through two points is defined as the friction
wear factor. It quickly became evident the equation for a line was not adequate for
determining a wear factor if it involved more than two data points.
Generally, the same result can be obtained from a linear regression analysis using
the log-log relationship ..
Also included in the analysis is Syx Values are given in logarithmic form .
~,x is a measure of variability similar to standard deviation. However, in the regression analysis, variability is about a line rather than about a mean.
CV is defined as the ratio of Sy.x to mean SN, expressed as a percentage. The r2 value expresses to what degree SN is affected by TR. An r2 value
of 0668 indicates 66,8% of the influence on SN is caused by TR. The other 33.2% influence
is from factors other than TR. It is possible a trend could be established for some other
variable. However, in this case, TR was the only variable considered.
A 95% level of confidence was used to determine significance of the effect of
TR If significance was established, the regression line was drawn on the graph. It should
be realized that this regression line is valid only within the limits of existing data. If
non-significance was established, it was indicated with the sentence, "A regression analysis
indicates that the skid numbers are not significantly affected by accumulated traffic,
therefore, a dependable wear factor cannot be calculated" .
Project Results
For plant mix bituminous pavements, percentages given for mineral aggregates
are normally calculated on total weight of mineral aggregate instead of total weight of
mix, as is the case for asphaltic concrete pavements.
Wet Bottom Boiler SJag*
The following four projects utilized wet bottom boiler slag in varying amounts
as part of the mjneral aggregate. Each produced very similar results, which tends to point
out the amount of wet bottom boiler slag in pavements with various limestones is not critical in locations with AADLT under 1000,
*Wet bottom boiler slag is a waste product of coal burning, electric utility plants. It
is essentially silicon dioxide and is a black, vitreous, hard, angular material. The slag
is discharged in a molten state at the bottom of the boiler into a water bath which quickly cools the slag into a solid state.
-8-
~
1 I I J
1
1
1
t
J
J
1
1
J
1
I I 1
1
I I I f
[
! l
It appears there are no statistically important relationships between SN and TR
on wet bottom boiler slag mixes, However, analyses of variance were highly suggestive
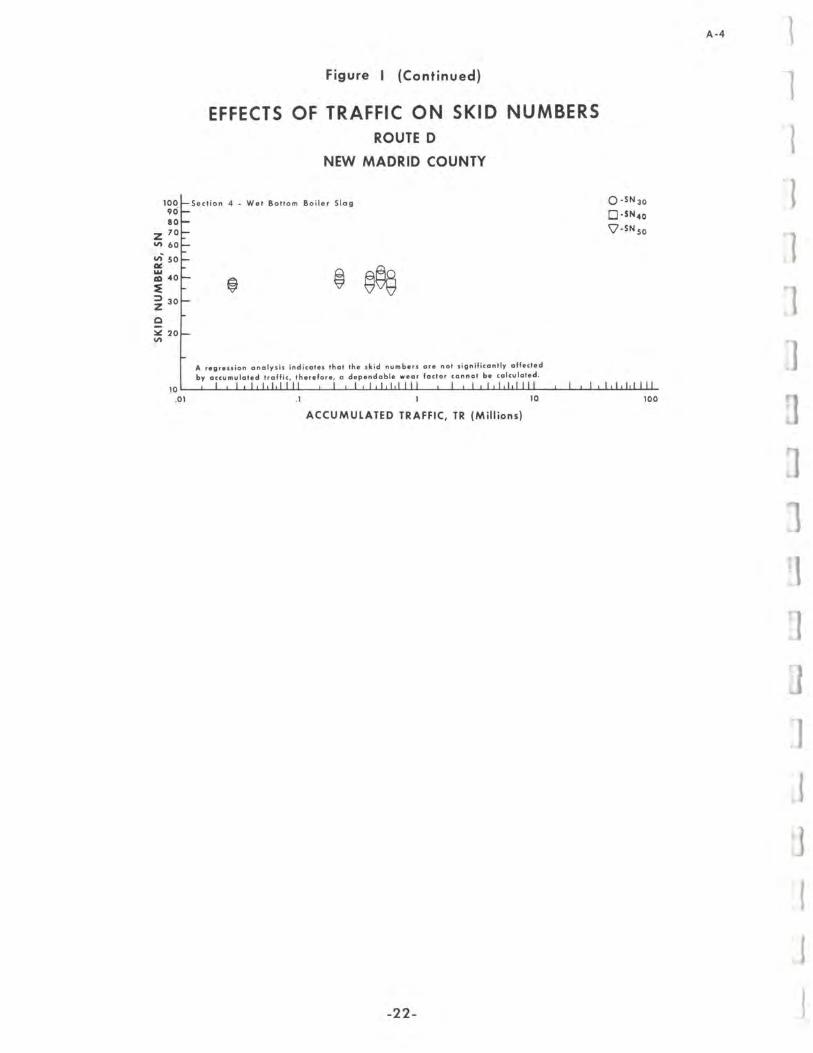
AADLT does affect SN to some degree. ROUTE D, NEW MADRID COUNTY (Section A of the appendix): The plant
mix bituminous pavement on this project utilized 96.0% wet bottom boiler slag as aggregate.
Two years of testing provided SN40 averaging in the lower 40's for AADLT
ranging from 350 to 500 and SN40 averaging in the higher 30's for an AADLT of about
950. Each test section shows a SN40 range of 5 SN or less,
An analysis of variance indicated SN on the sections with the lowest and highest
AADLT (Sections 2 and 4 respectively) were significantly different from each other at
the 99% level of confidence.
ROUTE 41, SALINE COUNTY (Section B of the appendix): The plant mix
bituminous pavement on this project utilized 20.0% wet bottom boiler slag as fine aggregate
and 39.0% each of Callaway and Chouteau limestones as coarse aggregate.
Five years of data indicated SN40 averaged slightly less than 50 and had a range
of 14 SN, The lowest values were obtained after about two years of testing. AADLT
ranged from 300 to 450.
Regression analyses on the data did not establish significant relationships between
SN and TR In addition, there was no statistical indication SN was significantly affected by AADLT.
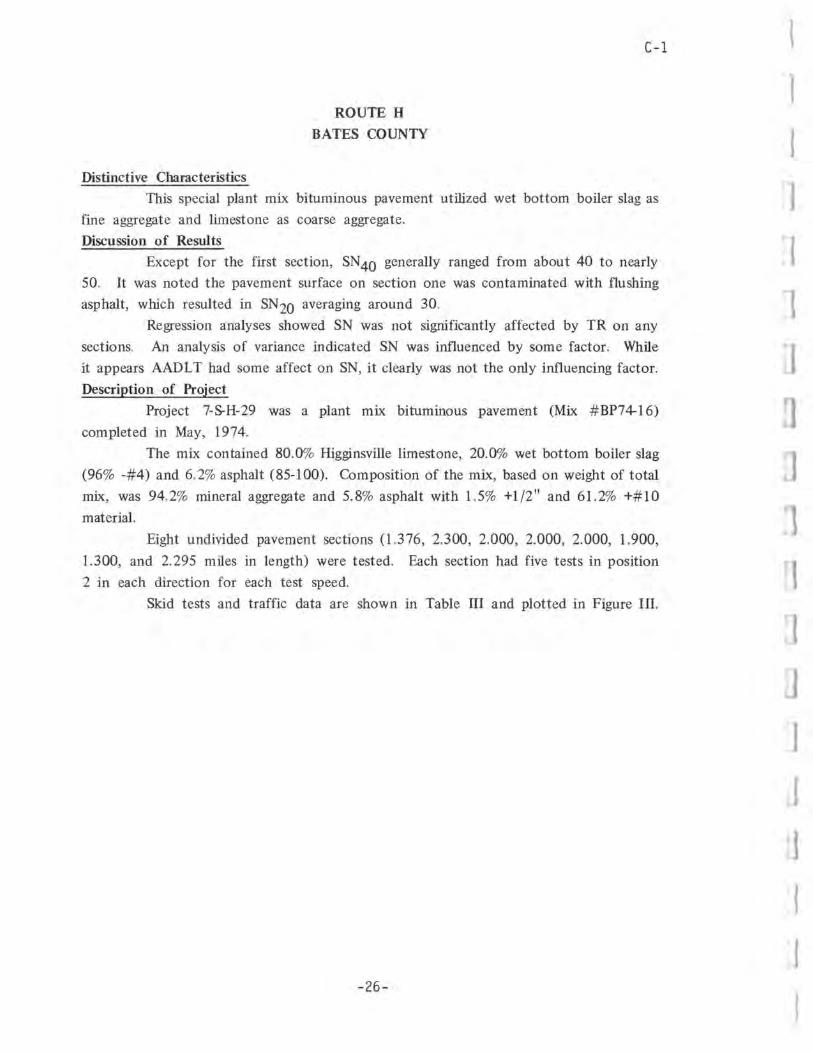
ROUTE H, BATES COUNTY (Section C of the appendix): The plant mix
bituminous pavement on this project utilized 20.0% wet bottom boiler slag as fine aggregate
and 80.0% Higginsville limestone as coarse aggregate, After approximately four years of
testing, average SN40 ranged from about 40 to 50. SN40 on most sections ranged over a 7 SN spread. AADLT ranged from 150 to 400.
Section one was not evaluated with the other sections. Besides being tested
at lower speed due to being in a town, the surface was contaminated with flushing asphalt.
An analysis of variance indicated some factor influenced SN but it was apparent
AADL T was not the only influencing factor. According to the regression analyses, the
effect on SN from TR was not significant.
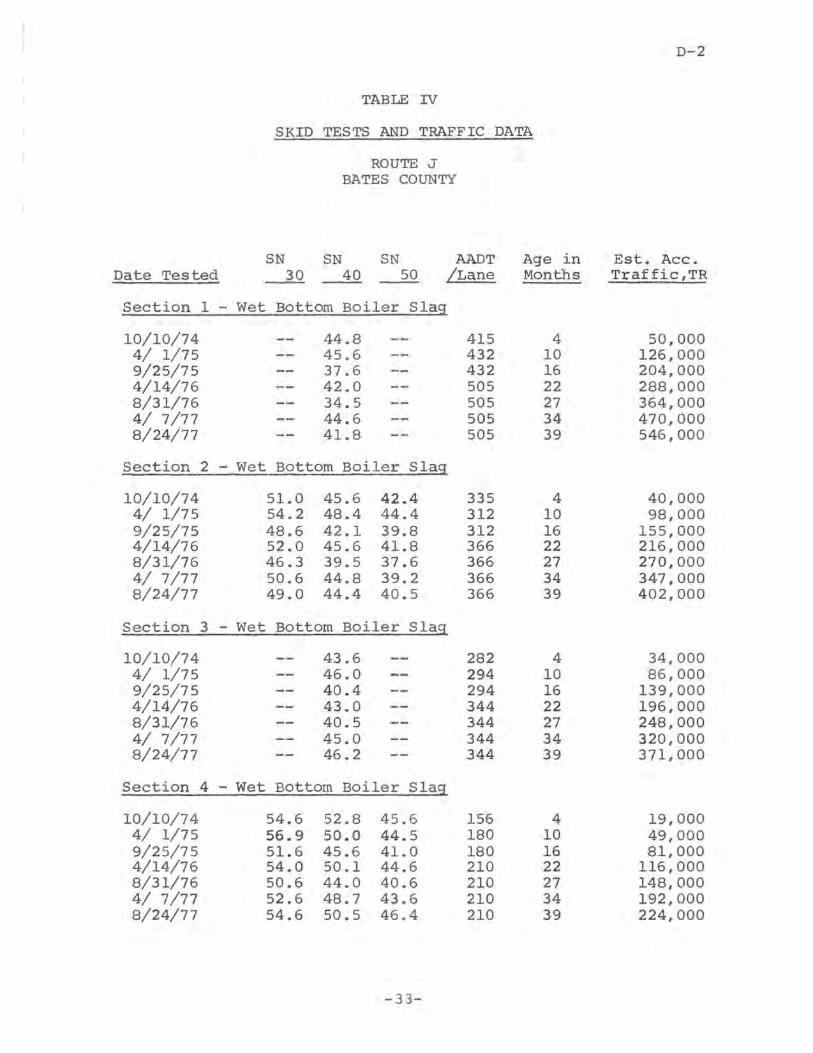
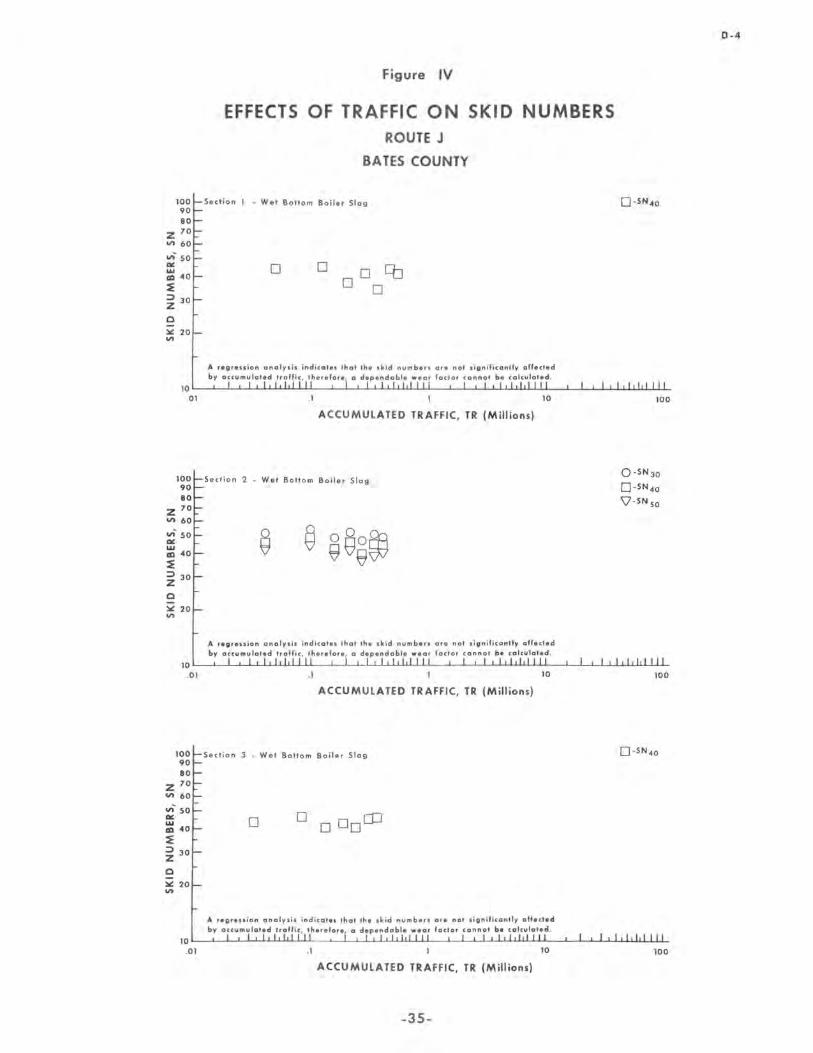
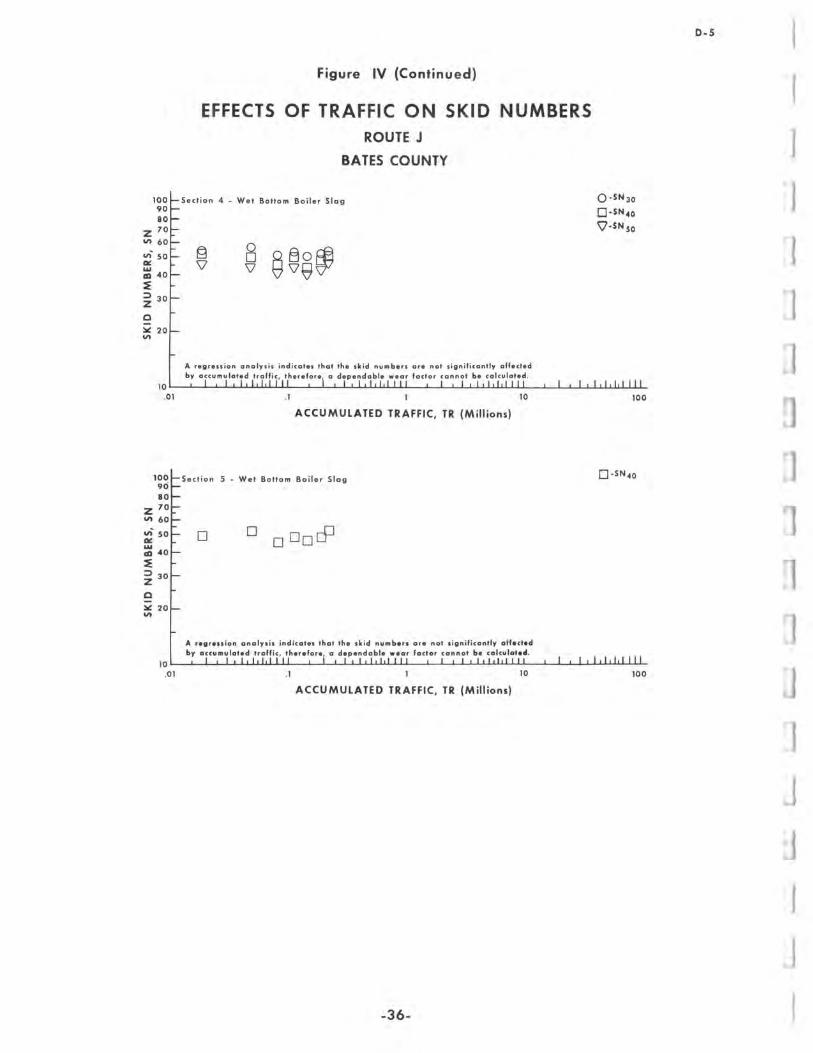
ROUTE J, BATES COUNTY (Section D of the appendix): The plant mix
bituminous pavement on this project also utilized 20,0% wet bottom boiler slag as fine
aggregate and 80,0% Higginsville limestone as coarse aggregate, The mix design was identical
to the above project.
Four years of testing provided SN40 averaging in the 40's for all five sections.
This project has a slightly larger range of SN than the Route H project. AADLT ranged
from 200 to 500.
-9-
Although regression analyses indicated SN was not significantly affected by TR,
an analysis of variance indicated AADLT did significantly affect SN.
Lightweight Aggregate (Expanded Shale)
The asphaltic concrete pavements on the following two projects utilized
lightweight aggregate as coarse aggregate. In each case, the new surface significantly
improved skid resistance about 20 SN,
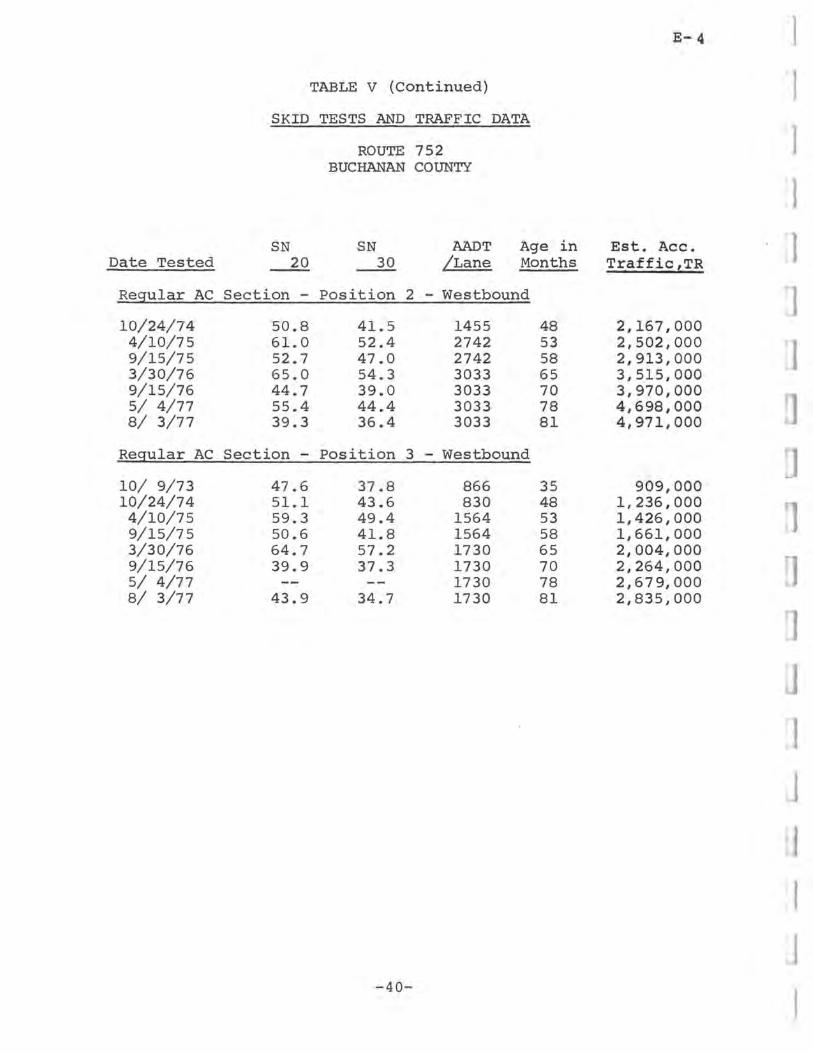
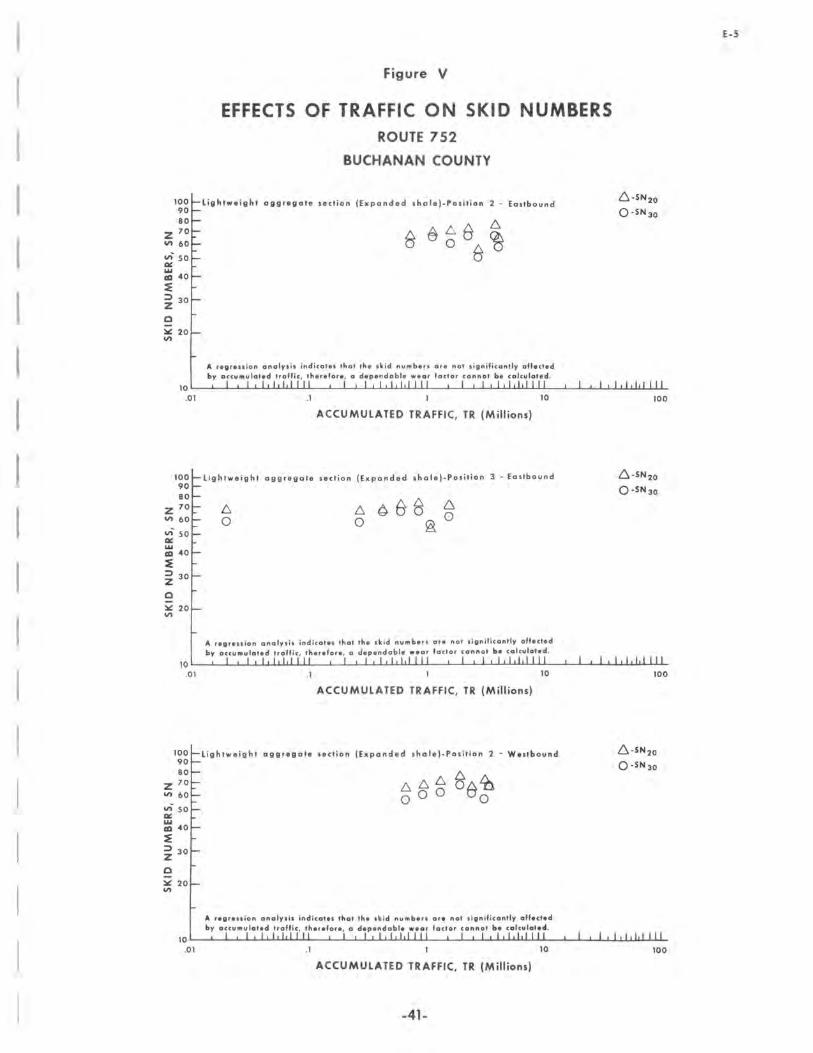
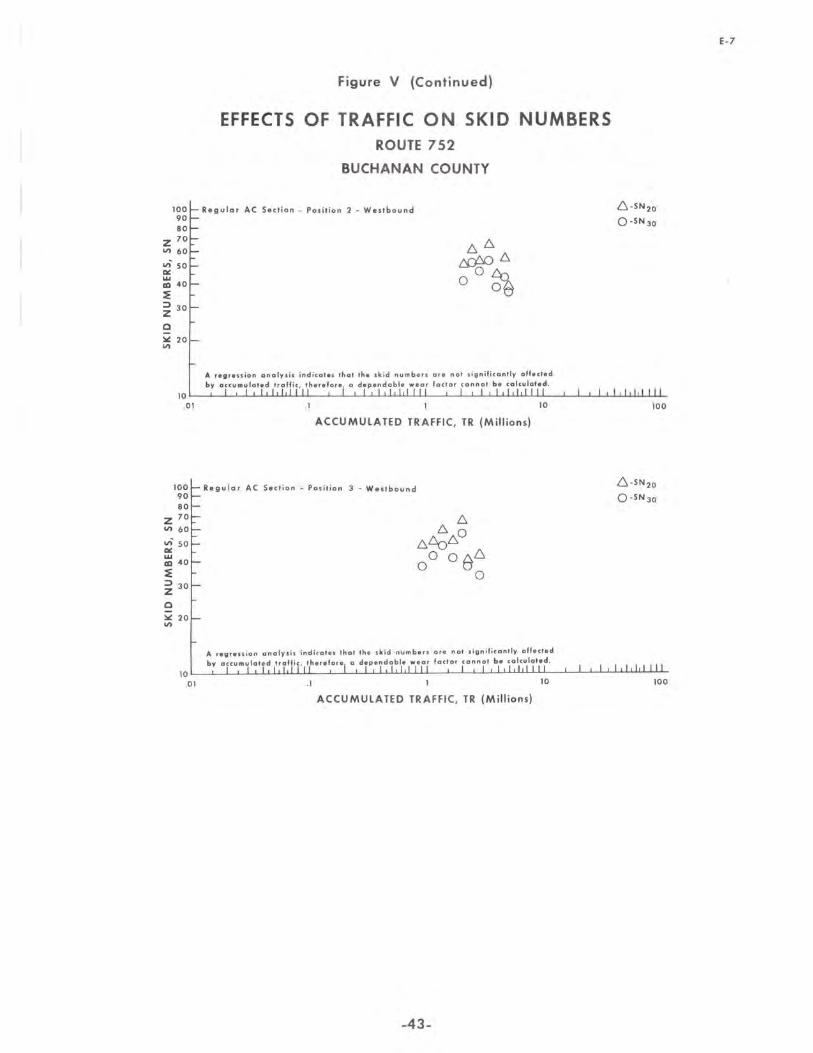
ROUTE 752, BUCHANAN COUNTY (Section E of the appendix): This asphaltic
concrete pavement utilizing lightweight aggregate was placed on a curve. A control section
of regular asphaltic concrete was also tested.
After four years of testing, SN30 averaged in the lower 60's compared to the
lower 40's in the control section. No 40 mph tests were made.
There were no statistical implications SN was affected by either TR or AADLT.
AADLT ranged from 1300 to 3600.
ROUTE 1-70, JACKSON COUNTY (Section F of the appendix): This asphaltic
concrete pavement utiHzing lightweight aggregate was also placed on a curve. A control
section of PCC pavement was also tested.
After two years of testing, SN40 averaged in the middle 40's for the lightweight
aggregate section compared to the lower 20's in the control section. AADLT ranged
from 12,000 to 17,000.
Statistical analyses did not disclose any significant relationships between SN and
TR or AADLT
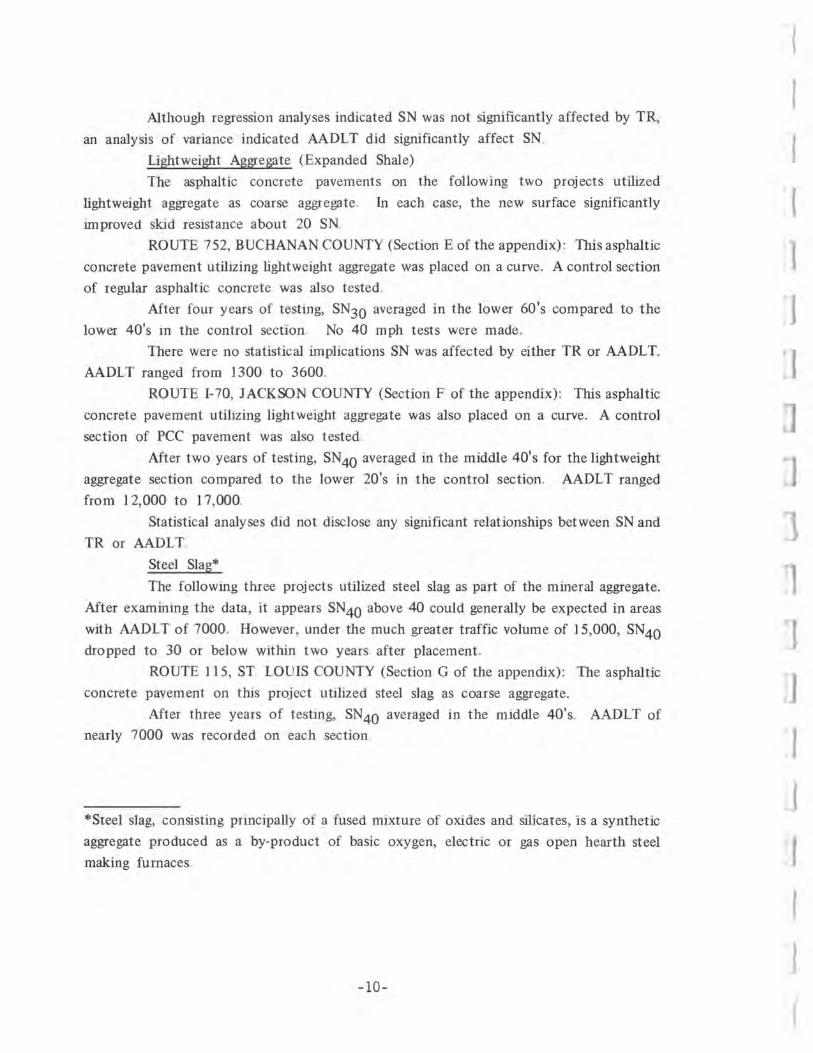
Steel Slag*
The following three projects utilized steel slag as part of the mineral aggregate.
Mter examining the data, it appears SN40 above 40 could generally be expected in areas
with AADLT of 7000. However, under the much greater traffic volume of 15,000, SN40
dropped to 30 or below within two years after placement.
ROUTE 115, ST. LOUIS COUNTY (Section G of the appendix): The asphaltic
concrete pavement on this project utilized steel slag as coarse aggregate.
Mter three years of testing, SN40 averaged in the middle 40's. AADLT of
nearly 7000 was recorded on each section.
*Steel slag, consisting principally of a fused mixture of oxides and silicates, is a synthetic
aggregate produced as a by-product of basic oxygen, electric or gas open hearth steel
making furnaces.
-10-
I 1 I
1 "1
1
]
J
J J
f
1 J
I I {
I I 1
I I I l
[
l
The 20 mph and 30 mph test results in Section 1 showed a definite statistical
relationship between SN and TR Wear factors of -0. 132 and -0.082, respectively, were
computed" ROUTE 141, ST. LOUIS COUNTY (Section H of the appendix): The asphaltic
concrete pavement on this project also utilized steel slag as coarse aggregate"
Two years of data on this single test section with an AADL T of about 6000
revealed SN40 maintaining an average of about 46 with a maximum range of 63 SN,
No significant relationships were detected by regression analyses on the data,
ROUTE 1-44, STo LOUIS COUNTY (Section Y of the appendix) : The asphaltic
concrete pavement on this project utilized steel slag as coarse aggregate.
Less than two years of data has been collected on this project. SN40 appears
to be dropping rather sharply from around 40 to about 30 or less, AADLT was in the
neighborhood of 15,000.
Regression analyses did not indicate significant relationships between SN and
TR and an analysis of variance gave no indication of significant influence on SN ..
Blast Furnace Slag*
The asphaltic concrete pavements on the following two projects utilized blast
furnace slag as coarse aggregate. The pavements generally produced SN40 of above SO
for AADLT of less than 7000 and above 60 for AADLT of 3500.
ROUTE 21, ST. LOUIS COUNTY (Section I of the appendix) : The two asphaltic
concrete pavements on this project utilized blast furnace slag as coarse aggregate. The
primary difference between mixes was the asphalt contents of 6.0% and 6.2%
About two years of testing were performed on the project. SN40 was in the
low to middle 50's and AADLT ranged from 5800 to 6600. The maximum range of
SN4Q was 7.5" Sections with 6.0% asphalt had less variability of SN than those with
6.2%" An analysis of variance indicated SN was influenced by some factor but the
influencing factor could not be pinpointed with the available data. Regression analyses
did not disclose any significant relationships between SN and TR
ROUTE 140, ST. LOUIS COUNTY (Section J of the appendix): Two asphaltic
concrete pavements were used on this project which consisted of a porphyry section and
a blast furnace slag section, The porphyry section will be discussed later.
* Air cooled blast furnace slag, consisting primarily of silicates, and alumino-silicates of
lime and other bases, is a synthetic aggregate produced as a by-product of blast furnaces.
-11-
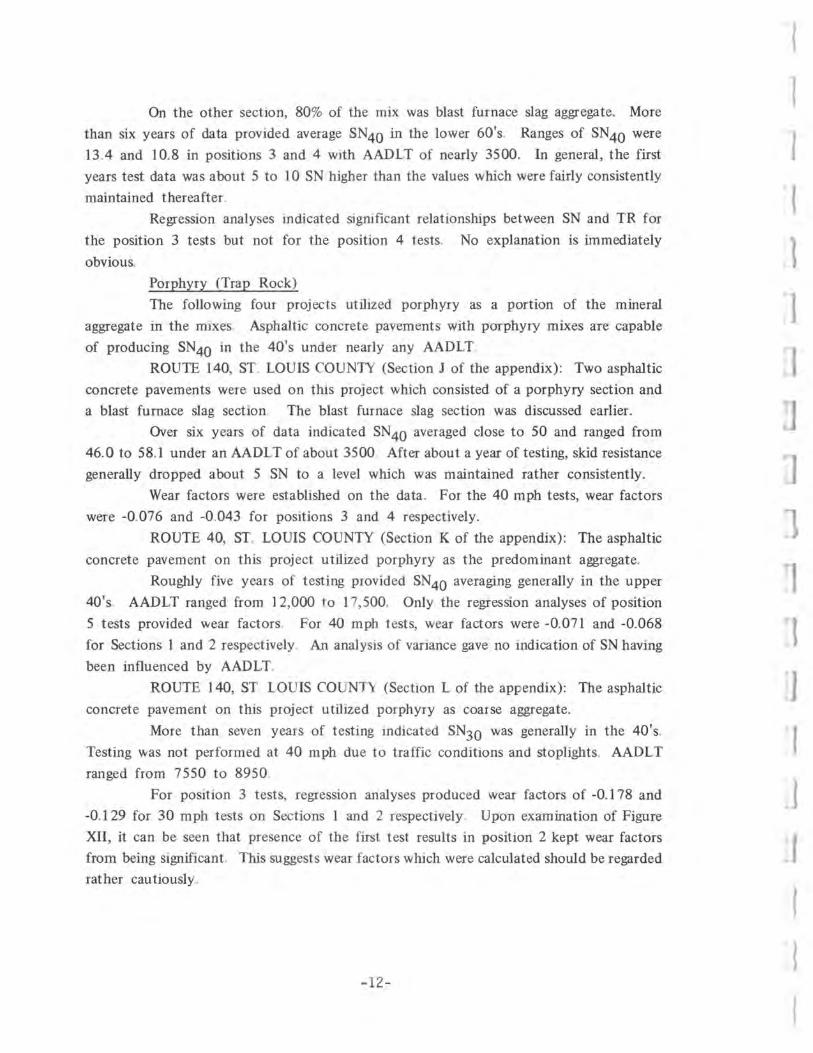
On the other section, 80% of the mix was blast furnace slag aggregate. More
than six years of data provided average SN40 in the lower 60's. Ranges of SN40 were
1304 and 10.8 in positions 3 and 4 with AADLT of nearly 3500. In general, the first
years test data was about 5 to 10 SN higher than the values which were fairly consistently
maintained thereafter,
Regression analyses indicated signi ficant relationships between SN and TR for
the position 3 tests but not for the position 4 tests. No explanation is immediately
obvious.
Porphyry (Trap Rock)
The following four projects utilized porphyry as a portion of the mineral
aggregate in the mixes Asphaltic concrete pavements with porphyry mixes are capable
of producing SN40 in the 40's under nearly any AADLT.
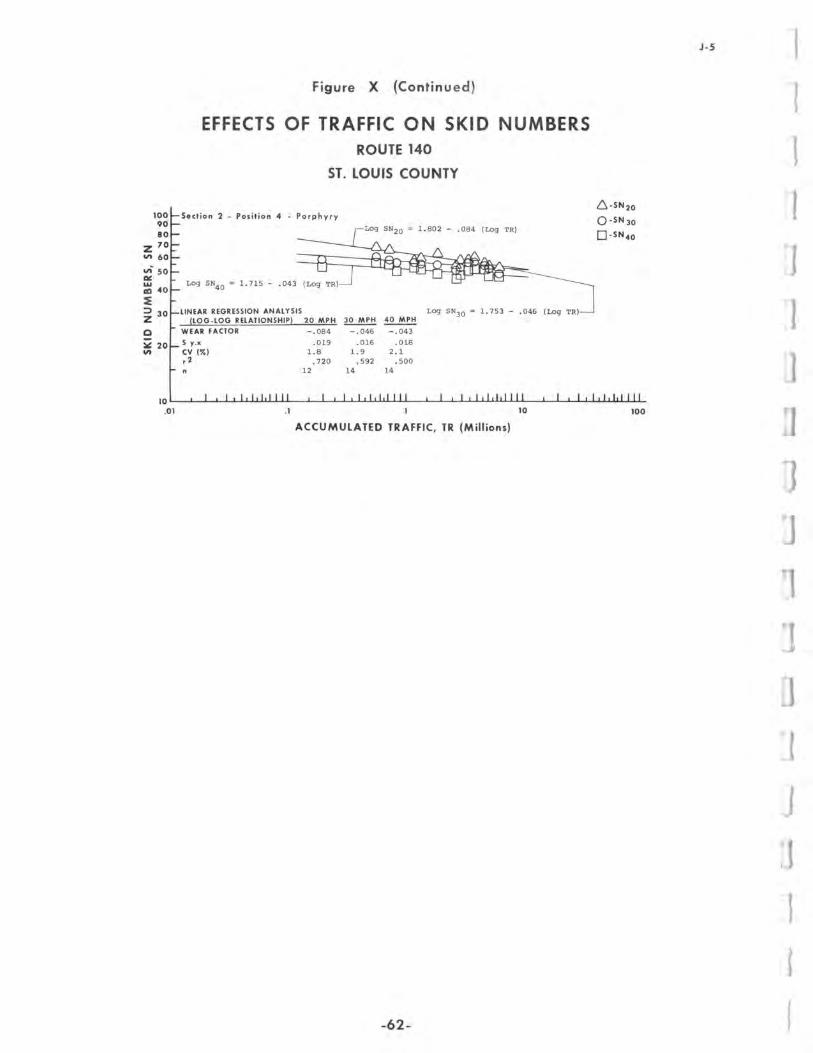
ROUTE 140, ST. LOUIS COUNTY (Section J of the appendix): Two asphaltic
concrete pavements were used on this project which consisted of a porphyry section and
a blast furnace slag section, The blast furnace slag section was discussed earlier.
Over six years of data indicated SN40 averaged close to 50 and ranged from
46.0 to 58.1 under an AADLT of about 3500. After about a year of testing, skid resistance
generally dropped about 5 SN to a level which was maintained rather consistently.
Wear factors were established on the data . For the 40 mph tests, wear factors
were -0.076 and -0 ,043 for positions 3 and 4 respectively.
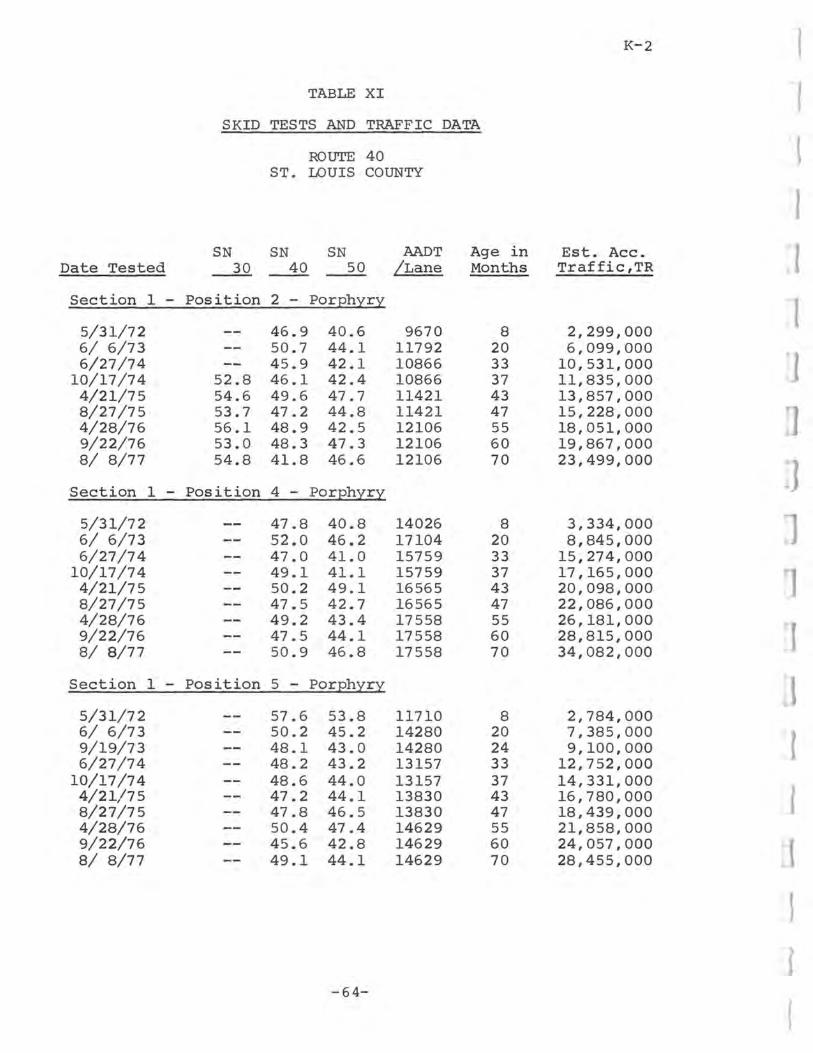
ROUTE 40, ST. LOUIS COUNTY (Section K of the appendix) : The asphaltic
concrete pavement on this project utilized porphyry as the predominant aggregate.
Roughly five years of testing provided SN40 averaging generally in the upper
4O'&, AADLT ranged from 12,000 to 17,500. Only the regression analyses of position
5 tests provided wear factors. For 40 mph tests, wear factors were -0.071 and -0.068
for Sections 1 and 2 respectively. An analysis of variance gave no indication of SN having
been influenced by AADLT.
ROUTE 140, ST. LOUIS COUNTY (Section L of the appendix) : The asphaltic
concrete pavement on this project utilized porphyry as coarse aggregate.
More than seven years of testing indicated SN30 was generally in the 40's.
Testing was not performed at 40 mph due to traffic conditions and stoplights. AADLT
ranged from 7550 to 8950.
For position 3 tests, regression analyses produced wear factors of -0.178 and
-0.129 for 30 mph tests on Sections 1 and 2 respectively. Upon examination of Figure
XII, it can be seen that presence of the first test results in position 2 kept wear factors
from being significant. This suggests wear factors which were calculated should be regarded
rather cautiously.
-12-
~
1 1
I 1 -1
1
J
J
f r
I I
I I I
[
I
An analysis of variance indicated position 3 tests are significantly higher than
position 2 tests. This situation has no obvious explanation.
ROUTE 1-435, CLAY COUNTY (Section M of the appendix) : The asphaltic
concrete pavement on this project utilized porphyry as coarse aggregate,
Roughly three years of data show SN40 generally above 50 with an AADLT
of nearly 5800.
Regression analyses on the data do not show significant trends between SN and
TR Flint Chat (J oplin Flint Chat)
The following four projects utilized flint chat in some amount, either as coarse
aggregate, fine aggregate or both. Except for the mix used on Sections 4A through 7 A,
Route 160, Greene County, flint chat mixes generally maintained SN40 in the middle
40's or higher for AADLT up to 4000,
ROUTE FF, JASPER COUNTY (Section N of the appendix) : The plant mix
bituminous pavement on this project utilized 75% flint chat and 25% Warsaw limestone
screenings.
About two years of testing produced SN40 averaging around 50 for Sections
1 and 2 and about 55 for Section 3. AADLT was about 500 on each section.
An analysis of variance indicated a significant difference between SN of Section
3 and the other two sections. No significant trends were established between SN and
TR ROUTE 160, GREENE COUNTY (Section 0 of the appendix) : The three plant
mjx bituminous pavements on this project utilized flint chat or flint chat sand in
combination with other mineral aggregates.
Sections 1 through 4 utilized 85% Burlington limestone and 15% flint chat sand.
SN40 averaged from about 48 to S5 with considerable variability. AADLT ranged from
750 to 2000. An analysis of variance did not reveal any significant differences in SN
between sections. RegresslOn analyses indicated reasonable wear factors of -0.073, -0.068,
-0.075 and -0.11 7 for SN40 on Sections 1 and 4 respectively.
Sections 5 and 6 utilized 45% Burlington limestone, 40% flint chat, and 15%
flint chat sand, SN40 averaged about 52 for both sections with AADl T of 2200 and
3800. Variability was much less than on Sections 1 through 4. Wear factors of -0,070
A regression analysis indicates that the skid numbers Of. not significantly affected by accumulated traffic, therefore, Q dependable wear factor (onnot b. calculated.
o -SN 30
D-SN 40
\7 - SN 50
10 I I, III! I I II I! I! 1.1 I II I I 1.1, J I II I, I, I. I I II
.01 .1 10
ACCUMULATED TRAFFIC, TR {Millions}
100Esection 2 - Wet Bottom Boile r Slag 90 80
Z 70 11'1 60
11'1 5,
~ 40
~ :l 30 Z C
~ 20 ."
~ ®@§
A regression analysis indicates that the s k id numbers are not significantly affected by accumulated traffic, therefor. , a dependab le we ar foctor cannot b. calculated.
100
o -SN 30
o -SN 40
\7 - SN 50
10 I I! I!', I I II I I 1,1,1 I II I I I, II J J II I I I, I, I III
.01 .1 10
ACCUMULATED TRAFFIC, TR {Millions}
lOOt-Section 3 - Wet Bottom Boiler Slag 90 80
Z 70 11'1 60
ffi- SO~® @ @ ~ III 40
~ :l 30 Z C
~ 20 11'1
A regression analysis indicates tho. the skid numbers or. not significantly aff.cted by accumulat.d traffic , ther.for. , a dependa ble wear 'aclar cannot be calculated .
100
o -SN 30
o -SN 40
\7- SN so
101 Itld"lli """dill 1""""1 I""dlll .01 .1 10 100
ACCUMULATED TRAFFIC, TR {Millions}
-21-
A-3
Figure I (Continued)
EFFECTS OF TRAFFIC ON SKID NUMBERS ROUTE D
NEW MADRID COUNTY
100f-Section 4 - Wet Bottom Boiler Slag 90 80
Z 70 11\ 60
'" SO 111: ' .... IlD 40
~ ;:) 30 Z o :.:: 20 01)
e @ ®®@
A regression analysis indicates that the skid numbers or. not significantly affected by Qccumulated traffic , ther.fore, a dependable wear foctor cannot b. calculated.
A regression analysis indicates that the skid numbers or. not significantly affected
by accumulated traffic, ther.fore, a dependable wear factor cannot b. calculated . 10' I, III,! I II . 01 I! I! 1.1 I II '''''"111
.1 10
ACCUMULATED TRAFFIC, TR (Millions)
lOOt-Section 2 - Wet Bottom Boi ler Slag 90 80
Z 70
~ "~ VI SO DC ... ~ 40
~ ::l 30 Z 0 ~ 20 VI
Q ® @@B~ \l
\l
A regression analysis indicates that the skid numbers are not si gnificantly affected by accumulated traffic, ther.for. , a dependable wear factor cannot b. calculated .
A regression analysis indicates that the skid numbers are not significantly affected by accumulated traffic , therefor., a dependable weor 'actor cannot be calculat.d .
6-SN20
101 1,ltI,Il!! ,1.ltI,j11l 111.111111 ,IIItI,I111
.01 .1 10
ACCUMULATED TRAFFIC, TR (Millions)
100 E Section 2 - Wet Bottom Boiler Slag 90 80
Z 70
'" 60
a- "F IlO 40
~ ::l 30 Z 0 ~ 20
'"
0 6 O@8~ ~ \7 ij \7
A regression analysis indicates that the skid numbers Of. not significantly offected by accumulated traffic , therefor •• a dependable wear factor cannot b. calculated .
100
o -SN 30
O - SN40
\7- SN so
101 ).Itldl!! I.!""'II ''''''''II '''''''III
.01 .1 10 100
ACCUMULATED TRAFFIC, TR (Millions)
100 Section 3 - Wet Bottom Boiler Slag O-SN40
90 80
Z 70
'" 60 .,; 50 ~
~ 40 o o oCb[jJ
~ ::l 30 Z 0 ~ 20
'"
A analysis indicates that the skid numbers or. no. significantly offected a dependable .eor fodor cannot b. calculated.
A regression analysis indicotes thot the skid numbers are not significantly affected by accumulated traffic , ther.for. , a dependable wear factor cannot b. calculated .
O-SN40
10' I, I! II! I II I! I! 1,1 I II I, I "" I II I!', II' , "
.01 .1 10
ACCUMULATED TRAFFIC, TR (Millions)
lOOf-Section 5 - Wet Bottom Boiler Slag 90 80
Z 70 VI 60
'" SO ~ 1:11: . ... ell 40
:IE ;:) 30 Z 0 ~ 20 CI'l
@ B O~E@ ~ \l \l
A regression analysis indicates that the skid numbers are not significantly affected by occumulated traffic, ther.for. , a dependable wear factor cannot b. colculated .
A regression analysis indicate, that the skid numb.,s at. not significantly affected by accumulated traffic, ther.fore, a dependable .ear factor cannot b. calculated.
A regression analysis ind icate. thot the skid numbers are not significantly affected by accumulat.d traffic , ther.for •• a dependabl. wear 'octor cannot b. calculated.
O-SN40
10' I I 111,1 'I I! I! '1" II I I I, III I I I ,!" II I'"
.01
100 90 80
Z 70
'" 60
vi" 50 Gt: . ... ID 40
~ i 30
o ~ 20
'"
.1 10
ACCUMULATED TRAFFIC, TR (Millions)
Section a · Wet Bo t tom Boiler Slog
@ @@~
A regression analys is ind icate. that the skid numbers or. not significantly affected by accumulated traff ic, ther.for. , a dependable wear 'actor cannot b. calculated.
100
o -SN 30
o -SN 40
\7 -SN 50
10' I! IIII! I II I! I! 'I'I!! I II "I"" I, I ,I" 'I'
.01 .1 10 100
ACCUMULATED TRAFFIC, TR (Millions)
-31-
C-6
Distinctive Characteristics
ROUTE J
BATES COUNTY
0-1
This special plant mix bituminous pavement utilized wet bottom boiler slag as
fihe aggregate and limestone as coarse aggregate .
Discussion of Results
Average SN40 was in the 40's on all sections. Regression analyses indicated
SN was not affected by TR. An analysis of variance disclosed SN40 was at least somewhat
influenced by AADLT.
Description of Project
Project 7-8-J-30 was a plant mix bituminous pavement (Mix #BP74-15)
A regression analysis indicates that the skid numbers are not significantly aff.cted by accumulat.d traffic , ther.for., a dependable wear factor cannot b. calculated.
0 - SN40
10' I.',II! " ""11"11 111"11"1 ,"""",
.01 .1 10
ACCUMULATED TRAFFIC, TR (Millions)
lOOt-Section 2 - Wet Boltom Boiler Slag 90 80
Z 70
'" 60
~ 50~ 00: . w ID 40
~ i 30
0 ~ 20
'"
§ § ~99~
A regression analysis indicates thot the skid numbers are not significantly aff.cted by occumulat.d traffic , ther.for. , a dependable wear factor cannot b. calculated.
100
o - SN 30
0-SN40
\7- SN so
10' ,,1""'11 '"""'" "'"11'" 1""11111 .01 .1 10
ACCUMULATED TRAFFIC, TR (Millions)
lOOt-Sect ion 3 - Wet Boltom Boiler Slag 90 80
Z 70
'" 60
~ 50~ 00: . w ID 40
~ ::J 30 Z 0 ~ 20
'"
0 0 o ODeD
A regrellion onolysis indicates thot th. skid numbers ar. not significantly affected by accumulated traff ic. ,her. for., a dependable .ear factor cannot b. colculot.d.
A reSirenion analysis indicate, that the skid numbers or. not significantly aff.cted by accumulated traffic , ther.for. , a dependable wear 'actor (on not b. colculated.
O -SN 30
O-SN40
~.SN50
10' ,,'11,,'11 ""!!"" 111 1 '"1" 1""1111'
.01 .1 10
ACCUMULATED TRAFFIC, TR (Millions)
lOOt-Sect ion S - Wet Bottom Boiler Slag 90 80
Z 70 VI 60
.,; 50 IX, ... lID 40
~ ::> 30 Z o ~ 20 VI
o o o DDcP
A reor.ssion analysis indicate, thot the skid numbe" are not significantly aff.cted by accumulated traffic , ther.for., a dependable .ear factor cannot b. calculated.
100
O·SN 40
10' I. IIIII I II I! I. II! I II I II" •• I II ",! '" !" .01 .1 10 100
ACCUMULATED TRAFFIC, TR (Millions)
-36-
0-5 1
1
J
J
I 1
J
1
1
1
1
1
1
J
I J
I J
J
I I
Distinctive Characteristics
ROUTE 752
BUCHANAN COUNTY
E-1
This special asphaltic concrete pavement utilized lightweight aggregate (expanded
shale) and sand as aggregate.
Discussion of Results SN30 for lightweight aggregate sections maintained a level in the low 60's while
SN30 for regular AC section averaged in the low 40's. No significant trends were indicated
by TR with regression analyses. There was no statistical evidence of influence on SN
by AADLT.
Description of Project This maintenance project was an asphaltic concrete pavement (Mix #C73-329)
completed in September, 1973.
The mix contained 57.2% lightweight aggregate (99.9% -3/8"), 18.0% Missouri
River sand, 16.0% limestone screenings, and 8.8% asphalt (60-70). Composition of the
mix, based on weight of total mix, was 91.2% mineral aggregate and 8.8% asphalt with
31.3% +#4 and 58.9% +#10 material.
A control section consisting of an asphaltic concrete using limestone was tested
for comparison. It was completed in November, 1970.
Test lengths of the test section and control section were 0.14 and 0.35 mile
respectively. The four-lane undivided pavement was tested in positions 2 and 3. Five
tests were performed in each lane for each direction at each test speed.
Skid tests and traffic data are shown in Table V and plotted in Figure V.
-37-
E-2
TABLE V
SKID TESTS AND TRAFFIC DATA
ROUTE 752 BUCHANAN COUNTY
SN SN AADT Age in Est. Acc. Date Tested 20 -2Q. /Lane Months Traffic,TR
Lightweight Aggregate Section ~ExEanded Shale} - Position 2 -Eastbound
A regfellion analysis indicat., thot the .kid numb.rs are not significantly aff.cted by accumulated traffic, ther.for., a dependabl •• eor foctor cannot b. calculated.
A reur.llion analysis indicat •• that the ,kid numbers are not significantly affected by accumulated traffic, therefor., a dependabl. wear factor cannot b. calculated.
A regress ion anolysis indicates that the slcid numb.,. are no' s ignificantly affected by accumulated traffic, ther.fore, a dependable wear foctor cannot b. calculated.
.6o-sN20
o .SN30
10' I! I, ,,' I II I, I, I,' I II I I I, I" '" I, I! I, I I II
.01 .1 10
ACCUMULATED TRAFFIC, TR (Millions)
100.l-Regular AC Section - Position 2 - Eastbound 90 80
Z 70 VI 60
VI- 50 a= .... a:I 40 ~ ~ 30 Z Q
~ 20 VI
tffft.6o
o &%
A regress ion analysis ind icate. that the skid numbers or. not signif icantly aff.cted by accumulated traffic , ther.fore, a dependable wear foctor conno' b. calculated .
100
.6o-sN20
o -SN 30
10' 1,''''''" '''''''III 1, 1 ",1111 1""11111
.01
100 90 80
Z 70 VI 60
VI- 50 a= ::: 40
~ ~ 30 Z Q
~ 20 VI
.1
ACCUMULATED TRAFFIC, TR (Millions)
Regular AC Section - Po s ition 3 - Eastbound
e ~geOB.6o o 0
10
A reg feu ion analysi. indicate. that the skid number. ar. not s ignificantly affected by accumulated traffic, therefore, a dependable .ear factor cannot be calculated.
100 r- Regular AC Section. Position 2 • Westbound 90 80
Z 70 II> 60
on 50 f¥ ' ... 10 40
~ ~ 30
o loI: 20 II>
6,6. Hffi 6,
o 0 4:>. 0&
A regression analysis indicate, that the skid numbers are not significantly affected by accumulated .traffic, . f.herefor_/ 0 dependable wear factor cannot be calculated.
6·SN 20
o .SN 30
10' 1,1,1,' I II I, 1,1,1 III ',1,',1111 I, 1,1,1 III
.01 .1 10
ACCUMULATED TRAFFIC, TR (Millions)
I00r- Regular AC Section· Position 3 . Westbound 90 80
Z 70 II> 60
on 50 f¥ ... 10 40
~ ;:) 30 Z o loI: 20 II>
6,6.
6,!::ut:P 00 ° 66
o
A regression analysis indicates that the skid numbers or. not significantly affected by accumulated traffic, ther.fore, a dependable wear factor cannot b. cclculated.
A regression analysis indicate. that the skid numb.r, are not significantly affected by accumulated traffic , ther.'or., a dependable wear factor cannot b. calculated .
A regression analysis indicate. thot the skid numbers or. no' significantly affected by accumulated traffic, ther.for., a dependable .ear 'actor canna. b. calculated .
100
o -SN 4 0
O-SNS5
10' ,1,'''''111 ,1"".1111 ,ltI"tllIl 1.I'!dlll
.01 .1 10
ACCUMULATED TRAFFIC, TR (Millions)
1~~t-Control Section - Po si tion 2 (PCCP)
80 z 70
'" 60
vi SO Go: .... ~ .. 0
~ :::) 30 Z Q
~ 20
'" A regression analysis indicate, tho. the ,kid numbers are not signifieDn,ly affected by occumulat.d traffic , therefore, a dep.ndabl ••• ar 'actor cannot be calculated.
100
o - SN 40
O -SNSS
@
~ @
10 I I ! I "" I " I II "" I II I I I "" I I I I " "" " I
.01 .1 10 100
ACCUMULATED TRAFFIC, TR (Millions)
-46-
F·3 I 1
I
J
J
j
Figure VI (Continued)
EFFECTS OF TRAFFIC ON SKID NUMBERS ROUTE 1-70
JACKSON COUNTY
lOOt-Control Section - Position 4 (PCCP) 90 80
Z 70 VI 60
vi 50 - 111: '
1&1 IG 40
~ ::::I 30 Z Q
~ 20 VI
A rlgreuion analYlis In dicatll that the .kld "t.lmb.,. or. not .Ignificontly affected by accumulated traffic, th.r.for., a dlpendabl. wlar 'actor cannot b. calculated.
D-SN4o
O-SN 55
rn:J @
~ 10' 111,111111 1,.",1111 '''''!!"' 1,1,1,,",
,01 .1 10 100
ACCUMULATED TRAFFIC, TR (Millions)
-47-
F-4
G-l
ROUTE 115
ST. LOUIS COUNTY
Distinctive Charac teristics
This special asphaltic concrete pavement utilized steel slag as coarse aggregate
and sand as fine aggregate.
Discussion of Results
SN40 averaged in the upper 40's on both sections. Significant relationships
between SN and TR were established for SN20 and SN30 in Section L
Description of Project
Project 6-U-IIS-59 was an asphaltic concrete pavement (Mix #SS73-2) completed
in November, 1973
The mIx contained 79 70/1" steel slag (97.6% -3/8"), 11 ,0% Missouri River sand,
40% mineral filler and 53% asphalt (60-70). Composition of the mix, based on weight
of total mix, was 94,7% mineral aggregate and 5.3% asphalt with 1.9% +3/8" and
57,6% +#10 material
Two undIvided pavement sections (each I 000 mile in length) were tested. Each
section had five tests in each direction for each test speed. Tests were performed in
positions I and 2
Skid tests and traffic data are shown in Table VII and plotted in Figure VIL
ind icate, thot the sk id numb.,. or. not s ignif icantly affected a dependabl. wear factor cannot b. calculated.
6 - SN20
o .SNao
O -SN40
10 I I , I I I" ' " I ! Ie I, I I " ' , I I II I " , , " ' II' " ,
.01 .1 10
ACCUMULATED TRAFFIC, TR (Millions)
100_r-Sect ion 2 - St ee l Slag 90 80
Z 70
'" 60 vi' 50 DC ... 10 40
~ ::::I 30 Z C
~ 20 '" I
o g B8~~ o 0
A r egre ssi on analys is indicates that the sk id numbers or . not s ig nifi cantly affected by accumulat.d traff ic, therefore, a dependab le wear 'actor cannot b. calcu lated .
100
6 · SN20
o . SN 30
o -SN 4 0
10' ,.11111111 ",,,,.,11 1,,",,", ",,,,"11
,01 .1 10 100
ACCUMULATED TRAFFIC, TR (Millions)
-50-
G-3 1 1 I 1
J ~
I
I l
l
H-1
ROUTE 141
ST, LOUIS COUNTY
Distinctive Characteristics
This special asphaltic concrete pavement utilized steel slag as coarse aggregate
and sand as fine aggregate,
Discussion of Results
Although data is very bmlted, SN40 maintained a level in the mid-40's,
Regression analyses did not reveal significant relationships between SN and TR.
Description of Project
Project 6-U-141 -42 was an asphaltic concrete pavement (Mix #SS74-25)
complet ed in May, 1975.
The mix contained 79.5% steel slag (97,6% -3 /8"), 11 .0% Missouri River sand,
4,0% mineral filler, and 5.5% asphalt (60-70). Composition of the mix, based on weight
of total mix, was 94,5% mineral aggregat e and 5.5% asphalt with 5.4% +3 .8" and
59.7% +#10 material .
One undivided pavement section (1 ,. 218 miles in length) was tested, The section
had fIVe tests in position 2 in each direction for each test speed.
Skid tests and traffic data are shown in Table VIII and plotted in Figure VIII.
-51-
TABLE VIII
SKID TESTS AND TRAFFIC DATA
ROUTE 141 ST. LOUIS COUNTY
SN SN SN AADT Age in Date Tested ~ 30 40 /Lane Months
A reg'.lIion analysis indicates tho. the ,kid nulftb.,. are not significantly off.cted by o((ulftulot.d traffic , th.r.'or., a dependable •• or factor cannot b. calculat.d.
H-2
Est. Acc. Traffic,TR
689,000 2,110,000 3,023,000 4,485,000 5,033,000
6·SN 20
O·SN 30
O·SN 40
10' "'11" 1" ""'11'11 ''''',,'ll '11"1111'
,01 .1 10 100
ACCUMULATED TRAFFIC, TR (Millions)
-52-
I 1
1 1 .I
1
I
J
1
I 1 I J
1 ]
I 1 I ]
I I I J
I 1
I
1-1
ROUTE 21
ST. WUIS COUNTY
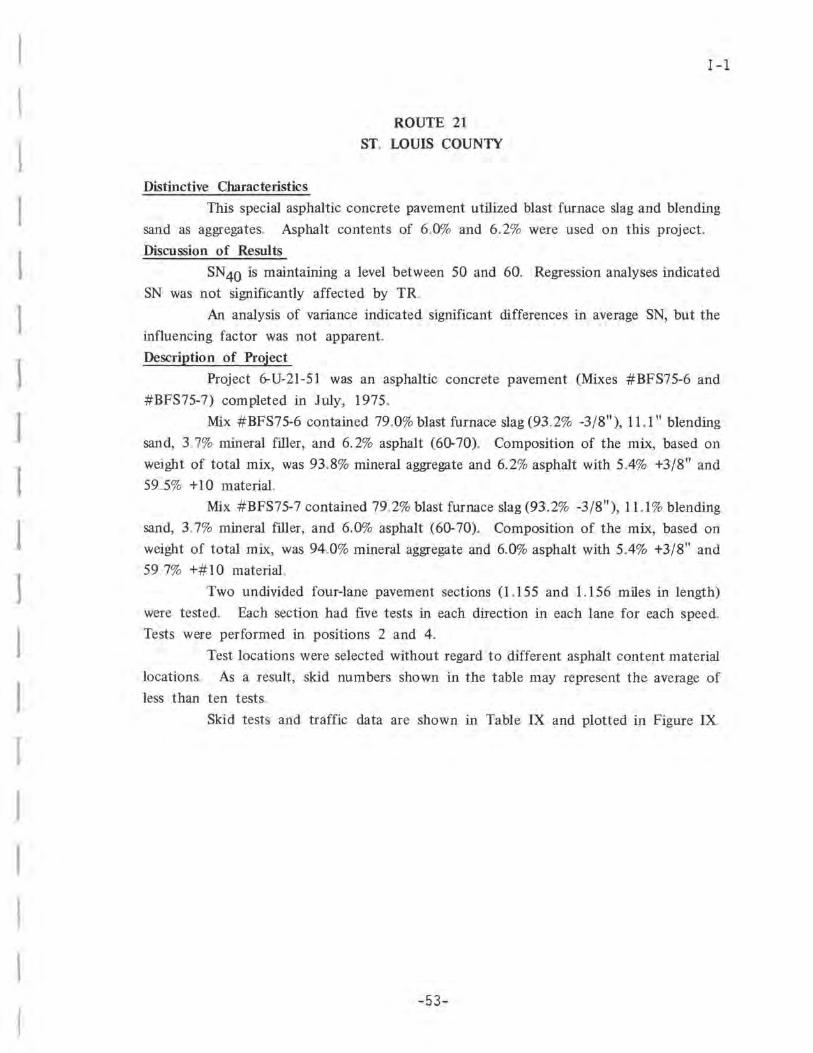
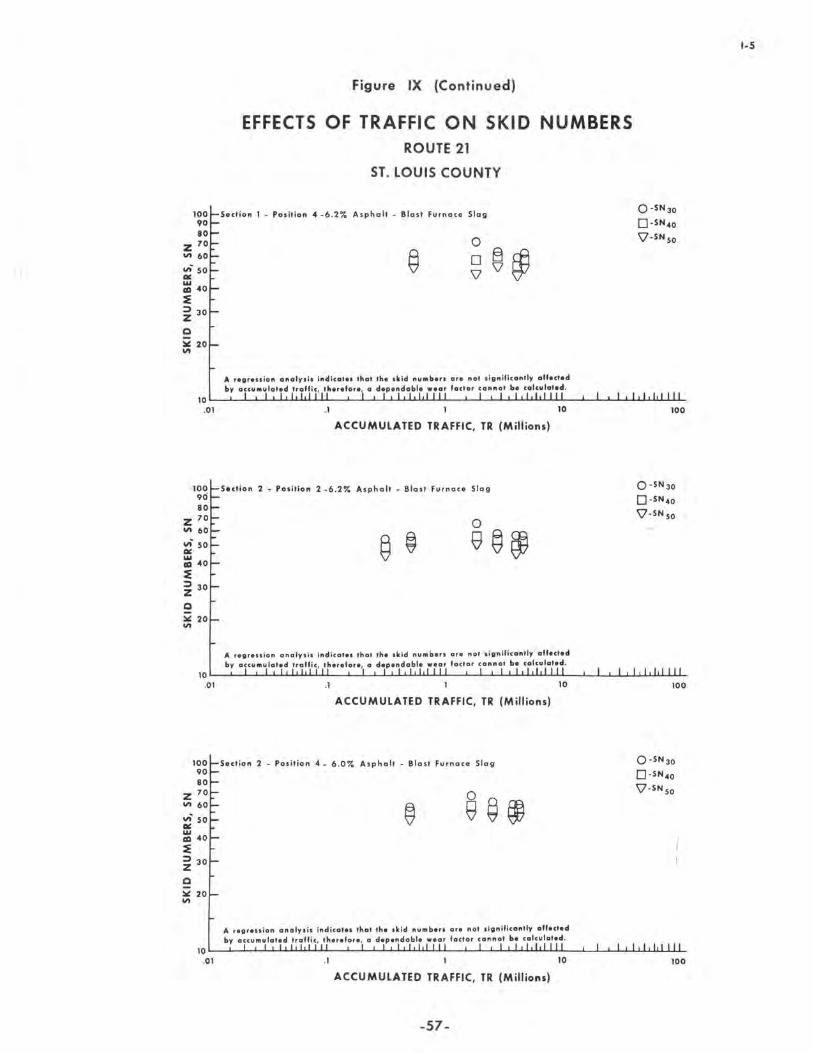
Distinctive Characteristics
This special asphaltic concrete pavement utilized blast furnace slag and blending
sand as aggregates. Asphalt contents of 6,0% and 6.2% were used on this project.
Discussion of Results
SN40 is maintaining a level between 50 and 60. Regression analyses indicated
SN was not significantly affected by TR
An analysis of variance indicated significant differences in average SN, but the
influencing factor was not apparent.
Description of Project
Project 6-U-2l-5l was an asphaltic concrete pavement (Mixes #BFS75-6 and
100~S.ction I - Position 2 - 6 .0% Asphalt - Bia s i Furnace Slag 90 80
Z 70
'" 60 ." SO 0/: . ... rtI 40
~ :;:, 30 Z Q
:.i: 20
'"
@ § 'V 9 ~ ~
O·SN 30
D-SN 4o
\7-SN so
A regrellion analysis indicote. that the ,kid numb.r. are not significantly affected by accufllutated traff ic, th.r.'or., a dependable .ear 'octor cannot b. calculoted.
10 I I tI II II 01 I " I II " II 01 I II tI tI 01 01 II I I tI tI "" II! .01
100 90 80
Z 70
'" 60 ." SO 0/: .
:::: 40
~ :;:, 30 Z Q
:.i: 20
'"
.1
ACCUMULATED TRAFFIC, TR (Millions)
S.ction I • Position 4 - 6.0% Asphalt - Biasi Furnace Slag
A reg,ellion anolysis indicat •• thot the .kid numbers are not significontly affected bv o(Cullu"lot.cI trf;ll'.i4; • • h.r.'or.,_ a dependabl •• eor 'ador cannot b. calculat.d.
10 I I I I II II 01 III I II tI II 01 (( I tI tI 01 01 I II I tI tI .! 01 I II .01 .1 ro 100
A reg,e"ion analysi. indicat •• that the ,kid nUMbers or. not significantly aff.ct.d by o~cUM",lot~d tr~f'i~/_t_h.r.for. ,_ a d.pendable .ear foctor co"no' b. calculated.
A reoression analysi. indicot., that the skid numb.,. or. no' significantly affected by accumulat.d traffic, ther.for., a dependable .eor 'actor cannot b. calculated.
A reoreuion analysi. indicote, thot the ,kid numbers or. not significantly aff.cted by accumulated traffic, th.r.for., a dependable wear factor cannot be calculated.
10 1 Ioidolill oIoidollll oIo1o1dlll 01 01 old III .01 .1 10 100
ACCUMULATED TRAFFIC, TR (Millions)
-57 -
1-5
J-l
ROUTE 140
ST. LOUIS COUN1Y
Distinctive Characteristics
This project involved two special asphaltic concrete pavements. Section 1 utilized
blast furnace slag as the coarse aggregate and sand as the fine aggregate. Section 2 utilized
porphyry (trap rock) as coarse aggregate and sand as fine aggregate.
Discussion of Results
SN40 on the blast furnace slag section was about 6 SN higher than on the
porphyry section. Position 4 tests of Section 1 . did not show statistical trends by TR
but all other tests did. SN40 maintained a level in the upper 40's for porphyry and
in the 50's for blast furnace slag.
Description of Project
Project C096-M(3) involved two asphaltic concrete pavements completed in
November, 1969.
Mix #C69-47l contained 79.6% porphyry (99.5% -1/2"), 12.0% Missouri River
sand, 3.4% mineral filler and 5.0% asphalt (60-70). Composition of the mix, based on
weight of total mix, was 95.0% mineral aggregate and 5.0% asphalt with 0.4% +1/2" and
~ 20 S y .. .014 .020 .019 In CV (%) 1. 5 1. 7 1. 8
,2 .833 .420 .481 13 13 13
1.862 - .094 (Log TR)
6 - SN20
O - SN30
D - SN 40
10' '''''"111 1,''''''" 1 .. ",1111 '""11"' .01
100 90 80
Z 70 In 60
on so 111: . ... GI 40
~ J 30 Z 0 ~ 20 In
.1 10
ACCUMULATED TRAFFIC, TR (Millions)
Sect ion 1 - POl it ion 4 - Blast Fu rnace Slag
8 8~~B_~
A regress ion analys is ind icat •• that the sk id numb.r. are not significantly affected by a~cu",ulat.d traff ic, ther.for. t _ a depe ndabl •• ear fa ct or canno t b. calculated.
100
6-SN20
o -SN 30
o -SN 40
10' l'I"eI'II ""'11'" I . I , I,!II' 1 , ." , 1111
.01
100 90 80
Z 70 In 60
on 50 111: .
~ 40
~ J 30 Z o ~ 20 In
.1
ACCUMULATED TRAFFIC, TR (Millions)
Section 2 - Posit ion 3 - Po r p hyry
Log SN30 1 . 769 - .087 (Log TR) ____ ~
Log SN40 1.731 - .076 (Log TR)
LINEAR REGRESSION ANALYSIS ILOG - LOG RELATIONSHIPI 20 MPH ~~
A regression analysis indicat., that the skid numb.,. are not significantly affected by accumulated traffic, ther.for •• a dependable .ear factor cannot b. calculated .
O - SN30
O -SN40
\7-SN so
.1 10 100
10' I, I!'" , " I! 1,1,1 I I I . 01 I I " "I " , I " II" " ,
ACCUMULATED TRAFFIC, TR (Millions)
100f-Section 1 - Position 4 - Porphyry 90 80
Z 70
"" 60 .,; 50 « , ... a:I 40
~ ~ 30
Q
~ 20
""
o \7
o \7
A regression analysis indicate, that the skid numbers are not s ignificantly affected by accumulated traffic , ther.'or., a dependable .ear factor cannot b. calculated.
~
o -SN 40
\7 - SN so
10' I! 111,1 I II I, I' '" I" I I III I I 1'1 I III "~I III
.01 .1
ACCUMULATED TRAFFIC, TR (Millions)
100r-Section 1 - Position 5 - Porphyry 90 80
Z 70
"" 60 .,; 50 « ... a:I 40
~
~ 30
Q
~ 20
""
LINEAR REGRESSION ANALYSIS ILOG-LOG RELATIONSHIPl
WEAR FACTOR
5 y .x cv (%) r 2
~ - .071
.018 2.1
.610 10
~ -.065
.024 2.3
.419 10
10 100
o -SN 40
\7 - SN 50
10' "1"11 " 1.1111 11 " 1'11" 111 ' 1"",1111
.01 .1 10 100
ACCUMULATED TRAFFIC, TR (Millions)
-66-
K- 4
t
I I I I
I I t \
I J
Figure XI (Continued)
EFFECTS OF TRAFFIC ON SKID NUMBERS ROUTE 40
ST. LOUIS COUNTY
100t-Seclion 2 - Position 2 - Porphyry 90 80
Z 70 CIt 60
u; 50~ 11&: . ... III 40
~ ::I 30 Z 0 loi: 20 CIt
0 \l 8~ ~
A reg,e"ion analys .. indicate. thot the ,kid numbers or. not significan.ly aff.ct.d by accumulot.d traffic, ther.for. , a dependable •• ar 'actor cannot b. calculated.
o - SN 30
D-SN 40
\7 - SN 50
10' I!'! 1.1 I 'I I! III •• I I I ,! I ,., I I II "', '" '"
.01 .1 10
ACCUMULATED TRAFFIC, TR (Millions)
100J-Seclion 2 - Position 4 - Porphyry 90 80
Z 70 CIt 60
U; 50 11&: . ... III 40
~ ::I 30 Z o loi: 20 CIt
o \l
o \7
A regression onolYl il indicat •• thot the .kid numbers or. no. lignificantly affected by accumulated traffic, th.r.for., a dependable •• ar 'actor cannot b. calculated.
A regression onalysi. indicat •• thot the ,kid numbers are not lignificontly aff.cted by accumulated traffic , ther.fore, a dependable wear 'actor cannot b. calculated.
6-SN20
o -SN 30
10' I! I! I, I II I! IIIII I I I I!' 'I! I I! I I, I, I, I I II
.01 .1
ACCUMULATED TRAFFIC, TR {Millions}
100l-Section I - Position 3 -Porphyry 90 80
10 100
6-SN20
o -SN 30
Z 70 ." 60
.,,- 50
~~ 1. 940 - . 201 (Log
Go:
~ 40
Log SN30 1 . 880 - . 178 (Log TR)-.-!~
~ :l 30 Z
LINEAR REGRESSION ANALYSIS (LOG-LOG RELATIONSHIP) 20 MPH ~
C WEAR FACTOR - . 201 - .178
loI: 20 ."
S y .x . 018 .022 cv ('7.) 2.0 2. 2 r2 .765 . 638
10 10
10' I! III, I I II I 1111,1 I I I I, 1.111 I! I I, I, I. I I II
.01
100 90 80
Z 70 ." 60
.,,- 50 Go: ... lID 40
~ :l 30 Z C loI: 20 ."
.1 10
ACCUMULATED TRAFFIC, TR {Millions}
Section 2 - Position 2 - Porphyry
6 o
66~ OO~
A regression analysis indicate. that the skid numbers or. not significDntly affected by accumulated traffic, ther.fore, a dependoble .eor factor cannot b. calculated.
100
6-SN20
o -SN 30
10' I! I!'" I II I! I! 1.1 II I I! II! I'" I, I! " I I I I
10 I I '"'''' I II I I " "" I I I I I " "" I I I ! I .. "" II I .01 .1 10
ACCUMULATED TRAFFIC, TR (Millions)
lOOr-Section 2 - Porphyry 90 80
Z 70 on 60
.,; 50 "" . ... dI 40
~ ::I 30 Z Q
~ 20 on
8 0 ~
A regression analysis indicat., thot the skid numb.,. or. not significantly affected by occuml.!la •• d _tr~f.ic; , ... her.fore,,- a d~p.ndabl ••• or 'actor cann.' b. calculated.
100
D-SN.4o
\7-SN so
10' 1,I"d'" 1"""'" I!ldllill 111""111
.01 .1 10 100
ACCUMULATED TRAFFIC, TR (Millions)
-75-
M-3
Distinctive Characteristics
ROUTE FF
JASPER COUNTY
N-l
This special plant mix bituminous pavement utilized flint chat as coarse aggregate
limestone screenings as fine aggregate.
Discussion of Results
SN40 averaged around 50 to 55. No significant trends were established with
TR but an analysis of variance indicated a significant difference between sections.
Description of Project
Project C049-FF(l)M was a plant mix bituminous pavement (Mix #BP75-49M)
A r.or."ion analysis indicat •• that the ,kid numb.,. are no' .ignificantly affected by accu ... ulat.dtraffi~ • . ,her.for.,_ a dependable .ear factor cannot b. calculat.d.
10 1 11.1.1.1111 , I! 1.1,1 III II,I,I.!I!I I ,! I. I., III
.01
100 90 80
Z 70 II) 60
on 50 111: .
~ 40
~ ;:) 30 Z o ~ 20 II)
.1
Section 2 - Flint Chat
o o \7
10
ACCUMULATED TRAFFIC, TR (Millions)
@ ® 00
A regression analysis indica ••• that the ,kid numbers are not significantly affected by accumulated traffic, ther.for., a dependable .ear factor cannot b. calculated.
100
o -SN 30
O-SN40
\7- SN so
10' ,"",1111 ,1"".1111 '''''''"1 ,1"""'11 .01
100 90 80
Z 70 II) 60
on 50 111: .
~ 40
~ ;:) 30 Z o ~ 20 II)
.1 10
ACCUMULATED TRAFFIC, TR (Millions)
Section 3 - Flint Chat
8 @ § 00 \l
A regr ... ion analysis ind ica ••• thot the skid numb.,. are no. significantly affected by a~cu",ulat~d _traffic , ther.for., a dependable .ear factor cannot b. calculated .
10 1 I. 1,1,1 I II . 01 '1.,1,' 'II 1.leldill
.1 10
ACCUMULATED TRAFFIC, TR (Millions)
-78-
100
O - SN30
O-SN40
\7- SN so
','''d'" 100
N-3 I J
1 -1
I
j
Distinctive Characteristics
ROUTE 160
GREENE COUNTY
~-1
This project involved the use of three special plant mix bituminous pavements.
As placed in 1970, the mixes involved three aggregate combinations: (1) limestone as
coarse aggregate and flint chat sand as fine aggregate, (2) limestone and flint chat as coarse
aggregate and flint chat sand as fine aggregate, and (3) flint chat as coarse aggregate and
limestone screenings as fine aggregate, In 1975, all three of the 1970 mixes were overlaid
with a mix of a design identical to aggregate combination (1) above, with limestone as
coarse aggregate and flint chat sand as fine aggregate.
Discussion of Results
It appeared after the first few months, the skid resistance of the mixes had
dropped to a level that it maintained fairly welL The mix with Burlington limestone
and Joplin flint chat sand appeared to have a breaking point with AADLT some place
between 1 000 and 2000" The other two mixes did not show any breaking points with
AADLTo The last resurfacing mix of Burlington limestone and Joplin flint chat sand
did not indicate the same results as the earlier mix even though the mix designs were
identical. However, it was found the later mix contained a higher percentage of minus
#200 material than was specified. Skid resistance averaged about 10 SN lower in the
AADLT ranges which were previously tested. The higher AADLT areas showed even lower
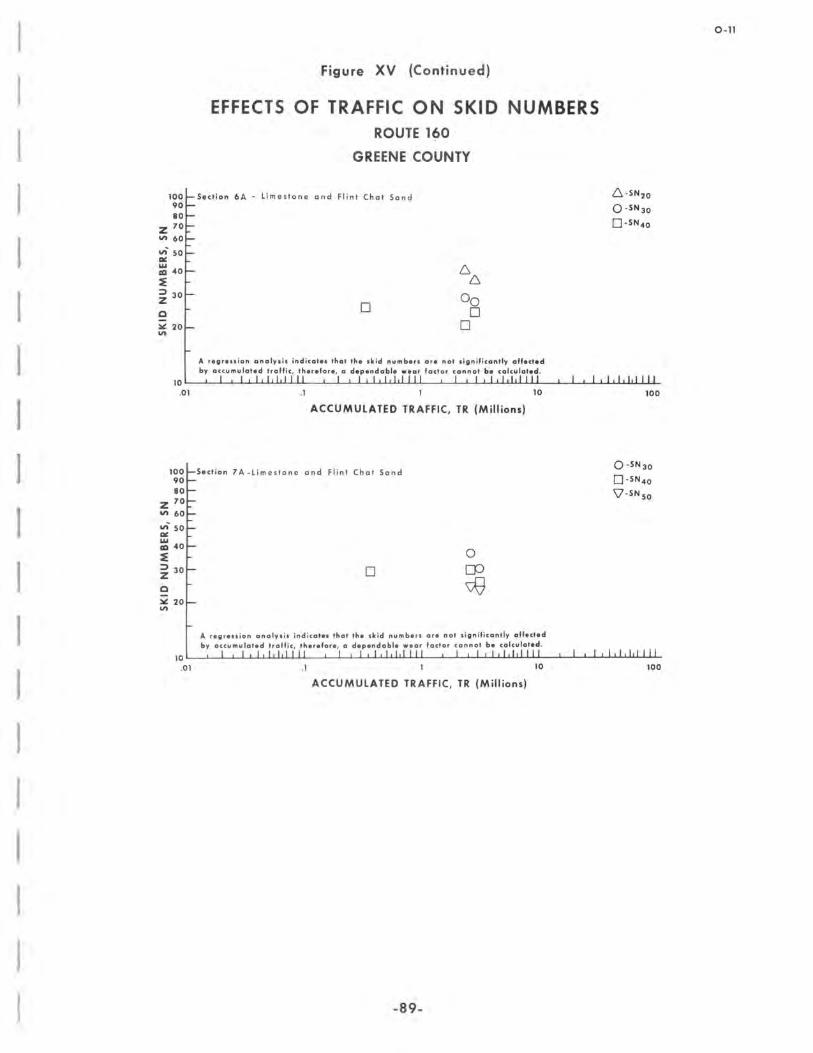
SNo Mixes which utilized flint chat as all or part of the coarse aggregate tend to be
capable of maintaining SN~& of around 50 or higher with AADLT of up to 4000.
Description of Project
Project C039-l60( 6)M involved three plant mix bituminous pavements (Mixes
#BP70-121M, BP70-124M, and BP70-l27M) completed in November, 1970.
LINEAR REGRESSION ANALYSIS (LOG-LOG RELATIONSHIP) 20 MPH ~ ~ ~
WEAR FACTOR - . 041 -.070
s y.x CV (%) ,2
n
. 021 1. 8
.553 11
.030 2.1
. 632 11
(Log TR)
• A regression analysis indicate. that the skid numbers at. not significantly affected by accumulated traffic, ther.for., a dependable wear factor cannot b. calculated.
-A regression analysis indicates that the skid numbers are not significantly affected by accumulated traffic. therefore. a dependable wear factor cannot be calculated.
100
6-SN20
o -SN 30
D-SN40
\7 -SN SO
O-SN60
.1 10 100
10' ,,', ,,' , " ",.1,1 I " I I 1,1.1 I II .01 I" "II III
ACCUMULATED TRAFFIC, TR (Millions)
-86-
0-8 1
1
1
J
]
]
J
J J
1
I I )
J
I J
I J
I I I
J
1
Figure XV (Continued)
EFFECTS OF TRAFFIC ON SKID NUMBERS ROUTE 160
GREENE COUNTY
100rSection 7 - Lim es tone Scr ee n in g a nd Fl i n t C hat 90 80
.606 .611 .984 n 11 11 ·A regression analysis indicat., that the ,kid numb. r, are not significantly aff.cted
by accumulated traffic , ther.for., a dependable wear factor cannot b. calculat.d . 10' I! 111.1 I II I I I , II! I I I I I I IIII I II I, I, III I II
.01
100 90 80
Z 70
'" 60
." 50 ell:
~ 40
~ ~ 30
0 ~ 20 V>
.1 10
ACCUMULATED TRAFFIC, TR (Millions)
Section 1 A - limestone and Flint Chat San d
o
66 o DO o
A regfession analy s is indicate, that the , kid number s or . not significantly affected ~Y accumulated traffic , ther.fore, a dependable .eor fo ct o r cannot b. calculated .
100
6 - SN20
0 - SN30
O - SN40
10'
I.',I,! " '" 1 ''''" 1111111111 ' 1 ""1111
.01 .1 10
ACCUMULATED TRAFFIC, TR (Millions)
100~Se(tion 2 A - l i m es ton e ond Fl i nt Chat Sa nd 90 80
Z 70
'" 60
E'l CO 40
~ ::;) 30 Z 0 ~ 20 V>
0
DO 0 \78
A regression analysis inditates that the ski d number s a re not s ignif itontly affected by accumulated traffic , therefore, a dependable wear factor cannot be coltulat.d .
100
0 - SN 30
O-SN40
'V - SN 50
10 1 I I I,I,! I II I I I I 1,1,111 I II I I I I I I I IIII I II I' I I III I II
.01 .1 10 100
ACCUMULATED TRAFFIC, TR (Millions)
-87 -
0-9
•
Figure XV (Continued)
EFFECTS OF TRAFFIC ON SKID NUMBERS ROUTE 160
GREENE COUNTY
100l-Section 3A - Limestone and Flint Chat Sand 90 80
Z 70 III 60
~ "~ ~ . .., UI 40
~ ;:) 30 Z Q
~ 20 11\
80
0 \7~
A regression analysis ind icate, thot the skid numbers ar. no. significan.ly affected by accumulated traffic , ther.for. , a dependable .ear foctor cannot b. calculated.
A regression analysis indicate, thot the skid numbers are no. significDntly affected by accumulated traffic , ther.for., Q dependable .ear factor cannot b. calculated .
10 1 1.1.1.1 I II . 01 I. 1.101 I II '''''''III .1 10
ACCUMULATED TRAFFIC, TR (Millions)
1001- Section SA - Limestono and Fl int Chat Sand 90 80
Z 70 III 60
.,; SO
~. ~ 66 ; 40
;:) 30 00
Z Q 0 00 ~ 20 11\
A r.grenion analysis indicates that the skid numbers or. not significantly affected by accumulated traffic , ther.fore, a dependable .eor factor cannot be calculated .
100
o -SN 30
D-SN40
\7-SN 50
I , I , "I I "
100
6-SN20
o -SN JO D-SN 4o
10 1 I, 1,1,1 I II , I, 1,1,1 I II I, 1,1,1 III 1'1'1'1 III
.01.1 10
ACCUMULATED TRAFFIC, TR (Millions)
-88-
0-10 1
1 ]
]
J
J J
I
I I )
I I I I J
J
j
Figure XV (Continued)
EFFECTS OF TRAFFIC ON SKID NUMBERS ROUTE 160
GREENE COUNTY
100l-Section 6A - Limestone and Flint Chat Sand 90 80
Z 70
'" 60 ",' SO rtf!
;l :I 30 Z 0 ~ 20
'"
6. 6.
00 0 0
0
A regr.nion analysi. indicat •• that the ,kid numb.r. or. not significantly affected by accumulated traffic, th.r.fore, a dependabl •• ear factor cannot b. calculated.
6.-SN20
o - SN 30
o -SN 40
10 I I I I I I, I I (I I ! I , I! I I II I I I ! "I I II I , I , II I I II
.01 .1 10
ACCUMULATED TRAFFIC, TR (Millions)
100l-Section 7A -Limestone and Flint Chat Sand 90 80
Z 70
'" 60 vi SO rtf! ...
~l :I 30 Z 0 ~ 20
'"
0 0 [p
~
A regr .. ,ion analysis indicat., that the ,kid numb.,. or. not lignificontly affected by accumulat.d traffic , th.r.fore, a dependable •• ar factor connot b. calculated .
100
o - SN JO
o -SN 40
\7 -SN SO
10' ,,11111111 '1'11,1111 '11,111111 ""1"',,
.01 .1 10 100
ACCUMULATED TRAFFIC, TR (Millions)
-89-
0-11
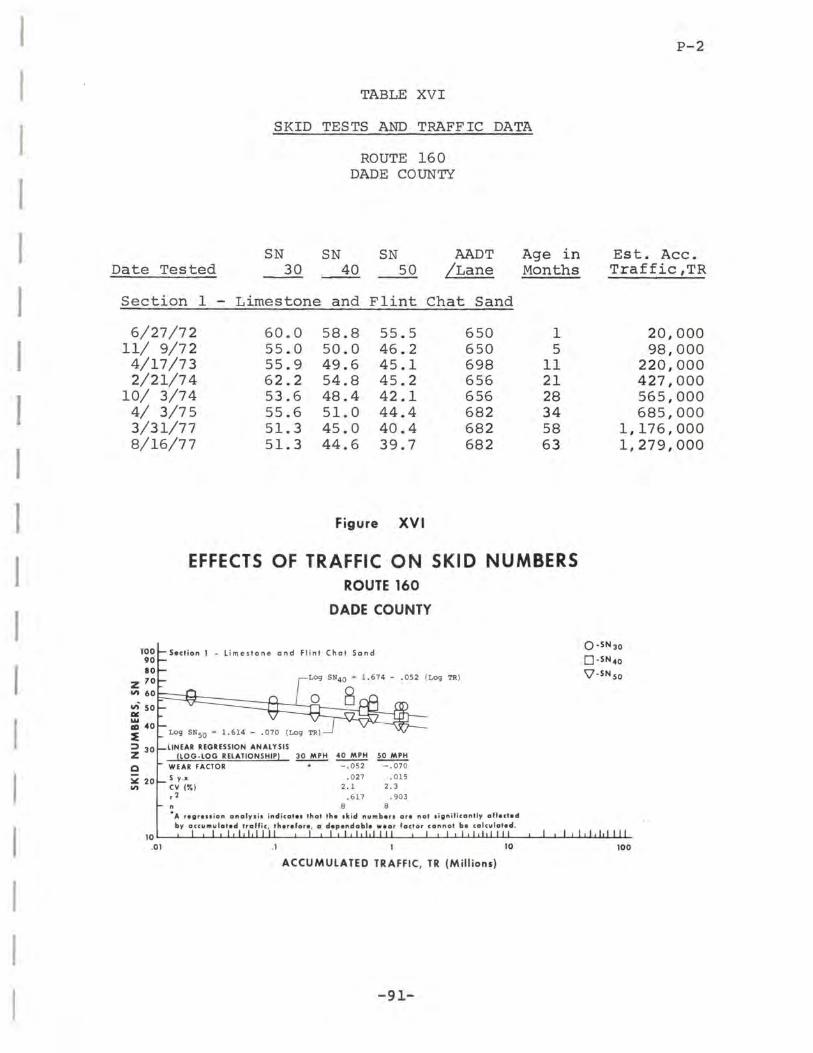
Distinctive Characteristics
ROUTE 160
DADE COUNTY
P-l
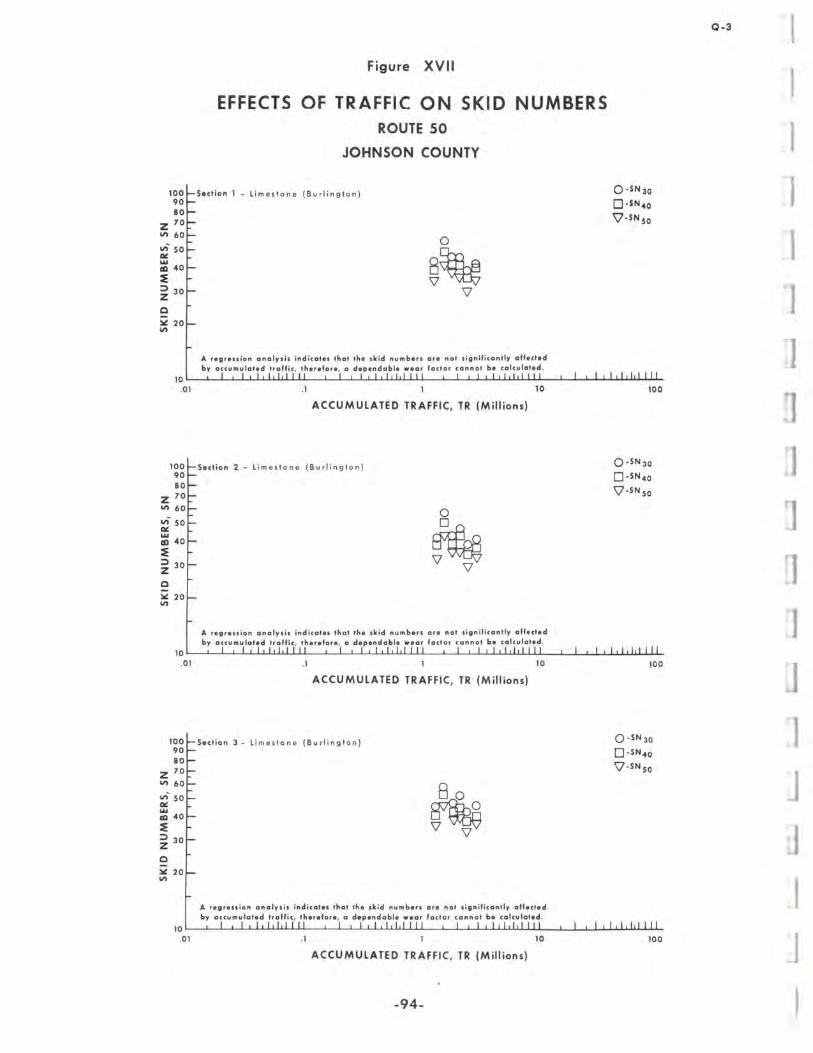
This special plant mix bituminous pavement utiHzed limestone as coarse aggregate
and flint chat sand as fine aggregate
Discussion of Results
Since this mix is identical to one of the mixes on Route 160, Greene County,
it's merit should be considered in the same manner as suggested in the Discussion of
Results for that project .
Description of Project
Project C029-39(5)M is a plant mix bituminous pavement (Mix #BP72-80M)
A regression analysis indicate. that the skid numbers are not significantly affected by accumulated traffic, ther.for. , a dependable wear 'actor CO""ot b. calculated.
o -SN30
D-SN40
V'-SN 50
10 I " " II I I " I , " I, I " , I " "" " I " " II' "I .01 .1 10
ACCUMULATED TRAFFIC, TR (Millions)
100J-5ection 2 - Limestone (Burlington) 90 80
Z 70 11\ 60
VI 50 111: ' ... CD 40
~ ::I 30 Z C ~ 20 11\
~ 'V 'V
A regression analysis indicate. that the skid numbers are not significantly affected by accumulated traffic, ther.for., a dependable wear 'actor cannot b. calculated .
100
o -5N 30
o -SN40
V'-SN SO
10' 1.'1""" 1,1,1,1111 111.111111 1,1"11"1
.01 .1 10
ACCUMULATED TRAFFIC, TR (Millions)
100~5ection 3 - Limestone (Burlington) 90 80
Z 70 11\ 60
VI 50 III: ... CD 40
~ ::I 30 Z C ~ 20 III
8 0
~ 'V
A ,egression analysis indicate, that the skid number. are no. significantly affected by accumulated traffic, ther.for., a dependable .ear 'actor cannot be calculated .
100
o -SN 30
D-5N 4 o V' -SN SO
10 1 ""II' " ,,1,1,1'" "1'"1111 ''1'1,,'11
.01 .1 10 100
ACCUMULATED TRAFFIC, TR (Millions)
-94-
Q-3 1
1
1
I J ]
r
J
J
Distinctive Characteristics
ROUTE 1-70
LAFAYETTE COUNTY
R-l
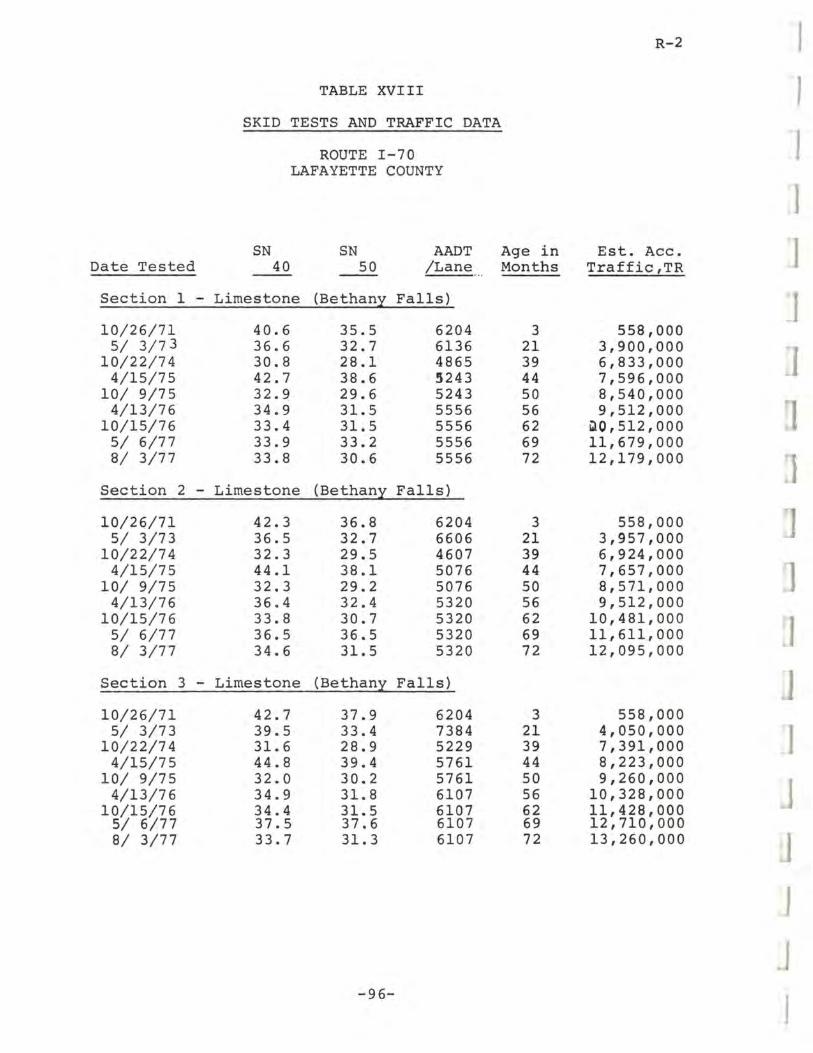
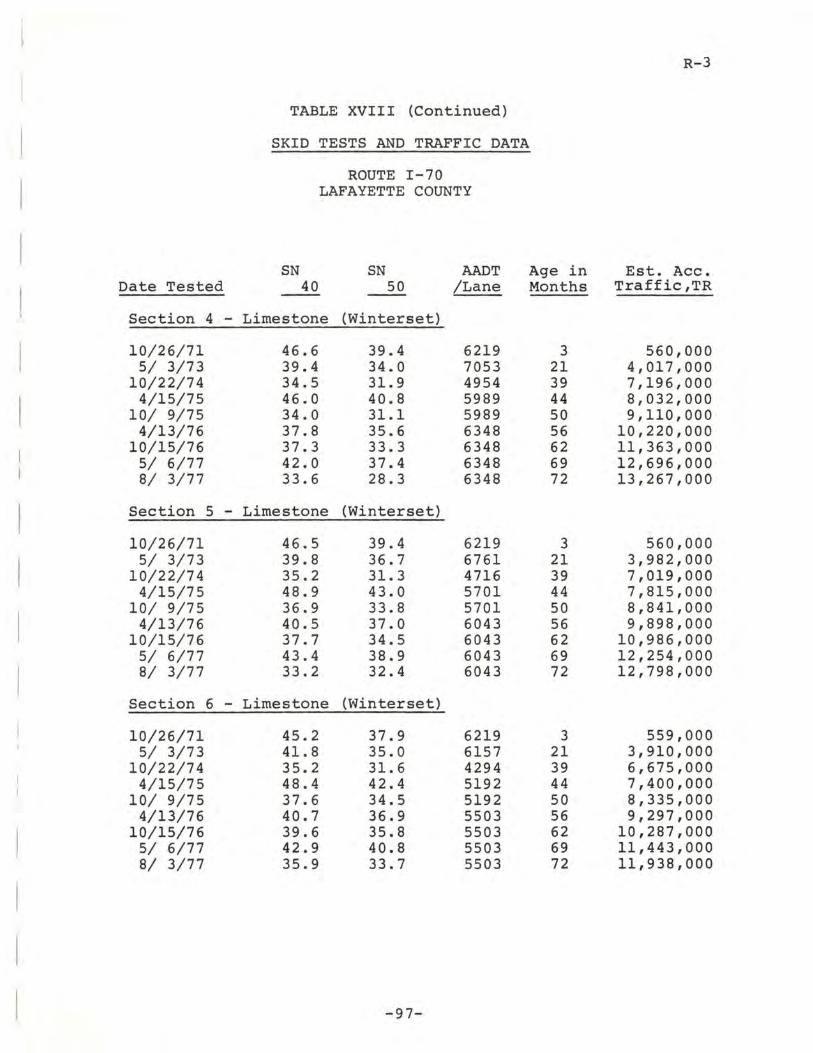
These asphaltic concrete pavements utilized two different limestones as coarse
aggregate and blended sand as fine aggregate.
Discussion of Results
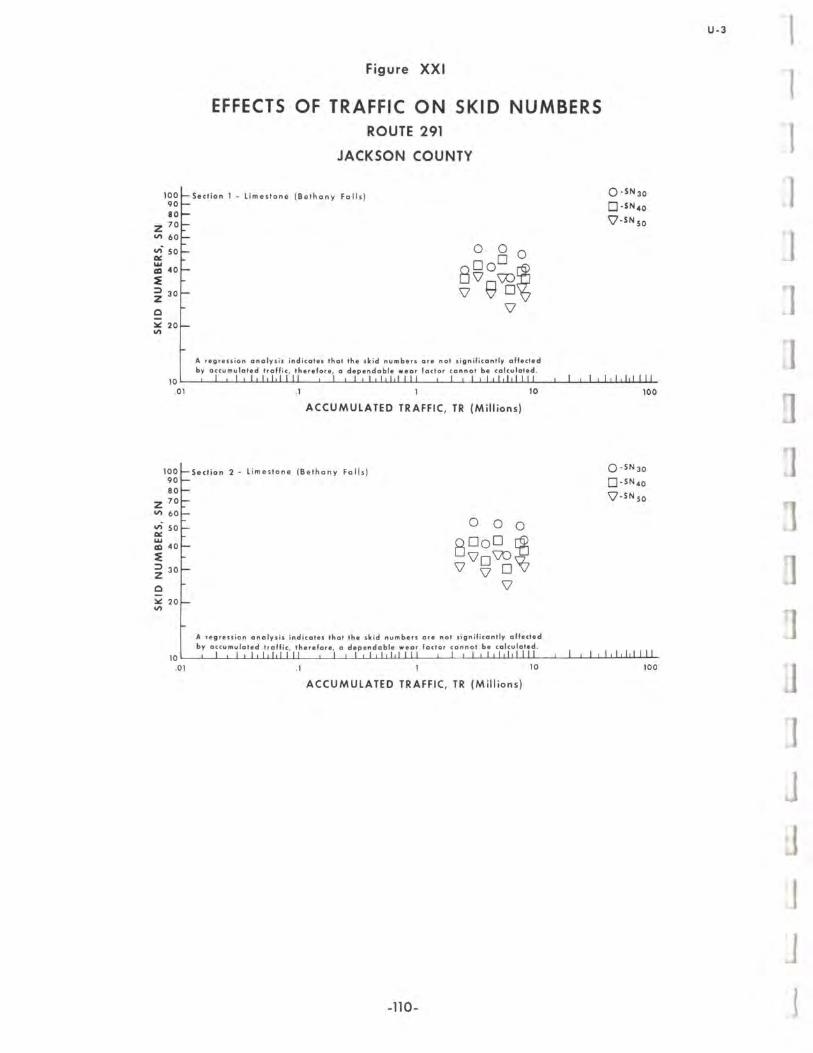
Sections 1, 2 and 3 had an average SN40 of about 36, which was roughly 4
SN less than Sections 4, 5 and 6. None of the sections showed any significant trends
for TR. Likewise, there was no evidence SN was influenced significantly by AADL T. Description of Project
Project C054-70( 1) involved the use of two different asphaltic concrete
pavements (Mixes #C71-258 and #C71-94) completed in August, 1971.
Mix #C71-258, which was used in the westbound lane, contained 66.3% Bethany
Falls limestone, 25.4% blended sand, 3.8% mineral filler, and 4.5% asphalt (60-70).
Composition of the mix, based on weight of total mix, was 95.5% mineral filler and 4.5%
asphalt with 1.7% +1/2" and 66.2% +#10 material.
Mix #C7l-94, which was used in the eastbound lane, contained 65.7% Winterset
limestone, 25.2% blended sand, 4.1 % mineral filler, and 5.0% asphalt (60-70). Composition
of the mix, based on weight of total mix, was 95.0% mineral aggregate and 5.0% asphalt
with 2.0% +1/2" and 66.0% +#10 material.
Six divided pavement sections (3.892, 3.892, 3.892, 3.407, 3.407, and 3.407
miles in length) were tested. Sections 1, 2, and 3 were in the westbound lane and Sections
4, 5 and 6 were in the eastbound lane. Five tests at each test speed were perfonned
in position 2.
Skid tests and traffic data are shown in Table XVIII and plotted in Figure XVIII.
-95-
R-2 I TABLE XVIII J
SKID TESTS AND TRAFFIC DATA
ROUTE I-70 I LAFAYETTE COUNTY
I SN SN AADT Age in Est. Acc. J Date Tested 40 50 /Lane Months Traffic,TR
A regression analysis indicat •• that the ,kid numbers are not lionificantly aff.cted by occumulated traffic , ther.for. , a dependabl. wear 'actor cannot b. calculat.d.
A reurellion analysis indicot •• that the ,k id numbe" or. no. significon.ly aff.cted by accumulated traffic , _ther.for. , a dependable wear foctor cannot b. calculated.
100
o -SN 40
\J -SN 50
10' 1",111'" 1,1'11 1111 111,11"11 1,1"11'"
.01 .1 10
ACCUMULATED TRAFFIC, TR (Millions)
lOOt-Section 3 - Limestone (Bethany Falls) 90 80
Z 70 .,.. 60
'" 50 Of:
~ 40r 8 ~
o \J
o 9\J~ ~ 30
Z o ~ 20 .,..
A reurellion analysis indicat •• that the ,kid numbers or. no' lignificantly aff.cted by accumulated traffic , ther.for. , a dependable wear factor cannot b. calculated .
It. re .. , ... ion analysis indicate. that the .kid numbe" ar. not lignificantly affected by accuMulat.d traffic, ther.for., a dependabl •• ear factor cannot b. calculated.
D -SN.40
\7 - SN 50
10' ""'11'11 ""11"" ".,11"11 ",",,111 .01 .1 10
ACCUMULATED TRAFFIC, TR (Millions)
100l-Section 5 - Lim~stone (Winte,set) 90 80
Z 70 on 60
", SO ~. ... IICI 40
2: ::) 30 Z Q
~ 20
""
o \] 9
o \i~ 8~
A regt.uion onalysi. indicote, that the skid numbers are not .ignificantly aff.cted by accumulated traffic, ther.for., a dependabl •• ear fador connot b. calculated.
It. re., ... ion onolysi, inciicat ••• hat the sleid nUMbers are not si,nificantly affected by aCCUMulated traffic, therefore, a dependable .ear factor cannot b. calculat.d.
A regression analysis indicate, thot the skid numbers are not significantly affected by accumulated traffic , therefore, a dependable wear foctor cannot b. calculated.
6-SN20
O-SN30
O-SN40
10' I.,.,!. " "",,"11 I"""!II ",",,111 .01 .1 10
ACCUMULATED TRAFFIC, TR (Millions)
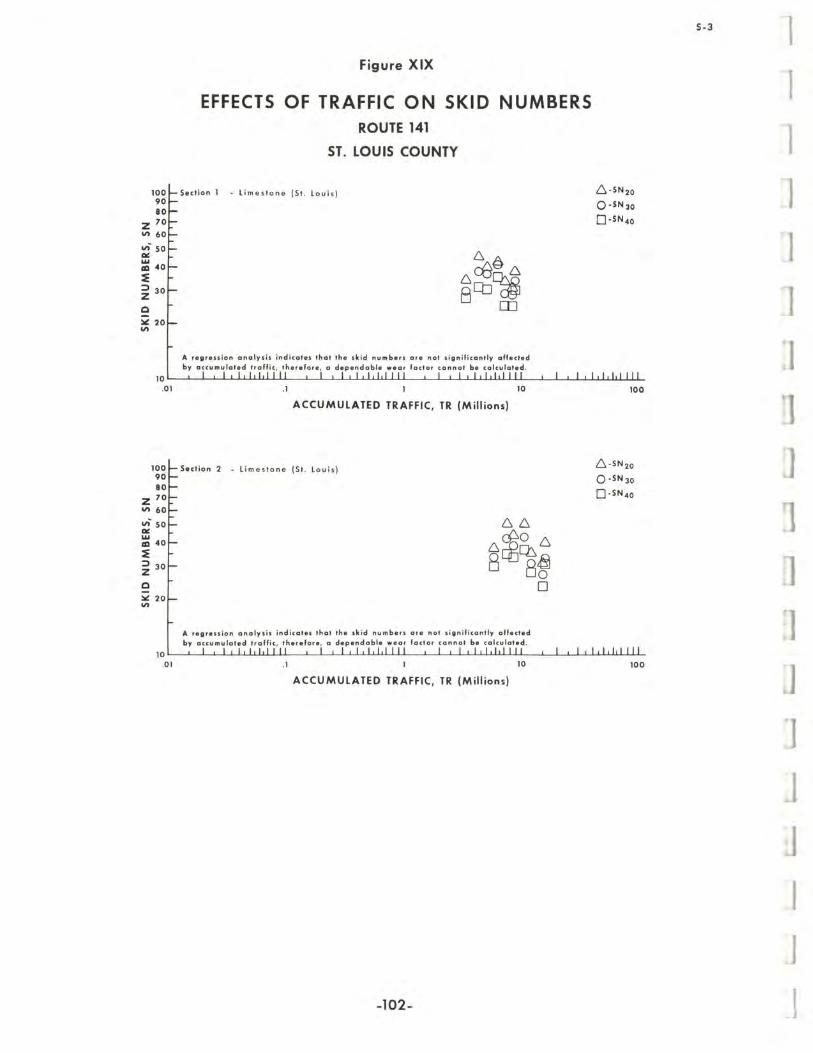
lOOt- Section 2 - Li mestone (St . Louis) 90 80
Z 70 ." 60
.,,- 50 111: ' ... 110 40
~ ::> 30 Z Q
~ 20 ."
66
~O 6 6[gCbB 8 80
A regression analysis indicates that the skid numbers or. not significantly affected by accumulated traffic, therefore. a dependable wear foctor cannot b. calculated.
o
100
6-SN20
O-SN30
O-SN40
10' ",,," '11 •••• 111.11 111,11"11 •• ",1111'
.01 .1 10 100
ACCUMULATED TRAFFIC, TR (Millions)
-102-
S-3 1
·1
1 J 1
]
]
J
J
J 1
Distinctive Characteristics
ROUTE 1-44
NEWTON COUNTY
T -1
This special asphaltic concrete pavement utilized limestone containing
approximately 35% chert as coarse aggregate and blended sand as fine aggregate.
Discussion of Results
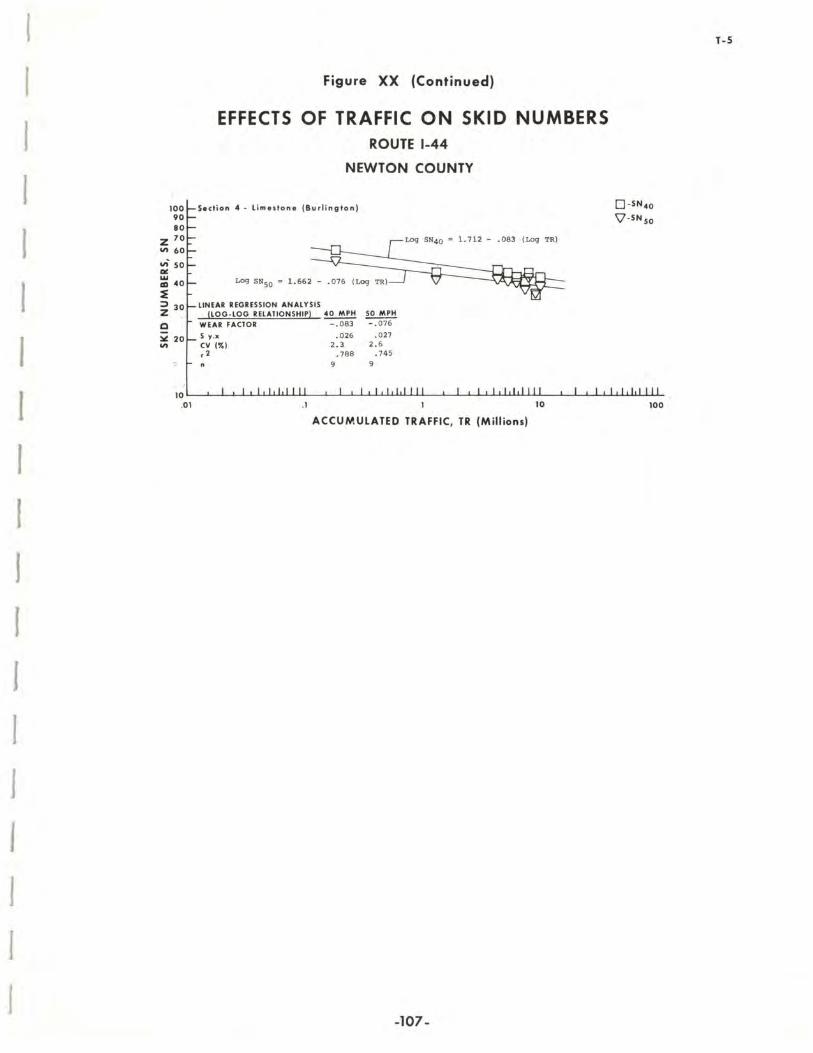
Each of the four sections maintained SN40 in the lower to middle 40's. Except
for initial tests, variability was rather small. Several reasonable wear factors were computed
with regression analyses. No significant influence on SN by AADLT was evident.
Description of Project
Project I-FI-44-1(36)0 involved an asphaltic concrete pavement (Mix #C72-300)
completed in October, 1972.
The mix contained 64.7% Burlington limestone containing approximately 35%
chert, 24.0% blended sand (flint chat sand and Missouri River sand), 5.7% mineral filler,
and 5.6% asphalt (60-70). Composition of the mix, based on weight of total mix, was
94.4% mineral aggregate and 5.6% asphalt with 4.4% +3/8" and 62.0% +#10 material.
Four divided pavement sections (each 3.900 miles in length) were tested.
Sections 1 and 2 were in the eastbound lane and Sections 3 and 4 were in the westbound
lane. Each section had five tests in position 2 at each test speed.
Skid tests and traffic data are shown in Table XX and plotted in Figure Xx.
-103-
T-2 I TABLE XX 1
SKID TESTS AND TRAFFIC DATA .-1
ROUTE I-44 NEWWN COUNTY
1 SN SN AADT Age in Est. Acc. J Date Tested 40 50 .LLane Months Traffic,TR
• A regression analysis indicot., that the skid numbers are not significantly offected by accumulated traffic, ther.fore, a dependable wear foctor cannot b. calculated.
A regression analysis indicates that the skid numb.rs ore not significantly offected by accumulated traffic , therefore, a dependable wear factor (annat be calculated .
A regression analysis indicates that the skid numbers are not significantly aff.cted by accumulated traffic , therefore , a dependable wear factor cannot be calculated .
~ 9 A r.greuion analYlis indicat •• that the skid nUMb.,. or. not significantly affected by aCCUMulated traff ic, th.r.'or., a dependable •• ar 'octor cannot b. calculated.
9 A regreuion analysis indicote, that the skid numbers or. not significantly aff.cted by accumulated traffic , therefore, a dependable .ear foctor con"ot b. calculated .
O - SN40
\7 - SN 50
10' IIIIII! " 1,1,111111 111",1111 1II!I""1
.01
100 90 80
Z , 70
'" 60
'" 50 0.:
:::: 40
~ ::::l 30 Z
0 ~ 20
'"
.1 10
ACCUMULATED TRAFFIC, TR (Millions)
Section 2 - limeston e (Ste. G enevie ve) and Crushed Grovel (Black River)
9 ~ ~ ~ SJ
A regression onalysis indicates that the skid numb.,s or. not significontly aff.cted by accumulated traffic , ther.fore, a dependable wear foctor cannot b. calculated.
100
O - SN40
\7 -SN SO
10 I I! I, I. I I II I! I, '1'1 II I I 1,1,1 I II I I I I III III
.01
100 90 80
Z 70
'" 60
vi" 50 0.:
:::: 40
~ ::::l 30 Z
0 ~ 20
'"
.1 10
ACCUMULATED TRAFFIC, TR (Millions)
Section 3 - Lim estone {Ste. G e neviev e )and Crushed Gravel (Black River )
9 Sl ~ ~ ~
A regression analy,i, indicate, that the ,kid numb.r, or. not ,ignificantly affect.d by accumulated traffic , ,h.refore, a dependable wear factor cannot be calculated .
100
O-SN40
\7 - SN 50
10' '111'11 I' 1 1 '1'1'11' 1111111111 1111111111
.01 .1 10 100
ACCUMULATED TRAFFIC, TR (Millions)
-118-
w-s
I 1
1 ~J
1
I J J
100 90 80
Z 70
'" 60
vi" SO III: w In 40
~ ~ 30
C
:..: 20
'"
Figure XXIII (Continued)
EFFECTS OF TRAFFIC ON SKID NUMBERS ROUTE I-55
PEMISCOT COUNTY
Section 4 - lim e stone (Ste . Genev iev e ) and C rush e d Gravel (Black River)
€I ~ ~ e~
A regression analysis indicates that the skid number s are not significant ly affected by accumulated traffic , ther.fore , a dependable wear 'ador cannot be calculated .
D-SN 40
\7 -SN so
la' 1,111,1" 1,1.1,1111 II'!I"III ""111" 1
.01
100 90 80
Z 70
'" 60 ",' SO III: w In 40
~ => 30 Z C
:..: 20
'"
.1 10
ACCUMULATED TRAFFIC, TR (Millions)
Section 5 - lim e stone (St e . G e n e vie ve ) and Cru s hed Gravel (Block River)
o \l ~ Sl ~~
A regress ion analys is indicates t hat the skid numb e rs o r. n ot s ignificontly affected by accumulated traffic , therefo r e , a dependable weor focto r (annat be colculated .
100
o -SN 40
\7-SN so
10' " "'I! " ! '" '" I I I I I III1I I I I I! I, I,! I I I
.01
100 90 80
Z 70
'" 60 ",' 50 III: w In 40
~ => 30 Z C :..: 20
'"
.1 10
ACCUMULATED TRAFFIC, TR (Millions)
Section 6 - lime s tone (St e. Gen e v iev e) and Cru s hed Grovel (Block River)
Log SN 50 1 . 646 - 0 ~ . 62 (Log :R)~ -
LINEAR REGRESSION ANALYSIS (LOG - LOG RELATIONSHIP) ~ ~
A regression analysis indicate, that the skid numbers or. not significantly affected by accumulated traffic , ther.for. , a dependable wear factor cannot b. calculated .
O-SN40
\7- SN so
10' "',,11 II ""11 " 11 "'''tI'" 11''''''11 .01
100 90 80
Z 70
'" 60 ",' 50 CIt
~ 40
~ :J 30 Z Q
:.:: 20
'"
.1 10
ACCUMULATED TRAFFIC, TR (Millions)
Section 8 - Limestone (Ste . G e nev ieve) and Crushed Gravel (Black River)
@ @ g~W
A regression analysis indicotes that the skid numbers or. not signjficantly affected
by accumulated traffic , therefor • • a dependable wear 'actor cannot b. calculated.
100
O-SN40
\7 -SN SO
10' I, 1,1,1 I II I, I, ,,, I I I I I 'III'I I I I, IIIII I I I
.01
100 90 80
Z 70
'" 60 ",' 50 CIt w CO 40
~ :J 30 Z Q
:.:: 20
'"
.1 10
ACCUMULATED TRAFFIC, TR (Millions)
Section 9 - Lim es tone (St •. G e nev ieve) and Crushed Gravel (Block River)
~""~ ."
LINEAR REGRESSION ANALYSIS (LOG - LOG RELATIONSHIP) ~ ~
WEAR FACTOR - .053
s y .x CV (%) ,2
.014 2 . 2
.7 08
• A regression analysis indicates that the skid numb.r, or. not significontly aff.cted by accumulated traffic, th.r.for., a dependable .ear factor cannot be calculated.
100
O - SN40
\7 -SN SO
10 I I I I, I' I " I , I I '" I II II I I'" I II I , I , II I I I !
.01 .1 10 100
ACCUMULATED TRAFFIC, TR (Millions)
-120-
W-7 r 1
I ]
)
1
J
J
J J
Distinctive Characteristics
ROUTE TT
JASPER COUNTY
X-I
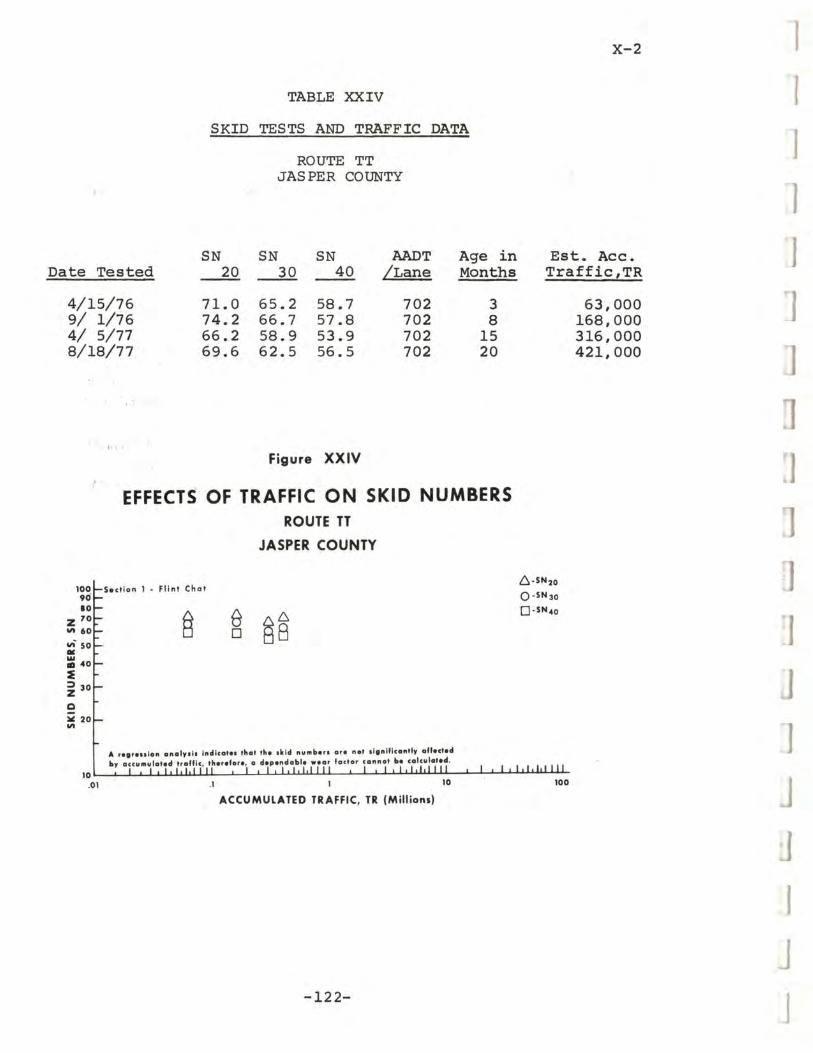
This special asphaltic concrete pavement utilized flint chat as coarse aggregate
and sand as fine aggregate.
Discussion of Results
Average SN40 was about 57. However, very little data was accumulated. No
significant trends were established for TR.
Description of Project
Project 7-U-TT-8 involved a special asphaltic concrete pavement (Mix #JFC75-37)
Missouri River sand, 6.0% mineral fIller, and 7.0% asphalt (6(}'70). Composition of the
mix, based on weight of total mix, was 93.0% mineral aggregate and 7.0% asphalt with
4.6% +3/8" and 49.6% +#10 material.
One four-lane undivided pavement section (0.970 miles in length) was tested.
The section had five tests in position 2 in each direction for each test speed.
Skid tests and traffic data are shown in Table XXIV and plotted in Figure XXIV.
-121-
Figure XXIV
EFFECTS OF TRAFFIC ON SKID NUMBERS ROUTE TT
100~S.ct i on I • Fl i nt Chat 90
Z ~:I- A lit 60E- tj on 50 .. = 40 ~ :» 30 Z o ~ 20 lit
JASPER COUNTY
e o sa
A r •• , ... lon analy.is Ind lcat •• that the sk id numbers or. net . lln itl (an,I, affecteel by a ccuMul.t.d traff ic, ther.for. , a depenclabl ••• ar foctor cannot b. calcu lat.eI.
6 · SN20
O · SN30
D·SN4o
10 I I , I"" I II I II eI II I I I I I I I ," I I II " II ,,' I II
.0 1 .1 ,0 100
ACCUMULATED TRAFFIC, TR (Millions'
-122-
J J J
V-I
ROUTE 1-44
ST. LOUIS COUNTY
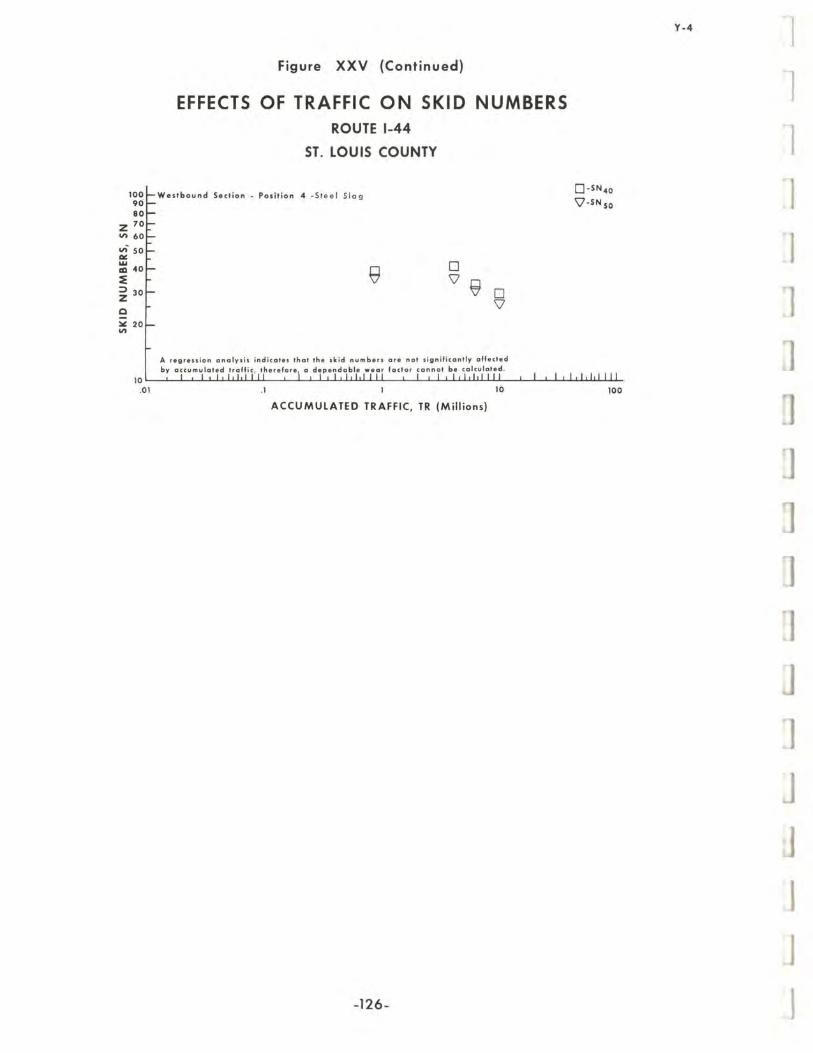
Distinctive Characteristics This special asphaltic concrete pavement utilized steel slag and sand as aggregate.
Discussion of Results
Data is very limited on this project. Although SN40 appears to be dropping,
no significant trends have been established for TR.
Description of Project
Project 6-1-44-109 (Third Street Viaduct) was an asphaltic concrete pavement
l00r-Eastbound Se ction - Po s it ion 2 - Stee l Slag 90 80
Z 70
'" 60 ",' SO ac ... aJ 40
~ :;, 30 Z
o ~ 20
'"
o \l o
\l o \l o
\l
A regression analysis ind icates that the skid numbers a re not significantly affected by accumulated traffic , therefo re, a dependabl e w e a r factor cannot be calculated.
O - SN40
\7 -SN so
101 1.1""111 '''''''III ,I""dlll ''''''' 1 11 .01
80
100~Eostbound 90
Z 70
'" 60 .;; SO ac ... aJ 40
~ :;, 30 Z o ~ 20
'"
.1
ACCUMULATED TRAFFIC, TR (Millions)
Sect ion - Position 4 -S t eel Slag
o \l
o \l
o \l
10
o \l
A regression analys is ind icates that the sk id number s are not significantly affected by accumu lated traffic , therefore, a dependable we ar factor cannot be calculated .
100
O - SN40
\l-SN SO
101 1.'''''111 I.!tldlll 1""""1 I""dlll
.01 .1 10
ACCUMULATED TRAFFIC, TR (Millions)
100I-Westbound Section - Pos ition 2 - Stee l Sl o g 90 80
Z 70
'" 60
'" 50
~ "~ ~ 30
0 ~ 20
'"
0 0 \l \l 9 0
\l
A regression analysis ind icates that the sk id numbe r s are not s ignificantly affected by accumulated traff ic, therefore, a dependable wear factor cannot b. calculat.d.
100
O - SN40
\7- SN so
10' 1"""111 1"""111 ,.'!I,'"' lelII,' III
.01 .1 10 100
ACCUMULATED TRAFFIC, TR (Millions)
-125-
Y-3
100 90 80
Z 70 en 60
vi 50 co: ... lID 40
~ ::::I 30 Z o ~ 20 on
Figure XXV (Continued)
EFFECTS OF TRAFFIC ON SKID NUMBERS ROUTE 1-44
ST. lOUIS COUNTY
Westbound Section - Pos itio n 4 -Steel Slag
8 o 'V ~ 0
\7
A regression analysis indic ates thot the skid numbers or. not significantly affected by accumulated traffic , ther.fare t a dependable wear factor cannot b. calculated .
O-SN40
\7 - SN so
la' I, IIIII II I, I! III I I! I,!! III I I I !! I, I., I II