c o m p u t e r m e t h o d s a n d p r o g r a m s i n b i o m e d i c i n e 1 2 9 ( 2 0 1 6 ) 117–124
jo ur nal ho me p ag e: www.int l .e lsev ierhea l t h.com/ journa ls /cmpb
n R package for the integrated analysis ofetabolomics and spectral data
hristopher Costaa, Marcelo Maraschinb, Miguel Rochaa,∗
CEB – Centre Biological Engineering, University of Minho, Braga, PortugalPlant Morphogenesis and Biochemistry Laboratory, Federal University of Santa Catarina, Florianopolis, Brazil
r t i c l e i n f o
rticle history:
eceived 24 July 2015
eceived in revised form
January 2016
ccepted 5 January 2016
eywords:
etabolomics
hemometrics
uclear magnetic resonance
ass spectrometry
nfrared and UV–visible
pectroscopy
a b s t r a c t
Recently, there has been a growing interest in the field of metabolomics, materialized
by a remarkable growth in experimental techniques, available data and related biological
applications. Indeed, techniques as nuclear magnetic resonance, gas or liquid chromatog-
raphy, mass spectrometry, infrared and UV–visible spectroscopies have provided extensive
datasets that can help in tasks as biological and biomedical discovery, biotechnology
and drug development. However, as it happens with other omics data, the analysis of
metabolomics datasets provides multiple challenges, both in terms of methodologies and
in the development of appropriate computational tools. Indeed, from the available software
tools, none addresses the multiplicity of existing techniques and data analysis tasks.
In this work, we make available a novel R package, named specmine, which provides a set of
methods for metabolomics data analysis, including data loading in different formats, pre-
processing, metabolite identification, univariate and multivariate data analysis, machine
learning, and feature selection. Importantly, the implemented methods provide adequate
support for the analysis of data from diverse experimental techniques, integrating a large
set of functions from several R packages in a powerful, yet simple to use environment.
The package, already available in CRAN, is accompanied by a web site where users can
deposit datasets, scripts and analysis reports to be shared with the community, promoting
the efficient sharing of metabolomics data analysis pipelines.
a large variance in chemical structures and properties, mak-
. Introduction
he field of metabolomics has been growing in interest by thecientific community, given its extensive range of applicationsn functional genomics and, more globally, in the characteri-ation of biological systems [12]. Indeed, the possible tasks
nclude studying metabolic systems, measuring biochemi-al phenotypes, understanding and reconstructing networks,iscriminating between samples, identifying biomarkers of
disease, analyzing food and beverages, studying plant phys-iology or fostering drug discovery [12,17,11].
Metabolomics can be defined as the identification andquantification of all intracellular and extracellular metabo-lites with low molecular mass. Unlike transcriptomics andproteomics which are based on polymers, metabolites have
ing difficult the development of high-throughput techniquesand reducing the number of molecules that can adequately bemeasured in a sample [17]. In recent years, however, an exten-
s i n b i o m e d i c i n e 1 2 9 ( 2 0 1 6 ) 117–124
Fig. 1 – General workflow of a metabolomics experiment.
118 c o m p u t e r m e t h o d s a n d p r o g r a m
sive range of experimental techniques has been developed toobtain metabolomics data, which are growing in size.
The main experimental approaches for metabolomicsdata acquisition are nuclear magnetic resonance (NMR),liquid chromatography (LC) and gas chromatography (GC)coupled with mass spectrometry (MS), infrared (IR), andultraviolet–visible (UV–vis) spectroscopies. GC/LC–MS andNMR are more robust techniques and they are fre-quently employed in the analysis and quantification of themetabolome. IR and UV–vis techniques have the advantage ofbeing simpler and less expensive, providing a complementaryview of that provided by GC/LC–MS or NMR.
Two distinct approaches can be chosen for runninga metabolomics experiment. The former, a chemometricsapproach or metabolic fingerprinting, makes direct use ofspectra or peaks lists, and the analysis typically addressessample discrimination. The latter, known as metabolic targetanalysis or profiling, focuses on the identification and quan-tification of compounds in the sample, using that informationto run the analysis. The general workflow of an experi-ment generally consists in the steps of sample preparation,data acquisition, preprocessing, data analysis and interpreta-tion (see Fig. 1). Once the samples are prepared and data isacquired, it will be preprocessed to correct some issues andimprove the performance of the next step, data analysis.
The analysis of metabolomics datasets needs to addressimportant challenges regarding the extraction of relevantknowledge from large amounts of data [16]. As it is the casewith other types of omics data, metabolomics data analysishas promoted the development and adaptation of numer-ous methods for data analysis from fields such as statistics,machine learning or computer science.
Some of the main available tools for metabolomics dataanalysis are summarized in Table 1. Most of the tools reviewedin the table, while providing useful functionalities, are limitedto specific types of metabolomics or spectral data (as it isthe case with hyperSpec, ChemoSpec, speaq or Automics).Other tools offer a limited portfolio of data analysis tools
(e.g. metabolomics package or MeltDB), not offering an exten-sive range of solutions for the construction of metabolomicsdata analysis pipelines. The most comprehensive tool foundwas the web-based suite MetaboAnalyst [18], which provides
Table 1 – Available free tools for metabolomics data.
a large number of tools with a user-friendly interface. It is,however, limited to the provided closed user interface andavailable configuration parameters, being difficult to extendand define personalized workflows. Also, it does not coverspectral data.
On the other hand, a number of R packages have beendeveloped, from which we emphasize xcms and MAIT [20](from Bioconductor), hyperSpec [2] and ChemoSpec [9], which,although limited to specific data types, provide valuable func-tions for many types of metabolomics data analysis. However,these packages are not well integrated with each other, andtherefore it is not straightforward to combine their function-alities.
Taking into account the aforementioned context, theproposed work aims to develop an integrated script-basedsoftware for the analysis of metabolomics data in the format
Short description
Web application to analyze metabolomic dataR package to handle spectral data and metadata
Spec R package to handle spectral dataages/ R-package + GUI for metabolomic profiles
Integrated workflow for robust alignment andquantitative analysis of NMRNMR-based spectral processing and analysisWeb-based system for data analysis
lomics R functions for metabolomics statistical analysismetap2/ Web application to analyze metabolomic dataiews.html Bioconductor R packages for metabolomics
c o m p u t e r m e t h o d s a n d p r o g r a m s i n b i o m e d i c i n e 1 2 9 ( 2 0 1 6 ) 117–124 119
Fig. 2 – Modules developed in the package.
opbbdsi
ogatssmfbnf
2p
Tcsrtd
wmatiaTgmyv
labels for the x- and y-axis. In Fig. 4, a graphical representationof the dataset structure is provided.
f a package for the R scientific computing environment. Thisackage will incorporate many available functions providedy metabolomics oriented R packages (as highlighted above),ut also more general-purpose data analysis R functions. Theeveloped tool will address at this stage metabolomics andpectral data from GC–MS, LC–MS, NMR, IR, and UV–vis exper-ments.
The framework was developed to address a wide varietyf common tasks on metabolomics data analysis, providing aeneral workflow that can be adapted for specific case studies,ddressing tasks as data loading, pre-processing, normaliza-ion, metabolite identification, univariate and multivariatetatistical analysis, clustering, machine learning and featureelection. Thus, it provides a tool that not only covers the mainetabolomics and spectral data types, but also addresses a
ull range of tasks in data analysis, allowing to create flexi-le and powerful analysis pipelines for specific case studies,ot loosing the capability of interacting with the multitude of
unctions provided by the R project’s community.
. Development of the package androvided functions
o achieve the objectives of this work, a package with featuresovering the main steps of the metabolomics data analy-is workflow was developed, containing functions for dataeading and dataset creation, preprocessing, metabolite iden-ification and data analysis. Fig. 2 shows the main moduleseveloped.
The package contains functions that are easy to use, i.e.ith few mandatory parameters, but also very flexible, sinceost functions have default parameters, but they also have
large number of parameters that can be used to changehe default behavior. The package integrates many functionsmported and sometimes adapted/extended from other pack-ges, integrating various packages over a unique interface.he package’s functions were meant to provide abundant
raphical visualization options of the results. The idea is toinimize the complexity of the code needed to make an anal-
sis pipeline over a dataset, but also to easily allow creatingariants for this analysis.
2.1. Development tools and installation
The package was developed using the R1 environment, a freesoftware environment for data manipulation, scientific andstatistical computing and graphical visualization. RStudio2
was the environment chosen to develop the scripts andassemble the package. Reports were made using a pluginnamed RMarkdown,3 which can create easily dynamic HTMLreports from annotated R code.
The package can be accessed and installed through theCRAN repository, being available under the name of specmine inthe URL https://cran.r-project.org/web/packages/specmine/,being also available a set of documents providing full doc-umentation for all functions. The package’s most recentdevelopment version can also be installed directly in RStu-dio using the install bitbucket function of the devtools package,using the following repository as an argument: “chris-bcl/metabolomicsPackage”.
2.2. Data reading and dataset structure
The types of metabolomics data supported are NMR, UV–vis,IR, and (GC- or LC-)MS data. A number of different file formatsare supported, including comma (or tab) separated values (CSVor TSV) files, (J)DX spectra files, NetCDF, mzDATA and mzXMLMS data. Metadata can be given as a CSV/TSV file. The corereading functions for (J)DX are provided by ChemoSpec [9]. ForLC/GC–MS spectra data (NetCDF, mzDATA, and mzML), thepackage xcms [19] was used. It is also possible to load data as apeaks list, using peak alignment functions to reach a datasetin a standard tabular form. Fig. 3 represents a scheme of thedata reading processes.
The basic structure of a dataset is general-purpose, inde-pendent of the type of data and source. A dataset is an R listconsisting of the following fields: description of the dataset,type of data, the data matrix, the metadata data frame and the
120 c o m p u t e r m e t h o d s a n d p r o g r a m s i n b i o m e d i c i n e 1 2 9 ( 2 0 1 6 ) 117–124
of th
Fig. 3 – Scheme
2.3. Exploratory analysis and data pre-processing
The package includes a number of functions that allow tocalculate global statistics and others to provide graphical visu-alization of the data. A basic visualization function allows tosee the distribution of values for (a subset of) the variablesin the dataset in the form of boxplots. There are also func-tions to plot spectral data (where variables are represented bynumerical values). For visualization functions, the base graph-ics system of R was used, but some functions also rely on theggplot2 package.
Various preprocessing methods were implemented for thedifferent types of data. To extract relevant parts of a dataset,a number of functions were developed that allow to extract(or remove) relevant subsets of samples, data and metadatavariables.
To perform spectral pre-processing, methods are availablefor different types of corrections or spectral processing. Theseinclude functions for shifting correction, multiplicative scatter
correction, first derivative, baseline (based on the methodsavailable for the baseline R package), offset and backgroundcorrections (both implemented from the hyperSpec package).
Fig. 4 – Representation of the structure of the data in adataset.
e data reading.
A few methods for smoothing interpolation are available, suchas bin or loess smoothing, as well as Savitzky–Golay filters.
To treat missing values, various imputation methodswere implemented. Also, methods for data normalization,transformation and scaling are provided. Sample normaliza-tion methods includes normalization by sum, median, by areference sample or feature. Cubic root and logarithmic trans-formation methods are available, and as for scaling methods,auto, range and pareto scaling methods are provided. Finally,to remove variables with low variance, flat pattern filters areprovided with distinct metrics and parameters.
2.4. Metabolite identification
A method from the MAIT (http://bioconductor.org/packages/release/bioc/html/MAIT.html) package is currently available toperform metabolite identification, at this stage only for LC–MSdata.
The method provides peak annotation with the CAMERApackage. It can also be used to obtain the significant featuresfrom the spectra, or the user can supply the features andproceed with metabolite identification. The MAIT package pro-vides a method called biotransformation that helps to improvethe metabolite identification process and also provides its owndatabase [20]. The results are stored on a folder with the querymass and the identification information associated with them.
2.5. Univariate analysis
A number of distinct univariate analysis methods, all basedin the stats R package, were implemented covering the fol-lowing types of analysis: correlations, fold changes, t-tests,analysis of variance (ANOVA) and regression analysis. Indeed,there are functions to calculate the correlations between vari-ables or samples, and the resulting matrix can be visualized
as a heatmap.
To perform fold change analysis, there are functions tocalculate fold changes of values considering two groups ofsamples (as defined by a metadata variable), being possible
c o m p u t e r m e t h o d s a n d p r o g r a m s
o visualize the results in tabular and graphical forms. Also, t-ests can be performed and visualized in a similar way. Theackage also implements one-way ANOVA, with the TukeySD post hoc test, and multifactorial ANOVA. There are func-
ions to summarize the main results of complex analysesroviding p-values and percentage of variation explained byhe different factors. Both t-tests and ANOVA implementa-ions are prepared to handle multiple testing by default, beinghe provided p-values adjusted using the false discovery rateFDR) method proposed by Benjamini and Hochberg [3].
Non-parametric tests were also considered, throughhe implementation of the Kruskal–Wallis andolmogorov–Smirnov tests. On the other hand, linear regres-ion analysis can be performed, being available functionshat summarize the coefficients for the different factors andnteractions, as well as the respective p-values.
.6. Unsupervised multivariate analysis
he package includes functions to perform principal compo-ent analysis (PCA) using two methods: classical and robust.obust PCA uses the grid search algorithm to compute theesired number of principal components, using the pcaPP Rackage [5]. It also provides a number of ways to visualizehe results through scree plots, scores plots, biplots and pairslots.
Additionally, two clustering methods were implemented:-means clustering and hierarchical clustering. The distanceethod can be chosen according to the available option from
he dist function, as well the method used in the case of theierarchical clustering. Clustering results can also be plotted.here are functions that create a dendrogram of the hierarchi-al clustering results and functions that allow to visualize theesults from k-means.
.7. Machine learning and feature selection
he package provides a number of functions to train, use andvaluate machine learning methods, being mostly based inhe R package caret, covering both classification and regression
ethods. Also, there are functions to evaluate the importancef each variable in the models. A list of possible models andunable parameters can be seen in: http://topepo.github.io/aret/modelList.html.
Validation methods are available to estimate the erroretrics, which include k-fold cross-validation, leave-one-out
ross-validation and resampling, among others. The erroretrics available include accuracy, area under the ROC curve
AUC) and kappa statistic for classification, and root meanquare error (RMSE) and the coefficient of determination (R2)or regression.
The implemented functions enable to do model trainingnd the posterior use of the model to predict new data. Also,t is possible to optimize a set of model parameters (e.g. num-er of components in partial least squares, or hidden nodes
n a neural network) testing a set of possible values and eval-
ating those according to the selected validation method andrror metrics. The results from a process of model optimiza-ion includes the best model obtained, the performance ofhis model, the variables’ importance, the results of all tested
o m e d i c i n e 1 2 9 ( 2 0 1 6 ) 117–124 121
combinations of parameters, the confusion matrices (for clas-sification), among other statistics. These models can be usedlater for predictions or visualization, as it happens in the par-tial least squares (PLS) case.
Also, from the same package, there are a number offunctions to perform feature selection, i.e. determine whichattributes are more valuable when applying different machinelearning methods. Both filter and wrapper methods are pro-vided for feature selection, which can be combined withselected models from the list mentioned above. Regarding thewrappers available, the most commonly used is recursive fea-ture elimination (RFE) [22]. This will test different subsets offeatures, iteratively reducing the number of features and ver-ifying which configuration provides the best performance.
2.8. Web site
Complementary to the R package developed, the authors havealso created a web site that aims to provide a means forsharing datasets and data analyses among the community.This web site, which is still provided in a preliminary version,allows users to deposit datasets, scripts and analysis reportsfor metabolomics data. The information made public by theusers can be freely navigated by anyone, making available thedata and metadata for a specific task, the R scripts used inthe analysis and the data analysis reports that were generatedusing R markdown.
The current version of the site is provided in the URLhttp://darwin.di.uminho.pt/metabolomics, being at this stageonly available the datasets referring to the case studiesdescribed in the following section of this paper.
3. Case studies
Four case studies using real data will be presented to testthe package and provide meaningful data analysis pipelines.The first is the analysis of metabolites concentrations of urinesamples from control and cachexic cancer patients, the nextis the discrimination of propolis samples from southern Brazil(using NMR and UV–vis data), the third is the analysis of theeffect of postharvest physiological deterioration (PPD) of cas-sava samples (IR data), and, finally, the last illustrates the useof LC–MS data with spectra of two groups of samples fromspinal cord of wild-type and mutant mice.
For one of the case studies, some selected results will beshown as a demonstration of some of the package’s capabili-ties. Full data analysis reports for all cases, following distinctanalysis pipelines are further provided in the web site men-tioned above.
3.1. Cachexia
Cachexia is a complex metabolic syndrome associated withan underlying illness (such as cancer) and characterized byloss of muscle with or without loss of fat mass [7]. Improved
approaches for detecting the onset and evolution of musclewasting would help to manage wasting syndromes andfacilitate early intervention [6]. As metabolites produced fromtissue breakdown are likely to be a sensitive indicator of
122 c o m p u t e r m e t h o d s a n d p r o g r a m
muscle wasting, urine samples were collected since severalend products of muscle catabolism are specifically excretedin urine [6]. A total of 77 urine samples were collected being47 of them patients with cachexia, and 30 control patients. Allone-dimensional NMR spectra of urine samples were acquiredand then the metabolites were detected and quantified, i.e.for each metabolite its concentration was measured.
3.2. Propolis
Propolis is a substance produced from the collected exu-dates of plants (resin) by bees. The resin is masticated,salivary enzymes are added, and the partially digested mate-rial is mixed with beewax and used in the hive to sealthe walls, strengthen the borders of combs, and embalmdead invaders. Recently, this product has been the subject ofstudies highlighting its pharmacological properties, such asthe antimicrobial [4,1], anti-oxidative [10], anti-viral [8], anti-tumoral [13,14] or anti-inflammatory [4,1].
It has long been known that propolis’ chemical composi-tion might be strongly influenced by environmental factorspeculiar to the sites of collection of a given geographic regionof production, as well as by seasoning. The aim of this casestudy is to gain insights of important features associated tochemical composition, harvest season, and geographic ori-gin of propolis produced in the Santa Catarina state, southernBrazil. The propolis samples used in this study for NMR dataanalysis were collected in the autumn (AU), winter (WI), spring(SP), and summer (SM) of 2010 from hives located in SantaCatarina state. A total of 59 samples were collected, with thedistribution of samples by seasons being: SM – 16 samples, AUand SP – 15 samples, WI – 13 samples. Also, three agroecologi-cal regions were defined for the different apiaries, distributedas follows: highlands – 12 samples, plain – 11 samples, plateau– 36 samples.
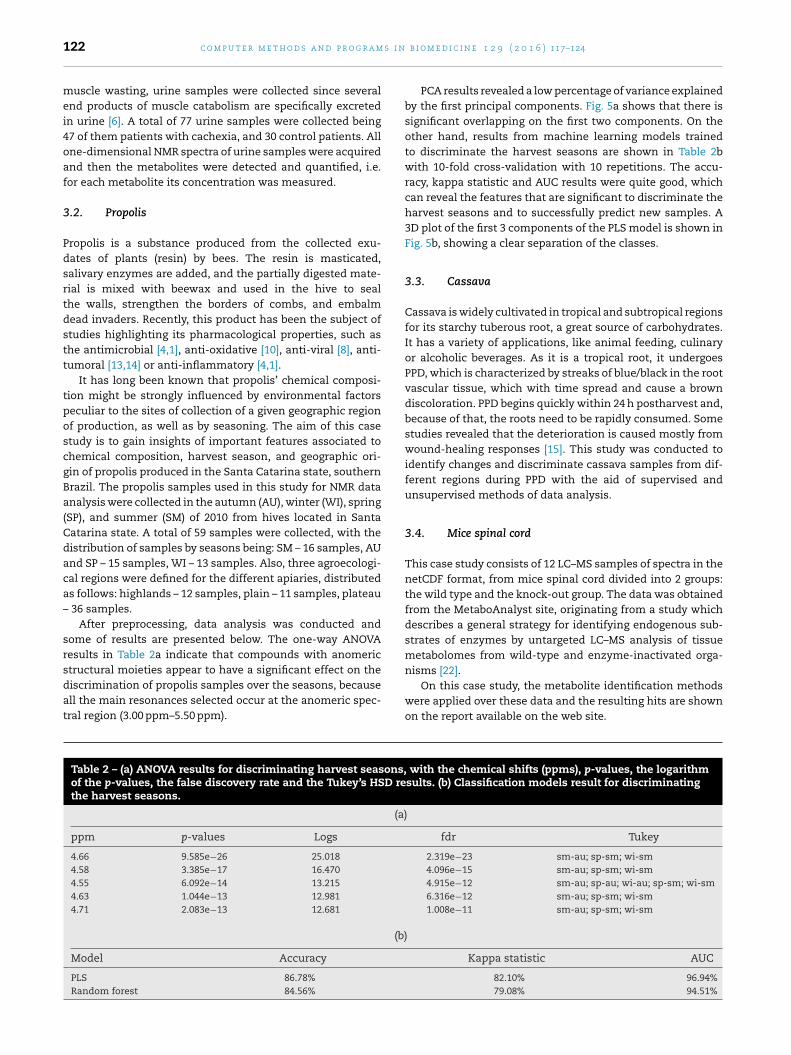
After preprocessing, data analysis was conducted andsome of results are presented below. The one-way ANOVAresults in Table 2a indicate that compounds with anomeric
structural moieties appear to have a significant effect on thediscrimination of propolis samples over the seasons, becauseall the main resonances selected occur at the anomeric spec-tral region (3.00 ppm–5.50 ppm).
Table 2 – (a) ANOVA results for discriminating harvest seasons,of the p-values, the false discovery rate and the Tukey’s HSD rethe harvest seasons.
(a)
ppm p-values Logs
4.66 9.585e−26 25.018
4.58 3.385e−17 16.470
4.55 6.092e−14 13.215
4.63 1.044e−13 12.981
4.71 2.083e−13 12.681
(b)
Model Accuracy
PLS 86.78%
Random forest 84.56%
b i o m e d i c i n e 1 2 9 ( 2 0 1 6 ) 117–124
PCA results revealed a low percentage of variance explainedby the first principal components. Fig. 5a shows that there issignificant overlapping on the first two components. On theother hand, results from machine learning models trainedto discriminate the harvest seasons are shown in Table 2bwith 10-fold cross-validation with 10 repetitions. The accu-racy, kappa statistic and AUC results were quite good, whichcan reveal the features that are significant to discriminate theharvest seasons and to successfully predict new samples. A3D plot of the first 3 components of the PLS model is shown inFig. 5b, showing a clear separation of the classes.
3.3. Cassava
Cassava is widely cultivated in tropical and subtropical regionsfor its starchy tuberous root, a great source of carbohydrates.It has a variety of applications, like animal feeding, culinaryor alcoholic beverages. As it is a tropical root, it undergoesPPD, which is characterized by streaks of blue/black in the rootvascular tissue, which with time spread and cause a browndiscoloration. PPD begins quickly within 24 h postharvest and,because of that, the roots need to be rapidly consumed. Somestudies revealed that the deterioration is caused mostly fromwound-healing responses [15]. This study was conducted toidentify changes and discriminate cassava samples from dif-ferent regions during PPD with the aid of supervised andunsupervised methods of data analysis.
3.4. Mice spinal cord
This case study consists of 12 LC–MS samples of spectra in thenetCDF format, from mice spinal cord divided into 2 groups:the wild type and the knock-out group. The data was obtainedfrom the MetaboAnalyst site, originating from a study whichdescribes a general strategy for identifying endogenous sub-strates of enzymes by untargeted LC–MS analysis of tissuemetabolomes from wild-type and enzyme-inactivated orga-
nisms [22].
On this case study, the metabolite identification methodswere applied over these data and the resulting hits are shownon the report available on the web site.
with the chemical shifts (ppms), p-values, the logarithmsults. (b) Classification models result for discriminating
c o m p u t e r m e t h o d s a n d p r o g r a m s i n b i o m e d i c i n e 1 2 9 ( 2 0 1 6 ) 117–124 123
Fig. 5 – (a) PCA scores plot (PC1 and PC2) grouped by the harvest seasons. (b) 3D plot of the first 3 components of the PLSmodel with the harvest seasons.
4
Tdadpmam
vuTtow
. Conclusions
o face the numerous challenges brought by metabolomicsata, an R package was developed, which includes featuresnd methods for a variety of important aspects, starting withata loading into a defined structure, various methods of pre-rocessing and visual exploration of the data, methods foretabolite identification, as well as methods for data analysis
nd machine learning. All these methods have been imple-ented and demonstrated in distinct real-world case studies.Since it provides the possibility of quickly creating and
isualizing the results of analysis pipelines, the package can besed by anyone with or without a computational background.
he package is quite flexible, with functions that are easy
o use having default configurations, but with the possibilityf configuring more specific details as users get acquaintedith the potential of the functions. A web site has also been
created to complement the package functionalities, providinga way for the community to exchange datasets, analysisscripts and reports of the analysis pipelines performed.
Therefore, the resources put forward in this work willbe valuable tools for researchers in the growing field ofmetabolomics. In current and future work, the team willextend the framework with other methods for the coveredtasks, but also address new functionalities. In the first case,the task of metabolite identification is still an area wherethe package can be improved covering other types of dataand methods, but also machine learning possibilities can beenhanced by considering other possible frameworks. In thesecond case, the team will focus in extending the frame-work with tools for extracting peaks from NMR raw data,
handling 2D NMR datasets, metabolite enrichment analysis,pathway analysis and in the implementation of methods fordata fusion, which can allow the integrated analysis of differ-ent types of data for the same case study.
124 c o m p u t e r m e t h o d s a n d p r o g r a m
Conflict of interest
The authors declare they have no conflict of interestsregarding this article.
Acknowledgments
The work is partially funded by Project 23060, PEM – Techno-logical Support Platform for Metabolic Engineering, co-fundedby FEDER through Portuguese QREN under the scope of theTechnological Research and Development Incentive system,North Operational and by Project PropMine, funded by theagreement between Portuguese FCT and Brazilian CNPq.
e f e r e n c e s
[1] A.H. Banskota, Y. Tezuka, S.H. Kadota, Recent progress inpharmacological research of propolis, Phytother. Res. 15(2001) 561–571.
[2] C. Beleites, hyperSpec Introduction, University of TriesteSpectroscopy – Imaging, IPHT Jena e.V, 2014, May, CENMATand DI3, http://cran.r-project.org/web/packages/hyperSpec/vignettes/introduction.pdf.
[3] Y. Benjamini, Y. Hochberg, Controlling the false discoveryrate: a practical and powerful approach to multiple testing, J.R. Stat. Soc. Ser. B 57 (2015) 289–300.
[4] G.A. Burdock, Review of the biological properties andtoxicity of bee propolis (propolis), Food Chem. Toxicol. 36(1998) 347–363.
[5] C. Croux, P. Filzmoser, M. Oliveira, Algorithms forprojection-pursuit robust principal component analysis,Chemom. Intell. Lab. Syst. 87 (2007) 218–225.
[6] R. Eisner, C. Stretch, T. Eastman, J. Xia, D. Hau, S. Damaraju,R. Greiner, D.S. Wishart, V.E. Baracos, Learning to predictcancer-associated skeletal muscle wasting from H-NMRprofiles of urinary metabolites, Metabolomics 7 (2010)25–34.
[7] W.J. Evans, J.E. Morleya, J. Argilésa, C. Balesa, V. Baracosa, D.Guttridgea, A. Jatoia, K. Kalantar-Zadeha, H. Lochsa, G.Mantovania, D. Marksa, W.E. Mitcha, M. Muscaritolia, A.Najanda, P. Ponikowskia, F.R. Fanellia, M. Schambelana, A.Scholsa, M. Schustera, D. Thomas, R. Wolfea, S.D. Anker,Cachexia, A new definition, Clin. Nutr. 27 (2008) 793–799.
[8] G. Gekker, S. Hu, M. Spivak, J.R. Lokensgard, P.K. Peterson,Anti-HIV-1 activity of propolis in CD4+ lymphocyte andmicroglial cell cultures, J. Ethnopharmacol. 102 (2005)158–163.
b i o m e d i c i n e 1 2 9 ( 2 0 1 6 ) 117–124
[9] B.A. Hanson, Chemospec: An R Package for ChemometricAnalysis of Spectroscopic Data and Chromatograms, 2003https://cran.r-project.org/web/packages/ChemoSpec/vignettes/ChemoSpec.pdf.
[10] S. Kumazawa, R. Ueda, T. Hamasaka, S. Fukumoto, T.Fujimoto, T. Nakayama, Antioxidant prenylated flavonoidsfrom propolis collected in Okinawa, Japan, J. Agric. FoodChem. 55 (2007) 7722–7725.
[11] F. Mozzi, M.E. Ortiz, J. Bleckwedel, L.D. Vuyst, M. Pescuma,Metabolomics as a Tool for the ComprehensiveUnderstanding of Fermented and Functional Foods WithLactic Acid Bacteria, Food Research International, 2012.
[12] J. Nielsen, M.C. Jewett, Metabolomics: A Powerful Tool inSystems Biology, Springer, 2007.
[13] J.M. Sforcin, Propolis and the immune system: a review, J.Ethnopharmacol. 113 (2007) 1–14.
[14] K. Tan-No, K.T. Nakajima, T. Shoii, O. Nakagawasai, F.Niijima, M. Ishikawa, Y. Endo, T. Sato, S. Satoh, K. Tadano,Anti-inflammatory effect of propolis through nitric oxideproduction on carrageenin-induced mouse paw edema, Biol.Pharm. Bull. 29 (2006) 96–99.
[15] V.G. Uarrota, R. Moresco, B. Coelho, E. da Costa Nunes, L.A.Martins Peruch, E. de Oliveira Neubert, M. Rocha, M.Maraschin, Metabolomics combined with chemometric tools(PCA, HCA, PLS-DA and SVM) for screening cassava (Manihotesculenta Crantz) roots during postharvest physiologicaldeterioration, Food Chem. 161 (2014) 67–78.
[16] K. Varmuza, P. Filzmoser, Introduction to MultivariateStatistical Analysis in Chemometrics, CRC Press, 2008.
[17] S. Villas-Boas, U. Roessner, M.A.E. Hansen, J. Smedsgaard, J.Nielsen, Metabolome Analysis: An Introduction, Wiley, 2007.
[18] J. Xia, R. Mandal, I.V. Sinelnikov, D. Broadhurst, D.S. Wishart,Metaboanalyst 2.0 – a comprehensive server formetabolomic data analysis, Nucleic Acids Res. 40 (2012)127–133.
[19] C.A. Smith, E.J. Want, G. O’Maille, R. Abagyan, G. Siuzdak,XCMS: processing mass spectrometry data for metaboliteprofiling using nonlinear peak alignment, matching andidentification, Anal. Chem. 78 (2006) 779–787.
[20] F. Fernandez-Albert, R. Llorach, C. Andres-Lacueva, A.Perera, An R package to analyse LC/MS metabolomic data:MAIT (metabolite automatic identification toolkit),Bioinformatics (Oxf., Engl.) 30 (13) (2014) 1937–1939,http://dx.doi.org/10.1093/bioinformatics/btu136http://bioinformatics.oxfordjournals.org/cgi/content/long/30/13/1937.
[21] A. Saghatelian, S.A. Trauger, E.J. Want, E.G. Hawkins, G.Siuzdak, B.F. Cravatt, Assignment of endogenous substrates
to enzymes by global metabolite profiling, Biochemistry 43(2004) 14332–14339.