65
t7-- tÞ: 4 I tl.-" t z:- _:la. -: Tll ; l' --i- - Race and Prosecutions 2013- 2015 AR ft e Santa Clara Coun District Att ornevts Office 185{l a qts; $ =L fr Ros District Att

t7--
tÞ:
4
I
tl.-"
t
z:- _:la. -:Tll ; l'
--i--
Race and Prosecutions
2013- 2015
AR ft e Santa Clara CounDistrict Attornevts Office
185{l
aqts;
$
=L
fr
Ros District Att
Forward
Hard questions are coming from our community and from communities across America.These questions cut to the core of one of our most basic and important values - fairness. Are webeing fair in the way criminal cases are prosecuted in our courts, and even before they get tocourt? Is our justice system fair to everyone? One study cannot answer these questions, and itcan't provide solutions to all of the problerns that it reveals. One study is a step, here in ourDistrict Attorney's Office and in our community, toward coming to grips with the troubling partsof our system where there is racial inequity. This study - which looks atrace and our adultprosecutions from 2013-2015 - ansrü/ers a few questions. It raises others. In the end, we hope thatit takes an initial but purposeful step toward a system where there is more understanding andfairness. We are committed to asking hard questions of ourselves, and providing more solutionsin the days to come.
Ç"'/'{'TL-**Jeff RosenDistrict AttomeyOctober 26,2016
2
The Core OuestÍons:
Is there racial unfairness in the way the DA's Office files criminal cases?
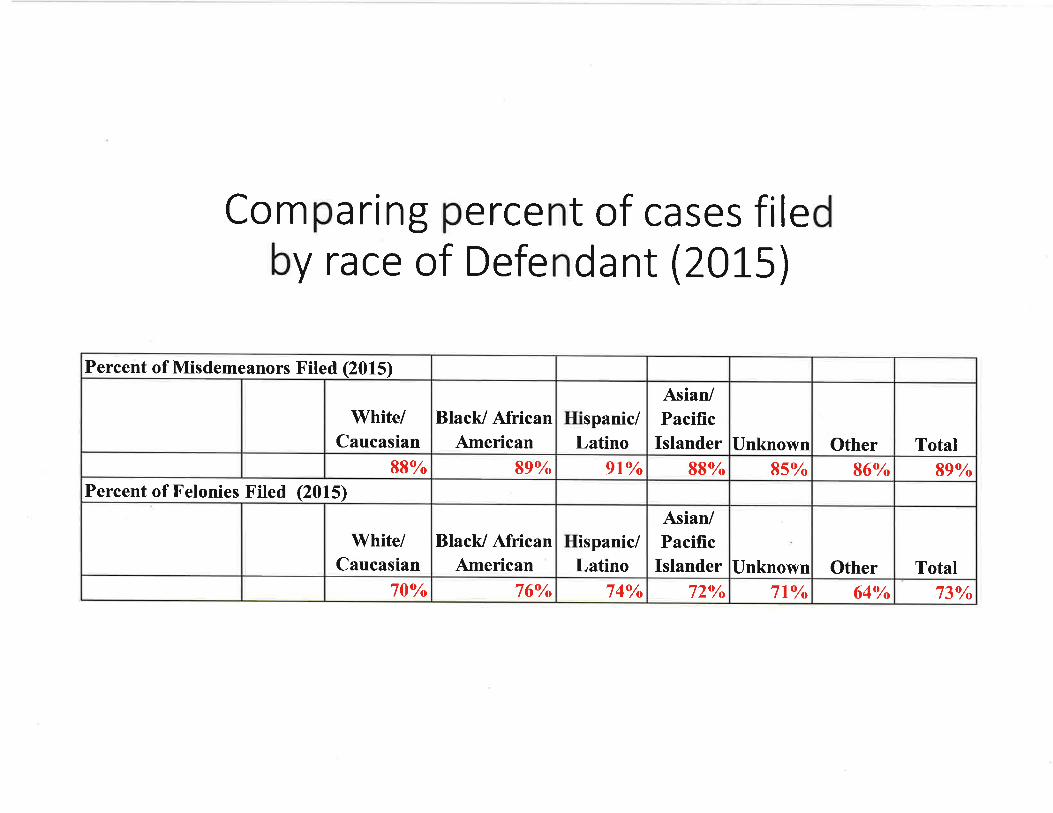
Our study found small differences in the filing rates of criminal cases against defendants ofdifferent races. The DA's Office files charges in about 89Yo of the misdemeanor cases reviewedand73% of felony cases reviewed regardless of the race of the suspect of the crime.
Yet there are higher percentages of Black/African American defendants and of Hispanic/Latinodefendants than those groups' percentages of the population, and a lower percentage ofAsian/Pacific Islander defendants. The representation of White/Caucasions in the population ofcriminal defendants most closely matched that group's part of the County's racial makeup.Those differences in prosecutions are important to recognize so that we can begin to address as a
broader community of law enforcement, educators, and community organizations the fact thatthe race of those arrested for crimes in our County does not mirror the racial makeup of theCounty as a whole.
Is there racial unfairness in the way we prosecute criminal cases once they are filed?
As the next stqr in this effort to study Race and Prosecutions in the Count¡ and in partnershipwith BetaGov, a non-profit that helps governmentorganizations to study and address issues, theDA's Office will be reviewing and studying the myriad of decisions that are made after a case isfiled from how we make offers of resolution at early stages to the sentences lve recoÍrmend aftertrials.
ril'hy did you study Race and Prosecutions and what were you trying to find out?
This report is an effort to answer the questions the community has been asking and that we havebeen asking ourselves. We wanted to know - not estimate, not guess, not assume -how manypeople of diffsrent races and ethnic goups we are prosecuting. And we wanted to share thatinformation with the public.
Our ability to do this kind of study is relatively new. In2}ll, the Santa ClaraCounty DistrictAttorney's Office began entering the race and gender data received from police reports andbooking information into our electronic case management systøn for all felonies and mostmisderneanors. Before that, our knowledge of the race of adult criminal defendants was limitedto our own anecdotal knowledge and the more limited collection of that data on some teams likethe Family Violence Team.
Santa Clara County has studied race and the Juvenile Justice Syston annually since2012. Thisis an effort to take a similar lons of inquiry and analysis and turn it on ourselves to try to answera key set of questions about race and our prosecutions of adults. Of course, answering somequestions aþout race and prosecutions leads to the asking of more questions. This study is thebeginning of what will be an ongoing review of these issues.
3

Background:
Demoqraphic context:
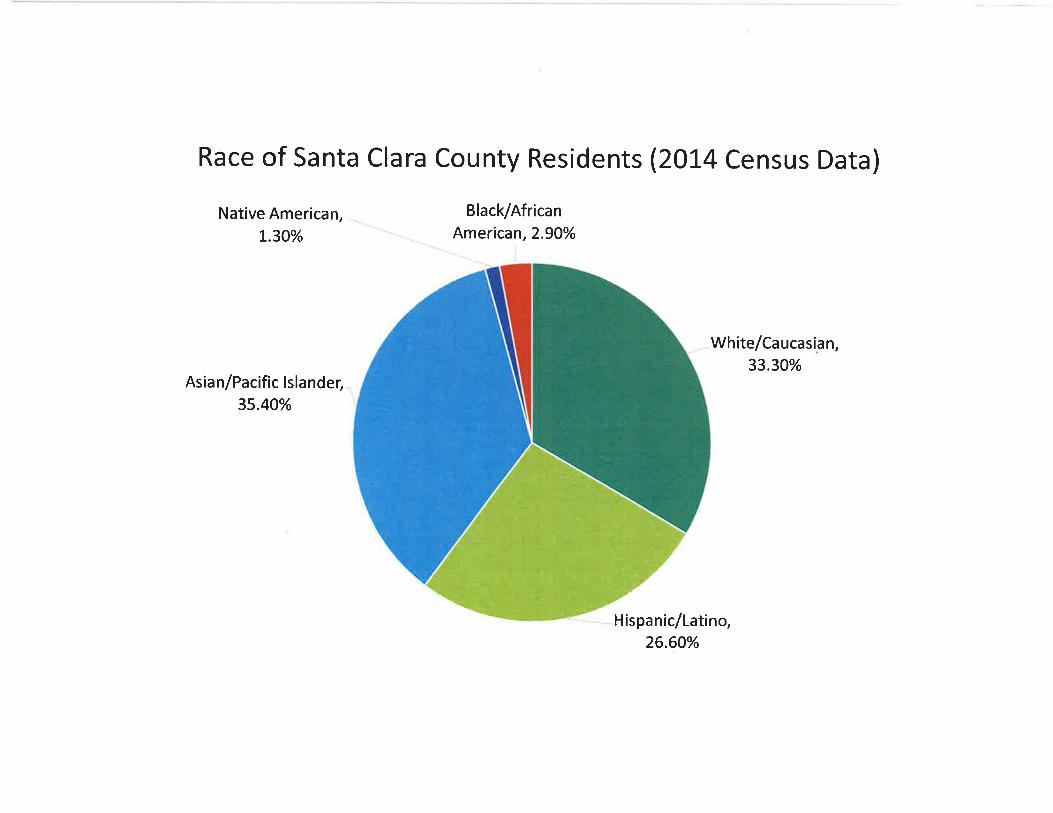
Currently, Santa Clara County's racial and ethnic breakdown is:
Race of Santa Clara County Residents(20L4 Census Data)
Black/Africa n America n, 2.90%Native American, L.3O%
Asian/Pacificlslandeç 35.40%
Wh¡te/Caucasian,33.30%
Hispanic/Latino,26.60%
4
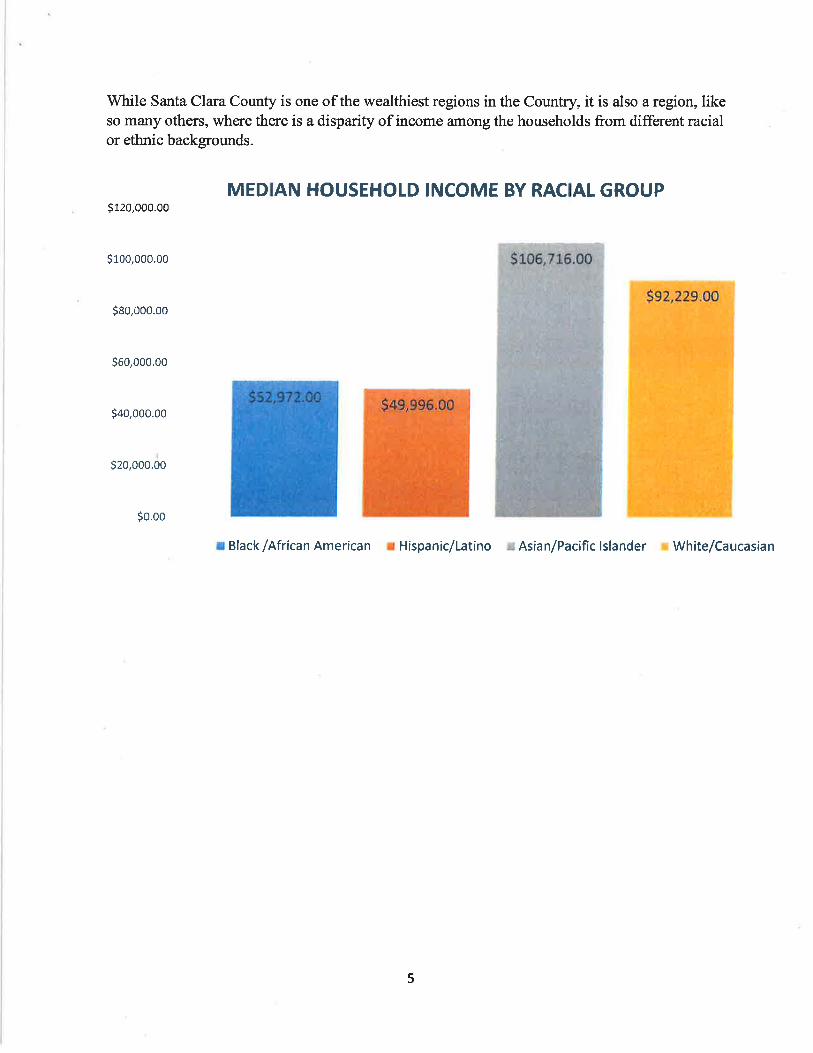
While Santa Clara County is one of the wealthiest regions in the Country, it is also a region, likeso many others, where there is a disparity of income rimong the households from different racialor ethnic backgrounds.
MEDIAN HOUSEHOTD INCOME BY RACIAL GROUPs120,000.00
s1o0,0oo.oo
s80,000.00
560,000.00
s40,000.00
s20,000.00
5o.oo
r Black /Atrican American r Hispanic/Latino r Asian/Pacific lslander r White/Caucasían
5
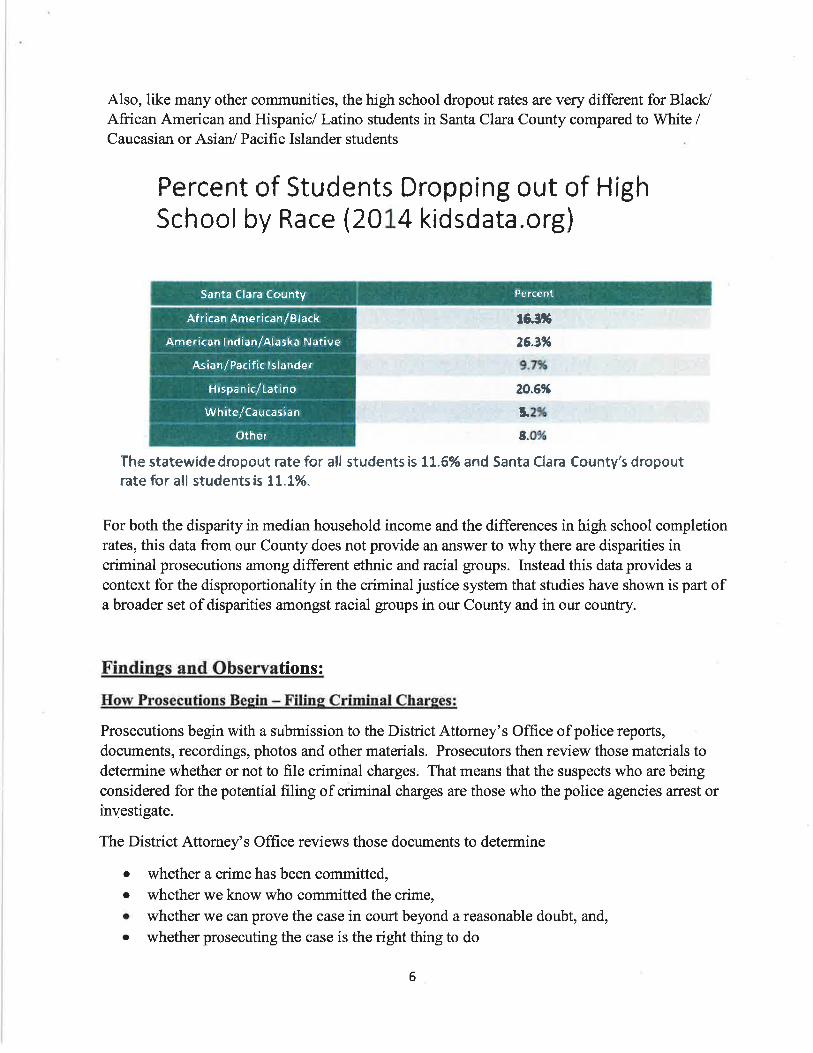
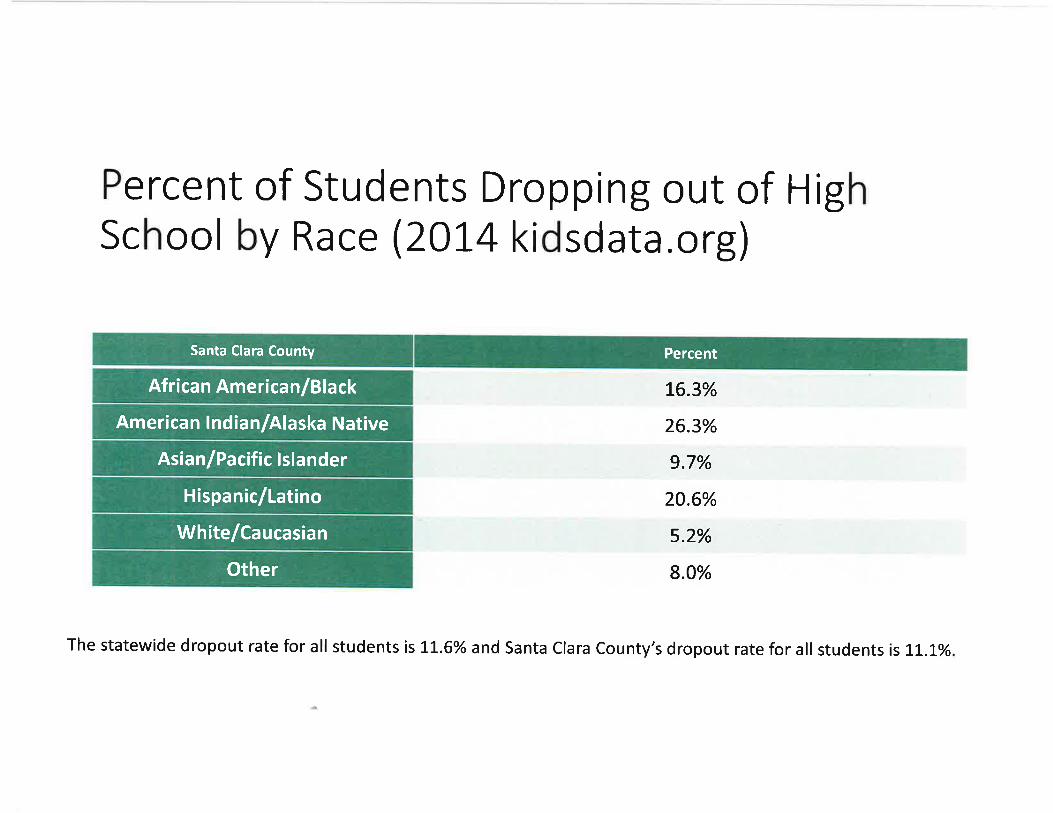
Also, like many other communities, the high school dropout rates are very different for Black/African American and Hispanic/Latino students in Santa Clara County compared to White /Caucasian or Asian/ Pacific Islander students
Percent of Students Dropping out of HighSchool by Race {2014 kidsdata.org}
r6.¡ls
r6.396
tñ20.69S
l'¡r8.016
The statewíde dropout rate for all students is 1!..6% and Santa Clar¿ Csunty's dropoutrate Sor all students is 11"19ú"
For both the disparity in median household income and the differences in high school completionrates, this data from our County does not provide an answer to why there are disparities incriminal prosecutions among different ethnic and racial groups. Instead this data provides a
context for the disproportionality in the criminal justice systøn that studies have shown is part ofa broader set of disparities amongst racial groups in our County and in our country.
Findinss and Observations:
How Prosecutions Begin - Filine Criminal Charges:
Prosecutions begin with a submission to the District Attorney's Office of police reports,documents, recordings, photos and other materials. Prosecutors then review those materials todetermine whether or not to file criminal charges. That means that the suspects who are beingconsidered for the potential frling of criminal charges are those who the police agencies arrest orinvestigate.
The District Attorney's Office reviews those documents to determine
o whether a crime has been committed,o whether we know who committed the crime,o whether we can prove the case in court beyond a reasonable doubt, and,o whether prosecuting the case is the right thing to do
6
Af rican Anrerican/Black
Amerlcan lnd¡õn/Alask¡ FJative
Asian/Pacific I slar¡de r
Hispanic/Latino
Whitc/Caucasian
Othcr
Pcrct ntSônta Clarô County
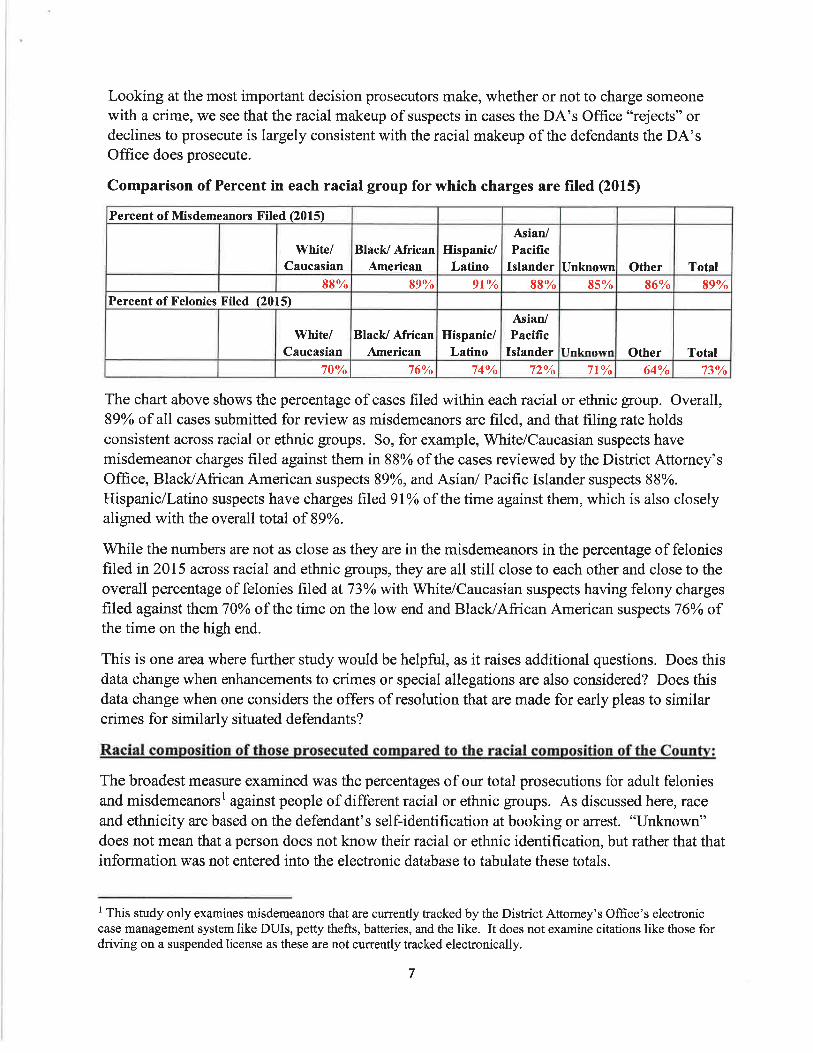
Looking at the most important decision prosecutors make, whether or not to charge someonewith a crime, we see that the racial makeup of suspects in cases the DA's Office "rejects" ordeclines to prosecute is largely consistent with the racial makeup of the defendants the DA'sOffice does prosecute.
ComparÍson of Percent in each racial group for which charges are filed (2015)
The chart above shows the percentage of cases filed within eachracial or ethnic group. Overall,89Yo of all cases submitted for review as misdemeanors are filed, and that filing rate holdsconsistent across racial or ethnic groups. So, for example, White/Caucasian suspects havemisdemeanor charges filed against them in 88% of the cases reviewed by the District Attorney'sOfftce, BlacVAfrican American suspects 89Yo, and Asian/ Pacific Islander suspects 88o/o.
Hispanic/Latino suspects have charges filed9l% of the time against them, which is also closelyaligned with the overall total of 89o/o.
While the numbers are not as close as they are in the misdemeanors in the percentage of feloniesfiled in 2015 across racial and ethnic groups, they are all still close to each other and close to theoverall percentage of felonies filed at 73Yo with White/Caucasian suspects having felony chargesfiled against thern 70%o of the time on the low end and Black/African American suspects 76Yo ofthe time on the high end.
This is one area where further study would be helpful, as it raises additional questions. Does thisdata change when enhancements to crimes or special allegations are also considered? Does thisdata change when one considers the offers of resolution that are made for early pleas to similarcrimes for similarly situated defendants?
Racial composition of those prosecuted compared to the racial composition of the Countv:
The broadest measure examined was the percentages of our total prosecutions for adult feloniesand misdemeanorsl against people of different racial or ethnic groups. As discussed here, race
and ethnicity are based on the defendant's selÊidentification at booking or arrest. "IJnknown"does not mean that aperson does not know their racial or ethnic identification, but rather that thatinformation was not entered into the electronic database to tabulate these totals.
I This study only examines misdemeanors that are currently tracked by the District Attorney's Office's electroniccase management system like DUIs, petty thefts, batteries, and the like. It does not examine cit¿tions like those fordriving on a suspended license as these are not currently tracked electronically.
7
Percent of Msdemeanors Filed (2015)
White/Caucasian
Black/ AfricanAmerican
Hispanic/Latino
Asian/Pacific
Islander Unknown Other Total88o/o 890Â 9lo/r 88Vo 85'^ 86f, 890
Percentof Felonies Filed (2015)
White/Caucasian
Black/ AfricanAmerican
HÍspanic/Latino
Asian/Pacifìc
Islander ÍT¡I¡nnwn Other Total70o/r 760/0 740Á 1t o,/ 7lo/o 64Yo 73o/o
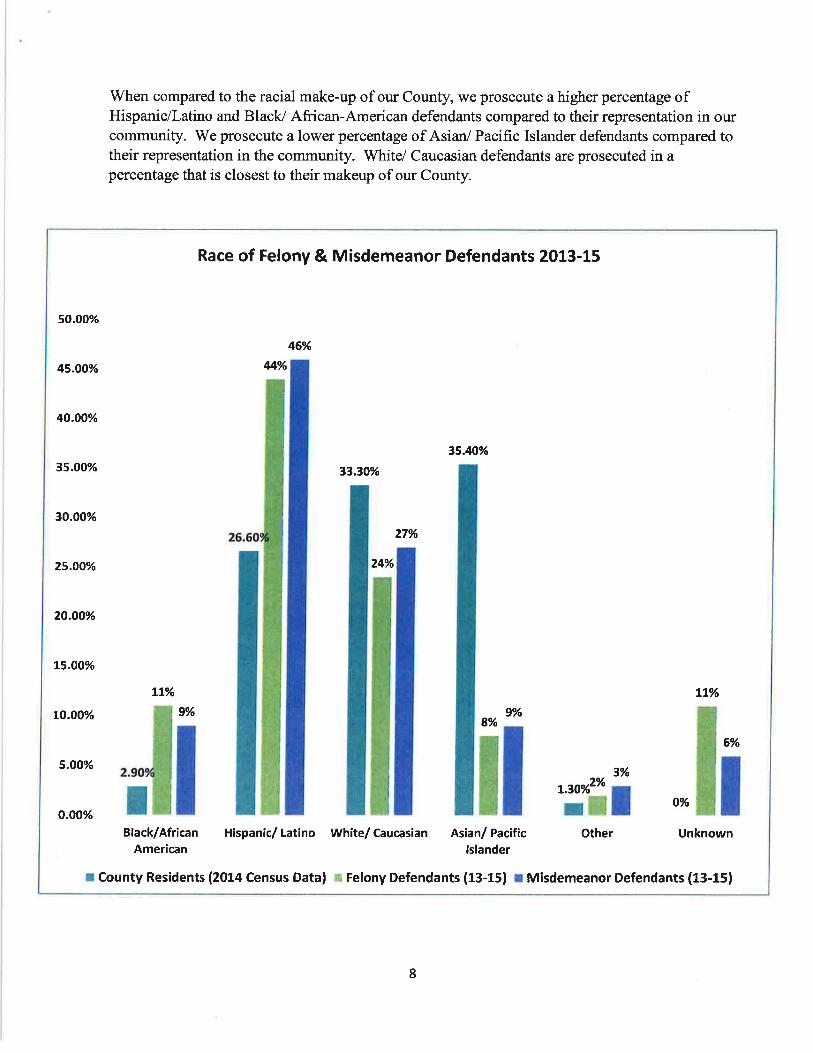
When compared to the racial make-up of our County, we prosecute a higher percentage ofHispanic/Latino and BlacV Afücan-American defendants compared to their representation in ourcommunity. We prosecute a lower percentage of Asian/ Pacific Islander defendants compared totheir representation in the community. White/ Caucasian defendants are prosecuted in apercentage that is closest to their makeup of our County.
Race of Felony & Misdemeanor Defendants 2013-15
50,oo%
460/o
45.OO% 44%
4O.OOo/o
35.40%3s.o0% 33.30%
30.oo%27%
25.OO% 24o/o
2O.OOo/o
t5.00%
tlYo tt%
to.00% 9% 9%8%
I6%
5.00%3% ILsov?%rI o%
o.oo%
Black/AfricanAmerican
Hispanic/ Latino White/ Caucasian Asian/ Pacificlslander
Other Unknown
r County Residents (2014 Census Data) r Felony Defendants (13-15) I Misdemeanor Defendants (13-15)
I
This kind of racial disparity in the criminal justice system is not unique to Santa Clara County.For example, a study released in2015 showed that in San Francisco County,BlacV AfricanAmericans made up 6Yo of County residents, but comprised 40o/o of those convicted of crimes2.
Could the dispariW in nrosecutions be due to adults from other counties with differentracial makeups comins to commit crimes in Santa Clara Countv?
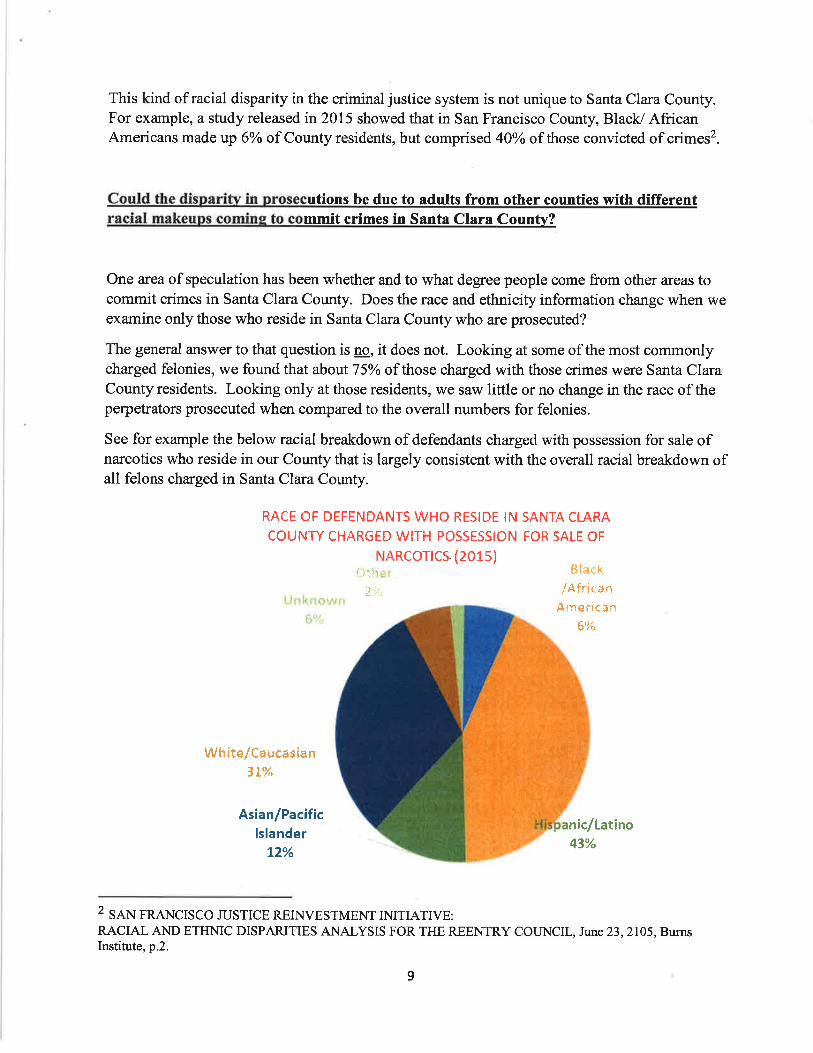
One area of speculation has been whether and to what degree people come from other areas tocommit crimes in Santa Clara County. Does the race and ethnicity information change when weexamine only those who reside in Santa Clara County who are prosecuted?
The general answer to that question is no, it does not. Looking at some of the most commonlycharged felonies, we found that about 75Yo of those charged with those crimes were Santa ClaraCounty residents. Looking only at those residents, we saw little or no change in the race of theperpetrators prosecuted when compared to the overall numbers for felonies.
See for example the below racial breakdown of defendants charged with possession for sale ofnarcotics who reside in our County that is largely consistent with the overall racial breakdown ofall felons charged in Santa Clara County.
RACE OF DEFËNDANTS WHO RESIDE IN SANTA CLARA
COUNTY CHARGED WITI{ POSSESSION FOR SALF OF
NARCOTTCS {20ls}{ }tircr tlack
lAfri*anAmerican
6"/-
'\ii/L /t\
iJtti<.¡tn,',¡r¡
6ól'
Wh¡te/Caucasian3tolo
Asian/Pacificlslander
L2%
nic/Latino43%
2 SAN FRANCIsco JUSTICE REINVEsTMENT IMTIATIVE:RACIAL AND ETHMC DISPARITIES ANALYSIS FOR THE REENTRY COUNCIL, June 23,2105, BurnsInstitute, p.2.
9
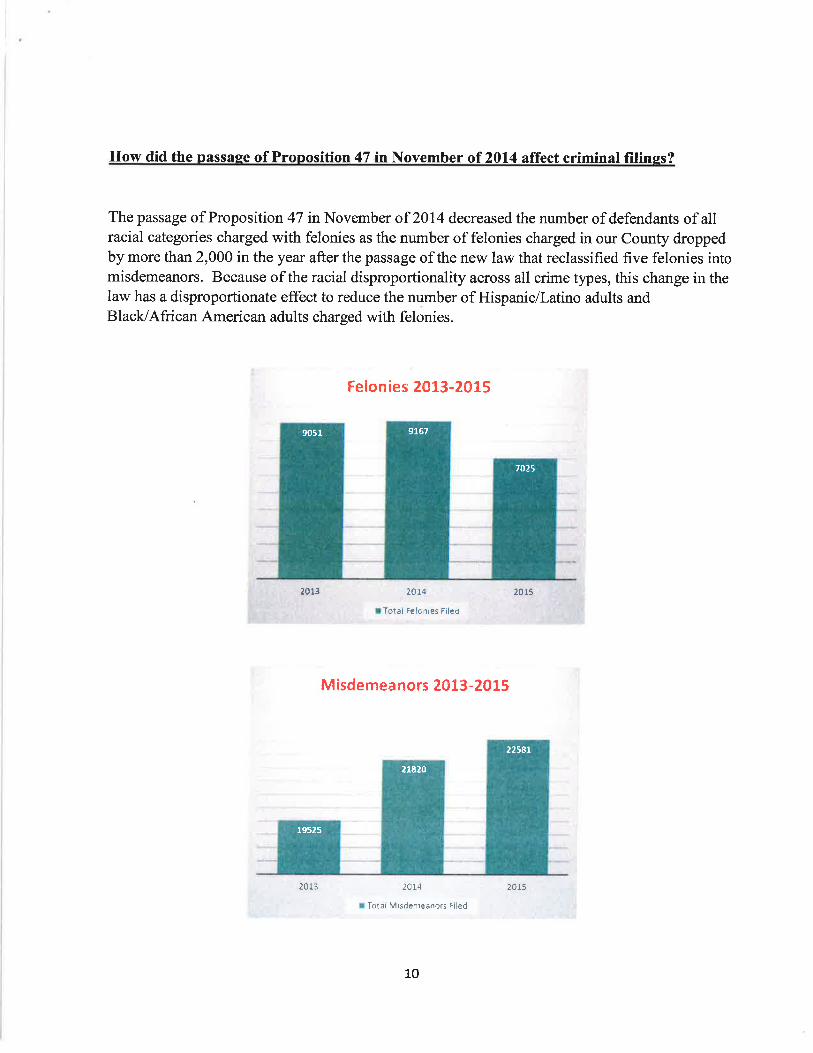
How did the oassase of Pronosition 47 in November of 20"1,4 affect criminal filinss?
The passage of Proposition 47 in November of 2014 decreased the number of defendants of allracial categories charged with felonies as the number of felonies charged in our County droppedby more than 2,000 in the year after the passage of the new law that reclassified five felonies intomisdemeanors. Because of the racial disproportionality across all crime types, this change in thelaw has a disproportionate effect to reduce the number of HispaniclLatino adults andBlack/African American adults charged with felonies.
Felonies 2013-2015
?013 2C:4
! Tôral t€lonies F¡lÊd
2015
Misdemeanors 2013-2015
20t4
r Total Misdênleåncrs Fiied
7Û2t
9051 9167
2182{)
19525
2254r
201.3
10
20:t5
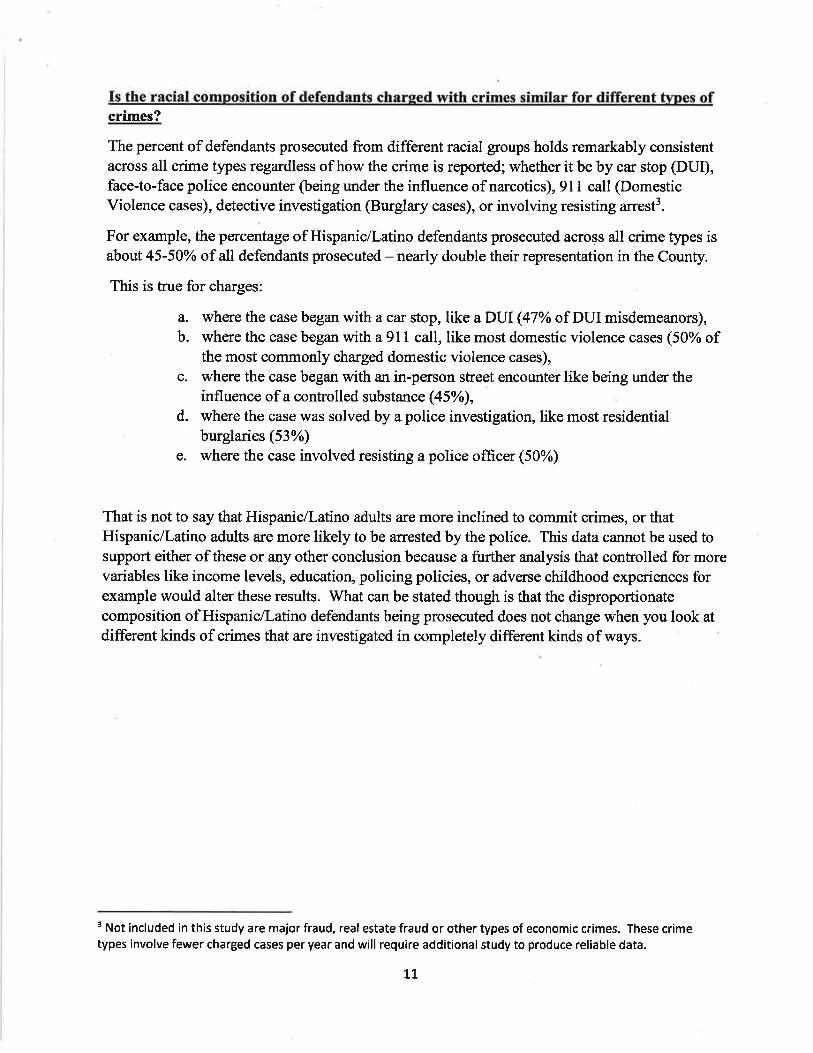
fs the racial composition of defendants charqed with crimes similar for different types ofcrimes?
The percent of defendants prosecuted from different racial groups holds rernarkably consistontacross all crime types regardless of how the crime is reported; whether it be by car stop (DUI),face-to-face police encounter (being under the influence of narcotics), 911 call (DomesticViolence cases), detective investigation (Burglary cases), or involving resisting arrest3.
For example, the percentage of Hispanic/Latino defendants prosecuted across all crime þpes isabout 45-50% of all defendants prosecuted - nearly double their representation in the County.
This is true for charges:
a. where the case began with a car stop, like a DUI (47% of DUI misdøneanors),b. where the case began with a 911 call, like most domestic violence cases (50% of
the most commonly charged domestic violence cases),
c. where the case began with an in-person street encounter like being under theinfluence of a controlled substance (45Yo),
d. where the case was solved by a police investigation, like most residentialburglaries (53o/o)
e. where the case involved resisting a police officer (50%)
That is not to say that Hispanic/Latino adults are more inclined to commit crimes, or thatHispanic/Latino adults are more likely to be arrested by the police. This data cannot be used tosupport either of these or any other conclusion because a further analysis that controlled for morevariables like income levels, education, policing policies, or adverse childhood experiences forexample would alter these results. \Vhat can be stated though is that the disproportionatecomposition of HispaniclLatino defendants being prosecuted does not change when you look atdifferent kinds of crimes that are investigated in completely different kinds of ways.
3 Not included in this study are major fraud, real estate fraud or other types of economíc crimes. These crimetypes involve fewer charged cases per year and will require additional study to produce reliable data.
TL
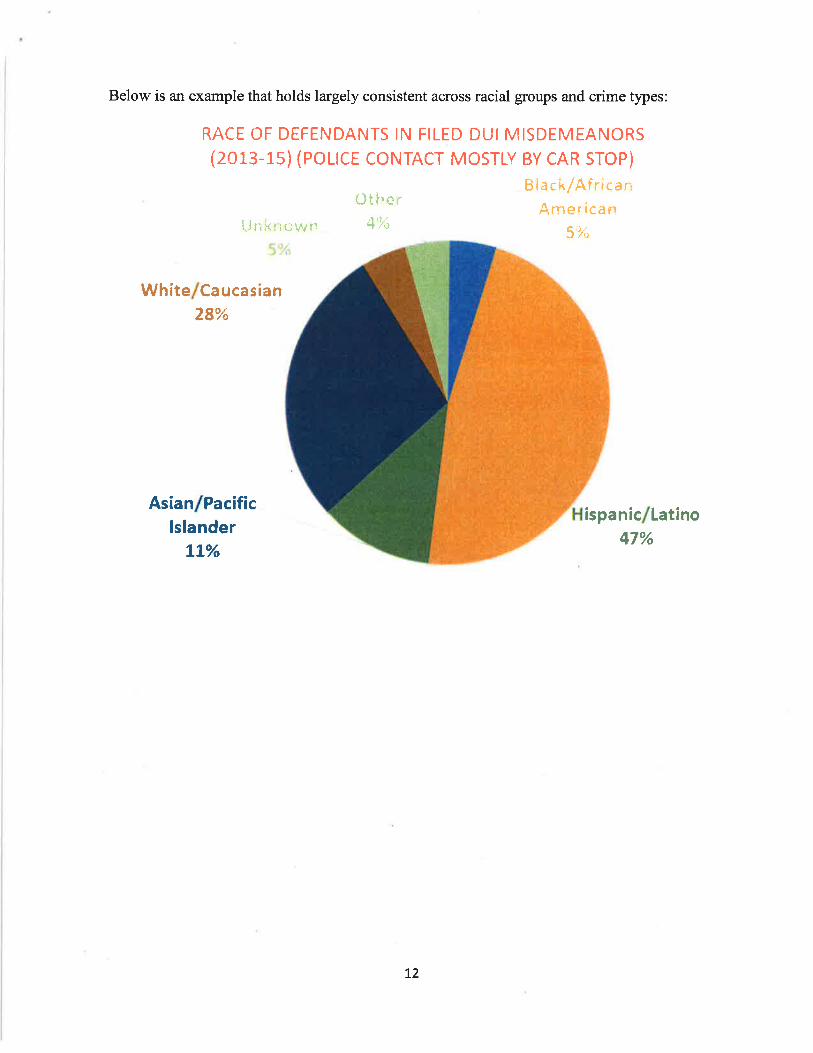
Below is an example that holds largely consistent across racial groups and crime types:
RACE OF DEFENDANTS IN FILED DUI MISDËMEANCIR5
{2013-1s} {POLTCE CONTACT MOSTLY By CAR STOP}
{ithsr Biack/Af ricanAmer ican
t""ln k tt t,w rl 4'X, S%
White/Caucasi:¡n28t/o
Asian/Pacificlslander
LL%
ispaniclLatino47%
L2
Next Steps:
a
Examine, in partnership with a non-profit organization BetaGov, other decision pointslike the sentences prosecutors recommend for similarly situated defendants (similarcrimes, similar criminal histories) to see how and if race is affecting or not affecting those
decisions.
Improve collection of data. Missing from this data for example is the race of defendants
charged with cases filed by a police officer citation like, driving on a suspended license,
even though citations make up by our estimates as many as 25Yo of all cases prosecutedby the DA's Office.Analyze this data over time to see how it may change, and use this study as a benchmarkfor future analysis.
Improve our outreach to Asian communities in our County, so that we are making sure
that the relatively low prosecution of Asian defendants is not related to a reluctance toreport crimes to the police.
Share this information with the public to get different perspectives on what this data
means, and on ways to improve fairness in criminal justice.
Conclusion
This study shows what everyone involved in the criminal justice systern in Santa ClaraCounty knew in an anecdotal way - that there were more Hispanic/Latino and moreBlack/African American defendants than reflect their representation in the population, and fewerAsian/Pacific Islander defendants. The study gives hard numbers to that general feeling and
shows that the disproportionality cannot be explained by people coming from other counties tocommit crimes. The study shows that for the most important decision prosecutors make, thedecision to file criminal charges, the race of the suspect of the crime has not been a significantfactor, and it shows that the racial composition of defendants charged with crimes is largelyconsistent across all types or crime.
This study is a start of what will be a periodic and more complete review of race andprosecutions, and the decisions that prosecutors make.
More study is needed, more input from the community is needed, and a continued self-examination on these and other questions. We are committed to all of these and to the sharing ofthis information with the public. Most importantly, we are committed to working harder toensure the fair administration ofjustice for everyone in Santa Clara County.
a
a
a
L3

APPENDIX SHOWING THE COMPLETE RESULTS OF THE STUDY
1,4
Race and ProsecutionsSanta Clara County 201 3-L5
Santa Clara County District Attorney's Office
Demographic Context
The following slides address demographic, educational, income andimmigration issues that affect Santa Clara County.
Race of Santa Clara County Residents (2014 Census Data)
Native American,1.30%
Asian/Pacific lslandeI3s.40%
Black/AfricanAmerican,2.90%
White/Caucasian,33.30%
H ispa nic/Latino,26.60%
800,fDo
7(x),000
600,(x)0
s00,000
400,0(X)
300,000
2(x,,000
1ü),000
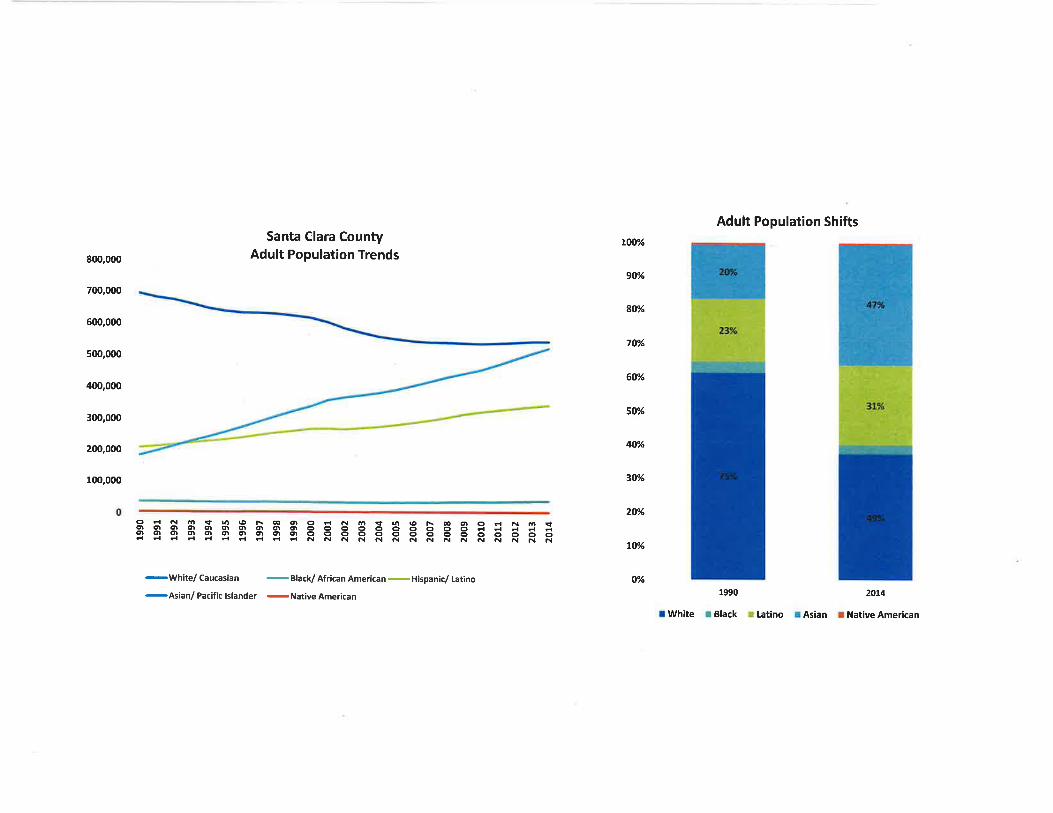
Santa Glara CountyAdult Population Trends
9 = !l tll s t!) g F gg qr g É !! o !' ¡4 @ À o o o d d ó <ro q o o o oo o qr oo c' o o o c' o o o cl - H ¡ É do! o! O o o oì o o O o! (' o õ õ Õ õ õ õ õ õ ö ö ö o odHdddddddddññññññññññññññ
-Wh¡te/ Caucasian
- Black/ Afr¡can Amer¡can
-Hispanic/ Lat¡no
-As¡an/
pacilic tslander
-Nat¡ve American
Adult Population Shifts
1990 20'4
I Wh¡te I Black r lât¡no ¡ As¡an t Nat¡ve American
ro0%
9V/.
8V/o
7Olo
60%
50%
q%
30%
20%
L0%
o%
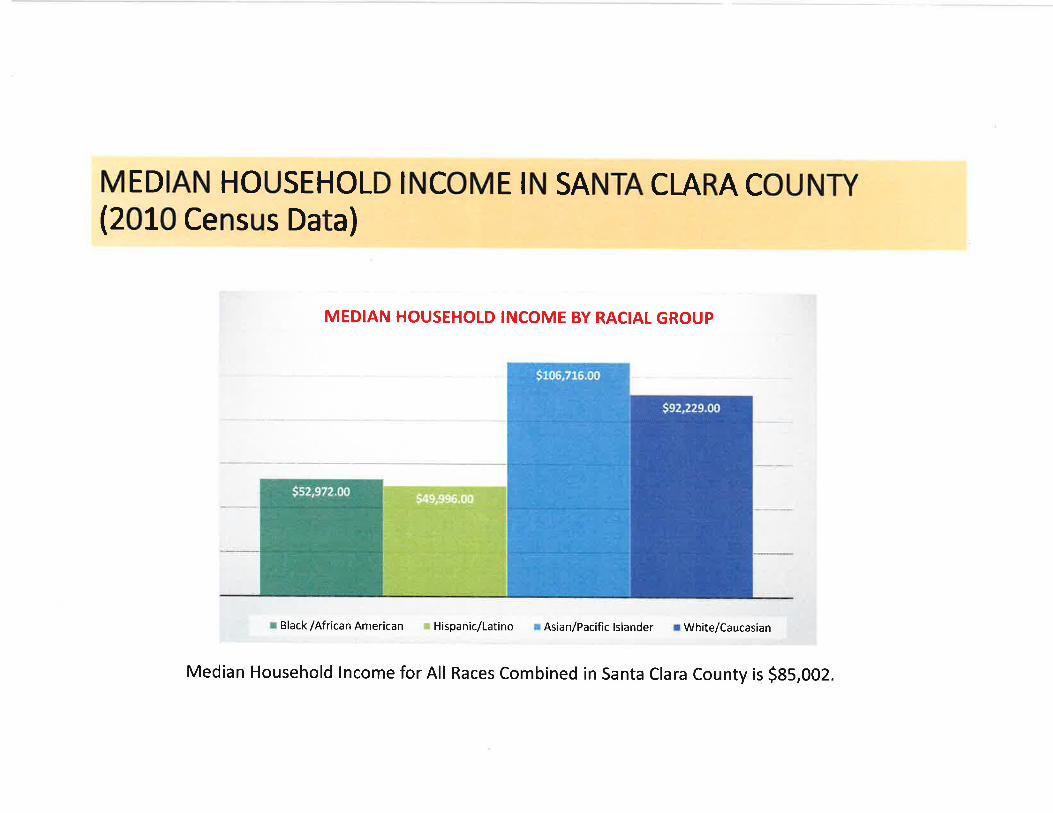
MEDIAN HOUSEHOLD INCOME IN SANTA CLARA COUNTY(2010 Census Data)
MEDIAN HOUSEHOLD INCOME BY RAC¡AL GROUP
r Black /African American I Hispanic/Latino r Asian/Pacific lslander r Wh¡te/Caucas¡an
Median Household lncome for All Races Combined in Santa Clara County ¡s 585,002.
Percent of Students Dropping out of HighSchool by Race (2014 kidsdata.org)
L6.3%
26.3%
9.7%
20.6%
s.2%
8.0%
The statewide dropout rate for all students ¡s LL.6% and Santa Clara County's dropout rate for all students is j.j..1%
Santa Clara County Percent
African American/Black
American lndian/Alaska Native
Asia n/Pacific lslander
Hispanic/Latino
White/Caucasian
Other

COUNTRY OF ORIGIN OF IMMIGRANT POPULATIONIN SANTA CLARA COUNTY
(37 .tyo of Santa Clara County Residents were born in another country)(2010 Study by USC)
SANTA CLARA COUNTY
Mexico
0t!'ler34.%
23%
VietnamL4%
China8%
Philippines9%
lndiat2%
F il ASCS
The following slides address the race of defendants and the number ofcases in filed and non-filed felonies and misdemeanors from 2OI3-20L5, with additional information about the most recent yea r,2OL5.
By Race 201-3-15edced and Non-F
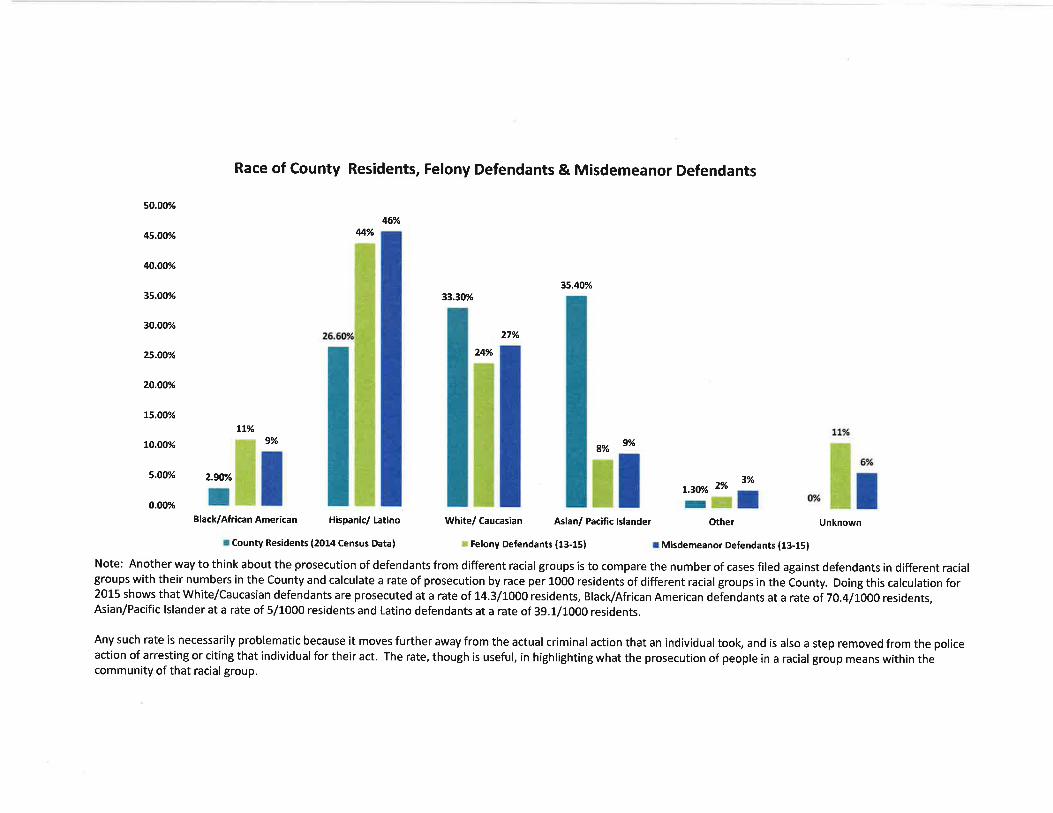
Race of county Residents, Felony Defendants & Misdemeanor Defendants
50.00%
45.00%
40.oo%
35.OO%
30.oo%
25.OO%
20.oo%
L5.OO%
to.oo%
5.00%
o.o0%
46%
tt%9%
2.90%
Black/AfricanAmerican H¡span¡c/lât¡no
r County Res¡dents (2014 Census Data)
White/ Caucasian Asian/ Pacific lslander
r Felony Defendants (13-15)
4%
35.4V.?330%
27%
24%
a% 9%ll 'y3lOther
It%
,. liUnknown
r M¡sdemeanor Defendants (13-15)
Note: Another way to think about the prosecution of defendants from different racial groups is to compare the number of cases filed against defendants in different racialgroups with their numbers in the County and calculate a rate of prosecution by race per 1000 residents of different racial groups in the County. Doing this calculation for2015 shows that White/Caucasian defendants are prosecuted at a rate of 14.3/1000 residents, Black/African American defendants at a rate of 70.4/LOO1 residents,Asian/Pacific lslander at a rate of 5/1000 residents and Latino defendants at a rate of 39.1/1000 residents.
Any such rate is necessarily problematic because it moves further away from the actual criminal action that an individual tooþ and is also a step removed from the policeaction of arresting or citing that individual for their act. The rate, though is useful, in highlighting what the prosecution of people in a racial group means within thecommunity of that racial group.
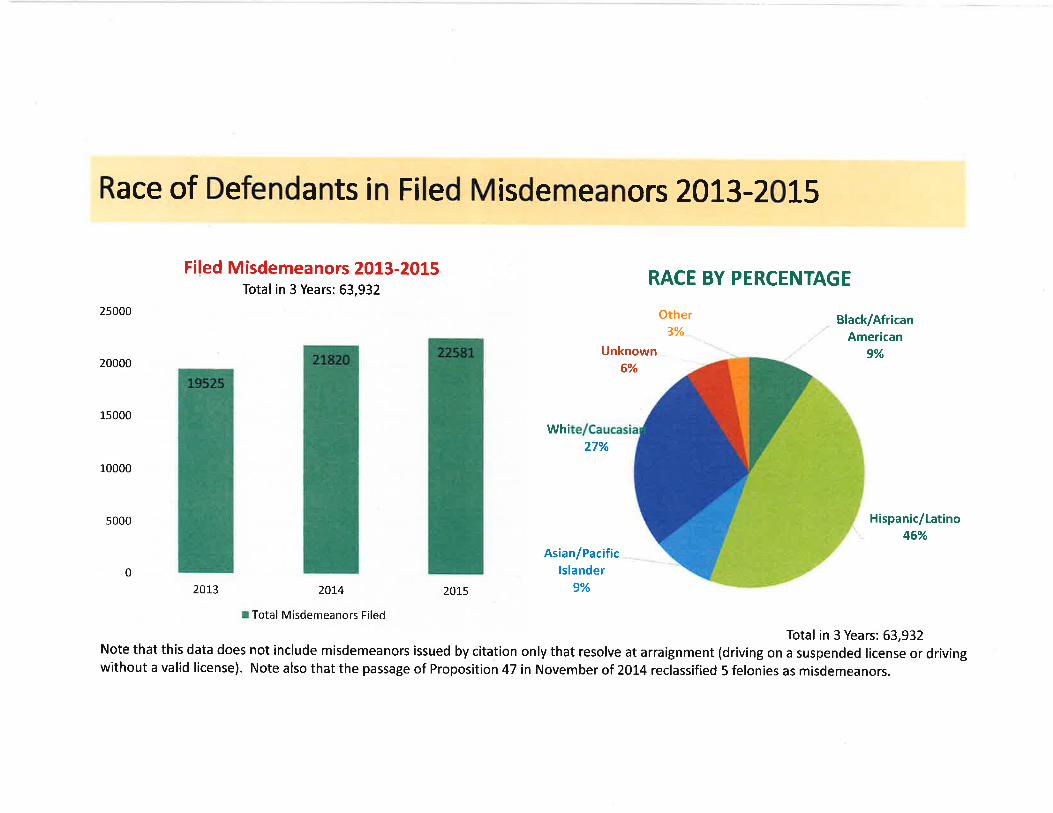
Race of Defendants in Filed Misdemeanors 2013-2015
Filed Misdemeanors 2013-2015Total in 3 Years: 63,932
RACE BY PERCENTAGE
2s000
20000
1s000
10000
5000
Other3%
Black/AfricanAmerican
9%Unknown .
6%
wh¡27%
Asian/Pacificlslander
9%
Hispanic/Latino46%
0
2013 2014
I Total Misdemeanors Filed
2075
Total in 3 Years: 63,932Note that this data does not include misdemeanors issued by citation only that resolve at arraignment (driving on a suspended license or drivingwithout a valid license). Note also that the passage of Proposition 47 in November of 20L4 reclassified 5 felonies as misdemeanors.
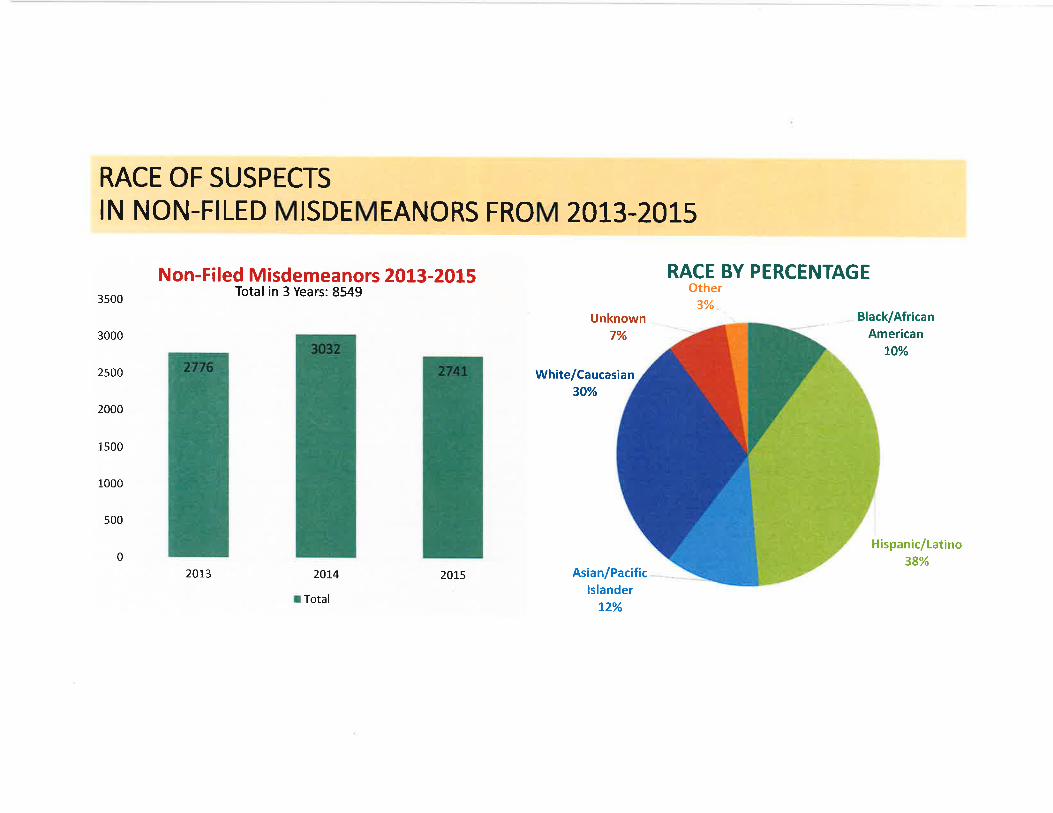
RACE OF SUSPECTS
IN NON-FILED MISDEMEANORS FROM 2AT3.2015
Non-Filed Misdemeanors 2013-2015Total in 3 Years: 8549
RACE BY PERCENTAGEOther
3500
3000
2500
2000
1500
1000
s00
3o/"
Unknown7%
Asian/Pacificlslander
l2o/o
. Black/AfricanAmerican
10%
White/Caucasian30%
0fiispanic/Latino
38%2013 2014
I Total
2015
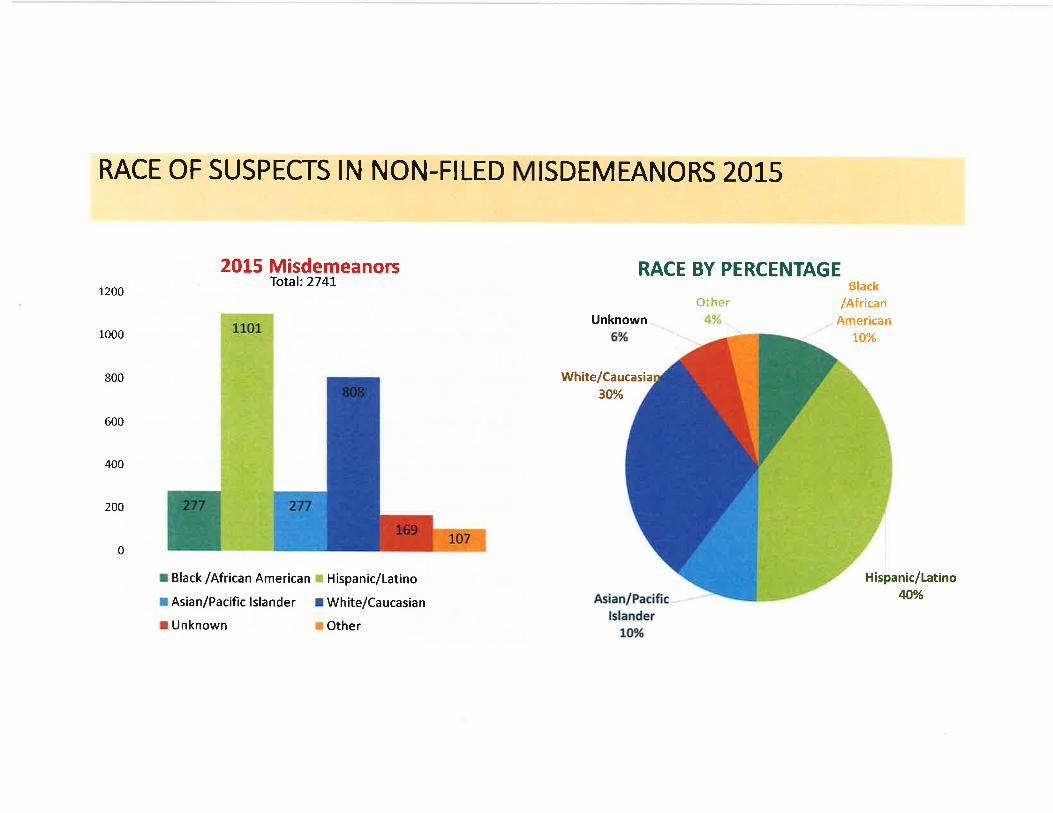
RACE OF SUSPECTS IN NON-FILED MISDEMEANORS 2OT5
2015 MisdemeanorsTotal:274t
RACE BY PERCENTAGEI200
1000
800
600
400
200
0therBlack
y'African
AmericanLO%
Unknown
White/Caucasia30%
0
r Black /African American r Hispanic/Latino
r Asian/Pacific lslander r White/Caucasian
I Unknown r Other
Hispanic/Latino40%
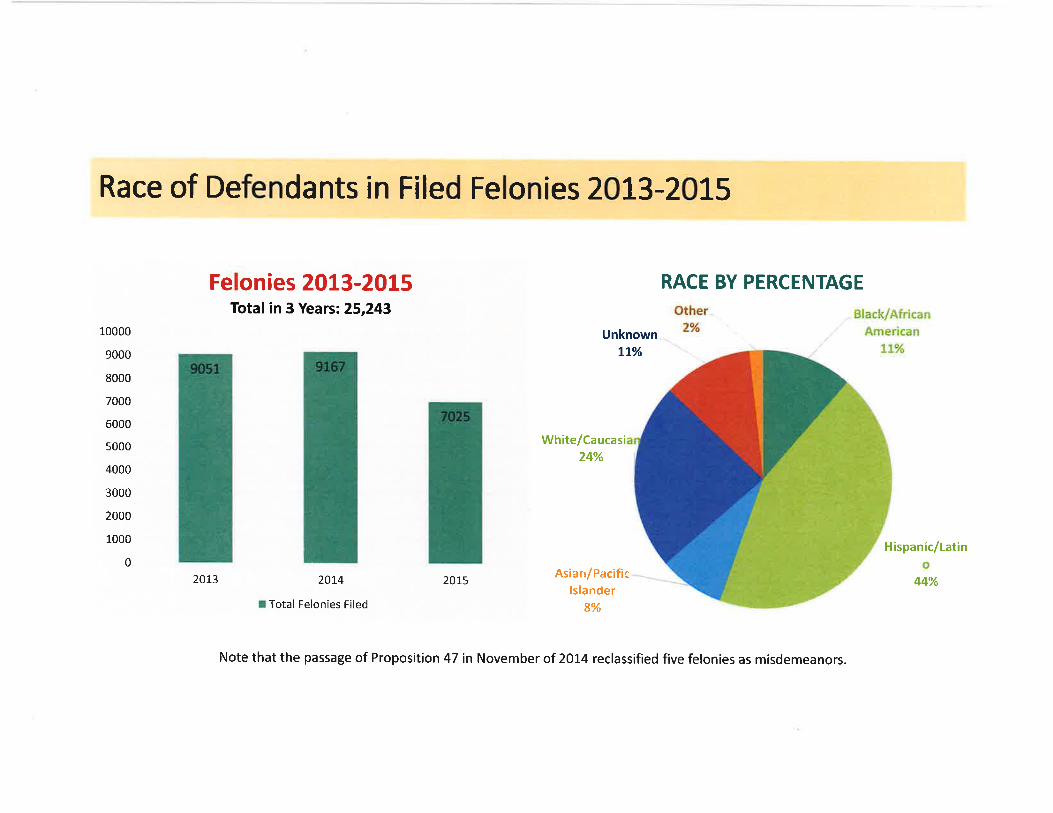
Race of Defendants in Filed Felonies 2OL3-2015
Felonies 2013-2015Total in 3 Years: 25,243
RACE BY PERCENTAGE
L0000
9000
8000
7000
6000
5000
4000
3000
2000
1000
0
Unknowntlo/o
20L3
White/Caucasi24%
Asian/Pacificlslander
8%
Hispanic/Latin
44%201520L4
I Total Felonies Filed
Note that the passage of Proposition 47 in November of 2Ot4 reclassified five felonies as misdemeanors.
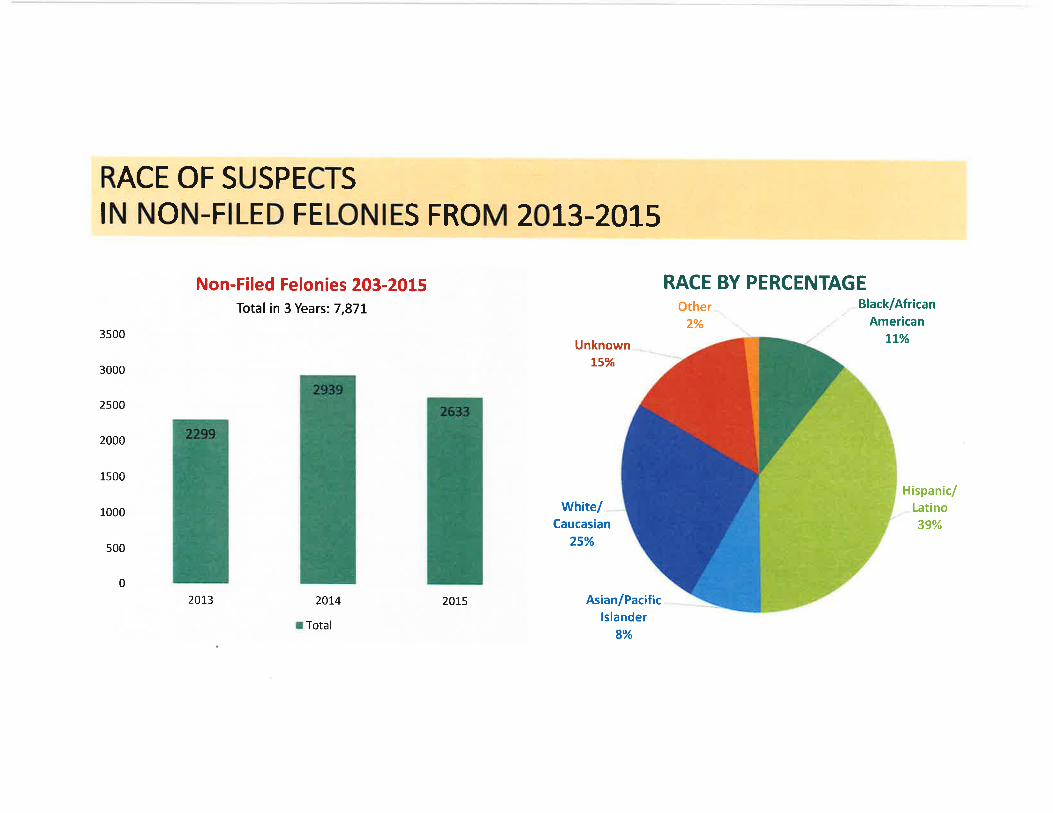
RACE OF SUSPECTSIN NON-FILED FELONIES FROM 2013-2015
Non-Filed Felonies 203-2015Total in 3 Years: 7,871
RACE BY PERCENTAGE
3500
3000
2500
2000
1500
1000
500
Unknown
White/Caucasian
25%
t5%
Other .
2%
Black/African" American
tL%
Hispanicy'Latino39%
0
201,3 2014
I Total
201,5 Asian/Pacificlslander
8%

RACE OF SUSPECTS ]N NON-FILED FELONIES 2015
2015 FeloniesTotal:2633
RACE BY PERCENTAGE
1200
1000
800
600
400
200
Unknown9%
Other3a/o
Black
/African, - American
LL%
White/Casian24%
c/Latino43%
0
I Black /African American r Hispanic/Latino
r Asian/Pacific lslander r Wh¡te/Caucasian
I Unknown r Other
Asian/Pacificlslander
to%
Comp ari ng percent of cases fi ledby race of Defendant (2015)
Total890Â
Total73o/o
Other86'/"
Other640Á
Unknown85o/o
Unknown7lo/o
Asian/Pacifïc
Islander88%
Asian/Pacific
Islander72o/o
Hispanic/Latino
9lo
Hispanic/Latino
74o/o
Black/ AfricanAmerican
890Á
Black/ AfricanAmerican
760/"
Percent of Misdemeanors Filed (2015)
White/Caucasian
88%Percent of Felonies Filed (201s)
\Mhite/Caucasian
70o/o
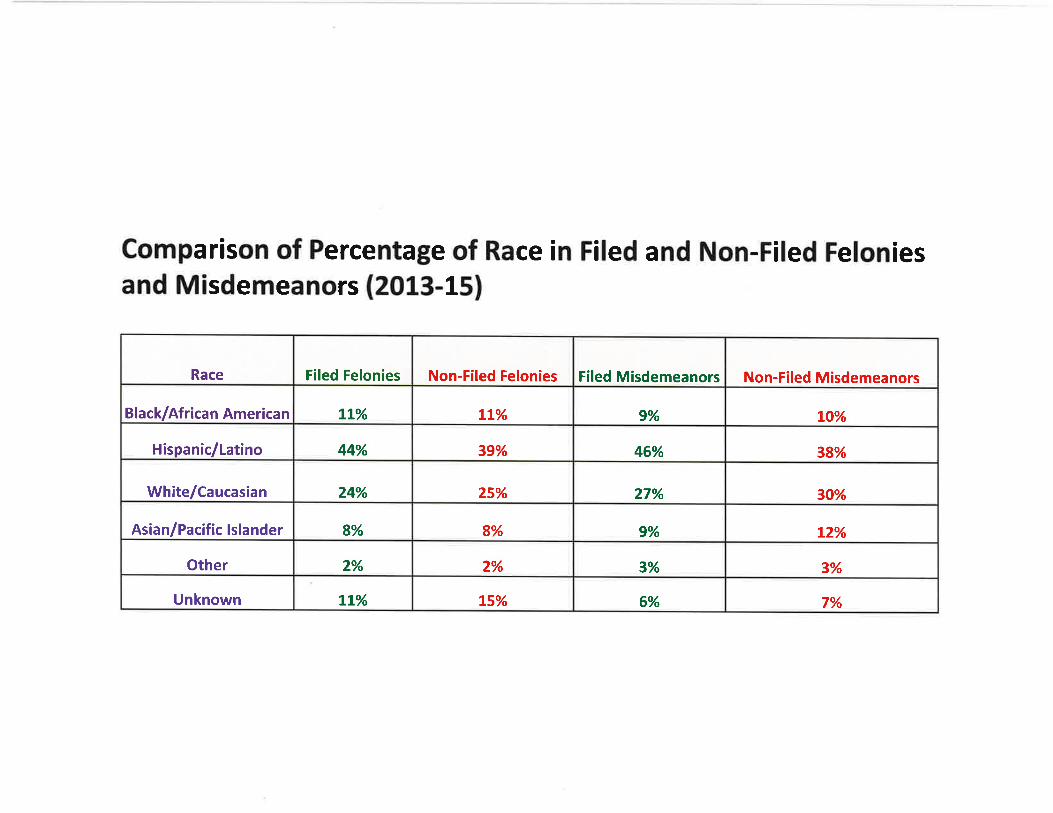
Comparison of Percentage of Race in Filed and Non-Filed Feloniesand Misdemeanors (2013-15)
Non-Filed Misdemeanors
LO%
38%
30%
L2%
3%
7%
Filed Misdemeanors
9%
46%
27%
9%
3%
6%
Non-Filed Felonies
LL%
39%
25%
8%
2%
t5%
Filed Felonies
LL%
44o/"
24%
8%
2%
Lt%
Race
Black/African American
Hispanic/Latino
White/Caucasian
Asian/Pacific lslander
Other
Unknown
The following slides address different crime typesthat the District Attorney's Office prosecutes a ndexamines the race of the defendants prosecutedacross different crime types from 2013-1-5.
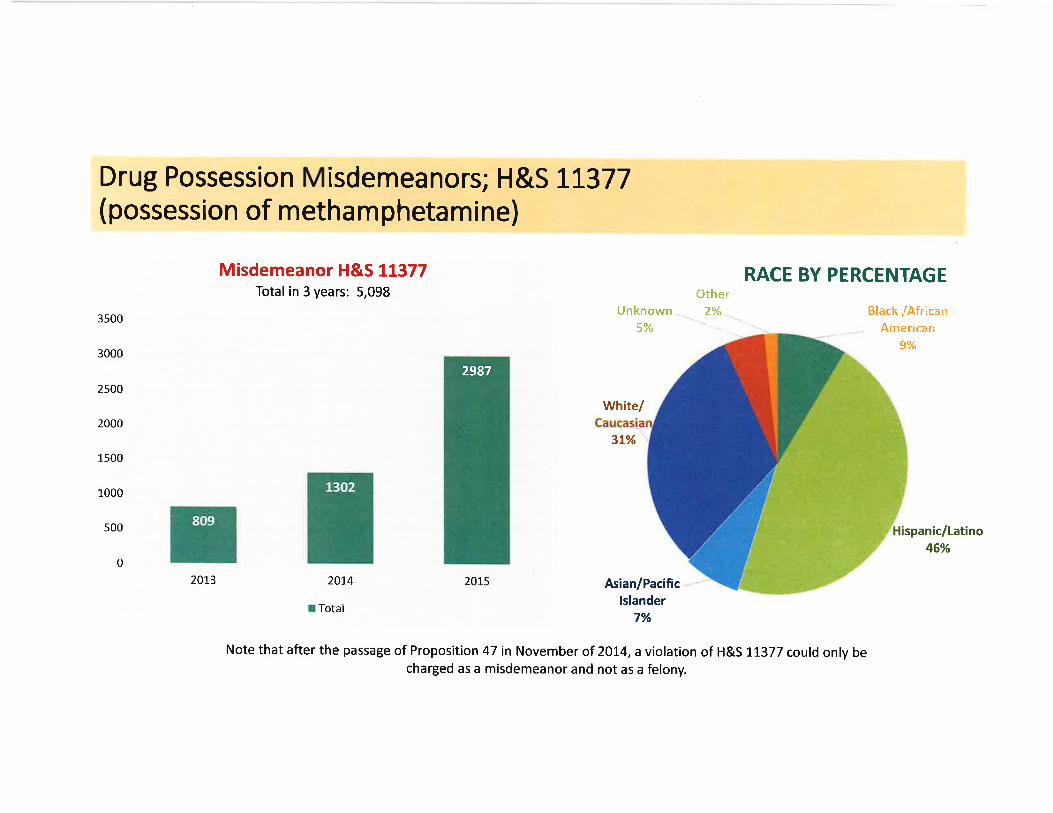
Drug Possession Misdemeanors; H&S IL377(possession of methamphetamine)
Misdemeanor H&S L1377Total in 3 years: 5,098
RACE BY PERCENTAGE0ther
2%3500
3000
2500
2000
1500
1000
Unknown5%
White/
3t%
Asian/Pacificlslander
7%
Black /AfricanAmericar¿
9%
s00
0
spanic/Latino46%
2013 2014
r Total
2075
Note that after the passage of Proposition 47 in November of 2OI4, a violation of H&S 11377 could only becharged as a misdemeanor and not as a felony.
2987
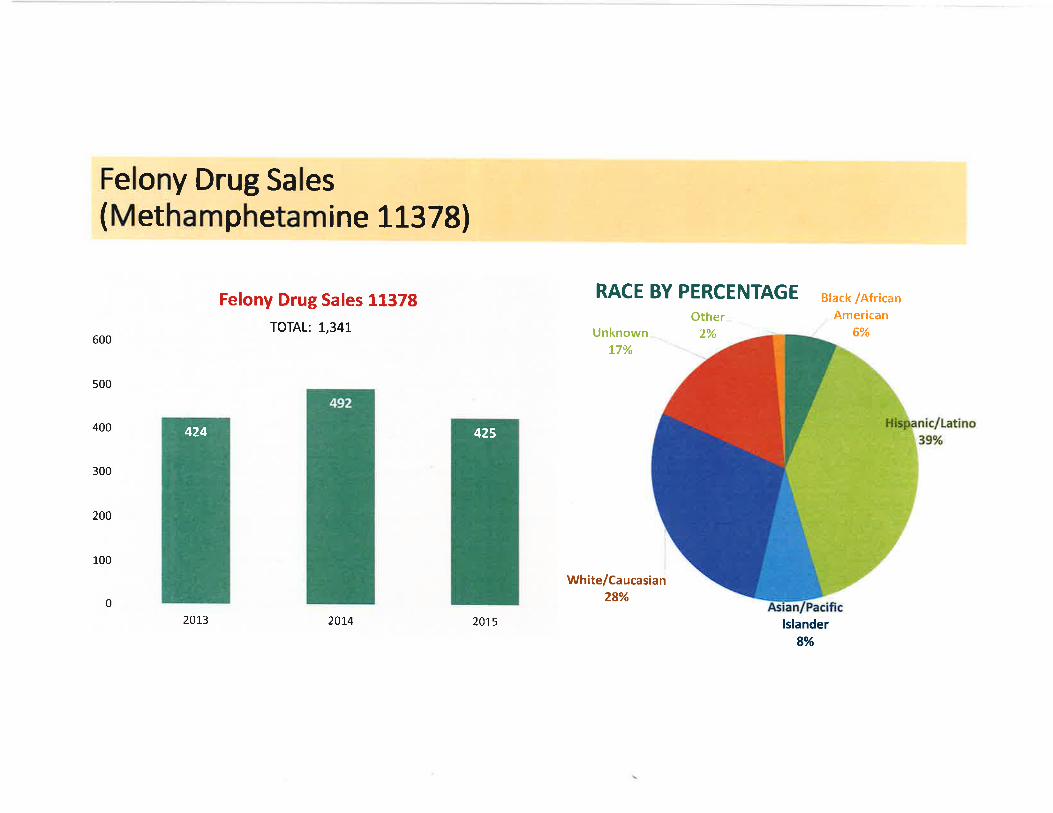
Felony Drug Sales( Methamphetamine 113 7Sl
Felony Drug Sales 11378TOTAL: 1,341
RACE BY PERCENTAGE
UnknownL7%
0ther1t/¿/a
Black /AfricanAmerican
' 6yo600
500
400
300
200
100 i
I
White/Caucasian28%0
2013 2014 2015 lslander8o/o
425424
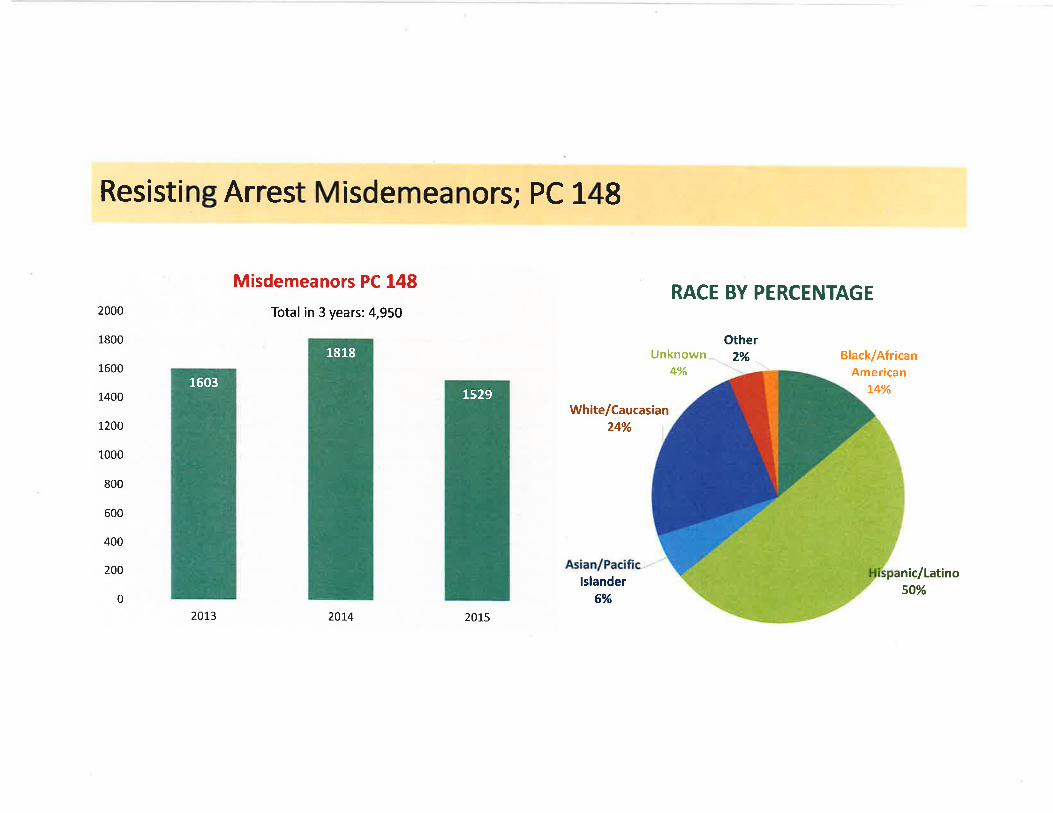
Resisting Arrest Misdemeanors; PC 148
Misdemeanors PC 148
Total in 3 years: 4,950RACE BY PERCENTAGE
2000
1800
1600
1400
1200
1000
800
600
400
200
0
Unknown4o/o
Other2o/o . Black/African
Americant4%
White/Caucasian24%
lslander6%
nic/Latinoso%
2073 20L4 2015
1818
1603t529
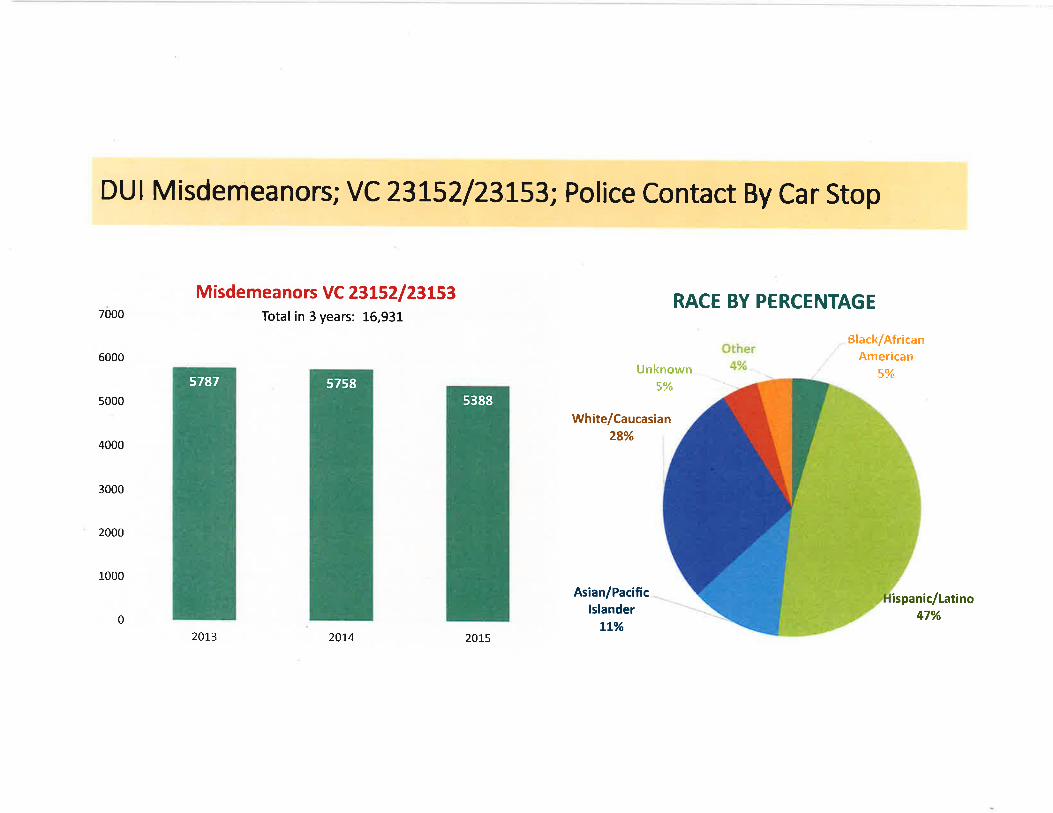
DU I Misdemeanors; VC 23 L52/23153; Police Contact By Car Stop
M isde mea nors V C 23152 | 23153Total in 3 years: 16,931
2013 201"4
RACE BY PERCENTAGE7000
6000
5000
4000
3000
2000
1000
UnknownEg/)lo
Black/AfricanAmerican
5%
0
White/Caucasian28%
Asian/Pacificlslander
tt%
ispanic/Latino47%
2075
57585787
5388
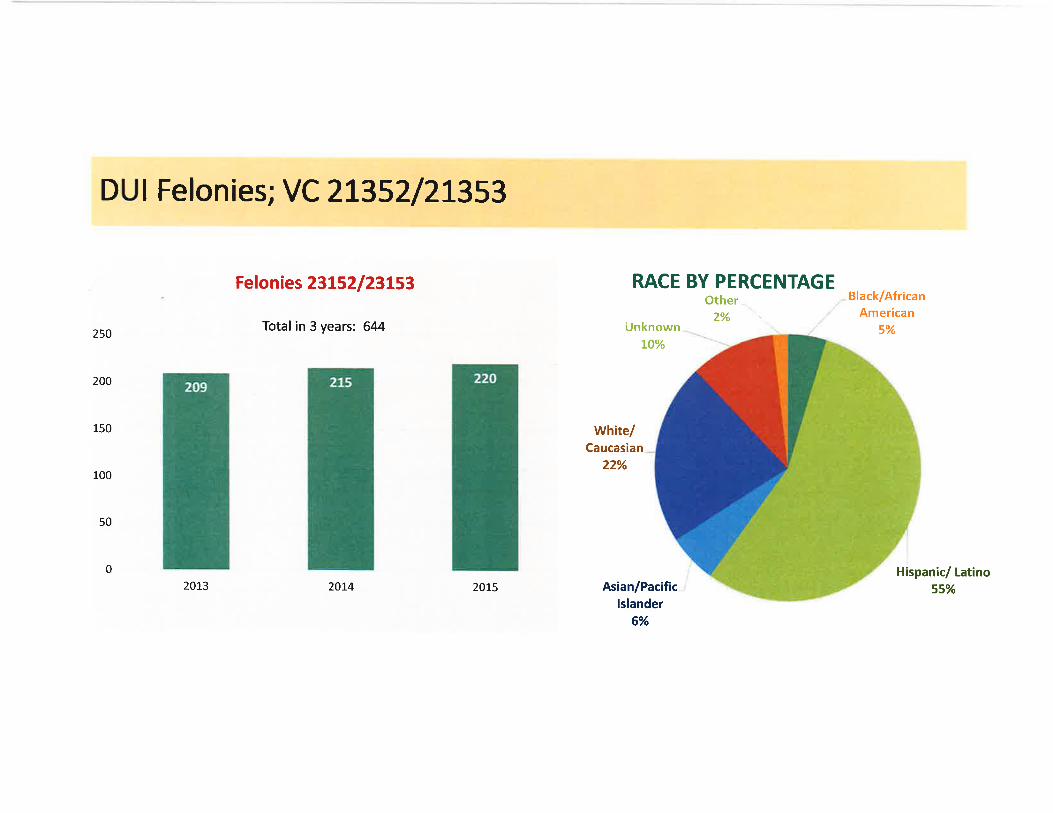
DUI Felonies; VC 2L352/2L353
Felonies 23t52123t53
Total in 3 years: 644
RACE BY PERCENTAGE0ther -.2% \.
Black/AfricanAmerican
5%250
200
150
100
50
UnknownLO%
White/Caucasian
22%
0 Hispanic/ Latino55%2013 2014 2015 Asian/Pacific -;
lslander60/o
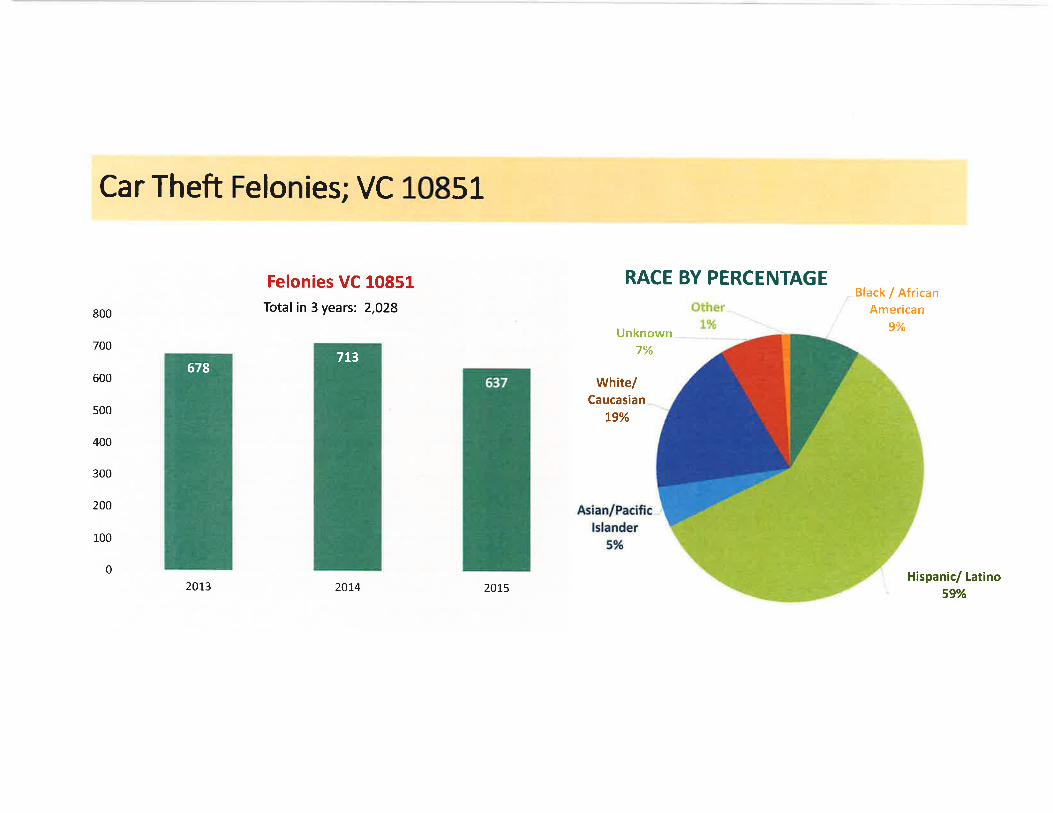
Car Theft Felonies; VC 10851
Felonies VC 10851Total in 3 years: 2,028
201-4
RACE BY PERCENTAGEBlack / African
American9%
800
700
600
500
400
300
200
100
Unknown7%
White/Caucasian
L9%
0
2013 2015Hispanic/ Latino
59o/o
713678
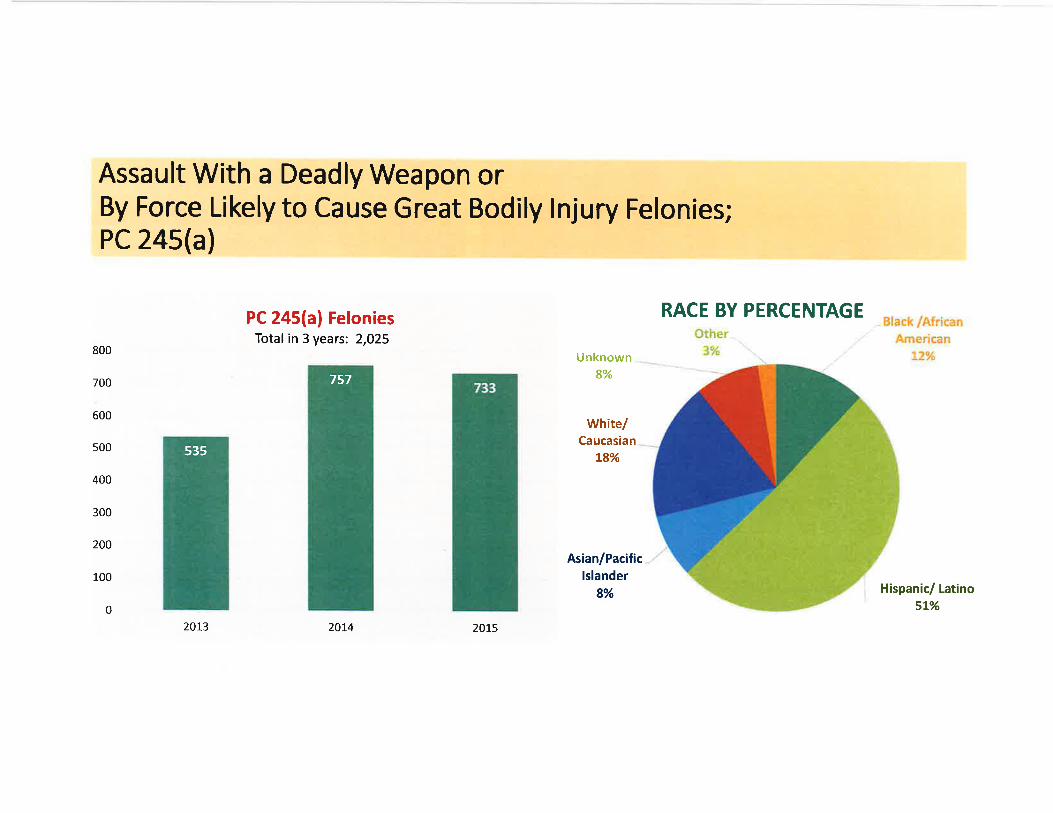
Assault With a Deadly Weapon orBy Force Likely to Cause Great Bodily lnjury Felonies;PC 2a5(a)
PC 245(a) FeloniesTotal in 3 years: 2,025
2014
RACE BY PERCENTAGE
800
700
600
500
400
300
200
100
0
Unknown8%
White/Caucasian
t8%
Asian/Pacificlslander
8% Hispanic/ Latino5L%
2013 2015
757
535
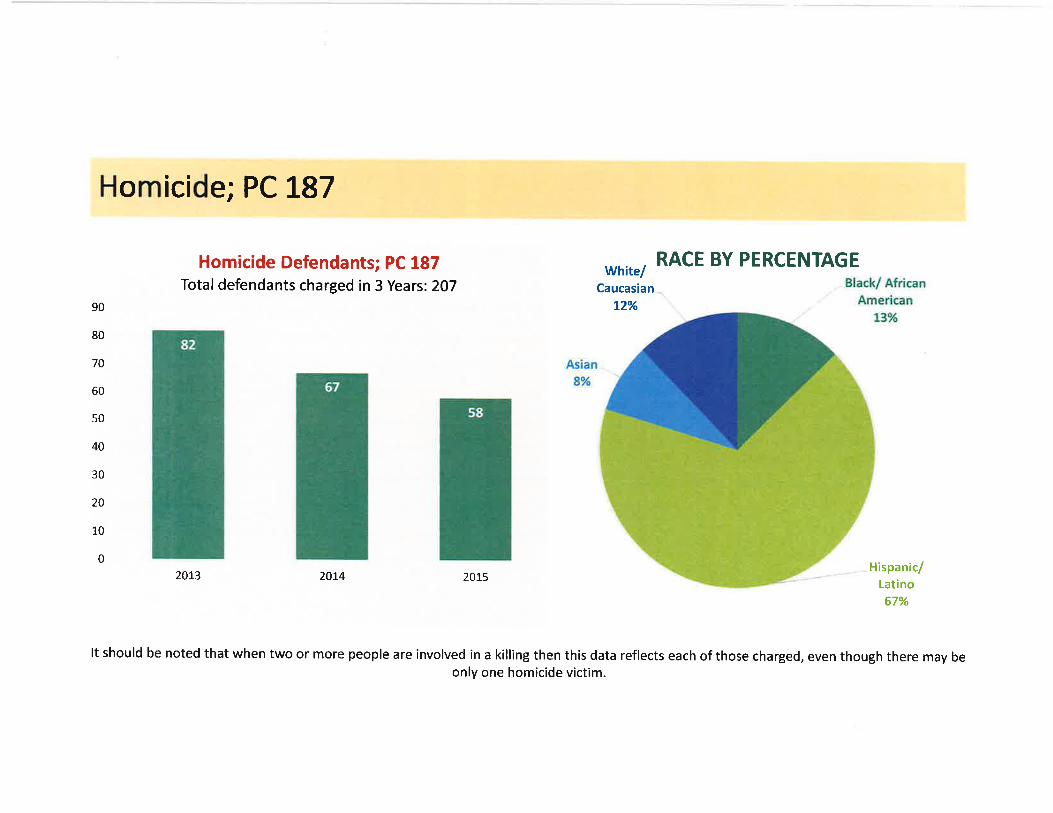
Homicide; PC L87
Homicide Defendants; PC 187Total defendants charged in 3 Years: 207
RACE BY PERCENTAGEwh¡te/
Caucasian
t2%90
80
70
60
s0
40
30
20
10
0
20r.3 20r4 201sHispanicl
Latino67%
It should be noted that when two or more people are involved in a killing then this data reflects each of those charged, even though there may beonly one homicide victim.
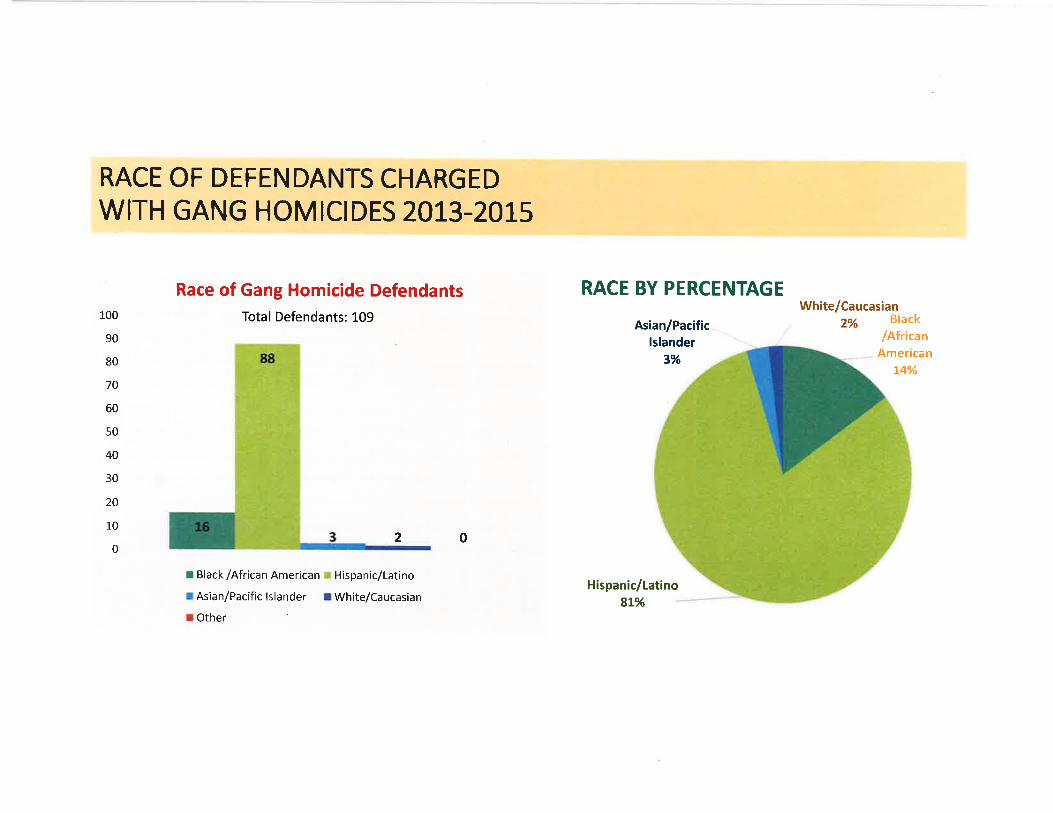
RACE OF DEFENDANTS CHARGEDWITH GANG HOMICIDES 2OT3-2OL5
Race of Gang Homicide DefendantsTotal Defendants: 109100
90
80
70
60
50
40
30
20
10
0
RACE BY PERCENTAGE
Asian/Pacificlslander
3%
Hispanic/Latino8L%
White/Caucasian2% Btack
/AfricanAmerican
14%
2
I Black /African American r Hispanic/Latino
r Asian/Pacific lslander I White/Caucasian
¡ Other
0

RACE OF DEFENDANTS CHARGEDWITH NON-GANG HOMICIDES 2OL3-2015
Race of Non-Gang Homicide Defendants60
50
40
30
20
10
Total Defendants: 98
1,
t Black /African American r Hispanic/Lat¡no
r Asian/Pacific lslander I White/Caucasian
r Other
RACE BY PERCENTAGE
White/Caucasian24%
Black
/AfricanAmerican
LA%
00 lslander
tLo/o
ispanic/Latino52%
The following slides address the county of residence of defendantsprosecuted in Santa Clara County and then examines how the racialcomposition of the defendants we prosecute changes when we onlylook at defendants who reside in Santa Clara County.
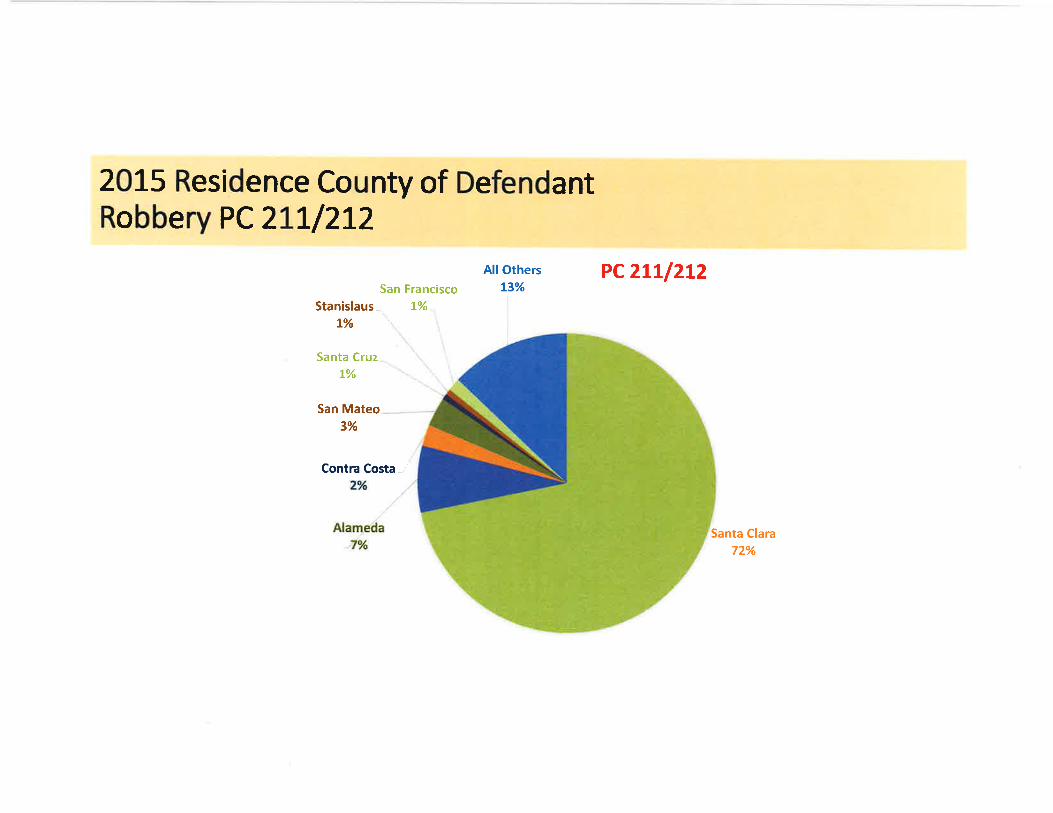
2015 Residence County of DefendantRobbery PC 2LL/2L2
San Francisco
AllOthersL3%
PC2Ltl2L2Stanislaus
t%1%
Santa Cruz
lo/o
San Mateo3%
Contra Costa-,'
Santa Clara
72o/o
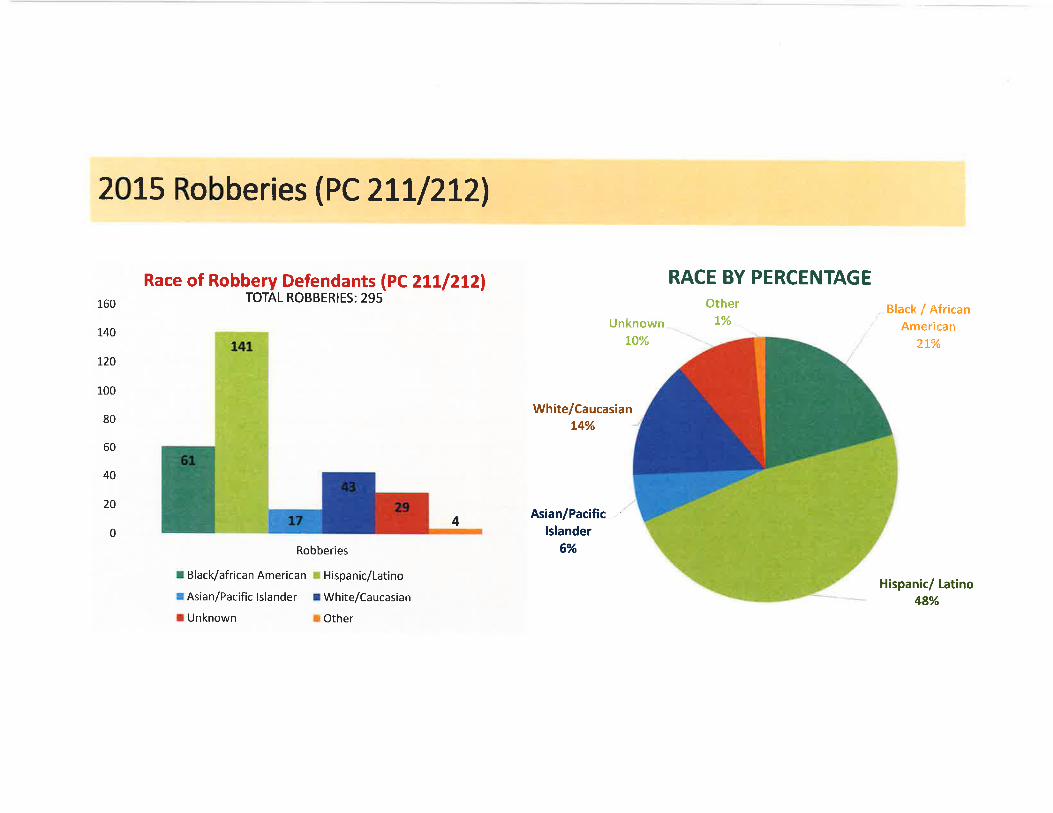
2015 Robberies (PC 2LI/2L21
Race of Robbery Defendants lPCzf.!/2t?l RACE BY PERCENTAGEOther
L%_. Black I African
, American2L%
Hispanic/ Latino48%
160
140
r20
100
80
60
40
20
TOTAL ROBBERIES:295
Robberies
r Black/african American r Hispanic/Latino
r Asian/Pacific lslander I Wh¡te/Caucasian
I Unknown r Other
UnknownLO%
4
White/Caucasiant4o/o
Asian/Pacific -,'Islander
60/o
0
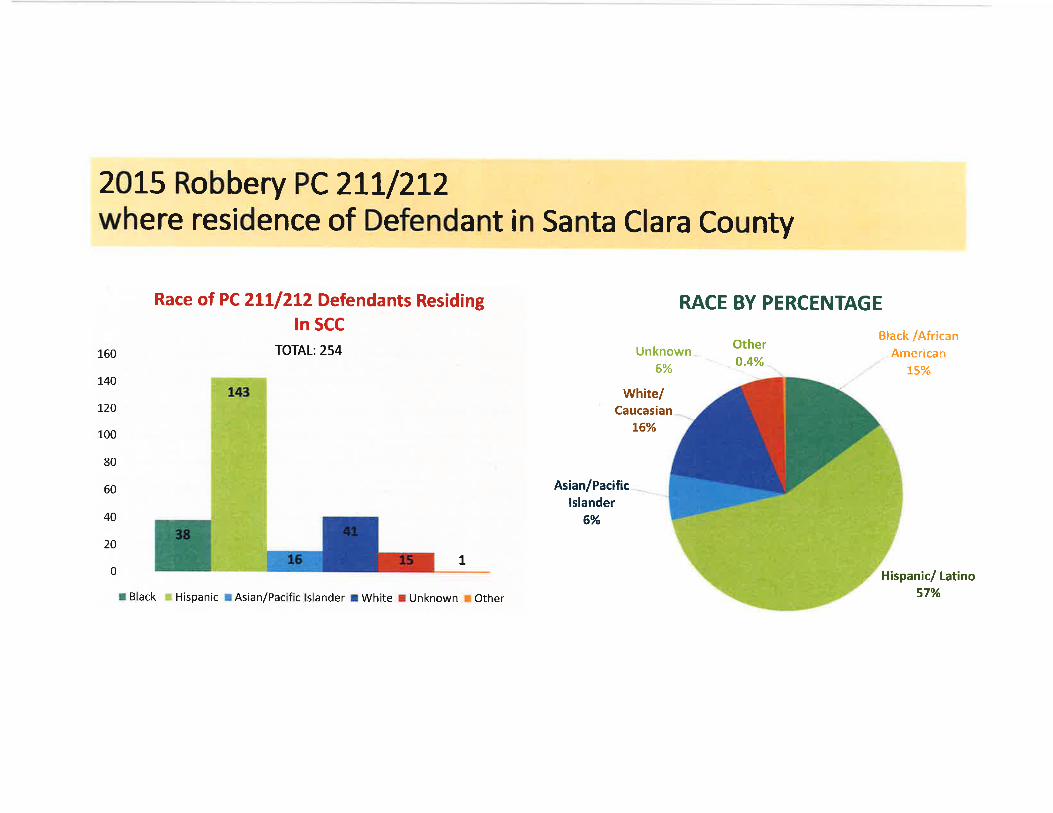
2OL5 Robbery PCZLL/LLTwhere residence of Defendant in Santa Clara County
RACE BY PERCENTAGEln SCC
TOTAL:254
Race of PC 2LU2LZ Defendants Residing
160
L40
120
100
80
60
40
20
0
Unknown
White/Caucasian
t6%
Other' 0.4%
Black,/African. American
L5%
Hispanic/ Latino57o/o
6%
Asian/Pacificlslander
6%
1
r Black r Hispanic r Asian/Pacific lslander r White I Unknown r Other
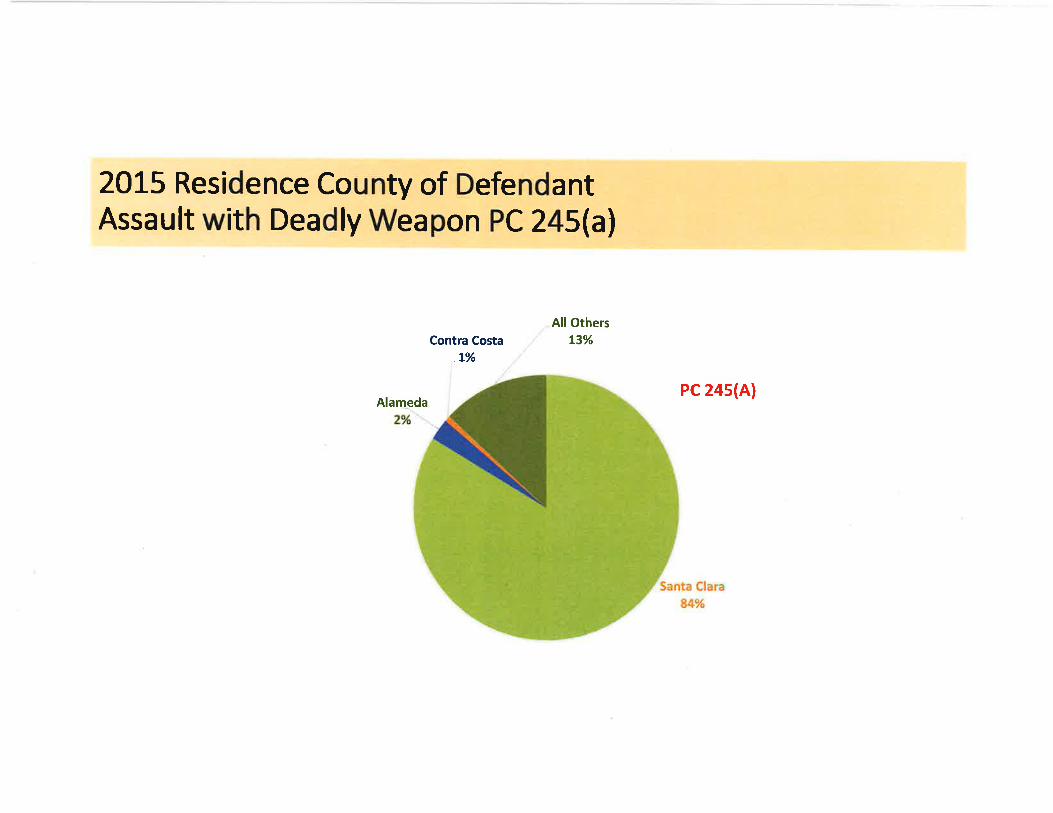
2015 Residence County of DefendantAssault with Deadly Weapon PC 245(a)
Contra Costa
-L%
AllOthersL3%
PC 24s(A)Alameda
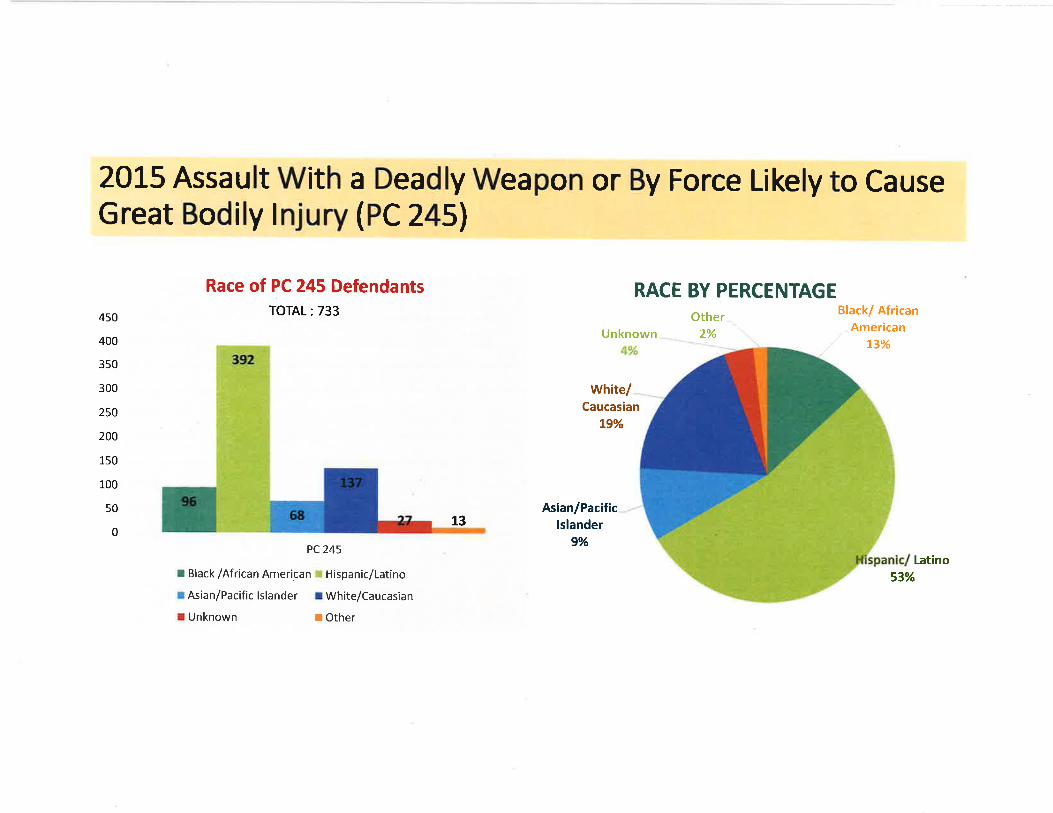
20L5 Assault With a Deadly Weapon or By Force Likely to CauseGreat Bodily lnjury (PC 245)
Race of PC 245 DefendantsTOTAL:733
PC245
r Black /African American r Hispanic/Latino
r Asian/Pacific lslander I White/Caucas¡an
I Unknown r Other
RACË BY PERCENTAGE0ther
10/L/O
Black/ African
,. American13%
53%
450
400
350
300
250
240
150
100
50
0
Unknown
White/Caucasian
L9%
13Asian/Pacific
lslander9%
Latino

2015 Assault with Deadly Weapon PC245(a)where residence of Defendant in Santa Clara County
Race of PC 245(a) Defendants Residing inscc
TOTAL:682
L4 t2
I Black r Hispanic r Asian/Pac¡fic lslander I White I Unknown r Other
RACE BY PERCENTAGE o*'.'Unknown
1ø/
2%
White/Caucasian
20%
- Black / African' American
ta%450
400
350
300
250
200
150
100
50
0
Asian/Pacific -/lslander
lÙo/"Hispanic/ Lat¡no
s6%
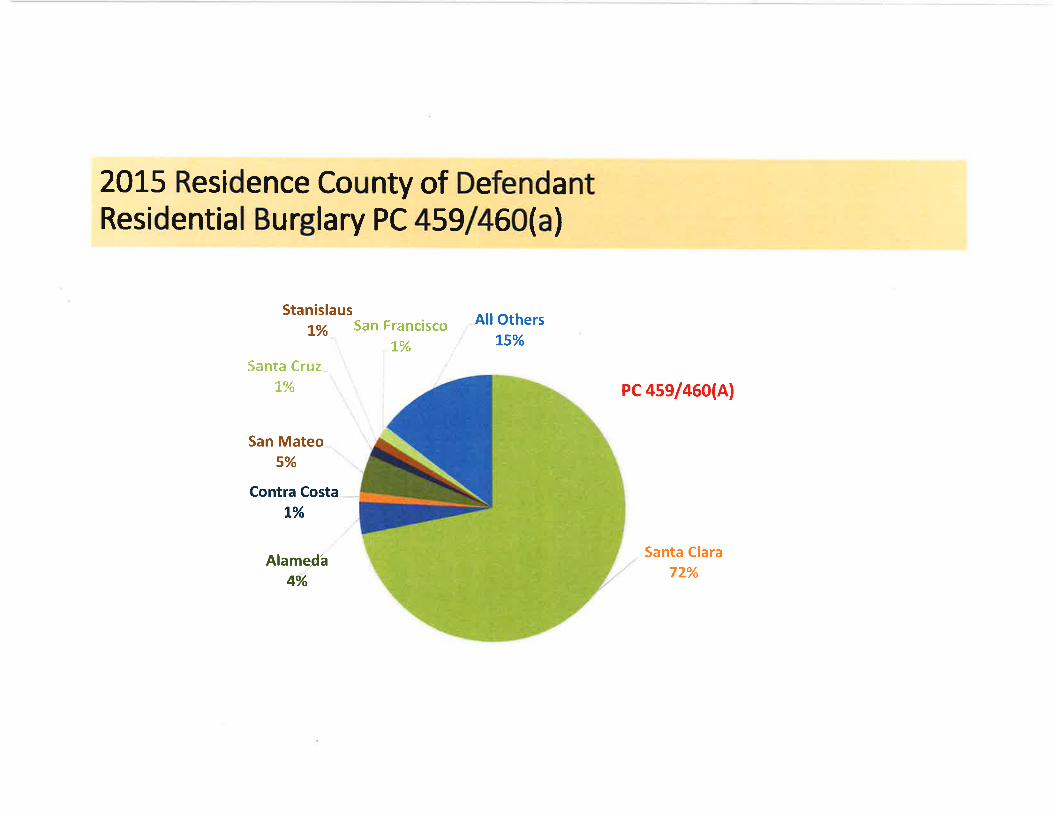
2OL5 Residence County of DefendantResidential Burglary PC 459 / 460(a)
StanislausL%
Santa Cru¡z
L%
San Mateo5%
Contra Costa
t%
Alameda4%
San Franciseo
!%
AllOtherst5%
Pc 4sel460(A)
- Santa Clara72%

2015 Burglary (Residential); PC 4591460(a)
Race of PC 459/46O(a) Defendants RACE BY PERCENTAGE
OtherL%_
3
180
160
140
r20
100
80
60
40
20
0
TOTAL:304
PC a59(a)
r Black r Hispanic r Asian/Pacific lslander r White ¡ Unknown r Other
Unknown4%
Black/ A,frican
Americant5%
White/Caucasian
2L%
Asian/Pacificlslander
60/o
nic/ Latino53%
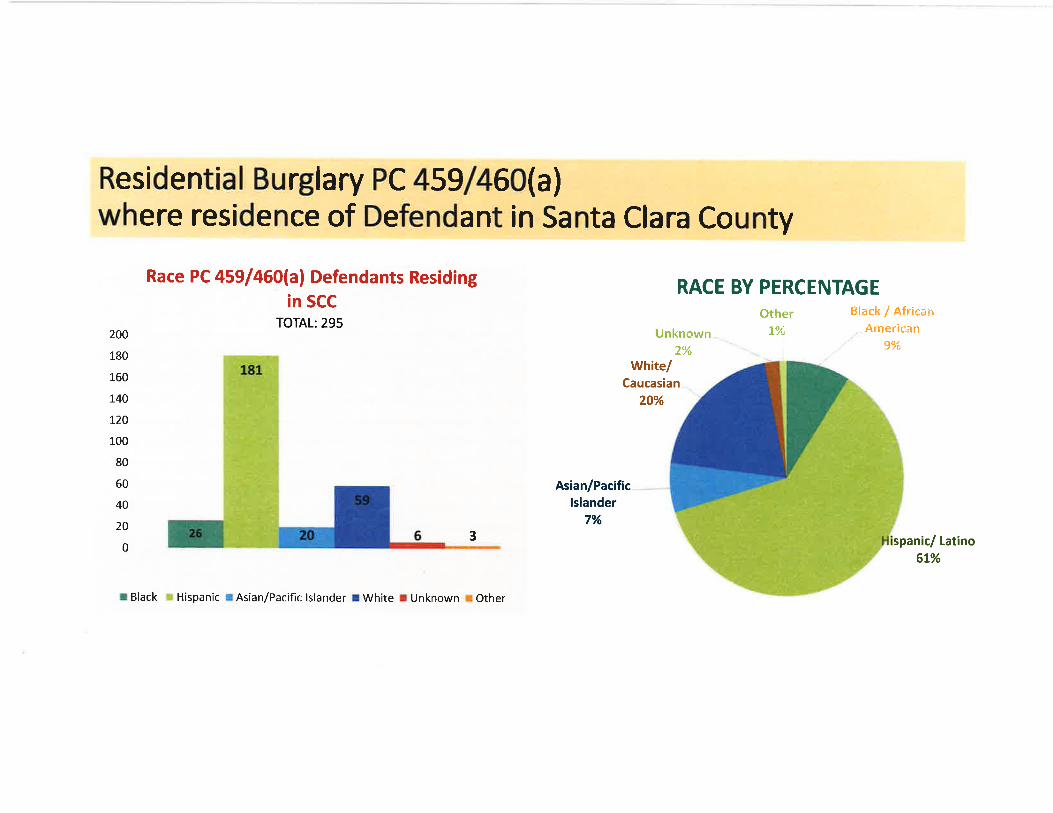
Residential Burglary PC 459 / 460(a)where residence of Defendant in Santa Clara County
Race PC 4591460(a) Defendants ResidingRACE BY PERCENTAGE
in SCCTOTAL:295
Other1%
Black I African,.American
g%200
180
160
r40
r20
100
80
60
40
20
0
Unknown2%
wh¡te/Caucasian
20%
Asian/Pacific
7%
lslander
3 spanic/ Latino6L%
r Black r Hispanic r Asian/Pacific lslander r White I Unknown ¡ Other
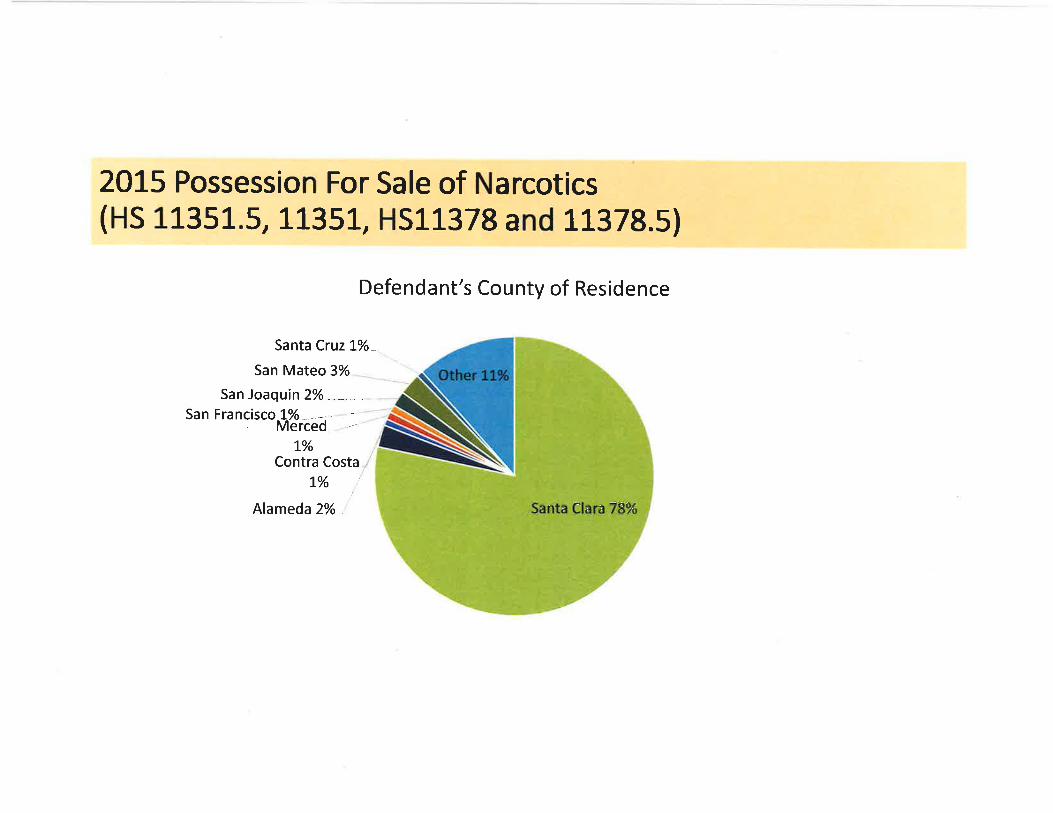
2015 Possession For Sale of Narcotics(HS 1L351.5, 1L351, HSLI378 and 11378.5)
Defendant's County of Residence
Santa CruzL%o^
San Mateo 3%
San Joaquin 2%
San FranciscoL%*-*--*Merced,,-"-
t%Contra Costa
L%
Alameda 2o/o,
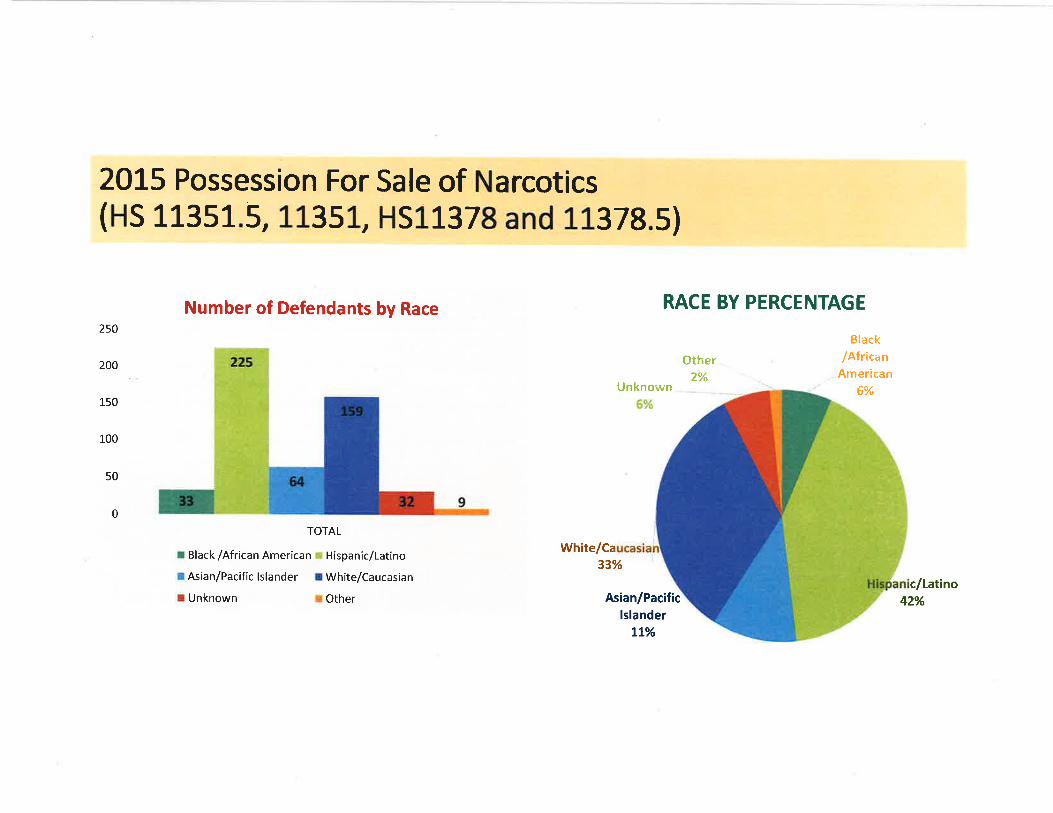
2015 Possession For Sale of Narcotics(HS 11351.5, 11351, HSlL378 and 11378.5)
Number of Defendants by Race RACE BY PERCENTAGE250
200
150
100
50
0the¡'2%
Black
lAfricanAmerican
6%Unknown
0
TOTAL
I Black /African American r Hispanic/Latino
r Asian/Pacífic lslander I White/Caucasian
I Unknown I Other
White/Ca33%
Asian/Pacificc/Latino
42%lslander
It%
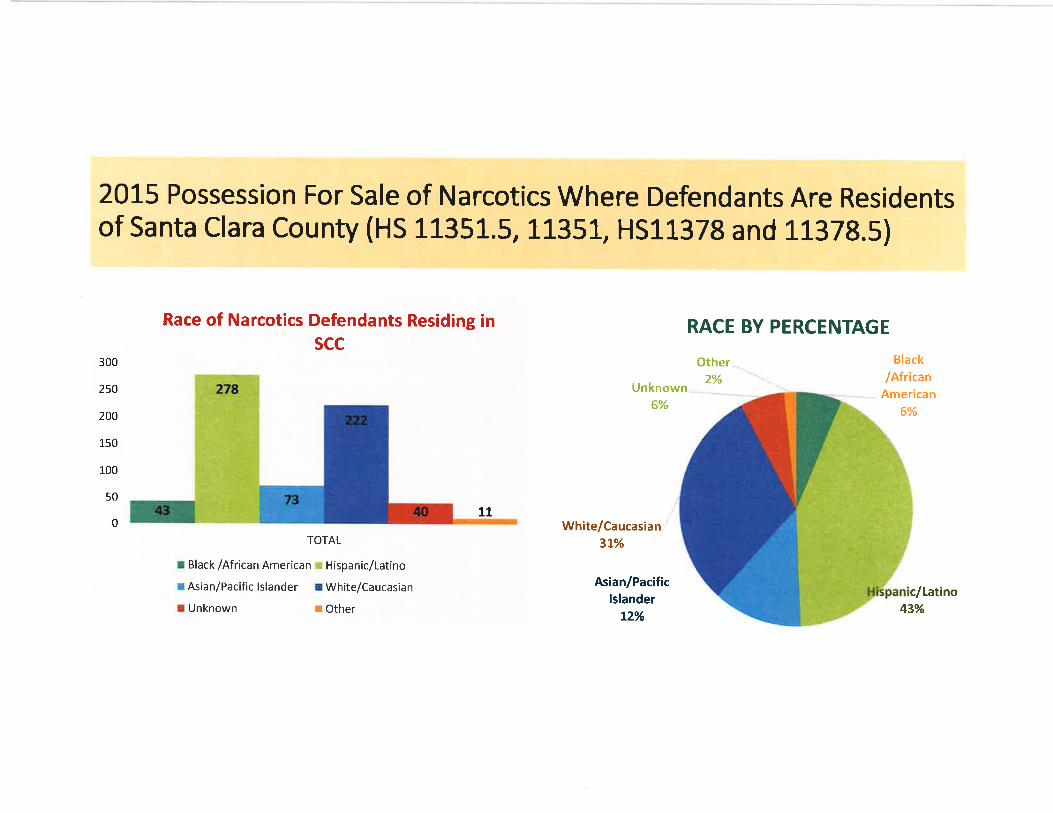
2015 Possession For Sale of Narcotics Where Defendants Are Residentsof Santa Clara County (HS 11351.5, 1135l-, HS1 1378 and 1L378.5)
Race of Narcotics Defendants Residing inscc
RACE BY PERCENTAGE
300
250
200
150
100
50
Other2o/"
Black
/AfricanAmerican
6%
c/Latino43%
Unknown6%
110 White/Caucasian,,
3lo/o
Asian/Pacificlslander
L2%
TOTAL
r Black /African American r Hispanic/Latino
r Asian/Pacific lslander I Wh¡te/Caucasian
I Unknown r Other
The following slide addresses the racial breakdown of victims of violentcrime assisted by the DA's Office Victim Services Unit in 2015. lt shouldbe noted that there was a dramatic increase in victims served in thesecond half of 20L5 after VSU moved in house to the DA's Office.
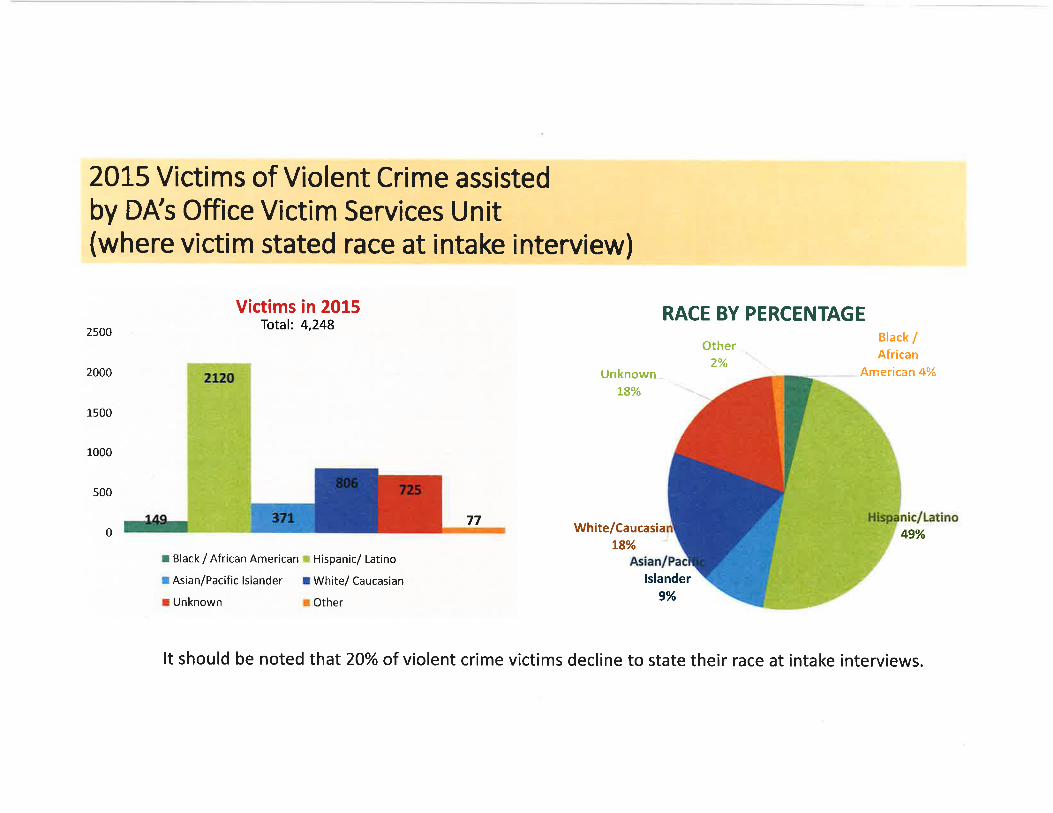
20LS Victims of Violent Crime assistedby DA s Office Victim Services Unlt(where victim stated race at intake interview)
Victims in 2015Total: 4,248
2500
1500
1000
RACE BY PERCENTAGE
Other ..
2%
Black IAfrican
American 4%
49%
2000 Unknown -..
L$o/o
White/CaucasiaL8%
500
077
r Black / African American r Hispanic/ Latino
r Asian/Pacific lslander r White/ Caucasian
I Unknown I Other
lslander9%
It should be noted that20% of violent crime victims decline to state their race at intake interviews.
The following slides address additional crimes prosecuted by the DA'sOffice, looking only at the most recent yea r,20!5.

2015 Felony Child Molestation (PC 269,288,288 .5,288.7)
Race of PC 2g9,288, 288.5, 288,7 Defendants RACE BY PERCENTAGE60
50
40
30
20
10
TOTAL CHILD MOLESTATION: 149PC269: L7PC 288: 96PC 288.5: 12PC288.7: 24
Unknown --.
to%
0ther3%
Black IAfrícan
American5%
58%
0 ¡ "L-..
White/Caucasian
9%
Asian/Pacificlslander
t5%
1 LLL
PC 269 PC 288
r Black/ African American r Hispanic/ Latino
r White/ Caucasian I Unknown
0 0110PC 288.5 PC 288.7
r Asian/Pacific lslander
r Other
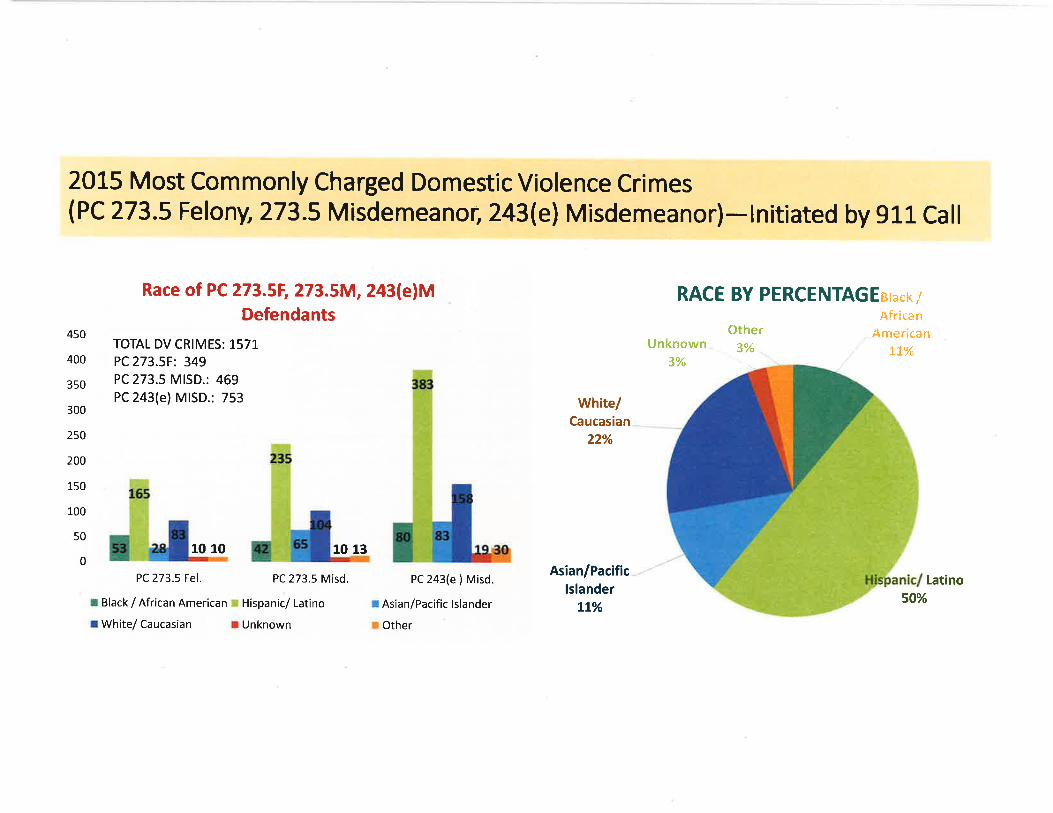
2oL5 Most Commonly Charged Dornestic Violence Crimes(PC 273.5 Felony, 273,5 Misdemeanoç 2a3(e) Misdemeanor)-lnitiated by 911 Call
Race of PC 273.5t, 273.5M,243(e)MDefendants
RACE BY PERCENTAGEBTaek,/
0therAfrican
. AmericanLt%
5Ùo/o
[atino
4s0
400
350
300
2s0
200
150
r-00
50
TOTAL DV CRIMES: 1571PC273.5t: 349PC273.5 MISD.: 469PC 2a3(e) MISD.: 753
10 10
Unknown3%
3%
10 13
PC 2a3(e ) Misd.
r Asian/Pacific lslander
r Other
White/Caucasian
22%
Asian/Pacificlslander
tt%
0
PC 273.5 Fel. PC 273.5 Misd.
r Black / African American r Hispanic/ Latino
r White/ Caucasian r Unknown
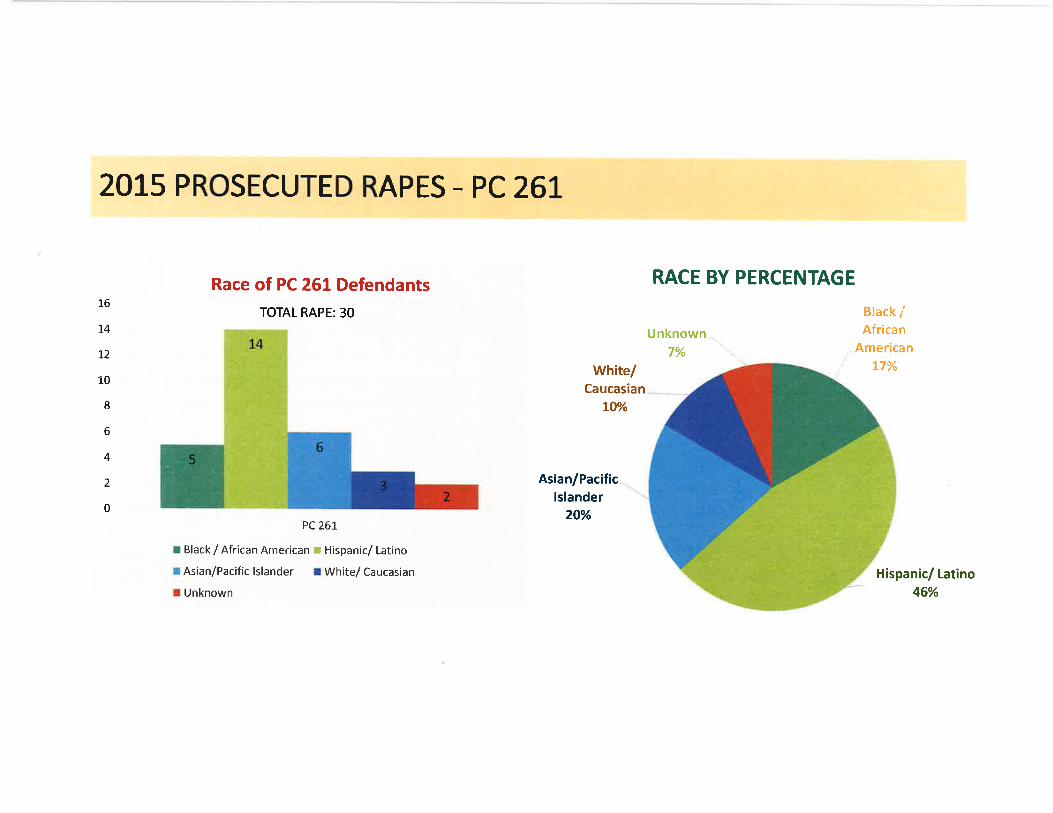
2OL5 PROSECUTED RAPES - PC 26L
Race of PC 261 Defendants
TOTAL RAPE: 30
RACE BY PERCENTAGE16
t4
12
10
8
6
4
2
0
Unknown7%
Black IAfrican
AmericanL7%wh¡te/
CaucasianLïo/o
Asian/Pacificlslander
20%PC261
r Black / African American r Hispanic/ Latino
I Asian/Pacific lslander r Whitel Caucasian
I Unknown
Hispanic/ Latino46%
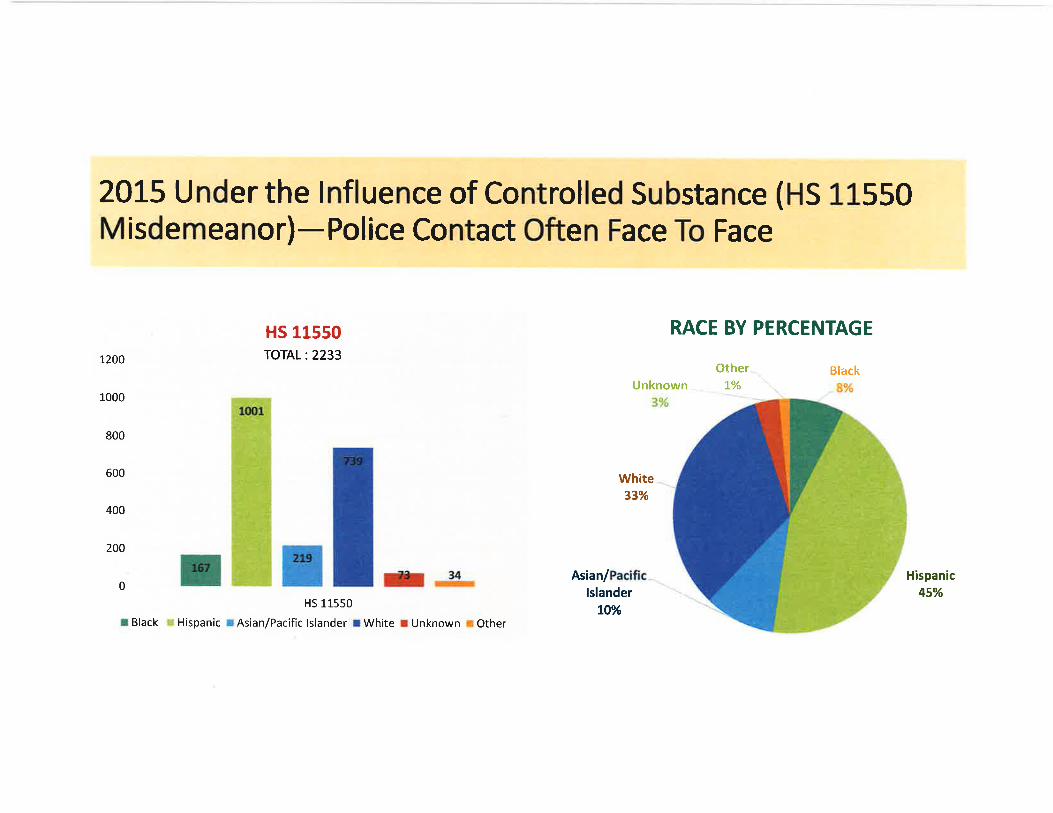
2015 Under the lnfluence of Controlled Substance (HS 11550Misdemeanor)-Police Contact often Face To Face
HS 11550TOTAL:2233
RACE BY PERCENTAGE
7200
1000
800
600
400
200
OtherUnknown l%
Black
White33%
0 rt4¡HS 11550
r Black r Hispanic r Asian/Pacific lslander r White ¡ Unknown r Other
Asian/lslander
LO%
Hispanic45%
lssues not addressed in these slides are many and future study may beable to address them. While this data does address a key decisionpoint, the filing or non-filing of criminal charges, ¡t does not addressthings more difficult to capture from our case management system likeoffers of resolution or the decisions about whether or not a caseshould proceed as a three-strike case.
Acknowledgements
The Santa Clara County District Attorney's Office thanks Laura Ridolfifrom the Burns lnstitute for her helpful insights, contributions andsuggestions that all made this study better and more complete.
We also thank Angela Hawken of BetaGov and Peter Katz of the ArnoldFoundation for their support of ongoing research and work on thisproject.
Contributors from the Santa Clara CountyDA's Offi ce
James Gibbons-Shapiro, Jaron Shipp, John Scavio, Chris Arriola, StaceyCapps, David Angel, Sean Webby, Quang Bui, Rina Myers and JuliaWood


