+ All Categories
Home > Documents > Animal and Plant Health Inspection Swine Enteric ...1 | Page Swine Enteric Coronavirus Disease...

Animal and Plant Health Inspection Swine Enteric ...1 | Page Swine Enteric Coronavirus Disease...

Date post: 25-Apr-2020
Category:
Upload: others
View: 4 times
Download: 0 times
Share this document with a friend
22
1 | Page Swine Enteric Coronavirus Disease (SECD) Situation Report – May 26, 2016 Information current as of 12:00 pm MDT, 05/25/2016 This report provides information on confirmed SECD-infected premises and SECD laboratory testing results data reported to USDA since the Federal Order was initiated on June 5, 2014. USDA–APHIS–VS veterinary officials confirm SECD-infected premises according to the official case definition. These reports are available on the USDA Web site at www.aphis.usda.gov/animal-health/secd. The Web site provides additional SECD information, including reports on SECD laboratory testing prior to the Federal Order. SECD Positive Premises Table 1. SECD Positive Premises This Week and Cumulative since June 5, 2014 NEW THIS WEEK (MAY 15–21, 2016) PEDV PDCOV DUAL INFECTION a New Confirmed Positive Premises This Week 26 3 4 New Presumptive Positive Premises This Week 5 0 0 CURRENT PREMISES WITH SECD POSITIVE STATUS Total Premises with Confirmed Positive Status This Week 2,245 155 143 CUMULATIVE SINCE JUNE 5, 2014 b Confirmed Positive Premises 2,679 177 152 Presumptive Positive Premises 615 52 37 Confirmed Positive Premises that have Attained Negative Status (i.e., premises that changed from positive to negative status) c 378 12 8 a Dual infection indicates premises with both PEDV and PDCoV. b Cumulative data include current premises with positive status and premises that were positive but have acquired negative status. c See Notes section of this report for details about premises statuses. Figure 1. Number of Confirmed Positive Premises by Week a a Week the sample was received at the laboratory for testing. 0 10 20 30 40 50 60 70 80 90 Number of Premises Week Received DUAL INFECTION PDCoV PEDV Animal and Plant Health Inspection Service Veterinary Services
Transcript

1 | P a g e

Swine Enteric Coronavirus Disease (SECD) Situation Report – May 26, 2016 Information current as of 12:00 pm MDT, 05/25/2016

This report provides information on confirmed SECD-infected premises and SECD laboratory testing results data reported to USDA since the Federal Order was initiated on June 5, 2014. USDA–APHIS–VS veterinary officials confirm SECD-infected premises according to the official case definition. These reports are available on the USDA Web site at www.aphis.usda.gov/animal-health/secd. The Web site provides additional SECD information, including reports on SECD laboratory testing prior to the Federal Order.

SECD Positive Premises Table 1. SECD Positive Premises This Week and Cumulative since June 5, 2014

NEW THIS WEEK (MAY 15–21, 2016) PEDV PDCOV DUAL INFECTIONa

New Confirmed Positive Premises This Week 26 3 4

New Presumptive Positive Premises This Week 5 0 0

CURRENT PREMISES WITH SECD POSITIVE STATUS

Total Premises with Confirmed Positive Status This Week 2,245 155 143

CUMULATIVE SINCE JUNE 5, 2014b

Confirmed Positive Premises 2,679 177 152

Presumptive Positive Premises 615 52 37

Confirmed Positive Premises that have Attained Negative Status (i.e., premises that changed from positive to negative status) c 378 12 8

aDual infection indicates premises with both PEDV and PDCoV. bCumulative data include current premises with positive status and premises that were positive but have acquired negative status. cSee Notes section of this report for details about premises statuses. Figure 1. Number of Confirmed Positive Premises by Week a

aWeek the sample was received at the laboratory for testing.

0102030405060708090

Num

ber o

f Pre

mis

es

Week Received DUAL INFECTION PDCoV PEDV

Animal and Plant Health Inspection Service Veterinary Services

2 | P a g e

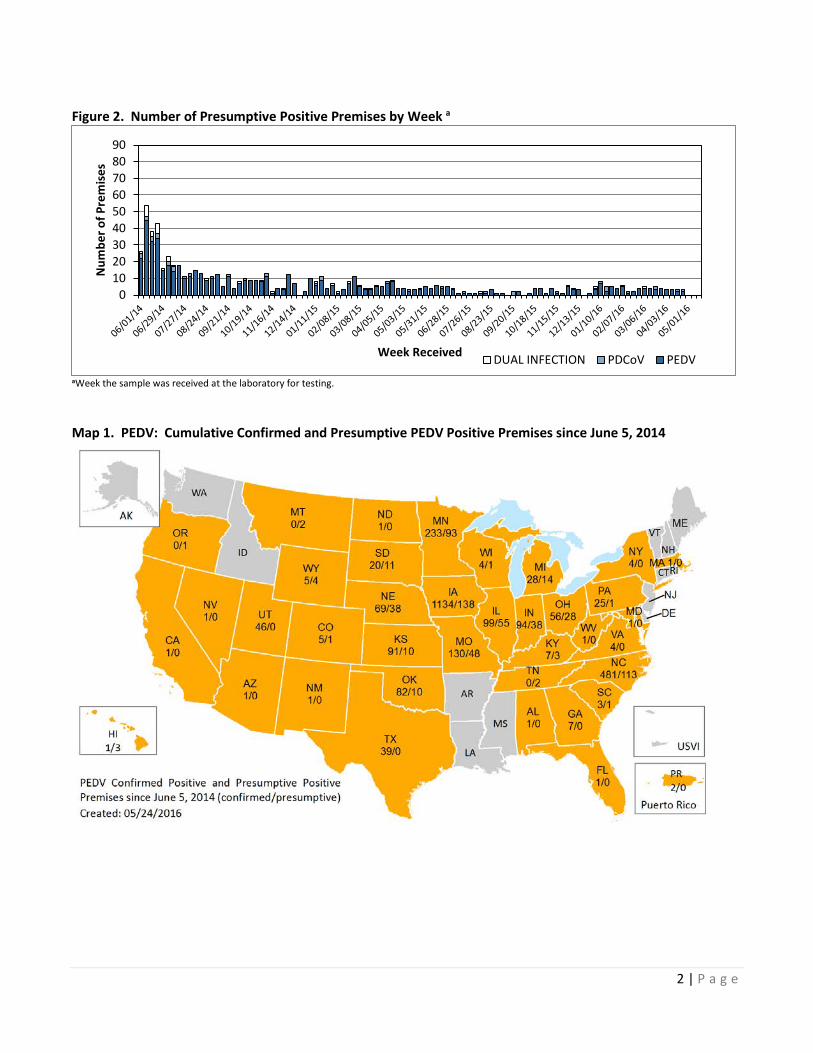
Figure 2. Number of Presumptive Positive Premises by Week a

aWeek the sample was received at the laboratory for testing. Map 1. PEDV: Cumulative Confirmed and Presumptive PEDV Positive Premises since June 5, 2014

0102030405060708090

Num

ber o

f Pre

mis

es

Week Received DUAL INFECTION PDCoV PEDV

3 | P a g e

Map 2. PDCoV: Cumulative Confirmed and Presumptive PDCoV Positive Premises since June 5, 2014

Map 3. Dual Infection: Cumulative Confirmed and Presumptive Positive Premises with Both PEDV and PDCOV since June 5, 2014

4 | P a g e

Table 2. Number of SECD Confirmed and Presumptive Positive Premises in Each Production Class, by Montha (includes PEDV, PDCoV, and Dual Infections) (confirmed / presumptive)

MONTH TESTED NURSERY WEAN TO

FINISH FARROW TO

FINISH FINISHER SOW/BREEDING UNKNOWN Jun 2014 21 / 12 31 / 18 15 / 8 24 / 28 48 / 45 13 / 51 Jul 2014 25 / 12 39 / 8 6 / 5 24 / 15 35 / 14 13 / 28 Aug 2014 15 / 8 17 / 8 2 / 5 25 / 9 12 / 7 12 / 17 Sep 2014 17 / 5 21 / 7 2 / 3 31 / 9 30 / 6 6 / 12 Oct 2014 5 / 4 30 / 7 4 / 0 38 / 16 10 / 3 5 / 7 Nov 2014 7 / 1 20 / 3 4 / 0 48 / 7 14 / 11 14 / 7 Dec 2014 20 / 1 47 / 2 12 / 4 65 / 9 23 / 4 9 / 5 Jan 2015 23 / 3 83 / 7 9 / 0 81 / 13 19 / 3 45 / 7 Feb 2015 22 / 3 74 / 3 8 / 0 73 / 7 21 / 1 56 / 6 Mar 2015 25 / 6 84 / 2 12 / 1 60 / 6 30 / 2 71 / 12 Apr 2015 29 / 3 47 / 2 9 / 1 40 / 12 16 / 1 27 / 6 May 2015 13 / 3 20 / 0 7 / 0 19 / 10 8 / 4 12 / 0 Jun 2015 2 / 4 9 / 1 4 / 0 9 / 7 4 / 3 9 / 6 Jul 2015 2 / 2 8 / 4 1 / 0 6 / 3 4 / 1 8 / 2 Aug 2015 3 / 1 5 / 1 1 / 0 6 / 5 3 / 0 5 / 1 Sep 2015 4 / 0 5 / 2 0 / 0 8 / 1 3 / 1 1 / 1 Oct 2015 4 / 3 8 / 0 4 / 1 15 / 2 22 / 0 10 / 4 Nov 2015 19 / 2 20 / 2 3 / 1 15 / 3 27 / 1 13 / 3 Dec 2015 27 / 2 30 / 0 7 / 0 52 / 1 25 / 2 16 / 5 Jan 2016 33 / 6 68 / 2 9 / 2 60 / 6 27 / 5 25 / 2 Feb 2016 32 / 1 42 / 1 6 / 0 68 / 9 27 / 2 21 / 1 Mar 2016 26 / 2 39 / 3 6 / 0 40 / 9 17 / 5 23 / 3 Apr 2016 10 / 1 26 / 1 4 / 0 21 / 7 13 / 1 21 / 2 May 2016 5 / 0 5 / 0 0 / 0 3 / 0 1 / 0 1 / 0

TOTAL 389 / 85 778 / 84 135 / 31 831 / 194 439 / 122 436 / 188 aMonth the sample was received at the laboratory for testing

Table 3, Part A: AL-ND. PEDV: Number of Confirmed and Presumptive Positive Premises by Weeka (confirmed / presumptive)

WEEKa TOTALb AL AZ CA CO FL GA HI IA IL IN KS KY MA MD MI MN MO MT NC ND

06/01/14 25 / 22 9 / 4 0 / 3 0 / 2 5 / 2 1 / 2 3 / 5 3 / 2

06/08/14 44 / 45 12 / 6 2 / 8 1 / 2 2 / 0 1 / 1 4 / 6 3 / 7 7 / 3

06/15/14 38 / 32 9 / 5 9 / 5 2 / 2 1 / 0 1 / 0 1 / 0 4 / 6 1 / 5 0 / 1 4 / 3

06/22/14 25 / 34 6 / 13 2 / 4 2 / 0 4 / 0 1 / 0 6 / 5 0 / 3 0 / 1

06/29/14 30 / 15 0 / 1 9 / 2 3 / 2 3 / 1 1 / 0 4 / 5 1 / 1 4 / 1

07/06/14 32 / 18 1 / 0 12 / 3 5 / 2 2 / 0 2 / 0 3 / 6 0 / 2 2 / 2

07/13/14 23 / 14 1 / 0 6 / 2 3 / 1 0 / 1 1 / 1 2 / 2 0 / 1 3 / 0

07/20/14 22 / 18 7 / 5 1 / 0 0 / 2 1 / 0 2 / 1 2 / 1 2 / 2

07/27/14 36 / 10 1 / 0 2 / 0 14 / 3 7 / 0 2 / 0 1 / 3 3 / 0 2 / 3

08/03/14 22 / 11 1 / 0 9 / 1 1 / 1 2 / 1 1 / 0 1 / 1 2 / 2 0 / 2 1 / 0 0 / 1

08/10/14 17 / 15 5 / 4 1 / 1 1 / 2 3 / 4 0 / 1 3 / 1

08/17/14 17 / 13 6 / 6 1 / 2 4 / 1 3 / 1 1 / 1

08/24/14 11 / 9 2 / 1 0 / 1 1 / 0 0 / 1 1 / 0 2 / 2 2 / 0 3 / 2

08/31/14 19 / 10 7 / 1 1 / 2 1 / 0 2 / 2 1 / 1 3 / 2

5 | P a g e

Table 3, Part A: AL-ND. PEDV: Number of Confirmed and Presumptive Positive Premises by Weeka (confirmed / presumptive)

WEEKa TOTALb AL AZ CA CO FL GA HI IA IL IN KS KY MA MD MI MN MO MT NC ND

09/07/14 35 / 12 10 / 0 0 / 1 4 / 5 0 / 2 4 / 1

09/14/14 26 / 5 11 / 0 0 / 1 1 / 2 0 / 1 2 / 0 4 / 0

09/21/14 19 / 11 1 / 0 9 / 1 0 / 4 0 / 1 0 / 1 1 / 0 3 / 0 0 / 1 1 / 1

09/28/14 18 / 4 11 / 2 2 / 0 1 / 0 1 / 0 1 / 0

10/05/14 13 / 7 5 / 1 0 / 2 3 / 0 1 / 0 0 / 1 3 / 2

10/12/14 20 / 9 9 / 2 1 / 0 1 / 1 1 / 1 1 / 1 3 / 1 1 / 1

10/19/14 17 / 9 7 / 4 1 / 0 4 / 0 3 / 0 0 / 1 0 / 4

10/26/14 24 / 9 10 / 3 0 / 1 3 / 1 6 / 1 2 / 2 0 / 1

11/02/14 21 / 8 6 / 0 0 / 1 3 / 4 1 / 2 1 / 1 1 / 0

11/09/14 31 / 11 9 / 4 4 / 2 9 / 0 0 / 1 2 / 2 1 / 0

11/16/14 31 / 1 1 / 0 5 / 0 1 / 0 8 / 0 1 / 0 1 / 0 2 / 1

11/23/14 16 / 4 9 / 0 1 / 0 3 / 0 0 / 1 0 / 1 0 / 2

11/30/14 43 / 3 15 / 0 0 / 1 2 / 0 10 / 1 1 / 0 2 / 1 7 / 0

12/07/14 41 / 12 0 / 3 15 / 3 3 / 2 2 / 0 3 / 0 3 / 3 4 / 0 3 / 0

12/14/14 42 / 7 19 / 2 2 / 1 0 / 1 5 / 1 0 / 1 2 / 1 4 / 0 1 / 0

12/21/14 19 / 0 8 / 0 1 / 0 1 / 0 1 / 0 2 / 0

12/28/14 25 / 2 20 / 1 1 / 0 0 / 1 1 / 0 1 / 0

01/04/15 53 / 10 29 / 2 2 / 0 1 / 1 0 / 1 5 / 0 5 / 0 2 / 3

01/11/15 59 / 6 36 / 2 1 / 0 0 / 2 1 / 0 9 / 0 1 / 0 3 / 2

01/18/15 62 / 9 33 / 3 2 / 2 3 / 0 5 / 1 3 / 1 9 / 2

01/25/15 54 / 4 26 / 2 3 / 0 3 / 0 1 / 0 2 / 0 1 / 0 10 / 2

02/01/15 51 / 6 25 / 2 2 / 0 1 / 0 6 / 0 3 / 0 9 / 2

02/08/15 40 / 1 19 / 0 1 / 0 2 / 0 1 / 0 4 / 0 9 / 1

02/15/15 72 / 3 31 / 1 2 / 0 4 / 0 1 / 0 4 / 1 6 / 1 14 / 0

02/22/15 64 / 7 1 / 0 25 / 2 3 / 0 1 / 1 1 / 2 1 / 0 8 / 0 21 / 2

03/01/15 62 / 11 5 / 0 25 / 0 3 / 3 1 / 0 1 / 1 4 / 4 19 / 3

03/08/15 72 / 5 33 / 1 3 / 0 4 / 0 5 / 0 1 / 1 4 / 1 3 / 0 11 / 2

03/15/15 65 / 3 22 / 1 5 / 0 4 / 1 3 / 0 4 / 0 22 / 1

03/22/15 48 / 3 1 / 0 23 / 0 3 / 0 2 / 0 2 / 1 1 / 1 12 / 0

03/29/15 47 / 5 25 / 0 2 / 0 1 / 1 5 / 0 2 / 0 11 / 3

04/05/15 46 / 5 17 / 0 2 / 0 1 / 0 1 / 0 1 / 1 6 / 0 11 / 2

04/12/15 35 / 7 14 / 4 1 / 0 1 / 0 2 / 0 1 / 0 2 / 0 4 / 0 8 / 2

04/19/15 31 / 8 12 / 5 3 / 0 1 / 0 8 / 1 1 / 0 3 / 1

04/26/15 21 / 4 8 / 2 1 / 0 2 / 0 5 / 1 3 / 0

05/03/15 29 / 4 14 / 1 1 / 0 0 / 1 5 / 0 1 / 0 5 / 0

05/10/15 17 / 2 6 / 1 3 / 0 2 / 1 2 / 0

05/17/15 12 / 3 1 / 2 1 / 0 0 / 1 2 / 0 2 / 0 5 / 0

05/24/15 8 / 3 3 / 2 1 / 0 3 / 0

05/31/15 10 / 5 7 / 4 1 / 0 0 / 1 2 / 0

06/07/15 10 / 4 4 / 1 2 / 1 2 / 2

06/14/15 2 / 6 1 / 2 0 / 1 1 / 1 0 / 2

06/21/15 9 / 4 4 / 2 1 / 0 1 / 1 1 / 0 1 / 1

06/28/15 10 / 5 3 / 4 1 / 0 0 / 1 1 / 0 4 / 0

07/05/15 10 / 3 6 / 1 1 / 1 2 / 0

6 | P a g e

Table 3, Part A: AL-ND. PEDV: Number of Confirmed and Presumptive Positive Premises by Weeka (confirmed / presumptive)

WEEKa TOTALb AL AZ CA CO FL GA HI IA IL IN KS KY MA MD MI MN MO MT NC ND

07/12/15 4 / 1 1 / 0 0 / 1 2 / 0

07/19/15 3 / 1 1 / 1 1 / 0

07/26/15 4 / 1 2 / 0 1 / 0

08/02/15 5 / 1 3 / 0 1 / 0 1 / 1

08/09/15 3 / 1 0 / 1 1 / 0 2 / 0

08/16/15 3 / 1 1 / 0 1 / 0

08/23/15 12 / 3 6 / 1 0 / 1 1 / 0 1 / 1 3 / 0

08/30/15 7 / 1 4 / 1 2 / 0 1 / 0

09/06/15 1 / 1 1 / 0 0 / 1

09/13/15 3 / 0 3 / 0

09/20/15 4 / 0 1 / 0 1 / 0 1 / 0

09/27/15 12 / 2 1 / 2 1 / 0 9 / 0

10/04/15 14 / 0 4 / 0 1 / 0 6 / 0

10/11/15 8 / 1 1 / 0 1 / 1 5 / 0

10/18/15 17 / 4 3 / 0 2 / 0 2 / 1 3 / 1 1 / 0 4 / 1

10/25/15 13 / 4 3 / 0 0 / 1 1 / 0 7 / 3

11/01/15 18 / 1 5 / 0 1 / 0 2 / 0 8 / 1 1 / 0

11/08/15 17 / 4 6 / 0 1 / 1 0 / 1 0 / 1 9 / 0

11/15/15 28 / 1 12 / 0 2 / 0 2 / 0 10 / 1

11/22/15 20 / 1 6 / 0 2 / 0 1 / 0 11 / 1

11/29/15 34 / 5 7 / 0 0 / 1 1 / 0 2 / 0 19 / 4

12/06/15 35 / 3 21 / 0 2 / 0 10 / 3

12/13/15 21 / 3 9 / 0 1 / 0 9 / 3

12/20/15 24 / 0 14 / 0 1 / 0 1 / 0 7 / 0

12/27/15 33 / 1 13 / 0 1 / 1 1 / 0 2 / 0 2 / 0 9 / 0

01/03/16 32 / 3 23 / 1 2 / 0 1 / 0 6 / 1

01/10/16 35 / 7 24 / 1 1 / 0 1 / 0 3 / 0 1 / 1 2 / 5

01/17/16 34 / 2 16 / 0 2 / 1 7 / 1 2 / 0 7 / 0

01/24/16 46 / 5 31 / 1 1 / 0 1 / 0 5 / 2 4 / 2

01/31/16 45 / 4 22 / 0 0 / 1 3 / 1 1 / 0 1 / 0 4 / 0 11 / 2

02/07/16 48 / 5 19 / 0 0 / 1 5 / 0 5 / 1 3 / 0 10 / 3

02/14/16 37 / 1 15 / 0 0 / 1 1 / 0 1 / 0 4 / 0 2 / 0 7 / 0

02/21/16 37 / 2 19 / 0 4 / 0 3 / 0 8 / 2

02/28/16 27 / 4 16 / 0 2 / 0 1 / 0 4 / 1 1 / 1 1 / 1

03/06/16 29 / 4 8 / 1 1 / 1 2 / 0 1 / 0 5 / 0 1 / 0 6 / 2

03/13/16 32 / 4 18 / 0 2 / 1 1 / 1 4 / 0 2 / 1 2 / 1

03/20/16 22 / 3 8 / 1 3 / 0 5 / 0 2 / 0 2 / 1

03/27/16 28 / 4 12 / 1 1 / 0 1 / 0 3 / 0 5 / 0 3 / 2

04/03/16 23 / 3 1 / 0 12 / 0 2 / 0 1 / 0 1 / 0 2 / 0 1 / 0 1 / 3

04/10/16 21 / 3 7 / 1 1 / 0 1 / 0 3 / 0 2 / 0 1 / 0

04/17/16 20 / 2 1 / 0 6 / 1 1 / 0 1 / 0 5 / 0 4 / 0

04/24/16 10 / 2 3 / 0 1 / 1 5 / 1

05/01/16 7 / 0 4 / 0

05/08/16 2 / 0 1 / 0 1 / 0

TOTAL 2,679 / 615 1 / 0 1 / 0 1 / 0 5 / 1 1 / 0 7 / 0 1 / 3 1,134 / 138

99 / 55

94 / 38

91 / 10 7 / 3 1 / 0 1 / 0

28 / 14

233 / 93

130 / 48 0 / 2

481 / 113 1 / 0

7 | P a g e

Table 3, Part B: NE-WY. PEDV: Number of Confirmed and Presumptive Positive Premises by Weeka (confirmed / presumptive)

WEEKa TOTALb NE NM NV NY OH OK OR PA PR SC SD TN TX UT VA WI WV WY

06/01/14 25 / 22 0 / 1 0 / 1 1 / 0 3 / 0

06/08/14 44 / 45 1 / 9 1 / 0 5 / 2 1 / 0 2 / 1 2 / 0

06/15/14 38 / 32 1 / 0 2 / 5 1 / 0 2 / 0

06/22/14 25 / 34 1 / 5 0 / 1 2 / 2 1 / 0

06/29/14 30 / 15 1 / 1 2 / 1 2 / 0

07/06/14 32 / 18 0 / 1 1 / 0 1 / 0 1 / 1 2 / 1

07/13/14 23 / 14 4 / 0 1 / 4 2 / 0 0 / 1 0 / 1

07/20/14 22 / 18 1 / 1 3 / 2 1 / 1 0 / 3 1 / 0 1 / 0

07/27/14 36 / 10 1 / 0 1 / 0 0 / 1 1 / 0 1 / 0

08/03/14 22 / 11 1 / 2 1 / 0 1 / 0 1 / 0

08/10/14 17 / 15 2 / 1 0 / 1 2 / 0

08/17/14 17 / 13 1 / 0 0 / 1 0 / 1 1 / 0

08/24/14 11 / 9 0 / 1 0 / 1

08/31/14 19 / 10 1 / 2 1 / 0 2 / 0

09/07/14 35 / 12 2 / 1 0 / 1 1 / 1 14 / 0

09/14/14 26 / 5 1 / 0 3 / 1 4 / 0

09/21/14 19 / 11 3 / 0 1 / 2

09/28/14 18 / 4 0 / 1 2 / 0 0 / 1

10/05/14 13 / 7 1 / 0 0 / 1

10/12/14 20 / 9 0 / 1 1 / 0 0 / 1 2 / 0

10/19/14 17 / 9 1 / 0 1 / 0

10/26/14 24 / 9 2 / 0 1 / 0

11/02/14 21 / 8 1 / 0 7 / 0 1 / 0

11/09/14 31 / 11 1 / 1 0 / 1 3 / 0 2 / 0

11/16/14 31 / 1 2 / 0 7 / 0 3 / 0

11/23/14 16 / 4 1 / 0 2 / 0

11/30/14 43 / 3 1 / 0 4 / 0 1 / 0

12/07/14 41 / 12 0 / 1 3 / 0 3 / 0 2 / 0

12/14/14 42 / 7 1 / 0 2 / 0 2 / 0 1 / 0 2 / 0 1 / 0

12/21/14 19 / 0 2 / 0 3 / 0 1 / 0

12/28/14 25 / 2 1 / 0 1 / 0

01/04/15 53 / 10 0 / 1 0 / 1 5 / 1 1 / 0 3 / 0

01/11/15 59 / 6 1 / 0 1 / 0 1 / 0 3 / 0 1 / 0 1 / 0

01/18/15 62 / 9 3 / 0 1 / 0 2 / 0 1 / 0

01/25/15 54 / 4 2 / 0 2 / 0 1 / 0 3 / 0

02/01/15 51 / 6 1 / 1 1 / 0 1 / 0 0 / 1 1 / 0 1 / 0

02/08/15 40 / 1 2 / 0 2 / 0

02/15/15 72 / 3 2 / 0 3 / 0 3 / 0 1 / 0 1 / 0

02/22/15 64 / 7 1 / 0 1 / 0 1 / 0

03/01/15 62 / 11 1 / 0 1 / 0 1 / 0 1 / 0

03/08/15 72 / 5 3 / 0 2 / 0 1 / 0 2 / 0

03/15/15 65 / 3 1 / 0 1 / 0 1 / 0 1 / 0 1 / 0

03/22/15 48 / 3 0 / 1 1 / 0 2 / 0 1 / 0

8 | P a g e

Table 3, Part B: NE-WY. PEDV: Number of Confirmed and Presumptive Positive Premises by Weeka (confirmed / presumptive)

WEEKa TOTALb NE NM NV NY OH OK OR PA PR SC SD TN TX UT VA WI WV WY

03/29/15 47 / 5 1 / 1

04/05/15 46 / 5 3 / 2 3 / 0 1 / 0

04/12/15 35 / 7 1 / 0 1 / 1

04/19/15 31 / 8 0 / 1 1 / 0 2 / 0

04/26/15 21 / 4 0 / 1 1 / 0 1 / 0

05/03/15 29 / 4 1 / 0 0 / 2 1 / 0 1 / 0

05/10/15 17 / 2 1 / 0 3 / 0

05/17/15 12 / 3 1 / 0

05/24/15 8 / 3 0 / 1 1 / 0

05/31/15 10 / 5

06/07/15 10 / 4 2 / 0

06/14/15 2 / 6

06/21/15 9 / 4 1 / 0

06/28/15 10 / 5 1 / 0

07/05/15 10 / 3 1 / 1

07/12/15 4 / 1 1 / 0

07/19/15 3 / 1 1 / 0

07/26/15 4 / 1 0 / 1 1 / 0

08/02/15 5 / 1

08/09/15 3 / 1

08/16/15 3 / 1 1 / 1

08/23/15 12 / 3 1 / 0

08/30/15 7 / 1

09/06/15 1 / 1

09/13/15 3 / 0

09/20/15 4 / 0 1 / 0

09/27/15 12 / 2 1 / 0

10/04/15 14 / 0 1 / 0 2 / 0

10/11/15 8 / 1 1 / 0

10/18/15 17 / 4 1 / 0 1 / 0 0 / 1

10/25/15 13 / 4 1 / 0 1 / 0

11/01/15 18 / 1 1 / 0

11/08/15 17 / 4 1 / 0 0 / 1

11/15/15 28 / 1 1 / 0 1 / 0

11/22/15 20 / 1

11/29/15 34 / 5 3 / 0 1 / 0 1 / 0

12/06/15 35 / 3 1 / 0 1 / 0

12/13/15 21 / 3 1 / 0 1 / 0

12/20/15 24 / 0 1 / 0

12/27/15 33 / 1 1 / 0 1 / 0 1 / 0 1 / 0 1 / 0

01/03/16 32 / 3 0 / 1

01/10/16 35 / 7 2 / 0 1 / 0

01/17/16 34 / 2

01/24/16 46 / 5 1 / 0 2 / 0 1 / 0

9 | P a g e

Table 3, Part B: NE-WY. PEDV: Number of Confirmed and Presumptive Positive Premises by Weeka (confirmed / presumptive)

WEEKa TOTALb NE NM NV NY OH OK OR PA PR SC SD TN TX UT VA WI WV WY

01/31/16 45 / 4 2 / 0 1 / 0

02/07/16 48 / 5 1 / 0 3 / 0 2 / 0

02/14/16 37 / 1 4 / 0 1 / 0 1 / 0 1 / 0

02/21/16 37 / 2 1 / 0 1 / 0 1 / 0

02/28/16 27 / 4 1 / 0 0 / 1 1 / 0

03/06/16 29 / 4 2 / 0 2 / 0 1 / 0

03/13/16 32 / 4 2 / 0 1 / 0

03/20/16 22 / 3 1 / 1 1 / 0

03/27/16 28 / 4 1 / 0 1 / 0 1 / 0 0 / 1

04/03/16 23 / 3 1 / 0 1 / 0

04/10/16 21 / 3 3 / 2 1 / 0 2 / 0

04/17/16 20 / 2 2 / 0 0 / 1

04/24/16 10 / 2 1 / 0

05/01/16 7 / 0 2 / 0 1 / 0

05/08/16 2 / 0

TOTAL 2,679 /

615 69 / 38 1 / 0 1 / 0 4 / 0 56 / 28 82 / 10 0 / 1 25 / 1 2 / 0 3 / 1 20 / 11 0 / 2 39 / 0 46 / 0 4 / 0 4 / 1 1 / 0 5 / 4 bTotal of all States in Table 3, Parts A and B. Table 4. PDCoV: Number of Confirmed and Presumptive Positive Premises by Weeka (confirmed / presumptive)

WEEK a TOTAL IA IL IN KS KY MI MN MO MT NC NE OH PA SD TX

06/01/14 2 / 3 0 / 1 1 / 1 0 / 1 1 / 0

06/08/14 1 / 2 0 / 2 1 / 0

06/15/14 4 / 3 2 / 0 0 / 1 1 / 2 1 / 0

06/22/14 2 / 3 1 / 1 0 / 2 1 / 0

06/29/14 1 / 0 1 / 0

07/06/14 3 / 2 3 / 1 0 / 1

07/13/14 2 / 3 1 / 0 1 / 0 0 / 3

07/27/14 1 / 1 1 / 0 0 / 1

08/03/14 1 / 2 1 / 0 0 / 2

08/17/14 1 / 0 1 / 0

08/31/14 0 / 1 0 / 1

09/21/14 1 / 1 1 / 0 0 / 1

10/12/14 1 / 1 1 / 0 0 / 1

10/19/14 2 / 0 1 / 0 1 / 0

10/26/14 1 / 0 1 / 0

11/02/14 1 / 0 1 / 0

11/09/14 6 / 2 2 / 0 3 / 1 1 / 0 0 / 1

11/30/14 1 / 1 1 / 1

12/07/14 2 / 0 2 / 0

12/14/14 4 / 0 3 / 0 1 / 0

12/21/14 1 / 0 1 / 0

12/28/14 1 / 0 1 / 0

01/04/15 6 / 0 3 / 0 1 / 0 1 / 0 1 / 0

01/11/15 3 / 1 1 / 0 0 / 1 1 / 0 1 / 0

01/18/15 2 / 2 0 / 1 1 / 1 1 / 0

10 | P a g e

Table 4. PDCoV: Number of Confirmed and Presumptive Positive Premises by Weeka (confirmed / presumptive)

WEEK a TOTAL IA IL IN KS KY MI MN MO MT NC NE OH PA SD TX

01/25/15 2 / 0 2 / 0

02/01/15 2 / 0 1 / 0 1 / 0

02/08/15 4 / 0 2 / 0 1 / 0 1 / 0

02/15/15 5 / 0 1 / 0 1 / 0 1 / 0 1 / 0 1 / 0

02/22/15 2 / 0 1 / 0 1 / 0

03/01/15 3 / 0 1 / 0 1 / 0 1 / 0

03/08/15 4 / 0 1 / 0 1 / 0 1 / 0 1 / 0

03/15/15 2 / 1 1 / 0 1 / 0 0 / 1

03/22/15 2 / 1 2 / 0 0 / 1

04/05/15 1 / 0 1 / 0

04/12/15 1 / 1 1 / 0 0 / 1

04/19/15 1 / 0 1 / 0

04/26/15 1 / 0 1 / 0

05/03/15 2 / 0 2 / 0

05/10/15 0 / 1 0 / 1

05/24/15 1 / 1 1 / 1

05/31/15 1 / 0 1 / 0

06/21/15 0 / 1 0 / 1

07/05/15 1 / 1 0 / 1 1 / 0

07/19/15 0 / 1 0 / 1

08/16/15 0 / 1 0 / 1

09/20/15 0 / 2 0 / 2

10/04/15 2 / 0 2 / 0

10/11/15 2 / 0 1 / 0 1 / 0

11/08/15 1 / 0 1 / 0

11/15/15 1 / 1 1 / 1

11/22/15 1 / 0 1 / 0

11/29/15 5 / 1 1 / 0 0 / 1 1 / 0 3 / 0

12/06/15 1 / 0 1 / 0

12/13/15 4 / 0 1 / 0 2 / 0 1 / 0

12/27/15 1 / 0 1 / 0

01/03/16 20 / 1 10 / 1 10 / 0

01/10/16 8 / 1 2 / 0 1 / 0 3 / 1 2 / 0

01/17/16 7 / 3 6 / 2 1 / 1

01/24/16 7 / 0 2 / 0 1 / 0 1 / 0 1 / 0 2 / 0

01/31/16 4 / 0 1 / 0 1 / 0 1 / 0 1 / 0

02/07/16 3 / 1 1 / 0 1 / 1 1 / 0

02/14/16 2 / 1 2 / 0 0 / 1

02/21/16 1 / 0 1 / 0

02/28/16 4 / 0 1 / 0 1 / 0 2 / 0

03/06/16 2 / 0 2 / 0

03/13/16 1 / 0 1 / 0

03/20/16 3 / 2 1 / 0 1 / 0 1 / 2

03/27/16 1 / 0 1 / 0

04/03/16 1 / 0 1 / 0

04/10/16 6 / 0 1 / 0 1 / 0 2 / 0 2 / 0

04/17/16 0 / 1 0 / 1

04/24/16 1 / 1 1 / 0 0 / 1

11 | P a g e

Table 4. PDCoV: Number of Confirmed and Presumptive Positive Premises by Weeka (confirmed / presumptive)

WEEK a TOTAL IA IL IN KS KY MI MN MO MT NC NE OH PA SD TX

05/08/16 2 / 0 2 / 0

05/15/16 1 / 0 1 / 0

TOTAL 177 / 52 69 / 13 18 / 5 11 / 5 2 / 0 1 / 0 2 / 3 29 / 8 1 / 1 0 / 1 18 / 3 12 / 3 6 / 10 4 / 0 3 / 0 1 / 0

Table 5. Dual Infection: Number of Confirmed and Presumptive Positive Premises by Weeka (confirmed / presumptive)

WEEKa TOTAL CA ID IL IN IA KS MI MN NE NC OH OK PA SD TX WY

06/01/14 1 / 1 0 / 1 1 / 0

06/08/14 2 / 7 0 / 1 1 / 1 0 / 1 0 / 1 1 / 1 0 / 1 0 / 1

06/15/14 1 / 3 0 / 1 1 / 0 0 / 1 0 / 1

06/22/14 3 / 6 0 / 1 0 / 1 0 / 1 2 / 1 1 / 1 0 / 1

06/29/14 1 / 1 1 / 1

07/06/14 4 / 3 1 / 0 1 / 1 1 / 0 1 / 0 0 / 1 0 / 1

07/13/14 0 / 1 0 / 1

07/20/14 1 / 0 1 / 0

07/27/14 1 / 0 1 / 0

08/10/14 1 / 0 1 / 0

08/17/14 1 / 0 1 / 0

08/24/14 0 / 1 0 / 1

09/14/14 1 / 0 1 / 0

09/28/14 1 / 0 1 / 0

10/05/14 0 / 1 0 / 1

10/12/14 1 / 0 1 / 0

10/19/14 1 / 0 1 / 0

11/02/14 1 / 1 0 / 1 1 / 0

11/16/14 0 / 1 0 / 1

12/07/14 2 / 0 1 / 0 1 / 0

12/14/14 1 / 0 1 / 0

12/28/14 1 / 0 1 / 0

01/04/15 3 / 0 1 / 0 1 / 0 1 / 0

01/11/15 2 / 1 2 / 1

01/18/15 5 / 0 1 / 0 2 / 0 1 / 0 1 / 0

01/25/15 2 / 0 2 / 0

02/01/15 6 / 1 2 / 0 2 / 1 1 / 0 1 / 0

02/08/15 4 / 1 3 / 0 0 / 1 1 / 0

02/15/15 3 / 0 1 / 0 1 / 0 1 / 0

02/22/15 1 / 1 1 / 1

03/01/15 2 / 0 1 / 0 1 / 0

03/08/15 0 / 1 0 / 1

03/15/15 1 / 0 1 / 0

03/22/15 1 / 0 1 / 0

03/29/15 1 / 1 1 / 1

04/12/15 2 / 0 1 / 0 1 / 0

04/19/15 4 / 1 3 / 0 1 / 0 0 / 1

04/26/15 4 / 0 3 / 0 1 / 0

05/10/15 3 / 0 1 / 0 2 / 0

12 | P a g e

Table 5. Dual Infection: Number of Confirmed and Presumptive Positive Premises by Weeka (confirmed / presumptive)

WEEKa TOTAL CA ID IL IN IA KS MI MN NE NC OH OK PA SD TX WY

06/28/15 1 / 0 1 / 0

07/19/15 1 / 0 1 / 0

08/09/15 0 / 1 0 / 1

08/30/15 1 / 0 1 / 0

11/15/15 1 / 0 1 / 0

11/22/15 3 / 0 1 / 0 2 / 0

11/29/15 4 / 0 4 / 0

12/06/15 1 / 1 1 / 0 0 / 1

12/20/15 1 / 0 1 / 0

01/03/16 12 / 1 1 / 0 9 / 1 1 / 0 1 / 0

01/10/16 11 / 0 7 / 0 3 / 0 1 / 0

01/17/16 6 / 0 5 / 0 1 / 0

01/24/16 4 / 0 3 / 0 1 / 0

01/31/16 5 / 0 4 / 0 1 / 0

02/07/16 5 / 0 3 / 0 1 / 0 1 / 0

02/14/16 4 / 0 1 / 0 1 / 0 2 / 0

02/21/16 3 / 0 3 / 0

02/28/16 2 / 0 1 / 0 1 / 0

03/06/16 2 / 1 1 / 1 1 / 0

03/13/16 3 / 0 1 / 0 1 / 0 1 / 0

03/20/16 2 / 0 1 / 0 1 / 0

03/27/16 1 / 0 1 / 0

04/03/16 1 / 0 1 / 0

04/10/16 2 / 0 2 / 0

04/17/16 2 / 0 1 / 0 1 / 0

04/24/16 2 / 0 1 / 0 1 / 0

05/08/16 3 / 0 3 / 0

TOTAL 152 / 37 1 / 0 0 / 1 3 / 4 12 / 3 84 / 11 1 / 0 3 / 4 22 / 5 7 / 1 5 / 1 11 / 4 1 / 0 0 / 2 1 / 0 1 / 0 0 / 1

aWeek sample was received at the laboratory for testing; weeks are not shown if there were no confirmed or presumptive positive premises for that week.

SECD Laboratory Testing Table 6. Biological Laboratory Accessions This Week and Cumulative since June 5, 2014

NEW THIS WEEK (MAY 15–21, 2016) PEDV PDCOV

Positive Accessions 56 11

Accessions Tested 497 493

Percent Positive 11.3% 2.2%

No. of NAHLN Labs Reporting 6

CUMULATIVE SINCE JUNE 5, 2014 PEDV PDCOV

Positive Accessions 8,514 917

Accessions Tested 68,940 39,855

Percent Positive 12.3% 2.3%

13 | P a g e

Table 7. Biological Accessions Tested and Number Positive by Month

MONTHc, d PEDV PDCOVb

TESTEDa POSITIVE % POS TESTED POSITIVE % POS

Before the Federal Order (FO)

Apr 2013 - 3 - - - - May 2013 - 112 - - - - Jun 2013 - 187 - - - - Jul 2013 - 113 - - - - Aug 2013 - 138 - - - - Sep 2013 - 134 - - - - Oct 2013 - 267 - - - - Nov 2013 1,064 414 38.9% - - - Dec 2013 2,294 630 27.5% - - - Jan 2014 2,774 953 34.4% - - - Feb 2014 3,650 1,228 33.6% - - - Mar 2014c 3,601 1,123 31.2% 45 7 15.6% Apr 2014 3,775 1,053 27.9% 947 124 13.1% May 2014 3,590 757 21.1% 1,042 112 10.7% Jun 2014 (through 6/4/14) 489 84 17.2% 140 15 10.7% Total Before FO 21,128 6,976 33.0% 2,172 260 12.0%

After the Federal Order (starting 6/5/2014)

Jun 2014 2,772 408 14.7% 829 84 10.1% Jul 2014 3,555 409 11.5% 1,196 45 3.8% Aug 2014 3,095 311 10.0% 1,193 18 1.5% Sep 2014 3,144 261 8.3% 1,339 10 0.7% Oct 2014 3,306 300 9.1% 1,900 19 1.0% Nov 2014 2,507 303 12.1% 1,555 30 1.9% Dec 2014 3,238 446 13.8% 1,982 50 2.5% Jan 2015 3,104 508 16.4% 1,875 46 2.5% Feb 2015 2,987 463 15.5% 1,804 49 2.7% Mar 2015 3,305 597 18.1% 1,900 59 3.1% Apr 2015 3,029 451 14.9% 1,797 31 1.7% May 2015 2,751 303 11.0% 1,643 28 1.7% Jun 2015 2,814 232 8.2% 1,718 22 1.3% Jul 2015 2,830 226 8.0% 1,767 13 0.7% Aug 2015 2,462 154 6.3% 1,510 11 0.7% Sep 2015 2,666 196 7.4% 1,644 12 0.7% Oct 2015 2,681 262 9.8% 1,685 11 0.7% Nov 2015 2,422 269 11.1% 1,578 15 1.0% Dec 2015 2,976 456 15.3% 1,770 39 2.2% Jan 2016 2,920 495 17.0% 1,916 106 5.5% Feb 2016 2,918 513 17.6% 1,933 68 3.5% Mar 2016 3,127 422 13.5% 2,071 68 3.3% Apr 2016 2,875 379 13.2% 1,888 52 2.8%

14 | P a g e

aFrom April through October 2013, number of cases tested was not reported and calculation of Percent Positive was not possible. bNAHLN laboratories started sharing PDCoV testing results with VS on March 23, 2014.

cPre-FO data: Month refers to the month the sample was tested; after the FO, month refers to the month the laboratory received the sample for testing. dSamples in individual laboratory accession may be tested in subsequent months (e.g., start and end of the month), causing an individual accession to be counted in 2 months. Figure 3. PEDV: Biological Accessions Tested and Number Positive by Weeka

Figure 4. PDCoV: Biological Accessions Tested and Number Positive by Weeka

aWeek the sample was received at the laboratory for testing.

0100200300400500600700800900

1000

Num

ber o

f Acc

essi

ons

Week Received

PEDV Accessions Tested PEDV Positive Accessions

0100200300400500600700800900

1000

Num

ber o

f Acc

essi

ons

Week Received

PDCOV Accessions Tested PDCOV Positive Accessions

May 2016 1,492 155 10.4% 1,373 31 2.3% Total After FO 68,976 8,519 12.4% 39,866 917 2.3%

Grand Total 90,104 15,495 17.2% 42,038 1,177 2.8%

15 | P a g e

Table 8. PEDV Positive Laboratory Accessions by Weeka and Stateb

WEEK

TOTAL POS. ACCS. AL AZ CA CO GA HI IA ID IL IN KS KY MA MD MI MN MO MT NC ND NE NM NV NY OH OK OR PA PR SC SD TN TX UT VA WI WY UNK

06/01/14 48 5 2 2 4 17 10 2 4 1 1

06/08/14 112 29 14 3 1 1 3 18 9 10 10 1 5 4 3 1

06/15/14 120 20 15 5 1 1 7 35 11 9 4 3 1 4 2 1 1

06/22/14 118 21 1 21 6 3 18 11 7 10 8 4 1 6 1

06/29/14 84 1 22 14 2 1 2 1 13 6 1 7 4 5 3 1 1

07/06/14 93 1 3 24 11 3 1 3 16 7 9 4 3 3 3 2

07/13/14 83 1 11 11 2 1 4 15 9 5 6 6 5 3 1 2 1

07/20/14 94 1 18 2 11 3 4 15 4 8 2 7 5 1 6 4 3

07/27/14 94 1 3 18 18 2 1 18 6 7 4 1 1 4 1 2 4 3

08/03/14 64 2 11 8 3 1 2 5 8 5 5 4 1 2 3 2 2

08/10/14 79 2 2 16 17 2 17 3 6 3 1 1 3 3 2 1

08/17/14 75 2 1 14 10 3 1 4 16 7 6 3 1 2 1 1 1 2

08/24/14 64 2 12 7 1 1 1 4 10 5 6 4 1 1 2 1 3 3

08/31/14 55 1 1 8 11 2 2 8 5 3 1 2 2 2 3 2 2

09/07/14 71 1 1 14 1 10 1 1 2 17 5 8 2 1 2 1 1 3

09/14/14 68 1 2 18 1 6 2 1 7 8 7 1 1 1 6 2 3 1

09/21/14 54 2 2 14 11 1 1 1 3 9 1 2 3 1 1 1 1

09/28/14 50 1 1 14 5 4 2 7 4 3 1 3 1 2 1 1

10/05/14 66 1 1 1 10 12 4 1 2 9 5 7 1 3 1 2 1 4 1

10/12/14 74 1 1 20 6 3 1 3 11 8 2 1 1 2 3 5 2 2 1 1

10/19/14 58 1 1 15 6 1 5 10 4 6 2 1 1 4 1

10/26/14 67 1 2 14 10 4 8 4 3 2 1 2 3 4 4 3 2

11/02/14 81 1 15 5 3 5 1 2 3 9 4 10 14 2 1 2 4

11/09/14 86 11 13 1 12 1 9 6 3 3 1 5 1 7 1 3 9

11/16/14 83 1 1 2 6 1 6 14 2 3 4 1 5 4 1 14 8 1 2 7

11/23/14 51 11 9 6 1 4 6 6 2 2 4

11/30/14 112 1 2 24 7 2 13 2 11 3 12 1 2 9 2 6 2 3 10

16 | P a g e

Table 8. PEDV Positive Laboratory Accessions by Weeka and Stateb

WEEK

TOTAL POS. ACCS. AL AZ CA CO GA HI IA ID IL IN KS KY MA MD MI MN MO MT NC ND NE NM NV NY OH OK OR PA PR SC SD TN TX UT VA WI WY UNK

12/07/14 114 1 1 1 26 16 3 3 1 1 19 10 9 2 1 2 5 4 2 2 5

12/14/14 120 1 1 2 2 38 1 12 2 6 2 10 11 6 1 1 6 1 1 6 3 1 2 4

12/21/14 51 1 2 13 9 2 3 6 2 4 2 1 2 3 1

12/28/14 59 1 1 30 7 1 1 5 3 2 1 2 1 1 1 2

01/04/15 115 1 3 2 37 1 12 2 3 1 10 9 11 1 1 5 1 1 7 1 1 5

01/11/15 120 1 3 50 1 6 2 2 1 1 17 6 10 2 1 4 1 6 2 1 1 2

01/18/15 138 2 2 46 1 18 5 2 1 14 8 21 4 1 3 1 2 2 1 4

01/25/15 126 1 1 40 1 17 5 5 1 6 7 19 1 2 4 2 5 1 8

02/01/15 113 1 40 8 3 1 2 11 11 17 2 1 3 1 3 4 3 1 1

02/08/15 106 1 1 37 14 2 1 1 1 4 8 19 1 2 2 2 3 1 6

02/15/15 125 1 40 1 9 5 2 6 15 24 3 1 2 7 1 1 1 6

02/22/15 119 1 39 11 1 4 2 5 13 29 2 1 1 3 1 1 3 1 1

03/01/15 136 5 45 6 5 1 1 7 11 36 1 3 3 1 3 2 1 1 4

03/08/15 161 1 54 11 7 7 3 7 13 31 4 3 3 2 5 8 2

03/15/15 124 33 1 12 8 2 7 7 36 3 1 3 2 1 4 1 1 2

03/22/15 139 1 47 10 9 4 2 9 10 27 2 4 2 2 4 2 4

03/29/15 107 1 34 4 4 3 2 10 9 26 1 2 2 5 1 3

04/05/15 120 1 42 1 4 6 2 1 6 19 23 3 3 2 1 1 2 1 2

04/12/15 113 40 3 8 3 1 1 8 13 25 1 2 2 1 1 2 2

04/19/15 94 35 4 6 2 16 5 10 2 1 1 5 3 1 2 1

04/26/15 77 21 3 2 3 1 14 7 13 2 1 6 1 2 1

05/03/15 85 25 1 6 1 1 10 9 12 3 3 1 2 3 2 2 4

05/10/15 82 1 22 1 11 7 8 15 2 2 1 1 1 6 2 2

05/17/15 57 1 14 7 2 2 6 7 9 1 1 2 2 2 1

05/24/15 57 1 4 15 1 2 2 2 2 9 4 5 1 1 1 4 1 1 1

05/31/15 68 1 29 4 2 1 5 6 10 1 1 3 2 1 2

06/07/15 48 1 11 1 4 1 1 1 3 2 8 1 1 1 6 4 1 1

17 | P a g e

Table 8. PEDV Positive Laboratory Accessions by Weeka and Stateb

WEEK

TOTAL POS. ACCS. AL AZ CA CO GA HI IA ID IL IN KS KY MA MD MI MN MO MT NC ND NE NM NV NY OH OK OR PA PR SC SD TN TX UT VA WI WY UNK

06/14/15 47 2 14 2 5 3 5 6 1 5 1 1 2

06/21/15 58 1 1 14 2 3 1 7 6 2 2 1 8 6 2 2

06/28/15 47 1 16 1 1 3 5 8 6 3 3

07/05/15 60 1 9 2 1 7 8 7 1 7 1 6 4 3 3

07/12/15 52 3 12 5 1 5 8 5 1 7 2 2 1

07/19/15 39 1 5 1 2 1 7 4 5 1 1 5 5 1

07/26/15 39 13 3 1 3 5 5 1 1 5 1 1

08/02/15 37 1 1 8 1 1 2 7 6 1 4 4 1

08/09/15 30 2 1 1 2 5 4 6 1 5 2 1

08/16/15 32 2 6 2 4 7 2 1 5 2 1

08/23/15 52 2 1 15 1 2 3 1 4 1 10 2 5 5

08/30/15 47 3 14 1 4 5 6 7 2 3 1 1

09/06/15 42 4 8 1 1 6 4 6 1 3 6 2

09/13/15 41 4 8 2 1 1 1 2 7 1 4 3 5 2

09/20/15 38 2 1 3 2 2 1 1 5 2 2 1 1 7 6 2

09/27/15 56 3 8 4 3 1 5 15 1 4 8 3 1

10/04/15 61 3 10 2 1 3 5 20 2 1 2 10 2

10/11/15 53 1 4 2 1 7 2 20 2 1 2 5 3 3

10/18/15 61 5 11 3 3 3 8 7 12 1 1 2 2 3

10/25/15 61 3 8 3 1 1 3 10 16 1 1 1 1 10 2

11/01/15 66 2 13 4 3 4 4 20 1 1 3 1 2 6 2

11/08/15 57 14 4 3 1 1 4 4 14 2 8 1 1

11/15/15 65 2 19 1 2 4 5 16 3 9 1 3

11/22/15 60 1 1 16 1 2 1 13 5 16 1 1 1 1

11/29/15 106 2 1 14 1 6 2 2 1 9 6 37 4 1 4 1 11 4

12/06/15 100 1 34 4 4 4 5 35 1 2 2 2 5 1

12/13/15 110 1 2 1 29 2 11 4 1 40 1 1 6 8 3

18 | P a g e

Table 8. PEDV Positive Laboratory Accessions by Weeka and Stateb

WEEK

TOTAL POS. ACCS. AL AZ CA CO GA HI IA ID IL IN KS KY MA MD MI MN MO MT NC ND NE NM NV NY OH OK OR PA PR SC SD TN TX UT VA WI WY UNK

12/20/15 75 24 2 2 4 6 23 2 1 7 2 2

12/27/15 86 22 1 5 3 1 8 8 23 2 2 1 1 5 4

01/03/16 133 47 6 4 1 8 6 32 1 3 1 2 1 7 5 9

01/10/16 125 45 7 2 1 12 12 35 1 2 3 2 3

01/17/16 122 38 1 6 3 12 10 30 1 1 1 1 5 10 3

01/24/16 115 48 4 2 11 10 24 2 2 3 3 4 2

01/31/16 133 38 10 6 2 1 2 16 7 32 1 4 1 5 3 5

02/07/16 136 40 1 4 6 4 2 15 14 29 2 3 3 1 4 5 3

02/14/16 115 33 1 3 1 2 1 14 15 24 3 1 3 1 4 4 5

02/21/16 118 40 2 3 1 1 1 17 10 31 1 2 1 1 2 2 3

02/28/16 103 28 4 4 1 9 9 26 2 2 6 2 3 2 5

03/06/16 96 19 3 2 1 16 13 23 1 8 2 1 1 3 3

03/13/16 95 1 29 6 2 1 10 17 12 3 3 2 2 4 3

03/20/16 70 2 17 4 4 7 7 14 1 3 2 1 1 3 4

03/27/16 91 1 1 28 5 3 2 9 7 14 5 2 5 1 2 4 1 1

04/03/16 119 1 41 7 2 3 4 9 10 26 4 1 2 1 5 3

04/10/16 77 1 1 21 4 2 1 10 12 10 5 1 1 4 1 2 1

04/17/16 79 1 26 2 1 1 15 9 8 1 2 1 1 1 4 2 4

04/24/16 80 1 15 2 1 3 1 9 7 30 2 2 3 1 2 1

05/01/16 43 16 4 1 1 1 8 5 3 1 3

05/08/16 55 1 14 4 4 1 8 5 7 2 3 2 1 3

05/15/16 56 13 3 3 2 1 5 7 12 2 2 1 1 2 2

TOTALc 8,517 2 70 53 37 8 5 2,283 30 672 237 189 25 1 2 118 920 747 4 1,432 4 174 2 2 4 144 245 2 37 1 7 111 2 323 290 6 13 102 213 aWeek the sample was received at the laboratory for testing; weeks are not listed if there were no positive accessions for that week. bFor SECD laboratory testing data, the State is the collection site State that was reported by the laboratory to USDA. cSamples in an individual laboratory accession may be tested in subsequent weeks (at the start and end of the week), causing an individual accession to be counted in 2 weeks. For this reason, totals in Table 8 may be slightly higher than totals in Table 6.

19 | P a g e

Table 9. PDCoV Positive Laboratory Accessions by Weeka and Stateb

WEEK TESTED

TOTAL POS. ACCS. CA IA ID IL IN KS KY MI MN MO MT NC NE OH OK PA SD TX WY UNK

06/01/14 9 1 4 1 2 1

06/08/14 23 1 2 2 1 4 2 1 2 1 2 2 3

06/15/14 33 2 1 2 18 1 6 1 2

06/22/14 15 1 1 3 5 1 2 2

06/29/14 8 2 1 1 1 1 2

07/06/14 17 9 1 1 1 3 1 1

07/13/14 14 1 2 1 2 1 5 1 1

07/20/14 7 1 1 2 1 1 1

07/27/14 8 1 3 2 2

08/03/14 3 1 2

08/10/14 3 1 1 1

08/17/14 6 1 1 1 1 2

08/24/14 1 1

09/07/14 1 1

09/14/14 2 1 1

09/21/14 3 1 1 1

09/28/14 5 3 1 1

10/05/14 4 1 1 1 1

10/12/14 4 1 1 1 1

10/19/14 5 3 1 1

10/26/14 5 4 1

11/02/14 10 1 1 1 2 1 2 1 1

11/09/14 11 1 5 2 1 2

11/16/14 6 2 1 2 1

11/23/14 3 2 1

11/30/14 5 2 2 1

12/07/14 11 4 2 5

12/14/14 17 5 1 6 2 1 1 1

12/21/14 10 2 6 2

12/28/14 7 2 2 1 2

01/04/15 15 1 3 1 3 1 2 2 1 1

01/11/15 10 4 1 1 2 1 1

01/18/15 18 3 1 3 3 2 4 1 1

01/25/15 3 1 1 1

02/01/15 11 2 1 1 1 2 2 1 1

02/08/15 12 4 2 2 1 1 2

02/15/15 15 2 1 1 1 1 1 3 2 1 1 1

02/22/15 8 2 2 1 1 1 1

20 | P a g e

Table 9. PDCoV Positive Laboratory Accessions by Weeka and Stateb

WEEK TESTED

TOTAL POS. ACCS. CA IA ID IL IN KS KY MI MN MO MT NC NE OH OK PA SD TX WY UNK

03/01/15 12 2 3 1 2 2 1 1

03/08/15 14 1 4 3 2 1 3

03/15/15 15 2 2 2 2 2 2 2 1

03/22/15 15 3 1 1 2 3 2 2 1

03/29/15 8 1 3 1 1 1 1

04/05/15 6 1 1 2 1 1

04/12/15 4 1 1 1 1

04/19/15 8 4 2 1 1

04/26/15 10 4 3 2 1

05/03/15 8 1 5 1 1

05/10/15 6 2 3 1

05/17/15 6 1 3 2

05/24/15 4 1 1 2

05/31/15 7 1 4 1 1

06/07/15 5 1 1 2 1

06/14/15 3 1 1 1

06/21/15 4 2 1 1

06/28/15 1 1

07/05/15 4 2 1 1

07/12/15 2 1 1

07/19/15 5 2 1 1 1

07/26/15 1 1

08/02/15 1 1

08/09/15 3 1 1 1

08/16/15 5 2 3

08/23/15 2 1 1

08/30/15 3 2 1

09/06/15 3 2 1

09/20/15 3 2 1

09/27/15 2 1 1

10/04/15 4 1 3

10/11/15 5 2 1 1 1

10/25/15 2 1 1

11/01/15 2 1 1

11/08/15 4 1 1 2

11/15/15 4 1 2 1

11/22/15 5 3 1 1

11/29/15 18 4 1 4 1 1 1 2 4

21 | P a g e

Table 9. PDCoV Positive Laboratory Accessions by Weeka and Stateb

WEEK TESTED

TOTAL POS. ACCS. CA IA ID IL IN KS KY MI MN MO MT NC NE OH OK PA SD TX WY UNK

12/06/15 3 2 1

12/13/15 7 2 2 1 2

12/20/15 3 2 1

12/27/15 8 2 1 1 3 1

01/03/16 45 23 1 2 17 1 1

01/10/16 23 10 1 1 2 8 1

01/17/16 22 13 1 1 5 1 1

01/24/16 16 7 1 1 2 3 1 1

01/31/16 11 4 1 2 3 1

02/07/16 20 7 1 3 2 2 1 2 1 1

02/14/16 17 4 1 3 1 4 3 1

02/21/16 16 6 2 4 1 1 2

02/28/16 17 5 1 3 1 2 3 1 1

03/06/16 19 6 1 3 2 2 1 2 2

03/13/16 12 4 2 3 1 1 1

03/20/16 15 3 3 1 1 1 2 2 1 1

03/27/16 10 2 1 2 1 1 1 1 1

04/03/16 9 3 1 1 1 2 1

04/10/16 15 5 1 1 3 3 2

04/17/16 9 3 2 1 1 1 1

04/24/16 15 6 2 2 1 1 2 1

05/01/16 8 1 2 3 2

05/08/16 12 6 1 1 1 1 2

05/15/16 11 2 1 3 1 2 2

TOTAL 905 11 243 26 129 66 7 2 73 133 17 1 52 28 42 11 7 15 9 1 32 aWeek the sample was received at the laboratory for testing; weeks are not listed if there were no positive accessions for that week. bFor SECD laboratory testing data, the State is the collection site State that was reported by the laboratory to USDA.

cSamples in an individual laboratory accession may be tested in subsequent weeks (at the start and end of the week), causing an individual accession to be counted in two weeks. For this reason, totals in Table 9 may be slightly higher than totals in Table 6.

Notes About Data Used in This Report • This report is posted on the USDA SECD Web site (www.aphis.usda.gov/animal-health/secd). This Web site also

provides information on SECD laboratory testing prior to the Federal Order (April 2013–June 2014), and information on SECD reporting, case definitions, herd plans, vaccines, and the Federal response.

• Dual infection indicates a premises that is positive for both PEDV and PDCoV.

• Premises statuses are assigned in accordance with the Novel Swine Enteric Coronavirus Disease Case Definition (available online at www.aphis.usda.gov/animal-health/secd). A confirmed positive premises is a premises where pigs tested positive and have clinical signs. A presumptive positive premises is a premises where pigs tested positive but have nonspecific, unknown, or no clinical signs consistent with SECD. Please see the official SECD Case Definition for more information (www.aphis.usda.gov/animal-health/secd).

22 | P a g e

• Some positive premises may have a change in their type of positive status over time. For example, with the onset of clinical signs, a presumptive positive premises may be reclassified to a confirmed positive premises. Or PEDV positive premises may be reclassified to a dual infection status with the laboratory diagnosis of PDCoV. Therefore, the number of cumulative positive statuses will be slightly more than the sum of the number of current positive statuses and positive statuses reclassified as negative (see Table 1).

• Table 1 describes premises that are confirmed “this week”; this refers to premises that were investigated and determined to be presumptive or confirmed according to SECD case definition criteria during the current report week. Data presented in Tables 2-4 and Figures 1-2 provide epidemiologic trends, and data are presented based on the week the specimen was received by the testing laboratory.

• In general, a laboratory accession is a set of samples collected at a single premises on a single day and submitted to the laboratory. A single herd or premises may be tested multiple times, and the same herd or premises may be represented in a large number of laboratory accessions. Because a single premises may repeatedly be represented in subsequent lab accessions, fluctuations in the lab accession data in this report do not accurately depict epidemiologic trends. The numbers of confirmed or presumptive positive premises provided in the first section of this report are better epidemiologic indicators.

• Laboratory accession data in this report include only PCR results from testing on biological samples; testing on environmental or feed samples is not included.

• In the laboratory accession section of this report, State is the Collection State reported by the testing laboratory to USDA; State of origin data provided by laboratories is not verified by USDA. However, USDA staff verifies the locations of premises associated with positive laboratory accessions and they are reported in the premises section of this report.

• NAHLN laboratories that have reported SECD testing data to the USDA–APHIS–VS since June 5, 2014, include: Arkansas Livestock & Poultry Commission Laboratory; University of Georgia, Athens; University of Illinois Veterinary Diagnostic Laboratory; Illinois Department of Agriculture, Galesburg Animal Disease Laboratory; Iowa State University Veterinary Diagnostic Laboratory; Kansas State Veterinary Diagnostic Laboratory; Michigan State University Diagnostic Center for Population and Animal Health; University of Minnesota Veterinary Diagnostic Laboratory; Missouri Department of Agriculture Veterinary Diagnostic Laboratory; University of Nebraska Veterinary Diagnostic Center; Rollins Diagnostic Laboratory, North Carolina Department of Agriculture; North Dakota State University Veterinary Diagnostic Laboratory; Ohio Animal Disease Diagnostic Laboratory–Ohio Department of Agriculture; Oregon State University Veterinary Diagnostic Laboratory; Indiana Animal Disease Diagnostic Laboratory at Purdue University; Animal Disease Research & Diagnostic Laboratory–South Dakota State University; and Texas Veterinary Medical Diagnostic Laboratory. Data in this report do not include testing data from private diagnostic laboratories or testing data for research projects.

• Data summaries provided in this report reflect the most current and complete data available at the time of report preparation; summaries in this report may differ from those provided in past reports.


Recommended