Anne Arundel County, Maryland Comprehensive Annual Financial Report For the Fiscal Year Ended June 30, 2020 County Executive Steuart Pittman County Council Allison Pickard - Chairperson Sarah Lacey – Vice Chairperson Amanda Fiedler Jessica Haire Andrew C. Pruski Lisa Brannigan Rodvien Nathan Volke Prepared by: Office of Finance – Karin McQuade, Controller
Transcript
Anne Arundel County, Maryland
Comprehensive Annual Financial Report
For the Fiscal Year Ended June 30, 2020
County Executive
Steuart Pittman
County Council
Allison Pickard - Chairperson
Sarah Lacey – Vice Chairperson
Amanda Fiedler
Jessica Haire
Andrew C. Pruski
Lisa Brannigan Rodvien
Nathan Volke
Prepared by: Office of Finance – Karin McQuade, Controller
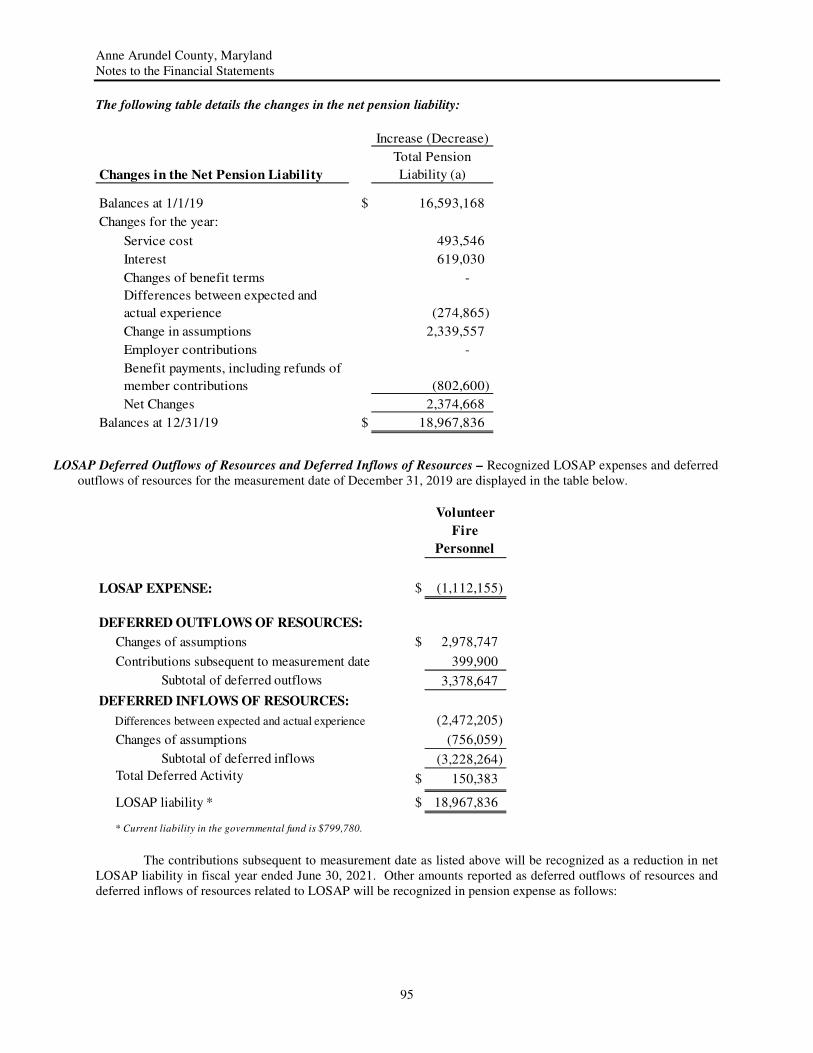
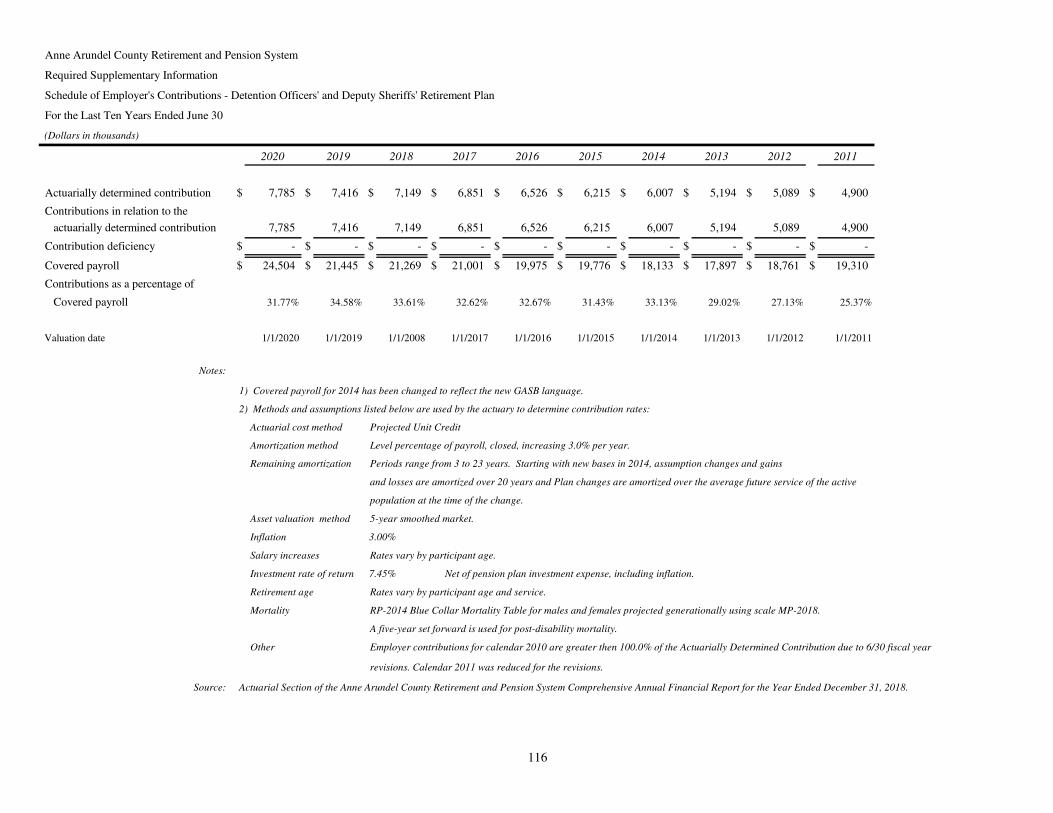
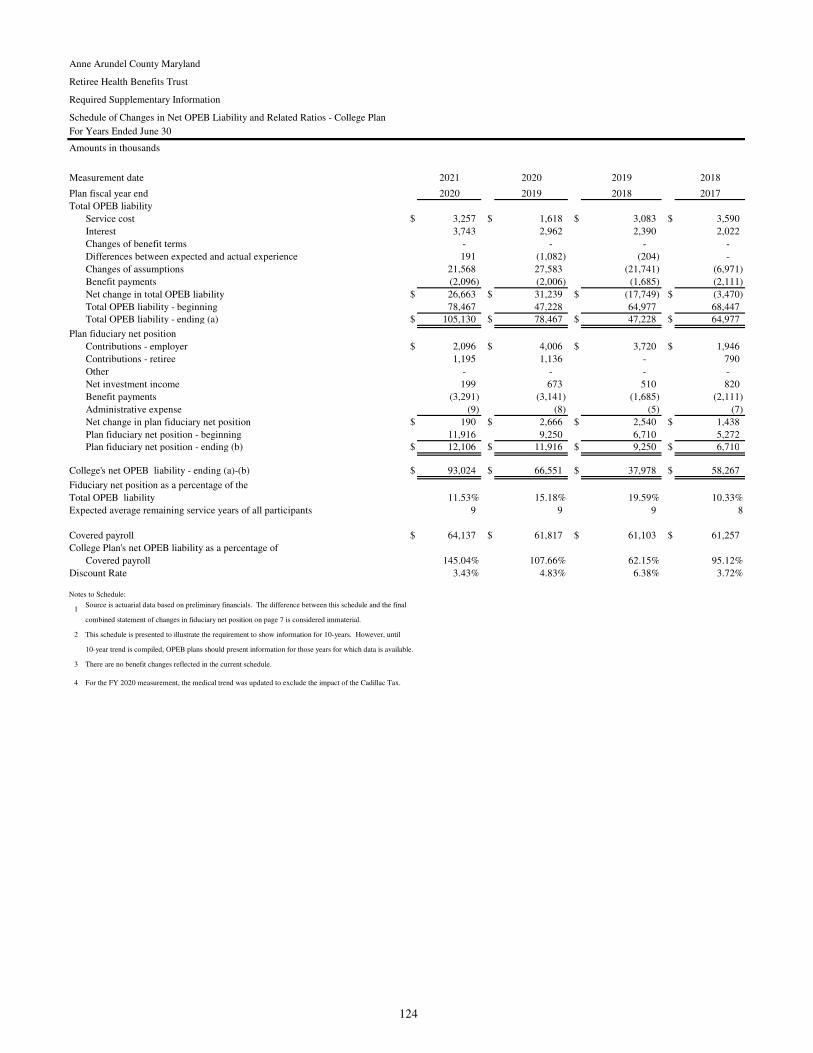
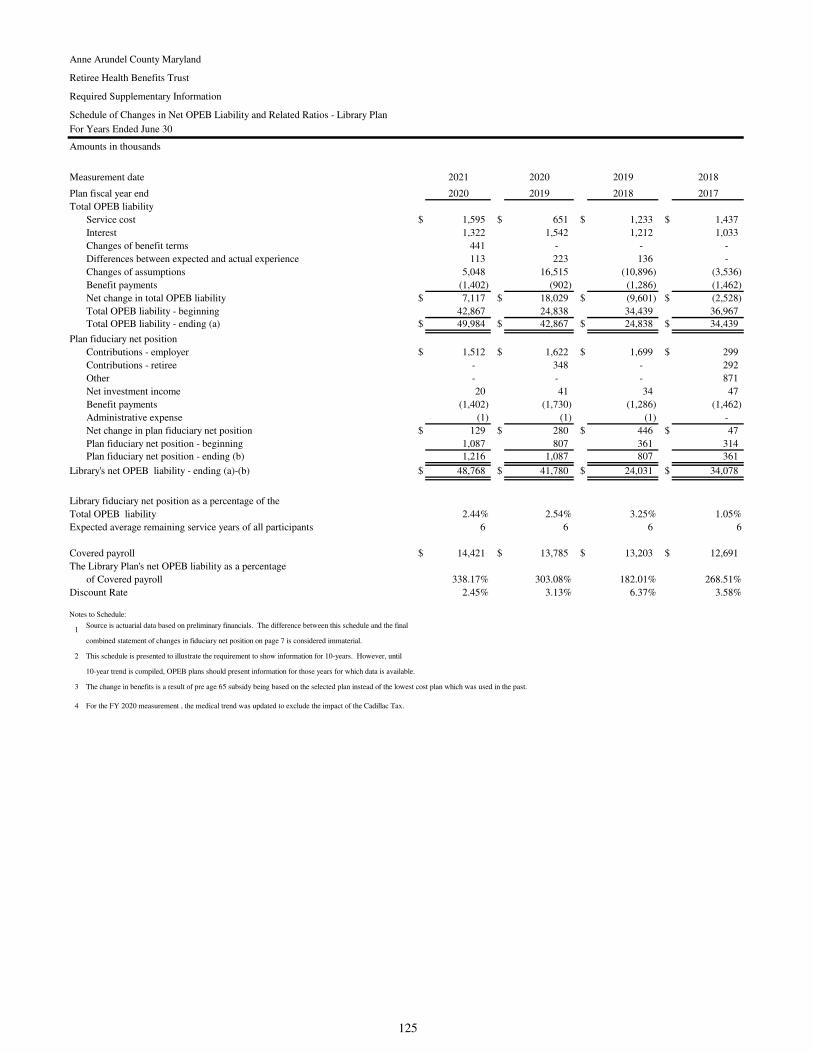
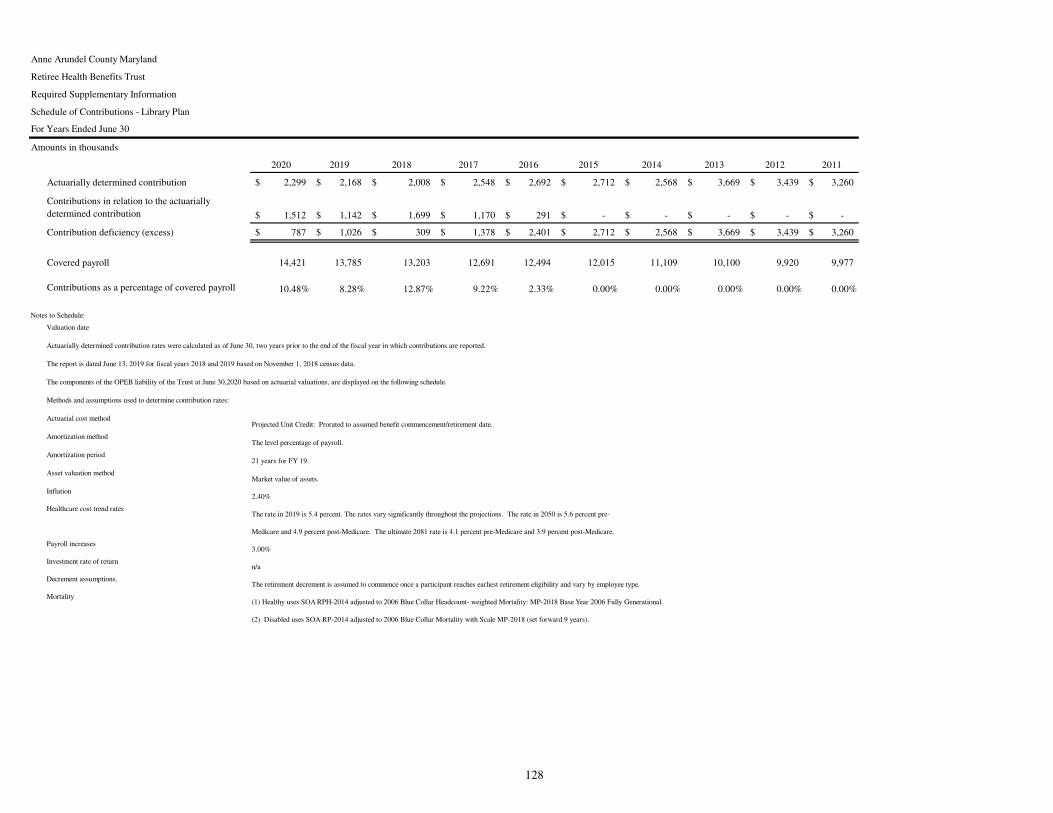
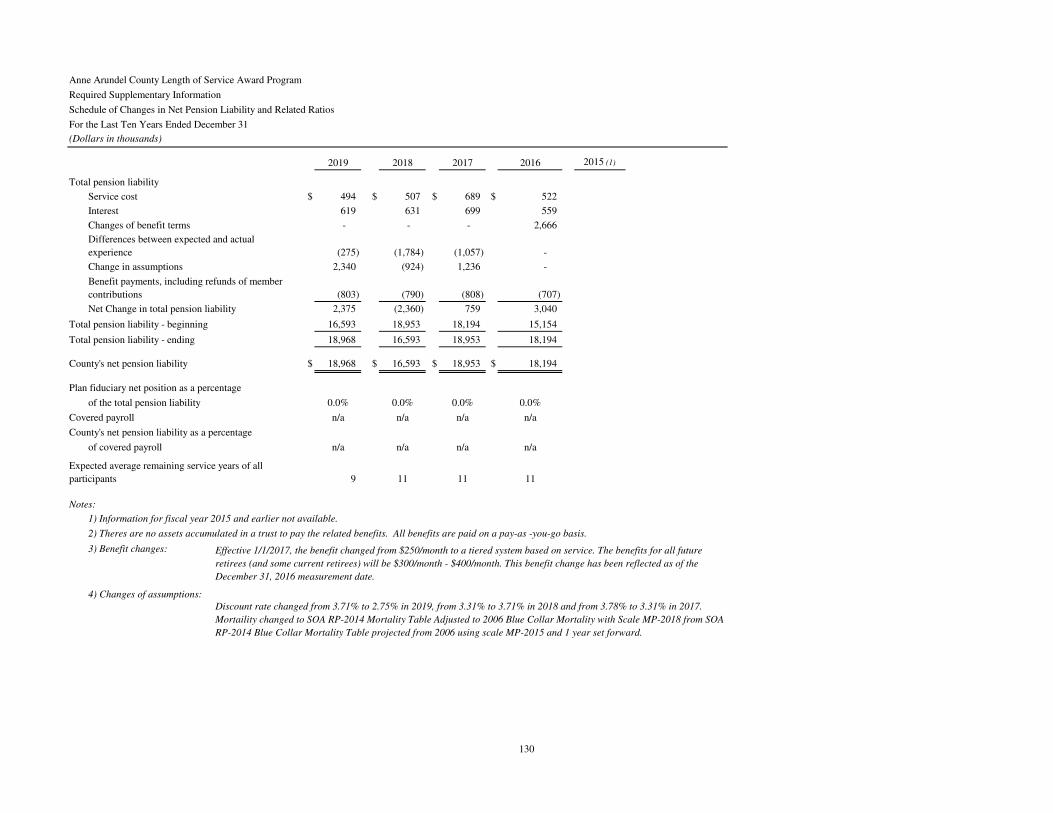
Schedule of Changes in Anne Arundel County's Length of Service Award Program (LOSAP) Net Pension Liability and Related Ratios . . . . . . . . . . . . . . . . . . .130
Combining Fund Statements, Budgetary Statements, and Other Supporting Schedules
County Executive ARUNDEL CENTER Controller P.O. BOX 2700
ANNAPOLIS, MARYLAND 21404-2700
(410) 222-1781
December 17, 2020
The Honorable County Executive, The Members of the County Council, Chief Administrative Officer and Citizens of Anne Arundel County, Maryland I am pleased to submit to you, the Comprehensive Annual Financial Report (CAFR) of Anne Arundel County, Maryland (the County) for the fiscal year ended June 30, 2020, in compliance with the Anne Arundel County Charter Section 513. The purpose of this report is to comply with the County Charter and to provide you and the taxpayers of Anne Arundel County with sufficient information to evaluate the County’s financial performance during fiscal year 2020. This report was prepared by the Office of Finance of Anne Arundel County. The basic financial statements have been audited by the County’s independent public accountants, CliftonLarsonAllen LLP, and their unmodified (“clean”) opinion is included in this report. The responsibility for the accuracy and fairness of the presentation, including all disclosures, rests with the County. We believe the data as presented to be accurate in all material respects and to reflect fairly the financial position and results of operations for the various funds. Management is responsible for establishing and maintaining an internal control structure designed to ensure that the assets of the government are protected from loss, theft or misuse and to ensure that adequate accounting data are compiled for the preparation of financial statements in conformity with accounting principles generally accepted in the United States of America (GAAP). The internal control structure is designed to provide reasonable, but not absolute, assurance that the financial statements will be free from material misstatement. The concept of reasonable assurance recognizes that: 1) the cost of a control should not exceed the benefits likely to be derived and 2) the valuation of costs and benefits requires estimates and judgments by management. GAAP requires that management provide a narrative introduction, overview and analysis to accompany the basic financial statements in the form of Management’s Discussion and Analysis (MD&A). This letter of transmittal is designed to complement the MD&A and should be read in conjunction with it. The County’s MD&A can be found immediately following the auditors’ reports.
2
ANNE ARUNDEL COUNTY
About Anne Arundel County Anne Arundel County was named for England’s Lady Anne of Arundell, beloved wife of Cecil Calvert, second Baron Baltimore. Married at 13 and the mother of many, her intellect was legend, and her love of the arts strong. The expedition to St. Mary’s in Maryland was planned in her sitting room in Tisbury, England. History records indicate that both she and Cecil Calvert longed to voyage to the New World, although neither made it. Her son Charles, the third Lord Baltimore, and Cecil’s younger brother Leonard Calvert, who later became Maryland’s first proprietary governor, were the first family members to step on Maryland soil. Anne of Arundell died at the age of 34. Her husband had engraved on her tombstone, “Farewell, you most lovely of earthly beauties”. The following year, in 1650, the General Assembly of the Maryland Colony named this County in her honor.
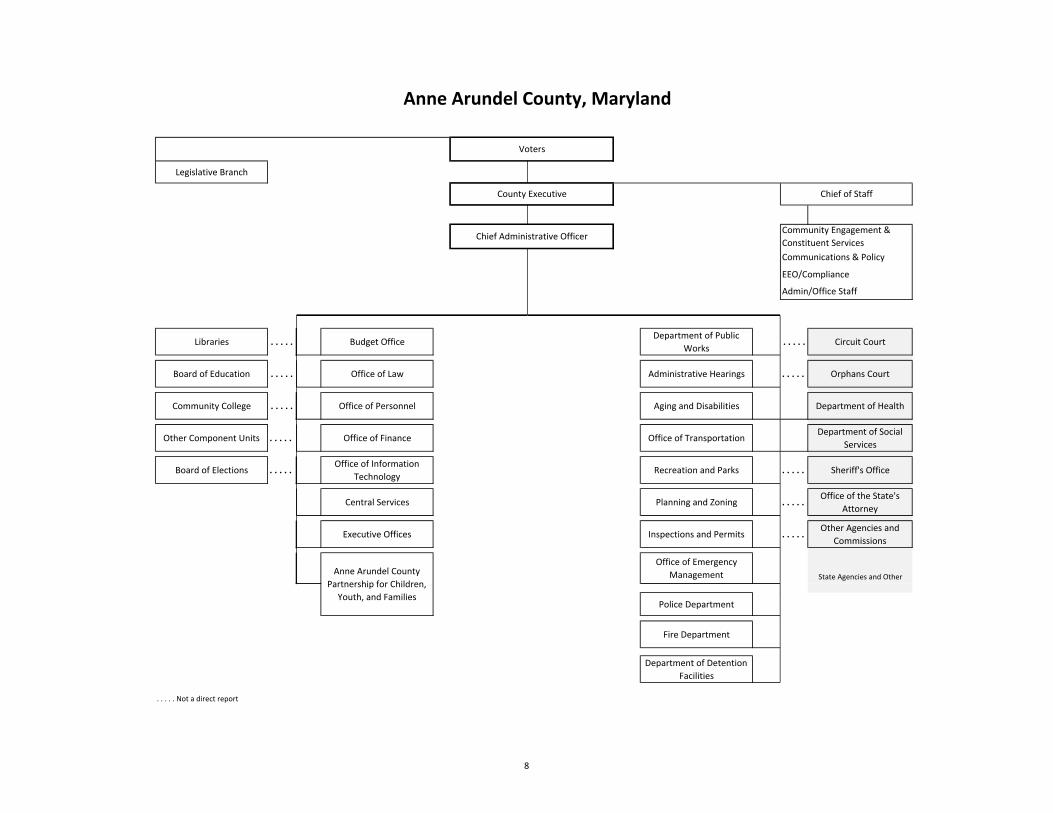
Profile of the Government Under a home rule charter, the County’s executive functions are vested in the elected County Executive, who is the chief executive officer of the County. The County Executive is generally responsible for the proper and efficient operation and management of the Executive Branch and administration of the affairs of the County. The County Executive is elected at-large to serve a four-year term. The County’s elected legislative body, the County Council, consisting of seven members, is vested with law making power. The Council selects a Chairman and Vice Chairman of the County Council annually. The Council members are elected by district and hold office for a term of four years. Both the County Council members and the County Executive are limited to two consecutive four-year terms. The County is located thirteen miles east of Washington, D.C. with Baltimore City and Baltimore County as its northern boundary and the Chesapeake Bay as its entire eastern boundary. The State of Maryland’s (State) capital, Annapolis, is an incorporated municipality located within the County.
Budgetary Controls The annual budget serves as the foundation for the County’s financial and budgetary controls to ensure compliance with legal provisions embodied in the annual appropriation ordinance approved by the County Council. The County budget is comprised of the budget message, current expense budget and the capital budget and capital program. Activities of the general fund and impact fee fund (annually appropriated major governmental funds) and certain special revenue funds and debt service funds (annually appropriated non-major governmental funds) are included in the current expense budget. The current operating expense budget includes appropriations for the full range of basic services as articulated in its Charter. These services include public safety, education, public works, community services, general government, legislative and judicial, and capital, debt and reserves. The capital budget includes funds to construct major governmental facilities such as roads, bridges, schools, libraries, water and sewer infrastructure and fire stations. Capital projects usually take more than a year to complete, unlike the operating budget which covers only a year. The budget process begins each fall when the County departments receive budget preparation instructions for the capital budget. The capital budget preparation is directed by the Chief Administrative Officer and the Budget Office. For the current expense budget, the County departments receive budget preparation guidance from the Chief Administrative Officer in December. A Spending Affordability Committee is appointed by the County Executive and confirmed by the County Council and makes advisory recommendations relating to County spending levels to reflect the ability of the taxpayer to finance County services and long-term debt. A Planning Advisory Board, appointed by the County Executive, reviews the itemized list of capital projects which agencies propose to undertake in the ensuing fiscal year and the succeeding five fiscal years and makes recommendations.
3
ANNE ARUNDEL COUNTY
After a thorough review of the departmental requests, the comprehensive budget document is submitted to the County Council on May 1st. The County Council then conducts a series of public hearings and work sessions to review the proposed budget. The County Council cannot alter revenue estimates or increase any expenditure for current or capital purposes, unless expressly provided in State law and to correct mathematical errors. The County Council can reduce the County Executive’s budget, but not increase it, except in the case of the Board of Education’s budget. After its review, the County Council finalizes the budget and sets tax rates, fees and charges needed to generate enough revenue to balance the budget. The budget must be adopted by the County Council on or before the fifteenth day of the last month of the fiscal year currently ending. The Office of Finance is responsible for budgetary control. Expenditure authority for the operating budget is at the fund and department level in major categories including personnel costs, operating expenses, and capital costs. Appropriations in the capital budget are at the project level on an annual basis. Expenses and encumbrances cannot exceed legally adopted appropriation. The County maintains an encumbrance system for budgetary control. All unencumbered appropriations of the operating budget lapse at year end. Unencumbered capital appropriations continue until the specific capital project is closed.
Factors Affecting Financial Condition
The information presented in the financial statements is perhaps best understood when it is considered from the broader perspective of the specific environment within which the County operates. Local Economy: Anne Arundel has one of the strongest economies in Maryland and continues to be a leader for job growth in the State. Anne Arundel County benefits from its corridor location between two large metropolitan areas. The result of this geography is Anne Arundel’s placement in the “Washington-Baltimore-Arlington, DC-MD-VA-WV-PA Combined Statistical Area,” the fourth largest United States market, as defined by the U.S. Census Bureau. This combined region contains a population of more than 9.8 million and its jurisdictions have household incomes at the highest levels in the country.
The County has six drivers of regional economic and employment activity located within its boundary:
1) The City of Annapolis 2) Baltimore-Washington International Thurgood Marshall Airport (BWI-TM airport) 3) Fort George G. Meade and its tenants 4) Arundel Mills & Live Casino/Hotel 5) Two Regional Hospitals 6) Northern Industrial Belt
The City of Annapolis is an independent municipality that supports some 30,086 jobs generated by the combined attributes of it being a major federal, state and county government center, a national historic tourist destination and a maritime recreational center with a reputation of being “America’s Sailing Capital”. It is also host to the U.S. Naval Academy. According to the Economic Impact of BWI Marshall Airport, in fiscal year 2017, the airport supported 12,753 direct jobs and contributed $9.3 billion to the Maryland economy. It is the 24th busiest U.S. airport providing 688 flights per day and serving nearly 27 million visitors in 2019. Fort Meade is a 5,067-acre federal facility that hosts 119 tenant organizations with an estimated total employment on base of 57,327 military and civilians, which translates into $9.0 billion in annual compensation and overall economic impact of $21.6 billion. Major tenants on the base include National Security Agency, Defense Information Systems Agency and the expanding U.S. Cyber Command.
4
ANNE ARUNDEL COUNTY
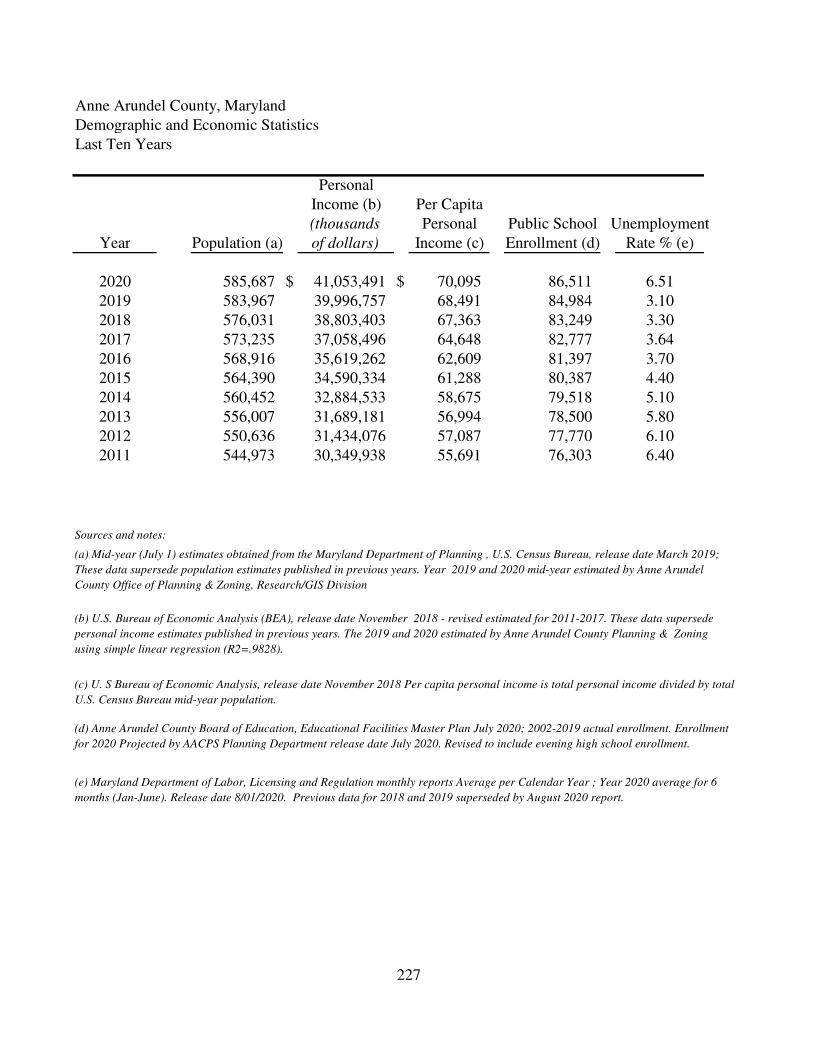
Arundel Mills is a major retail, entertainment, office and hospitality center in western Anne Arundel County. Its development history began 20 years ago with support from County Tax Increment Financing investment for infrastructure. In addition to regional retail, there are ten hotels, two office buildings and the Live Casino. To complement its entertainment venue, Live opened a 310-room hotel at the casino. In 2019, Live opened a new 75,000 square foot, three-story multi-use concert and event venue with VIP boxes, balcony views, and 4,000 seats. Two regional hospitals – Anne Arundel Medical Center and the University of Maryland Baltimore Washington Medical Center, with affiliations to Johns Hopkins and University of Maryland, provide healthcare services to the County residents and the extended area. Related medical offices and service providers help build a vibrant medical services industry for the region. The northern tier of Anne Arundel is home to BWI Thurgood Marshall Airport and Northrop Grumman’s Mission Systems division, a significant product logistics company which is also the largest private employer in the County. Northern Anne Arundel County also benefits from its proximity to other assets within the Greater Baltimore region such as the Port of Baltimore, major rail and highway routes, and Trade Point Atlantic, a 3,300 acre development that includes manufacturing, warehouses and deep-water berths. The facility has over eight million square feet of existing warehouse space with an additional eight million square feet for future development. Trade Point Atlantic is projected to generate 11,000 permanent jobs. Workforce: Anne Arundel County’s civilian workforce measuring more than 312,000 workers serves businesses, government agencies and institutions throughout the Washington-Baltimore Region. Within the County, there are approximately 274,465 “in-place” jobs (the County’s largest employer, the National Security Agency, does not report its employee numbers to any of the State or County statistical reporting agencies). The County’s workforce is highly skilled with an educational attainment that reports 41.7% workers 25 years and older with a bachelor’s or advanced graduate degree. The fiscal year 2020 average unemployment rate for Anne Arundel County is 4.4% as compared to the average for 2019 of 3.2 %. This rate is favorable in contrast to the average State unemployment rate of 5.0% and the average national rate of 6.0%. Industry Sectors: Anne Arundel County is fortunate to have a diverse range of industries that provide employment. Sectors that have seen continuously expanded employment since 2010 include Trade/Transportation and Utilities, Government, Professional and Business Services, Leisure and Hospitality, and Education and Health Services. In calendar year 2019, strong gains were also seen in the Manufacturing, Construction, Education and Health Services, and Professional and Business Services sectors. The County continues to experience all-time highs in payroll employment with 274,465 jobs currently in the County. Housing Market: The number of housing units sold in Anne Arundel County is up 10.1% from fiscal year 2019 at 8,461 units to 9,313 units in fiscal year 2020. In addition, the median price for existing homes is up 4.2% from $345,078 in fiscal year 2019 to $359,613 in fiscal year 2020. Additionally, the number of housing units available continues to rise and has grown by 15,185 over the past nine years to keep pace with an increasing population that was estimated at 579,234 at the end of 2019. Commercial Real Estate: Currently there is 61,675,316 square feet of commercial real estate in Anne Arundel County representing 1,964 properties. The average vacancy rate for all commercial property (office, flex, industrial) in the County is 9.8%, down slightly from the five-year average of 10.2%. Average rental rates are $16.32 per square foot, up when compared to the five-year average cost at $15.66 per square foot. Current average rental rates per square foot are $26.72 for office, $13.18 for flex and $8.36 for industrial space. Summary: The steady growth and expansion of Anne Arundel’s economic drivers, along with its highly skilled workforce and proximity to other regional assets, continues to provide endurance and strength for the County’s economy. Although, the number of housing units sold in the County has declined, the median price for existing homes has risen, and the number of available units is increasing year over year. Altogether, these factors position Anne Arundel County to continue to be a leader for job growth in the State.
5
ANNE ARUNDEL COUNTY
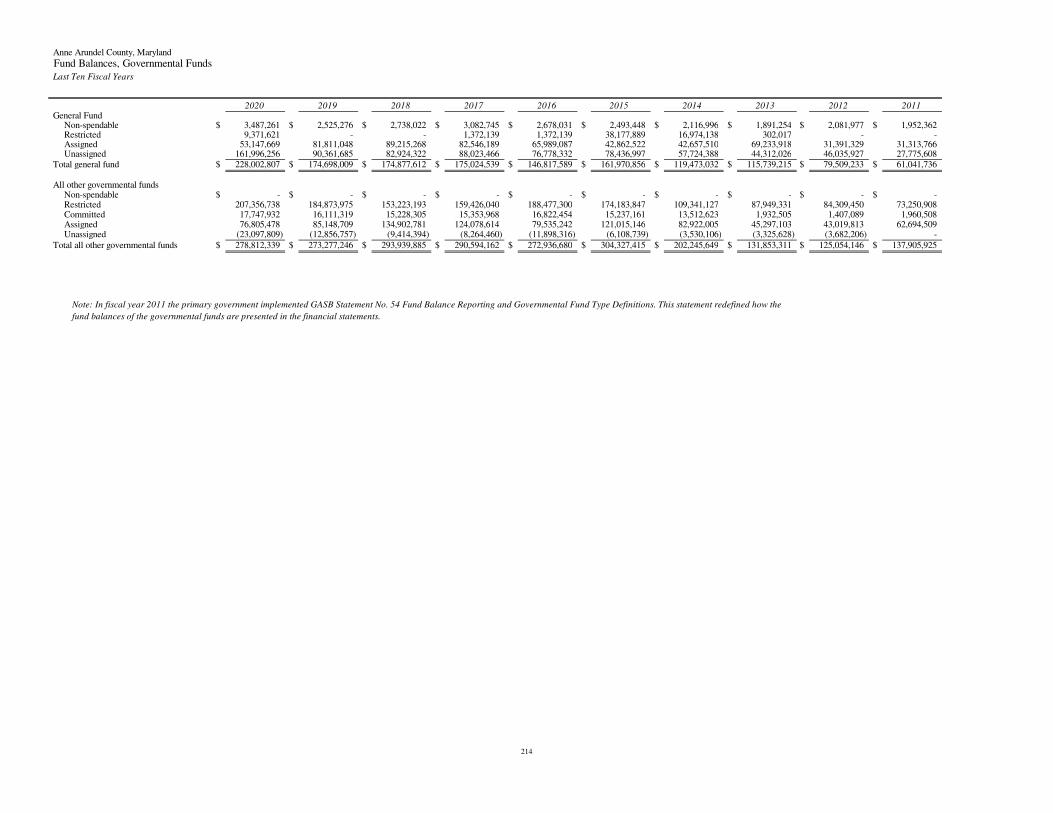
Long Term Financial Planning Permanent Public Infrastructure Fund: The County has restricted $9.4 million in funds for permanent public infrastructure to be used as a funding source for permanent public improvements in the capital budget as a result of bill number 42-19 which passed at the end of the previous fiscal year. Rainy Day Fund: The County maintains a Revenue Reserve Fund (rainy day fund) and the Fund has increased from a low of about $9.0 million at the end of fiscal year 2009 to approximately $82.4 million at the end of fiscal year 2020. This increase is the result of revenues exceeding expenditures for fiscal years subsequent to 2009 and transfers to this Fund as part of the budget process. Another $1.0 million will be transferred to the Fund during fiscal year 2021. Effective September 10, 2016, the maximum fund balance may not exceed an amount equal to 5.0% of the estimated General Fund revenues for the upcoming fiscal year or $84.1 million for fiscal year 2020. Spending Affordability Committee: The Spending Affordability Committee was established by Resolution No. 31-90 to provide recommendations and projections for the upcoming budget year. Specifically, the Committee is charged to review in detail the status and projections of revenues and expenditures for the County for the next budget year and subsequent five years; to evaluate future County revenue levels and consider the impact of economic indicators such as changes in personal income, assessable base growth; and to evaluate expenditure levels with consideration of the long-term obligations facing the County and the best way to pay for them. The Committee recommends revenue projections and the amount of new County debt authorization for the upcoming fiscal year. The Committee report includes the effect its recommendations will have on future budgets. It is also the task of this Committee to assess the County’s ability to repay bond debt and the Committee issues an annual report defining debt capacity of the County.
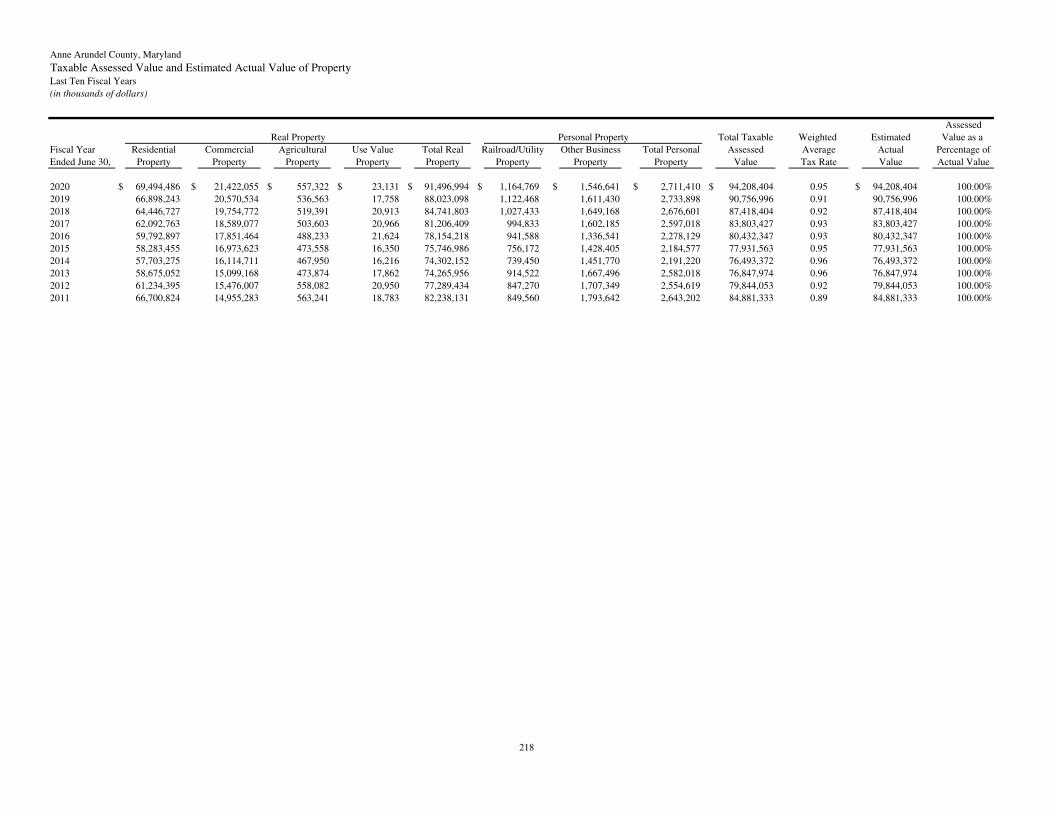
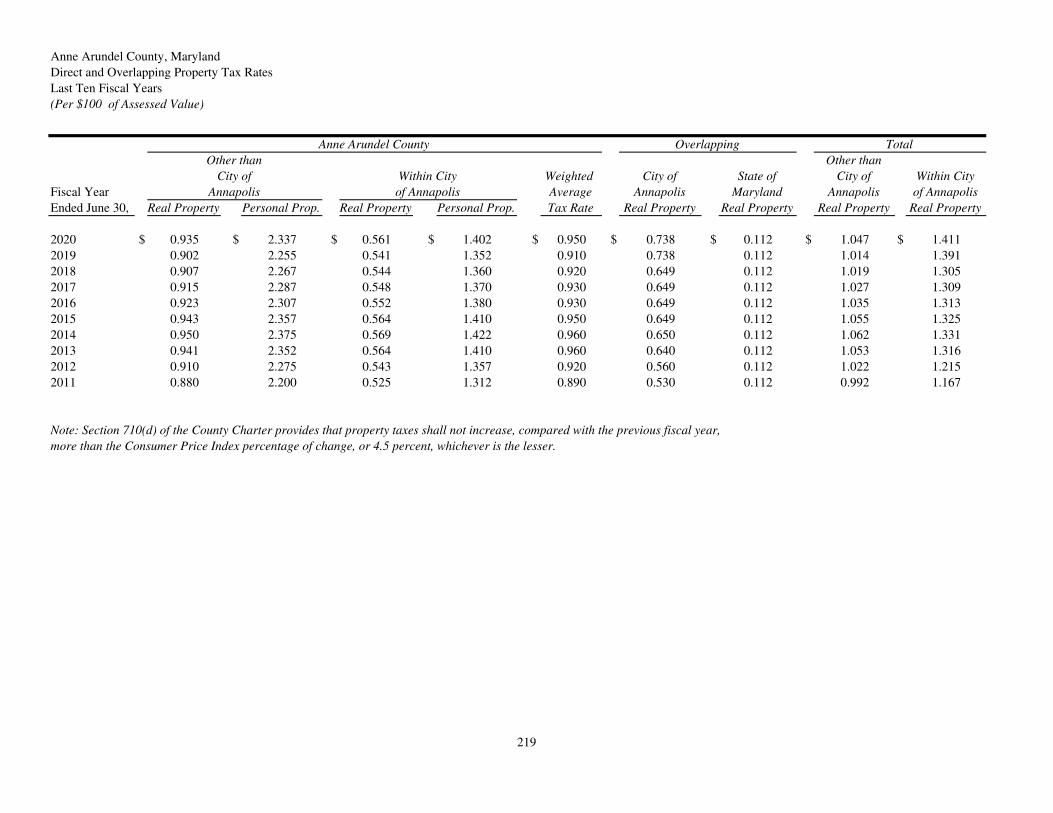
Economic Outlook: The economic outlook for the County is very favorable and will continue to grow. In addition, years of conservative budgeting and prudent financial management have created a solid foundation for economic stability for the future. Anne Arundel County’s low property and income tax rates make the County attractive for both businesses and families. At $0.934 per $100 assessed value, the property tax is the lowest among the State’s seven largest metropolitan jurisdictions and its local income tax rate at 2.81% is the 4th lowest in the State of Maryland. Revenues from property and income taxes for fiscal year 2020 supported 79.0% of the County’s budgeted expenditures, and growth in both sources should continue in the future. With a strong defense and technology industry base, a business community with global reach, a highly educated and skilled workforce, key transportation assets and a strategic location in the Baltimore/Washington DC corridor and favorable property and income tax rates, Anne Arundel County will continue to be a formidable competitor in the State with many businesses making the County their first choice as a location to do business.
Financial Policies
Debt Management Policy: The County has established a local debt policy to manage its debt as required by State law. The policy sets the parameters for issuing debt and managing the outstanding debt. It provides guidance to decision makers regarding the timing and purposes for which debt may be issued, types and amounts of permissible debt, method of sale that may be used and structural features that may be incorporated. The policy ensures that the County maintains a sound debt position and that credit quality is protected. As a result of the above, the County’s financial strength has been attested to by S&P Global Ratings and Moody’s Investors Service as these rating agencies have assigned AAA and Aa1 ratings, respectively, with a stable outlook for the County’s general obligation (GO) bonds.
Government Finance Officers Association
Certificate of Achievementfor Excellence
in Financial Reporting
Presented to
Anne Arundel CountyMaryland
For its Comprehensive AnnualFinancial Report
For the Fiscal Year Ended
June 30, 2019
Executive Director/CEO
FNHALL00
Typewritten text
7
Legislative Branch
Libraries . . . . . Budget OfficeDepartment of Public
Works. . . . . Circuit Court
Board of Education . . . . . Office of Law Administrative Hearings . . . . . Orphans Court
Community College . . . . . Office of Personnel Aging and Disabilities Department of Health
Other Component Units . . . . . Office of Finance Office of TransportationDepartment of Social
Services
Board of Elections . . . . . Office of Information
TechnologyRecreation and Parks . . . . . Sheriff's Office
Central Services Planning and Zoning . . . . . Office of the State's
Attorney
Executive Offices Inspections and Permits . . . . . Other Agencies and
INDEPENDENT AUDITORS' REPORT The Honorable County Executive and The Honorable Members of the County Council Anne Arundel County, Maryland Report on the Financial Statements
We have audited the accompanying financial statements of the governmental activities, the business-type activities, the aggregate discretely presented component units, each major fund, and the aggregate remaining fund information of Anne Arundel County, Maryland (the County), as of and for the year ended June 30, 2020, and the related notes to the financial statements, which collectively comprise the County’s basic financial statements as listed in the table of contents. Management’s Responsibility for the Financial Statements
Management is responsible for the preparation and fair presentation of these financial statements in accordance with accounting principles generally accepted in the United States of America; this includes the design, implementation, and maintenance of internal control relevant to the preparation and fair presentation of financial statements that are free from material misstatement, whether due to fraud or error. Auditors’ Responsibility
Our responsibility is to express opinions on these financial statements based on our audit. We did not audit the financial statements of the Tipton Airport Authority, which represent less than 1 percent of each of the assets and deferred outflows of resources and revenues of the discretely presented component units. Those financial statements were audited by other auditors, whose reports thereon have been furnished to us, and our opinion, insofar as it relates to the amount included for the Tipton Airport Authority, is based solely on the report of the other auditors. We conducted our audit in accordance with auditing standards generally accepted in the United States of America and the standards applicable to financial audits contained in Government Auditing Standards, issued by the Comptroller General of the United States. Those standards require that we plan and perform the audit to obtain reasonable assurance about whether the financial statements are free from material misstatement. The financial statements of the Anne Arundel Community College Foundation, which is included in the financial statements of the Anne Arundel County Community College, were not audited in accordance with Government Auditing Standards. An audit involves performing procedures to obtain audit evidence about the amounts and disclosures in the financial statements. The procedures selected depend on the auditors’ judgment, including the assessment of the risks of material misstatement of the financial statements, whether due to fraud or error. In making those risk assessments, the auditor considers internal control relevant to the entity’s preparation and fair presentation of the financial statements in order to design audit procedures that are appropriate in the circumstances, but not for the purpose of expressing an opinion on the effectiveness of the entity’s internal control. Accordingly, we express no such opinion. An audit also includes evaluating the appropriateness of accounting policies used and the reasonableness of significant accounting estimates made by management, as well as evaluating the overall presentation of the financial statements.
The Honorable County Executive and The Honorable Members of the County Council Anne Arundel County, Maryland
10
We believe that the audit evidence we have obtained is sufficient and appropriate to provide a basis for our audit opinions. Opinions
In our opinion, based on our audit and the reports of other auditors, the financial statements referred to above present fairly, in all material respects, the respective financial position of the governmental activities, the business-type activities, the aggregate discretely presented component units, each major fund, the budgetary comparison for the General Fund, and the aggregate remaining fund information of the County as of June 30, 2020, and the respective changes in financial position and, where applicable, cash flows thereof for the year then ended in accordance with accounting principles generally accepted in the United States of America. Other Matters
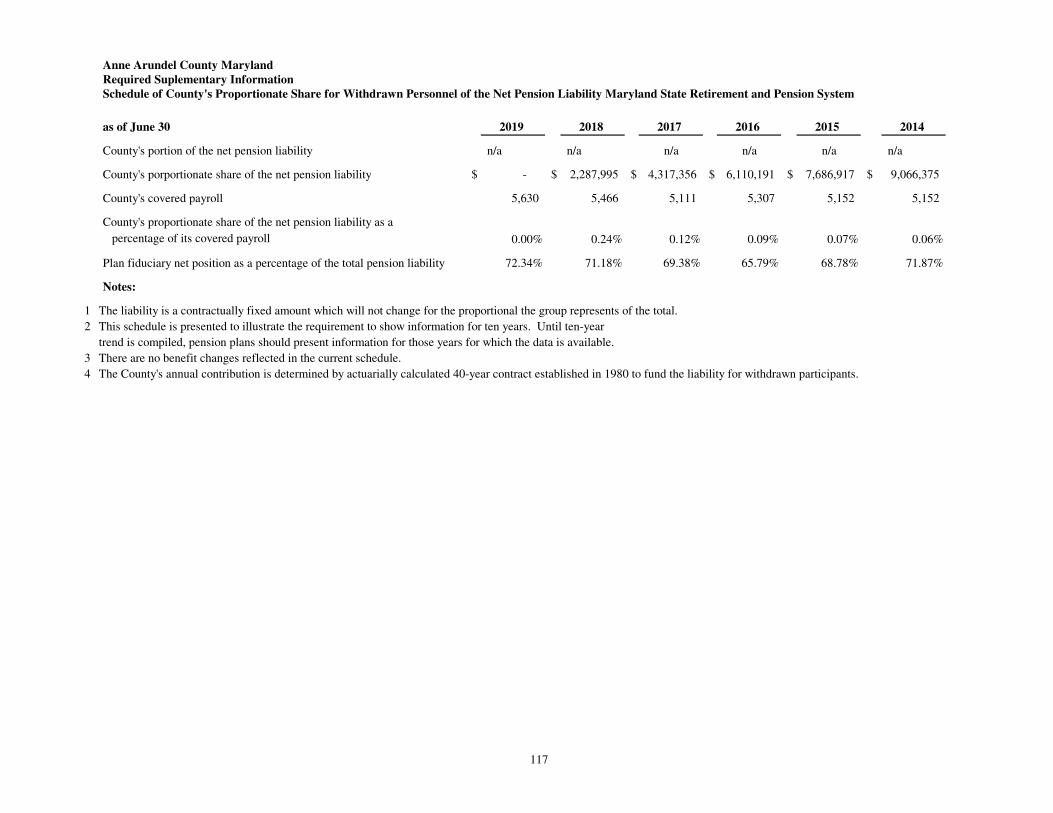
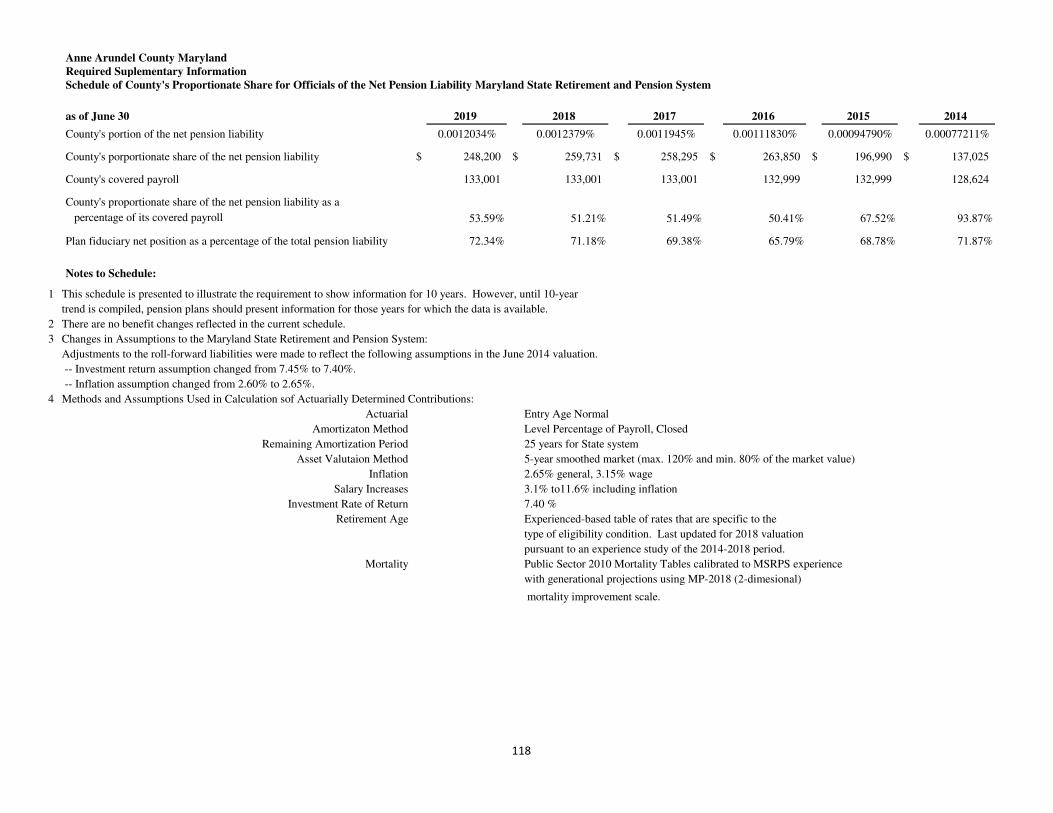
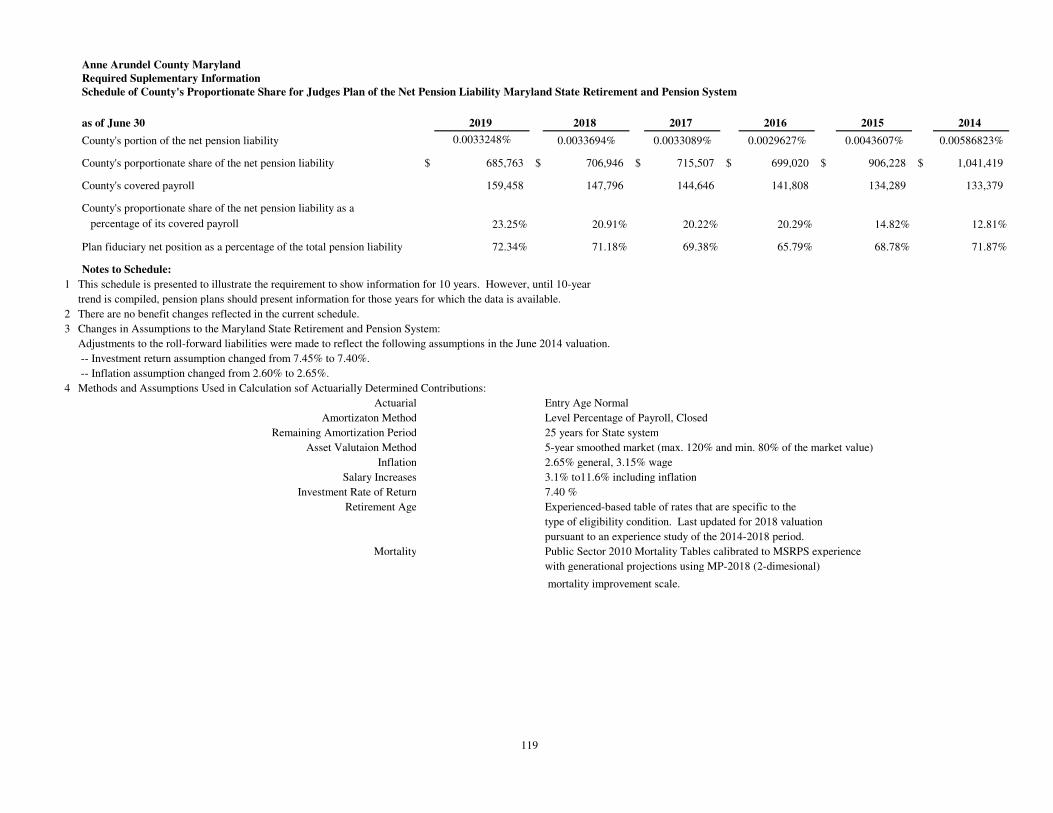
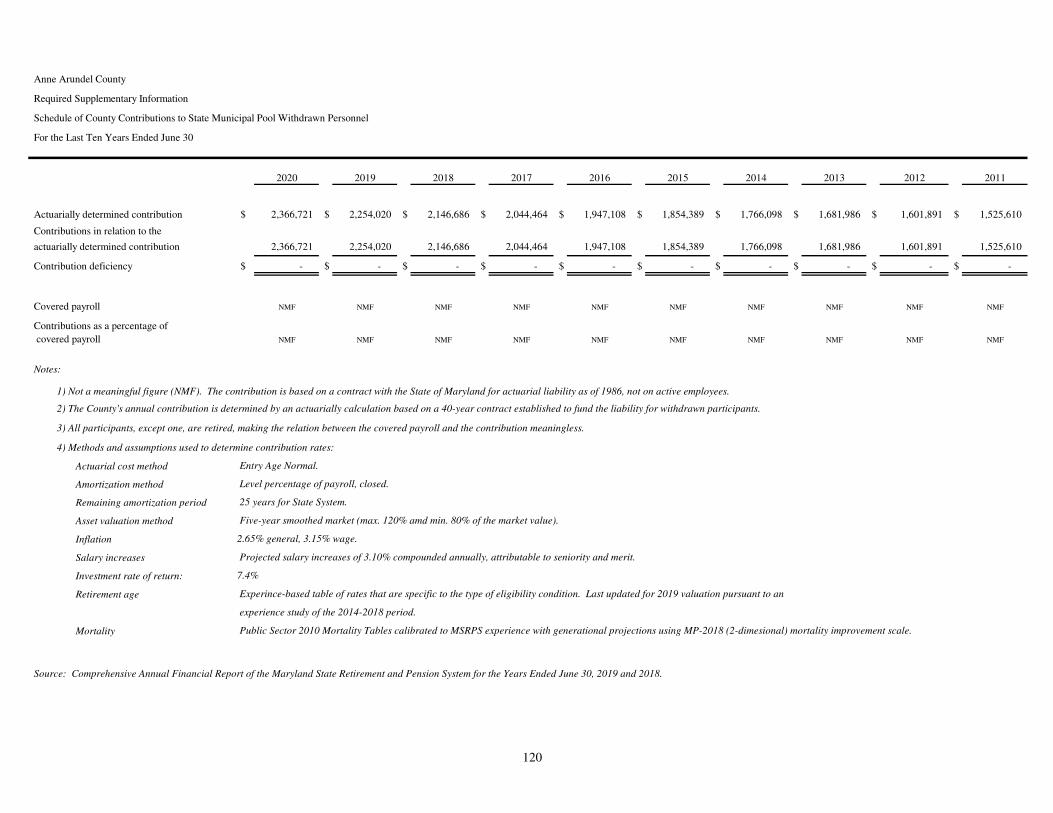
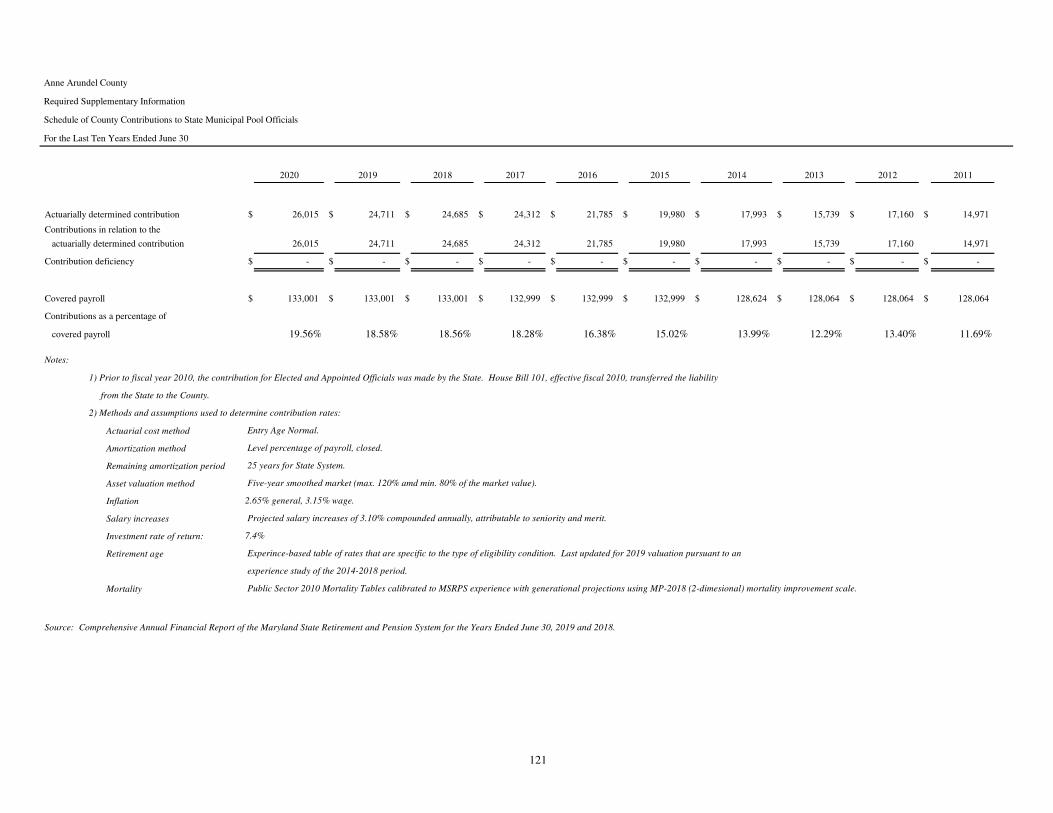
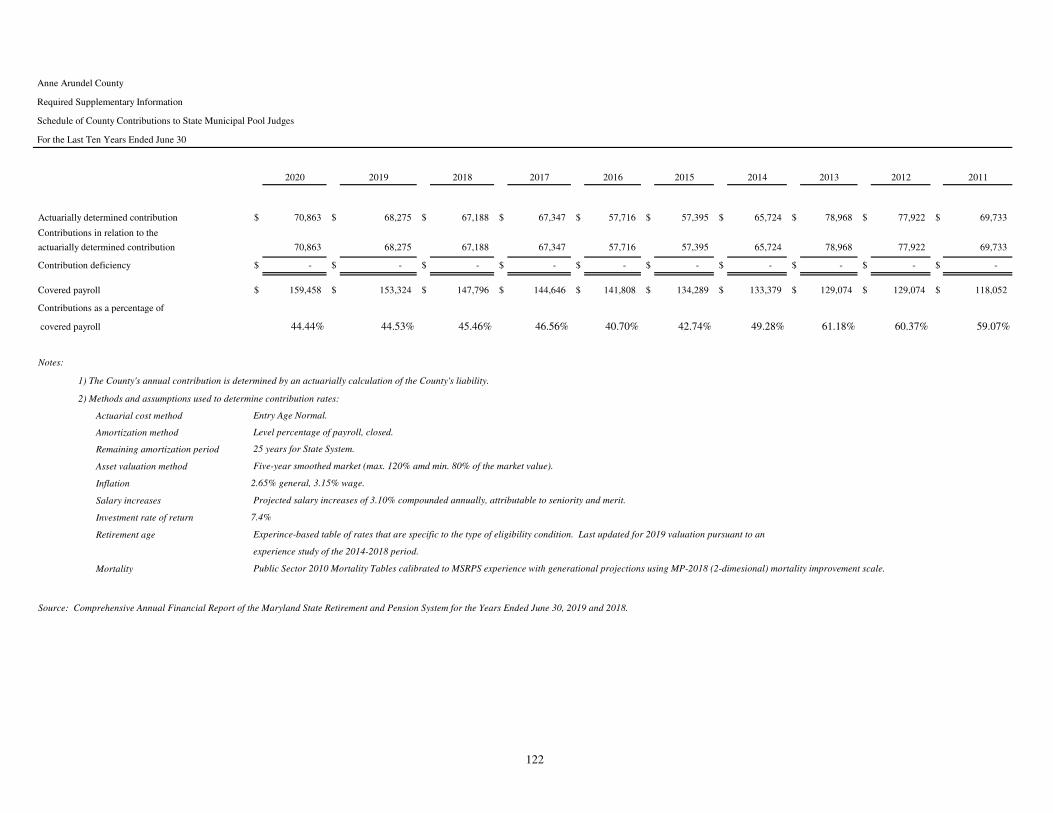
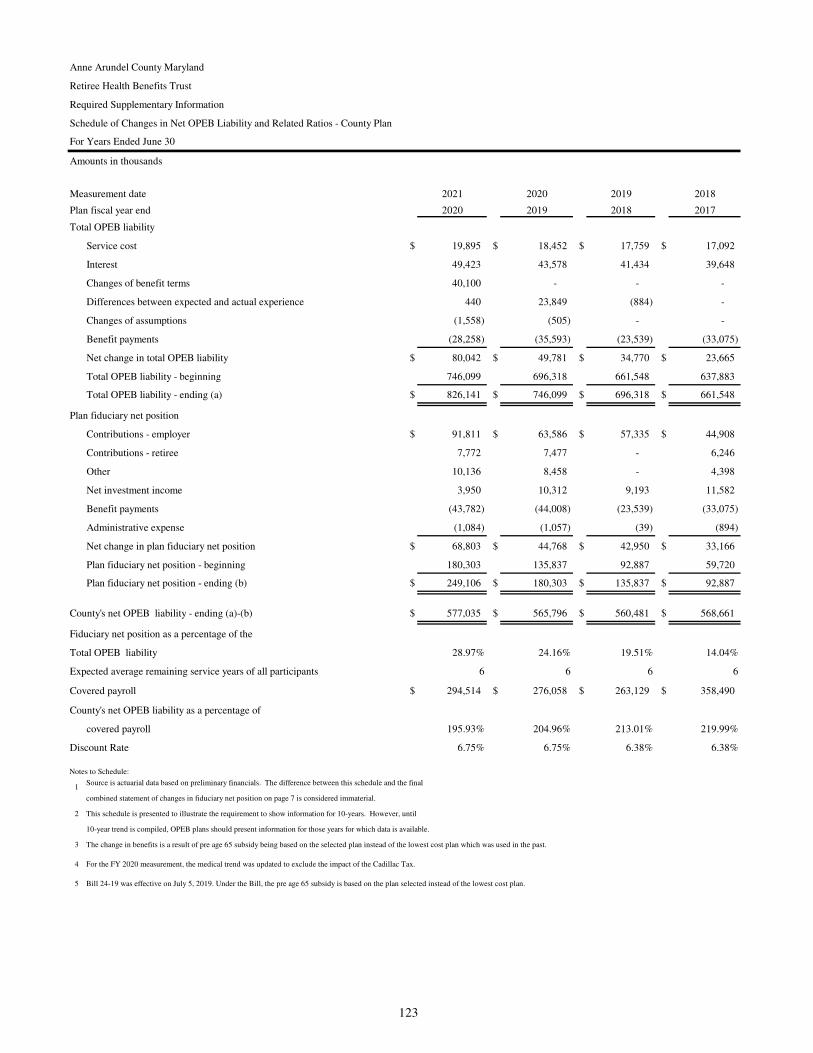
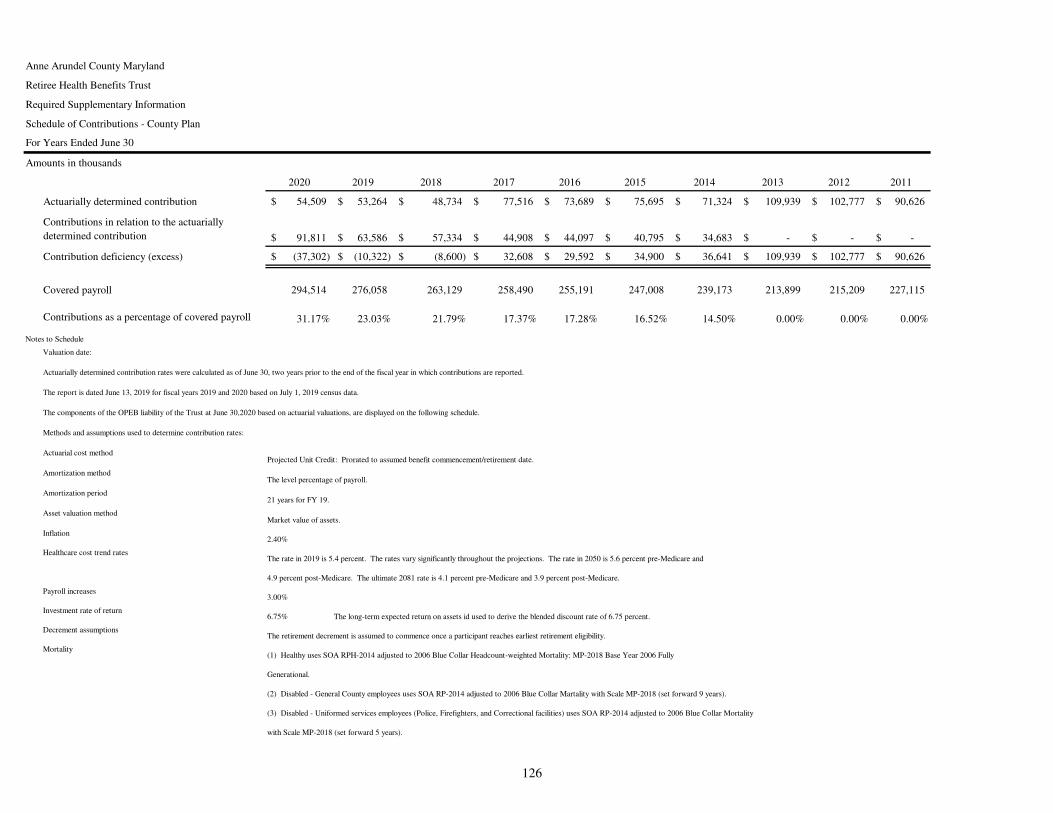
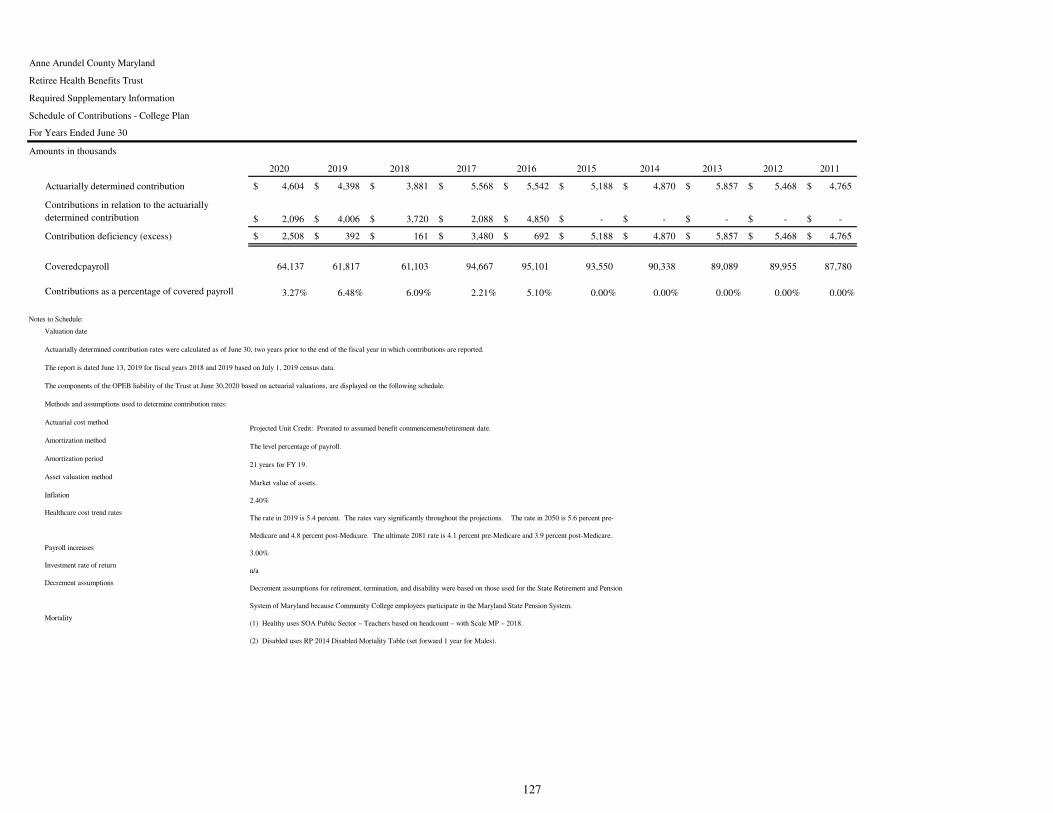
Required Supplementary Information
Accounting principles generally accepted in the United States of America require that the management’s discussion and analysis, schedules of changes in net pension liabilities and related ratios, schedules of investment returns, schedules of employers’ contributions, schedules of proportionate shares of pension plans, schedules of County’s contributions, and schedules of changes in net OPEB liabilities and related ratios, as identified in the accompanying table of contents be presented to supplement the basic financial statements. Such information, although not a part of the basic financial statements, is required by the Governmental Accounting Standards Board who considers it to be an essential part of financial reporting for placing the basic financial statements in an appropriate operational, economic, or historical context. We have applied certain limited procedures to the required supplementary information in accordance with auditing standards generally accepted in the United States of America, which consisted of inquiries of management about the methods of preparing the information and comparing the information for consistency with management’s responses to our inquiries, the basic financial statements, and other knowledge we obtained during our audit of the basic financial statements. We do not express an opinion or provide any assurance on the information because the limited procedures do not provide us with sufficient evidence to express an opinion or provide any assurance. Other Information
Our audit was conducted for the purpose of forming opinions on the financial statements that collectively comprise the County’s basic financial statements. The introductory section, combining fund statements, budgetary statements and other supporting schedules, and statistical section, as referenced in the accompanying table of contents are presented for purposes of additional analysis and are not a required part of the basic financial statements. The combining fund statements, budgetary statements and other supporting schedules are the responsibility of management and were derived from and relate directly to the underlying accounting and other records used to prepare the basic financial statements. Such information has been subjected to the auditing procedures applied in the audit of the basic financial statements and certain additional procedures, including comparing and reconciling such information directly to the underlying accounting and other records used to prepare the basic financial statements or to the basic financial statements themselves, and other additional procedures in accordance with auditing standards generally accepted in the United States of America. In our opinion, the combining fund statements, budgetary statements, and other supporting schedules are fairly stated, in all material respects, in relation to the basic financial statements as a whole.
The Honorable County Executive and The Honorable Members of the County Council Anne Arundel County, Maryland
11
The introductory section and statistical section, as referenced in the accompanying table of contents, have not been subjected to the auditing procedures applied in the audit of the basic financial statements, and accordingly, we do not express an opinion or provide any assurance on them. Other Reporting Required by Government Auditing Standards
In accordance with Government Auditing Standards, we have also issued our report dated December 17, 2020, on our consideration of the County's internal control over financial reporting and on our tests of its compliance with certain provisions of laws, regulations, contracts, and grant agreements and other matters. The purpose of that report is solely to describe the scope of our testing of internal control over financial reporting and compliance and the results of that testing, and not to provide an opinion on the effectiveness of the County’s internal control over financial reporting or on compliance. That report is an integral part of an audit performed in accordance with Government Auditing Standards in considering the County’s internal control over financial reporting and compliance.
a CliftonLarsonAllen LLP
Baltimore, Maryland December 17, 2020
12
(This page left blank intentionally)
Anne Arundel County, Maryland Management Discussion and Analysis Year Ended June 30, 2020
13
As Management of Anne Arundel County, Maryland (the County), we have prepared the following discussion and analysis to inform readers of the County’s annual financial report about the financial information that the enclosed statements present. We encourage readers to consider the discussion and analysis along with the other information in this report, including the transmittal letter and notes to the basic financial statements. In this section we have provided an overview of the basic financial statements, selected condensed financial data and highlights, and analysis of the County’s financial position and changes in financial position. Comparable amounts from the fiscal year ended June 30, 2019 have been provided.
Financial Highlights
Government-wide:
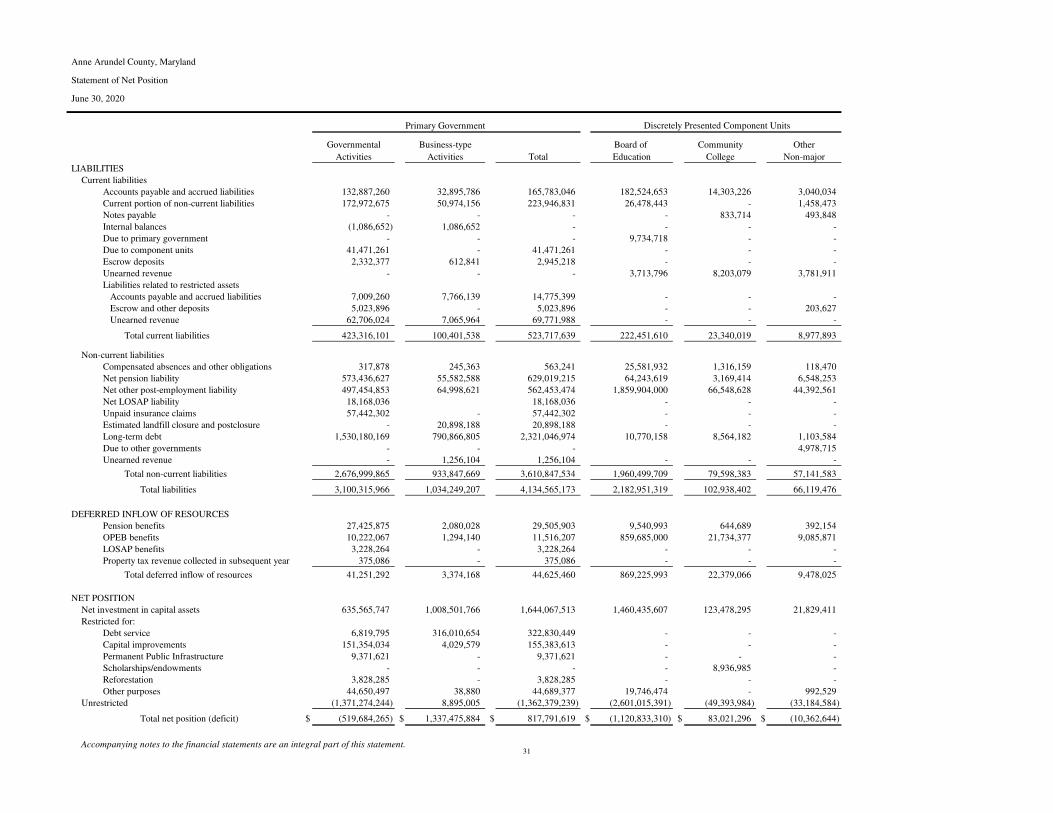
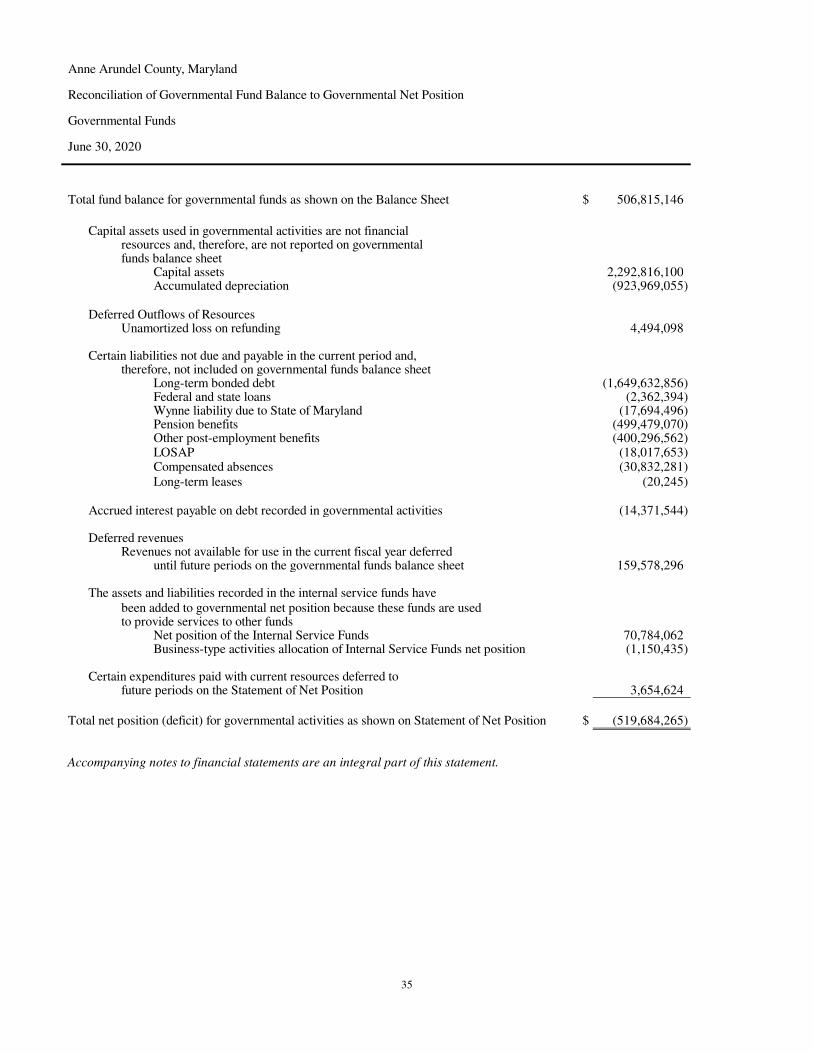
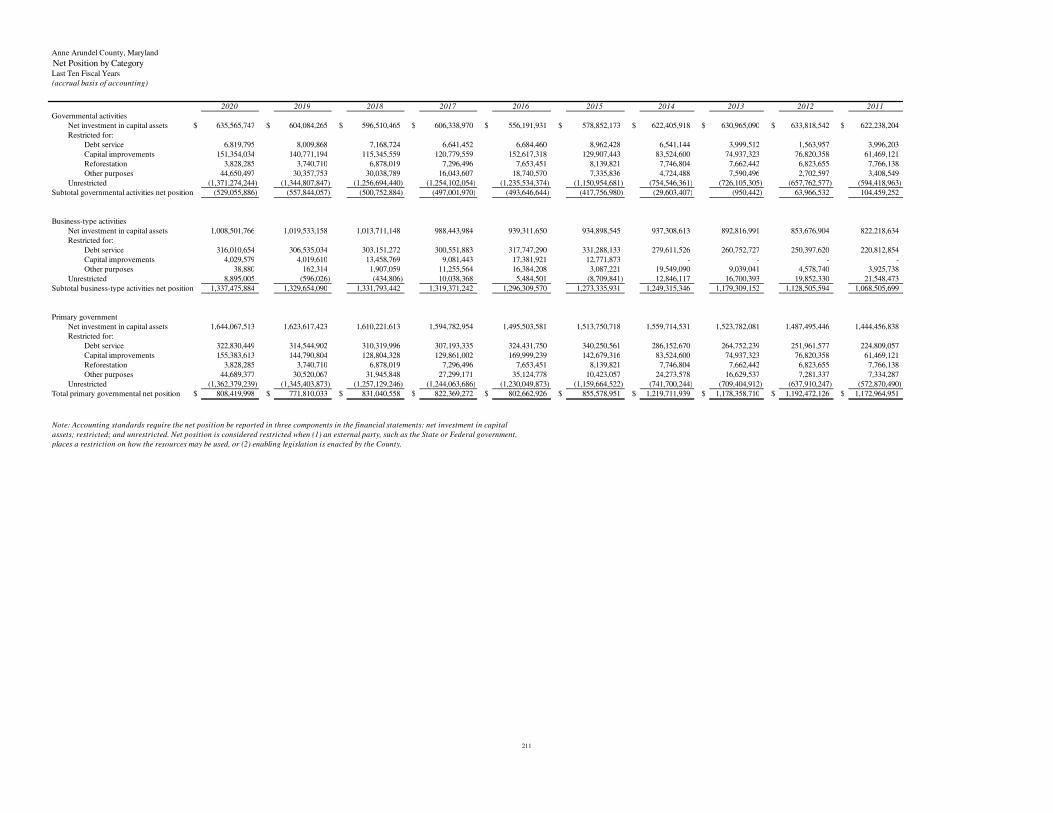
• The County wide assets and deferred outflow of resources exceeded its liabilities and deferred inflow of resources at the close of the fiscal year by $817.8 million. The unrestricted portion is a negative $1.4 billion which is composed of a deficit in the governmental activities of $1.4 billion and a surplus of $8.9 million in the business-type activities. The unrestricted deficit occurred in the governmental activities due to Board of Education and Anne Arundel Community College debt being recorded on the County’s statement of net position, but not the corresponding capital assets. Debt outstanding for education projects is $741.1 million and for college projects is $70.1 million. The current net value of the Board of Education capital assets is $1.5 billion and the community college net capital assets total $130.2 million. In the current fiscal year, the governmental activities unrestricted deficit increased by $26.5 million and the business-type activities unrestricted net position increased by $9.5 million.
• Total net position of the County has increased by $46.0 million or 6.0% over the prior fiscal year. o In the governmental activities, total revenues increased $142.6 million or 7.9% and expenses increased
$45.8 or 2.5% from the prior fiscal year, resulting in an increase of $38.2 million in net position, which is $95.3 million more than the prior fiscal year change. Increases in operating grants and contributions, capital grants and contributions, general property tax, and local income tax revenues of $41.0 million, $18.6 million, $58.8 million, and $45.8 million, respectively, were the primary drivers which increased revenues. These increase were offset by decreases in charges for services, local sales tax and investment income of $9.8 million, $5.4 million and $5.6 million, respectively. Higher expenses were primarily due to increases in general government of $21.4 million, and in health and human services of $20.0 million related in part to an increase in Covid-19 expenses. The increase in budgetary expenditures were in part from labor related the cost of living and pay for performance increase of 2.0% and 3.0%, respectively, compared to the prior fiscal year. Further details are presented in the Management’s Analysis section of the MD&A.
o In the business-type activities, total revenues increased by $15.7 million or 6.6% and total expenses increased by $7.3 million or 3.1%, from the prior fiscal year, resulting in a $7.8 million increase in net position which is $10.0 million more than the prior fiscal year change. The increase in revenues were driven mainly by an increase in charges for service, and capital grants and developer contributions in the amount of $4.4 million and $10.0 million, respectively. This was primarily from an increase in charges for service, connections fees, and environmental protection fees in the Utility Fund of $ 5.1 million, $6.2 million, and $2.9, respectably. The $7.3 million increase in expenses was mainly from an increase in spending for contractual service in the Water and Wastewater Fund of $4.6 million and in the Solid Waste Fund $1.9 million.
Fund Level:
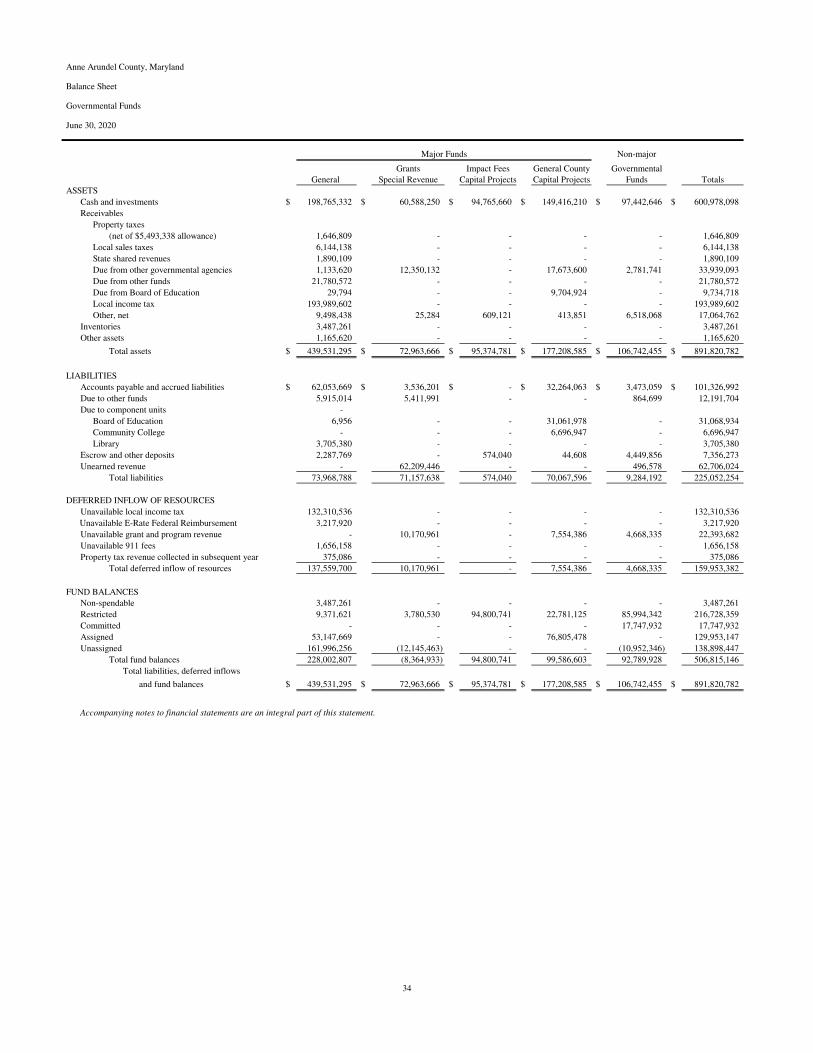
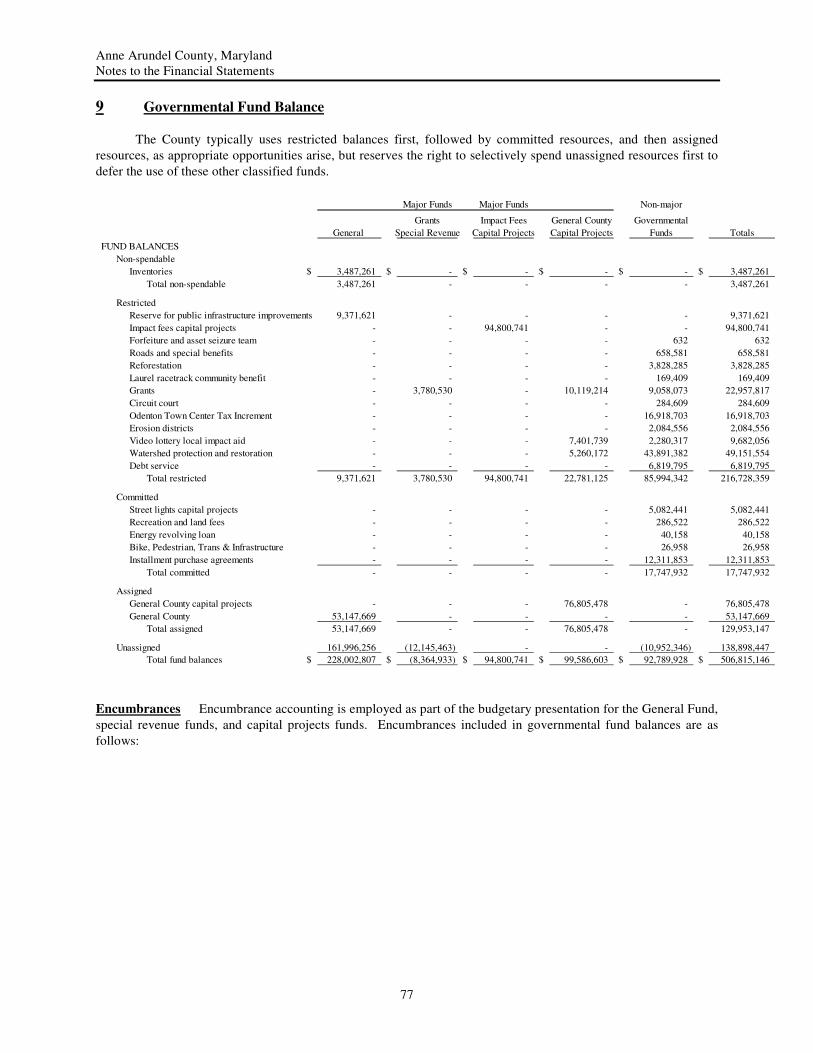
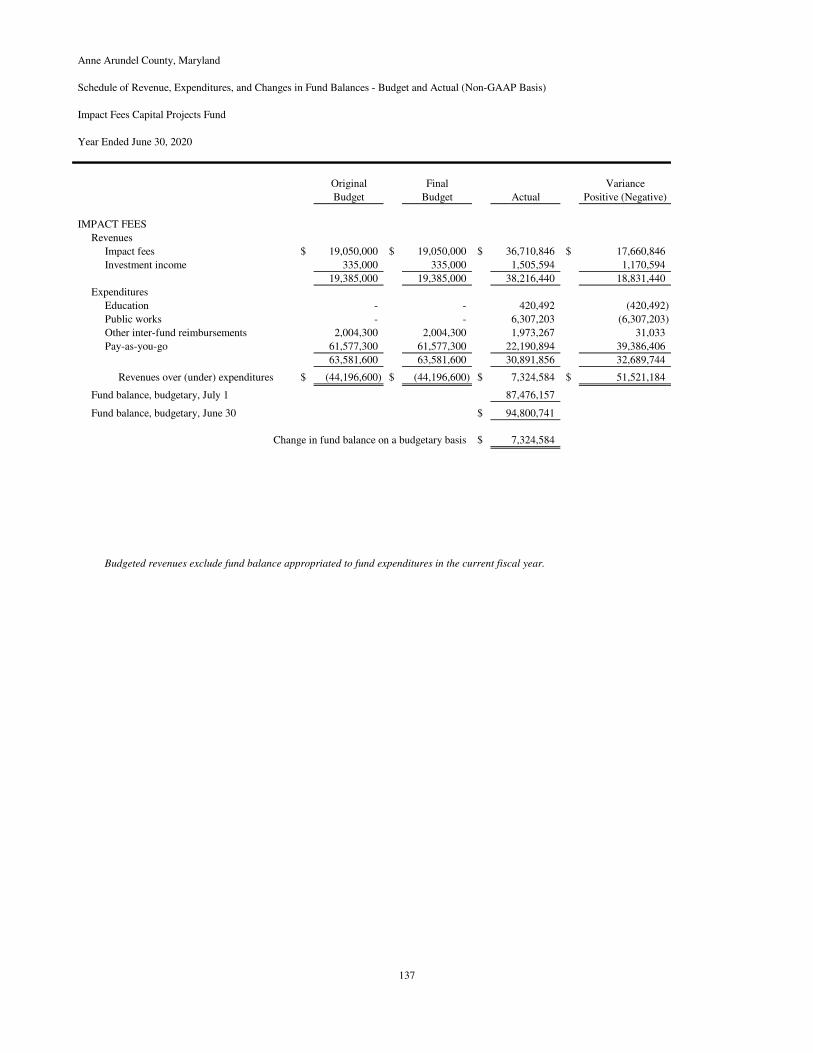
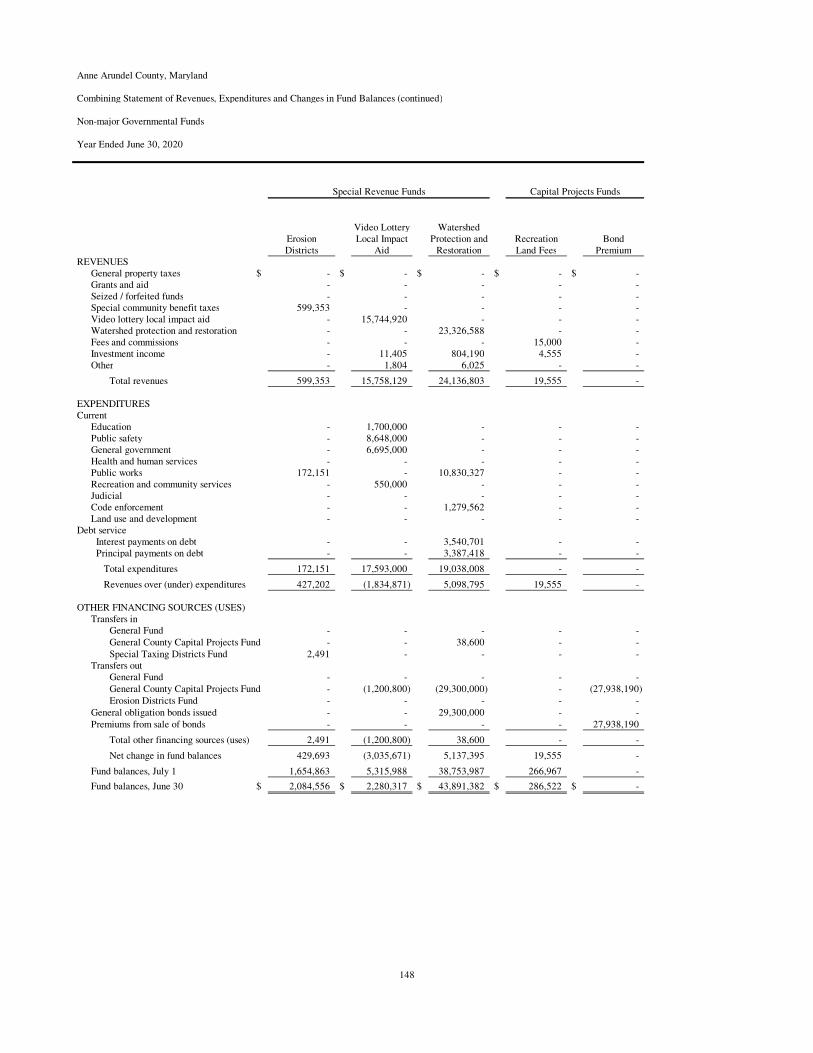
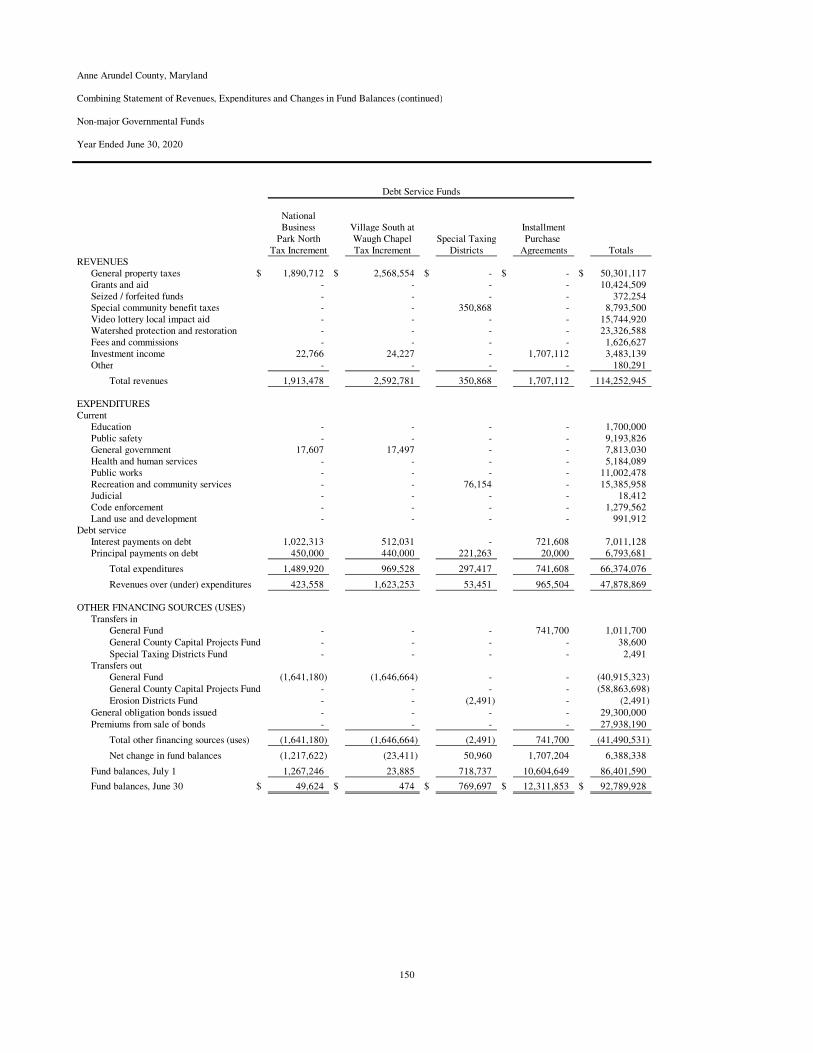
• The County’s governmental funds reported combined fund balances of $506.8 million, an increase of $58.8 million from the prior fiscal year. The greatest net change in fund balance was a $53.3 million increase from the prior fiscal year in the General Fund mainly due to an increase general property taxes and local income taxes of $54.5 million and $84.1 million, respectively. These increases in revenue were offset in part by increases in spending for education, public safety and interest expense of $48.5 million, $16.4 million and $4.8 million, respectively, and a decrease in general government and public works spending of $5.2 and $8.1 million, respectively. For fiscal year 2020, the Impact Fees Capital Projects Fund balance increased $7.3 million due to incoming revenues exceeding expenses and transfers out by $7.3 million. The General County Capital Projects fund balance decreased by $5.2 million as a result education and capital outlay spending exceeding incoming revenue and transfers in for capital project funding by $5.2 million. The Grants Fund balance decreased by $3.0 million as a result of expenses exceeding revenues because of the normal lag in the grant reimbursements which occurs each year. Non-major governmental funds balance increased $6.4 million due to an increase in net operating income of $47.9 million, offset by a net of $41.5 million
Anne Arundel County, Maryland Management Discussion and Analysis Year Ended June 30, 2020
14
for other financing sources and uses.
• Approximately 56.5% of the total governmental fund balance or $286.6 million, is available to meet the County’s current and future needs as mandated by the appropriate level of authority within the County and are properly designated as committed, assigned and unassigned.
• Available fund balance for the General Fund was $215.1 million or 94.4% of the total fund balance, which is 13.8% of the current year expenditures. Non-spendable fund balance of the General Fund was $3.5 million or 1.5% of the total fund balance.
• The enterprise fund charges for service increased by $4.4 million or 3.0%, and capital contributions increased $10.0 million or 14.4%. As discussed previously, this was primarily due an increase in charges for service, connections fees, and environmental protection fees in the Utility Fund. Non-operating revenues increased by $1.2 million or 5.3%, in part due to an increase in other income of $1.0 million from prior year. Operating expenses increased by $7.3 million or 3.1%, and non-operating expenses increased by $1.6 million, from the prior fiscal year. Further details are presented in the Management’s Analysis section of the MD&A.
Changes to debt:
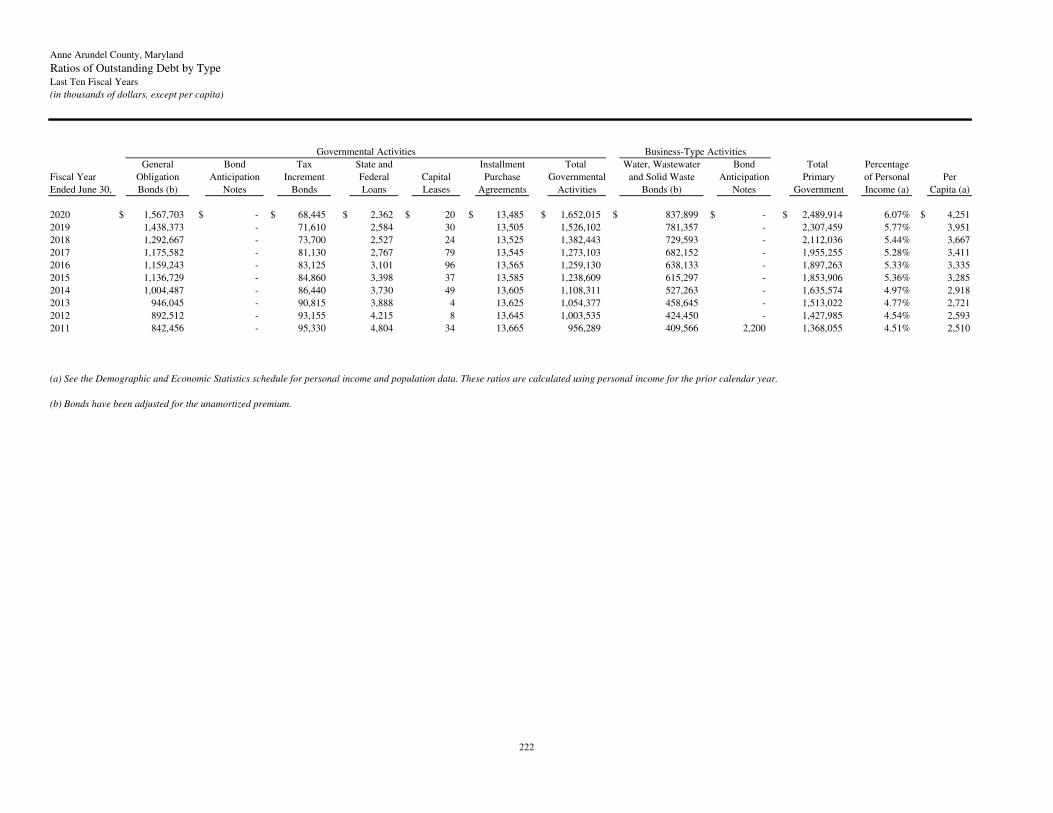
• The County’s general obligation bonded debt increased by $117.8 million for governmental activities and $45.5 million for business-type activity in fiscal year 2020. The County issued additional general obligation debt in the amount of $214.5 million for governmental activities which will be used for education, public safety, infrastructure improvements, community college, library, watershed protection and restoration, parks and recreation, and general government improvements. The County issued new bonds for business-type activity in the amount of $82.1 million for waste management and utility improvements. The County had a net decrease for Maryland Water Quality loans of $4.5 million for water and waste water improvements.
Overview of Basic Financial Statements
The basic financial statements consist of the government-wide financial statements, fund financial statements, budgetary statements, and notes to the basic financial statements. Each component intends to provide a different perspective of the County’s financial results. These components are discussed below. Government-wide Financial Statements – These statements are designed to provide a broad, entity-wide perspective of the County’s financial position and changes in financial position. These statements are prepared using a full-accrual accounting method that measures changes when the underlying economic activity occurs regardless of the timing of the related cash flows. This method is consistent with that used in the private sector.
The government-wide statements have consolidated the Primary government’s operations into two columns, governmental activities and business-type activities. In addition, the component units’ entity-wide statements are presented. The governmental activities are those functions of the Primary government principally supported by taxes and other general revenue sources. Such activities include education, public safety, general government, health and human services, public works, recreation and community services, judicial, code enforcement, and land use and development. The business-type activities include the Primary government’s functions which are primarily supported by user-fees and charges, such as utility services, waste collection, and child care services.
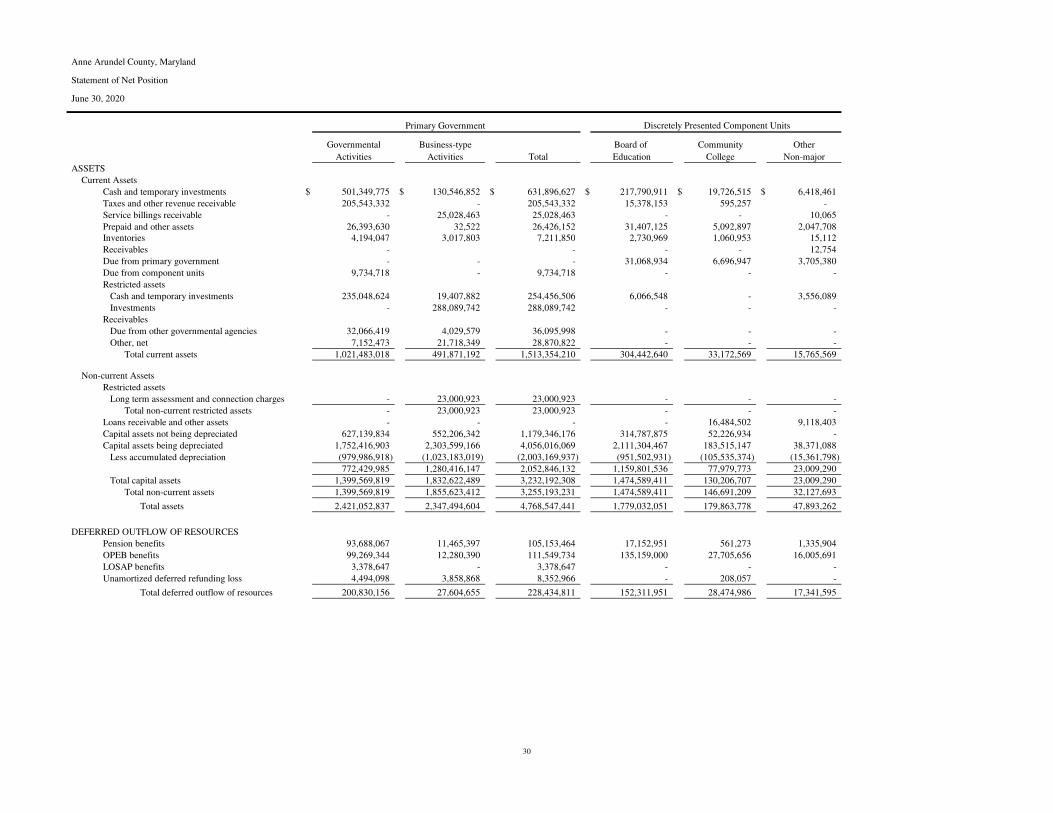
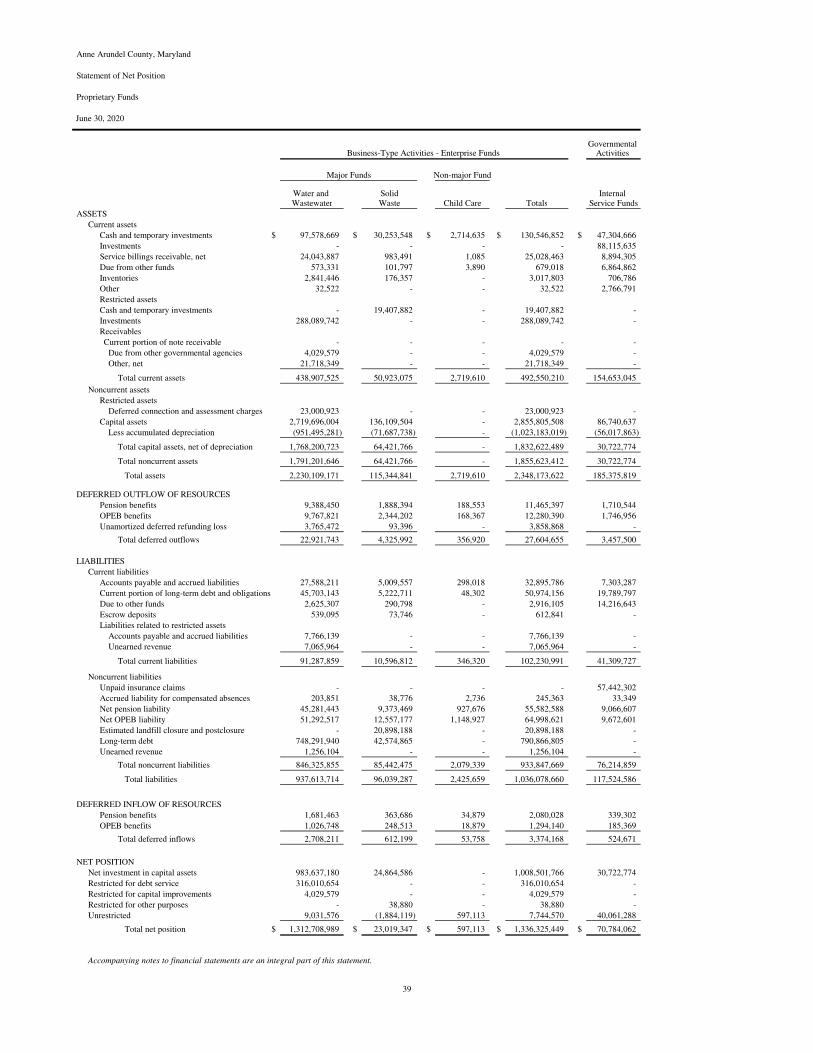
Statement of Net Position – The Statement of Net Position presents the components of the County’s assets and deferred outflows of resources, liabilities and deferred inflow of resources, and the net position at end of the fiscal year. This statement includes long-term capital assets and long-term liabilities. In addition, capital assets are shown at their depreciated value. Over time, increases or decreases in net position may indicate an improvement in, or deterioration of the County’s financial condition. Statement of Activities – The Statement of Activities presents information showing how the government’s net position changed during this fiscal year. All changes in net position are reported as soon as the underlying event giving rise to the change occurs, regardless of the timing of related cash flows. Thus, revenues and expenses are reported in this statement for some items that will only result in cash flow in future fiscal periods (e.g., uncollected taxes, revenues and earned but
Anne Arundel County, Maryland Management Discussion and Analysis Year Ended June 30, 2020
15
unused vacation leave).
Both statements include the Primary government’s component units, including the Board of Education, Community College, Library, Economic Development Corporation, Tipton Airport, and Workforce Development. These entities are included because the County provides a substantial amount of their funding or the County Executive appoints a majority of the Board members, implying a substantial degree of control over their management. In addition, the County approves the budgets of these entities. Fund Financial Statements – The Primary government segregates its financial operations into several funds to account separately for funding sources and activities that the government undertakes. This provides better control over resources designated for specific activities or objectives. These funds are grouped into three different types: governmental funds, proprietary funds, and fiduciary funds.
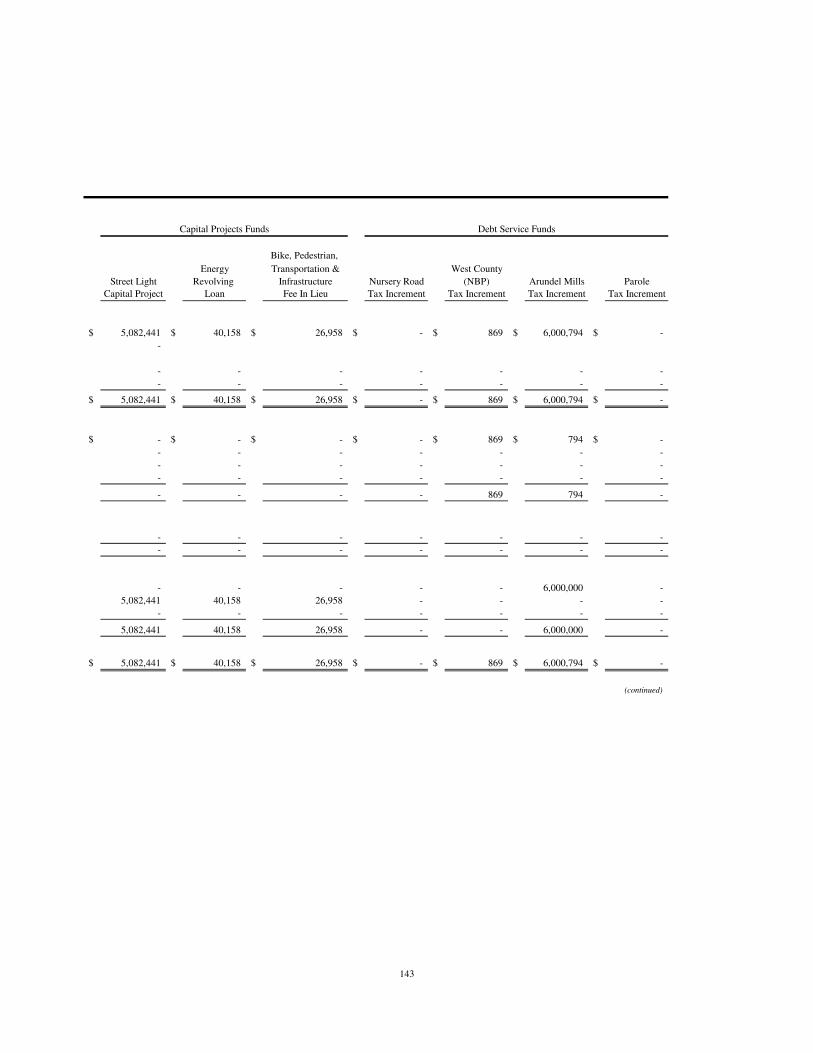
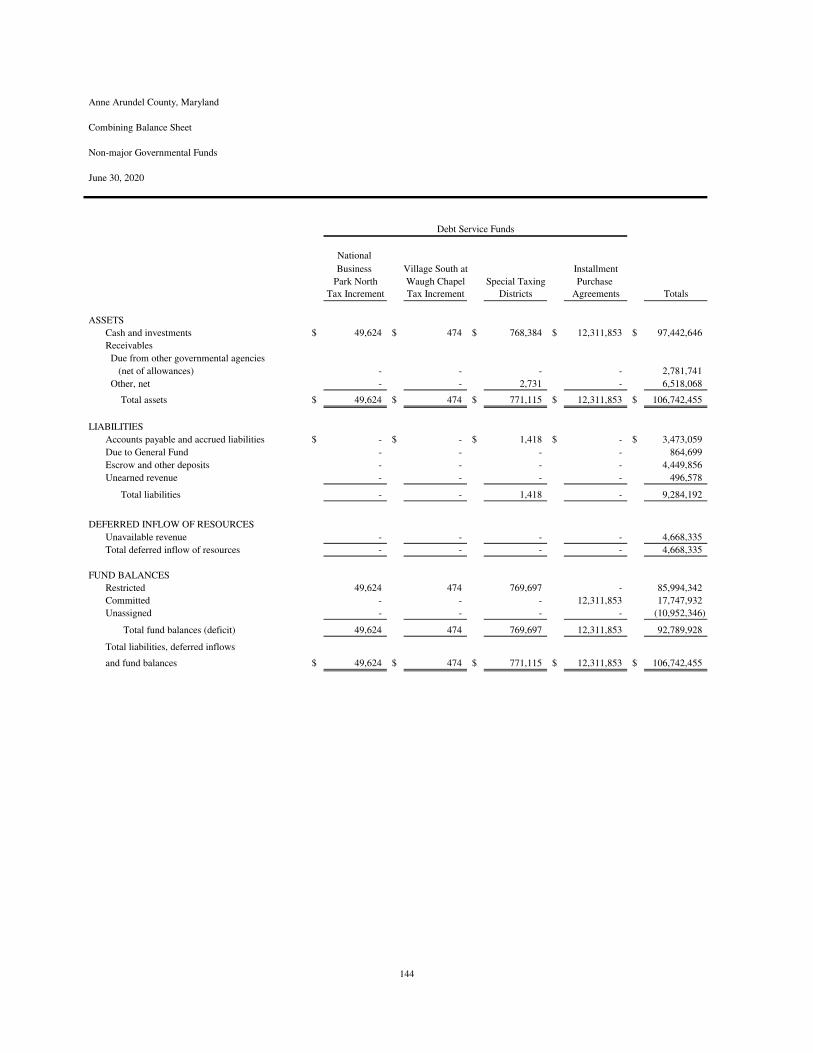
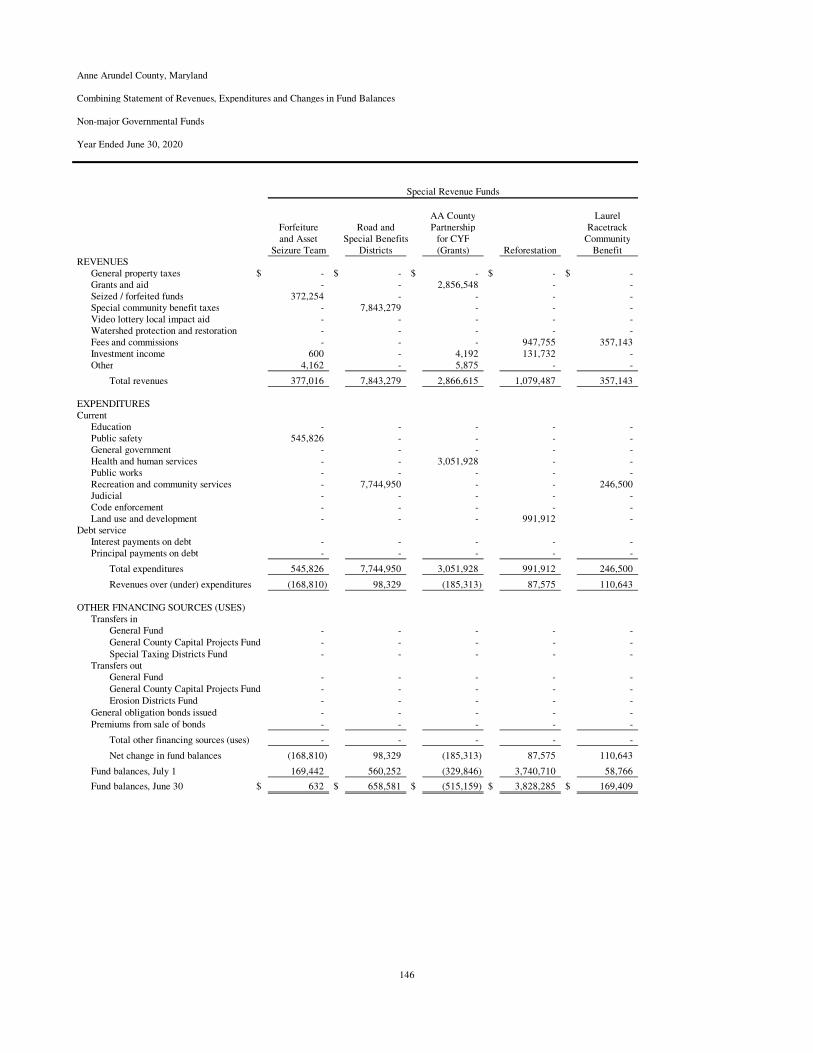
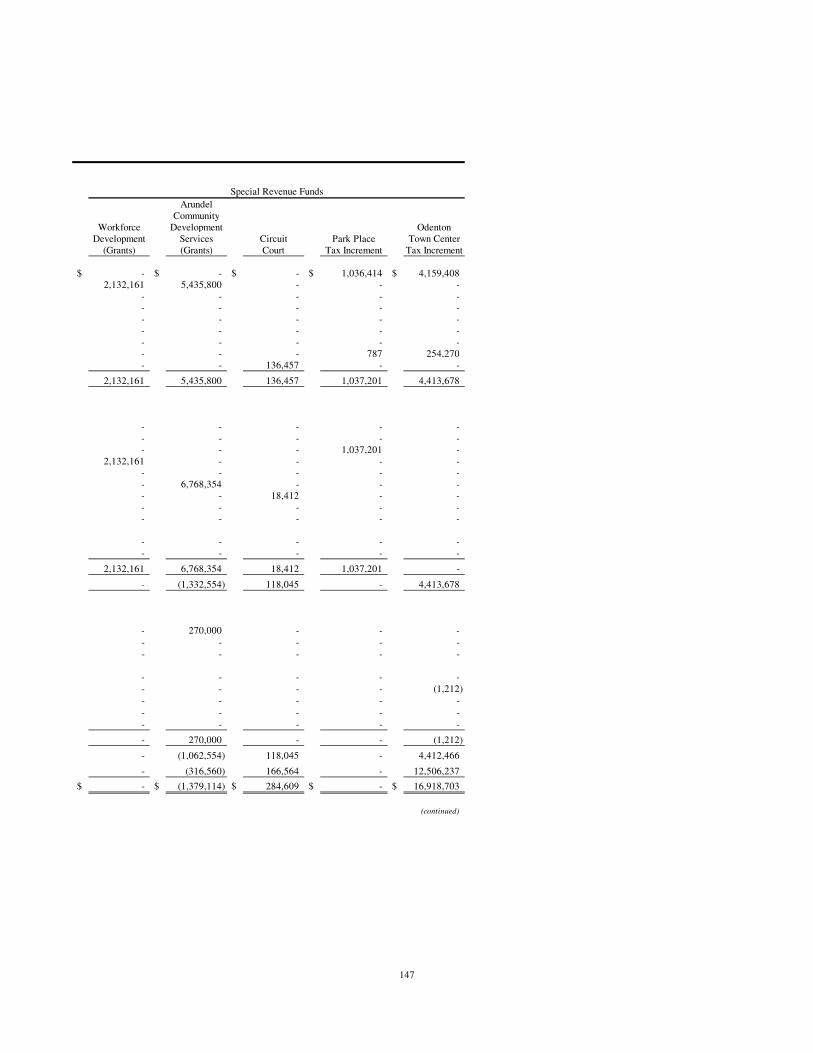
Governmental Funds – The governmental funds of the Primary government include the General Fund, Grants Fund, Capital Project Funds, which are used to accumulate and spend resources to construct capital assets; the special revenue funds, which segregate revenue sources to ensure these funds are spent on the intended purpose; and the debt service funds, which accumulate resources to pay certain long-term debt issued by the County or separate districts.
The perspective of these statements is narrower than the government-wide statements discussed previously. These statements present the financial position and changes in financial position resulting from currently available resources and currently due liabilities. Therefore, revenues are not recorded until available, and expenses are recorded primarily when the underlying economic activity occurs. In addition, because these statements focus on current resources, long-term assets and liabilities are not included.
The statements focus on the Primary government’s major funds. Major governmental funds include the General Fund, the Impact Fees Capital Projects Fund and the General County Capital Projects Fund. Separate columns are presented for those funds considered major either by size or by importance. The other funds are aggregated into one column called “other non-major funds.”
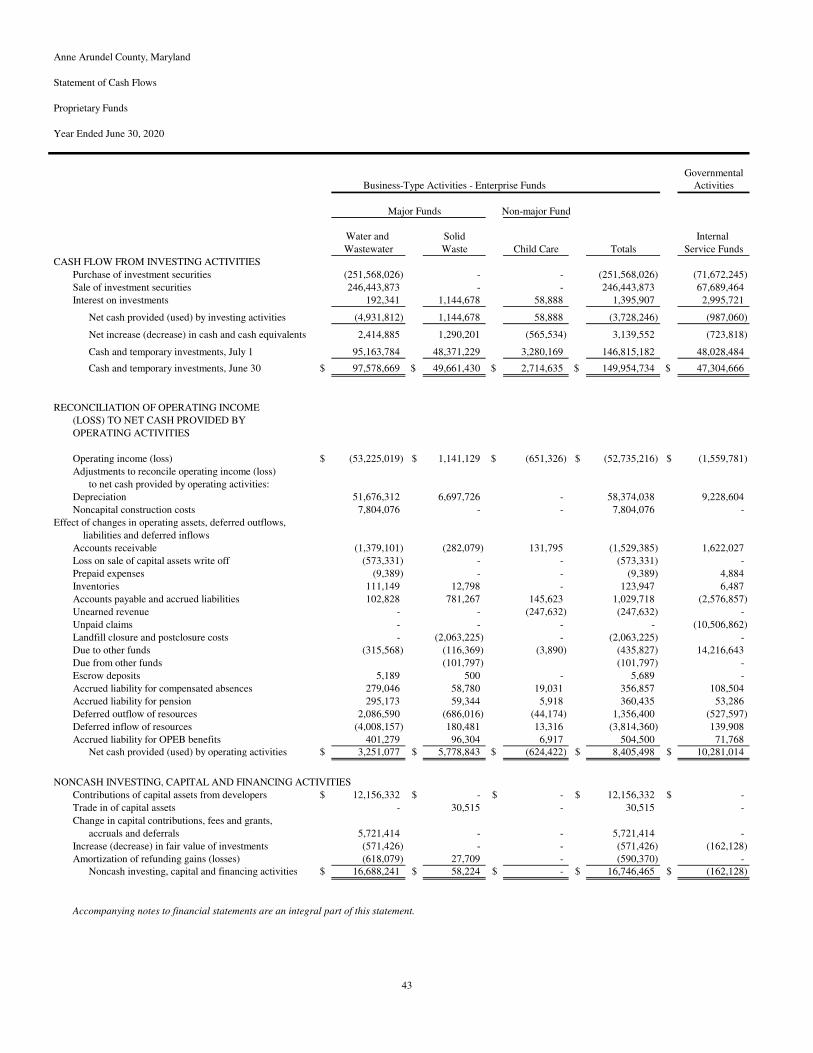
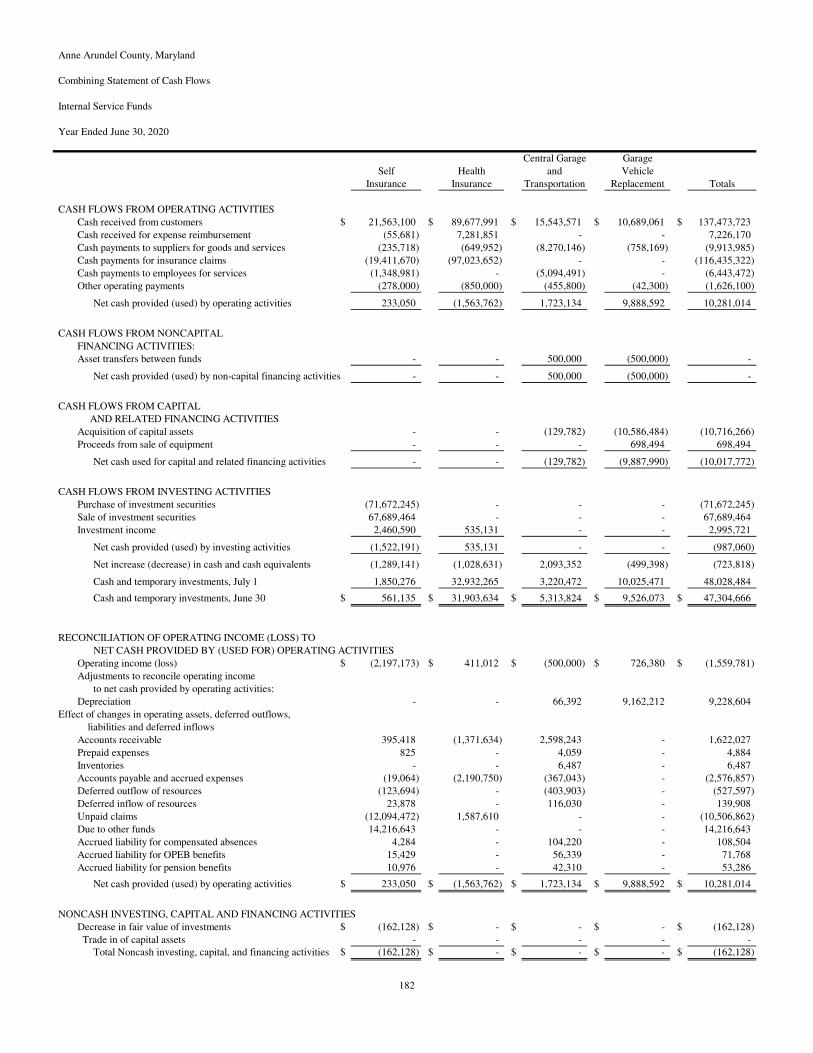
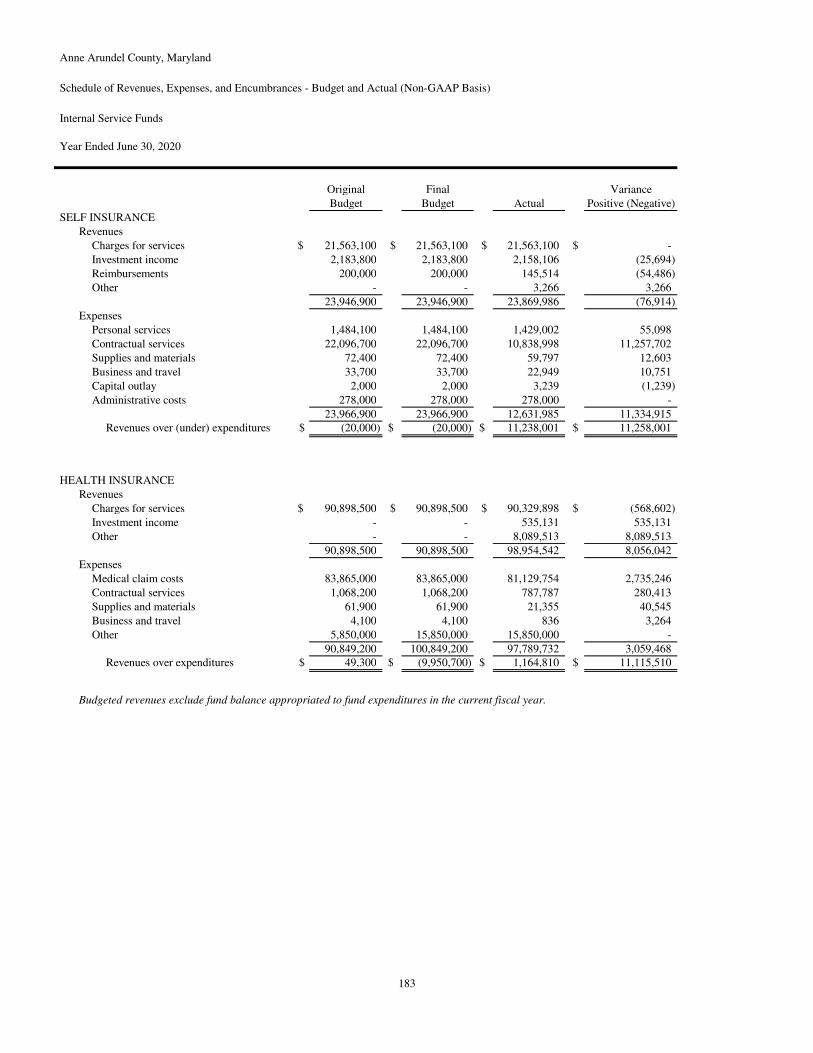
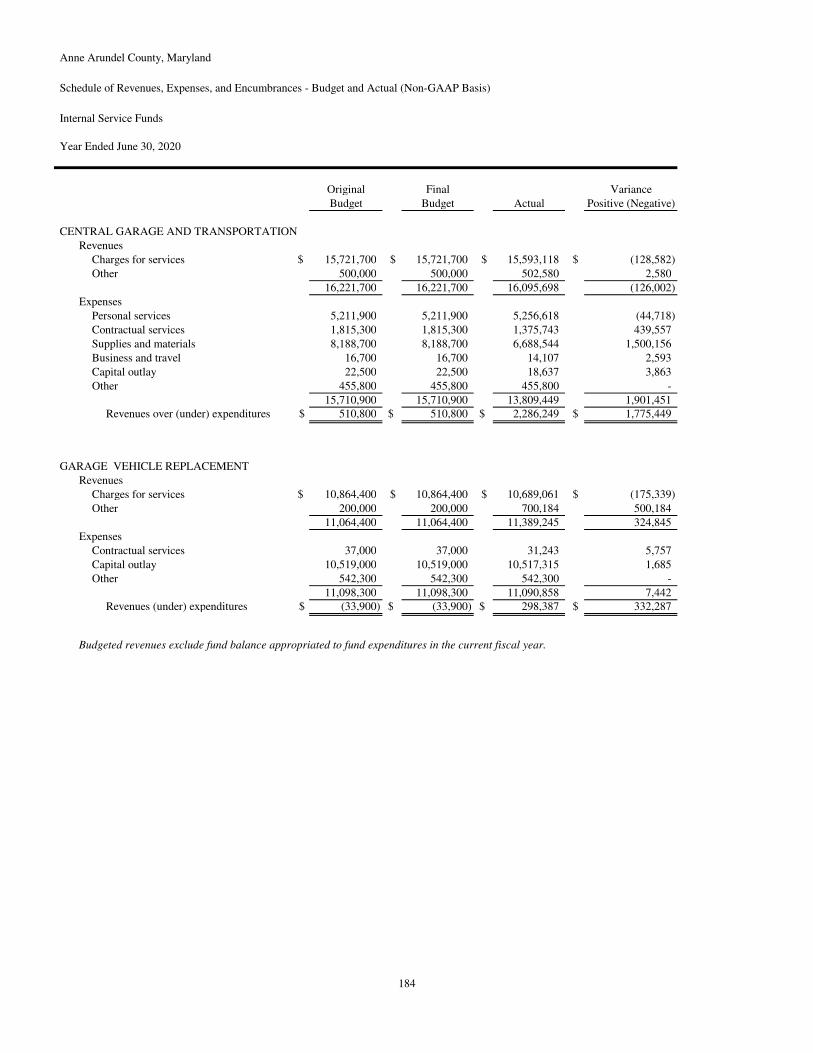
Proprietary Funds – The County maintains two types of proprietary funds. Enterprise funds are used to report the same functions presented as business-type activities in the government wide financial statements. Internal service funds are used to accumulate and allocate costs internally among the County’s various functions. Because these services predominately benefit governmental rather than business-type functions, they have been included within governmental activities in the government-wide financial statements. Transactions for these funds are recorded using the full-accrual basis of accounting whereby transactions are recorded when the underlying economic event takes place, regardless of the timing of cash flows. Moreover, long-term assets and liabilities are recorded on the statements. The enterprise funds include the Water and Wastewater Fund, the Solid Waste Fund, and the Child Care Fund. Internal service funds include the Self Insurance, Health Insurance, Central Garage and Transportation, and Garage Replacement Funds. These statements also focus on major funds so the County includes separate columns for the Water and Wastewater and Solid Waste Funds.
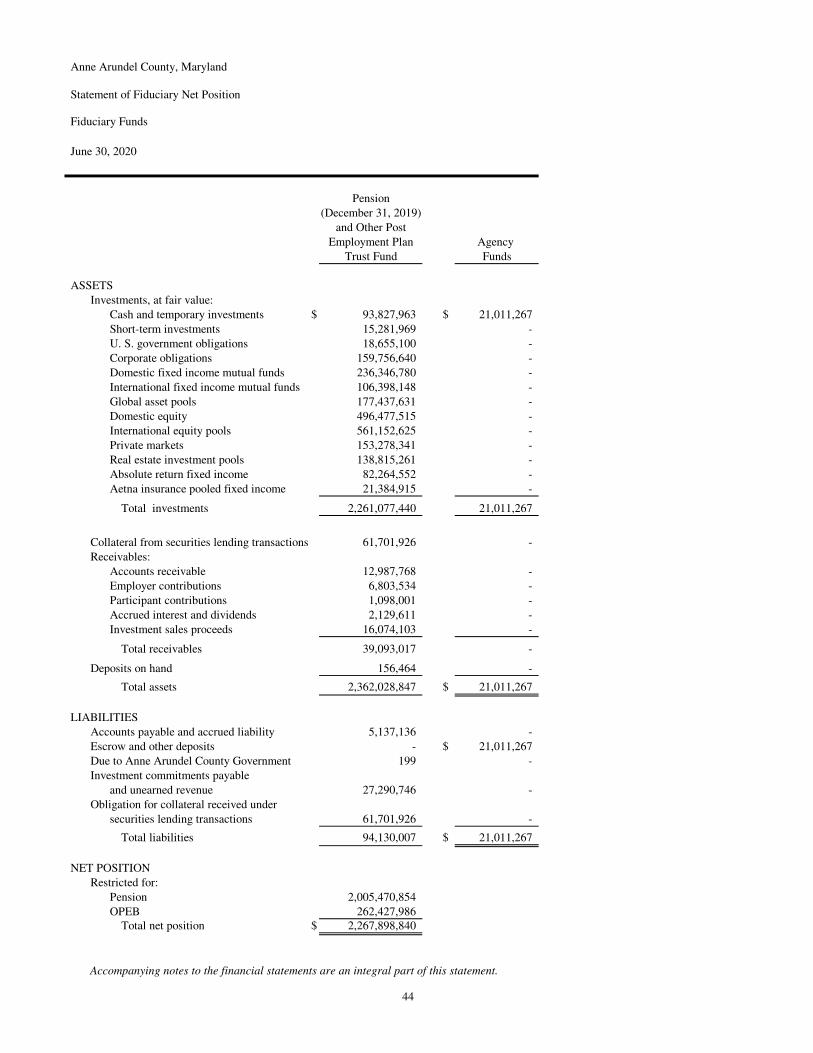
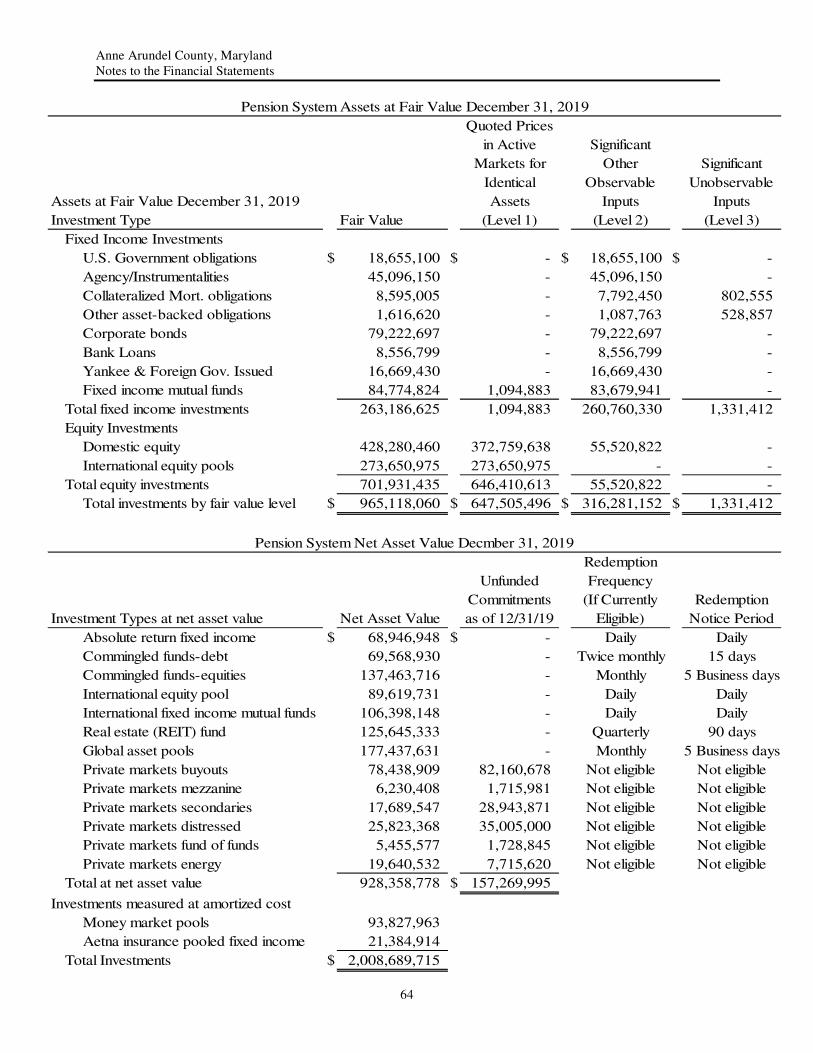
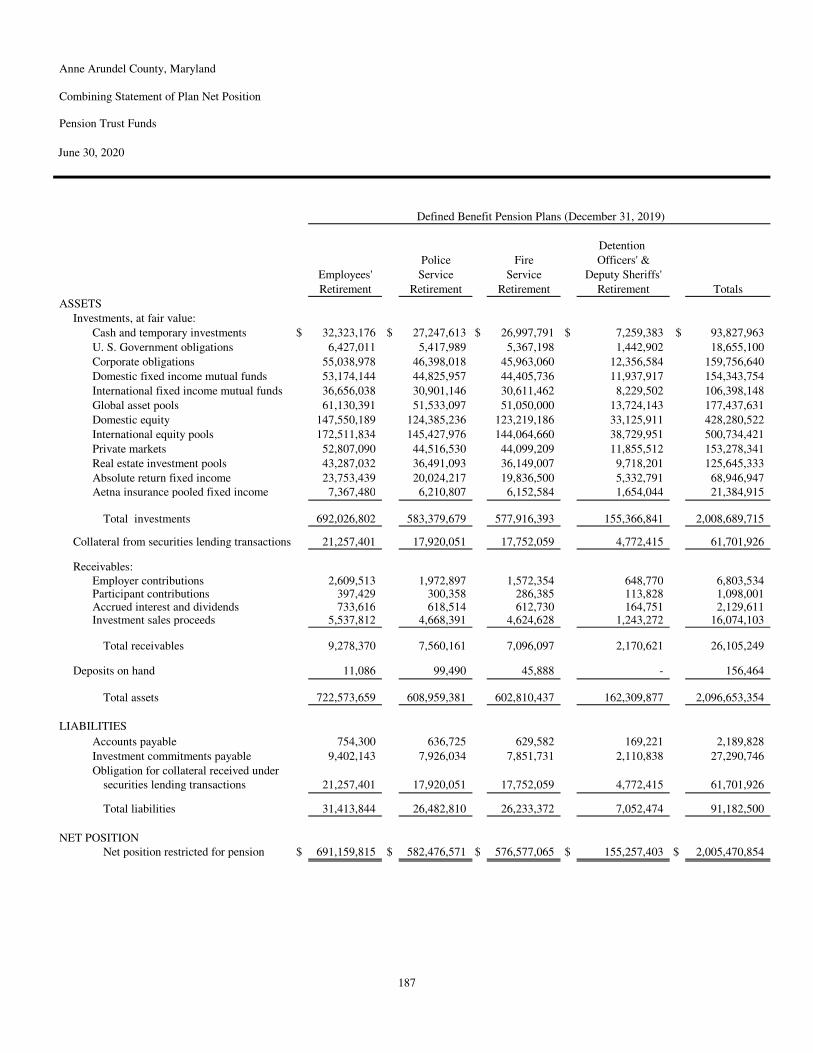
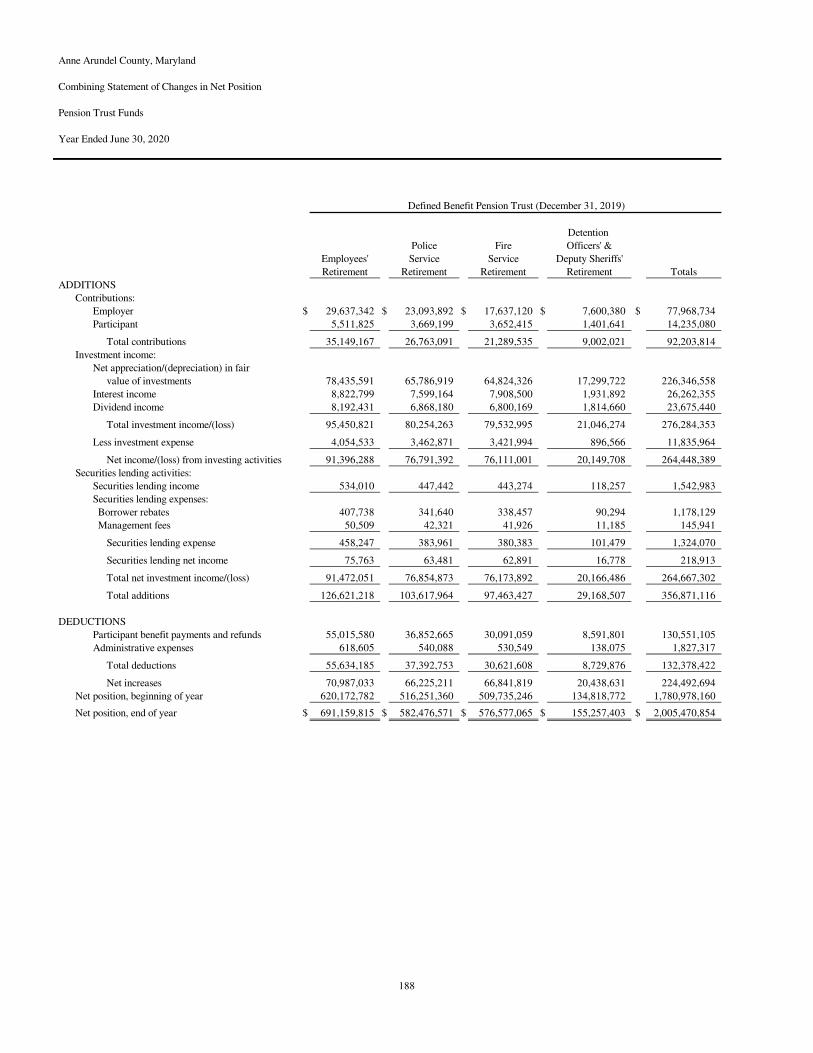
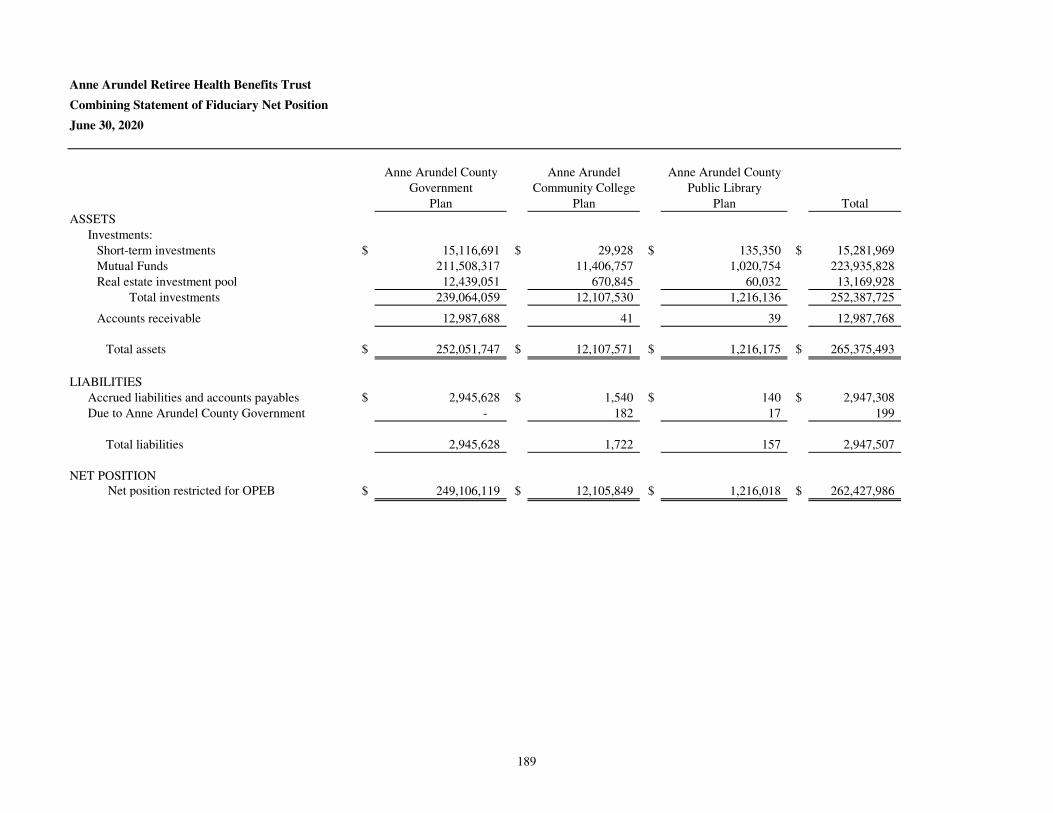
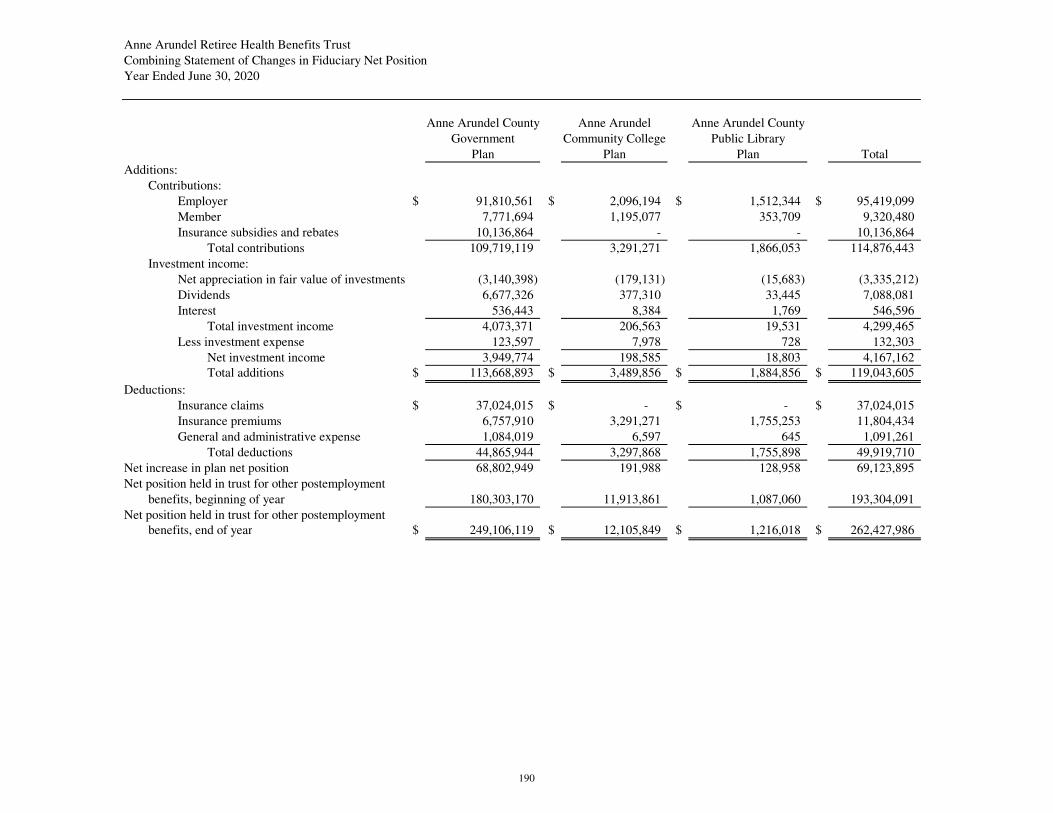
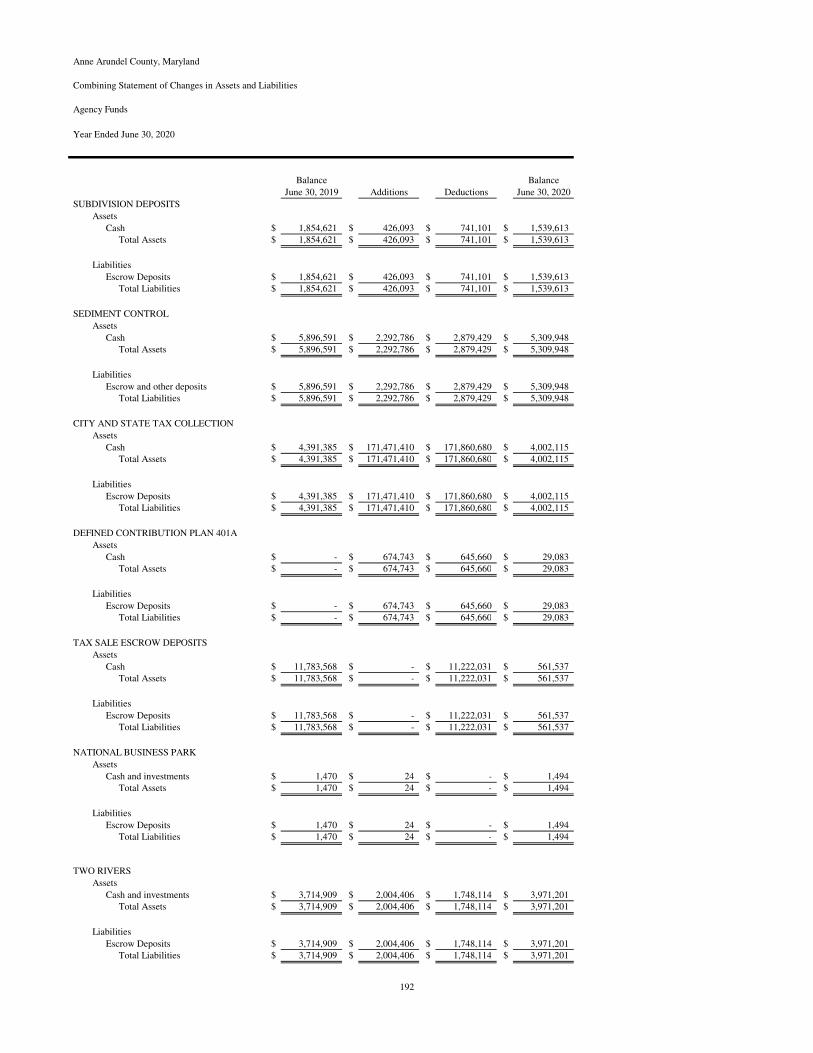
Fiduciary Funds – The fiduciary funds accumulate assets that are managed, but not owned, by the Primary government and therefore are not recorded in the government-wide statements and are not available to support County services. The County’s four defined benefit pension plans that form the Retirement System Pension Trust Funds are included in this category. The Retiree Health Benefits Trust Fund (OPEB Trust Fund) administers single employer defined benefit plans for the purpose of providing retiree health benefits. In addition, this category includes agency funds used to accumulate temporary deposits and other funds collected from outside parties in order to be returned to the payer or passed on to a third party. The Pension and OPEB Trust Funds follow the full-accrual method of accounting. The agency funds are presented as balances only and do not record revenues or expenses. Fiduciary funds are not reflected in the government-wide financial statement because the resources of those funds are not available to support the County’s own programs.
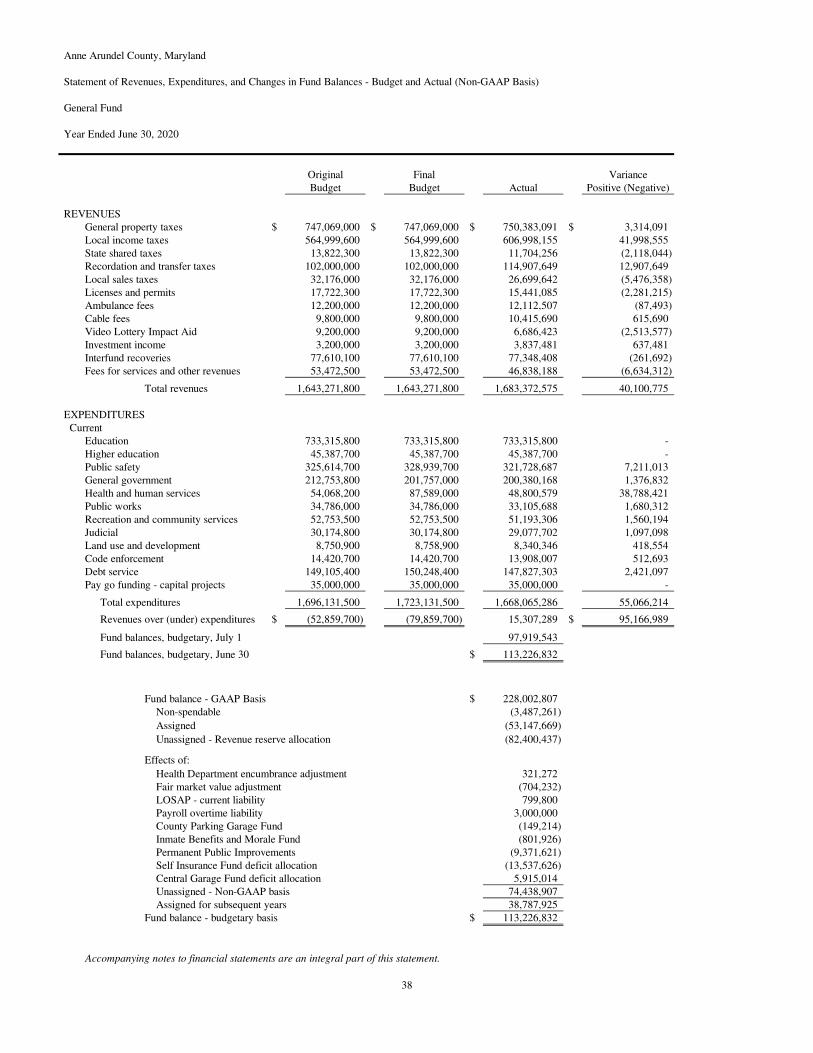
Budgetary Statements – A budgetary statement of revenue and expenditures for the General Fund has been presented in the basic financial statements. This statement provides the results of the County’s General Fund operations compared to the legally adopted budget. The statement uses the budgetary method when accounting for transactions. Revenues are
Anne Arundel County, Maryland Management Discussion and Analysis Year Ended June 30, 2020
16
generally recognized when available, and expenditures are recognized when a commitment, in the form of a purchase order or contract, has been issued to a vendor.
Notes to the Basic Financial Statements - The notes follow the basic financial statements and provide additional information essential to a full understanding of the data in the government-wide and fund financial statements.
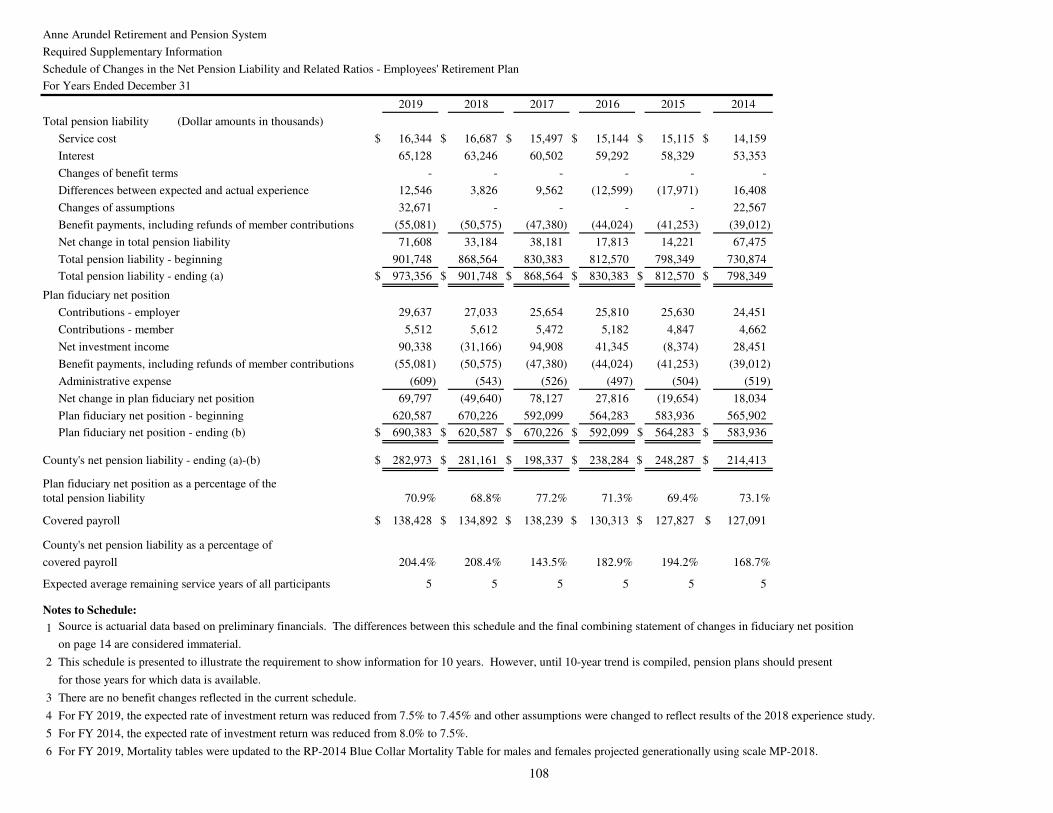
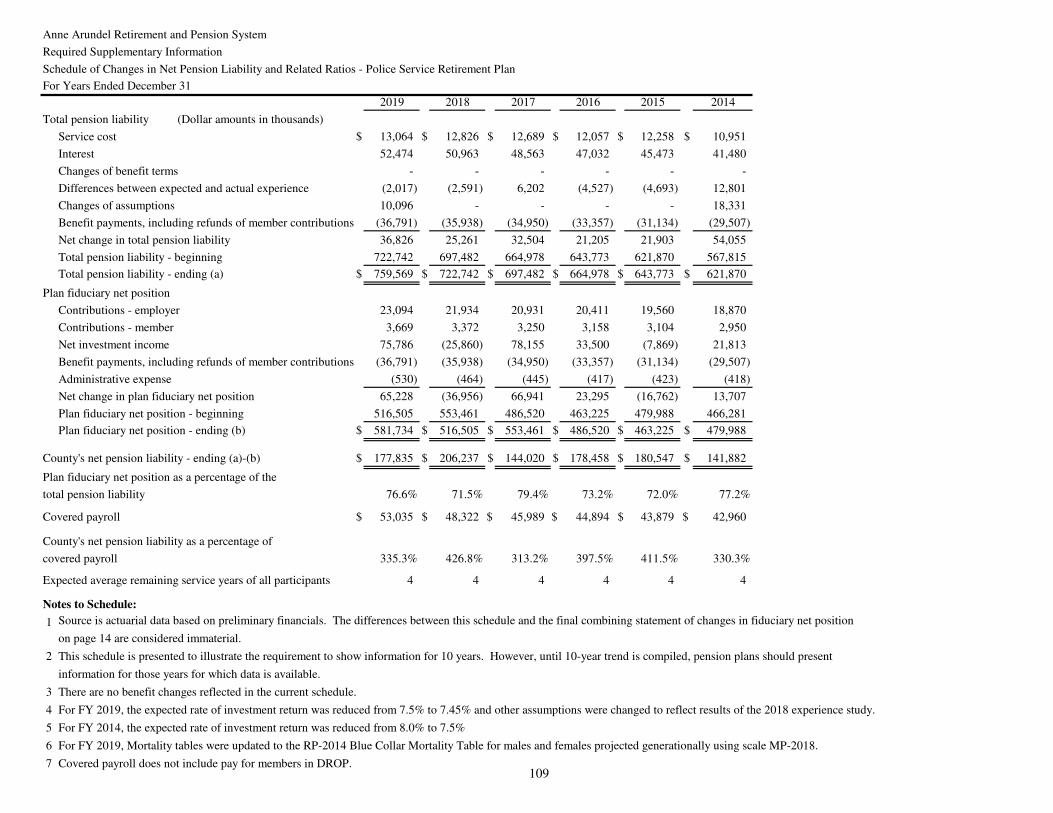
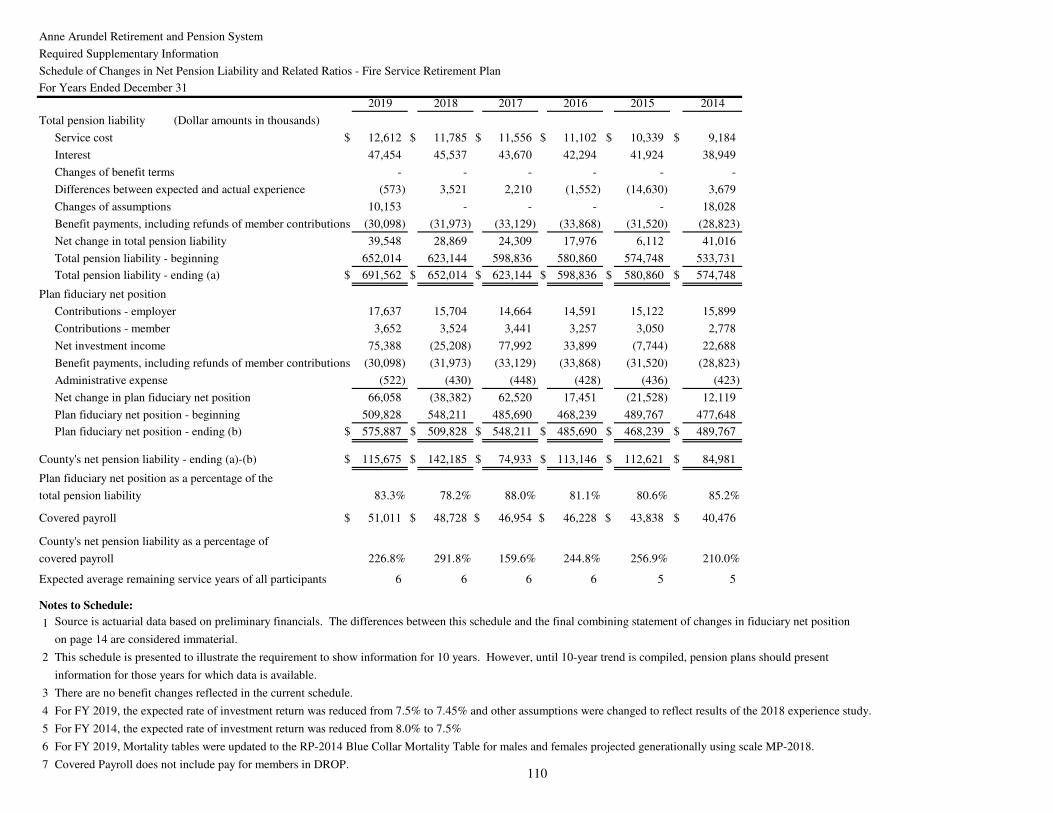
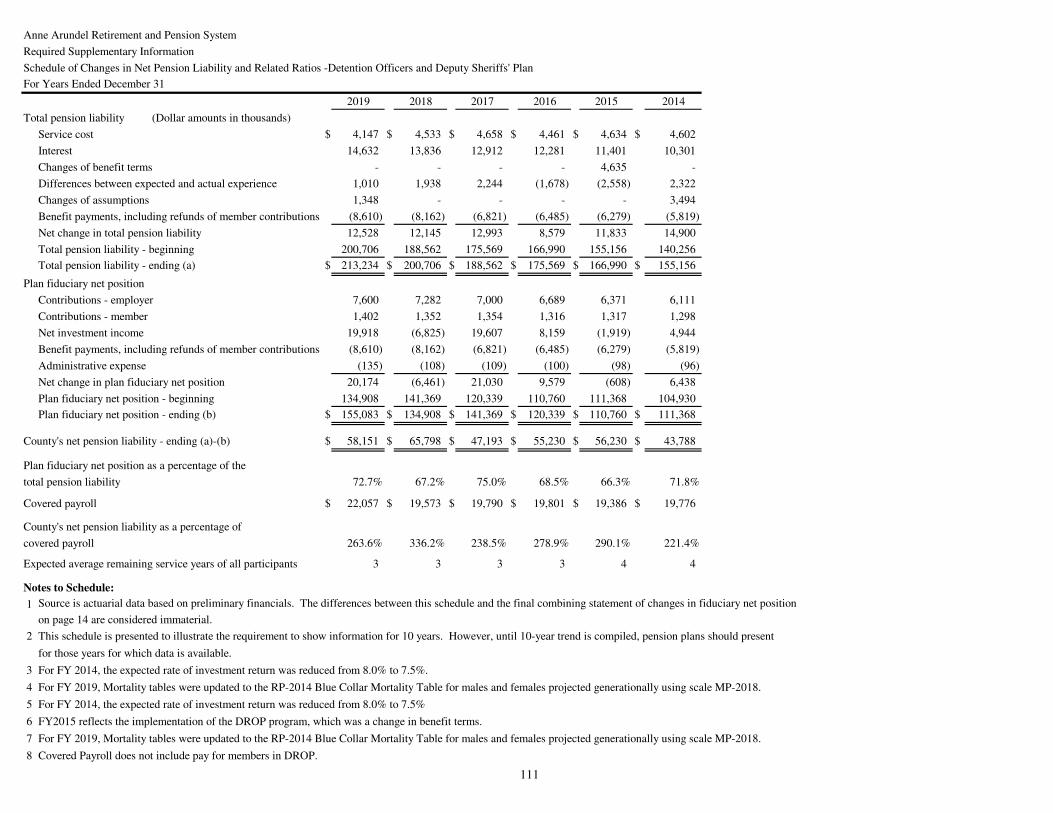
Required Supplementary Information - The required supplementary schedules provide trend data about the Pension Trust Funds and Other Post-Employment Benefits.
Financial Data and Management’s Analysis - Government-wide Statements
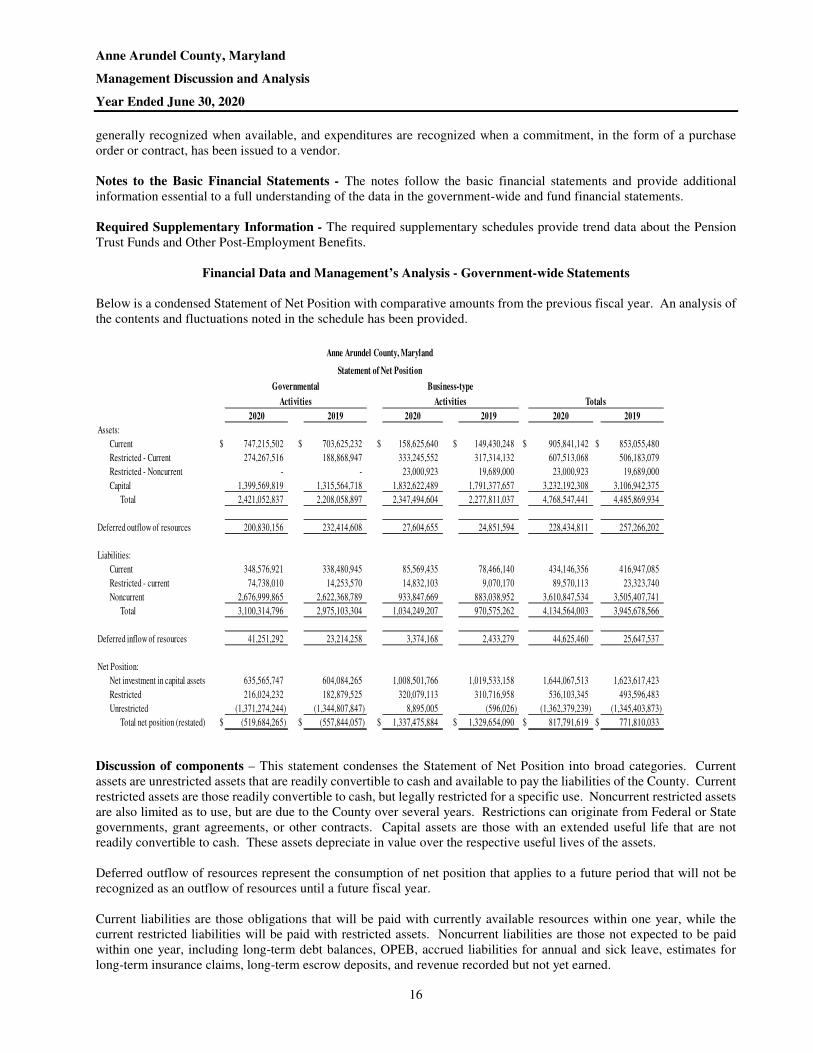
Below is a condensed Statement of Net Position with comparative amounts from the previous fiscal year. An analysis of the contents and fluctuations noted in the schedule has been provided.
Total net position (restated) $ (519,684,265) $ (557,844,057) $ 1,337,475,884 $ 1,329,654,090 $ 817,791,619 $ 771,810,033
Anne Arundel County, Maryland
Statement of Net Position
Activities
Business-typeGovernmental
Activities Totals
Discussion of components – This statement condenses the Statement of Net Position into broad categories. Current assets are unrestricted assets that are readily convertible to cash and available to pay the liabilities of the County. Current restricted assets are those readily convertible to cash, but legally restricted for a specific use. Noncurrent restricted assets are also limited as to use, but are due to the County over several years. Restrictions can originate from Federal or State governments, grant agreements, or other contracts. Capital assets are those with an extended useful life that are not readily convertible to cash. These assets depreciate in value over the respective useful lives of the assets. Deferred outflow of resources represent the consumption of net position that applies to a future period that will not be recognized as an outflow of resources until a future fiscal year. Current liabilities are those obligations that will be paid with currently available resources within one year, while the current restricted liabilities will be paid with restricted assets. Noncurrent liabilities are those not expected to be paid within one year, including long-term debt balances, OPEB, accrued liabilities for annual and sick leave, estimates for long-term insurance claims, long-term escrow deposits, and revenue recorded but not yet earned.
Anne Arundel County, Maryland Management Discussion and Analysis Year Ended June 30, 2020
17
Deferred inflows of resources represent the acquisition of net position that applies to a future period that will not be recognized as an inflow of resources until a future fiscal year. Net position represents equity remaining once amounts due from liabilities and deferred inflows of resources are subtracted from assets available and deferred outflows of resources. There are three categories: net investment in capital assets are amounts related to assets purchased or constructed net of the related debt; restricted funds are the amounts remaining after restricted liabilities are covered by restricted assets; and unrestricted funds. Management’s Analysis – Unrestricted current assets of governmental activities are $43.6 million more in fiscal year 2020. This is due primarily to an increase in cash and temporary investments, and taxes and other state revenue receivables of $39.0 million and $7.8 million, respectively, which was offset by a decrease in pre-paid expenses and other
receivables of $6.6 million. The business-type activities current assets increased by $9.2 million, primarily due to an
increase in cash and temporary investments of $7.8 million from the prior fiscal year. Restricted current assets in governmental activities increased by $85.4 million or 45.2%. This was mainly from an increase in restricted cash and temporary investments of $69.7 million. The restricted cash in the Grants Fund increased by $58.7 million as a result of Covid-19 funding which was unspent as of the end of the current fiscal year. The restricted cash in the Impact Fee Capital Projects Fund increased by $7.1 million as a result of an increase in fund balance of $7.3 million. This was in part due to an increase in fees recognized of $4.0 million. The General County Capital project fund had a decrease in cash and investments of $23.0 million. This decrease is in part the result of increases in accounts receivables of $12.5 million and a decrease in the fund balance of $5.2 million as a result of expenses receding revenues and transfer in amounts. The Non-major Governmental Funds had an increase in cash and investments of $5.6 million. This was mainly due to the following changes in cash and investments; Watershed Protection and Restoration Fund increased $4.9 million; Video Lottery Local Impact Aid decreased $5.3 million; and Odenton Town Center increased by $4.4 million. The increase in current non-restricted assets in business-type activities of $9.2 million or 6.2% was primarily due to an increase in cash and temporary investments of $7.8 million. The increase in current restricted assets in business-type activities of $15.9 million or 5.0%, was primarily due to an increase in investments and in other receivables of $12.1 million and $8.5 million, respectively, offset by a decrease in cash and temporary investments of $4.6 million. The increase in investments was due mainly to the annual reallocation of cash and the increase in other receivables was related to an increase in receivables from project developer allocations in the Water and Wastewater Debt Service Fund. The governmental capital assets balance increased by $84.0 million from the prior fiscal year or 6.4%. These increases are mainly the result of the completion of certain capital projects. Restricted noncurrent assets in business-type activities increased by $44.6 million from the prior fiscal year or 2.5%. This increase resulted in part from an increase in total capital assets of $41.2 million mainly as a result of the capitalization of water and waste water capital projects being completed and set up as capital assets in the current fiscal year.
Current unrestricted liabilities for governmental activities increased by $10.1 million or 3.0%, from the previous fiscal year. This occurred primarily due to increases in accounts payable and accrued liabilities, and current portion of non-current liabilities $13.2 million, and $8.5 million, respectively, offset by a decrease in escrow deposits, amounts due to component units, and internal balances of $4.6 million, $3.8 million and $3.2 million, respectively. The accounts payable and accrued liabilities increase was mainly from the General Fund in the amount of $19.2 million, which was offset by a decrease in the General County Capital Projects Fund of $3.7 million. The current unrestricted liabilities in business-type activities increased by $7.1 million or 9.1% from the prior fiscal, mainly the result of an increase in current portion of non-current liabilities, and internal balances of $4.0 million and $3.2 million, respectively.
Restricted current liabilities for governmental activities increased by $60.5 million or 424.4% from the prior fiscal year, mainly as a result of an increase in unearned revenue of $60.9 million due to unearned Covid-19 grant revenue. Restricted current liabilities for business-type activities increased by $5.8 million or 6.4% from the previous fiscal year, mainly the result of an increase in unearned revenue of $5.8 million. Noncurrent liabilities consist of bonded debt, pension benefits, OPEB obligation, unpaid insurance claims, loans, capital leases, and other liabilities. These liabilities increased $54.6 million or 2.1%, in governmental activities, and increased
Anne Arundel County, Maryland Management Discussion and Analysis Year Ended June 30, 2020
18
by $50.8 million or 5.8%, in business-type activities. The increase in governmental activities was mainly due to an increase in long-term debt liability of $120.6, which was offset by a decrease in pension liability of $63.5 million. The change in pension is related to updated actuary calculations, which includes changes in current contributions and updated market conditions. The increase in the noncurrent liabilities in business-type activities was caused primarily by an increase in the long-term bonded debt of $52.9 million. The components of governmental and business-type net position were discussed in the financial highlights above. It is important to note that although counties in the State of Maryland issue debt for the construction of schools, the schools are owned by the local Board of Education. Ownership reverts to the County if the building is no longer needed. The County also funds projects for the Community College and others that do not result in County assets. While the County’s statements include this outstanding debt, there are no capital assets recorded on the Primary Government’s statements. The negative unrestricted governmental activities fund balance of $1.4 billion reflects this treatment. The Board of Education and Community College net investment in capital assets of approximately $1.5 billion and $123.5 million, respectively, are evidence of the significant level of capital assets constructed primarily from County incurred debt.
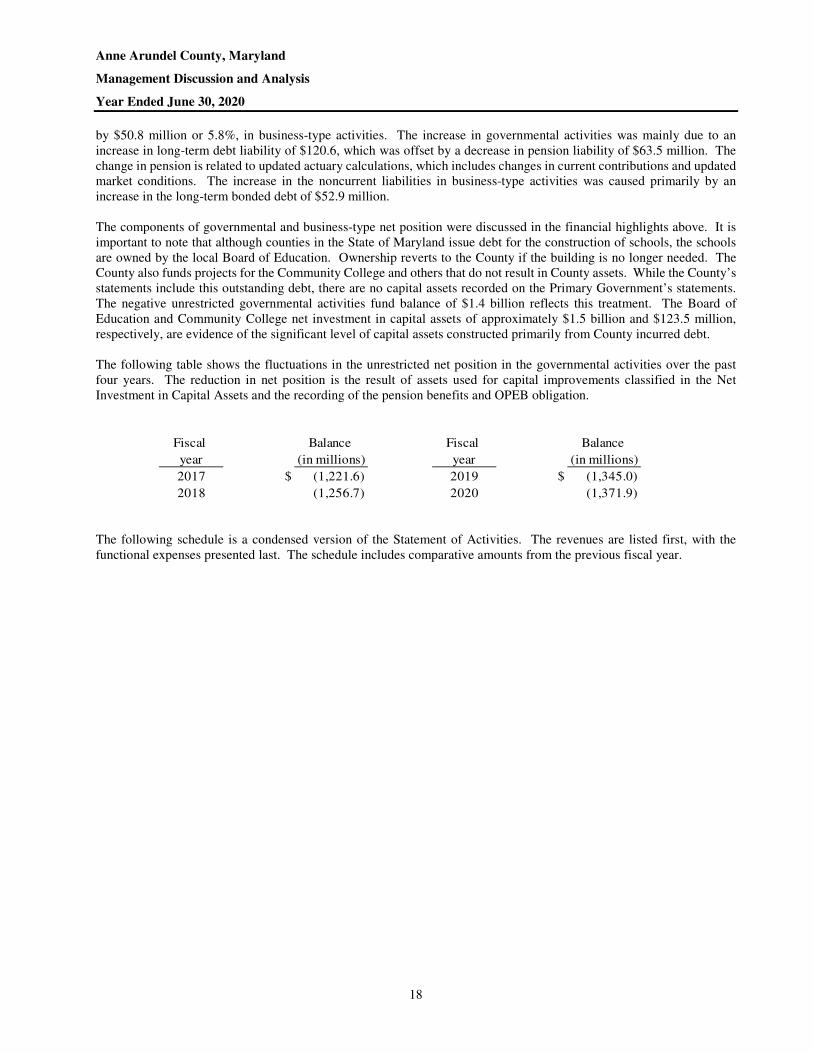
The following table shows the fluctuations in the unrestricted net position in the governmental activities over the past four years. The reduction in net position is the result of assets used for capital improvements classified in the Net Investment in Capital Assets and the recording of the pension benefits and OPEB obligation.
Fiscal Balance Fiscal Balance
year (in millions) year (in millions)
2017 $ (1,221.6) 2019 $ (1,345.0)
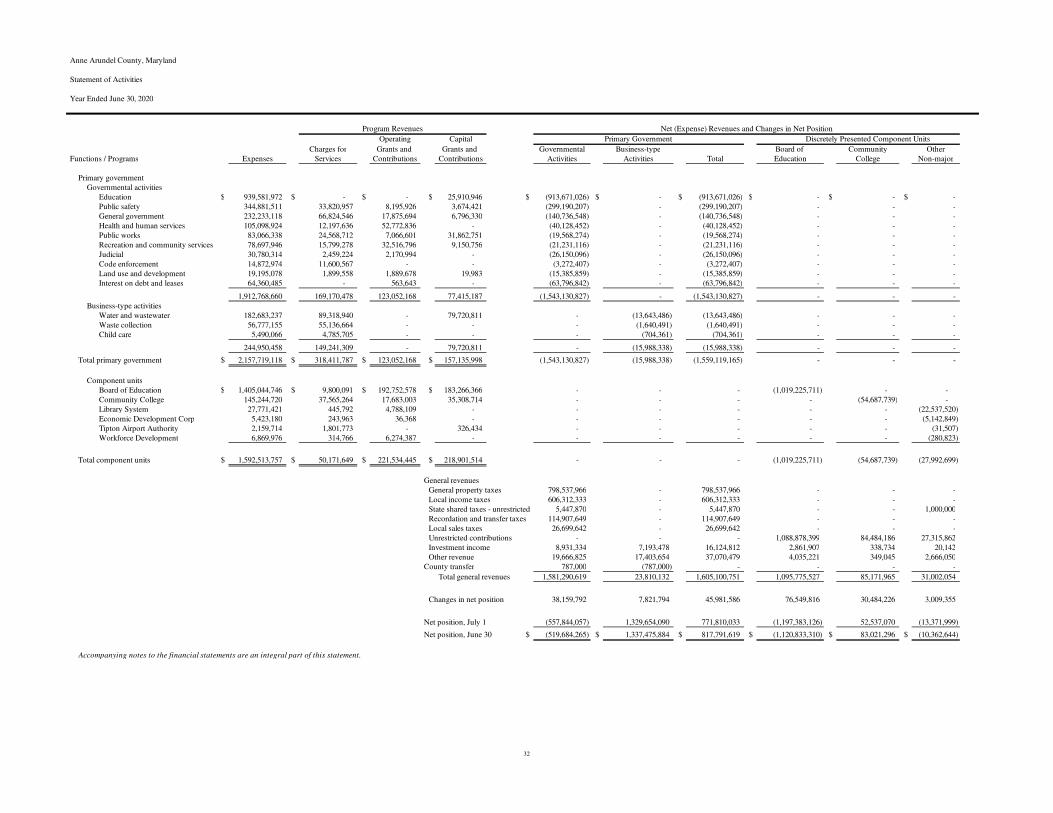
2018 (1,256.7) 2020 (1,371.9) The following schedule is a condensed version of the Statement of Activities. The revenues are listed first, with the functional expenses presented last. The schedule includes comparative amounts from the previous fiscal year.
Anne Arundel County, Maryland Management Discussion and Analysis Year Ended June 30, 2020
Child care - - 5,490,066 5,650,435 5,490,066 5,650,435
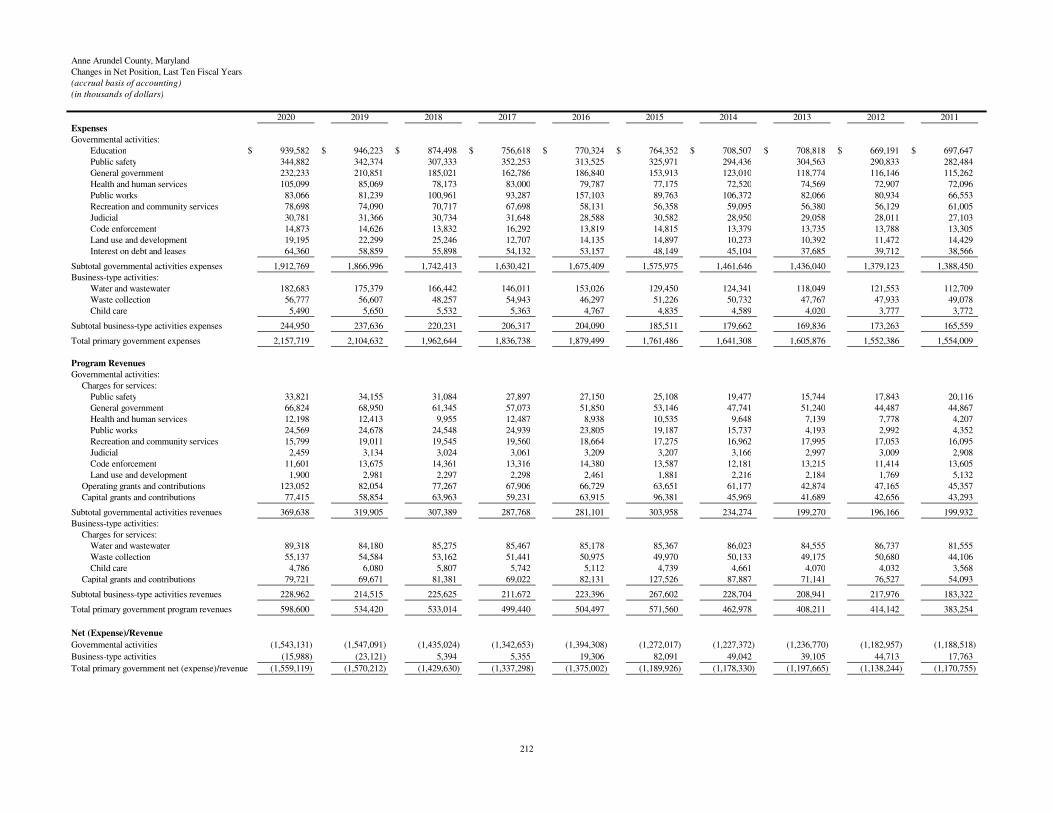
Total expenses 1,912,768,660 1,866,995,843 244,950,458 237,635,719 2,157,719,118 2,104,631,562
Increase(decrease) in net
position 37,372,792 (59,471,173) 8,608,794 240,648 45,981,586 (59,230,525)
Non operating income and expense:
County Transfer 787,000 2,380,000 (787,000) (2,380,000) - -
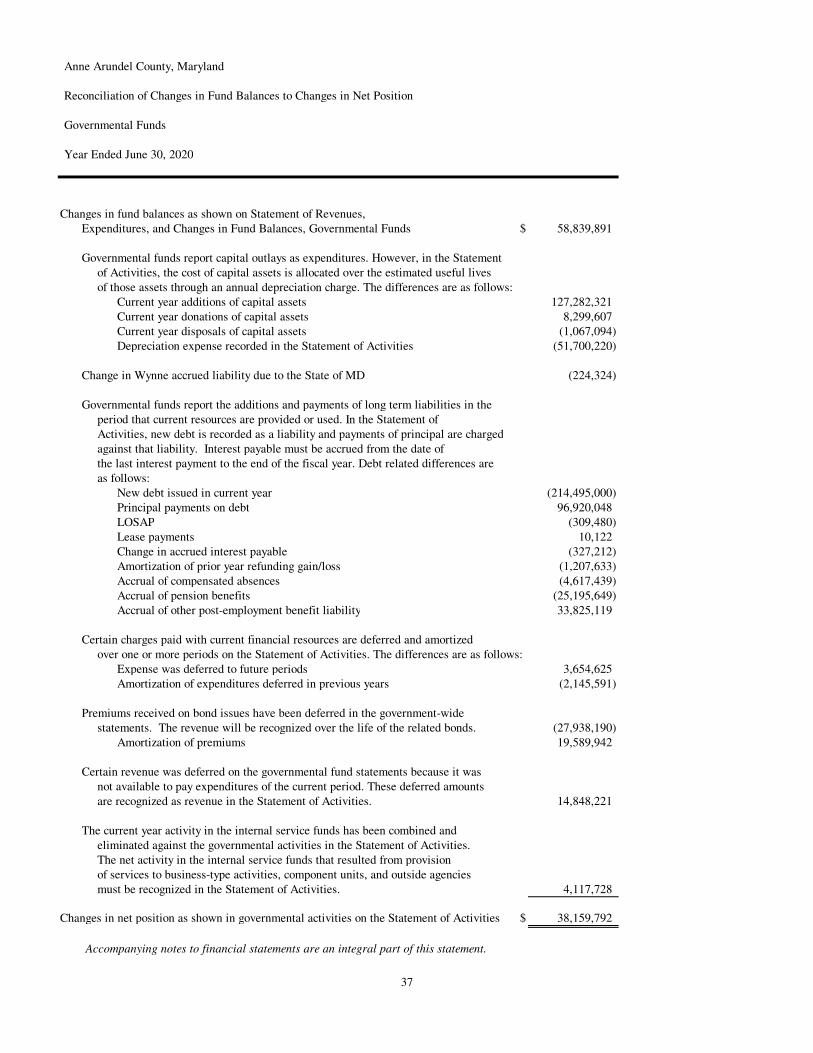
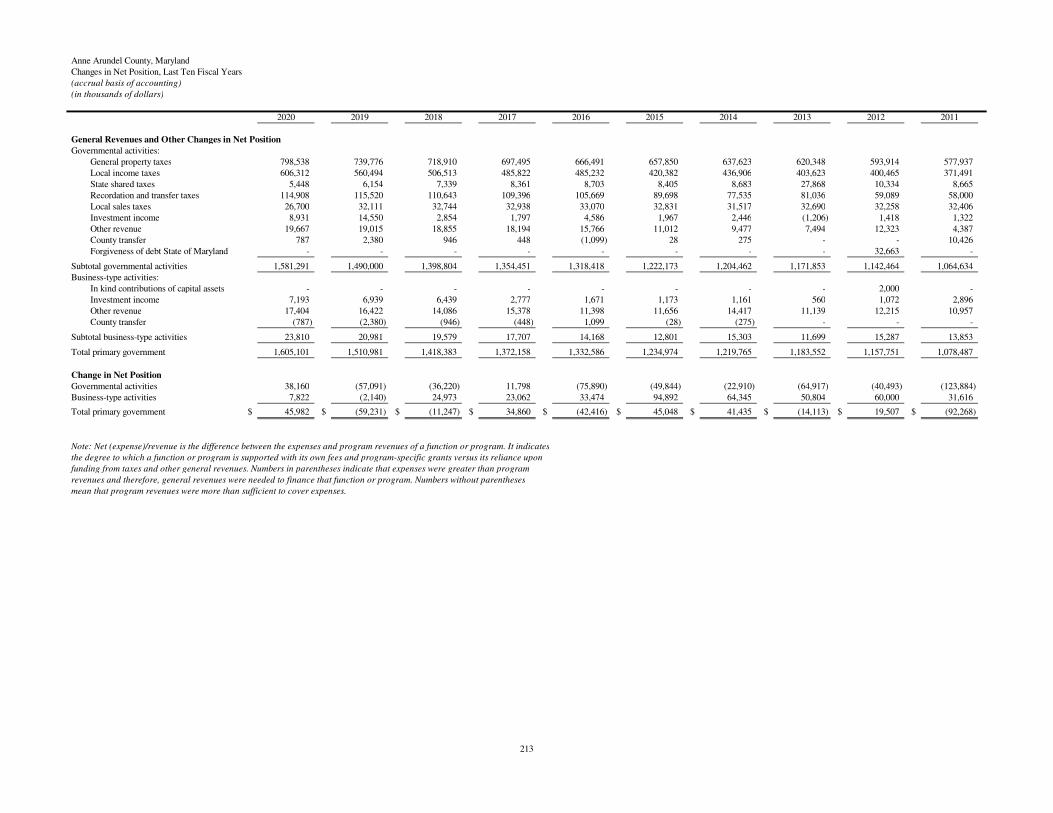
Change in Net Position 38,159,792 (57,091,173) 7,821,794 (2,139,352) 45,981,586 (59,230,525)
Net Position, beg of year (557,844,057) (500,752,884) 1,329,654,090 1,331,793,442 771,810,033 831,040,558
Adjustment to restate net
position - - -
Net Position, end of year $ (519,684,265) $ (557,844,057) $ 1,337,475,884 $ 1,329,654,090 $ 817,791,619 $ 771,810,033
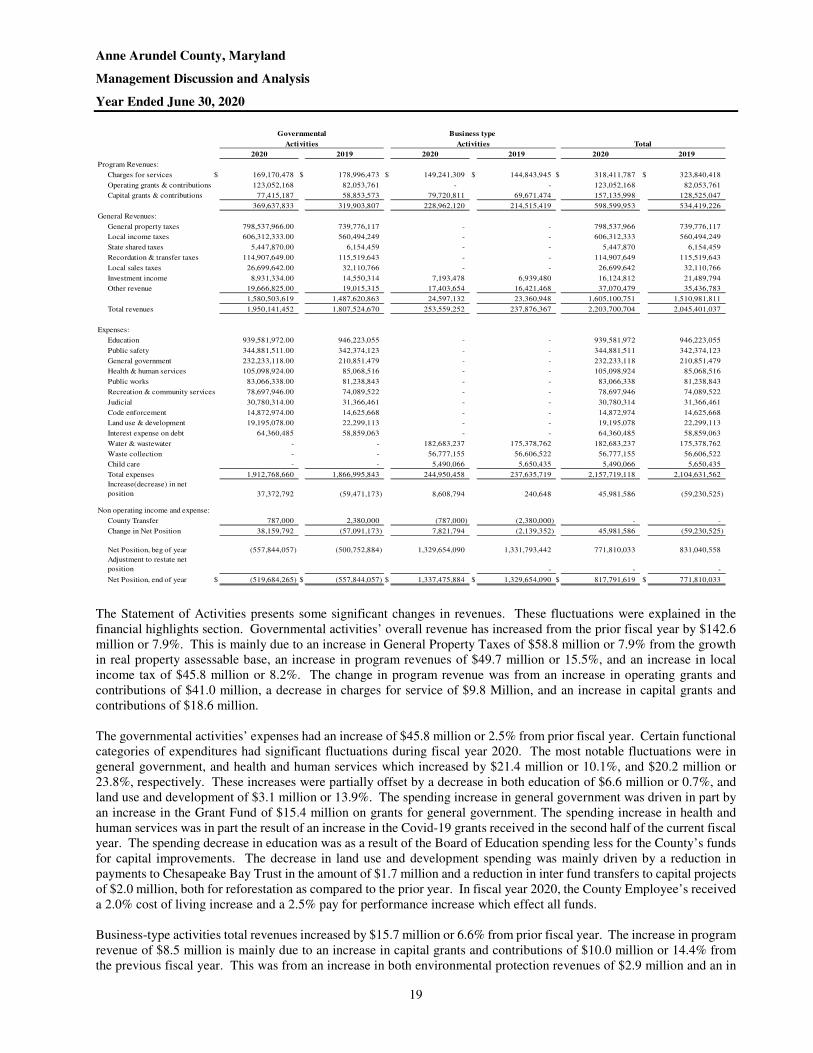
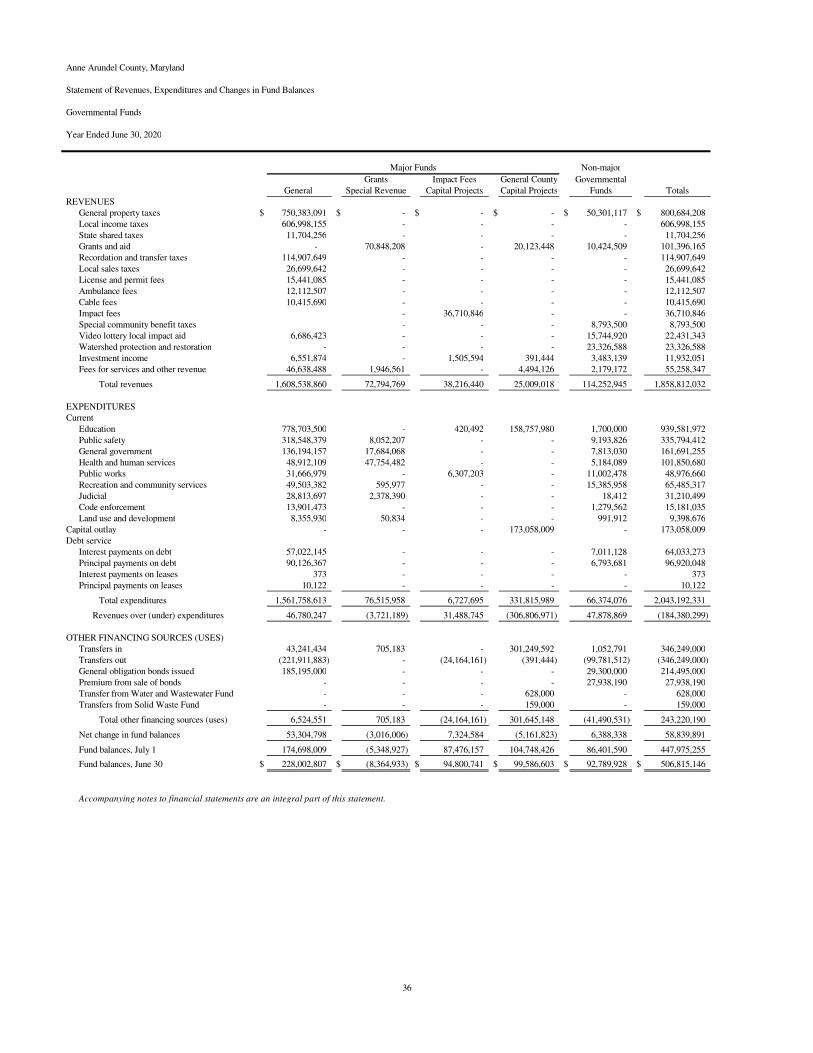
The Statement of Activities presents some significant changes in revenues. These fluctuations were explained in the financial highlights section. Governmental activities’ overall revenue has increased from the prior fiscal year by $142.6 million or 7.9%. This is mainly due to an increase in General Property Taxes of $58.8 million or 7.9% from the growth in real property assessable base, an increase in program revenues of $49.7 million or 15.5%, and an increase in local income tax of $45.8 million or 8.2%. The change in program revenue was from an increase in operating grants and contributions of $41.0 million, a decrease in charges for service of $9.8 Million, and an increase in capital grants and contributions of $18.6 million.
The governmental activities’ expenses had an increase of $45.8 million or 2.5% from prior fiscal year. Certain functional categories of expenditures had significant fluctuations during fiscal year 2020. The most notable fluctuations were in general government, and health and human services which increased by $21.4 million or 10.1%, and $20.2 million or 23.8%, respectively. These increases were partially offset by a decrease in both education of $6.6 million or 0.7%, and land use and development of $3.1 million or 13.9%. The spending increase in general government was driven in part by an increase in the Grant Fund of $15.4 million on grants for general government. The spending increase in health and human services was in part the result of an increase in the Covid-19 grants received in the second half of the current fiscal year. The spending decrease in education was as a result of the Board of Education spending less for the County’s funds for capital improvements. The decrease in land use and development spending was mainly driven by a reduction in payments to Chesapeake Bay Trust in the amount of $1.7 million and a reduction in inter fund transfers to capital projects of $2.0 million, both for reforestation as compared to the prior year. In fiscal year 2020, the County Employee’s received a 2.0% cost of living increase and a 2.5% pay for performance increase which effect all funds.
Business-type activities total revenues increased by $15.7 million or 6.6% from prior fiscal year. The increase in program revenue of $8.5 million is mainly due to an increase in capital grants and contributions of $10.0 million or 14.4% from the previous fiscal year. This was from an increase in both environmental protection revenues of $2.9 million and an in
Anne Arundel County, Maryland Management Discussion and Analysis Year Ended June 30, 2020
20
capital contributions in of $7.2 million in the Utility Debt Service Fund. General revenues increased by $1.2 million or 5.3% which was mainly from an increase in other revenue of $1.0 million from the prior fiscal year.
Business-type expenses had an overall increase of $7.3 million or 3.1% from the previous fiscal year, which was primarily caused by an increase water and wastewater fund of $7.3 million. The increase in the Water and Wastewater Operating Fund was in part from a $4.6 million increase in contractual services and an increase in depreciation expense of $1.2 million. There was also an increase in the Utility Debt Service fund of $1.8 million for interest expense. Distribution of Revenues and Expenses The next two charts show the percentage distribution of revenues from governmental activities and the percentage expended on each function. Discussion of the 2020 distribution and significant changes since 2019 follows.
General revenue sources continue to provide the vast majority of the County’s revenue. Tax revenues from property assessments, income, State shared sources, recordation and transfer, and sales provided 80% of the revenue base, which decreased 1% from fiscal year 2019. Charges for services paid to the County by users were 8% for fiscal year 2020, a decrease from fiscal year 2019 which was 10%.
An analysis of the percentage distribution of revenues revealed that there was an increase in Operating Contributions and Capital Contributions from 4% to 6% and 3% to 4%, respectively, while Sales Tax and Charges for Services decreased from 2% to 1% and 10% to 8%, respectively. An analysis of the percentage distribution of expenses by function revealed that General County and Health and Human Services increased slightly from 11% to 12% and 5% to 6%, respectively, while Education (Board of Education and Community College) decreased from 51% to 49%.
Property Taxes41%
Income Taxes31%
State SharedTaxes
1%
Recordation and Transfer Taxes
6%
Sales Taxes1%
InvestmentIncome
1% Other1%
Charges forServices
8%
OperatingContributions
6%Capital
Contributions4%
Governmental Revenues Fiscal Year 2020
Anne Arundel County, Maryland Management Discussion and Analysis Year Ended June 30, 2020
21
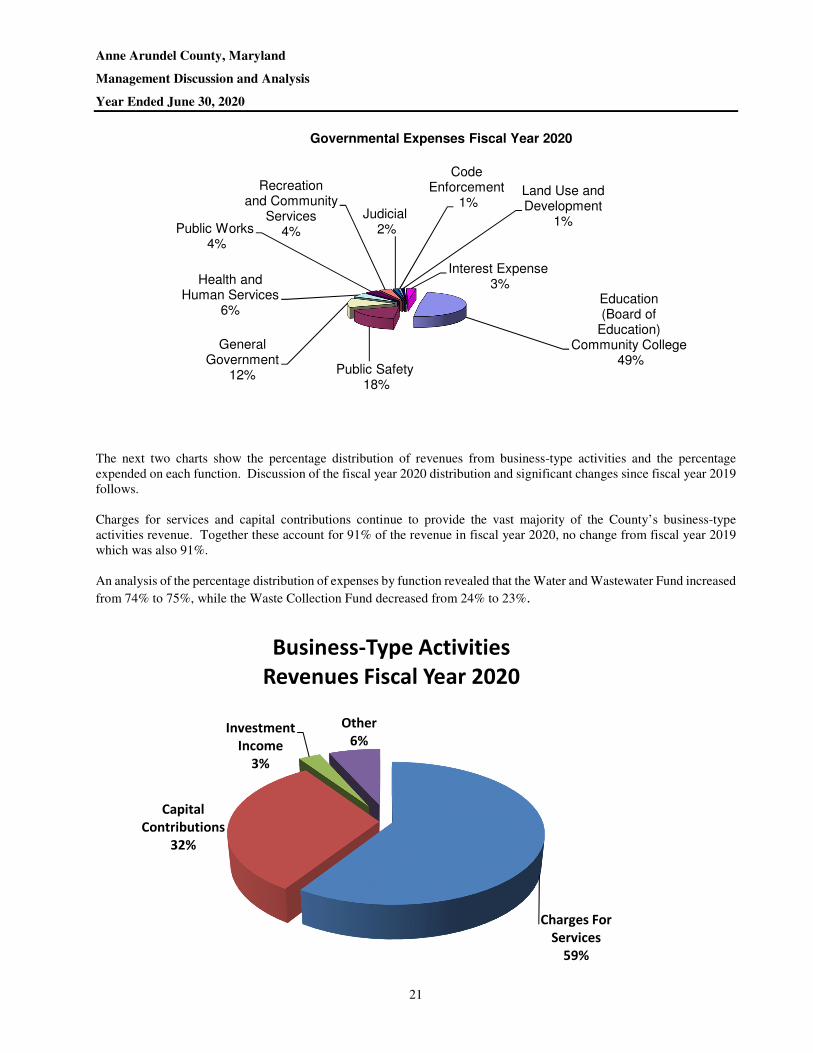
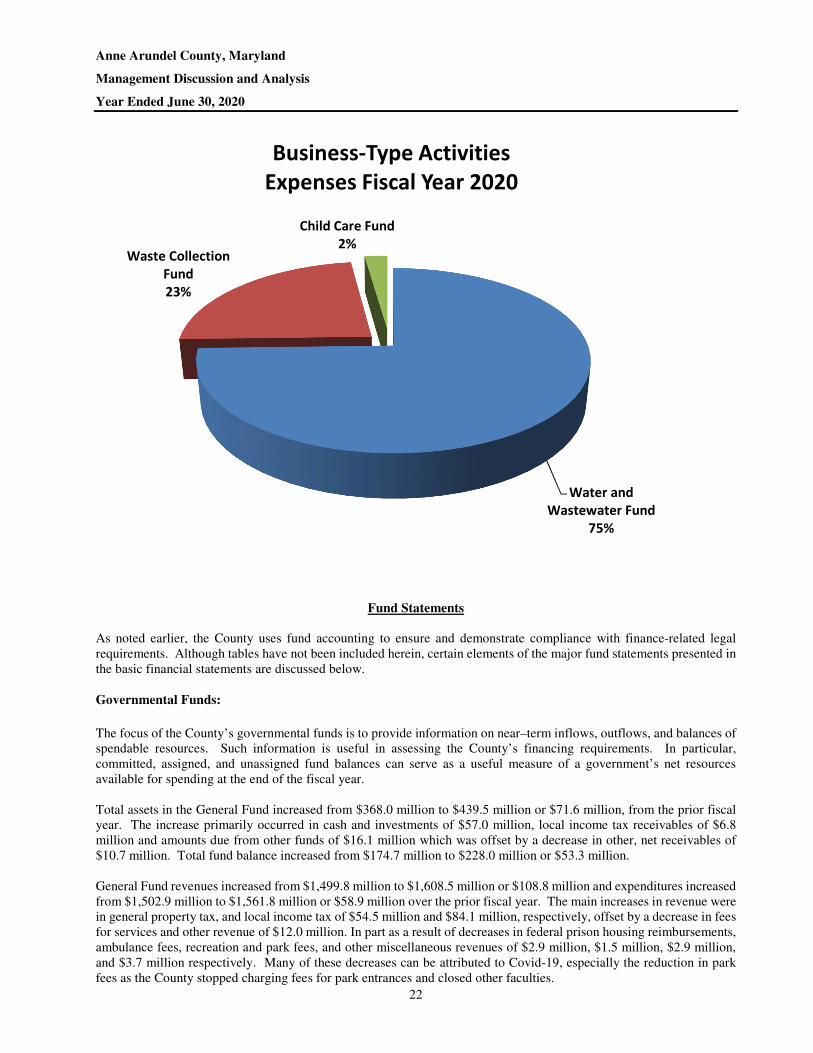
The next two charts show the percentage distribution of revenues from business-type activities and the percentage expended on each function. Discussion of the fiscal year 2020 distribution and significant changes since fiscal year 2019 follows. Charges for services and capital contributions continue to provide the vast majority of the County’s business-type activities revenue. Together these account for 91% of the revenue in fiscal year 2020, no change from fiscal year 2019 which was also 91%.
An analysis of the percentage distribution of expenses by function revealed that the Water and Wastewater Fund increased
from 74% to 75%, while the Waste Collection Fund decreased from 24% to 23%.
Education(Board of
Education)Community College
49%Public Safety
18%
GeneralGovernment
12%
Health and Human Services
6%
Public Works4%
Recreationand Community
Services4%
Judicial2%
CodeEnforcement
1%Land Use andDevelopment
1%
Interest Expense3%
Governmental Expenses Fiscal Year 2020
Charges For
Services
59%
Capital
Contributions
32%
Investment
Income
3%
Other
6%
Business-Type Activities
Revenues Fiscal Year 2020
Anne Arundel County, Maryland Management Discussion and Analysis Year Ended June 30, 2020
22
Fund Statements
As noted earlier, the County uses fund accounting to ensure and demonstrate compliance with finance-related legal requirements. Although tables have not been included herein, certain elements of the major fund statements presented in the basic financial statements are discussed below. Governmental Funds:
The focus of the County’s governmental funds is to provide information on near–term inflows, outflows, and balances of spendable resources. Such information is useful in assessing the County’s financing requirements. In particular, committed, assigned, and unassigned fund balances can serve as a useful measure of a government’s net resources available for spending at the end of the fiscal year. Total assets in the General Fund increased from $368.0 million to $439.5 million or $71.6 million, from the prior fiscal year. The increase primarily occurred in cash and investments of $57.0 million, local income tax receivables of $6.8 million and amounts due from other funds of $16.1 million which was offset by a decrease in other, net receivables of $10.7 million. Total fund balance increased from $174.7 million to $228.0 million or $53.3 million. General Fund revenues increased from $1,499.8 million to $1,608.5 million or $108.8 million and expenditures increased from $1,502.9 million to $1,561.8 million or $58.9 million over the prior fiscal year. The main increases in revenue were in general property tax, and local income tax of $54.5 million and $84.1 million, respectively, offset by a decrease in fees for services and other revenue of $12.0 million. In part as a result of decreases in federal prison housing reimbursements, ambulance fees, recreation and park fees, and other miscellaneous revenues of $2.9 million, $1.5 million, $2.9 million, and $3.7 million respectively. Many of these decreases can be attributed to Covid-19, especially the reduction in park fees as the County stopped charging fees for park entrances and closed other faculties.
Water and
Wastewater Fund
75%
Waste Collection
Fund
23%
Child Care Fund
2%
Business-Type Activities
Expenses Fiscal Year 2020
Anne Arundel County, Maryland Management Discussion and Analysis Year Ended June 30, 2020
23
The County has put aside funds for permanent public infrastructure, in the amount of $9.4 million, which is included in the restricted fund balance of the General Fund. The County has a Revenue Reserve Fund which is included in the unassigned category of General Fund balance. At the end of the current fiscal year, a balance of $82.4 million was in the reserve fund. This increase from the prior fiscal year is from the current year contribution of $5.5 million and investment earnings of $3.5 million. This reserve may only be used when revenues fall below budget expectations and would require legislative action. This fund has been in existence since fiscal year 1994 and has been drawn on by Management in fiscal year 2009 and fiscal year 2010 in the amounts of $16.8 million and $16.0 million, respectively, as a result of underperforming revenues during the recession of 2008 and 2009. The Grants Fund is being presented as a major fund in the current fiscal year as a result of the inflow and outflow of COVID-19 grants received from state and federal sources. The total fund balance decreased by $3.0 million, from a negative $5.3 million in fiscal year 2019 to a negative $8.4 million in fiscal year 2020. This was a result of an increase in deferred inflows of resources which was not received by September 30, 2020. The Impact Fees Capital Project Fund retains developer impact fees until needed for the construction of capital assets. The total fund balance increased $7.3 million, from $87.5 million in fiscal year 2019 to $94.8 million in fiscal year 2020. This was a result of impact fee revenues of $36.7 million exceeding impact fee expenses of $6.3 million and transfers out to capital projects of $24.2 million. The amounts transferred are used for the construction of capital assets and to pay off debt, both of which are related to impact fee eligible projects. The General County Capital Projects Fund’s total assets decreased from $187.7 million in fiscal year 2019 to $177.2 million in fiscal year 2020, or $10.4 million. This is primarily due to a decrease in cash and investments of $23.0 million at the end of current fiscal year, and an increase in receivables of $12.5 million. The receivable increase was in part due to the grants receivable increase in recreation and parks of $5.0 million for Greenways and Quite Waters Park, and Anne Arundel Community College for the Health Building of $3.3 million. Amounts due from the Board of Education increased by $3.3 million. Liabilities decreased by $9.9 million compared to the prior fiscal year, primarily due to a decrease in the amount due to the Board of Education of $9.1 million. Deferred inflow of resources increased $4.6 million due to an increase in unavailable grant and program revenue. The change in fund balance from the prior fiscal year decreased from $104.7 million to $99.6 million in fiscal year 2020, for a decrease of $5.1 million in fund balance from the prior fiscal year. Revenues in the General County Capital Projects Fund increased from $23.5 million in fiscal year 2019 to $25.0 million in fiscal year 2020, or by $1.6 million. Expenditures in this fund decreased by $50.8 million which is attributed to a decrease of $56.0 million for amounts paid to the Board of Education and Community College for capital projects and a $4.3 million increase in capital outlay expense. The decrease in Board of Education and Community College is primarily attributable to the decrease in cost for school construction. Although, school construction costs fluctuated based on various projects, Crofton Area High School, Jessup Elementary School and Arnold Elementary School completed construction which decreased costs by $68.1 million compared to the prior fiscal year. This was offset by an increased in funding for Anne Arundel Community College’s, Health, Science and Biology Building of $22.8 million. Proprietary Funds:
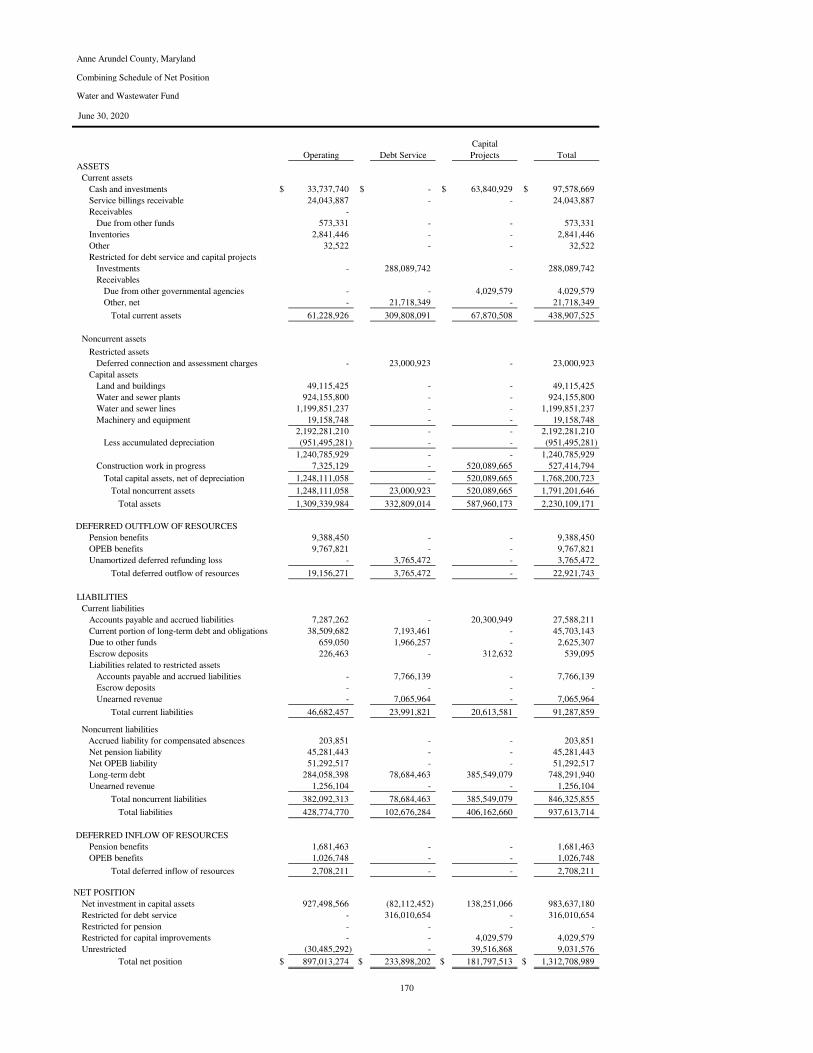
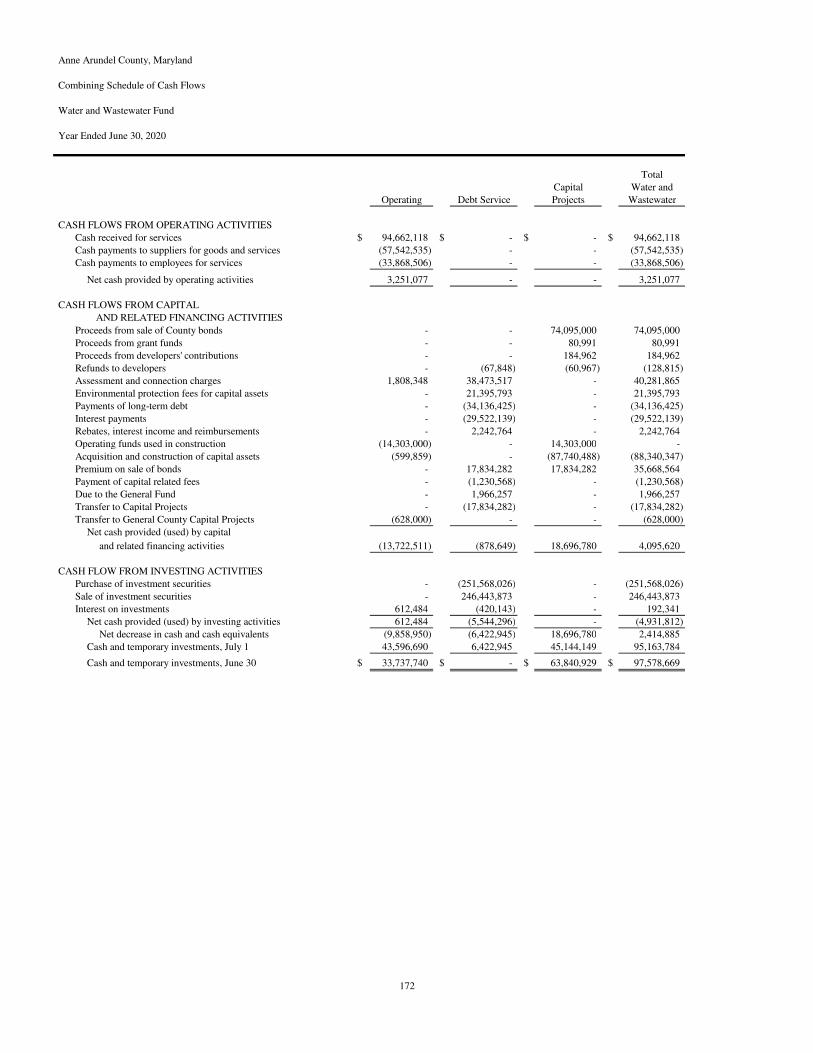
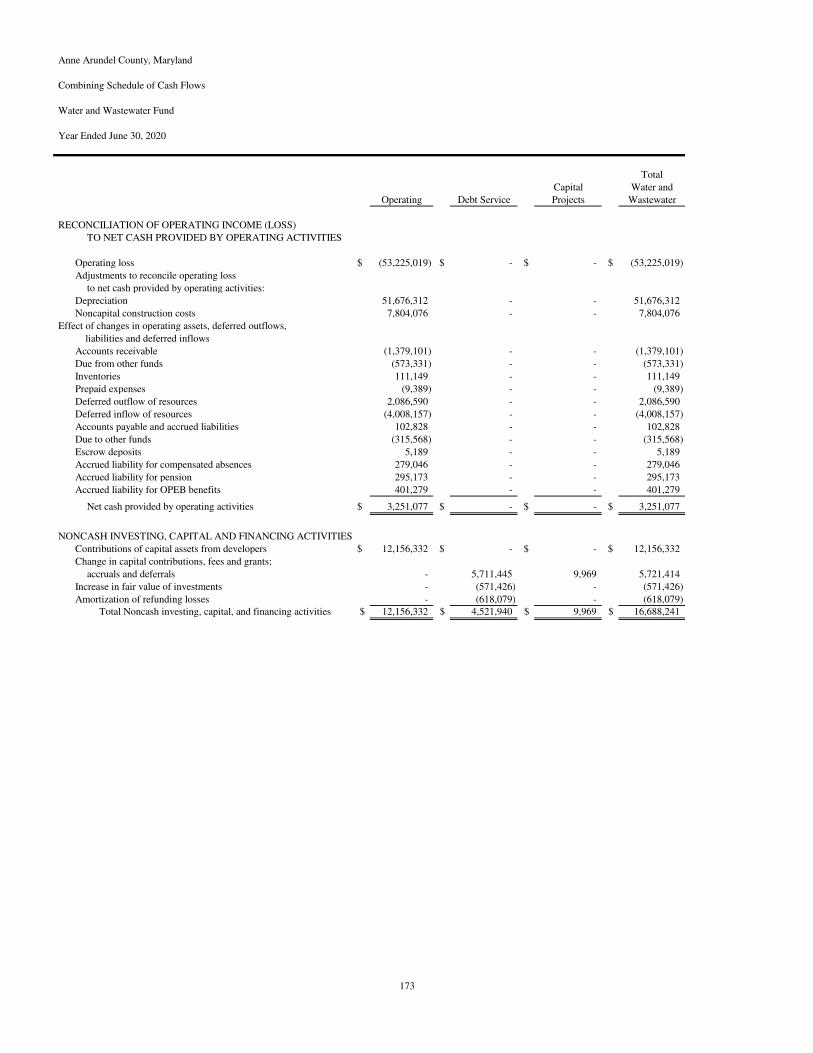
The County’s proprietary fund’s statements provide the same information found in the government-wide financial statements, but in more detail. The Water and Wastewater Fund’s assets totaled $2.2 billion at the end of fiscal year 2020, which was an increase of $66.8 million over fiscal year 2019. The increase primarily occurred as a result of an increase in net capital assets of $38.6 million and an increase in investments, restricted receivables and deferred connection and assessment charges of $12.1 million, $8.5 million and $3.3 million, respectively. Capital assets increase each year as capital projects are completed and developer donated water and sewer facilities are added. The main increase in liabilities was an increase in long term debt of $51.3 million. As a result of the changes in assets and liabilities, the Water and Wastewater Fund’s net position increased $10.4 million or 0.8%.
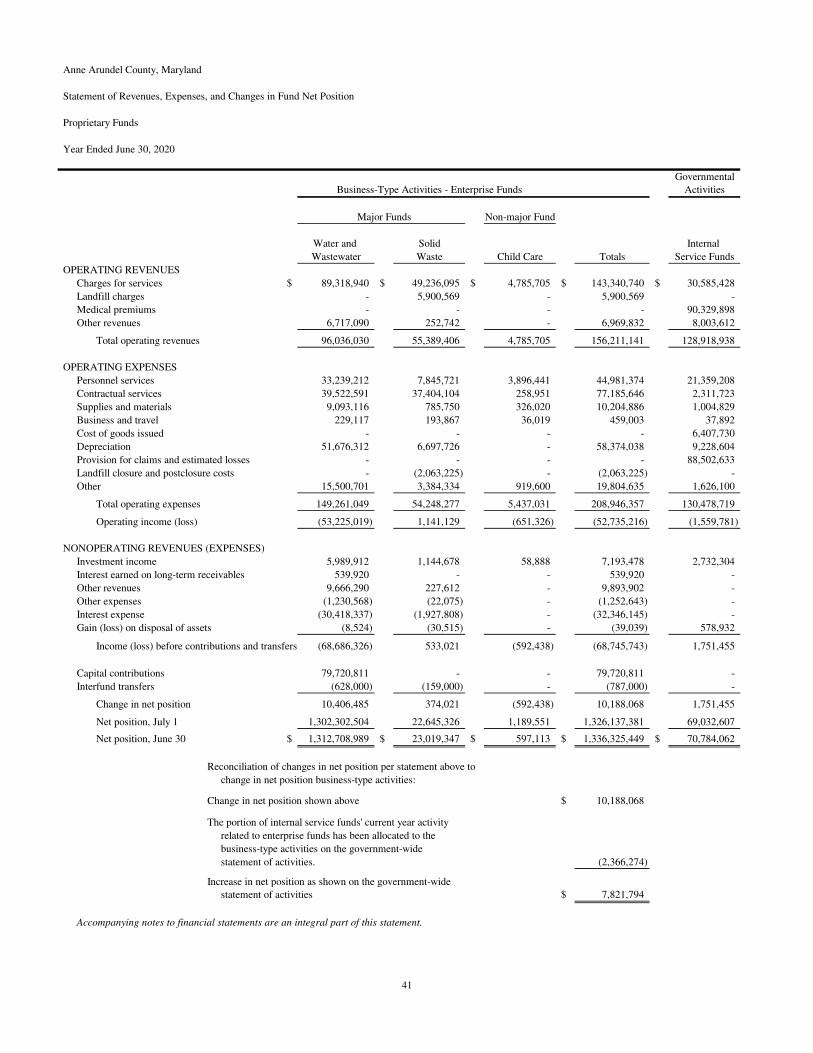
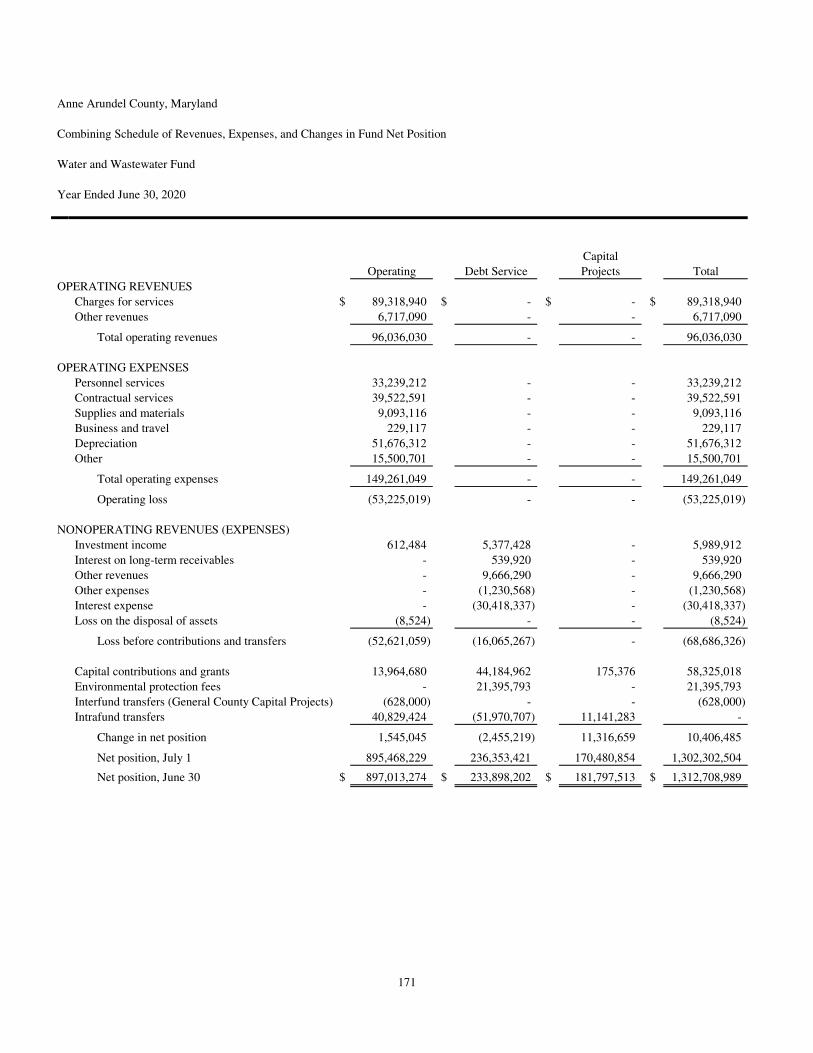
The Statement of Revenues, Expenses, and Changes in Fund Net Position for Water and Wastewater Fund had an increase in operating revenues of $5.6 million. Operating expenses increased by $3.4 million or 2.4%, mainly from an increase in
Anne Arundel County, Maryland Management Discussion and Analysis Year Ended June 30, 2020
24
contractual services of $4.9 million, and an increase in personnel services expense of $2.8 million. Non-operating revenue and expenses decreased from the previous year by $0.765 million. Capital contributions and grants increased by $7.2 million. These contributions represent the capital assets built by developers and fees collected from properties connecting to the County’s water and wastewater systems.
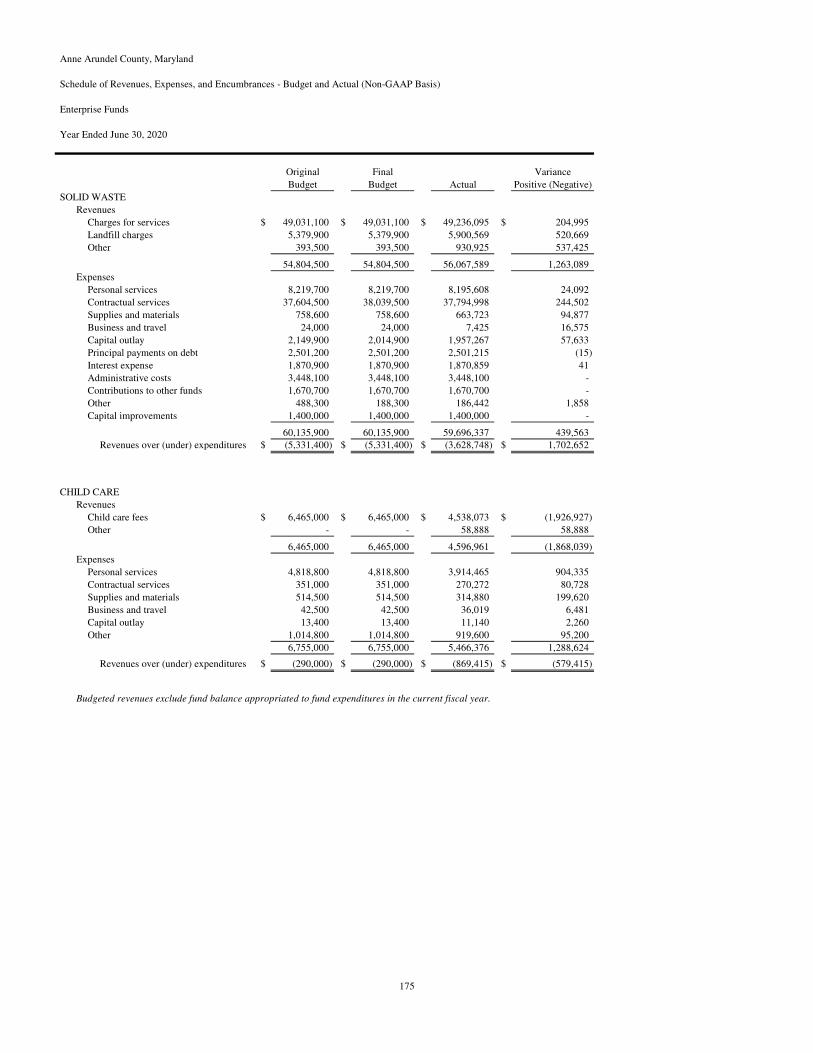
The Solid Waste Fund’s assets increased by $0.374 million. Liabilities increased by $4.4 million from the prior fiscal year in part from an increase in long-term debt of $4.7 million compared to prior fiscal year.
The Statement of Revenues, Expenses, and Changes in Fund Net Position for Solid Waste had an increase in operating revenue of $0.549 million and a decrease in operating expenses of $0.533 million. This contributed to an increase in net position of $0.347 million at the end of the current fiscal year.
Fiduciary Funds:
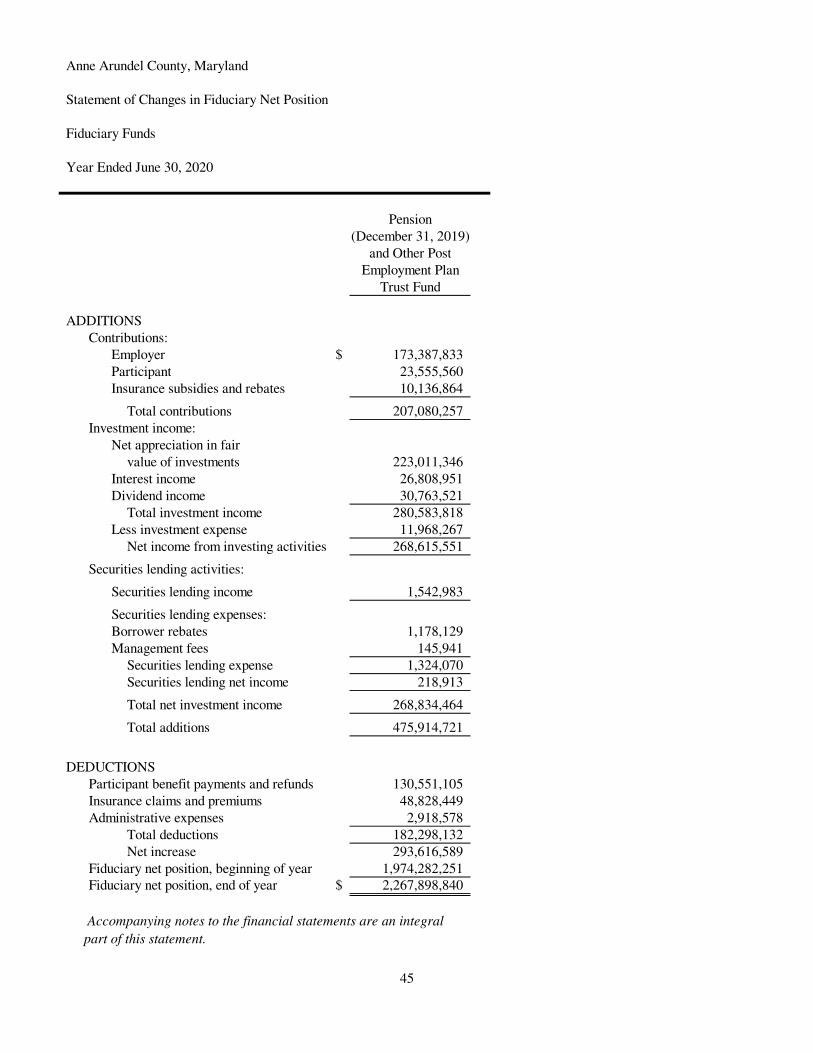
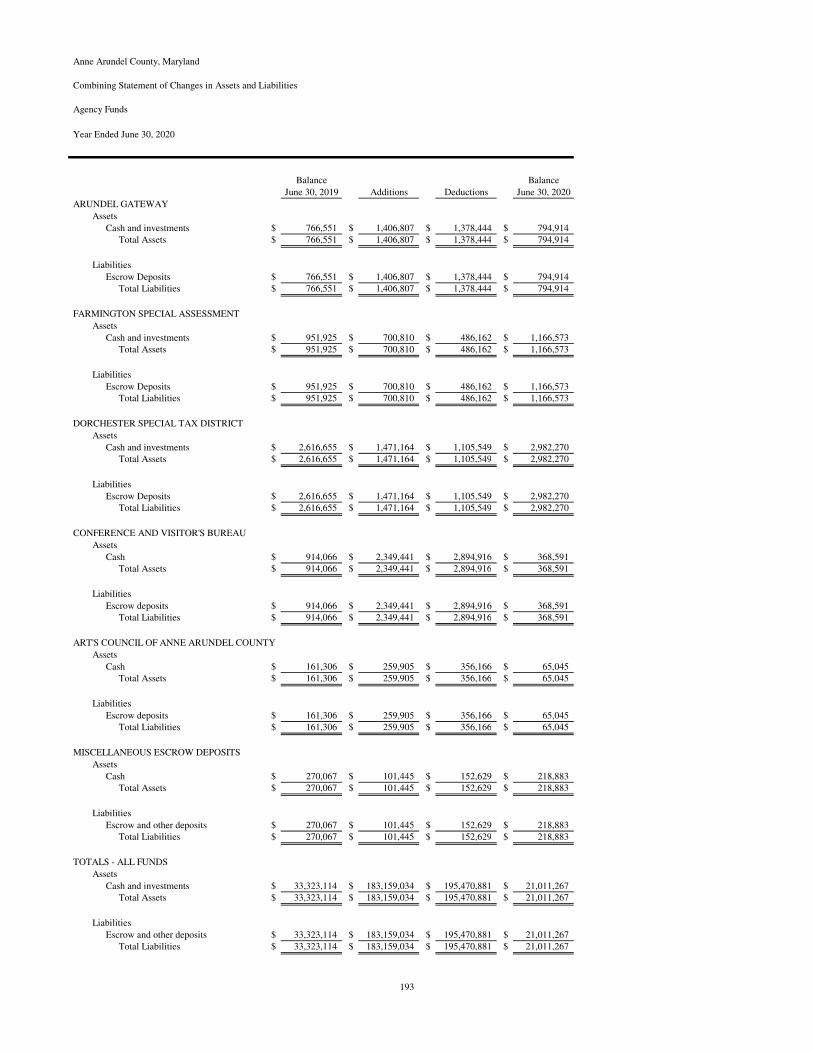
Fiduciary funds include the Pension Trust Funds, the OPEB Trust Fund, and the Agency Funds. The Pension Trust Funds are presented for the calendar year ended December 31, 2019. Total investments in the Pension Trust increased by $223.0 million in calendar year 2019. The Pension Fund net position increased from $1.8 billion to $2.0 billion or 12.6%. Contributions increased from $85.8 million in 2018 to $92.2 million during 2019 and investment activity increased by $354.0 million from prior year. The net position of the OPEB Trust at the end of the current fiscal year was $262.4 million, an increase of $69.1 million from the prior fiscal year. Agency funds decreased from $33.3 million in fiscal year 2019 to $21.0 million in fiscal year 2020 as a result of not having a property tax sale in fiscal year 2020. The annual property tax sale was postponed because of the Covid-19 pandemic.
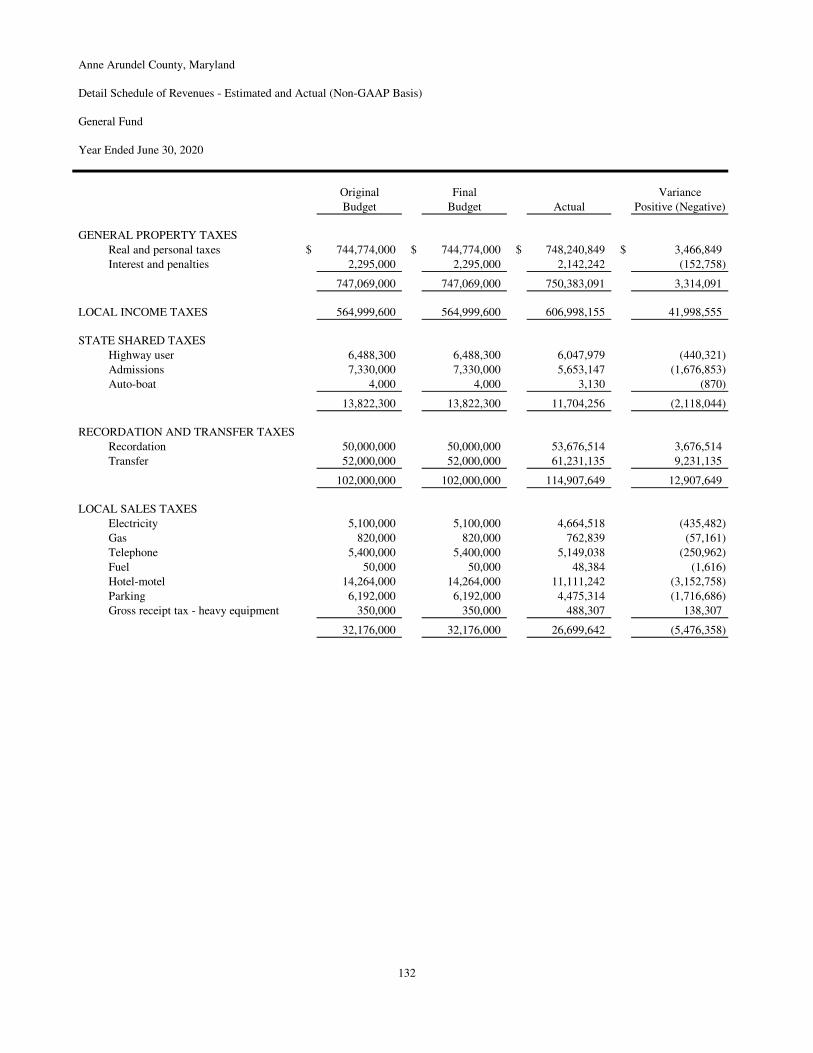
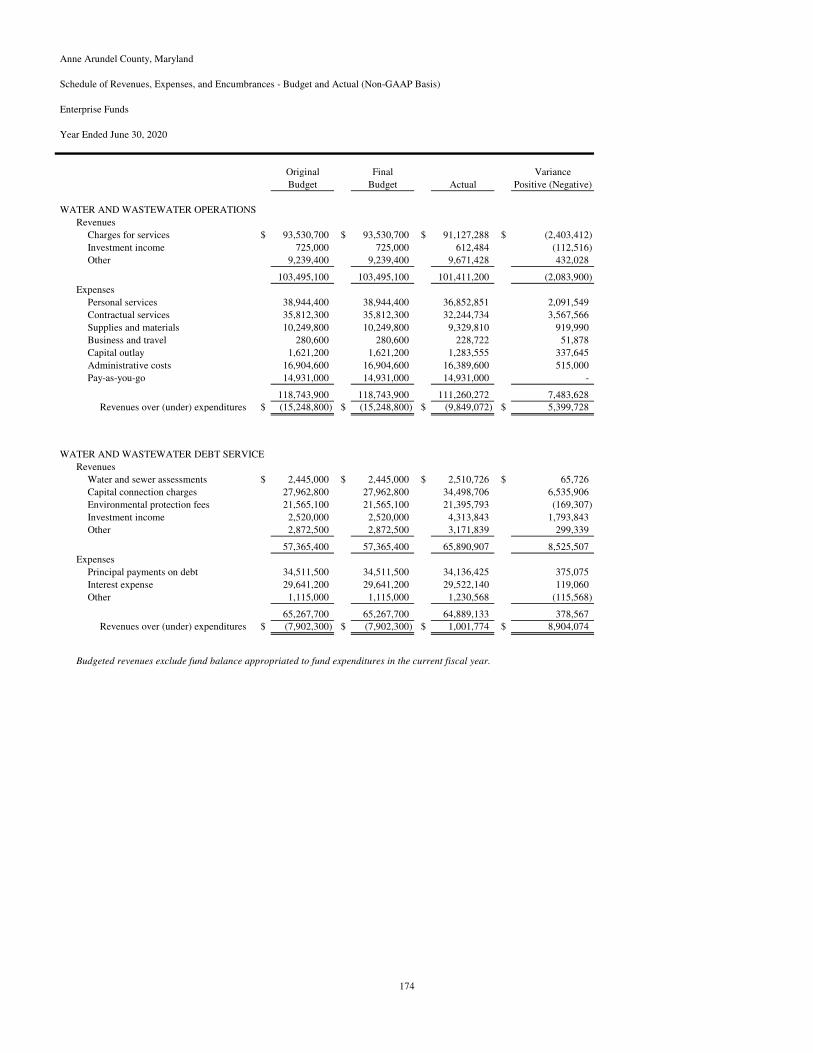
Budgetary Variations: The budgetary statements of the General Fund show actual revenues of $1.7 billion compared to budgeted amounts of $1.6 billion, resulting in $40.1 million more revenue than anticipated. The most significant budgetary variations within components of revenue were the increases in general property taxes, local income tax, and recordation and transfer taxes which exceeded budgetary expectation by $3.1 million or 0.4%, $42.0 million or 7.4%, and $12.9 million or 12.7%, respectively. The remaining negative variances were mainly due to decreases in state shared taxes, local sales taxes, licensed and permits, Video Lottery Impact Aid, inter-fund recoveries, and fees for service and other revenues of $2.1 million, $5.5 million, $2.3 million, $2.5 million and $6.6 million, respectively. The decrease in revenues were mainly the result of the effects of Covid-19 related to County closures, the temporary reduction of fees charged by the County and the delay of the Video Lottery Impact Aid revenue which was received after September 30, 2020.
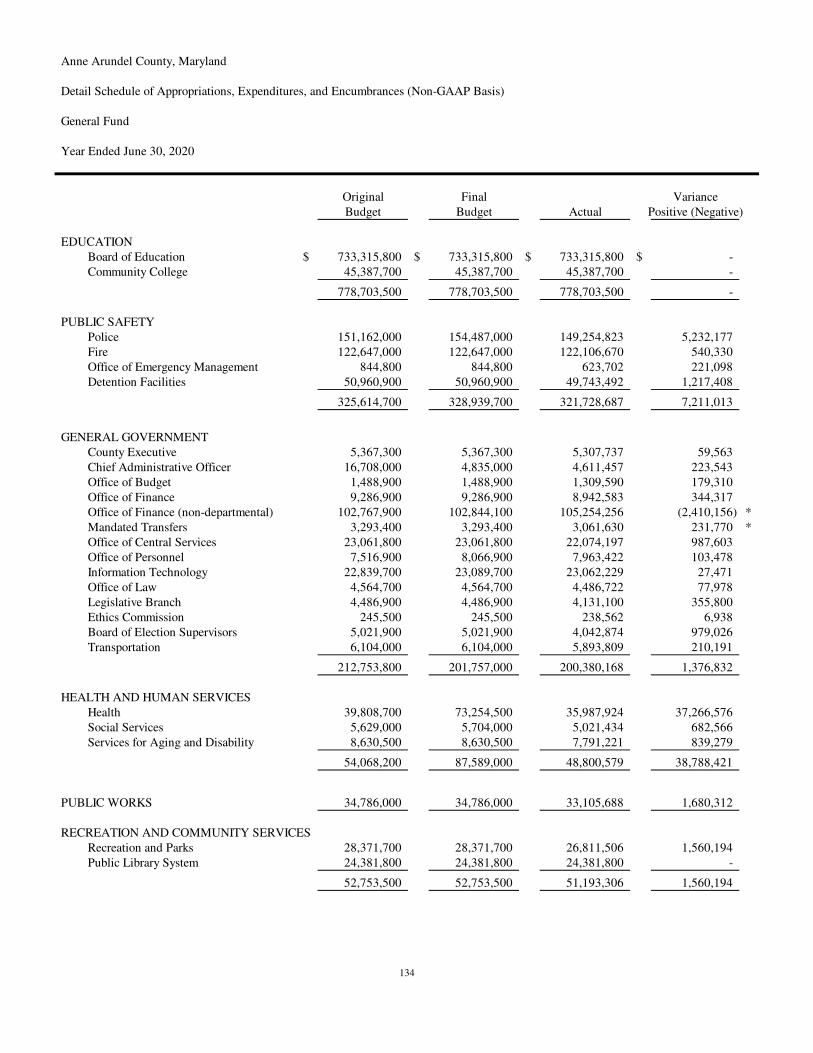
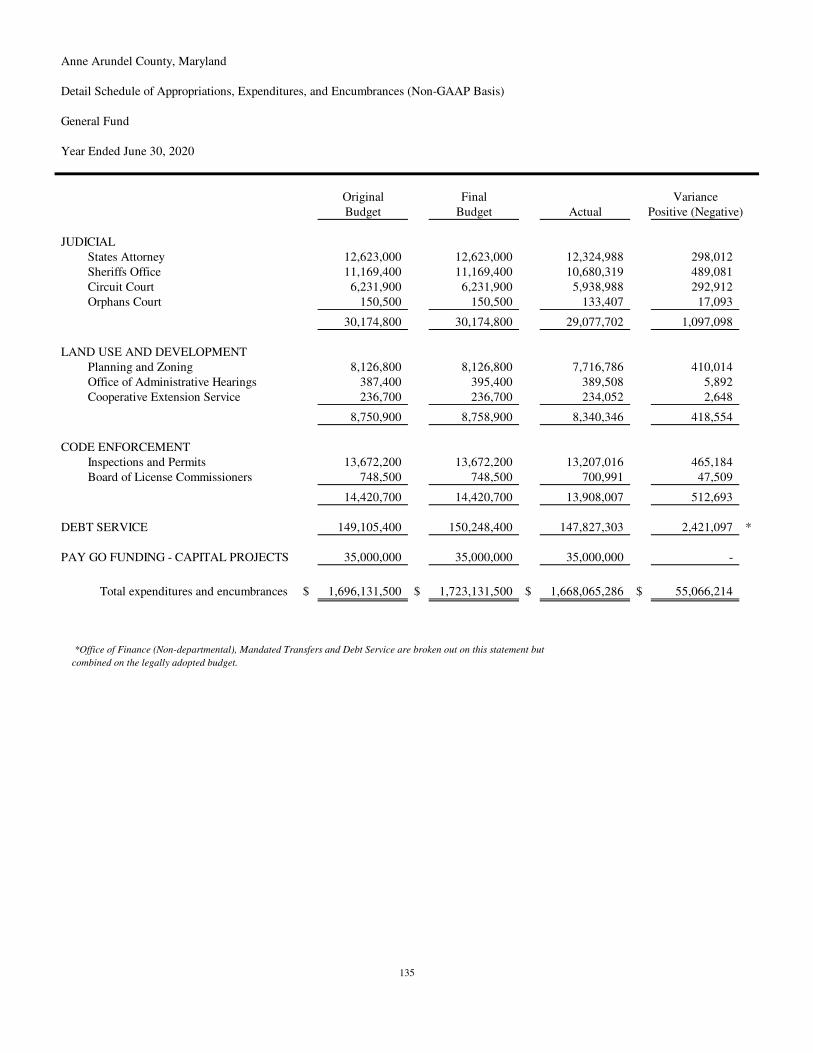
Total expenditures on a budgetary basis were $1.7 billion compared to appropriation authority of $1.7 billion, resulting in $55.1 million or 3.2%, less than planned. The most notable variances are in the public safety and health and human services of $7.2 million and $38.8 million, respectively. This was in part due to under spending in the Police Department of $5.2 million and in the Health Department of $37.3 million. The Police Department under spent mainly in personnel services partly as a result of position vacancies and the Health Department did not spend all of their Covid-19 grant funds which will be spent in the following fiscal year. Also, certain expenses were applied to grants for Covid-19 related activities.
In reviewing the changes from the original budget to the final budget, total budgeted revenues did not change but budgeted expenses increased by $27.0 million mainly as a result of increase spending requests for Covid-19 grant funds received during the second half of the current fiscal year. The expense increase was primarily in health and human service in the amount of $33.5 million for Covid-19 expenditures. There was a decrease in general government original expense budget, compared the final budget in the amount of $11.0 million. Management is not aware of any reasons why these and other budgetary variations would have a significant effect on future liquidity or services.
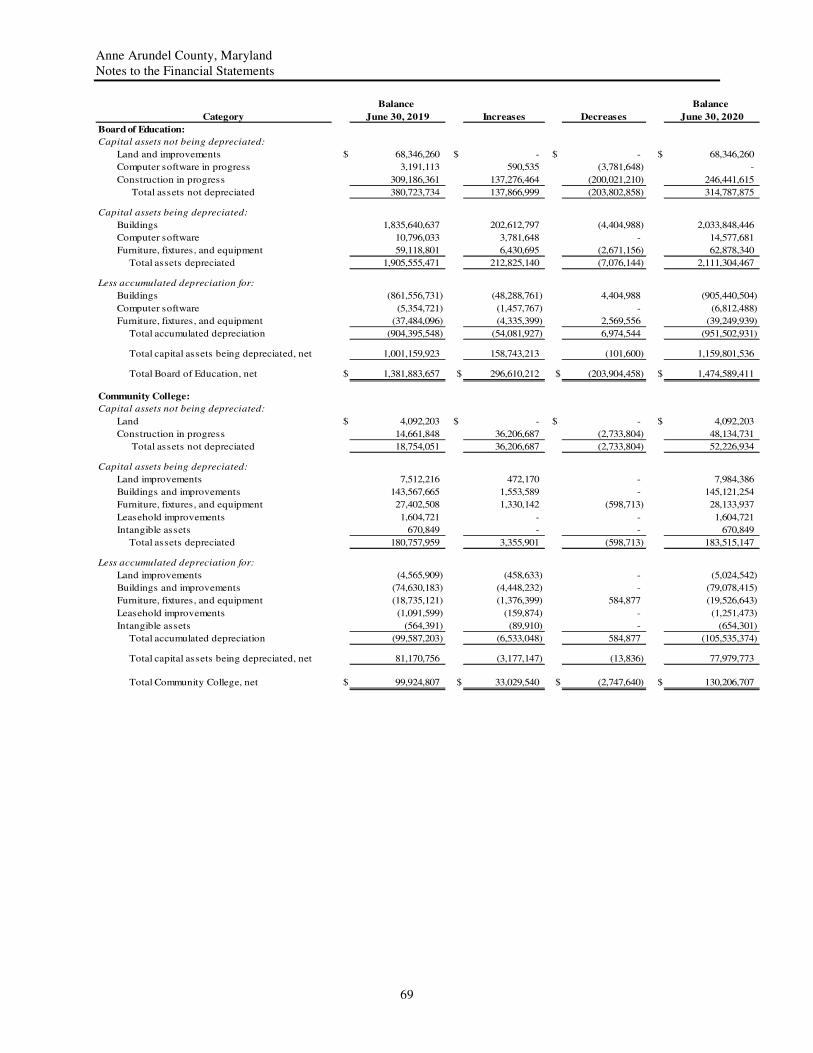
Capital Assets
The next table presents the asset values of the capital asset categories in governmental and business-type activities, net of accumulated depreciation. A discussion of the fluctuations follows.
Anne Arundel County, Maryland Management Discussion and Analysis Year Ended June 30, 2020
25
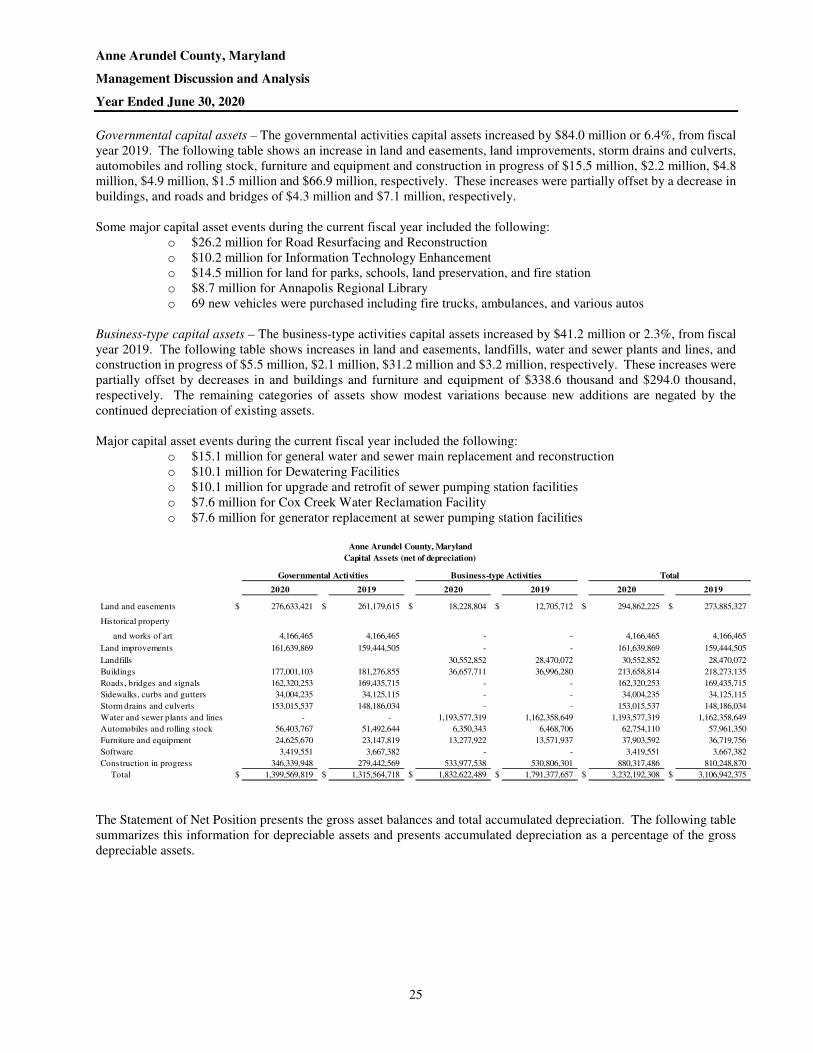
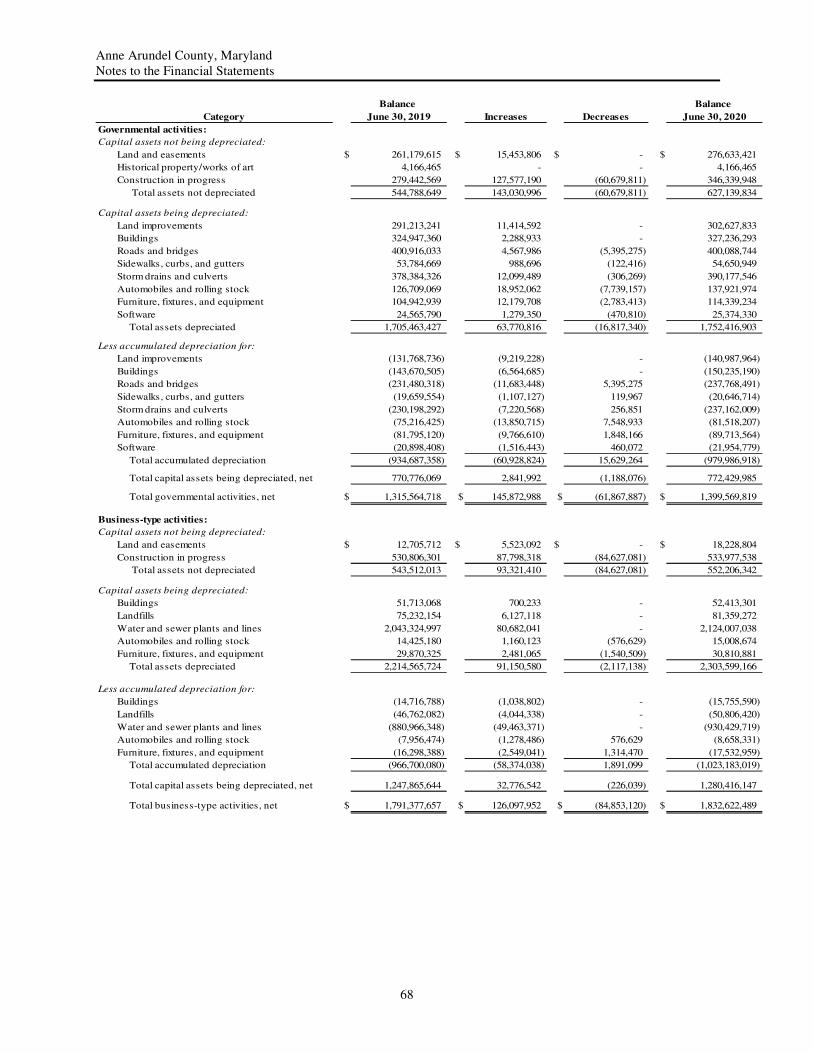
Governmental capital assets – The governmental activities capital assets increased by $84.0 million or 6.4%, from fiscal year 2019. The following table shows an increase in land and easements, land improvements, storm drains and culverts, automobiles and rolling stock, furniture and equipment and construction in progress of $15.5 million, $2.2 million, $4.8 million, $4.9 million, $1.5 million and $66.9 million, respectively. These increases were partially offset by a decrease in buildings, and roads and bridges of $4.3 million and $7.1 million, respectively. Some major capital asset events during the current fiscal year included the following:
o $26.2 million for Road Resurfacing and Reconstruction o $10.2 million for Information Technology Enhancement o $14.5 million for land for parks, schools, land preservation, and fire station o $8.7 million for Annapolis Regional Library o 69 new vehicles were purchased including fire trucks, ambulances, and various autos
Business-type capital assets – The business-type activities capital assets increased by $41.2 million or 2.3%, from fiscal year 2019. The following table shows increases in land and easements, landfills, water and sewer plants and lines, and construction in progress of $5.5 million, $2.1 million, $31.2 million and $3.2 million, respectively. These increases were partially offset by decreases in and buildings and furniture and equipment of $338.6 thousand and $294.0 thousand, respectively. The remaining categories of assets show modest variations because new additions are negated by the continued depreciation of existing assets. Major capital asset events during the current fiscal year included the following:
o $15.1 million for general water and sewer main replacement and reconstruction o $10.1 million for Dewatering Facilities o $10.1 million for upgrade and retrofit of sewer pumping station facilities o $7.6 million for Cox Creek Water Reclamation Facility o $7.6 million for generator replacement at sewer pumping station facilities
Anne Arundel County, Maryland
Capital Assets (net of depreciation)
Governmental Activities Business-type Activities Total
2020 2019 2020 2019 2020 2019
Land and easements $ 276,633,421 $ 261,179,615 $ 18,228,804 $ 12,705,712 $ 294,862,225 $ 273,885,327
Historical property
and works of art 4,166,465 4,166,465 - - 4,166,465 4,166,465
Land improvements 161,639,869 159,444,505 - - 161,639,869 159,444,505
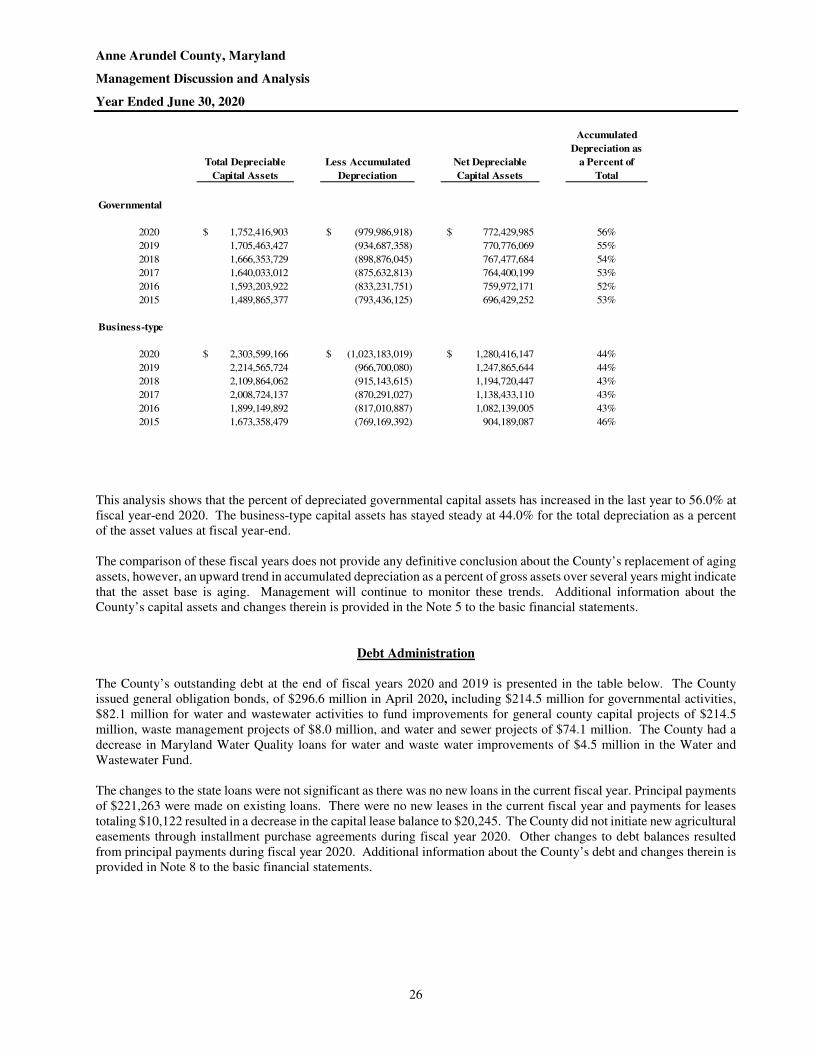
The Statement of Net Position presents the gross asset balances and total accumulated depreciation. The following table summarizes this information for depreciable assets and presents accumulated depreciation as a percentage of the gross depreciable assets.
Anne Arundel County, Maryland Management Discussion and Analysis Year Ended June 30, 2020
This analysis shows that the percent of depreciated governmental capital assets has increased in the last year to 56.0% at fiscal year-end 2020. The business-type capital assets has stayed steady at 44.0% for the total depreciation as a percent of the asset values at fiscal year-end.
The comparison of these fiscal years does not provide any definitive conclusion about the County’s replacement of aging assets, however, an upward trend in accumulated depreciation as a percent of gross assets over several years might indicate that the asset base is aging. Management will continue to monitor these trends. Additional information about the County’s capital assets and changes therein is provided in the Note 5 to the basic financial statements.
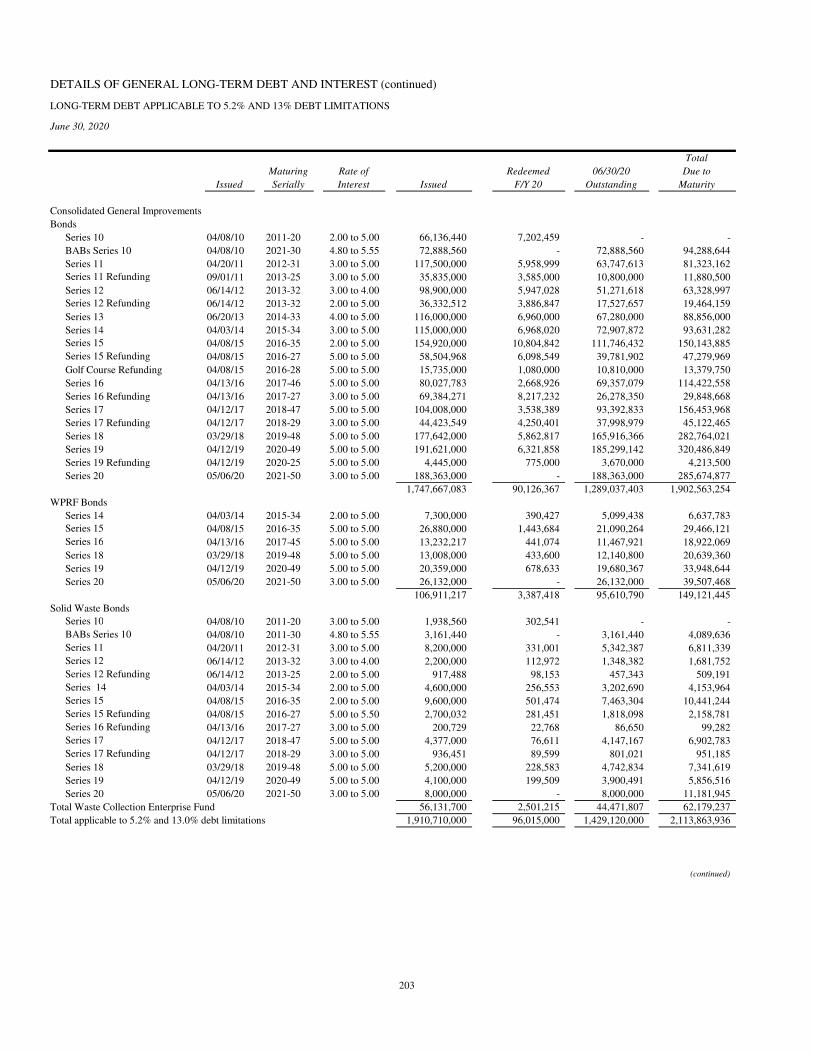
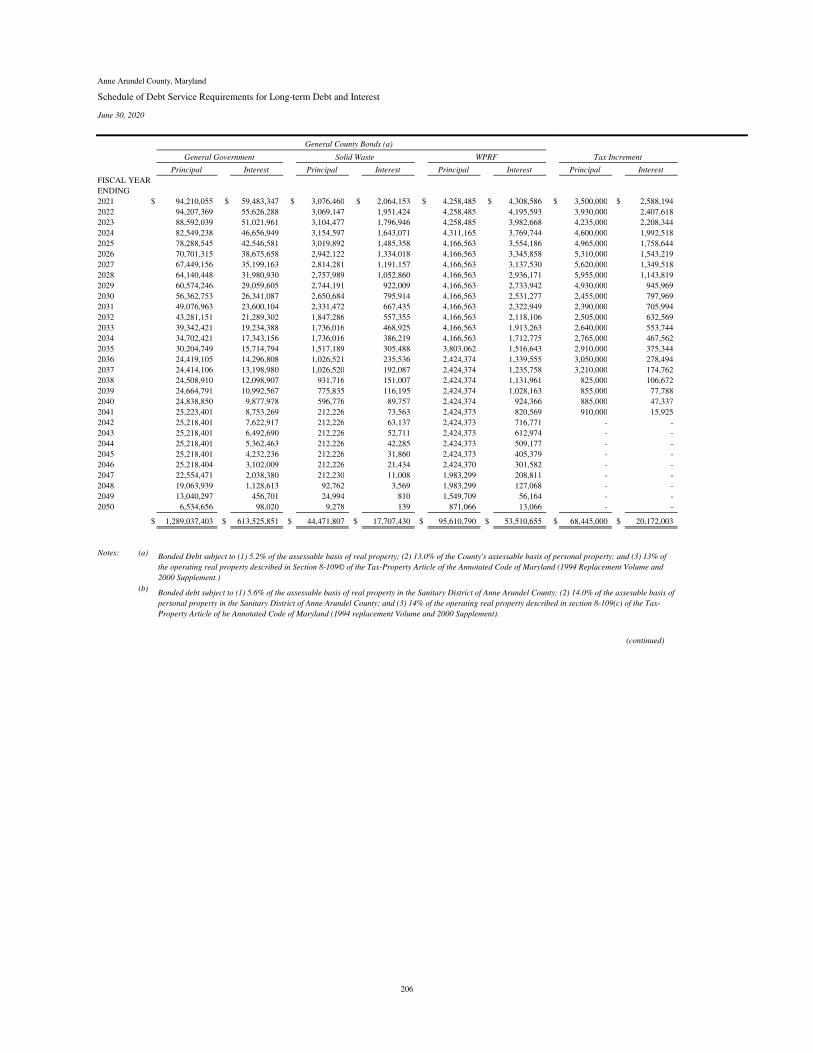
Debt Administration
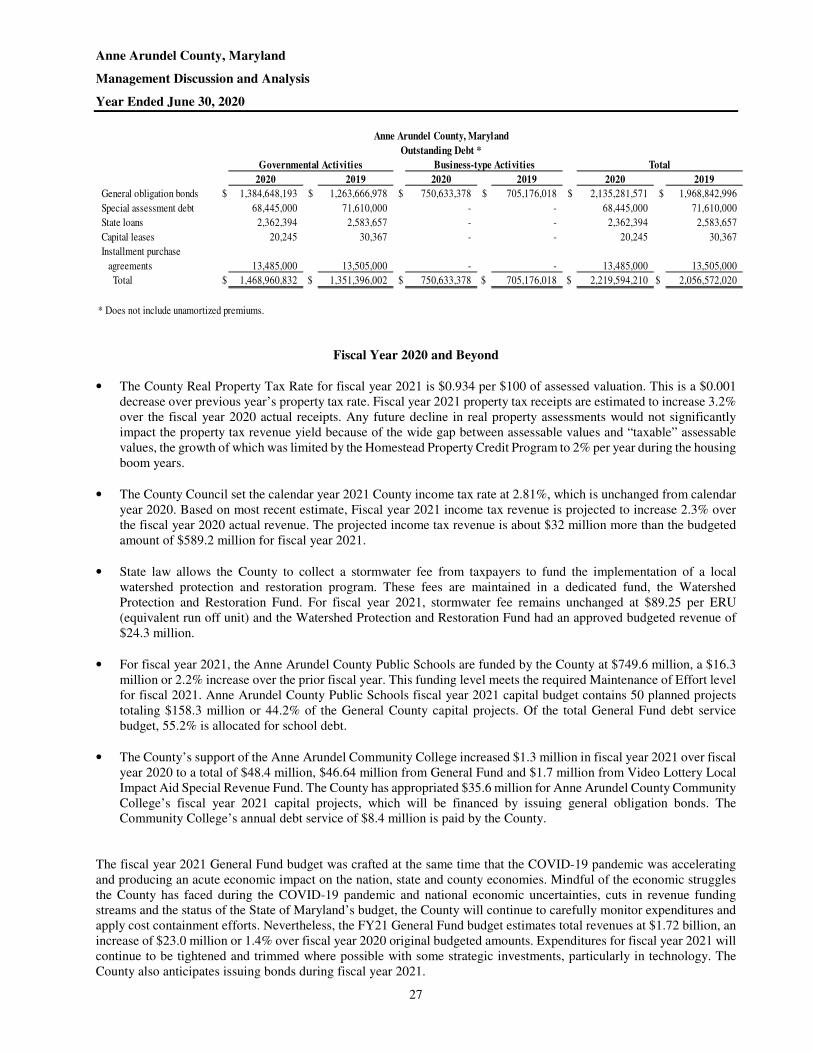
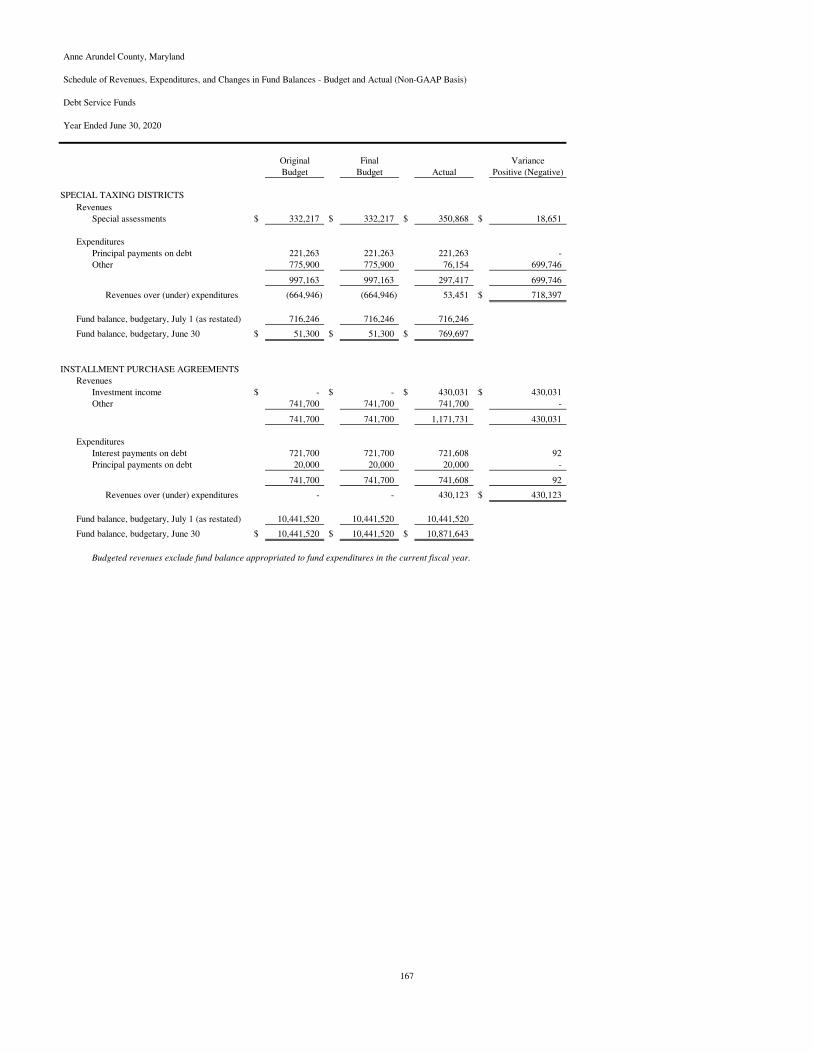
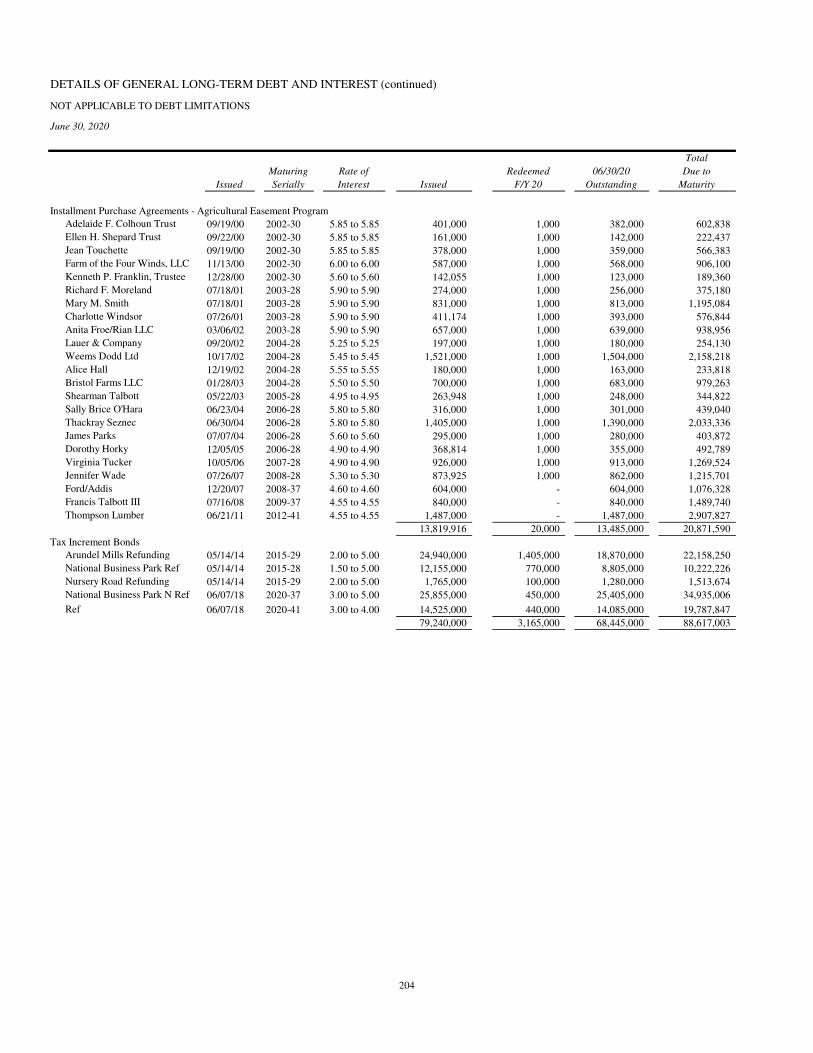
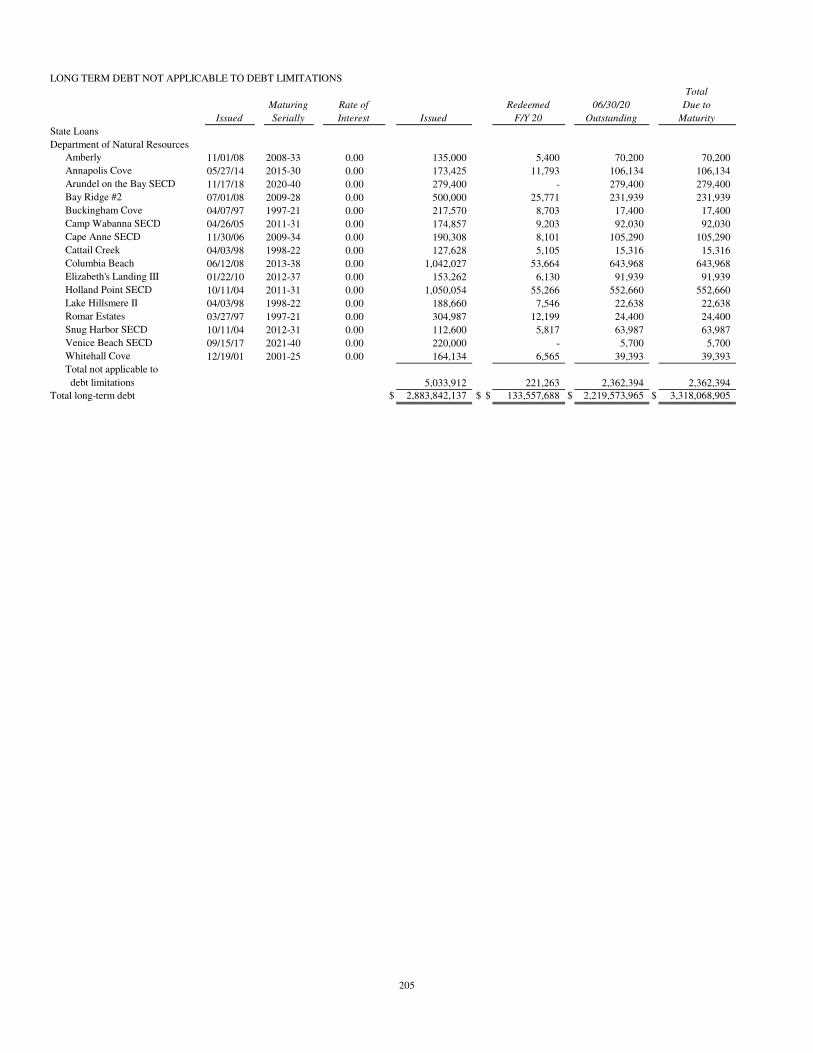
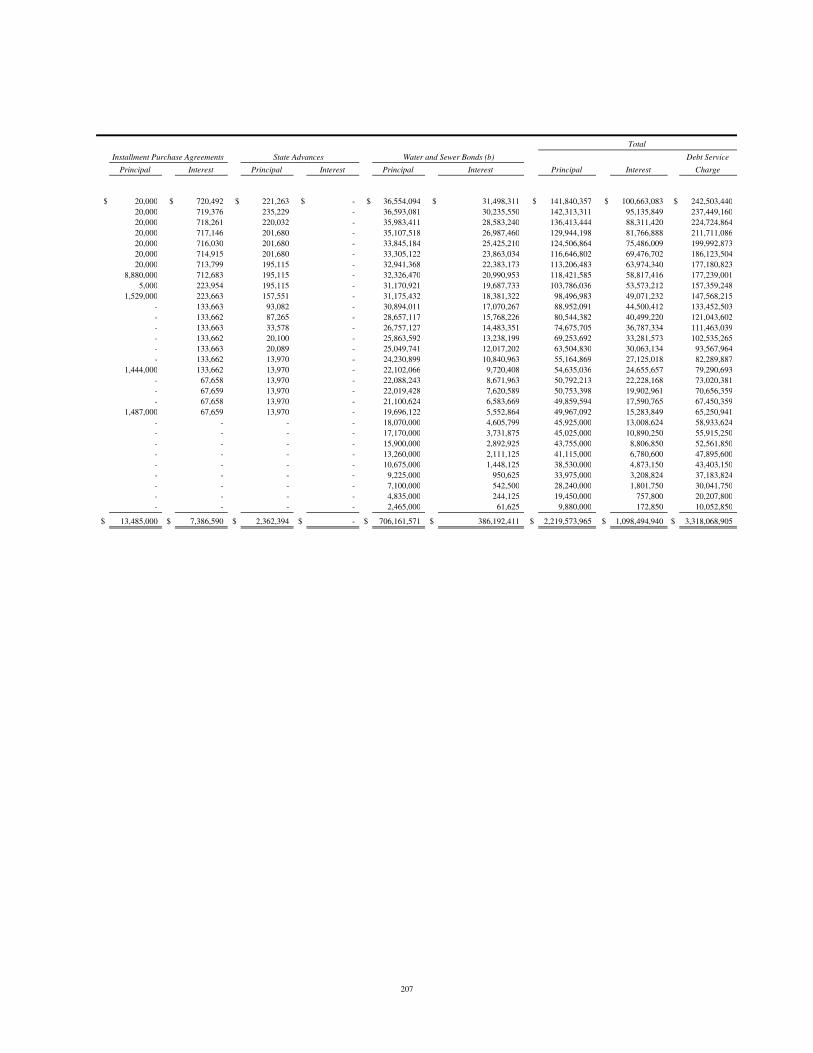
The County’s outstanding debt at the end of fiscal years 2020 and 2019 is presented in the table below. The County issued general obligation bonds, of $296.6 million in April 2020, including $214.5 million for governmental activities, $82.1 million for water and wastewater activities to fund improvements for general county capital projects of $214.5 million, waste management projects of $8.0 million, and water and sewer projects of $74.1 million. The County had a decrease in Maryland Water Quality loans for water and waste water improvements of $4.5 million in the Water and Wastewater Fund. The changes to the state loans were not significant as there was no new loans in the current fiscal year. Principal payments of $221,263 were made on existing loans. There were no new leases in the current fiscal year and payments for leases totaling $10,122 resulted in a decrease in the capital lease balance to $20,245. The County did not initiate new agricultural easements through installment purchase agreements during fiscal year 2020. Other changes to debt balances resulted from principal payments during fiscal year 2020. Additional information about the County’s debt and changes therein is provided in Note 8 to the basic financial statements.
Anne Arundel County, Maryland Management Discussion and Analysis Year Ended June 30, 2020
27
Anne Arundel County, Maryland
Outstanding Debt *
Governmental Activities Business-type Activities Total
• The County Real Property Tax Rate for fiscal year 2021 is $0.934 per $100 of assessed valuation. This is a $0.001 decrease over previous year’s property tax rate. Fiscal year 2021 property tax receipts are estimated to increase 3.2% over the fiscal year 2020 actual receipts. Any future decline in real property assessments would not significantly impact the property tax revenue yield because of the wide gap between assessable values and “taxable” assessable values, the growth of which was limited by the Homestead Property Credit Program to 2% per year during the housing boom years.
• The County Council set the calendar year 2021 County income tax rate at 2.81%, which is unchanged from calendar year 2020. Based on most recent estimate, Fiscal year 2021 income tax revenue is projected to increase 2.3% over the fiscal year 2020 actual revenue. The projected income tax revenue is about $32 million more than the budgeted amount of $589.2 million for fiscal year 2021.
• State law allows the County to collect a stormwater fee from taxpayers to fund the implementation of a local watershed protection and restoration program. These fees are maintained in a dedicated fund, the Watershed Protection and Restoration Fund. For fiscal year 2021, stormwater fee remains unchanged at $89.25 per ERU (equivalent run off unit) and the Watershed Protection and Restoration Fund had an approved budgeted revenue of $24.3 million.
• For fiscal year 2021, the Anne Arundel County Public Schools are funded by the County at $749.6 million, a $16.3 million or 2.2% increase over the prior fiscal year. This funding level meets the required Maintenance of Effort level for fiscal 2021. Anne Arundel County Public Schools fiscal year 2021 capital budget contains 50 planned projects totaling $158.3 million or 44.2% of the General County capital projects. Of the total General Fund debt service budget, 55.2% is allocated for school debt.
• The County’s support of the Anne Arundel Community College increased $1.3 million in fiscal year 2021 over fiscal year 2020 to a total of $48.4 million, $46.64 million from General Fund and $1.7 million from Video Lottery Local Impact Aid Special Revenue Fund. The County has appropriated $35.6 million for Anne Arundel County Community College’s fiscal year 2021 capital projects, which will be financed by issuing general obligation bonds. The Community College’s annual debt service of $8.4 million is paid by the County.
The fiscal year 2021 General Fund budget was crafted at the same time that the COVID-19 pandemic was accelerating and producing an acute economic impact on the nation, state and county economies. Mindful of the economic struggles the County has faced during the COVID-19 pandemic and national economic uncertainties, cuts in revenue funding streams and the status of the State of Maryland’s budget, the County will continue to carefully monitor expenditures and apply cost containment efforts. Nevertheless, the FY21 General Fund budget estimates total revenues at $1.72 billion, an increase of $23.0 million or 1.4% over fiscal year 2020 original budgeted amounts. Expenditures for fiscal year 2021 will continue to be tightened and trimmed where possible with some strategic investments, particularly in technology. The County also anticipates issuing bonds during fiscal year 2021.
Anne Arundel County, Maryland Management Discussion and Analysis Year Ended June 30, 2020
28
As mentioned above, FY2021 income tax rate stayed at 2.81%. This rate is the fourth lowest in the State. The FY2021 property tax rate is $0.934 per $100 of assessed valuation – the fifth lowest in the State. The Homestead Tax Credit rate for County real property tax is at 2.0% which remains unchanged from the past fiscal year. Legislation was passed to restore the admissions and amusement tax for the gross receipts derived from any admissions and amusement charge for admission to any moving picture theater effective January 1 2019. Bill 42-19 has been passed to establish the Reserve Fund for Permanent Public Improvements (PPI Fund). These funds are currently restricted in the general fund. The revenue for the Fund is based off of 1/10th of a percentage point by which the income tax rate exceeds 2.50% and capped at $21 million a year to pay for the debt service of a one-time capital infusion totals $250 million. FY2021 General Fund Budget met the required contribution toward the PPI Fund. The Water and Wastewater Fund usage rates for water and wastewater fees for fiscal year 2021 are $2.83/1,000gal and $4.97/1,000gal, respectively. This is same with the prior fiscal year. No changes were made to the annual refuse and recycling fees. A 10% rate increase was placed on Capital Facility Connection Charges and Environment Protection Fee (EPF) consistent with the five year plan.
Requests for Information
This financial report is designed to provide a general overview of the County’s finances for all those interested. Questions concerning any information provided in this report or requests for additional finance information should be addressed to the Office of Finance, 44 Calvert Street, Annapolis, Maryland 21401. Complete financial reports are also available on our website www.aacounty.org. The County’s component units, except for the Library, issue their own separately audited financial statements. These statements may be obtained by directly contacting the component unit. Contact information can be found on Note 1A of this report.
Basic
Financial
Statements
29
(This page left blank intentionally)
Anne Arundel County, Maryland
Statement of Net Position
June 30, 2020
Primary Government
Governmental Business-type Board of Community Other
Activities Activities Total Education College Non-major
Total fund balances 228,002,807 (8,364,933) 94,800,741 99,586,603 92,789,928 506,815,146
Total liabilities, deferred inflows
and fund balances $ 439,531,295 $ 72,963,666 $ 95,374,781 $ 177,208,585 $ 106,742,455 $ 891,820,782
Accompanying notes to financial statements are an integral part of this statement.
Major Funds
34
Anne Arundel County, Maryland
Reconciliation of Governmental Fund Balance to Governmental Net Position
Governmental Funds
June 30, 2020
Total fund balance for governmental funds as shown on the Balance Sheet $ 506,815,146
Capital assets used in governmental activities are not financial resources and, therefore, are not reported on governmental funds balance sheet
Capital assets 2,292,816,100 Accumulated depreciation (923,969,055)
Deferred Outflows of ResourcesUnamortized loss on refunding 4,494,098
Certain liabilities not due and payable in the current period and, therefore, not included on governmental funds balance sheet
Long-term bonded debt (1,649,632,856) Federal and state loans (2,362,394) Wynne liability due to State of Maryland (17,694,496) Pension benefits (499,479,070) Other post-employment benefits (400,296,562) LOSAP (18,017,653) Compensated absences (30,832,281) Long-term leases (20,245)
Accrued interest payable on debt recorded in governmental activities (14,371,544)
Deferred revenuesRevenues not available for use in the current fiscal year deferred
until future periods on the governmental funds balance sheet 159,578,296
The assets and liabilities recorded in the internal service funds have been added to governmental net position because these funds are used to provide services to other funds
Net position of the Internal Service Funds 70,784,062 Business-type activities allocation of Internal Service Funds net position (1,150,435)
Certain expenditures paid with current resources deferred to future periods on the Statement of Net Position 3,654,624
Total net position (deficit) for governmental activities as shown on Statement of Net Position $ (519,684,265)
Accompanying notes to financial statements are an integral part of this statement.
35
Anne Arundel County, Maryland
Statement of Revenues, Expenditures and Changes in Fund Balances
Governmental Funds
Year Ended June 30, 2020
Non-major
Grants Impact Fees General County Governmental
General Special Revenue Capital Projects Capital Projects Funds Totals
Loss on sale of capital assets write off (573,331) - - (573,331) -
Prepaid expenses (9,389) - - (9,389) 4,884
Inventories 111,149 12,798 - 123,947 6,487
Accounts payable and accrued liabilities 102,828 781,267 145,623 1,029,718 (2,576,857)
Unearned revenue - - (247,632) (247,632) -
Unpaid claims - - - - (10,506,862)
Landfill closure and postclosure costs - (2,063,225) - (2,063,225) -
Due to other funds (315,568) (116,369) (3,890) (435,827) 14,216,643
Due from other funds (101,797) (101,797) -
Escrow deposits 5,189 500 - 5,689 -
Accrued liability for compensated absences 279,046 58,780 19,031 356,857 108,504
Accrued liability for pension 295,173 59,344 5,918 360,435 53,286
Deferred outflow of resources 2,086,590 (686,016) (44,174) 1,356,400 (527,597)
Deferred inflow of resources (4,008,157) 180,481 13,316 (3,814,360) 139,908
Accrued liability for OPEB benefits 401,279 96,304 6,917 504,500 71,768
Net cash provided (used) by operating activities $ 3,251,077 $ 5,778,843 $ (624,422) $ 8,405,498 $ 10,281,014
NONCASH INVESTING, CAPITAL AND FINANCING ACTIVITIES
Contributions of capital assets from developers $ 12,156,332 $ - $ - $ 12,156,332 $ -
Trade in of capital assets - 30,515 - 30,515 -
Change in capital contributions, fees and grants,
accruals and deferrals 5,721,414 - - 5,721,414 -
Increase (decrease) in fair value of investments (571,426) - - (571,426) (162,128)
Amortization of refunding gains (losses) (618,079) 27,709 - (590,370) -
Noncash investing, capital and financing activities $ 16,688,241 $ 58,224 $ - $ 16,746,465 $ (162,128)
Accompanying notes to financial statements are an integral part of this statement.
43
Anne Arundel County, Maryland
Statement of Fiduciary Net Position
Fiduciary Funds
June 30, 2020
Pension
(December 31, 2019)
and Other Post
Employment Plan Agency
Trust Fund Funds
ASSETS
Investments, at fair value:
Cash and temporary investments $ 93,827,963 $ 21,011,267
Short-term investments 15,281,969 -
U. S. government obligations 18,655,100 -
Corporate obligations 159,756,640 -
Domestic fixed income mutual funds 236,346,780 -
International fixed income mutual funds 106,398,148 -
Global asset pools 177,437,631 -
Domestic equity 496,477,515 -
International equity pools 561,152,625 -
Private markets 153,278,341 -
Real estate investment pools 138,815,261 -
Absolute return fixed income 82,264,552 -
Aetna insurance pooled fixed income 21,384,915 -
Total investments 2,261,077,440 21,011,267
Collateral from securities lending transactions 61,701,926 -
Receivables:
Accounts receivable 12,987,768 -
Employer contributions 6,803,534 -
Participant contributions 1,098,001 -
Accrued interest and dividends 2,129,611 -
Investment sales proceeds 16,074,103 -
Total receivables 39,093,017 -
Deposits on hand 156,464 -
Total assets 2,362,028,847 $ 21,011,267
LIABILITIES
Accounts payable and accrued liability 5,137,136 -
Escrow and other deposits - $ 21,011,267
Due to Anne Arundel County Government 199 -
Investment commitments payable
and unearned revenue 27,290,746 -
Obligation for collateral received under
securities lending transactions 61,701,926 -
Total liabilities 94,130,007 $ 21,011,267
NET POSITION
Restricted for:
Pension 2,005,470,854
OPEB 262,427,986
Total net position $ 2,267,898,840
Accompanying notes to the financial statements are an integral part of this statement.
44
Anne Arundel County, Maryland
Statement of Changes in Fiduciary Net Position
Fiduciary Funds
Year Ended June 30, 2020
Pension
(December 31, 2019)
and Other Post
Employment Plan
Trust Fund
ADDITIONS
Contributions:
Employer $ 173,387,833
Participant 23,555,560
Insurance subsidies and rebates 10,136,864
Total contributions 207,080,257
Investment income:
Net appreciation in fair
value of investments 223,011,346
Interest income 26,808,951
Dividend income 30,763,521
Total investment income 280,583,818
Less investment expense 11,968,267
Net income from investing activities 268,615,551
Securities lending activities:
Securities lending income 1,542,983
Securities lending expenses:
Borrower rebates 1,178,129
Management feesManagement fees 145,941
Securities lending expense 1,324,070
Securities lending net income 218,913
Total net investment income 268,834,464
Total additions 475,914,721
DEDUCTIONS
Participant benefit payments and refunds 130,551,105
Insurance claims and premiums 48,828,449
Administrative expenses 2,918,578
Total deductions 182,298,132
Net increase 293,616,589
Fiduciary net position, beginning of year 1,974,282,251
Fiduciary net position, end of year $ 2,267,898,840
Accompanying notes to the financial statements are an integral
part of this statement.
45
Note 1 Summary of Significant Accounting Policies 48
A. Reporting Entity
B. Financial Statement Presentation, Measurement Focus, and Basis of Accounting
C. Cash, Investments, and Related Income
D. Inventories and Prepaid Expenses
E. Program Revenues
F. Capital Assets
G. Deferred Outflows/Inflows of Resources
H. Operating and Nonoperating Revenues and Expenses and Capital Contributions
I. Bond Premiums and Refunding Gain or Loss
J. Indirect Costs
K. Encumbrances
L. Fund Balance Classification
M. Compensated Absences
N. New GASB Pronouncements
O. Use of Estimates
Note 2 Budgetary Information 56
A. Excess Expenditures over Appropriation Limits
B. Fund Deficits
C. Reconciliation Between Fund Financial Statements and Budgetary Statements
Note 3 Cash and Investments 57
A. Policies
B. Balances and Custodial Credit Risk
C. Interest Rate Risk
D. Credit Risk
E. Concentration Risk
F. Foreign Currency Risk
G. Fair Value Measurement
Note 4 Receivables 67
A. Property Taxes Receivable
B. State Income Taxes Receivable
C. Long-Term Receivables
Note 5 Capital Assets 67
Note 6 Restricted Assets and Liabilities 70
Note 7 Interfund and Intra-Entity Balances and Transfers 71
Note 8 Bonded Debt and Other Obligations 72
A. Bond Anticipation Notes
B. General County Debt
C. Tax Increment and Other Debt
D. State Loans
E. Leases
F. Installment Purchase Agreements
G. Year-end Balances, Debt Limitations, and Authorized Debt
H. Loans Payable
I. Payables to State of Maryland
J. Changes in Debt and Obligations
K. Refundings
Anne Arundel County, Maryland
Notes to Basic Financial Statements
Index
46
Note 9 Governmental Fund Balance 77
Note 10 Deferred Outflows and Inflows of Resources and Unearned Revenue 79
Note 11 Conduit Debt 80
Note 12 Pension Plans 80
A. Summary of Significant Accounting Policies for Pensions
B. Single-Employer Defined Benefit Pension Plans
C. Multiple-Employer Pension Plans
D. Funding Policy and Annual Pension Costs
E. Net Pension Liability of the System by Plan
F. Changes in the Net Pension Liability by Plan for the Measurement Period December 31, 2019
G. Pension Expense and Deferred Outflows of Resources and Deferred Inflows of
Resources Related to the County Pension Plans
H. Payable to the County Pension System
I. Commitments
J. Teacher Pension Funding Shift
K. Fireman's Length of Service Award Program (LOSAP)
Note 13 Other Post-employment Benefits 96
A. Plan Description, Eligibility, Authorization, and Funding Policy
B. Membership by Plan
C. Funding Policy
D. Actuarial Methods and Assumptions
E. Net OPEB Liability of the Trust
F. Long Term Expected Real Rate of Return
G. Discount Rate
H. Sensitivity of the Net OPEB Liability to Changes in the Discount Rate
I. Sensitivity of the Net OPEB Liability to Changes in the Healthcare Cost Trend Rate
Note 14 Risk Management 104
Note 15 Landfill Closure, Post-Closure, and Remediation 105
Note 16 Tax Abatements 106
A. Payment in Lieu of Taxes (PILOT)
B. Brownsfields Site Tax Credit
C. Agricultural Land Tax Credit
D. Enterprise Zone Tax Credit
E. The State of Maryland
Note 17 Contingent Liabilities 106
A. Impact Fees
B. Lawsuits
C. Federal Financial Assistance
D. Payroll
Index (continued)
Anne Arundel County, Maryland
Notes to Basic Financial Statements
47
Anne Arundel County, Maryland
Notes to the Financial Statements
June 30, 2020
48
1 Summary of Significant Accounting Policies The basic financial statements are prepared in accordance with accounting principles generally accepted in the United States of America applicable to governmental units as prescribed by the Governmental Accounting Standards Board (GASB). This note summarizes the significant accounting policies. A Reporting Entity – The County’s basic financial statements include various departments, agencies, and other organizational units governed directly by the County Executive and the County Council, herein referred to as the primary government. These statements also include other entities, which by the entities’ relationships with the primary government are considered component units of the County. Accounting principles dictate that those entities that are financially accountable to the primary government or where exclusion would cause the financial statements to be misleading or incomplete should be included in the County’s basic financial statements. The County’s component units and the reasons for the entities’ inclusion are as follows:
• Anne Arundel County Board of Education (Board of Education) - The Board of Education and the Anne Arundel County Public School System provide public education for the County’s students in grades kindergarten through twelve.
• Anne Arundel Community College (Community College) – The Community College and its Foundation operate an institution of higher education within the County.
• Public Library Association of Annapolis and Anne Arundel County, Inc. (A.A. County Public Library or Library) – The Library operates the public library system within the County.
• Anne Arundel Economic Development Corporation (Economic Development) – Economic Development provides services and programs that promote economic development within the County.
• Tipton Airport Authority (Tipton Airport) – Tipton Airport operates a general aviation airport in the western area of the County.
• Anne Arundel Workforce Development Corporation (Workforce Development) – Workforce Development provides job training and placement services to County citizens.
All of these entities are component units because the primary government approves the entities’ respective
budgets and/or provides a substantial amount of funding. In addition, the County Executive appoints a majority of the members of the governing bodies for Economic Development, Tipton Airport, and Workforce Development.
All of these entities are discretely presented in the government-wide statements. The Board of Education and
the Community College are considered major component units and have been presented in separate columns on the face of the government-wide statements.
Separately issued financial statements for the Board of Education, the Community College, Economic
Development, Tipton Airport, and Workforce Development may be obtained from the respective administrative offices. The addresses are provided below. The Library does not issue separate financial statements, and all of its required financial statements have been included in the County’s comprehensive annual financial report (CAFR). Anne Arundel County Board of Education Anne Arundel Community College 2644 Riva Road 101 College Parkway Annapolis, MD 21401 Arnold, MD 21012 Anne Arundel Economic Development Corp. Tipton Airport Authority 2660 Riva Road, Suite 200 P. O. Box 155 Annapolis, MD 21401 Odenton, MD 21113-0155 Anne Arundel Workforce Development Corp. 1131 Benfield Boulevard, Suite N Millersville, MD 21108
Anne Arundel County, Maryland Notes to the Financial Statements
49
B Financial Statement Presentation, Measurement Focus, and Basis of Accounting – The basic financial statements are divided into three categories: government–wide financial statements, fund financial statements, and budgetary statements.
Government-Wide Financial Statements
The government-wide financial statements, consisting of the Statement of Net Position and the Statement of Activities, are reported using the economic resources measurement focus and the accrual basis of accounting. Revenues are recorded when earned, and expenses are recorded when a liability is incurred, regardless of the timing of related cash flows. Property taxes are recognized in the year levied, and grants and similar revenues are recognized when all eligibility requirements imposed by the provider have been met.
The government-wide statements present governmental activities, which are supported primarily by taxes
and intergovernmental revenues, separately from business-type activities, which are funded primarily by user fees. In addition, the primary government’s activity is presented separately from its discretely presented component units. The government-wide statements do not include the net position or activities of the fiduciary funds, which include the pension trust funds, other post-employment trust funds and the agency funds, because these funds account for assets that are not owned by the County.
Interfund activity within the primary government’s governmental activities and business-type activities has
been eliminated from the government-wide statements. Residual balances between the governmental and business-type categories are presented on the Statement of Net Position as “Internal balances.” In addition, transactions between these activities and the internal service funds, which primarily serve the primary government, have been eliminated. Certain residual assets, liabilities, and net positions of the internal service funds have been added to governmental activities. In addition, transactions between the internal service funds and component units or other non-County agencies have been included in governmental activities. Fund Financial Statements The fund financial statements include statements for the governmental funds, the proprietary funds, and the fiduciary funds. Major funds within each category have been presented in separate columns, while all non-major funds are combined in one column.
Governmental fund financial statements - The governmental funds are reported using the current financial resources measurement focus and the modified accrual basis of accounting. Revenues are recognized when measurable and available. Revenues are considered available if those revenues are collectible within the current period or shortly thereafter to pay liabilities of the current period. Expenditures are generally recorded when incurred; however, expenditures for debt service, compensated absences, claims, and judgments are recorded when payments are due.
The County considers revenue collected within ninety days of the end of the year as available, except for
property taxes, which must be collected within sixty days. Property taxes, income taxes, certain shared taxes, and grants that have not been received within the availability period have been deferred to future periods and recorded as deferred inflow of resources.
The governmental fund financial statements separately present the following major funds:
• General Fund – This fund is the primary operating fund. It accounts for all financial resources of the primary government except those accounted for in another fund.
• Grants Special Revenue Fund – The grants fund accounts for grant monies collected by the County through the following departments: Chief Administrative Office, Circuit Court, Fire, Health, Police, Planning and Zoning, Recreation and Parks, Sheriff’s Office, Social Services, State’s Attorney’s Office, Aging and Disability, and Detention Facilities. This fund moved from a minor fund to a major fund in the current fiscal year as a result of increases in revenues and expenses related to Covid-19.
• Impact Fee Capital Projects Fund – This capital projects fund accounts for impact fees collected from developers to pay a share of the cost of additional school capacity, road improvements, and public safety facilities necessitated by the development.
Anne Arundel County, Maryland Notes to the Financial Statements
50
• General County Capital Projects Fund – This fund accounts for all financial resources that are received and used for the acquisition or development of major capital improvements. Resources received are applied such that the most restrictive resources are used first. This generally results in the following order:
restricted revenues such as developer contributions, bonds, pay-as-you-go, and grants.
Proprietary fund financial statements - The proprietary funds are reported using the economic resources measurement focus and the accrual basis of accounting. Revenues are recognized when earned, and expenses are recognized when a liability is incurred, regardless of the timing of cash flows. These funds account for County services that operate as self-supporting activities. Those who benefit from these services bear the cost through the payment of user fees. The proprietary fund financial statements separately present the following major enterprise funds:
• Water and Wastewater – This fund accounts for the operating, debt service, and capital improvement activities of the water and wastewater utility services provided to County residents and businesses.
• Solid Waste – This fund accounts for the costs associated with the collection and disposal of refuse for County residents and businesses. This includes the cost of operations, debt service, capital improvements, and landfill restoration.
The proprietary fund statements also include a column that presents totals for internal service funds. These
funds operate as self-supporting activities that primarily serve the primary government and its component units. The internal service funds of the County are:
• Self Insurance – The County is self-insured for workers’ compensation, auto liability, and general liability insurance. This fund accounts for the self-insured activity and the purchase of policies from commercial insurers for certain specific exposures. These services, provided to the primary government and certain component units, are funded through charges to the users.
• Health Insurance – The County is self-insured for employee and retiree medical benefits. This fund accounts for this health insurance activity and the payment to outside administrators and medical service providers. These services are provided to the primary government and certain component units and other agencies and are funded through premiums charged to the users.
• Central Garage and Transportation – This fund accounts for activity in the County’s central garage, which provides the primary government and certain component units with vehicle maintenance, fuel usage, and motor pool vehicles. Costs are recovered through fees to users for maintenance, fuel use, and vehicle lease charges.
• Garage Vehicle Replacement – This fund accounts for the collection of replacement fees from participating funds within the primary government and certain component units. The fees are used to replace motor pool vehicles as needed.
Fiduciary fund financial statements - The fiduciary fund statements include the following:
• Pension Trust Fund – The activities of the Anne Arundel County Retirement and Pension System (Retirement System). The Retirement System accounts for the activity in the primary government’s four defined-benefit pension plans and reports on a calendar-year basis. The Pension Trust Fund is reported using the economic resources measurement focus and accrual basis of accounting. Revenues are recognized when earned, and expenses are recognized when a liability is incurred, regardless of the timing of related cash flows. These plans accumulate employer and employee contributions and invest these funds to provide guaranteed pension benefits after retirement. Employer contributions are based on actuarial recommendations.
Pension expenses are liquidated within the following governmental funds: the General Fund, Reforestation Fund and grant funds. They are also liquidated in the following internal service and enterprise funds: Self Insurance, Central Garage and Transportation, Water and Wastewater, Solid Waste and Child Care.
• Anne Arundel Retiree Health Benefits Trust Fund – The activities of the Anne Arundel Retiree Health Benefits Trust (OPEB Trust Fund). The OPEB Trust Fund has fiduciary responsibility to administer the agent multi-employer defined benefit plans for the purpose of providing retiree health benefits as “other
Anne Arundel County, Maryland Notes to the Financial Statements
51
post-employment benefit” for following three entities; the Anne Arundel County Plan (County Plan), the Anne Arundel Community College Plan (College Plan), and the Public Library Association of Annapolis and Anne Arundel County, Inc. (Library Plan).
Anne Arundel County Retiree Health Benefits are liquidated within the following governmental funds: the General Fund, Reforestation Fund and grant funds. They are also liquidated in the following internal service and enterprise funds: Self Insurance, Central Garage and Transportation, Water and Wastewater, Solid Waste and Child Care.
• Agency Funds – The balances of assets and liabilities maintained in the primary government’s agency funds. Since agency funds report only assets and liabilities, these funds do not have a measurement focus. Transactions in these funds are recorded using the accrual basis of accounting. Agency funds account for deposits that are collected and held on behalf of individuals, organizations, or other governments. These monies include the following: escrow deposits for developer subdivisions, sediment control, tax sale, special taxing districts, and other miscellaneous purposes; monies held in trust on behalf of the Special Tax and Assessment Districts; and taxes collected for other governments.
Budgetary Statements
The basic financial statements include a Statement of Revenues, Expenditures, and Changes in Fund
Balances – Budget and Actual for the General Fund. This statement is prepared using the budgetary basis of accounting in which revenues are recognized when earned and available. This non-GAAP basis of accounting recognizes that the County’s budget is adopted in accordance with legal requirements regarding appropriation authority and the certification of the availability of funds to support those appropriations. Pursuant to the County Charter, the capital and operating budgets are presented by the County Executive to the County Council by May 1st. The County Council holds public hearings regarding the budget. The Annual Budget and Appropriation Ordinance must be approved by June 15th (prior to the start of the next fiscal year on July 1st) and provides the spending authority at the department level for the operations of the County. Unexpended or unencumbered appropriations in the operating budget expire at year end. The County also recognizes revenue collected within ninety days of the end of the fiscal year as available for the prior year’s appropriation, except for property taxes, which must be collected within sixty days and grant revenue when the County Controller has determined that sufficient documentation exists to support that revenues not yet collected within ninety days of the end of the year are available to support appropriations in that fiscal year. Budgetary expenditures are recognized when encumbered or when goods or services are received. All major capital project funds have legally adopted budgets and unspent appropriations at year end carry forward to the subsequent year, except for the Impact Fee Fund. All non-major governmental funds have legally adopted budgets, except the Storm Drain Fees Fund, Recreation Land Fees Fund, Street Light Fund, and Energy Revolving Loan Fund, which are expended through the Capital Projects Fund. Additional Budgetary information can be found at www.aacounty.org/departments/budget-office/previous-budgets/fy2020/index.html.
Combining and Other Supplementary Schedules
For all columns in the basic financial statements that accumulate the data for non-major funds or
component units, the County has provided combining statements that present the individual funds included in these non-major categories. In addition, budgetary statements of revenue and expenditures for all primary government funds for which budgets are adopted have been provided. Separate financial statements for the Library, a non-major component unit, are also presented because the Library does not issue separate financial statements.
C Cash, Investments, and Related Income – Cash includes bank deposits in checking and savings accounts. Investments include external pools and fixed income issues which generally mature within one year. Investments may extend longer than one year to facilitate the specific purpose of a fund. Details on investment types and terms are displayed in Note 3, “Cash and Investments.”
Investments are recorded at fair value. Available cash from the primary government and Library is pooled in the General Fund and invested in money market or other investments. To facilitate the pooling, cash belonging to other funds is transferred to and from the General Fund. On the Statement of Cash Flows for the proprietary funds, cash and cash equivalents include bank deposits and liquid investments readily convertible to cash.
Anne Arundel County, Maryland Notes to the Financial Statements
52
Investment income earned on investments is generally allocated to each fund based on its proportionate
share of the average daily cash balance each month. Investment income earned on the balances in certain special revenue funds, certain internal service funds, agency funds, and the Library Fund is retained in the General Fund. In addition, investment earnings recognized in the General County Capital Projects Fund are transferred to the General Fund.
Investments of the Retirement System are reported at fair value. Short-term investments are reported at cost, which approximates fair value. Securities traded on a national or international exchange are valued at the last reported sales price at current exchange rates. Mortgages are valued on the basis of future principal and interest payments and are discounted at prevailing interest rates for similar instruments. The fair value of real estate investments is based on periodic independent appraisals. Investments that do not have an established market, such as Private Markets, are reported at estimated fair values. The fair value of private equities are based on management’s valuation of estimates and assumptions from information and representations provided by the respective general partners, in the absence of readily ascertainable market values. There are no investments with parties or in entities related to the County. D Inventories and Prepaid Expenses – Inventories of parts and supplies recorded in the General Fund and certain proprietary funds are valued at cost assuming a first-in, first-out consumption pattern. The government-wide and the fund statements record the cost of inventory as it is consumed, while the budgetary statements record the cost when the inventory is purchased. For the government-wide and proprietary statements, prepaid expenses are recognized as the services are consumed. For the budgetary statements, prepaid items are recognized when either encumbered or paid. E Program Revenues – The government-wide Statement of Activities is presented using a net-cost format. Total costs are presented on a functional basis. Some of these functional activities are financed in whole or in part by program revenues received from parties outside the County government. These program revenues are subtracted from the functional costs to arrive at net costs. General County revenues are then applied against the net costs to arrive at changes in net position for the fiscal year. Program revenues include amounts received from those who purchase, use, or directly benefit from a program; amounts received from outside parties that are restricted to one or more specific programs; and earnings on investments that are legally restricted for a specific purpose. Program revenues include user fees and charges, impact fees, fines, license and permit fees, special community benefit assessments, grants and contributions, and restricted investment income. F Capital Assets – Capital assets of the primary government are recorded in the applicable governmental or business-type activities columns on the government-wide Statements of Net Position. These asset balances include all constructed, purchased, or developer-donated public domain infrastructure (roads, bridges, and similar items). Infrastructure with an individual value of $50,000 or more, intangible assets and software with an individual value of $50,000 or more, library books are recorded at cost, and other assets with an individual value of $5,000 or more are capitalized. Capital assets are valued at historical cost or estimated historical cost. Donated assets are recorded at acquisition value on the date donated. Land and easements, historical property, and works of art are assets that are not depreciated. Depreciable assets are depreciated on a straight-line basis over the respective useful lives. The estimated useful lives of the capital assets are determined by the category. They are listed as follows:
Category Years Category Years
Buildings, structures, sidewalks, curbs, Heavy machinery and other equipment 5 – 10
gutters and water / sewer lines 50 Library collection 10
Water / sewer structures 35 Furniture and fixtures 5 – 10
Land improvements 30 Office equipment, intangible assets,
Culverts and storm drains 25 – 50 software, and telecommunications
Roads and bridges 17 – 30 systems 5 – 7
Landfills 15 – 20 Automobiles and small rolling stock 5
Anne Arundel County, Maryland Notes to the Financial Statements
53
G Deferred Outflows/Inflows of Resources – A deferred outflow of resources represents the consumption of
net position that applies to a future period that will not be recognized as an outflow of the resources (expenditure) until the future period. At the end of the current fiscal year, the County Primary Government had deferred outflows of resources for pension benefits, Other Post-Employment Benefits (OPEB), Length of Service Awards Program (LOSAP), and unamortized deferred refunding losses. The Board of the Maryland State Retirement, Anne Arundel County Pension and Retirement System, and Anne Arundel Retiree Health Benefits Trust (OPEB) recognizes deferred outflows of resources (DOR) which are amortized according to the actuarial valuation report. The DOR can occur from contributions after measurement date, changes in investment, changes in assumptions and changes in experience, as determined from the actuarial valuation report. Deferred inflow of recourses represents an acquisition of net position that applies to a future reporting period that will not be recognized as an inflow of resources (revenue) until that time. For government-mandated and voluntary non-exchange transactions on the governmental funds, a deferred inflow is reported when resources are received before time requirements are met and revenue unavailable. The governmental funds had deferred inflows of resources representing unavailable tax revenues, E-Rate Federal reimbursements, 911 fees, and unavailable grant and program revenues. On the government wide statements, the primary government had deferred inflows of resources (DIR) representing pension, OPEB, LOSAP and advances in property tax revenue. The Board of the Maryland State Retirement, Anne Arundel County Pension and Retirement System, and Anne Arundel Retiree Health Benefits Trust (OPEB) recognizes deferred inflows of resources related to pensions and OPEB actuarial estimates which are amortized according to the actuarial valuation report. The DIR can occur from changes in investment, changes in assumptions and changes in experience, as determined from the actuarial valuation report.
Deferred outflows of resources are presented below the total assets on the government-wide, proprietary, and governmental statements. Deferred inflows of resources are presented below the total liabilities on the government-wide, proprietary, and governmental statements.
H Operating and Non-operating Revenues and Expenses and Capital Contributions – The Statement of Revenues, Expenses, and Changes in Fund Net Position for proprietary funds categorize revenue sources into operating, non-operating, and capital contributions. Operating revenues include charges for water, wastewater, landfill usage, child care and other revenue used to fund the ongoing provision of water and wastewater, waste collection, and child care services to citizens. The statement also presents combined totals for the internal service funds. These funds collect charges from other funds and component units for insurance and the primary government’s motor pool maintenance and replacement. Non-operating revenues include all other sources, such as interest earned and other revenue. Capital contributions include developer-contributed assets and grants, capital connection fees, capital facility assessments, and front foot benefit fees restricted for the construction of capital assets or the payment of debt issued for capital construction. Operating expenses in the proprietary funds include the costs of operating the County’s water and wastewater system, waste collection activities, and school-based child care services. Expenses consist of personnel and non-personnel services, cost of goods issued, depreciation, landfill closure and post-closure costs, indirect costs, and other miscellaneous allocated expenses. Non-operating expenses include interest on debt and other miscellaneous expenses. I Bond premiums and refunding gain or loss – The primary government typically receives premiums as a result of the sale of general obligation bonds. The treatment of the premiums differs depending on the basis of accounting used on the related statements. Premiums earned on debt in governmental activities are recognized as revenue in the year of the bond sale on the fund statement, amortized over the life of the bonds on the government-wide presentation, and applied against the purchase of capital assets in the subsequent fiscal years on the budgetary statement. Premiums earned on the bonds in business-type activities are amortized over the life of the bonds on the fund level and government-wide presentations, recorded as premium revenue on budgetary statements and then applied against the purchase of capital assets in the subsequent fiscal years. The refunding gain or loss is applied against the shorter life of the old debt or the new debt.
J Indirect costs – Administrative costs of the primary government are generally included in the general government functional expenses on the government-wide Statement of Activities and the fund financial statements. However, some allocations of administrative costs are made through an indirect cost allocation plan, resulting in charges to the proprietary funds, Pension Trust Fund, and General County Capital Projects Fund. These allocated costs are included in the functional expenses of these other funds.
Anne Arundel County, Maryland Notes to the Financial Statements
54
K Encumbrances – The governmental funds utilize encumbrance accounting under which purchase orders, contracts, and other commitments are recorded in order to reserve budget appropriations for that purpose. Open encumbrances at fiscal year-end are shown as part of the restricted, committed or assigned fund balance, depending on the nature of the fund, in the governmental fund statements and are recorded as expenditures on the budgetary statements. Encumbrances as of June 30, 2020 totaled $130,039,493 in the governmental fund types, of which $99,996,185 is for construction activity. The proprietary funds utilize encumbrance accounting for budgetary purposes. As of June 30, 2020, the proprietary funds had encumbrances totaling $87,077,254, of which $73,704,145 is for construction activity.
L Fund Balance Classification – The governmental fund financial statements present fund balances based on
classifications that comprise a hierarchy based primarily on the extent to which the County is bound to honor
constraints on the specific purposes for which amounts in the respective governmental funds can be spent. The
classifications used in the governmental fund financial statements are as follows:
• Non-spendable: This classification includes amounts that cannot be spent because they either (a) are not in
spendable form or (b) are legally or contractually required to be maintained intact. The County has classified
inventories, and prepaid items as non-spendable.
• Restricted: This classification includes amounts for which constraints have been placed on the use of the
resources either (a) externally imposed by creditors (such as through a debt covenant), grantors, contributors, or
laws or regulations of other governments, or (b) imposed by law through constitutional provisions or enabling
legislation. The following fund balances are classified as restricted:
o Permanent Public Infrastructure (PPI): $$9,971,621 of the general fund balance is restricted
through enabling legislation from County bill 42-19 which established the reserve fund for
permanent public improvement (PPI).
o Base realignment and closure (BRAC): restricted by the Annotated Code of Maryland, Economic
Development Article, Section 5-1306 for the revitalization and incentive programs in the BRAC
area.
o Impact fees: restricted by the Annotated Code of Maryland, Local Government Article, Section
20-701 for expanded infrastructure required to accommodate new development.
o Forfeiture and asset seizure team: restricted by federal regulations for law enforcement activities.
o Roads and special benefits: restricted by the Annotated Code of Maryland, Local Government
Article, Section 10-314 for the improvements and benefits within designated districts.
o Reforestation: restricted by the Annotated Code of Maryland, Natural Resources Article, Section
5-1610 for the reforestation of properties in the County.
o Laurel racetrack community benefit: restricted by the Annotated Code of Maryland, Business
Regulation Article, Section 11-404 for certain services and facilities in the vicinity of the Laurel
racetrack.
o Grants: restricted by various state and federal laws, regulations and grant agreements that specify
how funds may be spent.
o Circuit court: restricted by the Annotated Code of Maryland, Court and Judicial Proceeding
Article, Section 7-204 for Circuit Court operations.
o Odenton Town Center Tax Increment: restricted by State Enabling Legislation and the creation
of the special taxing district as defined in Anne Arundel County Resolution 42-14, for the creation
of Odenton Town Center Development District.
Anne Arundel County, Maryland Notes to the Financial Statements
55
o Erosion districts: restricted by the Annotated Code of Maryland, Local Government Article,
Section 21-306 for erosion control projects and related loans in designated districts.
o Video lottery local impact aid: restricted by the Annotated Code of Maryland, State Government
Article, Section 9-1A-31(b) for improvements and facilities in the vicinity of the video lottery
facility.
o Watershed protection and restoration: restricted by the Annotated Code of Maryland,
Environment Article, Section 4-202.1(h) (4) for stormwater management and projects.
o Bond premium: restricted by the County Charter, Section 720(b) for capital improvements
financed with the proceeds of the bonds that generated the premiums.
o Debt Service: is restricted through debt covenants.
• Committed: This classification includes amounts that can be used only for specific purposes pursuant to
constraints imposed by formal action of the County’s highest level of decision making authority through the
passing of ordinances. These amounts cannot be used for any other purpose unless the County Council removes
or changes the ordinance that was employed when the funds were initially committed. The following funds are
committed based on legislation in the County code: Bike, Pedestrian, Transportation and Infrastructure Fund;
Street Lights Capital Project Fund; Recreation Land Fees Fund; and Energy Revolving Loan Fund. The
Installment Purchase Agreement Fund is committed for the purchase of agricultural and woodland preservation
programs.
• Assigned: This classification includes amounts that are constrained by the County’s intent to be used for a
specific purpose, but are neither restricted nor committed. The policy to assign funds is established through the
Annual Budget and Appropriation Ordinance each year which is approved by both the County Council and the
County Executive. This classification also includes the remaining positive fund balance for all governmental
funds except for the General Fund. General County Capital Projects are assigned for the repair and
replacement of equipment.
• Unassigned: The General Fund is the only fund that reports a positive unassigned fund balance. In other
governmental funds, it is not appropriate to report a positive unassigned fund balance amount. However, in
governmental funds other than the General Fund, if expenditures incurred for specific purposes exceed the
amounts that are restricted, committed, or assigned to those purposes, it may be necessary to report a negative
unassigned fund balance in that fund. This classification includes the residual fund balance for the General
Fund. The A.A. County Partnership for Children Youth and Family Fund, Arundel Community Development
Service Fund and the Grants Fund have negative unassigned fund balance which represents the timing
difference between the grant expenditures and payments received for the reimbursable grants. The County typically uses restricted resources first, followed by committed resources, and then assigned resources, as appropriate opportunities arise, but reserves the right to selectively spend unassigned resources first to defer the use of these other classified funds. M Compensated absences - The primary government’s Statements of Net Position include an accrual for compensated absences. This accrual is an estimate of unused annual leave as of June 30, 2020. The annual leave accrual is calculated using unused annual leave hours as of June 30, 2020 and pay rates in place for each employee at the end of the fiscal year. The compensated absences accrual also includes an estimate of sick leave payouts earned as of fiscal year-end. Certain employees are paid $25 per day for unused sick leave upon retirement. The estimate uses unused sick days at year end multiplied by $25 per day. The accrual is then adjusted to reflect an estimate of the current employees that will ultimately retire with the primary government.
Anne Arundel County, Maryland Notes to the Financial Statements
56
Compensated absences are liquidated within the following governmental funds: the General Fund and Reforestation Fund. They are also liquidated in the following internal service and enterprise funds: Self Insurance, Central Garage and Transportation, Water and Wastewater, Solid Waste and Child Care. N New GASB Pronouncements - In fiscal year ended June 30, 2020, the County did not implement any new Governmental Accounting Standard Board (GASB) pronouncements.
The following pronouncements will be evaluated for future implementation:
As of the year ended June 30, 2020, GASB issued Statement No. 84, Fiduciary Activity; Statement No. 87, Leases; Statement No. 90, Majority Equity Interests; Statement No. 91, Conduit Debt Obligations; Implementation Guide No. 2019-2 and Implementation Guide No. 2019-3. Some of these statements will have a material effect on the County’s financial statements once implemented.
The County will be analyzing the effects of these pronouncements and plans to adopt them as applicable by their effective date.
O Use of Estimates - The preparation of financial statements in conformity with generally accepted accounting principles requires management to make estimates and assumptions that affect the amounts reported in the financial statements and the related notes. Actual results could differ from those estimates.
2 Budgetary Information
Expenditures and encumbrances of funds may not exceed legally adopted appropriations. The appropriations are established by the County Council in the Annual Budget and Appropriation Ordinance. During the fiscal year, the County Council may adopt supplemental budgetary appropriation ordinances that increase appropriations from revenue not anticipated in the budget or in excess of that anticipated in the budget. The County Executive has the authority to approve intra-department transfers within a fund. Transfers of appropriations from one department to another or from one capital project to another require the County Council’s approval by ordinance. The legal level of budgetary control is by fund and agency for the operating funds, at the project level for capital projects, and at the district level for Roads and Special Community Benefit Districts, Shore Erosion Control Districts, and Waterway Improvement Special Taxing Districts. All unexpended, unencumbered appropriations lapse at year end, except appropriations for capital projects. The County adopts budgets for all funds except the Agency and Fiduciary Funds, Library Dedicated Revenue Fund and the capital project funds for the Bike, Pedestrian, Transportation and Infrastructure Fund, Recreation Land Fees Fund, Street Light Fund, and Energy Revolving Loan Fund, which are expended through the General County Capital Projects Fund. Appropriations in the grant funds may be increased without a separate ordinance if the conditions in the code are met.
A Excess Expenditures over Appropriation Limits – The County did not exceeded their budget appropriations
in the current fiscal year. B Fund Deficits - The Partnership for Children, Youth and Family, Grants Fund and Arundel Community Development Services have deficit fund balances in the amount of ($515,159, $8,364,933 and $1,379,114), respectively, as a result of funds expended in the current fiscal year that were not reimbursed by the grantor within 90 days of the fiscal year end. The Board of Education and Anne Arundel County Public Library, discretely presented component units, have deficit net positions of ($1,120,833,310) and ($23,400,353), respectively, as a result of unfunded liabilities for other postemployment and pension benefits. In addition, Governmental Activities has a deficit net position of ($520,422,149) on the full accrual statements as a result of unfunded liabilities for other postemployment and pension benefits. C Reconciliation Between Fund Financial Statements and Budgetary Statements - The General Fund’s Statement of Revenues, Expenditures and Changes in Fund Balances and the Statement of Revenues, Expenditures, and Changes in Fund Balances – Budget and Actual use different revenue and expenditure recognition policies, a reconciliation of these two statements is provided as follows:
Anne Arundel County, Maryland Notes to the Financial Statements
57
General Fund
Revenue (under) over expenditures - budgetary basis $ 15,307,289
Net effect of encumbrances 2,757,715
Change in due to Central Garage and Transportation Fund 2,173,626
Transfer for Permanent Public Improvements 9,371,621
Change in from to Self Insurance Fund 13,911,487
Change in revenue reserve allocation 8,974,967
FMV interest adjustment (578,933)
Health Department encumbrance adjustment 193,667
LOSAP - Current Liability (50)
Effects of Inmate Benefit Fund & Parking Garage Fund 231,424
Net inventory change 961,985
Change in fund balance - modified accrual basis $ 53,304,798
3 Cash and Investments
The primary government pools available cash and centrally invests these funds to maximize earnings. The component units also pool available cash in this manner. Assets of the Anne Arundel County Pension and Retirement System (Retirement System) and the Anne Arundel County Retiree Health Benefits Trust, which covers Other Post-Employment Benefits (OPEB), are held separately. Significant accounting policies related to cash and investments are included in Note 1C. A Policies – The primary government is authorized to invest available public money in obligations of the U.S. Government, its agencies and instrumentalities; repurchase agreements that are fully collateralized by direct U.S. Government obligations and U.S. Government agency and instrumentality obligations, including fixed rate Mortgage-Backed Securities; Bankers’ Acceptances; mutual funds that are registered with the Securities and Exchange Commission (SEC) under the Investment Company Act of 1940 (the Act), are operating in accordance with Rule 2A-7 of the Act, and have received the highest possible rating from at least one Nationally Recognized Statistical Rating Organization as designated by the SEC; Certificates of Deposit; and Commercial Paper. In addition, the primary government can participate in the local government investment pool authorized and maintained by the State of Maryland. The fair value of the position in the pool is the same as the value of the shares. Finally, the primary government is authorized to invest bond proceeds that are subject to arbitrage rebate requirements in State and local government obligations. The primary government, Board of Education, Community College, and Library all participate in the Maryland Local Government Investment Pool (MLGIP), which provides all local government units of the State a relatively safe investment vehicle for the short-term investment of funds. The State Legislature created MLGIP with the passage of Article 95 22G, of the Annotated Code of Maryland. The MLGIP, under the administrative control of the State Treasurer, is managed by PNC Capital Advisors, LLC. The pool is a 2a7 like pool, which is not registered with the Security and Exchange Commission (SEC), but generally operates in a manner consistent with the SEC’s rule 2a7 of the Investment Company Act of 1940 (Rule 2a7). MLGIP has a credit rating of AAAm and seeks to maintain a $1 per share value, is designed to give local government units of the State an investment vehicle for short-term investment of funds. Legislation became effective during fiscal year 2015 that expanded the authorized investments for Self-Insurance funds. In addition to the vehicles available for public money, the non-current portion of Self Insurance fund reserves may be invested in investment grade domestic corporate bonds, mutual funds, exchange traded funds, and taxable or tax-exempt municipal securities.
Anne Arundel County, Maryland Notes to the Financial Statements
58
Pooled cash is primarily used to purchase short-term investments. Policy requires that for repurchase agreement investments made by the County, the initial collateral securities underlying repurchase agreement investments have a market value of at least 102.0% of the cost of the repurchase agreement. The collateral is in the County’s name and held by an independent third party or at the Federal Reserve. When the collateral falls under 101.0% or is $100,000 less than the 102.0%, additional collateral is required to bring the total to the required level. At June 30, 2020, there were not any repurchase agreements to collateralize at 102.0%
The Retirement System is authorized to invest in U.S. Government securities, insurance company general accounts, commercial paper, money market mutual funds, corporate bonds, common and international stocks, limited partnerships, absolute return funds, private equity, mortgage participations, and real estate. The Retirement System lends its securities to broker-dealers and other entities with a simultaneous agreement to return the collateral for the same securities in the future. Effective December 1, 2016, the Retirement System’s Lending Agent was Deutsche Bank AG. Deutsche Bank AG lends securities for collateral in the form of cash or other securities of 102.0% for domestic securities and 105.0% for international. Cash collateral received by the Retirement System with respect to these transactions is invested in a separate, un-pooled account basis at the direction of the Board of Trustees in fully collateralized repurchase agreements.
At year end, the Retirement System had no credit risk exposure to borrowers, because the amount of
collateral held by the Retirement System was greater than the value of securities on loan. The market value of invested collateral held as of December 31, 2019 was $69,917,128. There were no securities held as collateral. The market value of securities on loan for the Retirement System as of December 31, 2019 was $68,264,610.
The Retirement System did not impose any restrictions during the year on the amount of the loans that the agent made on its behalf. Moreover, there were no losses during the year resulting from a default of the borrowers or agent. All security loans can be terminated on demand by either the Retirement System or the borrower. Cash collateral received was invested in Repurchase Agreements, which as of December 31, 2019 had a weighted average final maturity of 19.0 days. The interest rate risk is zero days, as assets and liabilities can be rate changed on a daily basis. The Anne Arundel Retiree Health Benefits Trust (OPEB Trust) is authorized to invest in large capitalized domestic equities, international equities, emerging international equities, core fixed income, and diversified fixed income. The OPEB Trust’s Board of Trustees has established an Investment Policy Statement (IPS) to set forth investment objectives, policies, guidelines, monitoring and review procedures relating to the management and safekeeping of all assets of the OPEB Trusts. Policy allows the use of mutual/commingled funds as investment vehicles under certain guidelines. B Balances and Custodial Credit Risk – As of June 30, 2020, the carrying amount of the primary government’s bank deposits was $810,825 and bank balances were $2,469,916. All bank balances were fully secured by Federal Deposit insurance or fully collateralized. The total money market fund balance was $318,103,649.
Cash balances of the Board of Education are fully secured by Federal Deposit insurance and collateral held in the Board’s name at the Federal Reserve Bank of Richmond. Deposits for Anne Arundel Community College are secured and properly protected. The cash balances of the other non-major component units were insured. Money market fund balances for the Retirement System as of calendar year-end December 31, 2019 and OPEB Trust as of fiscal year ended June 30, 2020, were $93,827,963 and $15,281,969 respectively.
Custodial credit risk is the risk that the primary government will not be able to recover deposits in the event of the failure of a depository financial institution or will not be able to recover collateral securities that are in the possession of an outside party. Investment securities are exposed to custodial credit risk if the securities are uninsured, are not registered in the name of the primary government, and are held by either a counterparty or the counterparty’s trust department or agent, but not in the primary government’s name. The primary government’s Investment Policy requires that the Controller maintain a list of financial institutions authorized to provide investment services, including custodial services and collateral requirements. Internal procedures establish the methods for evaluating eligible institutions. Custodial credit risk for deposits is not addressed in the policy.
Anne Arundel County, Maryland Notes to the Financial Statements
59
C Interest Rate Risk – Interest rate risk is the risk that changes in interest rates will adversely affect the value of an investment. The fair value of fixed income (debt) securities is affected by increases and declines in interest rates. These investments may also have embedded call features allowing the issuer to redeem part or all of the issue prior to maturity at a pre-determined price. In addition, debt issues may have interest rates that vary according to a pre-determined external index (such as the London Inter-Bank Offered Rate) or a pre-determined step-up in the interest rate at a pre-determined date(s). The primary government’s Investment Policy does not specifically address interest rate risk. However, term limits are established for certain investments to minimize interest rate risk. The Retirement System’s Investment Policy Statement (IPS) sets limits on floating rates for mortgage-backed securities and establishes limits on the average duration of some investment types.
The table that follows uses the Segmented Time Distribution method to display debt investments by
maturity for the primary government and the component units by term and investment type. Market values for issues within the primary government’s agency/instrumentalities category include $84,848,939.59 of callable issues and there are no issues that have both callable and variable-rate features as of June 30, 2020. The component units’ issues have no variable rate securities. Equity mutual fund investments with a market value of $8,011,545 are not included in this table.
Investment Maturities
Investment Type Fair Value Less than 1 year 1 to 5 years 6 to 10 years
Greater than
10 years
U.S. Government securities $ 304,342,451 292,078,992 $ - $ 9,940,145 $ 2,323,314
The following table uses Segmented Time Distribution to display the Retirement System’s debt holdings by
maturity term and investment type as of December 31, 2019. Some issues within the categories agencies/instrumentalities, corporate bonds, collateralized mortgage obligations, and other asset-backed securities have variable-rate features. The total fair value of these securities with variable rate features was $8,595,005 as of December 31, 2019.
The table also includes issues with call features and assumes that these issues will be held to maturity. The
total fair market value of callable securities totals $69,402,684 with call dates ranging from January 15, 2020 for continuously callable issues to February 20, 2059. Stated call prices are generally at par. The callable holdings
Anne Arundel County, Maryland Notes to the Financial Statements
60
include issues with floating interest rates, which have a market value of $13,030,714. Non-debt investments, guaranteed contracts, and un-invested cash with a combined fair value of $1,454,323,195, do not have maturity dates and therefore are not included in this table.
Less than
Investment Type Fair Value 1 year 1 to 5 6 to 10 over 10
The OPEB Trust owned two debt mutual funds exposed to interest rate risk as of June 30, 2020. As of June
30, 2020, the trust owned two fixed income mutual fund with an effective maturity of 7.1 years and 9.5 years with a fair value of $95,320,631.
D Credit Risk – Credit risk is the risk that an issuer or other counterparty to an investment will not fulfill its obligations. Debt securities are rated by Nationally Recognized Statistical Rating Organizations to provide purchasers with an opinion of the capability and willingness of a borrower to repay its debt. The primary government’s Investment Policy does not address credit risk. The following table displays the County’s debt holdings and quality ratings from Standard & Poor’s. Ratings for the component units and Retirement System are listed separately. Equity mutual fund investments with a market value of $8,011,545 are not included in this table.
Credit ratings of U.S. government agency securities that are only implicitly guaranteed by the U.S.
government are categorized accordingly in the main body of this table. Implicitly guaranteed agency securities include government mortgage backed, government agencies, and short-term U.S. treasury bills and notes. Other categories issued are Federal National Mortgage Association, Federal Deposit Insurance Corporation, Federal Home Loan Bank, Federal Home Loan Mortgage Corporation, Federal Financing Corporation, Small Business Association, Farmer Mac, and Federal Farm Credit.
Anne Arundel County, Maryland Notes to the Financial Statements
** The fair value o f U.S . g o vernment ag ency securit ies is lis ted here. Due to the exp licit g uarantee fro m the U.S . g overnment , they are consid ered to have no cred it
risk fo r rep o rting p urp oses .
Standard & Poor's Credit Ratings
The Retirement System’s Investment Policy Statement provides guidelines to all fixed income managers
related to allowable quality ratings. Holdings displayed by rating as of December 31, 2019, excluding equities and un-invested cash with a total fair value of $1,454,323,134, are displayed next.
Anne Arundel County, Maryland Notes to the Financial Statements
E Concentration Risk – Concentration risk is the risk of loss attributed to the magnitude of the government’s investment in a single issuer. As of June 30, 2020, Federal Home Loan Bank was 10.52% of the primary government’s investments, Federal Agricultural Mortgage Corporation represented 4.02%, Federal Farm Credit Bank was 3.23%, Federal Home Loan Mortgage Corporation was 2.84%, and Federal National Mortgage Association was 1.78%. The primary government’s Investment Policy requires diversification of investments by security type and institution. Issuer limits are not addressed. There was no investment greater than 5.0% for the Board of Education or the Community College, excluding pools. The Retirement System’s IPS sets maximum concentration limits by asset type and manager style. As of December 31, 2019, there was no exposure to a single issuer greater than 5.0% of the Retirement System’s plan net position, excluding investment pools. F Foreign Currency Risk – This risk relates to the potential, unfavorable fluctuation of exchange rates compared with the U.S. Dollar. Neither the primary government nor its component units had exposure to foreign currency risk as of June 30, 2020. The Retirement System recognizes the value of global diversification and retains six managers for global and international equity and fixed income investments. Global and international managers may also purchase or sell currency on a spot basis and may enter into forward exchange contracts on currency, provided that the use of such contracts is designed to dampen portfolio volatility or to facilitate the settlement of securities transactions. As of December 31, 2019, the Retirement System had no direct exposure to fixed income foreign currency. The fair market value of international/global equities and fixed income assets, which are managed in pooled funds, totaled $784,570,200 as of December 31, 2019.
As of June 30, 2020, the OPEB Trust had no direct exposure to fixed income foreign currency. The fair market value of one international mutual fund totaled $60,418,204.
Anne Arundel County, Maryland Notes to the Financial Statements
63
G Fair Value Measurement – The Primary Government, Retirement System and Retiree Health Benefits Trusts have categorized the fair value measurements within the fair value hierarchy established by generally accepted accounting principles. The hierarchy is based on the valuation inputs used to measure the fair value of the asset and give the highest priority to unadjusted quoted prices in active markets for identical assets or liabilities (Level 1 measurements) and the lowest priority to unobservable inputs (Level 3 measurements). Level 1 inputs are quoted prices in active markets for identical assets; Level 2 inputs are significant other observable inputs; and Level 3 inputs are significant unobservable inputs. Level 1 Unadjusted quoted prices in active markets for identical instruments. Level 2 Quoted prices for similar instruments in active markets; quoted prices for identical or similar
instruments in markets that are not active; and model-derived valuation in which all significant inputs are observable.
Level 3 Valuations derived from valuation techniques in which significant inputs are unobservable.
Investments that are measured at fair value using the net asset value per share, or its equivalent, as a practical expedient are not classified in the fair value hierarchy.
The schedule of investments by type and hierarchy level as of June 30, 2020 is displayed below. As of June 30, 2020, short-term investments of $318,103,649 were in money market mutual funds, which are not subject to the fair value measurement requirements.
Assets at Fair Value June 30, 2020
Primary Government
Quoted Prices
in Active
Markets for
Identical
Assets
Significant Other
Observable
Inputs
Significant
Unobservable
Inputs
Investment Type Fair Value Level 1 Level 2 Level 3
U.S. Treasuries $ 304,342,451 $ 304,342,451 $ - $ -
As of June 30, 2020, all investments and deposits for the Board of Education and the non-major component units were in money market mutual funds, which are not subject to the fair value measurement requirements. The following table shows the fair market measurements for the Retirement System as of December 31, 2019. As of December 31, 2019, all short-term investments were in money market mutual funds, which are not subject to the fair value measurement requirements.
Anne Arundel County, Maryland Notes to the Financial Statements
64
Assets at Fair Value December 31, 2019
Quoted Prices
in Active
Markets for
Identical
Assets
Significant
Other
Observable
Inputs
Significant
Unobservable
Inputs
Investment Type Fair Value (Level 1) (Level 2) (Level 3)
Fixed Income Investments
U.S. Government obligations $ 18,655,100 $ - $ 18,655,100 $ -
International equity pools 273,650,975 273,650,975 - -
Total equity investments 701,931,435 646,410,613 55,520,822 -
Total investments by fair value level $ 965,118,060 $ 647,505,496 $ 316,281,152 $ 1,331,412
Investment Types at net asset value Net Asset Value
Unfunded
Commitments
as of 12/31/19
Redemption
Frequency
(If Currently
Eligible)
Redemption
Notice Period
Absolute return fixed income $ 68,946,948 $ - Daily Daily
Commingled funds-debt 69,568,930 - Twice monthly 15 days
Commingled funds-equities 137,463,716 - Monthly 5 Business days
International equity pool 89,619,731 - Daily Daily
International fixed income mutual funds 106,398,148 - Daily Daily
Real estate (REIT) fund 125,645,333 - Quarterly 90 days
Global asset pools 177,437,631 - Monthly 5 Business days
Private markets buyouts 78,438,909 82,160,678 Not eligible Not eligible
Private markets mezzanine 6,230,408 1,715,981 Not eligible Not eligible
Private markets secondaries 17,689,547 28,943,871 Not eligible Not eligible
Private markets distressed 25,823,368 35,005,000 Not eligible Not eligible
Private markets fund of funds 5,455,577 1,728,845 Not eligible Not eligible
Private markets energy 19,640,532 7,715,620 Not eligible Not eligible
Total at net asset value 928,358,778 $ 157,269,995
Investments measured at amortized cost
Money market pools 93,827,963
Aetna insurance pooled fixed income 21,384,914
Total Investments $ 2,008,689,715
Pension System Assets at Fair Value December 31, 2019
Pension System Net Asset Value Decmber 31, 2019
Anne Arundel County, Maryland Notes to the Financial Statements
65
Securities classified in Level 1 are valued using quoted prices in active markets for those securities. Securities classified in Level 2 and Level 3 are valued using methodologies such as various bid evaluations, market averages and other matrix pricing techniques as well as values derived from associated traded securities or last trade data. In instances where inputs used to measure fair value fall into different levels, the fair value is categorized based on the lowest level input that is significant to the valuation. Investments valued at the net asset value (NAV) per share, or its equivalent, have been classified separately in the table above and include investments considered to be Alternative Investments as defined by the American Institute of Certified Public Accountants. The definition includes investments for which a readily determinable fair value does not exist (that is, investments not listed on national exchanges or over-the-counter markets, or for which quoted market prices are not available from sources such as financial publications, the exchanges, or NASDAQ). These types of investments can be held within any of the asset classes used by the System based on underlying portfolio holdings and analysis of risk and return relations. These investments can be structured in different ways, including limited partnerships, limited liability companies, common trusts, and mutual funds. Some are closed-ended with a specific life and capital commitments while others are open-ended with opportunity for ad hoc contributions or withdrawals and termination with proper notice. Exposure to Derivatives – Derivative instruments are securities that derive value from another asset and are in the form of a contract between two or more parties. Common derivatives are futures contracts, forwards contracts, options, and swaps. The System has no direct exposure to derivative securities. There are however, mutual funds, commingled funds, and other investment vehicles in which the System has a percentage ownership that have exposure to futures, currency forward contracts, commodity forward contracts, and total return swap contracts. These funds enter into derivative contracts as part of their investment strategies to mitigate risk and volatility. A derivative policy statement is included in the Investment Policy Statement (IPS). Prohibited instruments include options, commodities, uncovered options or futures, uncovered short positions, short selling, and use of financial leverage. The derivative exposure as of December 31, 2018 within the mutual funds is comprised of allowable instruments based on the IPS. Commingled/Mutual Funds – These types of funds are open-ended funds and may be utilized in equity or fixed income asset classes. They are funds made up of underlying securities that have readily available fair values (publically traded stocks or bonds). The Retirement System owns units of these funds rather than the individual securities. Contributions or withdrawals from the funds can be made as needed, generally with daily or monthly liquidity, with a notice period of one to thirty days. There are no unfunded commitments for these types of investments, because they are liquid funds. Private Markets – Private Market investments are typically private interests in corporations across different areas of the capital structure and in different stages of the corporations’ development via limited partnership vehicles. Private Market investments are illiquid and long-term in nature (10-12 years), typically held until maturity. These portfolios generally have a “J-Curve Effect” whereby there are low to negative returns in the initial years due to the payment of investment management fees and initial funding of investments made by the General Partner during a period when investments are typically carried at cost and returns have not been realized. To diversify the program, investments are made across business cycles, vintage years, and different strategies. The Retirement Systems’ Investment Policy Statement has a dedicated asset class for Private Markets. There is no option to request redemptions from the Private Market funds.
Anne Arundel County, Maryland Notes to the Financial Statements
66
The schedule of fair market measurements for the Community College follows:
Quoted Prices in
Active Markets
for Identical
Assets
Significant
Other
Observable
Inputs
Significant
Unobservable
Inputs
Investment Type Fair Value Level 1 Level 2 Level 3
Retiree Health Benefits Trust Assets at Fair Value June 30, 2020
Total Fair Value
Net Asset Value
Anne Arundel County, Maryland Notes to the Financial Statements
67
4 Receivables
A Property Taxes Receivable - The County’s property tax is levied each July 1st based on values assessed and certified by the Maryland State Department of Assessments as of that date. Liens are placed on property at that time. A revaluation of each property is required to be completed every three years. For owner-occupied residential property, owners can choose to pay one payment due September 30th or two installments due on September 30th and December 31st. Property taxes are due from all other taxpayers on September 30th. Once the due date has passed, interest and penalties are charged each month on the unpaid balance. Property with delinquent taxes, are included in the tax sale each May or June. B State Income Taxes Receivable – Revenue from the income tax is derived from personal income from County residents like salaries and social security payments as well as income from capital gains, interest and some business income. Local income tax revenue is collected by The State and distributed to local governments throughout the year. The State’s distribution of the County’s share of income taxes lags behind the County’s fiscal year. Management estimates the amount of receivables for taxes earned in the fiscal year by analyzing the historical trends of distribution patterns and current year income tax activity. The estimated unavailable local income tax balance as of June 30, 2020 is $132,772,034. The local income tax rate for the reporting fiscal year is 2.81%. C Long-Term Receivables – The primary government has long-term receivables recorded in the Water and Wastewater Fund consisting of front foot benefit assessments, capital facility connection fees, and interest charges that vary from 1.6% to 8.0%. These receivables are collected over five to thirty years. The balance as of June 30, 2020 is $23,000,923.
5 Capital Assets
The components of capital assets, changes in asset categories, and accumulated depreciation for the fiscal year ended June 30, 2020 are presented as follows:
Anne Arundel County, Maryland Notes to the Financial Statements
68
Balance Balance
Category June 30, 2019 Increases Decreases June 30, 2020
Governmental activities:
Capital assets not being depreciated:
Land and easements $ 261,179,615 $ 15,453,806 $ - $ 276,633,421
Historical property/works of art 4,166,465 - - 4,166,465
Construction in progress 279,442,569 127,577,190 (60,679,811) 346,339,948
Total assets not depreciated 544,788,649 143,030,996 (60,679,811) 627,139,834
Capital assets being depreciated:
Land improvements 291,213,241 11,414,592 - 302,627,833
Buildings 324,947,360 2,288,933 - 327,236,293
Roads and bridges 400,916,033 4,567,986 (5,395,275) 400,088,744
Sidewalks, curbs, and gutters 53,784,669 988,696 (122,416) 54,650,949
Storm drains and culverts 378,384,326 12,099,489 (306,269) 390,177,546
Automobiles and rolling stock 126,709,069 18,952,062 (7,739,157) 137,921,974
Furniture, fixtures, and equipment 104,942,939 12,179,708 (2,783,413) 114,339,234
Automobiles and rolling stock (10,889) (5,327) - (16,216)
Furniture, fixtures, and equipment (1,580,706) (178,828) 211,075 (1,548,459)
Total accumulated depreciation (14,595,700) (2,348,130) 1,582,032 (15,361,798)
Total capital assets being depreciated, net 20,033,659 4,698,823 (1,723,192) 23,009,290
Total other non-major, net $ 20,033,659 $ 4,698,823 $ (1,723,192) $ 23,009,290
The County has established tax increment and special taxing districts to aid in development efforts within certain geographical areas. The proceeds of debt issued on behalf of the districts are primarily used for capital improvements. Expenditures related to the improvements are recorded in the County’s capital projects and are included as construction in progress until the projects are completed. The related assets are capitalized when developer construction agreements are finalized and the assets inspected. The assets are depreciated over their estimated useful lives. Certain items in construction in progress may be expensed once the projects close based on the final analysis of the capital projects closing. As a result, the amounts closed in construction in progress may be greater than the additions to capital assets. Depreciation expense has been included in the functional categories on the Statement of Activities based on the governmental department, business-type activity, or component unit responsible for the asset. The table that follows shows the depreciation expense for each functional category.
Public safety $ 12,278,512 Water and wastewater $ 51,676,312
General government 14,645,045 Waste collection 6,697,726
Health and human services 477,462 $ 58,374,038
Public works 24,101,510 Component units:
Recreation and community services 7,900,172 Board of Education $ 54,081,927
Judicial 1,418,512 Community College 6,533,048
Code enforcement 10,208 Library System 1,568,925
Land use and development 97,403 Economic Development Corp 50,998
$ 60,928,824 Tipton Airport Authority 672,790
Workforce Development 55,417
$ 62,963,105
6 Restricted Assets and Liabilities
The following funds are shown as restricted on the government-wide financial statements, Statement of Net Position: Impact Fees Capital Project, Forfeiture and Asset Seizure Team, Roads and Special Benefits District, Anne Arundel County Partnership for Children, Youth and Family, Reforestation, Laurel Racetrack, Video Lottery Local Impact Aid, Workforce Development, Arundel Community Development Services, Grants, Circuit Court, Erosion Districts, Watershed Protection and Restoration, Bond Premium, Park Place, Tax Increment Funds and Special Taxing Districts. In addition, fees collected by the Water and Wastewater Fund, including capital connections, front foot benefit assessments, and environmental protection fees are restricted for the payment of debt service incurred for the construction of capital facilities. Water and Wastewater Fund capital grants are restricted and the Solid Waste Fund includes restricted funds for the payment of closure and post-closure costs.
Anne Arundel County, Maryland Notes to the Financial Statements
71
7 Interfund and Intra-Entity Balances and Transfers The interfund balances of the primary government consist of the following as of June 30, 2020:
Interfund Balances of the Primary Government
Fund With Receivable Fund With Payable Amount Represents
General Fund Non-major Governmental Funds $ 864,699 Implicit borrowing from the General Fund
General Fund Grants Special Revenue Fund 5,411,991 Implicit borrowing from the General Fund
General Fund Water and Wastewater Fund 1,966,257 Implicit borrowing from the General Fund
General Fund Internal Service Funds 13,537,625 Self Insurance Fund surplus allocation
Non-major Enterprise Funds Internal Service Funds 3,890 Self Insurance Fund surplus allocation
Water and Wastewater Fund Internal Service Funds 573,331 Self Insurance Fund surplus allocation
Solid Waste Fund Internal Service Funds 101,797 Self Insurance Fund surplus allocation
Internal Service Funds Water and Wastewater Fund 659,050 Central Garage Fund deficit allocation
Internal Service Funds Solid Waste Fund 290,798 Central Garage Fund deficit allocation
Internal Service Funds General Fund 5,915,014 Central Garage Fund deficit allocation
$ 29,324,452
Interfund balances between the General Fund and internal service funds have been eliminated on the government-wide Statement of Net Position.
Transfers between the primary government’s governmental funds totaled $346,249,000 for fiscal year 2020. The transfers are for the following:
Originating Fund Recipient Fund Amount Purpose
General Fund Arundel Community Development Services $ 270,000 Transfers for grants
General Fund General County Capital Projects 185,195,000 Bond proceeds transferred for capital projects
General Fund General County Capital Projects 35,000,000 Pay-as-you-go transfers for capital projects
Impact Fees Capital Projects General County Capital Projects 22,190,894 Impact fee funding for capital projects
Odenton Town Center Tax Increment General County Capital Projects 1,212 Transfers for capital projects
Watershed Protection and Restoration General County Capital Projects 29,300,000 Transfers for capital projects
Bond Premium General County Capital Projects 27,938,190 Transfers for capital projects
Video Lottery Local Impact Aid General County Capital Projects 1,200,800 Transfers for capital projects
Street Light Capital Projects General County Capital Projects 423,496 Transfers for capital projects
General County Capital Projects Watershed Protection and Restoration 38,600 Investment income allocation retained
General County Capital Projects General Fund 352,844 Investment income allocation retained
Impact Fees Capital Projects General Fund 1,973,267 Impact fees transferred for debt service
Nursery Road Tax Increment General Fund 5,382,639 Transfers legally appropriated
West County Tax Increment General Fund 6,786,598 Transfers legally appropriated
Arundel Mills Tax Increment General Fund 8,227,351 Transfers legally appropriated
Parole Tax Increment General Fund 17,230,891 Transfers legally appropriated
National Business Park North TIF General Fund 1,641,180 Transfers legally appropriated
Village South at Waugh Chapel TIF General Fund 1,646,664 Transfers legally appropriated
General Fund Grants 705,183 Transfers for grants
General Fund Installment Purchase Agreements 741,700 Transfers for land preservation
Special Taxing Districts Erosion Districts 2,491 Transfers for project maintenance
$ 346,249,000
Grants General County Non-Major
Transfer Out General Fund Special Revenue Capital Projects Governmental Total
General Fund $ - $ 705,183 $ 220,195,000 $ 1,011,700 $ 221,911,883
Impact Fees Capital Projects 1,973,267 - 22,190,894 - 24,164,161
General County Capital Projects 352,844 - - 38,600 391,444
Total Transfers In $ 43,241,434 $ 705,183 $ 301,249,592 $ 1,052,791 $ 346,249,000
Transfers In
Anne Arundel County, Maryland Notes to the Financial Statements
72
Transfers between the primary government’s proprietary funds and governmental funds presented as follows, totaled $787,000 for fiscal year 2020. The transfers from the Water and Wastewater Fund and the Solid Waste Fund to the General County Capital Projects Fund are for an information technology project.
Interfund Transfers of the Primary Government
Originating Fund Recipient Fund Amount
Water and Wastewater Fund General County Capital Projects $ 628,000
Solid Waste Fund General County Capital Projects 159,000 $ 787,000
As of June 30, 2020, receivable and payable balances remained between the primary government and the
discretely presented component units. These balances and transactions are a result of the primary government’s ongoing funding of the component units’ capital and operating costs and a return of funding. Those balances and the payments from the primary government to or on behalf of these parties are presented as follows:
Receivables/Payables
Entity with Receivable Entity with Payable Amount
Board of Education Primary Government $ 31,068,934
Community College Primary Government 6,696,947
Other Non-major Primary Government 3,705,380
Primary Government Board of Education 9,734,718
$ 51,205,979
Primary Government Expenditures
Originating Entity Recipient Entity Amount
Primary Government Board of Education $ 857,185,558
Primary Government Community College 82,396,414
Primary Government Other Non-major 27,088,800
$ 966,670,772
8 Bonded Debt and Other Obligations
The primary government’s Statement of Net Position includes short and long-term debt and obligations comprised of bond anticipation notes, general obligation bonds, special assessment debt, installment purchase agreements, and liabilities related to State loans, unpaid insurance claims and claims and judgments. Descriptions of certain of these obligations and the respective balances, debt service requirements, and changes during fiscal year 2020 are provided as follows.
A Bond Anticipation Notes – The County periodically incurs short-term debt by issuing bond anticipation notes for the purchase of capital related assets. Upon refinancing, at the notes’ maturities, they will be marketed at then-current interest rates which is calculated at 80% of the one month LIBOR plus 40 basis points. This remarketing is backed for liquidity purposes by a letter of credit, the terms of which provide that no principal repayments are due if there is a call on the letter of credit, until the termination of the agreement. The maturity date of the current liquidity arrangement is December 14, 2020. The County has a credit amount available of up to $90 million, of which none is outstanding at June 30, 2020. The County is in the process of renewing the agreement with Bank of America effective December 14, 2020. B General County Debt – Substantially all long-term bonded debt is issued as general obligation bonds for the purchase of capital assets and guaranteed by the full faith and credit of the County, subject to guidelines set forth in Title10, Subtitle1, Section 4-10-104 of the County Charter, which addresses bonds and notes for capital improvements. The following table includes general obligation bonds which include amounts issued for the Watershed Protection and Restoration Fund, but excludes the tax increment bonds, installment purchase agreements, and state loans. These are listed separately. Business-type debt includes general obligation bonds issued for the
Anne Arundel County, Maryland Notes to the Financial Statements
73
Solid Waste Fund and Water and Wastewater Fund. The debt service requirements for the bonds outstanding as of June 30, 2020 are presented as follows:
C Tax Increment and Other Debt - As of June 30, 2020, there was $68,445,000 of Special Obligation Tax Increment Bonds payable from property tax revenue generated from assessment increases occurring since the formation of the tax increment districts. This debt is included in the primary government’s long-term debt on the Statements of Net Position. The County has pledged its full faith and credit for the following Special Obligation Tax Increment Bonds: Arundel Mills Refunding 2004, National Business Park Refunding 2004, West Nursery Road 2004, Arundel Mills Refunding 2014, National Business Park Refunding 2014, and West Nursery Road Refunding 2014. As of the June 30, 2020, the County has also pledged its full faith and credit for National Business Park North 2018 Refunding bonds and Village South at Waugh Chapel 2018 Refunding bonds. During the fiscal year ended June 30, 2020, $50,301,117 of incremental property tax revenue was collected and available for debt service purposes as reported on the Combining Statement of Revenues, Expenditures and Changes in Fund Balances for the Non-major Governmental Funds. Of this amount, $1,036,414 is related to Park Place which is not considered part of the County’s debt and $4,159,408 is related to Odenton Town Center TIF which does not have debt outstanding as of June 30, 2020. The table that follows outlines the debt service requirements for these bonds.
Year Ending Year Ending
June 30, Principal Interest June 30, Principal Interest
In addition, there were $2,530,000, $11,485,000, $30,000,000, and $22,500,000 of special tax district bonds related to the Farmington Village Project, the Villages of Dorchester, Two Rivers, and Arundel Gateway outstanding as of June 30, 2020, respectively. The proceeds of these bonds were used to finance infrastructure improvements within the special districts. These bonds are payable solely from the proceeds of a special tax levied on parcels within the districts and are not backed by the County’s full faith and credit. This debt does not appear on the Statement of Net Position. The County acts only as a fiduciary in collecting the taxes and servicing the debt. D State Loans – The County has interest free loans outstanding in the amount of $2,362,394 as of June 30, 2020. These loans were received from the State for waterway improvements. During fiscal year 2020, the County paid $221,263 for principal. The table that follows outlines the debt service requirements:
Anne Arundel County, Maryland Notes to the Financial Statements
74
Year Ending Year Ending
June 30, Principal June 30, Principal
2021 $ 221,263 2026-2030 944,576
2022 235,229 2031-2035 $ 254,114
2023 220,032 2036-2040 69,850
2024 201,680 2041 13,970
2025 201,680 $ 2,362,394
E Leases – The County has one outstanding lease agreement that qualifies as capital leases for accounting purposes. The agreement has resulted in a capital asset in the amount of $40,490 for an Avatar III robot for the Office of Emergency Management. The total principal payments due as of fiscal year-end are $20,245. The net present value of these minimum lease payments as of June 30, 2020 and the future minimum lease obligations were as follows:
Year ending Principle Interest Total
June 30, Lease Payments Lease Payments Lease Payments
2021 $ 10,123 $ 372 $ 10,494
2022 10,122 373 10,496
$ 20,245 $ 745 $ 20,990
The County has also entered into several operating lease arrangements for office space and equipment. All leases are cancelable at the option of the County. Many of the agreements contain renewal options, and some have rent escalation clauses. Minimum annual rental costs required by the leases are summarized as follows:
Year ending Annual Year ending Annual
June 30, Rentals June 30, Rentals
2021 $ 5,242,392 2026-2030 $ 16,299,364
2022 4,332,422 2031-2035 12,918,791
2023 3,731,121 2036-2040 2,107,712
2024 3,247,207 2041-2045 1,033,588
2025 2,971,595 2046-2050 222,594
$ 52,106,787
F Installment Purchase Agreements – The County has instituted an Installment Purchase Program to facilitate County purchases of real property easements to maintain farmland and other open space. Under this program, the County signs long-term debt agreements with property holders with a minimal down payment, typically $1,000. Interest and nominal principal payments are made over the life of the agreement, and a balloon payment is due at the end of the term to pay off the remaining principal balance. To pay the balloon payment, the County purchases and reserves a zero coupon U.S. Treasury Strip. This investment matures when the agreement expires and effectively earns the same interest rate that the County pays on the debt. The debt requirements as of June 30, 2020 are presented as follows:
Anne Arundel County, Maryland
Notes to the Financial Statements
75
Year Ending Year Ending
June 30, Principal Interest June 30, Principal Interest
G Year-end Balances, Debt Limitations, and Authorized Debt - A summary of the debt issues currently outstanding is provided as follows:
Dates Rates Original Issue Outstanding
Governmental activities:
General obligation bonds 2021-2050 1.50% to 5.55% $ 1,854,578,300 $ 1,384,648,193
Tax increment district bonds 2021-2041 1.50% to 5.00% 79,240,000 68,445,000
Installment purchase agreements 2021-2041 4.55% to 6.00% 13,819,916 13,485,000
Loans payable 2021-2041 0% 5,033,912 2,362,394
Total governmental activities 1,952,672,128 1,468,940,587
Business-type activities:
Water and wastewater serial bonds 2021-2050 1.00% to 5.55% 875,038,309 706,161,571
Solid waste serial bonds 2021-2050 2.00% to 5.55% 56,131,700 44,471,807
Total business-type activities 931,170,009 750,633,378
$ 2,883,842,137 $ 2,219,573,965
The County Charter authorizes the County Council to approve the issuance of general obligation bonds and to set limits on bonds issued through ordinance. Based on the effective ordinance, bonds (other than water and sewer) are limited at 5.2% of the assessable base of real property and 13.0% of the assessable base of personal property and certain operating real property of the County. In addition, general obligation water and water and wastewater bonds are limited at 5.6% of the assessable base of real property and 14.0% of the assessable base of personal property and certain operating real property within the County’s sanitary district. As of June 30, 2020, the legal debt limitations and margins are as follows:
General Bonds Water and Wastewater
(5.2%/13.0% Limitations) (5.6%/14.0% Limitations)
Charter imposed limitation 5,110,326,945$ 5,080,470,234$
Bonded debt outstanding
Installment purchase agreements 13,485,000 -
General obligation-serial bonds 1,289,037,403 706,161,571
General obligation-serial bonds, WPRF 95,610,790 -
General obligation-serial bonds, Solid Waste 44,471,807 -
Tax increment bonds 68,445,000 -
1,511,050,000 706,161,571
Legal debt margin 3,599,276,945$ 4,374,308,663$
As of June 30, 2020, the County had the total authority to issue bonds in the amount of $2,119,859,621 of which $767,620,300 has not been issued. Included in the amounts available to issue to date are $339,456,799 for general obligation water and wastewater series bonds, and $14,128,254 of general obligation bonds for the Solid Waste Fund. This unused authority will be used to fund existing capital projects and those appropriated through the budgetary process.
H Loans Payable – On July 25, 2012, the Anne Arundel Community College Foundation finalized an agreement between Anne Arundel County, Maryland (the issuer) and The Bank of New York (the Trustee) whereby
Anne Arundel County, Maryland
Notes to the Financial Statements
76
the Foundation refinanced $12,180,000 of the economic development revenue bonds. The proceeds of the loan were used to finance the cost of the construction of educational facilities. Principal payments began September 1, 2014, with the final principal payment being due on September 1, 2028. Interest on the bonds varies from 2.00% to 4.00%. The loan balance as of June 30, 2020 was $8,330,000. Scheduled principal payments due on the bonds payable for future years ending June 30 are shown as follows:
Year Ending Principal Year Ending Principal Year Ending Principal
June 30, Payments June 30, Payments June 30, Payments
2021 $ 810,000 2023 $ 875,000 2025 $ 925,000
2022 845,000 2024 895,000 2025-2029 3,980,000
$ 8,330,000
I Payables to State of Maryland – In the case of Comptroller v. Wynne, 135 S.Ct. 1787 (2015), the United States Supreme Court ruled in May 2015 that Maryland residents who paid income taxes to another state on income earned in the other state are entitled to a credit against the county portion of the Maryland income tax owed. The ruling means that each county in Maryland will experience a reduction in income tax revenue, including Anne Arundel County. The Comptroller’s Office estimates that the fiscal impact of the ruling on the County will be approximately $17,694,496 of refunds for prior years’ taxes, and an estimated reduction of $4,000,000 each year going forward. The estimated amount of refunds to be paid has been recorded as a non-current liability on the Statement of Net Position and an accrued liability in the General Fund. The refunds are initially paid to the taxpayer by the State of Maryland, with the County scheduled to begin reimbursing the State in May 2021 in the amount of $221,181 every quarter for the following twenty years.
J Changes in Debt and Obligations – The changes in the primary government’s long-term liabilities are presented as follows:
Balance Balance Due Within
June 30, 2019 Additions Reductions June 30, 2020 One Year
Total fund balances $ 228,002,807 $ (8,364,933) $ 94,800,741 $ 99,586,603 $ 92,789,928 $ 506,815,146
Encumbrances Encumbrance accounting is employed as part of the budgetary presentation for the General Fund,
special revenue funds, and capital projects funds. Encumbrances included in governmental fund balances are as
follows:
Anne Arundel County, Maryland
Notes to the Financial Statements
78
General Fund
Police $ 6,362,629
Fire 644,528
Detention Facilities 586,538
Chief Administrative Officer 54,366
Office of Budget 18
Office of Finance 135,895
Central Services 1,251,792
Personnel 207,377
Information Technology 1,556,494
Legislative Branch 61,667
Board of Election Supervisors 112,702
Transportation 185,563
Health 628,510
Services for the Aging 14,738
Public Works 2,464,010
Recreation & Parks 16,517
States Attorney 2,070
Sheriffs Office 64,731
Planning & Zoning 3,065
Inspection & Permits 6,534
Grants Fund 3,780,530
Arundel Community Development Services 9,058,073
Reforestation Fund 12,870
Watershed Protection and Restoration 2,831,766
General County Capital Projects Fund 68,964,060
Watershed Protection and Restoration Capital Projects Fund 31,032,125
Tax Increment Funds 325
Total $ 130,039,493
Encumbrance
Balances
Anne Arundel County, Maryland
Notes to the Financial Statements
79
10 Deferred Outflows and Inflows of Resources and Unearned Revenue
Governmental funds and proprietary funds report deferred outflows of resources which are related to net assets that are applicable to future reporting periods. The components of deferred outflows were reported as follows:
Governmental Water and Solid Business-Type Grand
Activities Wastewater Waste Child Care Totals Totals
* Included in Governmental Activities column above.
Contributions subsequent to
measurement date
Changes proportion share of
contribution
Contributions subsequent to
measurement date
Governmental Activities - Internal Service Funds * Component Units
Governmental funds report deferred inflows of resources in connection with receivables for revenues that are not considered to be available to liquidate liabilities of the current period. In addition, governmental funds and governmental activities defer revenue recognition in connection with resources that have been received, but unearned. At the end of the current fiscal year, the components of deferred inflows and unearned revenue were reported as follows:
Anne Arundel County, Maryland
Notes to the Financial Statements
80
Governmental Water and Solid Business-Type Grand
Activities Wastewater Waste Child Care Totals Totals
* Included in Governmental Activities column above.
Governmental Activities - Internal Service Funds * Component Units
11 Conduit Debt The County has issued Industrial Revenue Bonds to provide financial assistance to third parties for the acquisition or construction of facilities deemed to be in the public interest. The bonds are secured by the property financed and are payable solely from payments received on underlying mortgage loans. Upon repayment of the bonds, ownership of the facilities transfers to the private entity served by the bond issuance. As of June 30, 2020, 154 Industrial Revenue Bonds series had been issued. The aggregate principal amounts payable for the four series issued after July 1, 1996 that are still outstanding was $22,025,000. The aggregate principal amounts payable for the 150 issued prior to July 1, 1996, could not be determined; however, the original issues totaled $582,700,000. The County is not obligated in any manner for payment of the bonds. Accordingly, the bonds are not reported as liabilities in the accompanying financial statements.
12 Pension Plans
County employees participate in one of four single-employer defined benefit pension plans, which are in
separate trust funds and administered by the Anne Arundel County Retirement and Pension System (Retirement System). The Retirement System issues a separate financial report for these plans. A copy of this report can be obtained from Anne Arundel County on the Office of Personnel page of the County website at www.aacounty.org. Some County employees participate in two multi-employer cost sharing pension plans administered by the State of
Anne Arundel County, Maryland
Notes to the Financial Statements
81
Maryland. The County plans were established under authority created by County Charter and legislation, while the State plans were created by State legislation. The County’s actuarial valuation measurement date is December 31, 2018.
A Summary of Significant Accounting Policies for Pensions – For purposes of measuring the net pension liability, deferred outflows of resources and deferred inflows of resources related to pensions, and pension expense, information about the fiduciary net position of the County System and the Maryland State Retirement and Pension System and additions to/deductions from the System’s fiduciary net position have been determined on the same basis as they are reported by the respective Systems. For this purpose, benefit payments (including refunds of employee contributions) are recognized when due and payable in accordance with the benefit terms. Investments are reported at fair value.
B Single Employer Defined Benefit Pension Plans – The Retirement System administers the Anne Arundel County Employees' Retirement Plan (Employees Plan), Anne Arundel County Police Service Retirement Plan (Police Plan), Anne Arundel County Fire Service Retirement Plan (Fire Plan), and Anne Arundel County Detention Officers’ and Deputy Sheriffs’ Pension Plan (Detention Plan). Although the assets of the plans are commingled for investment purposes, each plan's assets must be used for the payment of benefits to the participants within that plan, in accordance with the terms of the plan. All benefit provisions are established by County legislation. Each of the plans provides for cost of living adjustments to annual benefit payments.
Membership in each plan consisted of the following as of December 31, 2019 based on the January 1, 2020,
actuarial valuation:
Police Fire Detention
Employees' Service Service Officers' and
Retirement Retirement Retirement Deputy Sheriffs'
Plan Plan Plan Plan Total
Retirees and beneficiaries receiving payments 2,051 758 626 295 3,730
Terminated Plan members entitled to but
not yet receiving payments 301 - - 6 307
Deferred Retirement Option (DROP) - 73 73 26 172
Active Plan members 2,170 713 779 354 4,016
Total 4,522 1,544 1,478 681 8,225
Employees Plan - Plan Description – The Employees’ Retirement Plan is a single-employer defined benefit
pension plan that covers all full-time general employees of the County who are not included in any other pension plan, as well as employees of Anne Arundel Economic Development Corporation. The Plan provides retirement, disability, and death benefits to Plan members and their beneficiaries pursuant to two separate benefit structures, Tier I and Tier II. Cost-of-living adjustments (COLAs) are also provided pursuant to County legislation.
Contributions – Contribution rates for participants are established through County legislation. Employees who elect to be in Tier I are required to contribute 4.0% of their annual covered salary. Tier II employees are not required nor permitted to make contributions.
Cliff Vesting – Participants hired on or before June 30, 2015 will be fully vested after their fifth year of
service. Termination prior to the fifth year will result in the return of all employee contributions, if applicable, plus 4.25% interest per annum with no additional benefits available. Participants hired on or after July 1, 2015 will be fully vested after their tenth year of service. Termination prior to the tenth year will result in the return of all employee contributions, if applicable, plus 4.25% interest per annum with no additional benefits available.
Police Plan - Plan Description – The Police Service Retirement Plan is a single-employer defined benefit pension plan that covers the following classes of workers: Police Officer, Police Officer Fist Class, Police Corporal, Police Sergeant, Police Lieutenant, Police Captain, Police Major, Deputy Police Chief (classified
Anne Arundel County, Maryland
Notes to the Financial Statements
82
position), and (by election) the Chief of Police and Deputy Police Chief (by election if exempt). The Plan provides retirement, disability, and death benefits to Plan members and their beneficiaries. COLAs are also provided pursuant to County legislation.
Contributions – Contribution rates for participants are established through County legislation. Plan
participants are required to contribute 7.25% of their basic rate of pay as a participant. The basic rate of pay is the rate of annual basic compensation (including longevity) with the County on the day specified, excluding overtime payments and other forms of additional compensation.
Normal Retirement – Participants hired on or after February 25, 2002 will be fully vested on the earlier of
their attainment of age 50 and completion of their fifth year of service, or their completion of 20 years of service. Participants hired before February 25, 2002 will be fully vested on the earlier of their attainment of age 50 or completion of 20 years of service. Termination prior to attainment of Normal Retirement will result in the return of all employee contributions, if applicable, plus 3.0% interest per annum with no additional benefits available.
Fire Plan - Plan Description – The Fire Service Retirement Plan is a single-employer defined benefit
pension plan that covers the following classes of workers: Fire Fighter II, Fire Fighter III, Fire Fighter Cardiac Rescue Technician, Fire Fighter/Emergency Medical Technician-Paramedic, Fire Lieutenant, Fire Captain, Fire Battalion Chief, Fire Division Chief, Fire Deputy Chief, and (by election) the Assistant Fire Chief and Fire Chief. The Plan provides retirement, disability, and death benefits to plan members and their beneficiaries. COLAs are also provided pursuant to County legislation.
Contributions – Contribution rates for participants are established through County legislation. Plan participants are required to contribute 7.25% of their annual covered salary.
Normal Retirement – Participants who retire on or after July 1, 2002 will be fully vested on the earlier of their attainment of age 50 and completion of their fifth year of service, or their completion of 20 years of service. Participants who retired prior to July 1, 2002 will be fully vested on the earlier of their attainment of age 50 and completion of 5 years of service. Termination prior to attainment of Normal Retirement will result in the return of all employee contributions, if applicable, plus 3.0% interest per annum with no additional benefits available.
Detention Plan - Plan Description – The Detention Officers’ and Deputy Sheriffs’ Retirement Plan is a
single-employer defined benefit pension plan that covers the following classes of workers: Detention Officer, Detention Corporal, Detention Sergeant, Detention Lieutenant Detention Captain, Correctional Program Specialist I, Correctional Program Specialist II, Criminal Justice Program Supervisor, Correctional Facility Administrator, Assistant Correctional Facility Administrator, Deputy Sheriff I, Deputy Sheriff II, Deputy Sheriff III, Deputy Sheriff IV, and (by election) the Superintendent of Detention Facilities. The plan provides retirement, disability, and death benefits to Plan members and their beneficiaries. COLAs are also provided pursuant to County legislation.
Contributions – Contribution rates for participants are established through County legislation. Plan
participants are required to contribute 6.75% of their annual covered salary.
Cliff Vesting – Participants will be fully vested on the attainment of age 50 and completion of their fifth year of service. Termination prior to attainment of Normal Retirement will result in the return of all employee contributions, if applicable, plus 4.25% interest per annum, with no additional benefits available.
Additional detail for determining benefit payments and eligibility for retirement can be found on the
County Connect Personnel Benefits web site under Pension System Information for all four plan.
C Multiple-Employer Pension Plans - Primary government employees hired prior to July 1, 1969 who elected not to transfer to the Employees Plan and substantially all employees of the Board of Education, Library and Community College participate in plans of the Maryland State Retirement and Pension System (the State System), which are multi-employer cost sharing defined benefit pension plans. The system plans provide retirement and disability benefits, annual cost-of-living adjustments, and death benefits to plan members and beneficiaries. The State System issues a financial report that includes financial statements and required supplementary information that can be obtained at http://www.sra.state.md.us or by writing to State Retirement Agency of Maryland, 120 East Baltimore Street, Baltimore, MD 21202.
Anne Arundel County, Maryland
Notes to the Financial Statements
83
The County is liable through fiscal year 2020 for employees who were participants in the State System when the County withdrew from the State System. In addition there are two active employees allowed to participate in the State System. Information on the State System follows: Plan description: Retirees and employees of the County are covered by the Maryland State Retirement and Pension System (the System), which is a cost sharing employer public employee retirement system. The State System is made up of two cost-sharing pools: the “State Pool” and the “Municipal Pool”. The Municipal Pool consists of the participating governmental units that elected to join the System. Neither pool shares in each other’s actuarial liabilities, thus participant governmental units that elect to join the State System share in the liabilities of the Municipal Pool only. The State System is comprised of the Teachers’ Retirement and Pension Systems, Employees’ Retirement and Pension System, State Police Retirement System, Judges’ Retirement System, and Law Enforcement Officers’ Pension System. Most of the County retirees and employees participate in the Employees’ System. The State System was established by the State Personnel and Pensions Article of the Annotated Code of Maryland to provide retirement allowances and other benefits to State employees, teachers, police, judges, legislators, and employees of participating governmental units. The Plans are administered by the State Retirement Agency.
Responsibility for the System’s administration and operation is vested in a 15-member Board of Trustees.
Benefits provided: The State System provides retirement allowances and other benefits to State employees of participating governmental units, among others. For individuals who become members of the Employees’ Retirement and Pension Systems on or before June 30, 2011, retirement/pension allowances are computed using both the highest three years Average Final Compensation (AFC) and the actual number of years of accumulated creditable service. For individuals who become members of the Employees’ Pension System on or after July 1, 2011, pension allowances are computed using both the highest five years AFC and the actual number of years of accumulated creditable service. Various retirement options are available under each system which ultimately determines how a retirees’ benefits allowance will be computed. Some of these options require actuarial reductions
based on the retirees’ and/or designated beneficiary’s attained age and similar actuarial factors.
A member of the Employees’ Retirement System is generally eligible for full retirement benefits upon the earlier of attaining age 60 or accumulating 30 years of creditable service regardless of age. The annual retirement allowance equals 1/55 (1.81%) of the member’s average final compensation (AFC) multiplied by the number of
years of accumulated creditable service.
A member of the Employees’ Pension System on or before June 30, 2011 is eligible for full retirement benefits upon the earlier of attaining age 62, with specified years of eligibility service, or accumulating 30 years of eligibility service regardless of age. An individual who becomes a member of the Employees’ Pension System on or after July 1, 2011, is eligible for full retirement benefits if the members’ combined age and eligibility service equals at least 90 years or if the member is at least age 65 and has accrued at least 10 years of eligibility service.
For most individuals who retired from the Employees’ Pension System on or before June 30, 2006, the annual pension allowance equals 1.2% of the members AFC, multiplied by the number of years of credible service accumulated prior to July 1, 1998, plus 1.4% of the members AFC, multiplied by the number of years of credible service accumulated subsequent to June 30, 1998. With certain exceptions, for individuals who are members of the Employees’ Pension System on or after July 1, 2006, the annual pension allowance equals 1.2% of the member’s AFC, multiplied by the number of years of credible service accumulated prior to July 1, 1998 plus 1.8% of the members AFC, multiplied by the number of years of credible service accumulated subsequent to June 30, 1998. Beginning in July 1, 2011, any new member of the Employees’ Pension System shall earn an annual pension allowance equal to 1.5% of the member’s AFC multiplied by the number of years of creditable service accumulated as a member of the Employees’ Pension System. Contributions: The County and covered members are required by State statute to contribute to the State System. Members of the Employees’ Pension System are required to contribute 7.0% annually. Members of the Employees’ Retirement System are required to contribute 5.0% to 7.0% annually, depending on the retirement option selected. The contribution requirements of the members, as well as the State and participating governmental employers are
established and may be amended by the Board of Trustees for the State System.
The County’s total required contribution during the year ended June 30, 2020 was $2,463,599. Of this amount, $2,366,721 was a final payment for the State withdrawal payoff, $26,015 was for County Officials
Anne Arundel County, Maryland
Notes to the Financial Statements
84
Retirement System and $70,863 was for Master Judges Retirement System. The rates varied from 0.0% for the actuarially determined contractual liability to 44.5% of covered payroll for the participant in the Judges Retirement System and 19.56% for the County Officials Retirement System. The County made its share of the required
contributions.
At June 30, 2020, the County reported a liability of $933,963 for its proportionate share of the net pension liability of the State System. The net pension liability was measured as of June 30, 2019 and the total pension liability used to calculate the net pension liability was determined by an actuarial valuation as of that date. The County’s proportion of the net pension liability was based on actual employer contributions billed to participating government units for the year ending June 30, 2019. The contributions were increased to adjust for differences between actuarial determined contributions and actual contributions by the State of Maryland. As of June 30, 2019,
the County’s proportionate share was 0.0045%, a decrease of .0001%.
Actuarial assumption: The total pension liability for the State System in the June 30, 2019 actuarial valuation was
determined using the following actuarial assumptions, applied to all periods included in the measurement:
Inflation 2.60% Salary increases 3.10% Investment rate of return 7.40%
Mortality rates were based on PUB-2010 Mortality Tables with projected generational improvements based on the MP-2018 fully generational mortality improvement scale.
The economic and demographic actuarial assumptions used in the June 30, 2019 valuation were adopted by the System’s Board of Trustees based upon review of the State System’s experience study for the period 2014-2018, after the completion of the June 30, 2018 valuations. Assumptions from the experience study including investment return, inflation, COLA increases, mortality rates, retirement rates, withdrawal rates, disability rates and rates of salary increase were adopted by the Board for the first use in the actuarial valuation as of June 30, 2019. As a result, an investment return assumption of 7.40% and an inflation assumption of 2.60% were used in the June 30, 2019 valuation.
The long term expected rate of return on pension plan investments was determined using a building block
method in which best-estimate ranges of expected future real rates of return (expected returns, net of pension plan investment expense and inflation) are developed for each major asset class. These ranges are combined to produce the long-range expected rate of return by weighting the expected future real rates by the target asset allocation percentage and by adding expected inflation. Best estimates of geometric real rates of return were adopted by the Board after considering input from the State System’s investment consultant(s) and actuary(s). For each major asset class that is included in the System’s target asset allocation, these best estimates are summarized in the following table:
Long Term Expected
Target Allocation Real Rate of Return
Public Equity 37% 6.30%
Private Equity 13% 7.50%
Rate Sensitive 19% 1.30%
Credit Opportunity 9% 3.90%
Real Assets 14% 4.50%
Absolute Return 8% 3.00%
Total 100%
Asset Class
Source- Maryland State Retirement and Pension System Comprehensive Annual
Finanicial Report For the Years Ended June 30, 2019 and 2018
The above was the System’s Board of Trustees adopted asset allocation policy and best estimate of geometric real rates for each major asset class as of June 30, 2019.
Anne Arundel County, Maryland
Notes to the Financial Statements
85
For the year ended June 30, 2019, the annual money-weighted rate of return on pension plan investments,
net of the pension plan expense was 6.46%. The money-weighted rate of return expresses investment performance, net of investment expense, adjusted for the changing amounts actually invested.
Discount rate: The single discount rate used to measure the total pension liability was 7.40%. This single discount rate was based on the expected rate of return on pension plan investments of 7.40%. The projection of cash flows used to determine this single discount rate assumed that plan member contributions will be made at the current contribution rate and that employer contributions will be made at rates equal to the difference between actuarially determined contribution rates and the member rate. Based on these assumptions, the pension plans fiduciary net position was projected to be available to make all projected future benefit payments of current plan members. Therefore, the long-term expected rate of return on pension plan investments was applied to all periods of projected benefit payments to determine the total pension liability.
D Funding Policy and Annual Pension Costs – The employee contribution requirements for each defined benefit plan in the Retirement System are set by County legislation. The County’s annual contribution is based on annual actuarial valuations. The Required Supplementary Information following these notes presents changes in net pension liability and related ratios by Plan. Certain participants in the State Retirement and Pension Systems (State plans) are required to contribute 2.0% to 7.0% of compensation to the plans. The County is required to contribute the remaining amounts necessary to fund the plans, except that the State pays the employer’s share of retirement costs on behalf of certain teachers, professional librarians, and related positions for the Board of Education, Library, and Community College, in accordance with State law. These amounts are shown as grant revenue and current expenses in the financial statements of these component units. County expenditures for those employees in the State plans for the years ended June 30, 2020, 2019, and 2018 equal the required contributions and are summarized as follows along with the State’s contribution on behalf on the employees discussed previously.
2020 2019
County contributions:
County $ 2,463,599 $ 2,347,006
Board of Education 7,277,312 6,396,136
Community College 281,859 297,703
State contributions on behalf of:
Board of Education 63,629,739 62,094,648
Community College 4,895,148 4,826,816
Library 1,628,249 1,565,477
$ 80,175,906 $ 77,527,786
Fiscal Year Ending June 30,
Anne Arundel County, Maryland
Notes to the Financial Statements
86
E Net Pension Liability of the System by Plan - The components of the net pension liability and assumptions for each Plan at December 31, 2019 as calculated by the actuary are displayed as follows:
Employees' Police Service Fire Service
Detention Officers'
and Deputy Sheriffs'
Retirement
Plan Retirement Plan Retirement Plan Retirement Plan
Plan fiduciary net position (690,383,355) (581,733,565) (575,886,891) (155,082,765)
Plan net pension liability $ 282,972,634 $ 177,834,947 $ 115,674,824 $ 58,151,099
Plan fiduciary net position
as a percentage of the total
pension liability 70.93% 76.59% 83.27% 72.73%
Note to schedule
Actuarial assumptions The total pension liability was determined by an actuarial valuation as of December 31,
2019 using the following summarized actuarial assumptions, applied to all periods in the
Inflation 3.00% 3.00% 3.00% 3.00%
Salary increases Rates vary by participant age for each Plan.
Investment rate of return 7.45%, net of pension plan investment expense, including inflation for each Plan.
Mortality Scale
Set forward for post-
disability mortality. 9 years 5 years 5 years 5 years
The above is a summary of key actuarial assumptions. Full descriptions of the actuarial assumptions are available in the
Actuarial Statement Section included in this Comprehensive Annual Financial Report.
Source is actuarial data based on preliminary financials. The difference between this
schedule and the final combining statement of changes in fiduciary net position on
Page 14, are considered immaterial.
measurement. Full descriptions of the actuarial assumptions are available in the January 1,
2019 valuation reports. The most recent Experience and Assumption Study was conducted
in 2018 for the period 2012 to 2016.
RP-2014 Blue Collar Mortality Table for males and females projected generationally
using scale MP-2018.
Long-Term Expected Returns - For investment purposes, the four County Plans which comprise the System are managed on a co-mingled basis. The long-term expected rates of investment return are the same for each Plan. The long-term (30 year) expected rate of return on pension System investments was determined using a building-block method in which best-estimate ranges of expected future real rates of return (expected returns, net of pension plan investment expense and inflation) are developed for each major asset class. These ranges are combined to produce the long-term expected rate of return by using an optimizer program that relies on the arithmetic return inputs, the standard deviation forecast (risk) for each asset class, and the correlations among them. The result is a 30-year nominal, geometric, net-of-fee return forecast for the pension assets. The 30-year real rate of return is calculated by netting the inflation assumption out of the nominal forecast. The nominal and real rates of return forecasts for each major asset class included in the pension System’s target asset allocation, as of December 31, 2019 are summarized in the following table. Data is provided by the System’s Investment Advisor, New England Pension Consultants, which uses a 30-year geometric inflation assumption of 2.75%.
Anne Arundel County, Maryland
Notes to the Financial Statements
87
30-Year Return Assumption by Asset Class
As of December 31, 2019
Asset Class (Nominal Returns) (Real Returns)
Cash 3.00% 0.24%
U.S. Treasuries 3.75% 0.97%
IG Corp Credit 5.75% 2.92%
Mortgage Backed Securities 3.75% 0.97%
Bank Loans 5.50% 2.68%
* Core Fixed Income 4.37% 1.57%
High-Yield Bonds 6.50% 3.65%
Absolute Return Fixed Income 4.75% 1.95%
Emerging Market Debt (External) 6.25% 3.41%
Emerging Market Debt (Local Currency) 6.75% 3.89%
Large Cap Equity 7.50% 4.62%
Small/Mid Cap Equity 7.75% 4.87%
International Equities (Unhedged) 7.75% 4.87%
Emerging Int'l Equities 9.25% 6.33%
Private Equity 11.15% 8.18%
Private Debt 8.11% 5.22%
Real Estate 6.25% 3.41%
Hedge Funds 6.76% 3.90%
Hedge Funds (Macro) 6.50% 3.65%
** Risk Parity 6.78% 3.92%
30-Year Geometric Forecast
Note: NEPC's 30-year geometric CPI inflation assumption is 2.75%. NEPC's 5-7 year geometric CPI inflation
assumption is 2.25%.
* Core Bonds assumption based on market weighted blend of components of Aggregate Index (Treasuries, IG
Corp Credit, and MBS).
** Risk Parity Allocation Modeled as 2.25% Global Macro Hedge Funds and the balance Bridgewater All
Weather (using NEPC manager specific assumptions for Bridgewater).
Discount Rate: The calculation of actuarial liabilities for valuation purposes is based on a current estimate of future benefit payments. The calculation includes a computation of the “present value” of those estimated future benefit payments using an assumed discount rate; the higher the discount rate assumption, the lower the estimated liability will be. For purposes of estimating the liabilities (future and accrued) in this report, an assumption was selected based on the expected long-term rate of return on plan investments. Using a lower discount rate assumption, such as a rate based on long-term bond yields, could substantially increase the estimated present value of future and accrued liabilities. The projection of cash flows used to determine this single discount rate assumed that plan member contributions will be made at the current contribution rate and that employer contributions will be made at rates equal to the difference between actuarially determined contribution rates and the member rate. Based on these assumptions, the pension plans fiduciary net position was projected to be available to make all projected future benefit payments of current plan members. Therefore, the long-term expected rate of return on pension plan investments was applied to all periods of projected benefit payments to determine the total pension liability.
Anne Arundel County, Maryland
Notes to the Financial Statements
88
F Changes in the Net Pension Liability by Plan for the Measurement Period December 31, 2019:
Total Pension Plan Fiduciary Net Pension
Employees' Plan Liability Net Position Liability
(a) (b) (a) - (b)
Balances at 12/31/18 $ 901,747,616 $ 620,586,567 $ 281,161,049
Changes for the year:
Service cost 16,343,802 - 16,343,802
Interest 65,128,435 - 65,128,435 Differences between expected and actual 12,546,231 - 12,546,231
Balances at 12/31/19 $ 691,561,715 $ 575,886,891 $ 115,674,824
Increase (Decrease)
Note: The source is actuarial data Based on preliminary financials. The differences between this schedule and the final combining
statement of changes in fiduciary net position are considered immaterial.
Total Pension Plan Fiduciary Net Pension
Detention Officers and Deputy Sheriffs' Plan Liability Net Position Liability
(a) (b) (a) - (b)
Balances at 12/31/18 $ 200,706,206 $ 134,908,267 $ 65,797,939
Changes for the year:
Service cost 4,146,785 - 4,146,785
Interest 14,631,903 - 14,631,903
Differences between expected and actual
experience 1,010,457 - 1,010,457
Changes of assumptions 1,348,161 - 1,348,161
Contributions - employer - 7,600,380 (7,600,380)
Contributions - member - 1,401,642 (1,401,642)
Net investment income - 19,917,617 (19,917,617)
Benefit payments, including refunds of
member contributions (8,609,648) (8,609,648) -
Administrative expense - (135,493) 135,493
Net Changes 12,527,658 20,174,498 (7,646,840)
Balances at 12/31/19 $ 213,233,864 $ 155,082,765 $ 58,151,099
Increase (Decrease)
Note: The source is actuarial data Based on preliminary financials. The differences between this schedule and the final combining statement
of changes in fiduciary net position are considered immaterial.
Sensitivity of the net pension liability to changes in the discount rate: The following schedule presents the net pension liability, calculated using the discount rate of 7.45%, as well as what the Plan’s net pension liability would be if it were calculated using a discount rate that is 1.0 percentage point lower (6.45%) or 1.0 percentage point higher (8.45%) that the current rate.
Anne Arundel County, Maryland
Notes to the Financial Statements
90
Employees' Police Service Fire Service
Detention Officers'
and Deputy
Sheriffs'
Retirement Plan Retirement Plan Retirement Plan Retirement Plan
Current Discount Rate 7.45% 282,972,634 177,834,947 115,674,824 58,151,099
1% Increase to 8.45% 189,930,038 100,037,960 44,249,266 37,832,961
Sensitivity of groups within the State System:
Withdrawn Group
* Officials Judges
Proportional Share of State System n/a 0.00120340% 0.00332480%
1% Decrease to 6.40% n/a $ 359,245 $ 992,573
Current Discount Rate 7.40% n/a 248,200 685,763
1% Increase to 8.40% n/a 155,714 430,229
* Note: The liability is a contractually fixed amount which will not change for the County's change in
proportion or for investment rate changes.
G Pension Expense and Deferred Outflows of Resources and Deferred Inflows of Resources Related to the
County Pension Plans – Recognized pension expenses and deferred outflows of resources, including amounts for the Anne Arundel County Public Library and Anne Arundel County Economic Development Corp., for the measurement date of December 31, 2019, are displayed by Plan in the following table.
The contributions subsequent to measurement date as listed above, will be recognized as a reduction in net pension liability in fiscal year ended June 30, 2021. Other amounts reported as deferred outflows of resources and deferred inflows of resources related to pensions will be recognized in pension expense and amortized over an additional four to five years as provided by the actuary as follows:
Employees' Police Service Fire Service
Detention Officers'
and Deputy
Sheriffs' Total Pension
Retirement Plan Retirement Plan Retirement Plan Retirement Plan System
Pension Expense and Deferred Outflows of Resources and Deferred Inflows of Resources Related to the County
portion of the Maryland State Retirement and Pension System – Recognized pension expenses and deferred outflows of resources for the measurement date of June 30, 2019 are displayed by Plan in the table below. Details for the entire State System can be obtained at http://www.sra.state.md.us.
County Portions of Maryland State Retirement and Pension System
Net pension liability - $ 685,763 $ 248,200 $ 933,963
Changes of assumptionsNet difference between projected and
actual earnings
Contributions subsequent to
measurement date
Total Deferred Activity
Subtotal of outflows
Differences between expected and actual
experience
Subtotal of inflows
Changes of assumptions
The contributions subsequent to measurement date as listed above will be recognized as a reduction in net pension liability in fiscal year ended June 30, 2021. Other amounts reported as deferred outflows of resources and deferred inflows of resources related to pensions will be recognized in pension expense as follows:
Anne Arundel County, Maryland
Notes to the Financial Statements
92
Year ended June 30: Master Judges Officials Total
2021 $ (3,697) $ (1,973) $ (5,670)
2022 (21,235) (7,998) (29,233)
2023 (11,236) (4,086) (15,322)
2024 (5,111) (1,850) (6,961)
The County and State pension plans reconciles to the Statement of Net position, as presented in the
following table:
Governmental Business-Type Economic Pension County & State
Activities * Totals Library Development Totals Pension Totals
H Payable to the County Pension System – At December 31, 2019, the System reported no payables.
I Commitments – The System has committed to fund various private markets investments totaling $390.2 million at December 31, 2019, of which approximately $157.3 million remains unfunded. The expected funding dates for these commitments extend through 2024.
J Teacher pension funding shift - Legislation enacted by the Maryland General Assembly during 2012 requires County Boards of Education to pay a portion of employer contributions for members of the Teachers’ Retirement System or the Teachers’ Pension System beginning in fiscal year 2013. Beginning in fiscal year 2017, each local Board pays the normal cost for their teachers in the Teachers’ Retirement System and the Teachers’ Pension System, which was $23,665,760. In fiscal year 2018, the Teachers’ Pension System appropriation was $23,665,762. In fiscal year 2019, the Teachers’ Pension System appropriation was $23,980,202. K Firemen’s Length of Service Award Program (LOSAP): The County instituted and began administering a single employer defined benefit length of service award program (LOSAP or the Plan), for volunteer firemen and ambulance personnel on May 1, 1975. Anne Arundel County Bill No 90-16 modified the methods and terms of the awards program. Summary of Significant Accounting Policies for LOSAP Pension Plan - LOSAP is included in the Fire Departments departmental financial statements and full accrual Governmental Activities section of the County financial statements. For purposes of measuring the pension liability related to pension and pension expense, benefit payments are recognized when due and payable in accordance with the benefit terms. This is an unfunded program, so there are no assets accumulated for this program. The County does not issue a separate financial statement for the LOSAP. General Information about the LOSAP Pension Plan:
Plan description: The Anne Arundel County Length of Service Award Program is a single-employer defined benefit retirement plan administered by Anne Arundel County, Maryland, which provides retirement and death benefits to volunteer fire and ambulance personnel serving the various independent volunteer fire companies in the County. Benefits provided: Under the LOSAP, participants become vested after 25 years of eligible service beginning at age 50. No benefit is paid if service is less than 25 years. Employees covered by benefit terms: A person who has served as an active member of a County or Annapolis City volunteer fire company is entitled to receive benefits under LOSAP if the person has satisfied the following requirements:
Anne Arundel County, Maryland Notes to the Financial Statements
94
Persons who are at least 50 years old and who have completed at least 25 years of active volunteer service with a County volunteer fire company or an Annapolis City volunteer fire company; or volunteer firefighters who have been determined by the Maryland Workmen’s Compensation Commission to have been permanently and totally disabled in the performance of duties as a volunteer firefighter.
Volunteer personnel who have qualified for benefits under the above provisions shall receive a monthly benefit payment according to the following payment schedule: 1. For members receiving benefits as of January 1, 2017, eligibility for an increase in benefits shall be determined based on earning active service credit in seven of the previous ten years (January 1, 2007 to December 31, 2016). If the member has not met this service requirement, the benefit will remain at $250 per month for life. 2. For members receiving benefits as of January 1, 2017 and have met the requirement for continued active service in seven of the previous ten years, benefits will be increased to the following:
- 25 to 34 years of active service, receive $300 per month for life; - 35 to 44 years of active service, receive $350 per month for life; - 45 or more years of active service, receive $400 per month for life.
3. Current beneficiaries who continue to earn active service credit shall be eligible for benefit increases as they obtain the next service milestone on the benefit scale. 4. Any new beneficiaries that become eligible for benefits shall receive a benefit payment in accordance with the above scale and shall be eligible for benefit increases as they obtain the next service milestone on the benefit scale.
The surviving spouse of a volunteer firefighter who, at the time of death, was receiving benefits under LOSAP is entitled to receive a surviving spouse benefit. The benefits shall be paid to the surviving spouse monthly until the death or remarriage of that spouse. As of January 1, 2017, all current spouse beneficiaries shall continue to receive the benefit as a rate of $150 per month. After January 1, 2017, any new spouse beneficiaries shall receive a benefit equal to 50.0% of the member benefit at the time of the member’s death.
The total pension liability was determined by an actuarial valuation as of December 31, 2019 using the
following actuarial assumptions:
Actuarial Assumptions:
Inflation Rate 3.00 %
Discount rate 2.75 % Salary increases Not applicable Mortality SOA RP-2014 Adjusted to 2006 Blue Collar Mortality with Scale MP-2018 Retirement First eligible Turnover Rates varying based on age and service Disability Rates varying based on age
Source: Index rate for 20-year, tax-exempt general obligation municipal bonds with an average rating of AA/Aa or higher.
Anne Arundel County, Maryland Notes to the Financial Statements
95
The following table details the changes in the net pension liability:
Increase (Decrease)
Total Pension
Liability (a)
$ 16,593,168
Service cost 493,546
Interest 619,030
Changes of benefit terms -
Differences between expected and
actual experience (274,865)
Change in assumptions 2,339,557
Employer contributions -
Benefit payments, including refunds of
member contributions (802,600)
Net Changes 2,374,668
$ 18,967,836
Balances at 1/1/19
Balances at 12/31/19
Changes for the year:
Changes in the Net Pension Liability
LOSAP Deferred Outflows of Resources and Deferred Inflows of Resources – Recognized LOSAP expenses and deferred outflows of resources for the measurement date of December 31, 2019 are displayed in the table below.
Volunteer
Fire
Personnel
LOSAP EXPENSE: $ (1,112,155)
DEFERRED OUTFLOWS OF RESOURCES:
$ 2,978,747
399,900
Subtotal of deferred outflows 3,378,647
DEFERRED INFLOWS OF RESOURCES:
(2,472,205)
(756,059)
Subtotal of deferred inflows (3,228,264)
$ 150,383
LOSAP liability * $ 18,967,836
* Current liability in the governmental fund is $799,780.
Changes of assumptions
Contributions subsequent to measurement date
Total Deferred Activity
Differences between expected and actual experience
Changes of assumptions
The contributions subsequent to measurement date as listed above will be recognized as a reduction in net LOSAP liability in fiscal year ended June 30, 2021. Other amounts reported as deferred outflows of resources and deferred inflows of resources related to LOSAP will be recognized in pension expense as follows:
Anne Arundel County, Maryland Notes to the Financial Statements
96
Year ended June 30: LOSAP
2021 $ (421)
2022 (421)
2023 (421)
2024 (421)
2025 (421)
Thereafter (247,412)
Sensitivity of the net pension liability to changes in the discount rate: The following presents the net pension liability of the County LOSAP, calculated using the discount rate of 2.75%, as well as what the County’s net pension liability would be if it were calculated using a discount rate that is 1 percentage-point lower (1.75%) or 1.0% percentage-point higher (3.75%) than the current rate:
Current
1% Discount 1%
Decrease Rate Increase
1.75% 2.75% 3.75%
County's Net Pension Liability $ 22,082,924 $ 18,967,836 $ 16,508,330
Source: Yield or index rate for 20-year, tax-exempt general obligation municipal bonds with an average rating of AA/Aa or higher (or equivalent quality on another rating scale). The following schedule presents the LOSAP participants at December 31, 2019:
Volunteers Survivors
Active Receiving Receiving
Participants Payment Payment
Number 481 199 71
Average Age 43.47 71.00 77.94
Total Annual Benefits $ 702,600 $ 128,400
Average Service 8.58
LOSAP Participant Summary at December 31, 2019
13 Other Post-employment Benefits
The County (which includes the County and Anne Arundel Economic Development Corporation), the Community College, and the Library participate in a single employer defined benefit healthcare plan for retirees. The assets of each participant (the County, Community College, and Library) are commingled for investment and payment of benefits, however each participant’s activity is tracked separately, and each participant receives a separate actuarial valuation. The following provides a summary of the plans’ descriptions and eligibility, funding policies and sources of authorization, annual cost and net obligations, and the actuarial methods and assumptions used in determining costs and liabilities. In addition, required supplementary information includes trend data about these plans. The Supplementary Information following these notes presents multi-year trend information about whether the actuarial value of each plan’s assets is increasing or decreasing relative to the actuarial accrued liability for benefits year to year over a four-year period.
Actuarial valuation of an ongoing plan involves estimates of the value of reported amounts and
assumptions about the probability of occurrence of events far into the future. Amounts determined regarding the funding status of the plan and the annual required contributions of the employer are subject to continual revisions as
Anne Arundel County, Maryland Notes to the Financial Statements
97
actual results are compared with past expectations and new estimates are made about the future. The total OPEB liability is based on January 1, 2019 valuation data for the County, College, and Library Plans with a roll forward of data to June 30, 2019. The Plan’s liability was rolled forward to the measurement date June 30, 2019. The methods, assumptions, plan provisions, and participant data used are detailed in the actuarial valuation report dated August 25, 2017 with the exception of the actuarial cost method. These calculations are based on the Entry Age Normal (EAN) cost method as required by GASB 74 and GASB 75. The EAN actuarial cost method requires a salary scale assumption. The Actuary used the salary scale assumption used to value Anne Arundel County’s pension plans. The calculation of the Actuarially Determined Contribution for the fiscal year ended June 30, 2020 is contained in the actuarial valuation report dated August 25, 2017. A Plan Description, Eligibility, Authorization, and Funding Policy - The primary government provides a group health plan for employees and retirees under the authority of § 6-1-308 of the County Code. This health plan may be extended to other component units under § 6-1-309 of the County Code. The Community College and the Library provide retiree health insurance through participation in the County’s health plans. Anne Arundel Economic Development, a component unit of the County, is a participant in the County plan. The County collects premiums from these entities to offset the related costs. The County Code requires the County to pay 80.0% of the health coverage cost for current County retirees and terminated vested employees that retired before July 1, 2014. Employees not eligible for normal or early retirement by January 1, 2017 will receive a subsidy based on years of service. The Library currently pays 80.0% for Library retirees. The primary government plan provides the same health plans to active employees and pre-age sixty-five retirees. The County offers a Medicare Advantage Plan to post age sixty-five retirees. The County offers the same prescription benefit for active employees and pre-age sixty-five retirees. Post age sixty-five retirees are eligible to participate in an Employer Group Waiver Plan (EGWP) plus WRAP for prescription benefits. County and Library retirees have the option of retaining dental and vision coverage, but must pay the full premium for these benefits. The Anne Arundel County Public school system offers a separate single employer defined OPEB plan, which is disclosed in its separately issued financial statements. Anne Arundel County Public Schools (AACPS) employees eligible to retire and receive Maryland State Retirement Agency (MSRA) benefits may be eligible for retiree healthcare benefits based on date of hire and service criteria. This is not part of the County plan. Employees hired prior to September 15, 2002 receive Board funding of 75.0% for Medical/Rx and dental benefits. For employees hired after September 15, 2002, ten years of AACPS service is required to be eligible for retiree health benefits. The Board funds a portion of the medical premium ranging from 25.0% with ten years of service to 75.0% with twenty or more years of service. No Board funding is provided for dental benefits. No Board funding is provided for vision coverage regardless of service date. Active employees and retirees have the same medical, dental, and vision plans while retirees over sixty-five have three Medicare Supplemental Plans available. The retiree and active prescription plan co-payments differ. The retiree plan is evaluated separately based on claims experience; however, a blended percentage increase has been applied to the retiree rates.
A Summary of the key elements of the AACPS Plan are disclosed below:
Net OPEB Liability
Deferred Outflows of
Resources
Deferred Outflows of
Resources
$ 1,859,904,000 $ 135,159,000 $ 859,685,000
The Community College (the College) provides medical, dental, and vision benefits to eligible retirees who are enrolled in medical coverage at the time of retirement. The benefit levels, employee contributions, and employer contributions are governed by and may be amended by the College Board of Trustees. Retirees are eligible for these benefits if they have a minimum of ten years of service and meet the eligibility requirement of their retirement plan, (Maryland State Retirement System or Optional plan). The College contributes to the cost of retirees’ benefits at a rate of 2.5% for each year of service, and employees must have at least ten years of service to qualify. The maximum paid by the College is 75.0%. Retirees have no vested rights to these benefits. A copy of the Anne Arundel Retiree Health Benefits Trust (OPEB Trust) financial statements may be obtained by contacting Anne Arundel County Office of Personnel, 2660 Riva Road, Annapolis, MD 21401.
Anne Arundel County, Maryland Notes to the Financial Statements
98
B Membership by Plan – Anne Arundel County retirees meeting certain criteria are eligible for medical insurance and prescription coverage in retirement. The College provides certain health care benefits to eligible retirees. The benefits provided, benefit levels, retiree contributions and employer contributions are governed by the College’s Board of Trustees and during the budgetary process. The Board of Trustees may amend or change the plan periodically. The Library, through its Health Benefits Pooling Agreement with the County, has agreed that its benefits and costs to the retirees will match the County Plan. The number of participants in the OPEB Trust as of January 1, 2019 follows. Data is based on actuarial valuations dated June 13, 2019.
County Plan College Plan Library Plan Total
Employees with medical coverage 3,823 700 195 4,718
Deferred vested termination 307 - - 307
Retirees 2,713 238 145 3,096
Total 6,843 938 340 8,121 C Funding Policy – Effective July 1, 2015, the County Council under Bill 13-15 established the Retiree Health Benefits Trust to include the primary government, the College and the Library. The Bill requires that the balance of Reserve Funds for Retiree Health Benefits on July 1, 2015 be transferred to the Trust. The Bill established a Board of Trustees to manage the Trust and designated the County Personnel Officer to administer the Trust. The County Executive will recommend annual appropriations to the Trust. The County Council will approve this request as is or may increase it during the County Annual Budget process. Previously, the County established under its Charter, a Reserve Fund for Retiree Health Benefits into which funds were appropriated for the sole purpose of funding retiree health benefits. This Reserve Fund has been closed and the funds transferred to the Trust Fund.
D Actuarial Methods and Assumptions – Projections of benefits for financial reporting purposes are based
on the substantive OPEB Trust (the Plan as understood by the employer and plan members) and include the types of benefits provided at the time of each valuation and the historical pattern of sharing of benefits costs between employers and plan members to that point. The actuarial methods and assumptions used include techniques that are designed to reduce short-term volatility in actuarial accrued liabilities and the actuarial value of assets, consistent with the long-term perspective of the calculations. The actuarial assumptions used in the latest valuation are as follows.
County Plan College Plan Library Plan
Actuarial Cost Method Entry Age Normal Entry Age Normal Entry Age Normal
Asset valuation Method Market value of Assets Market value of Assets Market value of Assets
Actuarial Assumptions
Discount Rate 6.75% 4.83% 3.13%
Long-term expected return
based on trust assets
Blended 6/30/2020 government bond
rate and long term expected rate of
return
6/30/2020 government bond
rate
Payroll Increase Pension Plan Assumptions Pension Plan Assumptions Pension Plan Assumptions
1) The health cost trend rate in 2019 is 54.1%. The rate in 2030 is 5.20%. The rate in 2050 is 4.90%
The rate in 2070 is 4.30%. The ultimate rate is 3.90%
2) The Plan's actual benefit payments may be greater or lesser than the amounts shown, depending on the Plan's actual
demographic experience, and claims experience.
3) The information above is from the actuarial valuation reports dated June 13, 2019 which used census valuation data as of
January 1,2019.
Schedule of Actuarial Methods and Assumptions
Mortality rates: Healthy uses SOA RPH-2014 adjusted to 2006 Blue Collar Headcount-Weighted Mortality; MP-2018 base year 2006 fully generational. Disabled - General County employees uses SOA RP-2014 adjusted to 2006
Anne Arundel County, Maryland Notes to the Financial Statements
99
Blue Collar Mortality with Scale MP-2018 (set forward 9 years). Disabled - Uniformed services employees (Police, Firefighters, and Correctional facilities) uses SOA RP-2014 adjusted to 2006 Blue Collar Mortality with Scale MP-2018 (set forward 5 years).
For purposes of measuring the net OPEB liability, deferred outflows of resources and deferred inflows of resources related to OPEB, and OPEB expense, information about the fiduciary net position of the Anne Arundel Retiree Health Benefits Trust (the Trust) and additions to/deductions from the Trust's fiduciary net position have been determined on the same basis as they are reported by the County. The measurement date for the current fiscal year-end was June 30, 2019. For this purpose, the Trust recognizes benefit payments when due and payable in accordance with the benefit terms. Investments are reported at fair value, except for money market investments and participating interest-earning investment contracts that have a maturity at the time of purchase of one year or less, which are reported at cost.
The following table details the changes in the net OPEB liability for the County Plan:
Total OPEB
Liability
(a)
Plan Fiduciary Net
Position
(b)
Net OPEB Liability
(a) - (b)
Balance as of June 30, 2018 for FYE 2019 $ 696,317,777 $ 135,837,275 $ 560,480,502
Balance as of June 30, 2019 for FYE 2020 $ 746,099,354 $ 181,032,424 $ 565,066,930
Change in Net OPEB Liability
County Employees
For the fiscal year ended June 30, 2020 Anne Arundel County General Employees, including Anne Arundel
Economic Development (AAEDC) recognized an OPEB expense of $53,002,650 and $127,002, respectively. Anne Arundel County General Employees and AAEDC, reported deferred outflows of resources and deferred inflows of resources related to the OPEB plan from the following sources:
Deferred Outflows Deferred Inflows
of Resources of Resources
Differences between expected and actual experience 19,874,422$ (589,543)$
Changes of assumptions - (421,102)
Net difference between projected and actual earnings
on OPEB plan investments - (10,559,223)
Employer contribution subsequent to measurement date 91,767,232 -
Total 111,641,654$ (11,569,868)$
Amounts reported as deferred outflows of resources and deferred inflows of resources related to the OPEB plan will be recognized in the expense as follows:
Anne Arundel County, Maryland Notes to the Financial Statements
100
Fiscal Year ended June 30:
2021 285,704$
2022 285,703
2023 1,702,310
2024 2,140,169
2025 3,890,668
The following table details the changes in the net OPEB liability for the College Plan:
Total OPEB
Liability
(a)
Plan Fiduciary Net
Position
(b)
Net OPEB Liability
(a) - (b)
Balance as of June 30, 2018 for FYE 2019 $ 47,227,928 $ 9,249,806 $ 37,978,122
Balance as of June 30, 2019 for FYE 2020 $ 78,467,225 $ 11,918,597 $ 66,548,628
Change in Net OPEB Liability
College Plan
For the fiscal year ended June 30, 2020 Anne Arundel Community College recognized an OPEB expense of $3,787,755. Anne Arundel Community College reported deferred outflows of resources and deferred inflows of resources related to the OPEB plan from the following sources:
Deferred Outflows Deferred Inflows
of Resources of Resources
Differences between expected and actual experience 1,121,268$ -$
Changes of assumptions 24,518,388 (21,556,590)
Net difference between projected and actual earnings (177,786)
on OPEB plan investments - -
Employer contribution subsequent to measurement date 2,066,000 -
Total 27,705,656$ (21,734,376)$
Amounts reported as deferred outflows of resources and deferred inflows of resources related to the OPEB plan will be recognized in the expense as follows:
Fiscal Year ended June 30:
2021 (74,078)$
2022 (74,076)
2023 18,681
2024 22,255
2025 17,642
Thereafter 3,994,856
Anne Arundel County, Maryland Notes to the Financial Statements
101
The following table details the changes in the net OPEB liability for the Library Plan:
Total OPEB
Liability
(a)
Plan Fiduciary Net
Position
(b)
Net OPEB Liability
(a) - (b)
Balance as of June 30, 2018 for FYE 2019 $ 24,837,684 $ 807,115 $ 24,030,569
Balance as of June 30, 2019 for FYE 2020 $ 42,866,576 $ 1,087,471 $ 41,779,105
Change in Net OPEB Liability
Library Plan
For the fiscal year ended June 30, 2020 Anne Arundel Public Library recognized an OPEB expense of
$2,537,174. Anne Arundel County Public Library reported deferred outflows of resources and deferred inflows of resources related to the OPEB plan from the following sources:
Deferred Outflows Deferred Inflows
of Resources of Resources
Differences between expected and actual experience 276,598$ -$
Changes of assumptions 13,762,607 (9,032,210)
Net difference between projected and actual earnings 8,513
on OPEB plan investments - -
Employer contribution subsequent to measurement date 1,866,053 -
Total 15,913,771$ (9,032,210)$
Amounts reported as deferred outflows of resources and deferred inflows of resources related to the OPEB plan will be recognized in the expense as follows:
Fiscal Year ended June 30:
2021 406,564$
2022 406,564
2023 411,923
2024 1,000,769
2025 2,789,688
Thereafter -
Anne Arundel County, Maryland Notes to the Financial Statements
102
E Net OPEB Liability of the Trust – The components of the net OPEB liability of the Plan, measured at June 30, 2019, for June 30, 2020 fiscal year-end are displayed on the following schedule.
Net OPEB Liability of the Trust
As of June 30, 2020
(in thousands)
County Plan
College
Plan
Library
Plan TOTAL
Total OPEB liability 746,099$ 78,467$ 42,867$ 867,433$
Plan fiduciary net position (181,032) (11,918) (1,088) (194,038)
Net OPEB liability 565,067$ 66,549$ 41,779$ 673,395$
Plan fiduciary net position as
a percentage of the total
OPEB liability 24.26% 15.19% 2.54%
Net OPEB liability:
Anne Arundel County Gov. 562,453$ -$ -$ 562,453$
Economic Development 2,614 - - 2,614
College Plan - 66,549 - 66,549
Library Plan - - 41,779 41,779
Net OPEB liability 565,067$ 66,549$ 41,779$ 673,395$
Actuarial assumptions The total OPEB liability was determined by an actuarial
valuation as of January 1, 2019, using the following actuarialassumptions, applied to all periods included in the measurement,
F Long-term expected real rate of return – The long-term expected rate of return on OPEB plan investments was determined using a building-block method in which best-estimate ranges of expected future real rates of return (expected returns, net of investment expense and inflation) are developed for each major asset class. These ranges are combined to produce the long-term expected rate of return by weighting the expected future real rates of return by the target asset allocation of 40 percent for fixed income and 60 percent for equity investments, and including the expected rate of inflation. Best estimates of arithmetic real rates of return for each major asset class included in the target asset allocation as of June 30, 2020 are summarized in the following table:
Anne Arundel County, Maryland Notes to the Financial Statements
103
Asset Class (Nominal Returns) (Real Returns)
Inflation (CPI) 2.40% --
Cash 1.79% -0.60%
Core Fixed Income(1)
2.62% 0.22%
Diversified Fixed Income(2)
4.53% 2.08%
Absolute Return Fixed Income(3)
3.52% 1.10%
Large Cap Equity 7.40% 4.88%
Small/Mid Cap Equity 7.60% 5.08%
International Equities (Unhedged) 7.60% 5.08%
Emerging Int'l Equities 9.50% 6.93%
Real Estate (Core) 5.70% 3.22%
Notes
NEPC's 30-year geometric CPI inflation assumption is 2.40%.
2019 30-Year Return Assumptions by Asset Class
(1) Core Bonds assumption based on market weighted blend of Bloomberg Barclays US Aggregate Bond Index
(Treasuries, IG Credit, MBS)
(2) Diversified Fixed Income assumption based on market weighted blend of Treasuries, Investment Grade
Corporate Credit, High Yield, Bank Loans, Emerging Market Debt, and Non-US Bonds
(3) Absolute Return Fixed Income assumption based on market weighted blend of US Leverage Cost, High Yield,
Emerging Market Debt, Non-US Bonds, Short Credit Fixed Income, and Hedge Funds - Macro
Policy allows use of mutual/commingled funds as investment vehicles. The following schedule displays
the asset allocation targets in the IPS.
Target
Allocation
Minimum
Allocation
Maximum
Allocation
Large Cap U.S. Equities 22% 17% 27%
Small/Mid Cap U.S. Equities 6% 0% 11%
International Equities- Developed Markets21% 16% 26%
Emerging International Equities 6% 0% 11%
Total Equity 55% 45% 65%
Core Fixed Income 15% 10% 20%
Diversified Fixed Income 20% 15% 25%
Absolute Return Fixed Income 5% 0% 10%
Total Fixed Income 40% 30% 50%
Real Estate (Core) 5% 0% 10%
Total Real Estate 5% 0% 10%
Asset Allocations by Investment Policy
G Discount rate – The discount rate used to determine the actuarial net liability varied by Plan. Based on assumptions of increasing contribution levels and normal costs for future hires, the County Plan is expected to never become insolvent. Consequently, the actuary determined the County’s liability using the expected rate of return on assets of 6.75 percent as the discount rate. The College’s liability uses the expected rate of return on assets of 4.83%. The Library’s liability uses the expected rate of return on assets of 3.13%.
Anne Arundel County, Maryland Notes to the Financial Statements
104
H Sensitivity of the net OPEB liability to changes in the discount rate – The following presents the net OPEB liability of each Plan based on the current discount rate, as well as what the liability would be if it were calculated using a rate that is 1.0% lower or 1.0% higher than the current discount rate as follows:
County Plan 5.75% 6.75% 7.75%
$ 688,281,051 $ 565,066,930 $ 467,027,807
College Plan 3.83% 4.83% 5.83%
$ 80,513,111 $ 66,548,628 $ 55,312,613
Library Plan 2.13% 3.13% 4.13%
$ 49,263,588 $ 41,779,105 $ 35,819,903
Discount Rate Sensitivity as of June 30, 2019
1.00% Decrease Current Rate 1.00% Increase
Net OPEB liability
I Sensitivity of the net OPEB liability to changes in the healthcare cost trend rate – The trend rate selected is based on an economic model developed by a health care economist for the Society of Actuaries. Future medical trend increases could vary significantly from the model. Model inputs will be updated periodically based on the best estimate of the economy at the time. Small changes in the model inputs can result in actuarial losses or gains of 5 to 15 percent of liabilities. The same trend rate is used for each Plan. The following presents the net OPEB liability for each Plan, as well as what the net OPEB liability would be if it were calculated using healthcare cost trend rates that are 1% lower or 1% higher than the current healthcare cost trend rates:
5.10%
County Plan $ 456,879,028 $ 565,066,930 $ 702,706,367
College Plan 53,426,433 66,548,628 83,582,623
Library Plan 35,195,731 41,779,105 50,227,496
3.10% 4.10%
Healthcare Trend Cost Sensitivity as of June 30, 2019
Net OPEB liability
1.00% Decrease Trend Rates 1.00% Increase
The schedules of funding progress, included as required supplementary information (RSI) following the notes to the financial statements, present multiyear trend information about whether the actuarial values of plan assets are increasing or decreasing over time relative to the AALs for benefits.
14 Risk Management The County retains the risk of loss for workers’ compensation and Directors and Officers coverage for the primary government, the Library, the Board of Education, and the Community College; general liability and vehicle liability coverage for the primary government, Library and the Board of Education; and health coverage for the primary government. The County purchases insurance coverage for real and personal property and money and security coverage, as well as school bus insurance for the bus contractors of the Board of Education. All insurance activities are recorded in the Self Insurance Fund, except for health activity, which is recorded in the Health Insurance Fund. The Self Insurance Fund has recognized a liability at fiscal year-end for those claims where a loss has occurred and the amount of loss can be reasonably estimated. This estimate includes reserves for non-incremental claims adjustment expense. An actuarial review of all claims is used as the basis for determining the liability at the end of the year. Management, with the assistance of claims administrators, estimates the liabilities for the Health Insurance Fund. Both funds include estimated liabilities for claims that have been incurred but not reported. Claims are reevaluated periodically to take into consideration recently settled claims, the frequency of claims, and other
Anne Arundel County, Maryland Notes to the Financial Statements
105
economic and social factors. As of June 30, 2020, the Self Insurance Fund liability of $71,126,333 is discounted, since discounting is more reflective of the nature of the claims. The Health Insurance Fund liability of $5,748,432 is undiscounted since claims will be paid within one year of the date incurred. Settlements have not exceeded coverage for each of the past three years. Changes in the balances of claims liabilities during fiscal years 2020 and 2019 were as follows:
2020 2019
Liability balance, July 1 $ 87,381,627 $ 83,182,953
Current year claims and changes in estimates:
Changes in estimates - prior periods 6,104,902 3,730,217
Changes in estimates - current year 97,156,456 99,419,571
Claims payments (113,768,220) (98,951,114)
Liability balance, June 30 $ 76,874,765 $ 87,381,627
15 Landfill Closure, Postclosure, and Remediation The primary government has utilized three landfill sites, however, only one site, the Millersville Landfill, is still accepting trash. The others, Glen Burnie and Sudley, ceased accepting solid waste in 1983 and 1993, respectively. The Millersville site consists of nine individual cells. Cells 1 through 7 are closed, cell 8 has stopped collecting solid waste and is 100.0% full. Closure for cell 8 will be competed in 2020. Cell 9 has opened and is 10.4% full. Cell 9 has a useful life to at least 2052. The table that follows presents the costs and liabilities related to all sites. The costs for cells 8 and 9 at the Millersville Landfill are determined by applying the percent of capacity used to the total estimated closure and post closure costs.
Millersville Closed Sites Total
Total costs:
Closure $ 60,140,819 $ 18,163,719 $ 78,304,538
Post closure 32,584,327 2,156,245 34,740,572
92,725,146 20,319,964 113,045,110
Less:
Amount recognized thru June 30, 2020 56,844,496 20,319,964 77,164,460
Costs remaining to be recognized $ 35,880,650 $ - $ 35,880,650
Current portion post closure 1,124,115 236,464 1,360,579
Post closure Long Term 16,544,927 1,919,781 18,464,708
$ 20,243,766 $ 2,156,245 $ 22,400,011
The primary government accounts for landfill activities in the Solid Waste Fund. Management estimates the costs of closure, post closure, remediation, and monitoring the landfills based on federal and state regulations. These estimates are recorded at current costs and are management’s best judgment of the minimum cost required to correct identified problems and close and remediate open cells. These estimates are subject to periodic reevaluation, and actual costs may differ due to inflation or deflation, changes in technology, or changes in applicable laws and regulations. The closure reserves increased in the amount of $703,588, as a result of Cell 9 closure costs through June 30, 2020 and post closure reserves decreased by $2,766,813 in fiscal year 2020. These amounts include changes to the estimates in the reserves, payments, and other adjustments. The Solid Waste Fund has restricted assets of $19,407,882 for closure and post closure care as of June 30, 2020.
Anne Arundel County, Maryland Notes to the Financial Statements
106
16 Tax Abatements
Anne Arundel County provides tax abatements through the following programs - Payment in Lieu of Taxes (PILOT), Brownfields Site property tax credits, Agricultural Land tax credits and Enterprise Zone tax credits. A PILOT - The purpose of the first type of County PILOT agreement is to provide quality multi-family housing communities for households of limited income in the County. Agreements are made with the County in negotiated amounts in lieu of County real property taxes per Tax Property Article § 7-506.1. For fiscal year 2020, the net amount of taxes abated after receipt of the PILOT payments was $686,903. The second type of County PILOT agreement is for economic development projects that demonstrate to the satisfaction of the Anne Arundel County Executive and County Council of Anne Arundel County that the project is an economic development project that provides a public benefit. Agreements are made with the County in negotiated amounts in lieu of County real or personal property tax per Tax Property Article § 7-520. For fiscal year 2020, the County had one of this type of PILOT agreement and the amount of the abatement of real and personal property taxes was $1,200,000. B Brownfields Site Tax Credit – The County provides a Brownfields Site tax credit on real property taxes levied on qualified brownfields sites as authorized by Tax Property Article § 9-229. The brownfields tax credit is effective for each of the five taxable years following the issuance of the notice of revaluation by the State Department of Assessments and Taxation after completion of a voluntary cleanup or a corrective action plan for a qualified site. For fiscal year 2020, the total amount of taxes abated for brownfields sites was $158,115.
C Agricultural Land Tax Credit – The County provides an agricultural land tax credit on real property taxes levied on agricultural land and woodland if the property is included in an agricultural preservation district as provided in the Agriculture Article § 2-509 of the State Code or a County agricultural district as provided in County Code and the landowner has agreed to remain in the district for at least ten years. For fiscal year 2020, the total amount of agricultural taxes abated was $618,144. D Enterprise Zone Tax Credit – The County provides enterprise zone tax incentives to businesses and property owners located in economically distressed communities. The Enterprise Zone tax credit from County real property taxes for eligible assessments of qualified properties is authorized per Tax Property Article § 9-103. For fiscal year 2020, there were no County participants in this program, therefore no taxes were abated. E The State of Maryland – The State of Maryland has programs that result in tax abatements for Anne Arundel County real property taxes. Per Tax Property Article § 8-209, property owners of qualified agricultural land receive a preferential land value. Land is assessed according to its current use and not according to its market value, resulting in a reduced assessed value of the land and thereby reducing the taxes. Lower assessments are given for land that is devoted to farm or woodland uses. For fiscal year 2020, there were 1,540 accounts totaling 46,501 acres receiving a preferential land value of $12,218,991. The exact amount of the tax abatement is unknown because the State Department of Assessments and Taxation is unable to provide the market value and can only provide the preferential land value.
Qualified country clubs and golf courses are assessed according to their preferred use value rather than their market value per Tax Property Article§§ 8-212 - 8-218. This lower assessment results in lower taxes. For fiscal year 2020, the difference between the preferred use value and the market value reduced the assessments by $15,909,353 resulting in an abatement of $148,752 in County real property taxes.
17 Contingent Liabilities A Impact Fees – At June 30, 2020, the primary government held impact fees accumulated for construction of schools and roads in designated districts of the County. County legislation authorizes the collection of such fees. In addition, the County has entered into impact fee agreements with developers who provide offsite improvements designed to lessen the impact of development on the immediate community. Unredeemed impact fee credits totaled $28,279,015 as of June 30, 2020. B Lawsuits – A taxpayer that owns and operates a major gaming facility seeks refunds of real property taxes paid for fiscal years 2013 through 2017 due to claimed fair market values below the assessed values upon which
Anne Arundel County, Maryland Notes to the Financial Statements
107
taxes were paid. The taxpayer claims it is entitled to tax refunds in the total amount of $2,850,888 in addition to interest from the dates of the various years’ payments totaling $1,452,234 for a total amount claimed of $4,303,122 as of October 31, 2020, with interest accruing at $14,254 per month thereafter. On December 26, 2017, the Maryland Tax Court ruled in favor of the taxpayer. The County noted an appeal to the Circuit Court for Anne Arundel County on December 29, 2017. On August 9, 2019, the Circuit Court ruled in favor of the taxpayer. The County noted an appeal to the Court of Special Appeals on September 5, 2019. The appeal is pending.
The County is a party to other legal proceedings that normally occur in governmental operations. Such proceedings include developer’s claims, property damage, employee liability, and workers compensation. These proceedings are not, in the opinion of the County Attorney, likely to have a material, adverse impact on the financial position of the County as a whole. Reserves for much of the losses alleged have been established in the Self-Insurance Fund.
C Federal Financial Assistance - The County receives significant financial assistance from the U.S. Government. Entitlement to the resources is generally conditioned upon compliance with terms and conditions of the grant agreements and applicable Federal regulations, including the expenditure of the resources for eligible purposes. Substantially all grants are subject to financial and compliance audits. Any disallowances as a result of these audits become a liability of the fund that received the grants. As of June 30, 2020, the County estimates that no material liabilities will result from such audits. D Payroll - In 2018, the Office of Personnel discovered that certain overtime wage calculations for certain County employees were performed incorrectly by the County’s payroll contractor in past years. The County has engaged financial professionals who are currently determining the amount of those miscalculations. An estimated liability of $3.0 million has been accrued and partial payments have been made.
Anne Arundel Retirement and Pension System
Required Supplementary Information
Schedule of Changes in the Net Pension Liability and Related Ratios - Employees' Retirement Plan
For Years Ended December 31
2019 2018 2017 2016 2015 2014
Total pension liability (Dollar amounts in thousands)
Expected average remaining service years of all participants 5 5 5 5 5 5
Notes to Schedule:
1 Source is actuarial data based on preliminary financials. The differences between this schedule and the final combining statement of changes in fiduciary net position
on page 14 are considered immaterial.
2 This schedule is presented to illustrate the requirement to show information for 10 years. However, until 10-year trend is compiled, pension plans should present
for those years for which data is available.
3 There are no benefit changes reflected in the current schedule.
4 For FY 2019, the expected rate of investment return was reduced from 7.5% to 7.45% and other assumptions were changed to reflect results of the 2018 experience study.
5 For FY 2014, the expected rate of investment return was reduced from 8.0% to 7.5%.
6 For FY 2019, Mortality tables were updated to the RP-2014 Blue Collar Mortality Table for males and females projected generationally using scale MP-2018.
108
Anne Arundel Retirement and Pension System
Required Supplementary Information
Schedule of Changes in Net Pension Liability and Related Ratios - Police Service Retirement Plan
For Years Ended December 31
2019 2018 2017 2016 2015 2014
Total pension liability (Dollar amounts in thousands)
Expected average remaining service years of all participants 4 4 4 4 4 4
Notes to Schedule:
1 Source is actuarial data based on preliminary financials. The differences between this schedule and the final combining statement of changes in fiduciary net position
on page 14 are considered immaterial.
2 This schedule is presented to illustrate the requirement to show information for 10 years. However, until 10-year trend is compiled, pension plans should present
information for those years for which data is available.
3 There are no benefit changes reflected in the current schedule.
4 For FY 2019, the expected rate of investment return was reduced from 7.5% to 7.45% and other assumptions were changed to reflect results of the 2018 experience study.
5 For FY 2014, the expected rate of investment return was reduced from 8.0% to 7.5%
6 For FY 2019, Mortality tables were updated to the RP-2014 Blue Collar Mortality Table for males and females projected generationally using scale MP-2018.
7 Covered payroll does not include pay for members in DROP.109
Anne Arundel Retirement and Pension System
Required Supplementary Information
Schedule of Changes in Net Pension Liability and Related Ratios - Fire Service Retirement Plan
For Years Ended December 31
2019 2018 2017 2016 2015 2014
Total pension liability (Dollar amounts in thousands)
Expected average remaining service years of all participants 6 6 6 6 5 5
Notes to Schedule:
1 Source is actuarial data based on preliminary financials. The differences between this schedule and the final combining statement of changes in fiduciary net position
on page 14 are considered immaterial.
2 This schedule is presented to illustrate the requirement to show information for 10 years. However, until 10-year trend is compiled, pension plans should present
information for those years for which data is available.
3 There are no benefit changes reflected in the current schedule.
4 For FY 2019, the expected rate of investment return was reduced from 7.5% to 7.45% and other assumptions were changed to reflect results of the 2018 experience study.
5 For FY 2014, the expected rate of investment return was reduced from 8.0% to 7.5%
6 For FY 2019, Mortality tables were updated to the RP-2014 Blue Collar Mortality Table for males and females projected generationally using scale MP-2018.
7 Covered Payroll does not include pay for members in DROP.110
Anne Arundel Retirement and Pension System
Required Supplementary Information
Schedule of Changes in Net Pension Liability and Related Ratios -Detention Officers and Deputy Sheriffs' Plan
For Years Ended December 31
2019 2018 2017 2016 2015 2014
Total pension liability (Dollar amounts in thousands)
Expected average remaining service years of all participants 3 3 3 3 4 4
Notes to Schedule:
1 Source is actuarial data based on preliminary financials. The differences between this schedule and the final combining statement of changes in fiduciary net position
on page 14 are considered immaterial.
2 This schedule is presented to illustrate the requirement to show information for 10 years. However, until 10-year trend is compiled, pension plans should present
for those years for which data is available.
3 For FY 2014, the expected rate of investment return was reduced from 8.0% to 7.5%.
4 For FY 2019, Mortality tables were updated to the RP-2014 Blue Collar Mortality Table for males and females projected generationally using scale MP-2018.
5 For FY 2014, the expected rate of investment return was reduced from 8.0% to 7.5%
6 FY2015 reflects the implementation of the DROP program, which was a change in benefit terms.
7 For FY 2019, Mortality tables were updated to the RP-2014 Blue Collar Mortality Table for males and females projected generationally using scale MP-2018.
8 Covered Payroll does not include pay for members in DROP.
111
2019 14.5 %
2018 (4.9) %
2017 15.7 %
2016 6.2 %
2015 (1.8) %
Note: Money-weighted results for the required ten year timeframe will be added as available.
Source: New England Pension Consultants, LLC
2019 6.4 %
2018 8.1 %
2017 10.0 %
2016 1.2 %
2015 2.7 %
Note: Money-weighted results for the required ten year timeframe will be added as available.
Source: Comprehensive Annual Financial Report of the Maryland State
Retirement Pension System.
Annual Money-Weighted Rate of Return
Net of Investment Expenses
For the Years Ended June 30
Maryland State Retirement and Pension System
Schedule of Investment Returns
Required Supplementary Information
Schedule of Investment Returns
Anne Arundel County Retirement and Pension System
For the Years Ended December 31
Annual Money-Weighted Rate of Return
Net of Investment Expenses
The investments for the Employees', Police Service, Fire Service and Detention Officers' and Deputy
Sheriffs' Retirement Plans are commingled. The annual money-weighted rate of return for all plans
Amortization method Level percentage of payroll, closed, increasing 3.0% per year.
Remaining amortization Periods range from 14 to 23 years. Starting with new bases in 2018, assumption changes and gains
and losses are amortized over 20 years and Plan changes are amortized over the average future service of the active
population at the time of the change.
Asset valuation method 5-year smoothed market.
Inflation 3.00%
Salary increases Rates vary by participant age.
Investment rate of return 7.45% Net of pension plan investment expense, including inflation.
Retirement age Rates vary by participant age and service.
Mortality RP-2014 Blue Collar Mortality Table for males and females projected generationally using scale MP-2018.
A five-year set forward is used for post-disability mortality.
Other Employer contributions for calendar 2010 are greater then 100.0% of the Actuarially Determined Contribution due to 6/30 fiscal
year revisions. Calendar 2011 was reduced for the revisions.
Source: Actuarial Section of the Anne Arundel County Retirement and Pension System Comprehensive Annual Financial Report for the Year Ended December 31, 2019.
1) Covered payroll for 2014 has been changed to reflect the new GASB language.
2) Methods and assumptions listed below are used by the actuary to determine contribution rates:
Anne Arundel County Retirement and Pension System
Required Supplementary Information
Schedule of Employer's Contributions - Police Service Retirement Plan
Amortization method Level percentage of payroll, closed, increasing 3.0% per year.
Remaining amortization Periods range from 14 to 23 years. Starting with new bases in 2014, assumption changes and gains
and losses are amortized over 20 years and Plan changes are amortized over the average future service of the active
population at the time of the change.
Asset valuation method 5-year smoothed market.
Inflation 3.00%
Salary increases Rates vary by participant age.
Investment rate of return 7.45% Net of pension plan investment expense, including inflation.
Retirement age Rates vary by participant age and service.
Mortality RP-2014 Blue Collar Mortality Table for males and females projected generationally using scale MP-2018.
A five-year set forward is used for post-disability mortality.
Other Employer contributions for calendar 2010 are greater then 100.0% of the Actuarially Determined Contribution due to 6/30 fiscal year
revisions. Calendar 2011 was reduced for the revisions.
Source: Actuarial Section of the Anne Arundel County Retirement and Pension System Comprehensive Annual Financial Report for the Year Ended December 31, 2018.
2) Methods and assumptions listed below are used by the actuary to determine contribution rates:
1) Covered payroll for 2014 has been changed to reflect the new GASB language.
Anne Arundel County Retirement and Pension System
Required Supplementary Information
Schedule of Employer's Contributions - Fire Service Retirement Plan
Amortization method Level percentage of payroll, closed, increasing 3.0% per year.
Remaining amortization Periods range from 3 to 23 years. Starting with new bases in 2014, assumption changes and gains
and losses are amortized over 20 years and Plan changes are amortized over the average future service of the active
population at the time of the change.
Asset valuation method 5-year smoothed market.
Inflation 3.00%
Salary increases Rates vary by participant age.
Investment rate of return 7.45% Net of pension plan investment expense, including inflation.
Retirement age Rates vary by participant age and service.
Mortality RP-2014 Blue Collar Mortality Table for males and females projected generationally using scale MP-2018.
A five-year set forward is used for post-disability mortality.
Other Employer contributions for calendar 2010 are greater then 100.0% of the Actuarially Determined Contribution due to 6/30 fiscal year
revisions. Calendar 2011 was reduced for the revisions.
Source: Actuarial Section of the Anne Arundel County Retirement and Pension System Comprehensive Annual Financial Report for the Year Ended December 31, 2018.
1) Covered payroll for 2014 has been changed to reflect the new GASB language.
2) Methods and assumptions listed below are used by the actuary to determine contribution rates:
Anne Arundel County Retirement and Pension System
Required Supplementary Information
Schedule of Employer's Contributions - Detention Officers' and Deputy Sheriffs' Retirement Plan
For the Last Ten Years Ended June 30
(Dollars in thousands)
116
Anne Arundel County Maryland
Required Suplementary Information
Schedule of County's Proportionate Share for Withdrawn Personnel of the Net Pension Liability Maryland State Retirement and Pension System
as of June 30 2019 2018 2017 2016 2015 2014
County's portion of the net pension liability n/a n/a n/a n/a n/a n/a
County's porportionate share of the net pension liability $ - $ 2,287,995 $ 4,317,356 $ 6,110,191 $ 7,686,917 $ 9,066,375
County's proportionate share of the net pension liability as a
percentage of its covered payroll 0.00% 0.24% 0.12% 0.09% 0.07% 0.06%
Plan fiduciary net position as a percentage of the total pension liability 72.34% 71.18% 69.38% 65.79% 68.78% 71.87%
Notes:
1 The liability is a contractually fixed amount which will not change for the proportional the group represents of the total.
2 This schedule is presented to illustrate the requirement to show information for ten years. Until ten-year
trend is compiled, pension plans should present information for those years for which the data is available.
3 There are no benefit changes reflected in the current schedule.
4 The County's annual contribution is determined by actuarially calculated 40-year contract established in 1980 to fund the liability for withdrawn participants.
117
Anne Arundel County Maryland
Required Suplementary Information
Schedule of County's Proportionate Share for Officials of the Net Pension Liability Maryland State Retirement and Pension System
as of June 30 2019 2018 2017 2016 2015 2014
County's portion of the net pension liability 0.0012034% 0.0012379% 0.0011945% 0.00111830% 0.00094790% 0.00077211%
County's porportionate share of the net pension liability $ 248,200 $ 259,731 $ 258,295 $ 263,850 $ 196,990 $ 137,025
Source: Comprehensive Annual Financial Report of the Maryland State Retirement and Pension System for the Years Ended June 30, 2019 and 2018.
Level percentage of payroll, closed.
Entry Age Normal.
1) Not a meaningful figure (NMF). The contribution is based on a contract with the State of Maryland for actuarial liability as of 1986, not on active employees.
2) The County's annual contribution is determined by an actuarially calculation based on a 40-year contract established to fund the liability for withdrawn participants.
3) All participants, except one, are retired, making the relation between the covered payroll and the contribution meaningless.
4) Methods and assumptions used to determine contribution rates:
Experince-based table of rates that are specific to the type of eligibility condition. Last updated for 2019 valuation pursuant to an
Public Sector 2010 Mortality Tables calibrated to MSRPS experience with generational projections using MP-2018 (2-dimesional) mortality improvement scale.
25 years for State System.
Five-year smoothed market (max. 120% amd min. 80% of the market value).
2.65% general, 3.15% wage.
Projected salary increases of 3.10% compounded annually, attributable to seniority and merit.
Five-year smoothed market (max. 120% amd min. 80% of the market value).
2.65% general, 3.15% wage.
Projected salary increases of 3.10% compounded annually, attributable to seniority and merit.
7.4%
Experince-based table of rates that are specific to the type of eligibility condition. Last updated for 2019 valuation pursuant to an
experience study of the 2014-2018 period.
Public Sector 2010 Mortality Tables calibrated to MSRPS experience with generational projections using MP-2018 (2-dimesional) mortality improvement scale.
Source: Comprehensive Annual Financial Report of the Maryland State Retirement and Pension System for the Years Ended June 30, 2019 and 2018.
1) Prior to fiscal year 2010, the contribution for Elected and Appointed Officials was made by the State. House Bill 101, effective fiscal 2010, transferred the liability
Anne Arundel County
Required Supplementary Information
2) Methods and assumptions used to determine contribution rates:
from the State to the County.
Schedule of County Contributions to State Municipal Pool Officials
Mortality Public Sector 2010 Mortality Tables calibrated to MSRPS experience with generational projections using MP-2018 (2-dimesional) mortality improvement scale.
Source: Comprehensive Annual Financial Report of the Maryland State Retirement and Pension System for the Years Ended June 30, 2019 and 2018.
1) The County's annual contribution is determined by an actuarially calculation of the County's liability.
2.65% general, 3.15% wage.
Projected salary increases of 3.10% compounded annually, attributable to seniority and merit.
7.4%
Experince-based table of rates that are specific to the type of eligibility condition. Last updated for 2019 valuation pursuant to an
experience study of the 2014-2018 period.
Level percentage of payroll, closed.
25 years for State System.
Five-year smoothed market (max. 120% amd min. 80% of the market value).
For the Last Ten Years Ended June 30
Schedule of County Contributions to State Municipal Pool Judges
Anne Arundel County
Required Supplementary Information
Entry Age Normal.
2) Methods and assumptions used to determine contribution rates:
122
Anne Arundel County Maryland
Retiree Health Benefits Trust
Required Supplementary Information
Schedule of Changes in Net OPEB Liability and Related Ratios - County Plan
For Years Ended June 30
Amounts in thousands
Measurement date 2021 2020 2019 2018
Plan fiscal year end 2020 2019 2018 2017
Total OPEB liability
Service cost $ 19,895 $ 18,452 $ 17,759 $ 17,092
Interest 49,423 43,578 41,434 39,648
Changes of benefit terms 40,100 - - -
Differences between expected and actual experience 440 23,849 (884) -
1Source is actuarial data based on preliminary financials. The difference between this schedule and the final
combined statement of changes in fiduciary net position on page 7 is considered immaterial.
2 This schedule is presented to illustrate the requirement to show information for 10-years. However, until
10-year trend is compiled, OPEB plans should present information for those years for which data is available.
3 The change in benefits is a result of pre age 65 subsidy being based on the selected plan instead of the lowest cost plan which was used in the past.
4 For the FY 2020 measurement, the medical trend was updated to exclude the impact of the Cadillac Tax.
5 Bill 24-19 was effective on July 5, 2019. Under the Bill, the pre age 65 subsidy is based on the plan selected instead of the lowest cost plan.
123
Anne Arundel County Maryland
Retiree Health Benefits Trust
Required Supplementary Information
Schedule of Changes in Net OPEB Liability and Related Ratios - College Plan
For Years Ended June 30
Amounts in thousands
Measurement date 2021 2020 2019 2018
Plan fiscal year end 2020 2019 2018 2017
Total OPEB liability
Service cost $ 3,257 $ 1,618 $ 3,083 $ 3,590
Interest 3,743 2,962 2,390 2,022
Changes of benefit terms - - - -
Differences between expected and actual experience 191 (1,082) (204) -
Changes of assumptions 21,568 27,583 (21,741) (6,971)
Benefit payments (2,096) (2,006) (1,685) (2,111)
Net change in total OPEB liability $ 26,663 $ 31,239 $ (17,749) $ (3,470)
Total OPEB liability - beginning 78,467 47,228 64,977 68,447
The Library Plan's net OPEB liability as a percentage
of Covered payroll 338.17% 303.08% 182.01% 268.51%
Discount Rate 2.45% 3.13% 6.37% 3.58%
Notes to Schedule:
1Source is actuarial data based on preliminary financials. The difference between this schedule and the final
combined statement of changes in fiduciary net position on page 7 is considered immaterial.
2 This schedule is presented to illustrate the requirement to show information for 10-years. However, until
10-year trend is compiled, OPEB plans should present information for those years for which data is available.
3 The change in benefits is a result of pre age 65 subsidy being based on the selected plan instead of the lowest cost plan which was used in the past.
4 For the FY 2020 measurement , the medical trend was updated to exclude the impact of the Cadillac Tax.
Contributions as a percentage of covered payroll 31.17% 23.03% 21.79% 17.37% 17.28% 16.52% 14.50% 0.00% 0.00% 0.00%
Notes to Schedule
Valuation date:
Actuarially determined contribution rates were calculated as of June 30, two years prior to the end of the fiscal year in which contributions are reported.
The report is dated June 13, 2019 for fiscal years 2019 and 2020 based on July 1, 2019 census data.
The components of the OPEB liability of the Trust at June 30,2020 based on actuarial valuations, are displayed on the following schedule.
Methods and assumptions used to determine contribution rates:
Actuarial cost methodProjected Unit Credit: Prorated to assumed benefit commencement/retirement date.
Amortization methodThe level percentage of payroll.
Amortization period21 years for FY 19.
Asset valuation methodMarket value of assets.
Inflation2.40%
Healthcare cost trend ratesThe rate in 2019 is 5.4 percent. The rates vary significantly throughout the projections. The rate in 2050 is 5.6 percent pre-Medicare and
4.9 percent post-Medicare. The ultimate 2081 rate is 4.1 percent pre-Medicare and 3.9 percent post-Medicare.
Payroll increases3.00%
Investment rate of return6.75% The long-term expected return on assets id used to derive the blended discount rate of 6.75 percent.
Decrement assumptionsThe retirement decrement is assumed to commence once a participant reaches earliest retirement eligibility.
Mortality(1) Healthy uses SOA RPH-2014 adjusted to 2006 Blue Collar Headcount-weighted Mortality: MP-2018 Base Year 2006 Fully
Generational.
(2) Disabled - General County employees uses SOA RP-2014 adjusted to 2006 Blue Collar Martality with Scale MP-2018 (set forward 9 years).
(3) Disabled - Uniformed services employees (Police, Firefighters, and Correctional facilities) uses SOA RP-2014 adjusted to 2006 Blue Collar Mortality
Contributions as a percentage of covered payroll 3.27% 6.48% 6.09% 2.21% 5.10% 0.00% 0.00% 0.00% 0.00% 0.00%
Notes to Schedule:
Valuation date
Actuarially determined contribution rates were calculated as of June 30, two years prior to the end of the fiscal year in which contributions are reported.
The report is dated June 13, 2019 for fiscal years 2018 and 2019 based on July 1, 2019 census data.
The components of the OPEB liability of the Trust at June 30,2020 based on actuarial valuations, are displayed on the following schedule.
Methods and assumptions used to determine contribution rates:
Actuarial cost methodProjected Unit Credit: Prorated to assumed benefit commencement/retirement date.
Amortization methodThe level percentage of payroll.
Amortization period21 years for FY 19.
Asset valuation methodMarket value of assets.
Inflation2.40%
Healthcare cost trend ratesThe rate in 2019 is 5.4 percent. The rates vary significantly throughout the projections. The rate in 2050 is 5.6 percent pre-
Medicare and 4.8 percent post-Medicare. The ultimate 2081 rate is 4.1 percent pre-Medicare and 3.9 percent post-Medicare.
Payroll increases3.00%
Investment rate of returnn/a
Decrement assumptionsDecrement assumptions for retirement, termination, and disability were based on those used for the State Retirement and Pension
System of Maryland because Community College employees participate in the Maryland State Pension System.
Mortality(1) Healthy uses SOA Public Sector – Teachers based on headcount – with Scale MP – 2018.
(2) Disabled uses RP 2014 Disabled Mortality Table (set forward 1 year for Males).
Contributions as a percentage of covered payroll 10.48% 8.28% 12.87% 9.22% 2.33% 0.00% 0.00% 0.00% 0.00% 0.00%
Notes to Schedule:
Valuation date
Actuarially determined contribution rates were calculated as of June 30, two years prior to the end of the fiscal year in which contributions are reported.
The report is dated June 13, 2019 for fiscal years 2018 and 2019 based on November 1, 2018 census data.
The components of the OPEB liability of the Trust at June 30,2020 based on actuarial valuations, are displayed on the following schedule.
Methods and assumptions used to determine contribution rates:
Actuarial cost methodProjected Unit Credit: Prorated to assumed benefit commencement/retirement date.
Amortization methodThe level percentage of payroll.
Amortization period21 years for FY 19.
Asset valuation methodMarket value of assets.
Inflation2.40%
Healthcare cost trend ratesThe rate in 2019 is 5.4 percent. The rates vary significantly throughout the projections. The rate in 2050 is 5.6 percent pre-
Medicare and 4.9 percent post-Medicare. The ultimate 2081 rate is 4.1 percent pre-Medicare and 3.9 percent post-Medicare.
Payroll increases3.00%
Investment rate of returnn/a
Decrement assumptions.The retirement decrement is assumed to commence once a participant reaches earliest retirement eligibility and vary by employee type.
Mortality (1) Healthy uses SOA RPH-2014 adjusted to 2006 Blue Collar Headcount- weighted Mortality: MP-2018 Base Year 2006 Fully Generational.
(2) Disabled uses SOA RP-2014 adjusted to 2006 Blue Collar Mortality with Scale MP-2018 (set forward 9 years).
128
Anne Arundel County Retiree Health Benefits Trust
Required Supplementary Information
Schedule of Investment Returns
For Year Ended June 30
2020 1.65%
2019 5.70%
2018 6.62%*
2017 12.94%*
* Percentage has changed due to calculation method.
Notes to this schedule
1 This schedule is presented to illustrate the requirement to show information for 10 years.
However, until the 10-year trend is compiled, OPEB plans should present information for those years.
2 Investments were initiated March 1, 2016.
3 Calculations are approximate.
Composite Money-Weighted Rate of Return, Net of Fees
129
2019 2018 2017 2016 2015 (1)
$ 494 $ 507 $ 689 $ 522
619 631 699 559
- - - 2,666
(275) (1,784) (1,057) -
2,340 (924) 1,236 -
(803) (790) (808) (707)
2,375 (2,360) 759 3,040
16,593 18,953 18,194 15,154
18,968 16,593 18,953 18,194
$ 18,968 $ 16,593 $ 18,953 $ 18,194
0.0% 0.0% 0.0% 0.0%
n/a n/a n/a n/a
n/a n/a n/a n/a
9 11 11 11
3) Benefit changes:
4) Changes of assumptions:
Net Change in total pension liability
1) Information for fiscal year 2015 and earlier not available.
Discount rate changed from 3.71% to 2.75% in 2019, from 3.31% to 3.71% in 2018 and from 3.78% to 3.31% in 2017.
Mortaility changed to SOA RP-2014 Mortality Table Adjusted to 2006 Blue Collar Mortality with Scale MP-2018 from SOA
RP-2014 Blue Collar Mortality Table projected from 2006 using scale MP-2015 and 1 year set forward.
Change in assumptions
Effective 1/1/2017, the benefit changed from $250/month to a tiered system based on service. The benefits for all future
retirees (and some current retirees) will be $300/month - $400/month. This benefit change has been reflected as of the
December 31, 2016 measurement date.
Notes:
Anne Arundel County Length of Service Award Program
Required Supplementary Information
Schedule of Changes in Net Pension Liability and Related Ratios
For the Last Ten Years Ended December 31
(Dollars in thousands)
Total pension liability
Service cost
Interest
Changes of benefit terms
Differences between expected and actual
experience
Benefit payments, including refunds of member
contributions
2) Theres are no assets accumulated in a trust to pay the related benefits. All benefits are paid on a pay-as -you-go basis.
Total pension liability - beginning
Total pension liability - ending
County's net pension liability
of the total pension liability
Covered payroll
County's net pension liability as a percentage
of covered payroll
Plan fiduciary net position as a percentage
Expected average remaining service years of all
participants
130
Combining Fund Statements,
Budgetary Schedules, and
Other Supporting Schedules
131
General Fund Budget Detail
The General Fund includes the budgets to pay for police and fire protection, maintain roads and plow the
snow, operate the detention centers, provide grants to community social service agencies and a host of other
activities, including the County’s contribution toward the operation of the County schools, community college and
library system. The revenue to support the general fund comes primarily from local property and income taxes.
General Fund - Detail Schedule of Revenues
General Fund - Detail Schedule of Appropriations, Expenditures, and Encumbrances
Separately budgeted General Fund component funds
County Parking Garage – This fund accounts for the operation of the County’s Whitmore Parking Garage located
near the Arundel Center. It was established based on an agreement with the State of Maryland. The County owns
the garage and the County and State pay for their respective spaces and share proportionately in any profit available
at the end of each fiscal year.
Piney Orchard Wastewater Service – In accordance with the County’s agreement with the operator of the Piney
Orchard Wastewater plant, this fund segregates 80% of the wastewater usage fees collected from the Piney Orchard
wastewater service area. These funds are then disbursed to the plant operator. The County maintains 20% of the
fees to offset administrative costs.
Inmate Benefit and Morale – This fund accumulates revenues designated for the benefit and morale of inmates at the
County’s two detention centers.
Impact Fees Capital Projects Fund Budget Detail
The Impact Fees Capital Projects Fund accounts for impact fees collected from developers to pay a share of
the cost of schools, road capacity improvements and public safety necessitated by development. Appropriations are
budgeted in the Impact Fees Capital Projects Fund to allow for transfer of funds to General County Capital Projects
as eligible expenditures are incurred and to reimburse the General Fund for debt service related to impact fee
projects.
Anne Arundel County, Maryland
Detail Schedule of Revenues - Estimated and Actual (Non-GAAP Basis)
General Fund
Year Ended June 30, 2020
Original Final Variance
Budget Budget Actual Positive (Negative)
GENERAL PROPERTY TAXES
Real and personal taxes $ 744,774,000 $ 744,774,000 $ 748,240,849 $ 3,466,849
Interest and penalties 2,295,000 2,295,000 2,142,242 (152,758)
747,069,000 747,069,000 750,383,091 3,314,091
LOCAL INCOME TAXES 564,999,600 564,999,600 606,998,155 41,998,555
STATE SHARED TAXES
Highway user 6,488,300 6,488,300 6,047,979 (440,321)
Total deferred inflow of resources - - - - 4,668,335
FUND BALANCES
Restricted 49,624 474 769,697 - 85,994,342
Committed - - - 12,311,853 17,747,932
Unassigned - - - - (10,952,346)
Total fund balances (deficit) 49,624 474 769,697 12,311,853 92,789,928
Total liabilities, deferred inflows
and fund balances $ 49,624 $ 474 $ 771,115 $ 12,311,853 $ 106,742,455
Debt Service Funds
144
145
(This page left blank intentionally)
Anne Arundel County, Maryland
Combining Statement of Revenues, Expenditures and Changes in Fund Balances
Non-major Governmental Funds
Year Ended June 30, 2020
AA County LaurelForfeiture Road and Partnership Racetrackand Asset Special Benefits for CYF Community
Seizure Team Districts (Grants) Reforestation BenefitREVENUES
General property taxes $ - $ - $ - $ - $ - Grants and aid - - 2,856,548 - - Seized / forfeited funds 372,254 - - - - Special community benefit taxes - 7,843,279 - - - Video lottery local impact aid - - - - - Watershed protection and restoration - - - - - Fees and commissions - - - 947,755 357,143 Investment income 600 - 4,192 131,732 - Other 4,162 - 5,875 - -
Total revenues 377,016 7,843,279 2,866,615 1,079,487 357,143
EXPENDITURESCurrent
Education - - - - - Public safety 545,826 - - - - General government - - - - - Health and human services - - 3,051,928 - - Public works - - - - - Recreation and community services - 7,744,950 - - 246,500 Judicial - - - - - Code enforcement - - - - - Land use and development - - - 991,912 -
Debt serviceInterest payments on debt - - - - - Principal payments on debt - - - - -
Total expenditures 545,826 7,744,950 3,051,928 991,912 246,500
Revenues over (under) expenditures (168,810) 98,329 (185,313) 87,575 110,643
OTHER FINANCING SOURCES (USES)Transfers in
General Fund - - - - -
General County Capital Projects Fund - - - - -
Special Taxing Districts Fund - - - - - Transfers out
General Fund - - - - -
General County Capital Projects Fund - - - - -
Erosion Districts Fund - - - - -
General obligation bonds issued - - - - -
Premiums from sale of bonds - - - - -
Total other financing sources (uses) - - - - -
Net change in fund balances (168,810) 98,329 (185,313) 87,575 110,643
Fund balances, July 1 169,442 560,252 (329,846) 3,740,710 58,766
Fund balances, June 30 $ 632 $ 658,581 $ (515,159) $ 3,828,285 $ 169,409
Special Revenue Funds
146
ArundelCommunity
Workforce Development OdentonDevelopment Services Circuit Park Place Town Center
Combining Statement of Revenues, Expenditures and Changes in Fund Balances (continued)
Non-major Governmental Funds
Year Ended June 30, 2020
Video Lottery WatershedErosion Local Impact Protection and Recreation BondDistricts Aid Restoration Land Fees Premium
REVENUESGeneral property taxes $ - $ - $ - $ - $ - Grants and aid - - - - - Seized / forfeited funds - - - - - Special community benefit taxes 599,353 - - - - Video lottery local impact aid - 15,744,920 - - - Watershed protection and restoration - - 23,326,588 - - Fees and commissions - - - 15,000 - Investment income - 11,405 804,190 4,555 - Other - 1,804 6,025 - -
Total revenues 599,353 15,758,129 24,136,803 19,555 -
EXPENDITURESCurrent
Education - 1,700,000 - - - Public safety - 8,648,000 - - - General government - 6,695,000 - - - Health and human services - - - - - Public works 172,151 - 10,830,327 - - Recreation and community services - 550,000 - - - Judicial - - - - - Code enforcement - - 1,279,562 - - Land use and development - - - - -
Debt service Interest payments on debt - - 3,540,701 - - Principal payments on debt - - 3,387,418 - -
Total expenditures 172,151 17,593,000 19,038,008 - -
Revenues over (under) expenditures 427,202 (1,834,871) 5,098,795 19,555 -
OTHER FINANCING SOURCES (USES)Transfers in
General Fund - - - - -
General County Capital Projects Fund - - 38,600 - -
Special Taxing Districts Fund 2,491 - - - - Transfers out
General Fund - - - - -
General County Capital Projects Fund - (1,200,800) (29,300,000) - (27,938,190)
Erosion Districts Fund - - - - -
General obligation bonds issued - - 29,300,000 - -
Premiums from sale of bonds - - - - 27,938,190
Total other financing sources (uses) 2,491 (1,200,800) 38,600 - -
Net change in fund balances 429,693 (3,035,671) 5,137,395 19,555 -
Fund balances, July 1 1,654,863 5,315,988 38,753,987 266,967 -
Fund balances, June 30 $ 2,084,556 $ 2,280,317 $ 43,891,382 $ 286,522 $ -
Special Revenue Funds Capital Projects Funds
148
Bike, Pedestrian, Street Light Energy Transportation & West County
Capital Revolving Infrastructure Nursery Road (NBP) Arundel Mills ParoleProjects Loan Fee In Lieu Tax Increment Tax Increment Tax Increment Tax Increment
Combining Statement of Revenues, Expenditures and Changes in Fund Balances (continued)
Non-major Governmental Funds
Year Ended June 30, 2020
NationalBusiness Village South at Installment
Park North Waugh Chapel Special Taxing Purchase Tax Increment Tax Increment Districts Agreements Totals
REVENUESGeneral property taxes $ 1,890,712 $ 2,568,554 $ - $ - $ 50,301,117 Grants and aid - - - - 10,424,509 Seized / forfeited funds - - - - 372,254 Special community benefit taxes - - 350,868 - 8,793,500 Video lottery local impact aid - - - - 15,744,920 Watershed protection and restoration - - - - 23,326,588 Fees and commissions - - - - 1,626,627 Investment income 22,766 24,227 - 1,707,112 3,483,139 Other - - - - 180,291
Total revenues 1,913,478 2,592,781 350,868 1,707,112 114,252,945
EXPENDITURESCurrent
Education - - - - 1,700,000 Public safety - - - - 9,193,826 General government 17,607 17,497 - - 7,813,030 Health and human services - - - - 5,184,089 Public works - - - - 11,002,478 Recreation and community services - - 76,154 - 15,385,958 Judicial - - - - 18,412 Code enforcement - - - - 1,279,562 Land use and development - - - - 991,912
Debt serviceInterest payments on debt 1,022,313 512,031 - 721,608 7,011,128 Principal payments on debt 450,000 440,000 221,263 20,000 6,793,681
Total expenditures 1,489,920 969,528 297,417 741,608 66,374,076
Revenues over (under) expenditures 423,558 1,623,253 53,451 965,504 47,878,869
OTHER FINANCING SOURCES (USES)Transfers in
General Fund - - - 741,700 1,011,700
General County Capital Projects Fund - - - - 38,600
Special Taxing Districts Fund - - - - 2,491 Transfers out
General Fund (1,641,180) (1,646,664) - - (40,915,323)
General County Capital Projects Fund - - - - (58,863,698)
Erosion Districts Fund - - (2,491) - (2,491)
General obligation bonds issued - - - - 29,300,000
Premiums from sale of bonds - - - - 27,938,190
Total other financing sources (uses) (1,641,180) (1,646,664) (2,491) 741,700 (41,490,531)
Net change in fund balances (1,217,622) (23,411) 50,960 1,707,204 6,388,338
Fund balances, July 1 1,267,246 23,885 718,737 10,604,649 86,401,590
Fund balances, June 30 $ 49,624 $ 474 $ 769,697 $ 12,311,853 $ 92,789,928
Debt Service Funds
150
Anne Arundel County, Maryland
Schedule of Revenue, Expenditures, and Changes in Fund Balances - Budget and Actual (Non-GAAP Basis)
Bonded debt subject to (1) 5.6% of the assessable basis of real property in the Sanitary District of Anne Arundel County; (2) 14.0% of the assesable basis of
personal property in the Sanitary District of Anne Arundel County; and (3) 14% of the operating real property described in section 8-109(c) of the Tax-
Property Article of he Annotated Code of Maryland (1994 replacement Volume and 2000 Supplement).
General Government Solid Waste
General County Bonds (a)
WPRF Tax Increment
Bonded Debt subject to (1) 5.2% of the assessable basis of real property; (2) 13.0% of the County's assessable basis of personal property; and (3) 13% of
Subtotal governmental activities net position (529,055,886) (557,844,057) (500,752,884) (497,001,970) (493,646,644) (417,756,980) (29,603,407) (950,442) 63,966,532 104,459,252
Business-type activities
Net investment in capital assets 1,008,501,766 1,019,533,158 1,013,711,148 988,443,984 939,311,650 934,898,545 937,308,613 892,816,991 853,676,904 822,218,634
Subtotal business-type activities net position 1,337,475,884 1,329,654,090 1,331,793,442 1,319,371,242 1,296,309,570 1,273,335,931 1,249,315,346 1,179,309,152 1,128,505,594 1,068,505,699
Primary government
Net investment in capital assets 1,644,067,513 1,623,617,423 1,610,221,613 1,594,782,954 1,495,503,581 1,513,750,718 1,559,714,531 1,523,782,081 1,487,495,446 1,444,456,838
Total primary government net (expense)/revenue (1,559,119) (1,570,212) (1,429,630) (1,337,298) (1,375,002) (1,189,926) (1,178,330) (1,197,665) (1,138,244) (1,170,755)
212
Anne Arundel County, Maryland
Changes in Net Position, Last Ten Fiscal Years
(accrual basis of accounting)
(in thousands of dollars)
2020 2019 2018 2017 2016 2015 2014 2013 2012 2011
General Revenues and Other Changes in Net Position
Total all other governmental funds $ 278,812,339 $ 273,277,246 $ 293,939,885 $ 290,594,162 $ 272,936,680 $ 304,327,415 $ 202,245,649 $ 131,853,311 $ 125,054,146 $ 137,905,925
Note: In fiscal year 2011 the primary government implemented GASB Statement No. 54 Fund Balance Reporting and Governmental Fund Type Definitions. This statement redefined how the
fund balances of the governmental funds are presented in the financial statements.
Taxable Assessed Value and Estimated Actual Value of PropertyLast Ten Fiscal Years
(in thousands of dollars)
Assessed
Total Taxable Weighted Estimated Value as a
Fiscal Year Residential Commercial Agricultural Use Value Total Real Railroad/Utility Other Business Total Personal Assessed Average Actual Percentage of
Ended June 30, Property Property Property Property Property Property Property Property Value Tax Rate Value Actual Value
(a) See the Demographic and Economic Statistics schedule for personal income and population data. These ratios are calculated using personal income for the prior calendar year.
(b) Bonds have been adjusted for the unamortized premium.
Business-Type ActivitiesGovernmental Activities
222
Anne Arundel County, Maryland
Ratios of General Bonded Debt OutstandingLast Ten Fiscal Years
(in thousands of dollars, except per capita)
Percentage of
Net General Estimated
Obligation Actual Taxable
Fiscal Year Bonds Value of Per
Ended June 30, Outstanding (a) Property (b) Capita (c)
2020 $ 2,151,217 2.28% $ 3,673
2019 1,976,795 2.18% 3,385
2018 1,785,640 2.04% 3,100
2017 1,631,670 1.95% 2,846
2016 1,556,069 1.93% 2,735
2015 1,496,636 1.92% 2,652
2014 1,332,037 1.74% 2,377
2013 1,230,752 1.60% 2,214
2012 1,158,156 1.45% 2,103
2011 1,122,542 1.32% 2,060
(a) Bonds have been adjusted for the unamortized premium and
net position restricted for debt service.
(b) See the Taxable Assessed Value and Estimated Actual Value of Property
schedule for property value data.
(c) See the Demographic and Economic Statistics schedule for population data.
223
Anne Arundel County, Maryland
Direct and Overlapping Governmental Activities Debt
As of June 30, 2020
Estimated
Estimated Share of
Debt Percentage Overlapping
Governmental Unit Outstanding Applicable Debt
Debt repaid with property taxes
City of Annapolis $ 153,502,362 100.00% $ 153,502,362
Subtotal overlapping debt 153,502,362
Anne Arundel County direct debt 1,652,015,495
Total direct and overlapping debt $ 1,805,517,857
Note: Overlapping governments are those that coincide, at least in part, with the geographic boundaries of the county.
This schedule estimates the portion of the outstanding debt of the overlapping government that is borne by the residents
and businesses of Anne Arundel County. This process recognizes that, when considering the government's ability to issue
and repay long-term debt, the entire debt burden borne by the residents and businesses should be taken into account.
However, this does not imply that every taxpayer is a resident, and therefore responsible for repaying the debt of each
overlapping government.
224
Anne Arundel County, Maryland
Legal Debt Margin
Last Ten Fiscal Years
(dollars in thousands)
2020 2019 2018 2017 2016 2015 2014 2013 2012 2011
Assessed value
Real property $ 91,496,994 $ 88,023,098 $ 84,741,803 $ 81,206,409 $ 78,154,218 $ 75,746,986 $ 74,302,152 $ 74,265,956 $ 77,289,434 $ 82,238,131 Personal and operating real property 2,711,410 2,733,898 2,676,602 2,597,018 2,278,129 2,184,577 2,191,220 2,582,018 2,554,619 2,643,202 Total assessed value 94,208,404 90,756,996 87,418,405 83,803,427 80,432,347 77,931,563 76,493,372 76,847,974 79,844,053 84,881,333
Legal debt margin
Debt limit (5.2% of assessed value of real property, 13% for fiscal
years 2001 and prior) 4,757,844 4,577,201 4,406,574 4,222,733 4,064,019 3,938,843 3,863,712 3,861,830 4,019,051 4,276,383 Debt limit (13% of assessed value of
personal and operating real property) 352,483 355,407 347,958 337,613 296,157 283,995 284,859 335,662 332,101 343,616 Total debt limit 5,110,327 4,932,608 4,754,532 4,560,346 4,360,176 4,222,838 4,148,571 4,197,492 4,351,151 4,619,999
Anne Arundel County Government 5,190 1.24% Anne Arundel County Government 4,163 1.17%
Anne Arundel Health System 4,900 1.17% Southwest Airlines 3,200 0.90%
Southwest Airlines 4,857 1.16% Anne Arundel Health System 2,800 0.78%
Univ. of MD Baltimore Washington Medical Center 3,215 0.77% Baltimore Washington Medical Center 2,650 0.74%
Live! Casino and Hotel 3,000 0.72% U.S. Naval Academy 2,340 0.66%
124,333 29.71% 104,376 29.23%
Sources: Anne Arundel Economic Development Corporation, the Maryland State Data Center, and the U.S. Department of Commerce - Bureau of Economic Analysis.
2020 2011
228
ANNE ARUNDEL COUNTY, MARYLAND
County Government Employees by Function - Full Time EquivalentLast Ten Fiscal Years
2020 2019 2018 2017 2016 2015 2014 2013 2012 2011
Function
General government 529 519 521 511 502 500 500 489 496 501