49
Annual Report 2014 Includes 3 months to 31 March 2013
Annual Report 2014Includes 3 months to 31 March 2013
Section 1 — About CPC 4 Our vision6 The cattle market today 8 Our business model 10 Our strategy Section 2 — Executive summary 14 Chairman’s statement 16 CEO’s report 18 Board of directors Section 3 — Corporate and social responsibility 22 Our people 24 Health and safety 26 Pasture monitoring 28 Corporate and social reponsibility
Section 4 — Development 32 Indonesian markets34 Capital development 36 Developing our people Section 5 — Financial statements at as 31 March 2014 40 Corporate governance statement 44 Directors’ report 46 Lead auditor’s independent declaration 47 Statementoffinancialposition 67 Directors’ declaration 68 Independent audit report
Section 6 — Financial statements at as 31 March 2013 70 Directors’ report 72 Lead auditor’s independent declaration 73 Statementoffinancialposition 93 Directors’ declaration 94 Independent audit report 96 Contact information
32
CONTENTS
Thewineglassbrandwasfirstregisteredin1922and used at Newcastle Waters Station by the owners at the time, John Lewis & Co. The brand does more than just identify cattle produced by Consolidated Pastoral Company, it has become an internationally recognised symbol of quality.
“Wineglass brand, symbol of quality”
Front cover: Lani Hart, headstockman, Wrotham Park Station (Nathan Dyer, 2014)
House Roof Hill, Carlton Hill Station
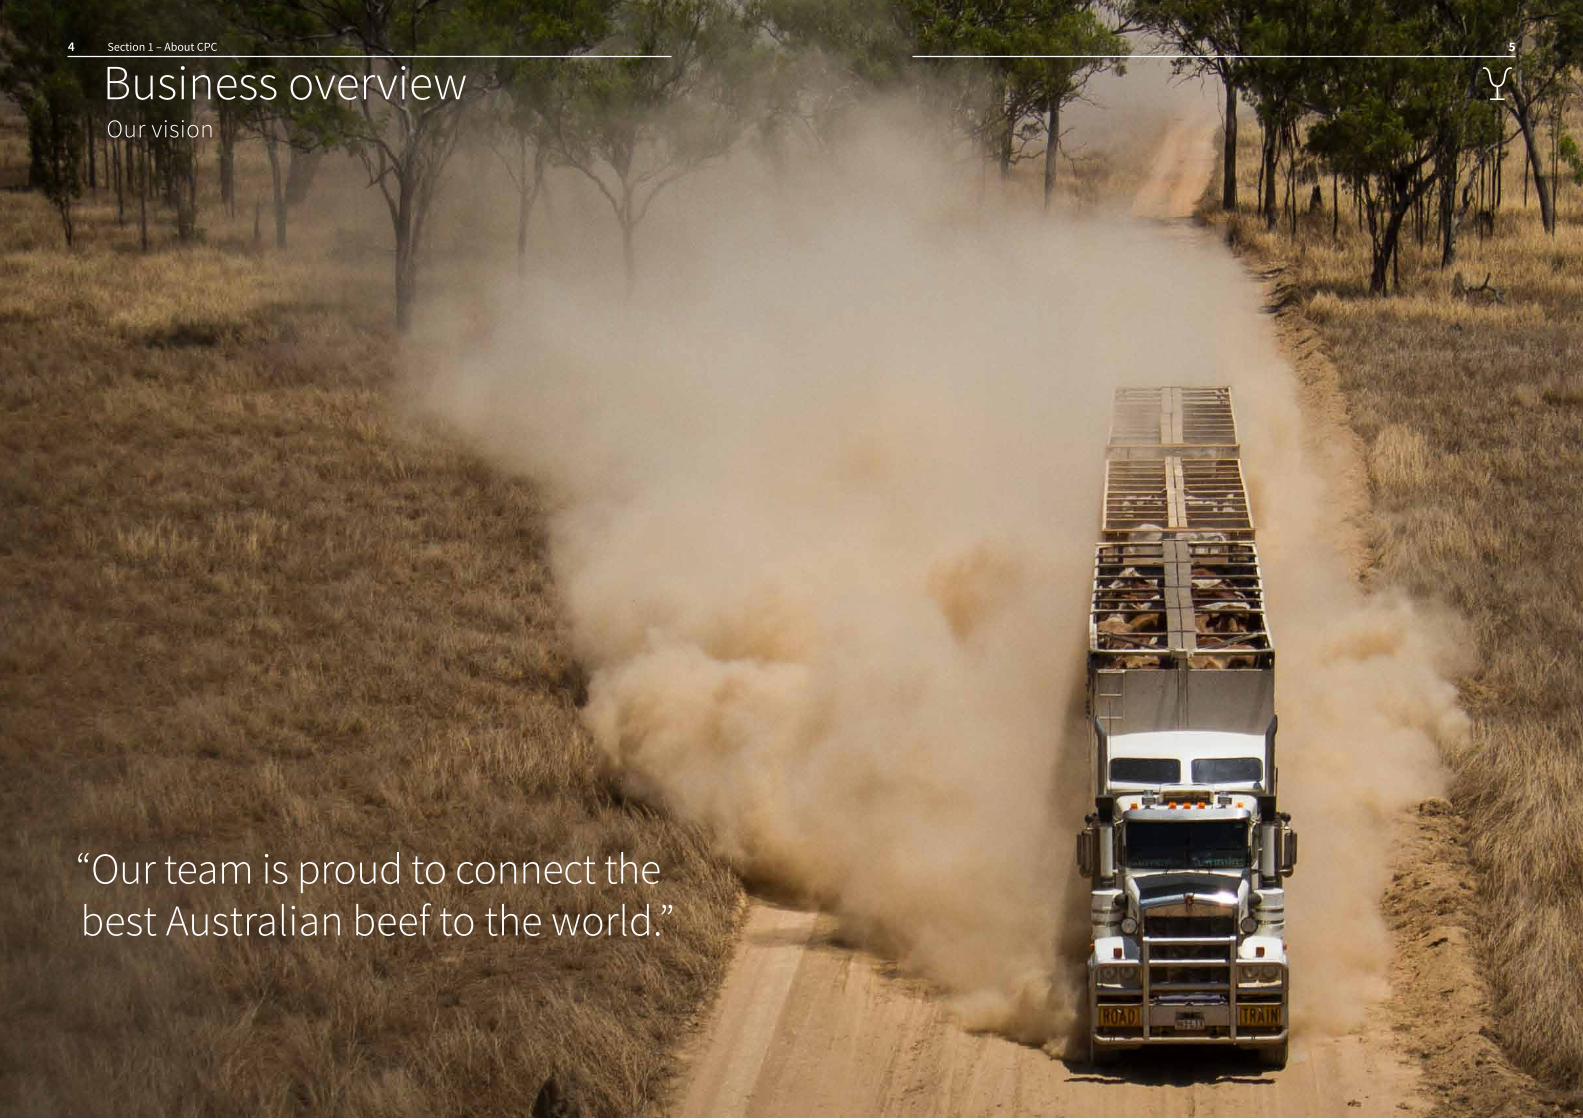
Business overviewOur vision
54 Section 1 – About CPC
“Our team is proud to connect the best Australian beef to the world.”
Paddock carting, Wrotham Park Station
The cattle market today
76 Section 1 – About CPC
Business overview
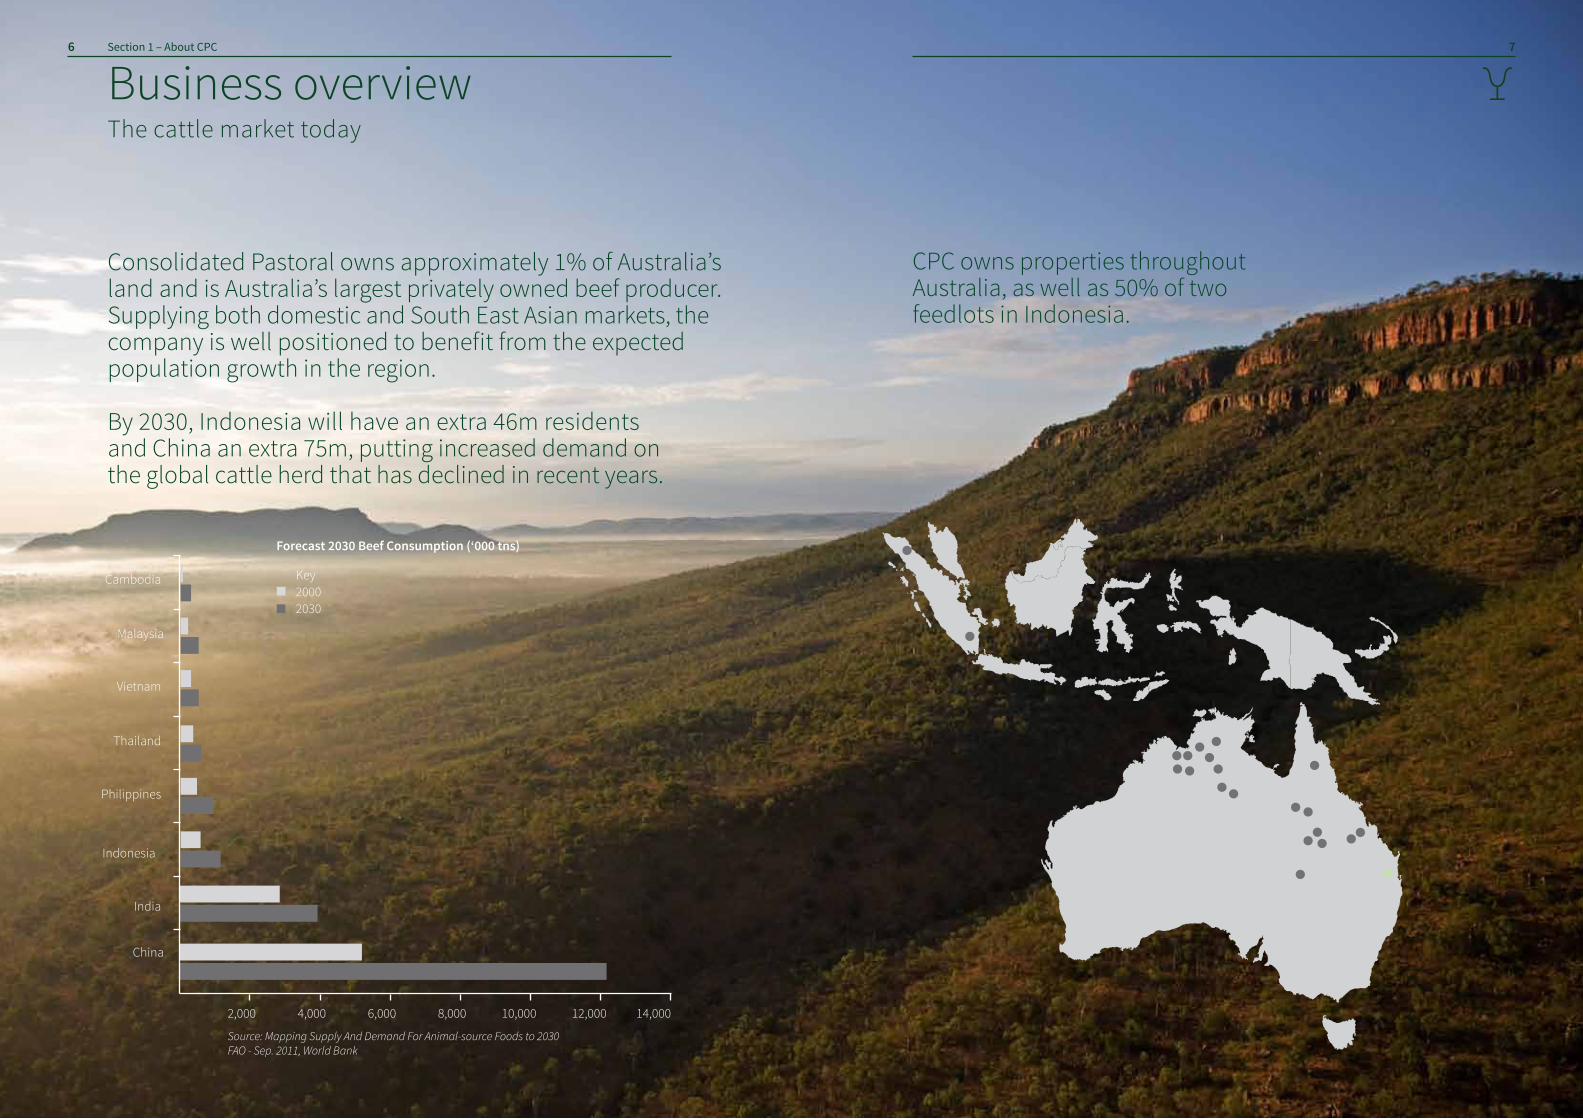
Consolidated Pastoral owns approximately 1% of Australia’s land and is Australia’s largest privately owned beef producer. Supplying both domestic and South East Asian markets, the company is well positioned to benefit from the expected population growth in the region. By 2030, Indonesia will have an extra 46m residentsand China an extra 75m, putting increased demand on the global cattle herd that has declined in recent years.
Malaysia
Cambodia
Forecast 2030 Beef Consumption (‘000 tns)
China
Thailand
Indonesia
Philippines
Vietnam
India
2,000 4,000 6,000 8,000 10,000 12,000 14,000
Source: Mapping Supply And Demand For Animal-source Foods to 2030 FAO - Sep. 2011, World Bank
CPC owns properties throughout Australia, as well as 50% of two feedlots in Indonesia.
2000Key
2030
Lake Woods, Newcastle Waters Station
Business overviewOur business model
98 Section 1 – About CPC
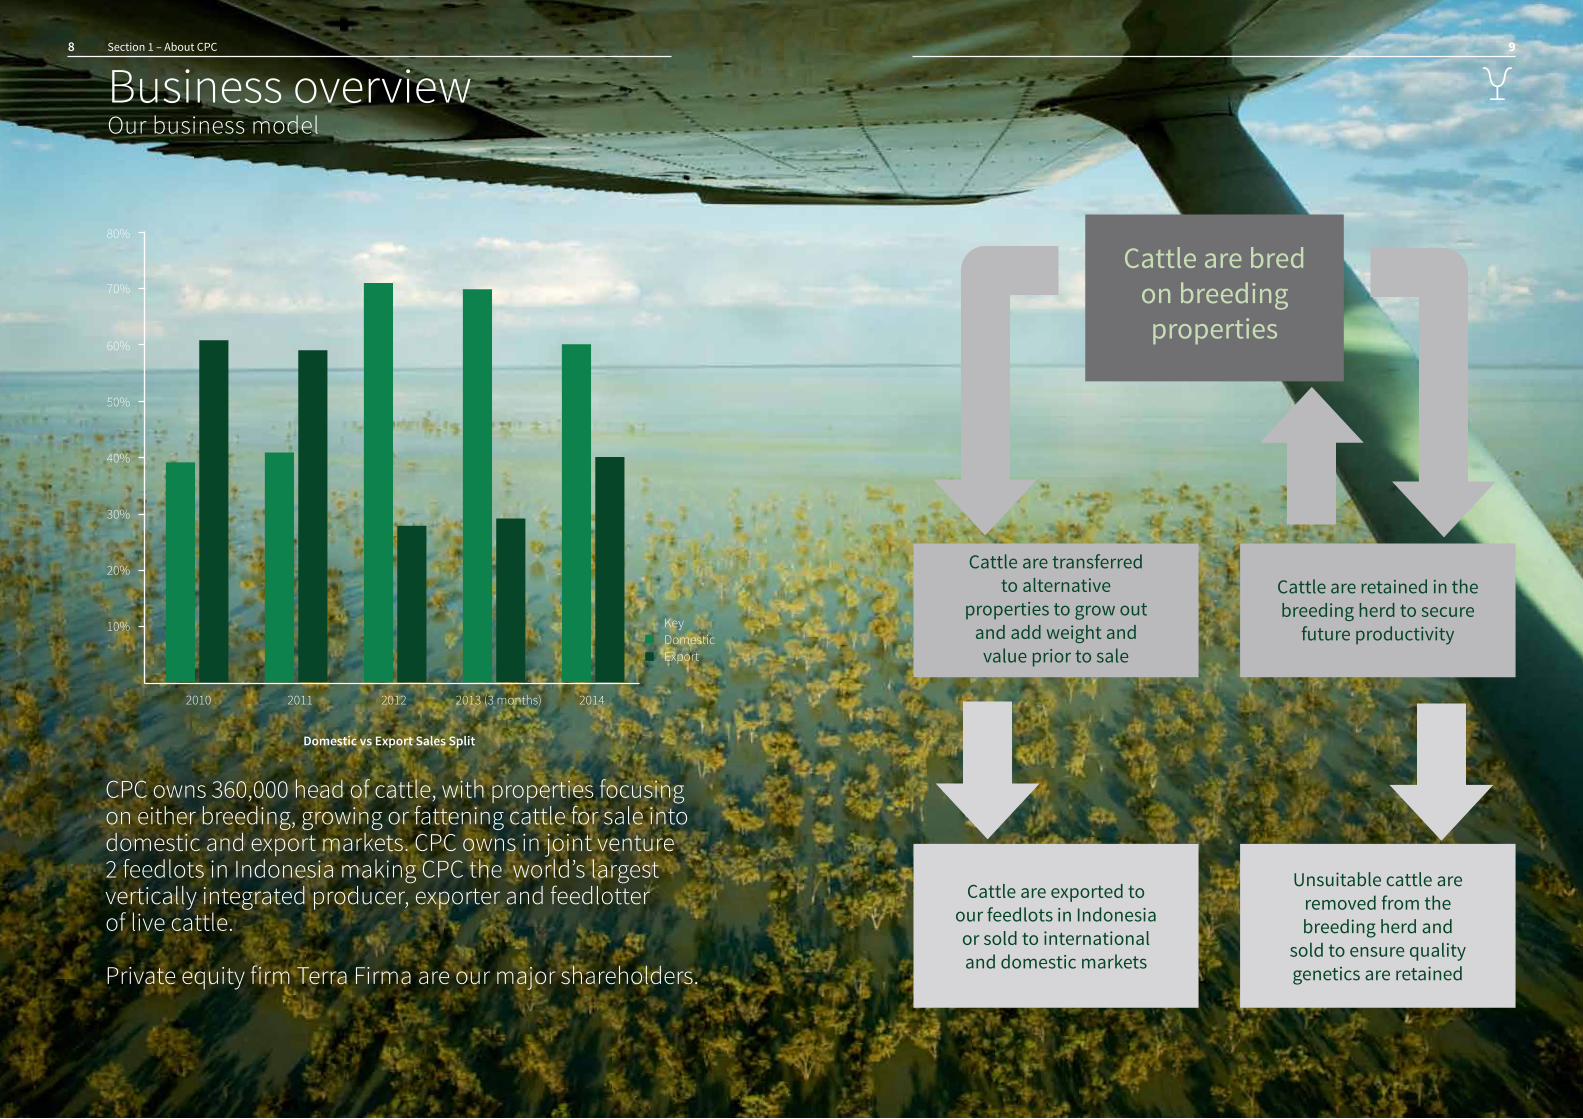
CPC owns 360,000 head of cattle, with properties focusing on either breeding, growing or fattening cattle for sale into domestic and export markets. CPC owns in joint venture 2 feedlots in Indonesia making CPC the world’s largest vertically integrated producer, exporter and feedlotter of live cattle. Private equity firm Terra Firma are our major shareholders.
Domestic vs Export Sales Split
10%
2010 2011 2012 2013 (3 months) 2014
20%
30%
40%
50%
60%
70%
80%
DomesticKey
Export
Cattle are bred on breeding properties
Cattle are retained in the breeding herd to secure
future productivity
Cattle are transferred to alternative
properties to grow out and add weight and
value prior to sale
Cattle are exported to our feedlots in Indonesia or sold to international and domestic markets
Unsuitable cattle are removed from the breeding herd and
sold to ensure quality genetics are retained
Our strategy
1110 Section 1 – About CPC
Business overview
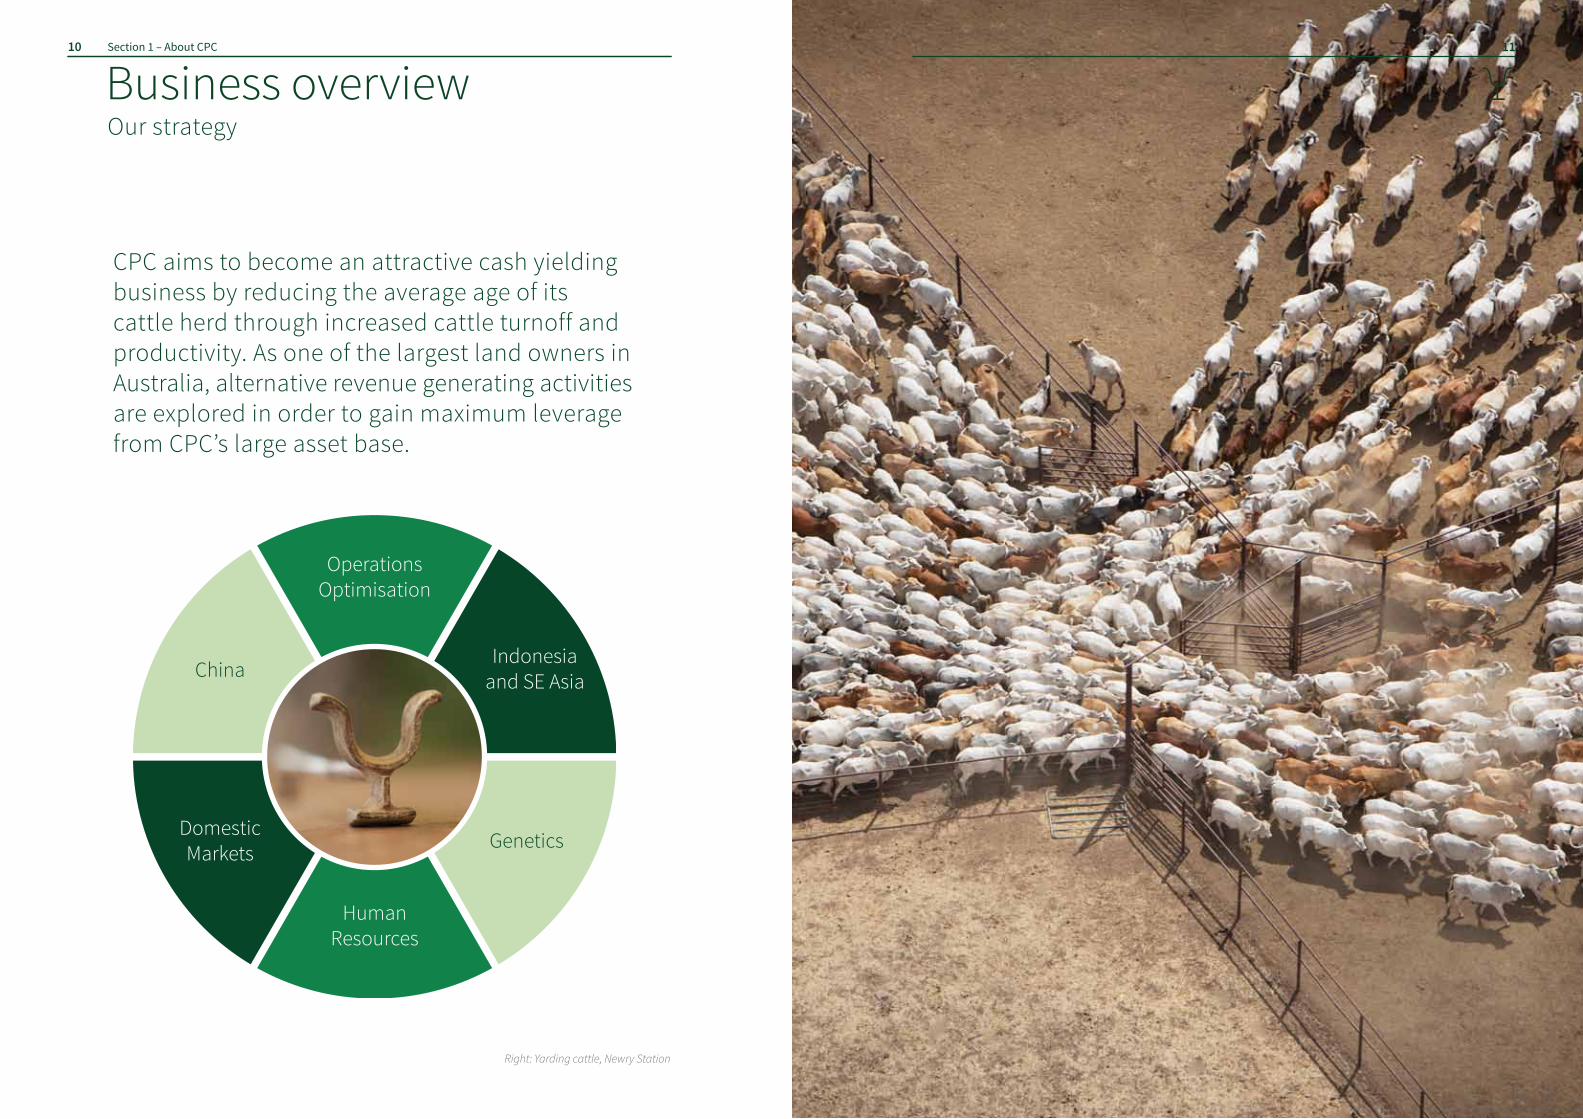
CPC aims to become an attractive cash yielding business by reducing the average age of its cattle herd through increased cattle turnoff and productivity. As one of the largest land owners in Australia, alternative revenue generating activities are explored in order to gain maximum leverage from CPC’s large asset base.
Right: Yarding cattle, Newry Station
Operations Optimisation
ChinaIndonesia
and SE Asia
Genetics
Human Resources
Domestic Markets

Mustering, Wrotham Park Station
1312 Section 2 – Executive Summary
Cattle Sales
71,919
66,206
52,625
Cattle Brandings
99,605
116,727
103,351
85,505
77,457
2013/2014 - 15 months
2013/2014 - 15 months
Executive Summary
2010 - 12 months
2010 - 12 months
2011 - 12 months
2011 - 12 months
2012 - 12 months
2012 - 12 months
1514 Section 2 – Executive Summary
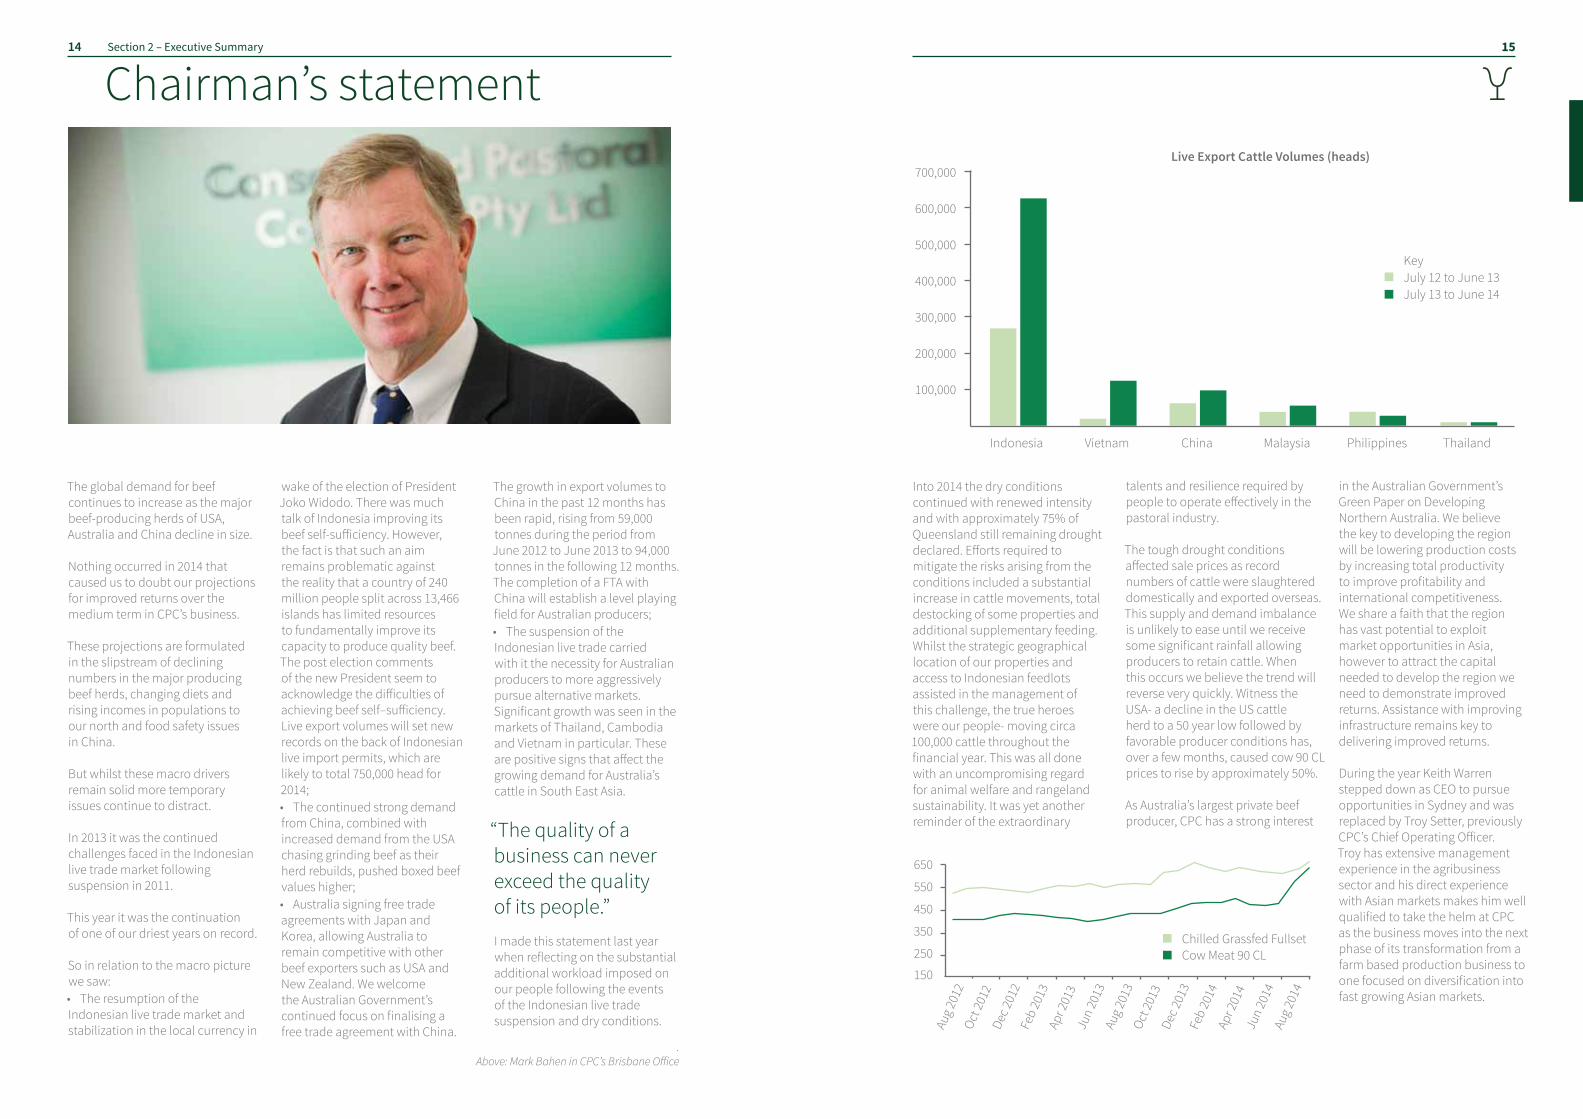
The global demand for beef continues to increase as the major beef-producing herds of USA, Australia and China decline in size. Nothing occurred in 2014 that caused us to doubt our projections for improved returns over the medium term in CPC’s business. These projections are formulated in the slipstream of declining numbers in the major producing beef herds, changing diets and rising incomes in populations to our north and food safety issues in China. But whilst these macro drivers remain solid more temporary issues continue to distract. In 2013 it was the continued challenges faced in the Indonesian live trade market following suspension in 2011. This year it was the continuation of one of our driest years on record. So in relation to the macro picture we saw: • The resumption of the Indonesian live trade market and stabilization in the local currency in
wake of the election of President Joko Widodo. There was much talk of Indonesia improving its beef self-sufficiency. However, the fact is that such an aim remains problematic against the reality that a country of 240 million people split across 13,466 islands has limited resources to fundamentally improve its capacity to produce quality beef. The post election comments of the new President seem to acknowledge the difficulties of achieving beef self–sufficiency. Live export volumes will set new records on the back of Indonesian live import permits, which are likely to total 750,000 head for 2014; • The continued strong demand from China, combined with increased demand from the USA chasing grinding beef as their herd rebuilds, pushed boxed beef values higher; • Australia signing free trade agreements with Japan and Korea, allowing Australia to remain competitive with other beef exporters such as USA and New Zealand. We welcome the Australian Government’s continued focus on finalising a free trade agreement with China.
The growth in export volumes to China in the past 12 months has been rapid, rising from 59,000 tonnes during the period from June 2012 to June 2013 to 94,000 tonnes in the following 12 months. The completion of a FTA with China will establish a level playing field for Australian producers; • The suspension of the Indonesian live trade carried with it the necessity for Australian producers to more aggressively pursue alternative markets. Significant growth was seen in the markets of Thailand, Cambodia and Vietnam in particular. These are positive signs that affect the growing demand for Australia’s cattle in South East Asia.
“The quality of a business can never exceed the quality of its people.” I made this statement last year when reflecting on the substantial additional workload imposed on our people following the events of the Indonesian live trade suspension and dry conditions.
Chairman’s statement
.Above: Mark Bahen in CPC’s Brisbane Office
Into 2014 the dry conditions continued with renewed intensity and with approximately 75% of Queensland still remaining drought declared. Efforts required to mitigate the risks arising from the conditions included a substantial increase in cattle movements, total destocking of some properties and additional supplementary feeding. Whilst the strategic geographical location of our properties and access to Indonesian feedlots assisted in the management of this challenge, the true heroes were our people- moving circa 100,000 cattle throughout the financial year. This was all done with an uncompromising regard for animal welfare and rangeland sustainability. It was yet another reminder of the extraordinary
talents and resilience required by people to operate effectively in the pastoral industry.
The tough drought conditions affected sale prices as record numbers of cattle were slaughtered domestically and exported overseas. This supply and demand imbalance is unlikely to ease until we receive some significant rainfall allowing producers to retain cattle. When this occurs we believe the trend will reverse very quickly. Witness the USA- a decline in the US cattle herd to a 50 year low followed by favorable producer conditions has, over a few months, caused cow 90 CL prices to rise by approximately 50%. As Australia’s largest private beef producer, CPC has a strong interest
in the Australian Government’s Green Paper on Developing Northern Australia. We believe the key to developing the region will be lowering production costs by increasing total productivity to improve profitability and international competitiveness. We share a faith that the region has vast potential to exploit market opportunities in Asia, however to attract the capital needed to develop the region we need to demonstrate improved returns. Assistance with improving infrastructure remains key to delivering improved returns.
During the year Keith Warren stepped down as CEO to pursue opportunities in Sydney and was replaced by Troy Setter, previously CPC’s Chief Operating Officer. Troy has extensive management experience in the agribusiness sector and his direct experience with Asian markets makes him well qualified to take the helm at CPC as the business moves into the next phase of its transformation from a farm based production business to one focused on diversification into fast growing Asian markets.
Live Export Cattle Volumes (heads)
100,000
Indonesia Vietnam China Malaysia Philippines Thailand
200,000
300,000
400,000
500,000
600,000
700,000
July 12 to June 13Key
July 13 to June 14
650
550
450
350
250
150
Aug
2012
Oct 2
012
Dec 2
012
Feb
2013
Apr 2
013
Jun
2013
Aug
2013
Oct 2
013
Dec 2
013
Feb
2014
Apr 2
014
Jun
2014
Aug
2014
Chilled Grassfed FullsetCow Meat 90 CL
1716 Section 2 – Executive Summary
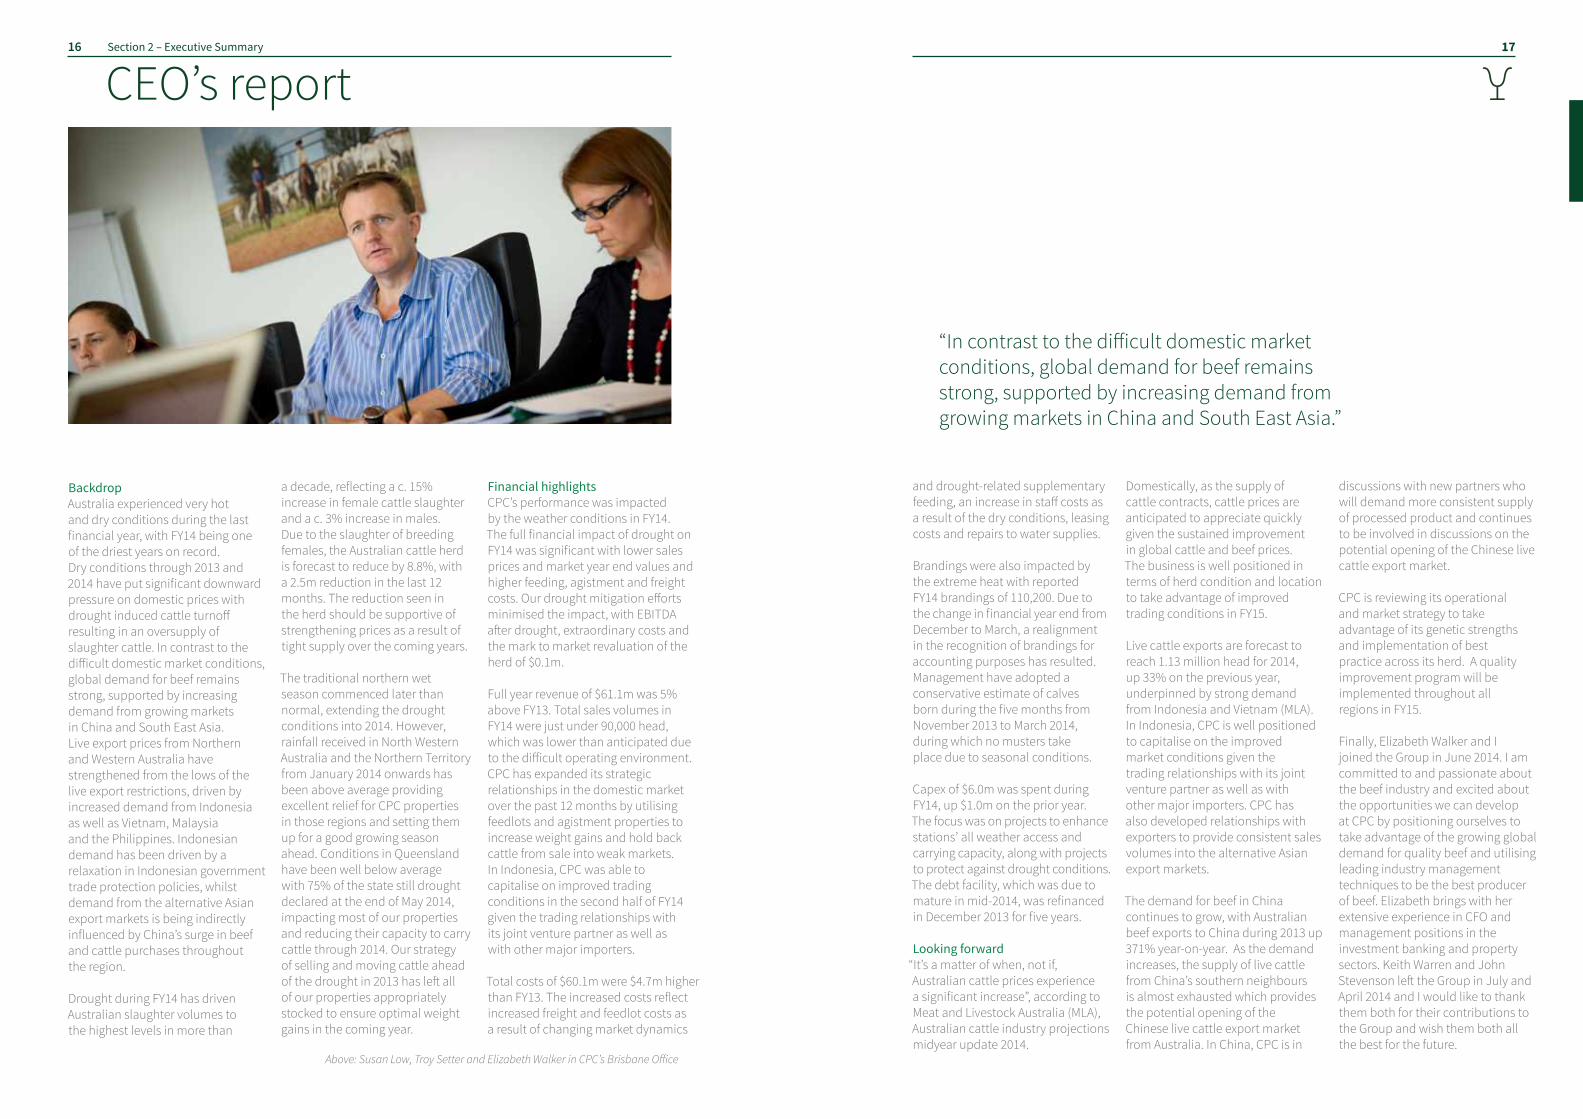
BackdropAustralia experienced very hot and dry conditions during the last financial year, with FY14 being one of the driest years on record. Dry conditions through 2013 and 2014 have put significant downward pressure on domestic prices with drought induced cattle turnoff resulting in an oversupply of slaughter cattle. In contrast to the difficult domestic market conditions, global demand for beef remains strong, supported by increasing demand from growing markets in China and South East Asia. Live export prices from Northern and Western Australia have strengthened from the lows of the live export restrictions, driven by increased demand from Indonesia as well as Vietnam, Malaysia and the Philippines. Indonesian demand has been driven by a relaxation in Indonesian government trade protection policies, whilst demand from the alternative Asian export markets is being indirectly influenced by China’s surge in beef and cattle purchases throughout the region. Drought during FY14 has driven Australian slaughter volumes to the highest levels in more than
a decade, reflecting a c. 15% increase in female cattle slaughter and a c. 3% increase in males. Due to the slaughter of breeding females, the Australian cattle herd is forecast to reduce by 8.8%, with a 2.5m reduction in the last 12 months. The reduction seen in the herd should be supportive of strengthening prices as a result of tight supply over the coming years. The traditional northern wet season commenced later than normal, extending the drought conditions into 2014. However, rainfall received in North Western Australia and the Northern Territory from January 2014 onwards has been above average providing excellent relief for CPC properties in those regions and setting them up for a good growing season ahead. Conditions in Queensland have been well below average with 75% of the state still drought declared at the end of May 2014, impacting most of our properties and reducing their capacity to carry cattle through 2014. Our strategy of selling and moving cattle ahead of the drought in 2013 has left all of our properties appropriately stocked to ensure optimal weight gains in the coming year.
Financial highlightsCPC’s performance was impacted by the weather conditions in FY14. The full financial impact of drought on FY14 was significant with lower sales prices and market year end values and higher feeding, agistment and freight costs. Our drought mitigation efforts minimised the impact, with EBITDA after drought, extraordinary costs and the mark to market revaluation of the herd of $0.1m. Full year revenue of $61.1m was 5% above FY13. Total sales volumes in FY14 were just under 90,000 head, which was lower than anticipated due to the difficult operating environment. CPC has expanded its strategic relationships in the domestic market over the past 12 months by utilising feedlots and agistment properties to increase weight gains and hold back cattle from sale into weak markets. In Indonesia, CPC was able to capitalise on improved trading conditions in the second half of FY14 given the trading relationships with its joint venture partner as well as with other major importers. Total costs of $60.1m were $4.7m higher than FY13. The increased costs reflect increased freight and feedlot costs as a result of changing market dynamics
CEO’s report
Above: Susan Low, Troy Setter and Elizabeth Walker in CPC’s Brisbane Office
and drought-related supplementary feeding, an increase in staff costs as a result of the dry conditions, leasing costs and repairs to water supplies. Brandings were also impacted by the extreme heat with reported FY14 brandings of 110,200. Due to the change in financial year end from December to March, a realignment in the recognition of brandings for accounting purposes has resulted. Management have adopted a conservative estimate of calves born during the five months from November 2013 to March 2014, during which no musters take place due to seasonal conditions. Capex of $6.0m was spent during FY14, up $1.0m on the prior year. The focus was on projects to enhance stations’ all weather access and carrying capacity, along with projects to protect against drought conditions. The debt facility, which was due to mature in mid-2014, was refinanced in December 2013 for five years.
Looking forward“It’s a matter of when, not if, Australian cattle prices experience a significant increase”, according to Meat and Livestock Australia (MLA), Australian cattle industry projections midyear update 2014.
“In contrast to the difficult domestic market conditions, global demand for beef remains strong, supported by increasing demand from growing markets in China and South East Asia.”
Domestically, as the supply of cattle contracts, cattle prices are anticipated to appreciate quickly given the sustained improvement in global cattle and beef prices. The business is well positioned in terms of herd condition and location to take advantage of improved trading conditions in FY15. Live cattle exports are forecast to reach 1.13 million head for 2014, up 33% on the previous year, underpinned by strong demand from Indonesia and Vietnam (MLA). In Indonesia, CPC is well positioned to capitalise on the improved market conditions given the trading relationships with its joint venture partner as well as with other major importers. CPC has also developed relationships with exporters to provide consistent sales volumes into the alternative Asian export markets. The demand for beef in China continues to grow, with Australian beef exports to China during 2013 up 371% year-on-year. As the demand increases, the supply of live cattle from China’s southern neighbours is almost exhausted which provides the potential opening of the Chinese live cattle export market from Australia. In China, CPC is in
discussions with new partners who will demand more consistent supply of processed product and continues to be involved in discussions on the potential opening of the Chinese live cattle export market. CPC is reviewing its operational and market strategy to take advantage of its genetic strengths and implementation of best practice across its herd. A quality improvement program will be implemented throughout all regions in FY15. Finally, Elizabeth Walker and I joined the Group in June 2014. I am committed to and passionate about the beef industry and excited about the opportunities we can develop at CPC by positioning ourselves to take advantage of the growing global demand for quality beef and utilising leading industry management techniques to be the best producer of beef. Elizabeth brings with her extensive experience in CFO and management positions in the investment banking and property sectors. Keith Warren and John Stevenson left the Group in July and April 2014 and I would like to thank them both for their contributions to the Group and wish them both all the best for the future.

Chris EvansMark Bahen Troy Setter Fergal LeamySami Kassam
1918 Section 2 – Executive Summary
Chris is Chairman of Agricultural Management Company Pty Ltd, one of Australia’s largest rural consultancy and management companies. Chris has been involved in agribusiness for over 35 years and was formerly Managing Director of Taylor Byrne and then Rural Management Partners, rural valuation and agribusiness consultancies. Chris began his working life as a Jackaroo, Overseer, Station Manager and Research and Development Officer for Stanbroke Pastoral Company. Over the 11 years of employment with Stanbroke, he was based on a number of cattle properties and the head office. Chris is also the co-owner and operator of a large beef cattle operation known as Bulloo River Pastoral Company.
Non-Executive Director
Board of directors
Mark joined the Board in November 2008 and was subsequently appointed as Chairman in August 2012. Mark is a former partner of Clayton Utz, one of Australia’s leading commercial law firms where he practiced corporate and commercial law and headed up the agribusiness practice. He has provided advice to some of Australia’s leading agribusiness companies. He is a Director of St John of God Health Care, a leading Australian private hospital and health care operator. Mark has retained a personal involvement in agriculture all his working life and currently farms in the Margaret River region.
Non-Executive Chairman
Appointed July 2014
Troy is one of the top cattlemen and agribusiness leaders in the country and well-renowned for his achievements across the industry. Prior to being appointed Chief Executive Officer at CPC in July 2014, Troy held key management positions at a variety of agribusinesses including Australian Agricultural Company, Torrens Investments, North Australian Cattle Company, Killara Feedlot and Twynam Group. Throughout his career Troy has been responsible for all aspects of the supply chain; from cereal and fibre cropping, grain and grass fed cattle operations, domestic and international logistics, trading and shipping through to genetic improvement, beef and cattle marketing, broad strategy development, investment and finance.
CEO- Executive Director
From October 2012 to August 2013, Fergal stepped in as interim Chief Executive Officer of CPC, helping to drive the strategy of the business and guiding the business through a significant period of change and transformation. Fergal is a Director at Terra Firma, and has spent 15 years working with food and agricultural businesses across Europe, the United States and Australia. Prior to joining Terra Firma, Fergal was the CEO of Greencore USA, one of the world’s leading private label food manufacturers. Fergal began his career at McKinsey and Company in London where he served many leading food and agricultural clients. He has Bachelor degrees in Business and Law from University College Dublin. Fergal currently sits on the Board of Tank & Rast, the largest Motorway service business in Germany.
Appointed October 2013
Non-Executive Director
Sami has a broad range of transaction experience, having worked on a variety of Terra Firma investments. Most recently, Sami led the sale of Phoenix Natural Gas, the leading gas distribution infrastructure network in Northern Ireland, as well as working on the acquisition of Annington Homes, the UK’s largest privately owned residential real estate business. Sami was also involved in Terra Firma’s acquisition of CPC.
Non-Executive DirectorElizabeth Walker
Elizabeth was appointed as CPC’s Chief Financial Officer in June 2014, joining the business with over 20 years’ experience in both large and smaller listed and private companies across investment banking, property development, construction, and funds management sectors. Prior to starting at CPC, Elizabeth was Group Chief Financial Officer and Treasurer of Dennis Group; a large privately owned group with both property and agricultural interests. A qualified Chartered Accountant, Elizabeth also holds a Graduate Diploma in Applied Finance and is currently working towards completion of an MBA at the University of Queensland.
CFO and Executive Director
Appointed June 2014
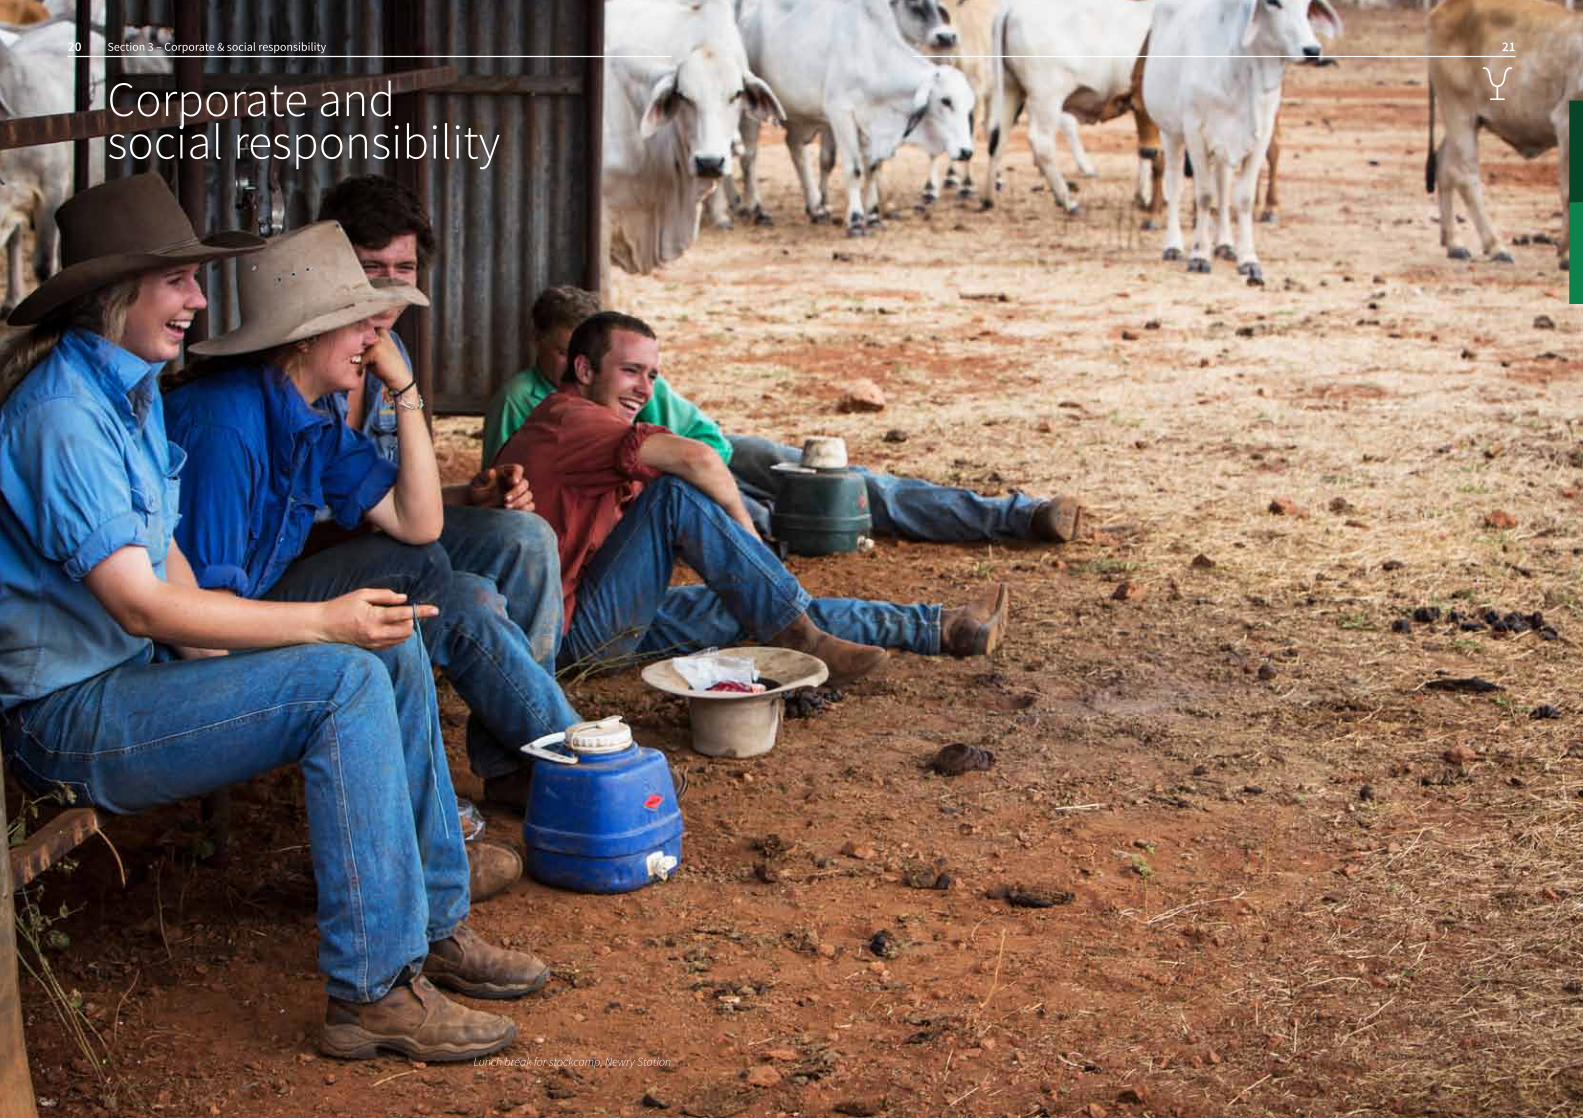
Lunch break for stockcamp, Newry Station
2120 Section 3 – Corporate & social responsibility
Corporate and social responsibility

Our people
CPC is continually improving processes and developing the Human Resource strategy that positions us as an employer of choice and provides a safe working environment in which to build people capacity at all levels whilst matching the workforce to the business needs. CPC’s Human Resources toolset is rapidly evolving to maximise business support, opportunities for development and performance recognition for its people. With its administration centre and stations spanning three Australian states, CPC’s HR team has been adopting new pathways of communication to compliment an open and collaborative culture across the country.
CommunicationThe worldwide uptake of social media tools for business communication has not eluded agribusiness. Mid-2013 saw CPC implement ‘Yammer’, a Microsoft tool that allows staff to update the whole company with station news from wherever they are situated. The team is using Yammer to share training material, market trends, ideas for innovative business
development, staff recognition, corporate events and photos of team activities. In order to get the most out of valuable staff feedback, CPC also began the process of carrying out an Organisational Health Index (OHI) Survey at the end of March 2014. Ninety-seven employees took part and revealed an overwhelming consensus that the company was ‘visionary’,
‘passionate’ and ‘fun’. There was a company-wide trend towards the view that CPC values customer focus and a sense of community. The team recognised and supported an ongoing commitment to being competitive, accountable, efficient and focused on the professional growth of its staff. Findings from the OHI Survey have been incorporated into CPC’s plans for future business development and employee engagement. Leadership and people managementAt the annual CPC Conference this year, CPC introduced Jan and Michelle Terkelsen. Highly talented and seasoned consultants in the fields of professional coaching
and change management, Jan and Michelle ran a Life Styles Inventory Survey to help the station managers and Brisbane office staff evaluate their existing workplace styles and work towards expanding their repertoire of constructive attributes. Jan and Michelle have provided ongoing leadership coaching, human resources assistance and mediation services. CPC has increased its female to male senior manager ratio over the financial year further diversifing its skill base. CPC currently has 2 female senior managers and 3 male senior managers. Performance recognition Station and Employee Recognition Awards were another new feature at this year’s annual conference. People’s Choice and CPC Ambassador awards were presented for staff showing outstanding dedication. Stations and staff were also recognised in the categories of Operational Performance, Best Station Teamwork, Station Safety and People Development. Performance recognition has also been supplemented by an improved bonus scheme and improved performance evaluation tools.
Indigenous AustraliansIn partnership with the Northern Territory Cattlemen’s Association, CPC has continued its involvement in the Real Jobs Program which targets employment in the pastoral industry through on-property and accredited training experiences for Indigenous people in the Northern Territory. During the year participants in the Reals Jobs Program were based at Manbulloo and Auvergne.
Learning and developmentUtterly committed to attracting, retaining and developing its promising young leaders, CPC has implemented a conference where Head Stockmen and Leading Hands are coached in effective leadership skills. Following the introduction of the Cadetship Program in 2013, CPC also saw its first cadets begin training when the wet season made way for the first round of mustering in early 2014. Highlights for the cadets have included attending leadership conferences, being appointed operational mentors and gaining exposure to all aspects of the business at the Brisbane office. CPC strives to provide an environment where learning is part of each employee’s career development and to this end we are rolling out Individual Development Plans that will seek to optimise each employee’s talents and interests. Our aim is to attract, develop and retain top quality people in all parts of CPC.
2322 Section 3 – Corporate & social responsibility
Above: Stockcamp going out to muster, Kirkimbie Station Right: Emily Bryant, Newry Station

Health and safety
The health and safety of our staff and all those associated with CPC continues to be a central and constant focus on CPC properties. CPC aims to be an influential leader within the pastoral industry in ensuring the wellbeing of all staff, contractors and visitors. Maintaining a robust and effective Workplace Health and Safety management system in an environment of increasing regulatory interest and licensing requirements is an ever-changing and ongoing body of work. It is achieved through a process of continuous improvement, whereby we fully integrate health, safety and wellbeing into all aspects of our activities and operations. CPC’s WHS Strategic Plan (2013-2015) was implemented to provide clear objectives towards improving WHS performance. Our strategic plan commits CPC to a proactive approach to our health and safety management system, based on effective communication and consultation with employees as well as systematic identification, assessment and control of hazards. To achieve the objectives of the strategic plan, CPC has focused its efforts on priority action items that include:
• increasing awareness of effective risk management practices through staff training that is carried out at all levels within CPC; • reducing the occurrence of workplace injuries and illness by targeting the areas of highest incidence; • liaising with other industry organisations to compare and evaluate incident data and WHS systems; • improving the WHS knowledge of our station managers and head stockmen to assist them in safe delegation of responsibilities; • promoting rehabilitation programs to ensure effective injury management; and • reviewing and improving WHS systems, policies and procedures on an ongoing basis, ensuring compliance with relevant legislation that is made accessible to CPC staff. These actions have allowed CPC to significantly reduce the occurrence of operational incidents from 2012 to 2013, despite a growing workforce. With reductions in lost time, workers compensation injuries and first aid injuries, as well as earlier reporting of hazards, CPC has a strong foundation upon which to continue to drive
awareness and the adoption of improved safety measures.
CPC’s Joint Venture, PT Jung Jaya Abdi Alan, is doing the same in Indonesia. JJAA works with the Indonesian Government’s Health Department and the Work Safety Division of the Labour Department to ensure the highest standards of WHS for their employees. These departments collaborate with JJAA’s Safety Officer to provide health and safety training to all staff, organise safety drills and carry out equipment and worksite inspections. They audit the company’s Work Health & Safety Program on an annual basis and assist JJAA with industry benchmarking.
CPC itself has reached out to other major agribusinesses to develop and maximise health and safety standards across the industry and a collaborative benchmarking process is currently underway.
CPC’s WHS management system continues to be supported by professionally and technically competent staff who are able to oversee external compliance, provide technical support and promote our health-conscious and safety-conscious culture.
decrease in total workplace incidents
time lost due to workers compensation injuries
26%
31%
2524 Section 3 – Corporate & social responsibility
. Left: Mick Hoare, Station Manaer, with Stockman, Will Cant, mustering at Dungowan Station
Pasture monitoring
Greater than 95% of the feed-base supporting CPC’s northern Australian cattle herd is native pasture. The native grasses, legumes, herbage and in some areas shrubs and trees that make up this pasture provide a robust, adapted and diverse source of nutrition for grazing animals. Keeping native pastures in good condition ensures that whatever rainfall is received is then converted into the greatest amount and best quality feed from one year to the next. The characteristics of good pasture are a dominance of preferred species for that land type, good ground cover and soil health, no erosion and no weeds. The key influencers of pasture condition are rainfall and grazing management. We can’t control the rain, so as land managers, we must apply the best in grazing management to ensure that pastures remain in good condition. The most important aspect of grazing management is stocking rate. Stocking rate is simply the number of animals in any given area at any time. As land managers we aim to stock our pastures according to established long term carrying capacity estimates for the different land types to keep them in good condition. Providing regular rest for pastures during the growing season is a key tool for maintaining good condition. Managers must
also monitor the condition of their pastures, just as we weigh cattle to see how they are growing or apply good accounting practices to ensure the financial side of the business stays in good health. The main driver for CPC in undertaking pasture monitoring is to ensure that pastures can continue to grow abundant good quality feed into the future. Managers can also respond to indicators from monitoring that suggest that pasture may be deteriorating and act before getting things back into good condition becomes too hard and too expensive. The landscape has enormous cultural, social and environmental value too. The native vegetation of northern Australia represents one of the last relatively untouched landscapes in the world. This landscape is of enormous environmental value, supporting an incredibly diverse range of flora and fauna. Traditional owners have thousands of years of being at one with this landscape with deep cultural significance placed on all aspects of the environment. Almost all of the CPC properties in northern Australia are held under pastoral lease tenure which is, in effect, a lease of public land for grazing purposes. The leaseholder has a legislative duty to ensure that pasture condition is maintained
over time. Monitoring pastures involves regular assessment of sites in the landscape and identifying the species present, estimating ground cover and assessing presence of erosion and weeds. The recordings are assessed in relation to what the landscape would look like in good condition and trends are drawn out over a number of years to assess if change is occurring. More recently, satellite imagery is being used to assist in these assessments. CPC uses pasture monitoring on all its northern properties to inform pasture management. Monitoring records, including photos and written assessments going back to the early 1980’s on Argyle Downs, for example, provide current managers with vital information on the management of the landscape today. Reviewing this resource provides guidance for making management decisions now. Monitoring is essential to demonstrate improving pasture condition around Lake Woods and its catchment on Newcastle Waters Station through extensive weed management works. Lake Woods is an area of international importance for migratory waders and shorebirds. Pasture monitoring including property visits, data collation and reporting across the 10 northern properties (WA, NT and Wrotham Park) is a major task taking 68 man days and over 15,000km of driving to assess 271 monitoring sites in 2013.
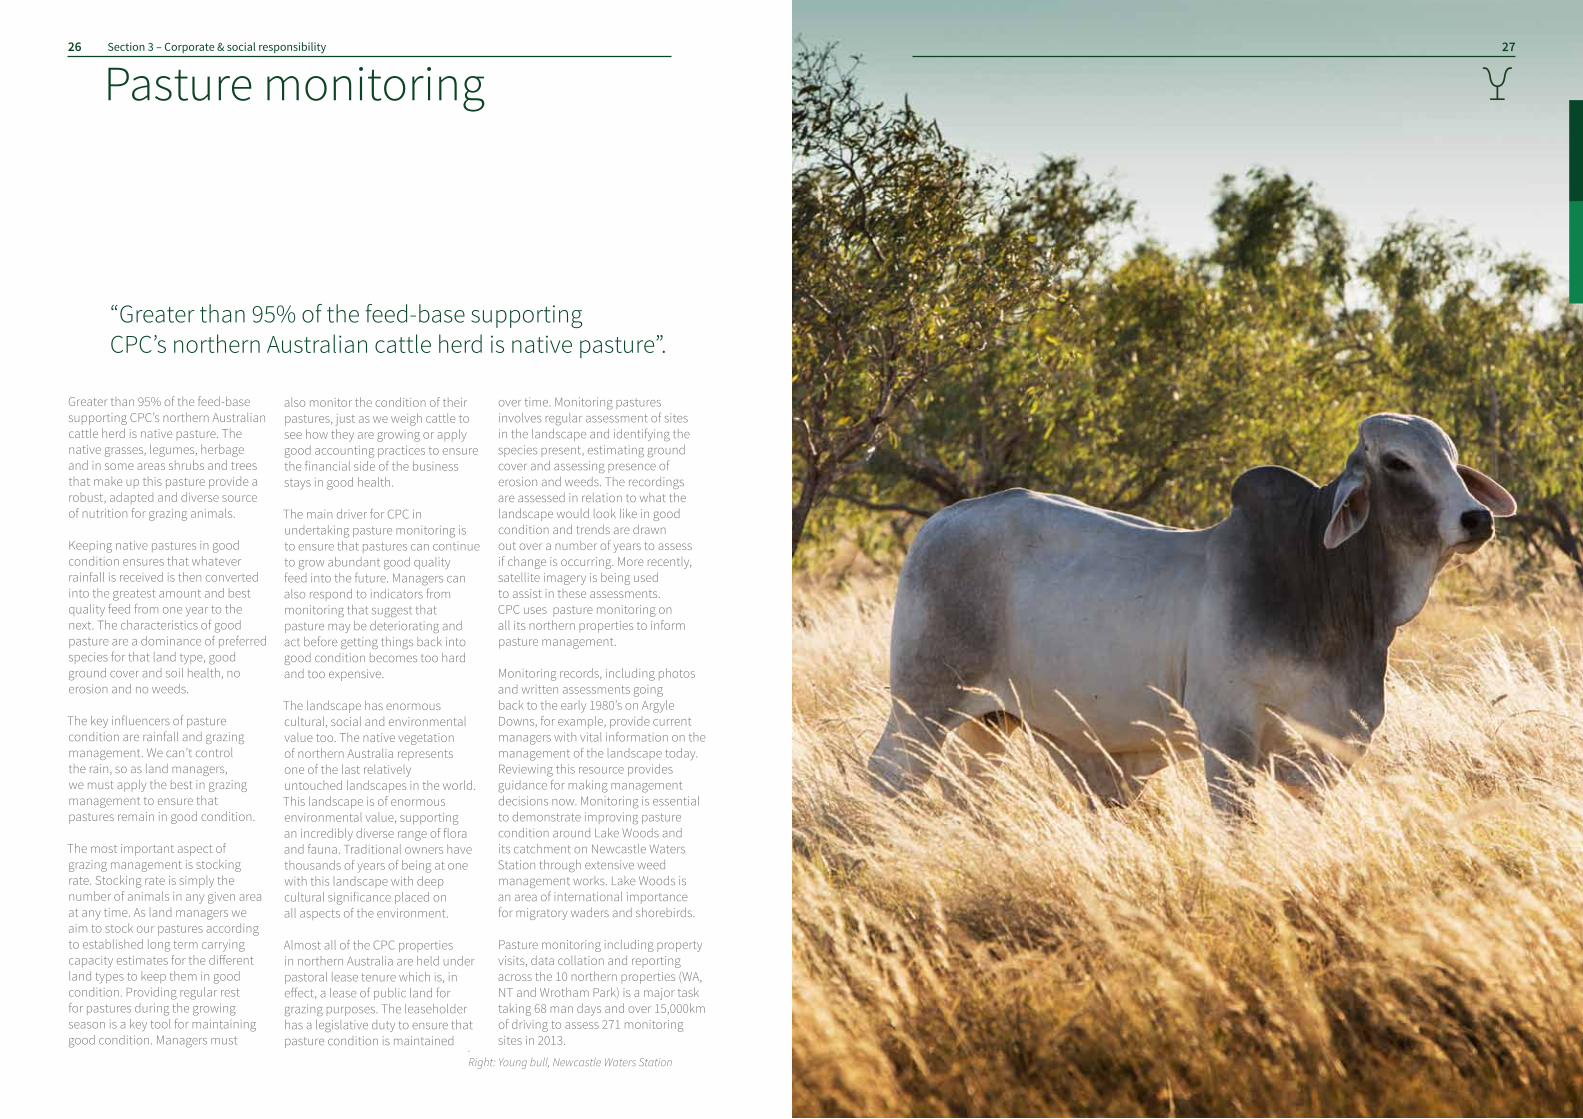
“Greater than 95% of the feed-base supporting CPC’s northern Australian cattle herd is native pasture”.
2726 Section 3 – Corporate & social responsibility
.Right: Young bull, Newcastle Waters Station
2928 Section 3 – Corporate & social responsibility
Corporate and social responsibility
Animal welfareThe welfare of our animals is of paramount importance to CPC and our people. CPC strives to continually improve and promote the standards of animal welfare whilst animals are on our properties and when they are in the care and ownership of others up to the point of slaughter. CPC applies the principles of low stress stock handling and regularly provides instruction and training to employees in these methods. CPC cattle have access to sufficient food, supplements and water and every effort is taken to protect our animals from disease and predators. Expert veterinarians and management are engaged to ensure that all endeavours are used to keep our cattle free from stress, disease and illness. CPC at all times at least meets the minimum requirements of the Codes of Practice and Regulations for the Management and Transport of Animals for both land and sea. CPC believes there is an ethical imperative of care extending beyond the change in legal title of its animals. CPC works closely
with the Australian and Indonesian Governments, our customers and with our joint venture partner in Indonesia to ensure acceptable standards of animal welfare are in place.
CPC reserves the right to inspect our customers’ facilities where CPC cattle are transported, managed and slaughtered and withhold supply if, in the company’s absolute discretion, we are not satisfied with the standards under which CPC animals are cared for.
CPC supports all steps designed to eliminate the inhumane and cruel treatment of animals.
Native TitleNative Title is a property right which recognises that some Indigenous Australians have a traditional right and interest in the land. Native Title can co-exist with non-indigenous property rights as is the case on CPC properties with Native Title determinations.
In March 2014 there was a consent determination recognising the Native Title rights of traditional owners on Tandyidgee, which forms part of Newcastle Waters Station. This decision was based on the
landmark 2007 Newcastle Waters consent determination (King v Northern Territory of Australia) which has become a reference point for Native Title decisions in the Northern Territory. Along with Newcastle Waters and Tandyidgee there are also determinations in place on Auvergne, Newry, Dungowan and Ucharonidge.
Environment CPC undertakes regular reviews of compliance with state and federal environmental regulations as part of its environmental management systems. In addition to this regulatory baseline, the company continues its efforts to meet or exceed industry best practice guidelines in environmental management. In comparison with more intensive land uses, rangeland grazing, the basis of the CPC business, has minimum impact on the largely intact native landscapes under management. However, flowing from our property specific environmental impact assessments and also to meet our responsibility to maintain natural resources into the future, CPC conducted an extensive pasture monitoring program on its northern properties throughout 2013.
“CPC supports all steps designed to eliminate the inhumane and cruel treatment of animals.”
CPC also developed and carried out work on weed and erosion management plans on several stations, which will continue in 2014. The past year saw the continuation of the Conservation Management Project in partnership with the Northern Territory Government over the Lake Woods area on Newcastle Waters Station. Covering an area of almost 140,000 ha, Lake Woods and its catchment are listed as of National Significance
for its importance for migratory and local waterbirds. The plan focuses on maintaining the natural flows of water through the catchment to the lake, reducing in the impact of the invasive weed Parkinsonia, monitoring waterbird populations and recording the details of the flora and fauna of this special area. CPC further protected its native birds by setting up a Gouldian Finch exclosure on Newry Station.
Anti-corruptionCPC is committed to conducting its business in an ethical, honest and transparent manner. Bribery and corruption are not consistent with the Group’s values and present significant risks to its business and it is therefore committed to the prevention, deterrence and detection of bribery and corruption. Under the Group Anti-Bribery Policy it is prohibited to offer, give, solicit or accept a bribe, whether cash or other inducement to or from any person or company.
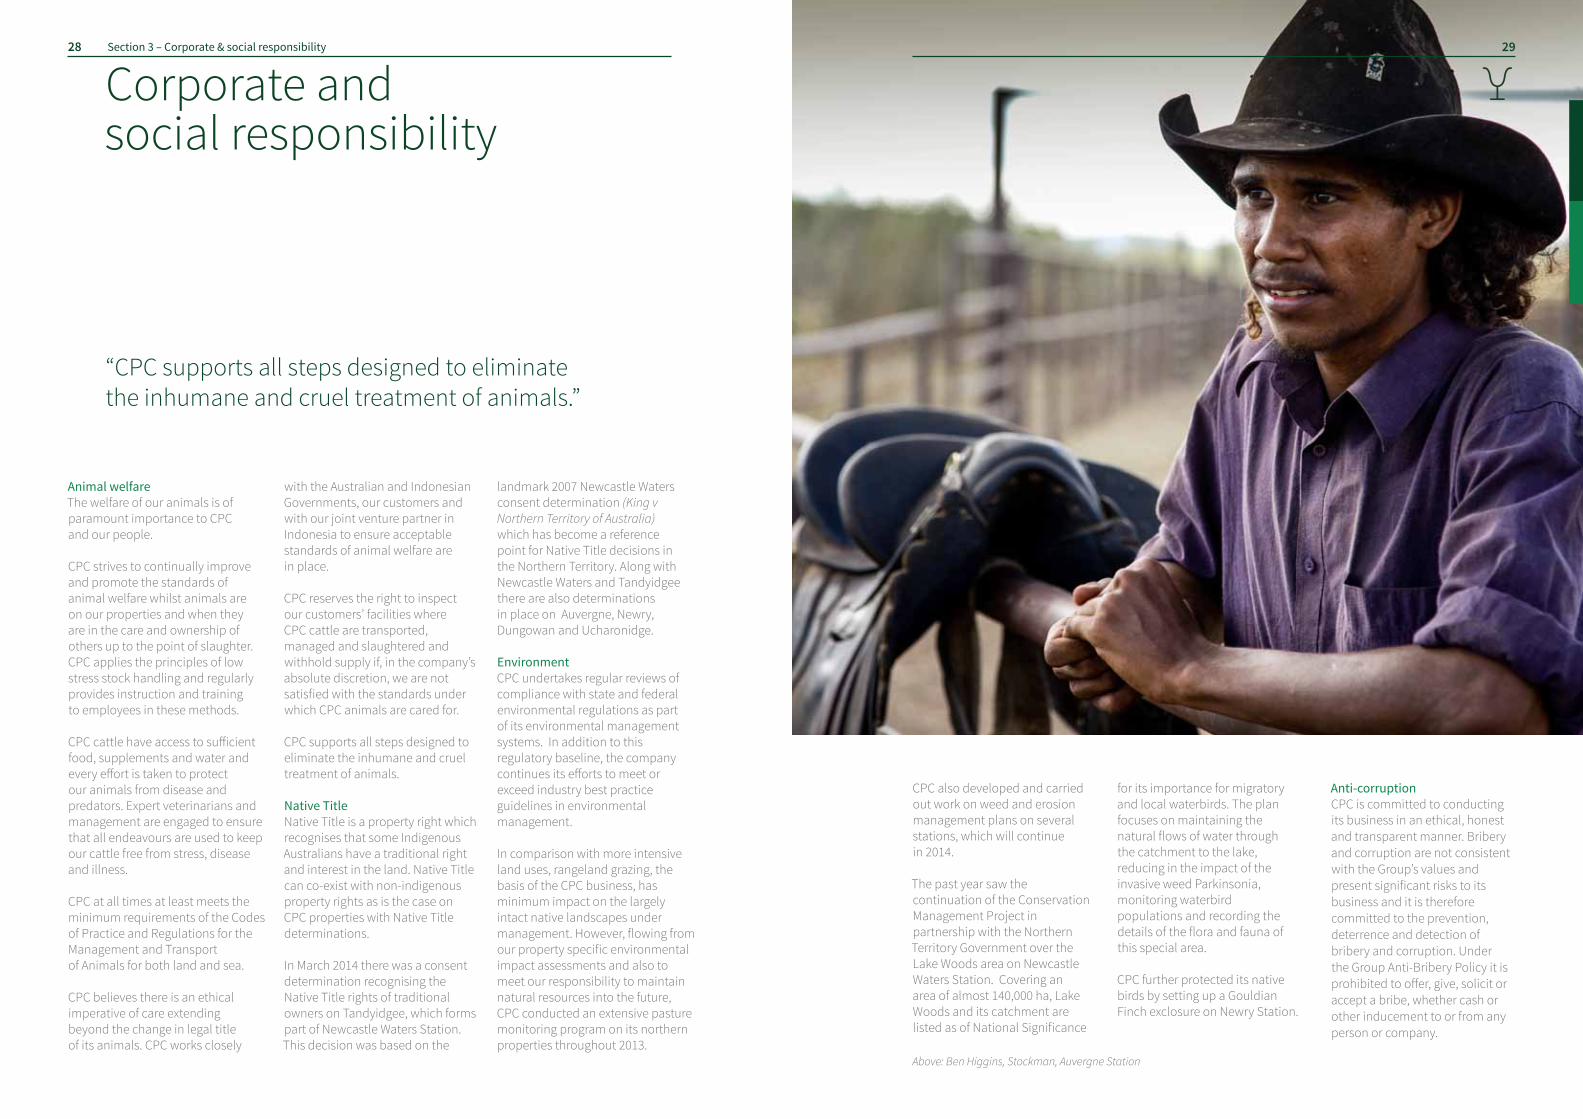
Above: Ben Higgins, Stockman, Auvergne Station
Development3130 Section 4 – Development

Indonesian markets
CPC exported 30,000 head of cattle to Indonesia in FY14, comprising 6% of the total Indonesian imports for that period. 17,000 head were sold to CPC’s Indonesian joint venture, JJAA, before being grain fed and sold into the wet market. The joint venture, in which CPC holds a 50% interest, was first established in 2000 and now operates two feedlots in Indonesia, located in Lampung (South Sumatra) and Medan (North Sumatra). The Lampung feedlot has a capacity of 28,000 head, while the Medan feedlot has a capacity of 7,500 head; both facilities are “best in class” operations.
Live export prices have been volatile since the live export ban in 2011 and FY14 saw prices for male feeder cattle reach significant lows through the winter months. However, a severe shortage of supply through Australia’s wet season saw a large rebound in prices. CPC was able to take advantage of the stronger market through its all-weather cattle yards that meant cattle could be sold at a time when most stations were unable to move cattle.
JJAA employs 180 people as permanent and contract employees, plus hires up to 300 casual daily workers. In 2006, in partnership with local JU partners PT Agro Giri Perkasa, a breeding program was established at the PT JJAA Lampung feedlot. Since 2006, 5,000 pregnant Brahman cross cows have been distributed throughout Indonesia supporting the increase in Indonesia’s national cattle population.
As part of corporate social responsibility (CSR) toward surrounding villages, PT JJAA has a number of routine and non-routine CSR projects including providing clean water facilities in each of its surrounding villages, building infrastructure (road and bridge), scholarships and providing financial assistance to the surrounding villages’ development.
$2.00
$2.00
$1.80
$1.80
$1.60
$1.40
$1.20
$1.00
Jan
2010
Jul 2
010
Jan
2011
Jul 2
011
Jan
2012
Jul 2
012
Jan
2013
Jul 2
013
Jan
2014
Jul 2
014
Darwin Steer Live Export Price c/kg lwt
3332 Section 4 – Development
Above: Inspecting the JJAA feedlot in Lampung, Indonesia. L to R: Dicky Adiwoso, Susan Low, Nyoman Budiasa, Troy Setter, William Bullo, Giki Argadiraksa and Parno.
Above: Lake Woods Holdings directors’, and Frontier Executive with the Hasan family at the Tanjung Unggul Mandiri (TUM) feedlot, Jakarta, Indonesia.
140
240
50
160
40
Indonesia wet market prices - beef from Australian live cattle ‘000 rupiah/kg - currency exchange on 31 Jan 2014, 1 AUD = 10 690 Rupiah
TenderloinKey
ChuckShank
Jan 2007 Jan 2008 Jan 2009 Jan 2010 Jan 2011 Jan 2012 Jan 2013 Jan 2014
Source: Morelink Asia Pacific.

Capital Expenditure projects are performed each year and undergo rigorous analysis before their final approval from the Board of Directors. Managers are encouraged to think of innovative ideas and projects that will increase the performance of their properties and the group as a whole. One such project is at Manbulloo Station and Manager, Cameron Kruckow, is currently working with his General Manager, Jock Warriner, to draw together a proposal to more intensively manage the property, create a new pathway to markets and therefore increase profitability.
Over the past five years, CPC has invested in large capital expenditure projects that aim to enable the group to deliver a consistent supply of cattle to our live export markets. In 2013, customers were asking CPC to deliver 3,000 head of live export cattle every month from 2014. This would involve CPC moving away from a traditional and opportunistic approach to sales in Indonesia to a more innovative and planned approach. The consistent delivery of cattle within tight specification guidelines through the months of January to March has never been done before by CPC.
The annual wet season in the North has traditionally been a time when operations are forced to stop. Horses, cattle and people suffer under the extreme heat and wet conditions - over 40°C and 90-100% humidity- but most detrimentally, access is cut off due to vehicles bogging in the muddy earth and the inability to truck cattle. As a result, an increase in demand occurs and higher prices are available during the period between December and March, primarily from live export markets.
Manbulloo is different from other CPC properties in that it has the major highway of the Northern Territory at its front gate, providing access to the major live export ports in the north or to the domestic southern markets. Direct highway access gives the station a good opportunity to work towards delivering a consistent supply of cattle year round. A balance will have to be made, however, between the risk of potential operational cost “blow outs” which may occur due to operating in the weather conditions and the high market premiums at that time.
Although this project is relatively small considering the size of the CPC herd, it has the potential to be used as a benchmark to work towards for other stations.
ConceptAn innovative, time-controlled, high-density grazing plan to sustainably produce the right cattle at the right time for minimum operational cost. Rotational grazing - as opposed to continuous grazing- has long been a recognized practice for better utilizing and sustaining pastures, increasing carrying capacity and in turn, increasing profitability. It is a grazing style that is prevalent in southern states for intensive purposes such as dairy cattle management and is generally used on well-developed agricultural land with productive soils and a high annual rainfall average. Continuous grazing is a traditional management style whereby cattle forage in a paddock year round which incurs minimal cost. The method has proven to degrade the pasture quality as cattle selectively target the best grasses and shrubs to sustain themselves.
Studies have shown that grazing at high density for short periods of time is effective on pasture in key ways. Firstly, the cattle are forced to be less selective, which gives the desirable grasses more opportunity to grow. Secondly, waste, undesirable fodder and hayed off grasses are trampled into the ground, providing natural fertilisation and aeration of the soil. Thirdly, the rest period enables the grasses to re-substantiate themselves with new leaves that are easily accessed. The challenge with intensely managing northern Australian pastures for cattle production and implementing rotational grazing is that the paddocks are of huge scale, rough terrain and subject to extreme
and variable weather conditions. The fencing infrastructure that contains cattle within paddocks is difficult and sometimes impossible to maintain. Simply finding, processing and moving cattle is often very difficult and very costly if done effectively. The Manbulloo project is designed to overcome these hurdles.
The country that has been earmarked for this development is approximately 2,000ha and located close to the station complex. Fences will need to be erected to enclose 23 separate paddocks ranging from 1 to 100 hectares in size. It will be heavily stocked throughout the wet season between December and March, allowing use of grass in
the second phase of growth when it is at its most palatable and highest nutritional value. Once all the stock have been sold over the wet season, the country will be reduced to zero head to recover. The grazing management during the wet season will incur minimal cost and only require two people, work dogs and a motorbike as the cattle can primarily be shifted from one paddock to the next by shifting their source of water. The project would be primarily for the wet season live export trade, however the project can be market flexible and used not only for feeders but for cow and calf units as well.
3534 Section 4 – Development
Capital development
Above: Manbulloo Station Above right: Grazing cattle, Manbulloo Station
Innovative grazing: Manbulloo
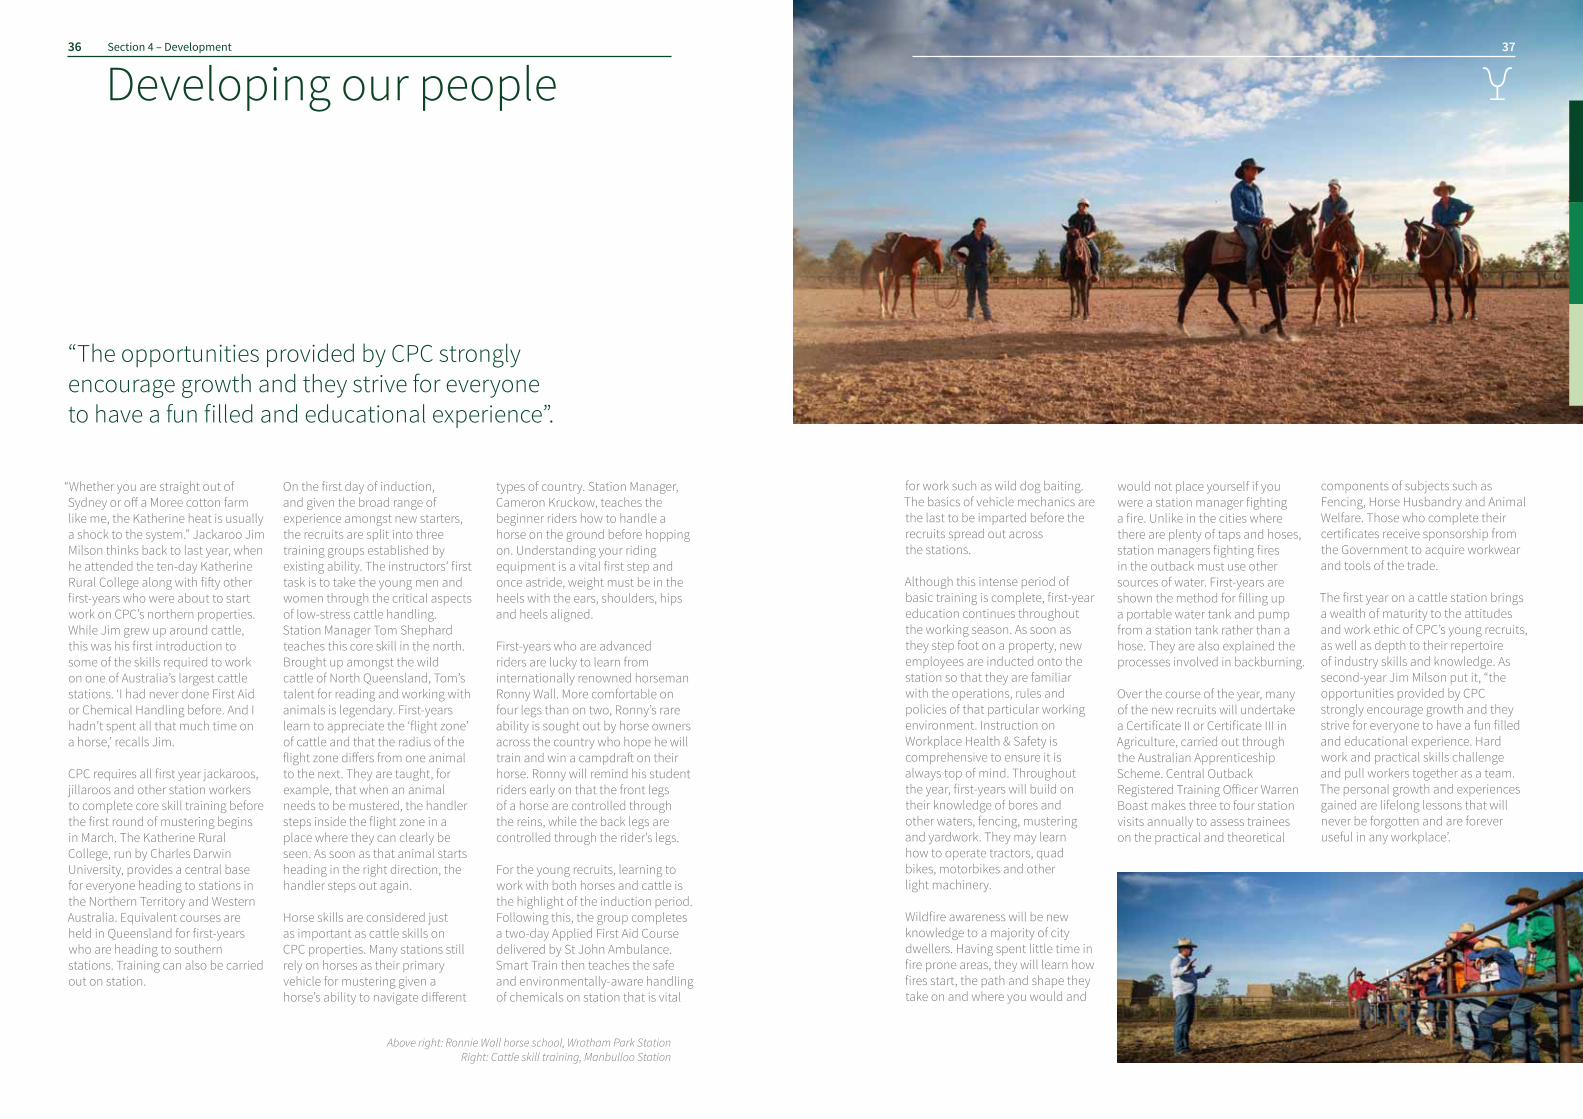
“Whether you are straight out of Sydney or off a Moree cotton farm like me, the Katherine heat is usually a shock to the system.” Jackaroo Jim Milson thinks back to last year, when he attended the ten-day Katherine Rural College along with fifty other first-years who were about to start work on CPC’s northern properties. While Jim grew up around cattle, this was his first introduction to some of the skills required to work on one of Australia’s largest cattle stations. ‘I had never done First Aid or Chemical Handling before. And I hadn’t spent all that much time on a horse,’ recalls Jim. CPC requires all first year jackaroos, jillaroos and other station workers to complete core skill training before the first round of mustering begins in March. The Katherine Rural College, run by Charles Darwin University, provides a central base for everyone heading to stations in the Northern Territory and Western Australia. Equivalent courses are held in Queensland for first-years who are heading to southern stations. Training can also be carried out on station.
On the first day of induction, and given the broad range of experience amongst new starters, the recruits are split into three training groups established by existing ability. The instructors’ first task is to take the young men and women through the critical aspects of low-stress cattle handling. Station Manager Tom Shephard teaches this core skill in the north. Brought up amongst the wild cattle of North Queensland, Tom’s talent for reading and working with animals is legendary. First-years learn to appreciate the ‘flight zone’ of cattle and that the radius of the flight zone differs from one animal to the next. They are taught, for example, that when an animal needs to be mustered, the handler steps inside the flight zone in a place where they can clearly be seen. As soon as that animal starts heading in the right direction, the handler steps out again. Horse skills are considered just as important as cattle skills on CPC properties. Many stations still rely on horses as their primary vehicle for mustering given a horse’s ability to navigate different
types of country. Station Manager, Cameron Kruckow, teaches the beginner riders how to handle a horse on the ground before hopping on. Understanding your riding equipment is a vital first step and once astride, weight must be in the heels with the ears, shoulders, hips and heels aligned. First-years who are advanced riders are lucky to learn from internationally renowned horseman Ronny Wall. More comfortable on four legs than on two, Ronny’s rare ability is sought out by horse owners across the country who hope he will train and win a campdraft on their horse. Ronny will remind his student riders early on that the front legs of a horse are controlled through the reins, while the back legs are controlled through the rider’s legs. For the young recruits, learning to work with both horses and cattle is the highlight of the induction period. Following this, the group completes a two-day Applied First Aid Course delivered by St John Ambulance. Smart Train then teaches the safe and environmentally-aware handling of chemicals on station that is vital
for work such as wild dog baiting. The basics of vehicle mechanics are the last to be imparted before the recruits spread out across the stations. Although this intense period of basic training is complete, first-year education continues throughout the working season. As soon as they step foot on a property, new employees are inducted onto the station so that they are familiar with the operations, rules and policies of that particular working environment. Instruction on Workplace Health & Safety is comprehensive to ensure it is always top of mind. Throughout the year, first-years will build on their knowledge of bores and other waters, fencing, mustering and yardwork. They may learn how to operate tractors, quad bikes, motorbikes and other light machinery.
Wildfire awareness will be new knowledge to a majority of city dwellers. Having spent little time in fire prone areas, they will learn how fires start, the path and shape they take on and where you would and
would not place yourself if you were a station manager fighting a fire. Unlike in the cities where there are plenty of taps and hoses, station managers fighting fires in the outback must use other sources of water. First-years are shown the method for filling up a portable water tank and pump from a station tank rather than a hose. They are also explained the processes involved in backburning. Over the course of the year, many of the new recruits will undertake a Certificate II or Certificate III in Agriculture, carried out through the Australian Apprenticeship Scheme. Central Outback Registered Training Officer Warren Boast makes three to four station visits annually to assess trainees on the practical and theoretical
components of subjects such as Fencing, Horse Husbandry and Animal Welfare. Those who complete their certificates receive sponsorship from the Government to acquire workwear and tools of the trade. The first year on a cattle station brings a wealth of maturity to the attitudes and work ethic of CPC’s young recruits, as well as depth to their repertoire of industry skills and knowledge. As second-year Jim Milson put it, “the opportunities provided by CPC strongly encourage growth and they strive for everyone to have a fun filled and educational experience. Hard work and practical skills challenge and pull workers together as a team. The personal growth and experiences gained are lifelong lessons that will never be forgotten and are forever useful in any workplace’.
3736 Section 4 – Development
Developing our people
Above right: Ronnie Wall horse school, Wrotham Park Station Right: Cattle skill training, Manbulloo Station
“The opportunities provided by CPC strongly encourage growth and they strive for everyone to have a fun filled and educational experience”.
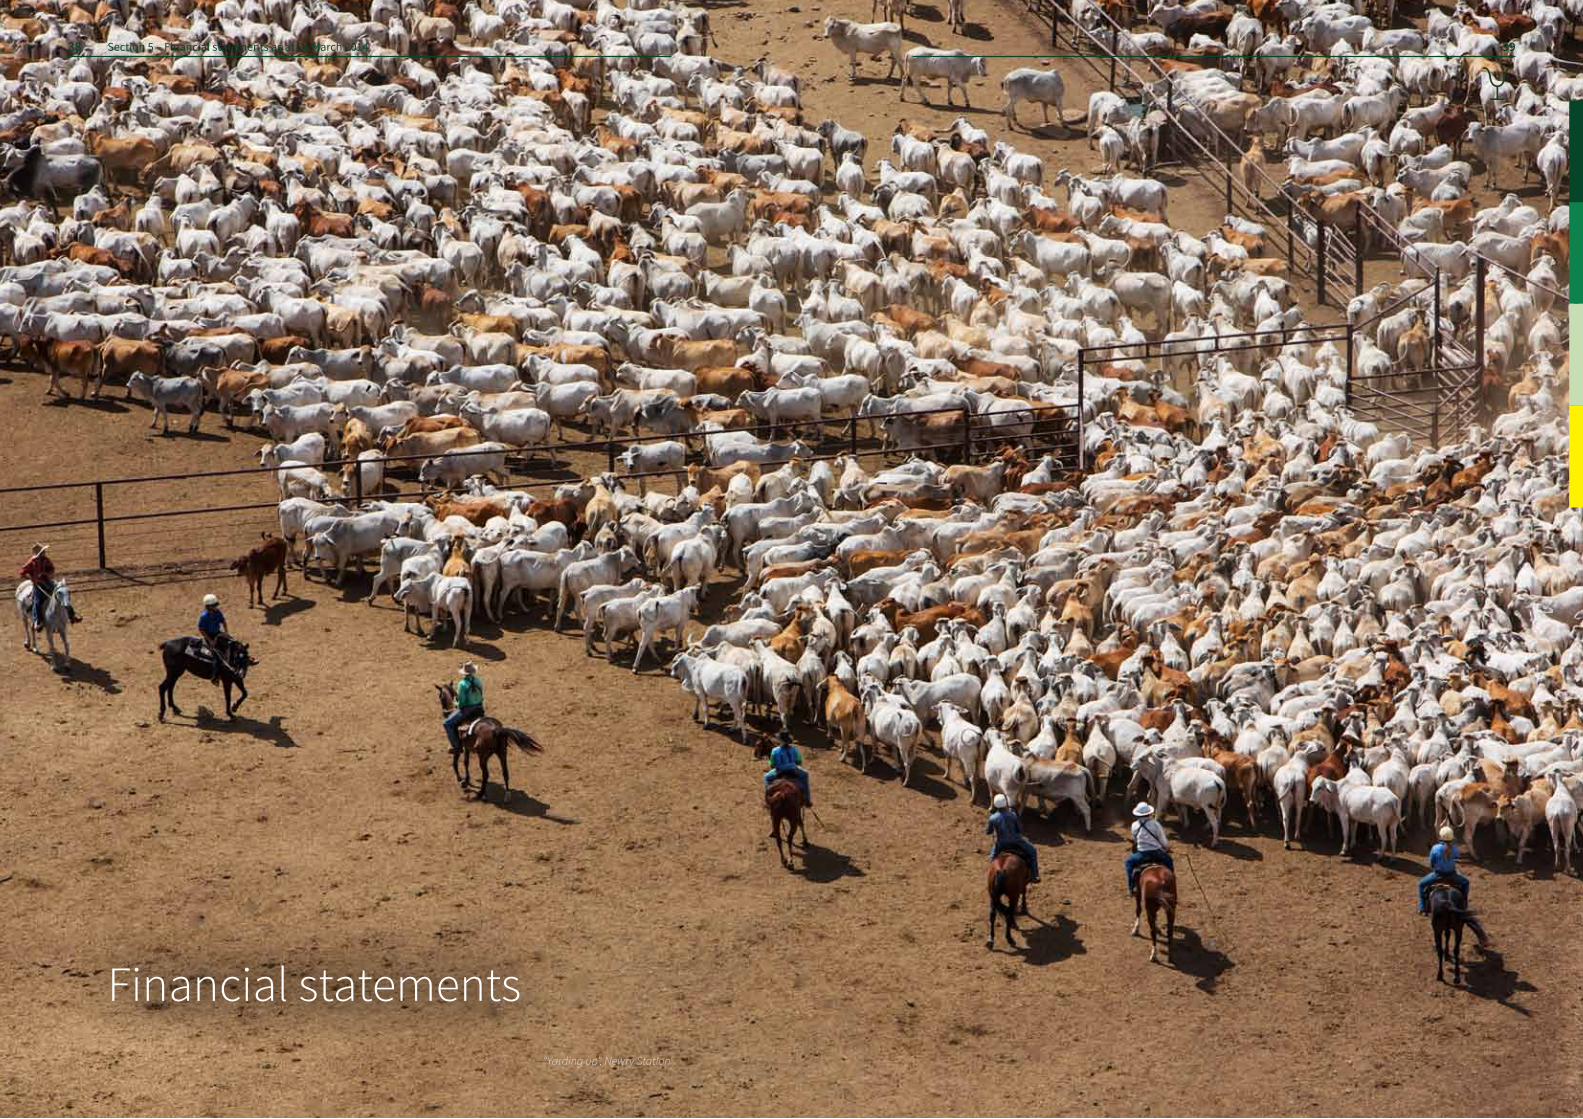
Financial statements
3938 Section 5 – Financial statements as at 31 March 2014
“Yarding up”, Newry Station
Corporate governance statement
The following paragraphs describe the key governance structures and internal controls operating within the company as at 31 March 2014. Through these mechanisms, the company aims to apply the highest standards of corporate governance.
Board constitution and procedures There were two executive directors and five non-executive directors on the Board as at 31 March 2014, with Mark Bahen as Chairman. The Chairman is responsible for the effective running of the Board and for communications with all directors. He ensures that the Board receives sufficient information on
financial trading and corporate issues prior to the board meetings. The executive directors are responsible for reporting to the Board on operations and the development of strategic plans for consideration by the Board as a whole. The Board meets regularly during the year. During the three months to 31 March 2013, one scheduled meeting was held in Australia. During the twelve months to 31 March 2014, six scheduled meetings were held, all in Australia. All members of the Board receive detailed financial and operational
information and regular presentations from executives on the business performance, in addition to items for decision and minutes of Board committees in advance of each board meeting, whether they are able to attend or not. This enables the directors to make informed decisions on corporate and business issues under consideration.
The Board has adopted a Corporate Governance Charter and a formal schedule of delegated authorities to facilitate decision making. Key policy and strategic decisions are made by
the full board. Such matters include, but are not limited to the final approval of the annual accounts and budget, major acquisitions and disposals, and any changes to the group’s financing arrangements and financial policies. Regular updates on legal and risk management, health and safety, and other key company policies are given to the Board. Where urgent decisions are required on matters specifically reserved for the Board in between meetings, there is a process in place to facilitate discussion and decision-making. The directors also have access to the advice and services of the Company Secretary and external advisers, as appropriate.
Board Committees The Board has established three committees, each with clearly defined terms of reference, procedures, responsibilities and powers.
Finance Committee This Committee is responsible for making recommendations to the Board on funding strategy, capital structure and management of financial risks as well as the policies and control procedures, approval of investments and divestments, raising of external financing and
the granting of securities, guarantees and indemnities as set out within the delegated authorities. In certain specific circumstances the Board has delegated authorities to the Committee to make decisions in these areas.
Audit Committee As at 31 March 2014, the Audit Committee was chaired by Sami Kassam. There were four members of the Audit Committee, all non-executive directors. The Chief Executive Officer, Chief Financial Officer and external auditors are normally invited to attend the Audit Committee meeting. The Committee meets at least twice annually at appropriate times in the reporting and audit cycle.
The Committee oversees the relationship with the external auditors. It reviews their audit plan and discusses audit findings with them. In addition, the Committee reviews the effectiveness of the group’s internal controls and risk management systems and also ensures that there is proportionate and independent investigation of any matter bought to their attention.
The Committee is required to assist the Board to fulfil its responsibilities related to external financial reporting and associated announcements. During the year the Committee reviewed either as a Committee or as part of the Board: • the annual financial statements, including the requirements for financial reporting; • changes proposed to the Company’s accounting policies and practices; • significant accounting issues; and • the audit plan and processes. The Committee is also responsible for the development, implementation and monitoring of the company’s policy on external audit. The Committee has oversight responsibility for monitoring independence, objectivity and compliance with ethical and regulatory requirements. The Committee recommends the appointment and reappointment of the company’s external auditors and annually reviews a formal letter provided by the external auditors confirming their independence and objectivity within the context of applicable regulatory requirements and professional standards.
4140 Section 5 – Financial statements
Lake Woods Holdings Pty Ltd’s Board believes that effective corporate governance is a fundamentalaspect of a well run company and is committed to achieving the highest standards of corporategovernance, corporate responsibility and risk management in directing and controlling the business.
Director Lake Woods Holdings Pty Ltd
Finance Committee
Audit Committee
Remuneration and Nominations Committee
Consolidated Pastoral Company Pty Ltd
Fergal LeamyChris EvansKeith WarrenJohn StevensonSteven WebberSami Kassam
Mark Bahen ✓ ✓ ✓ ✓✓ ✓ ✓ ✓✓ ✓ ✓ ✓ ✓✓ ✓ ✓✓ ✓✓✓ ✓ ✓
Board and Committee Composition as at 31 March 2014
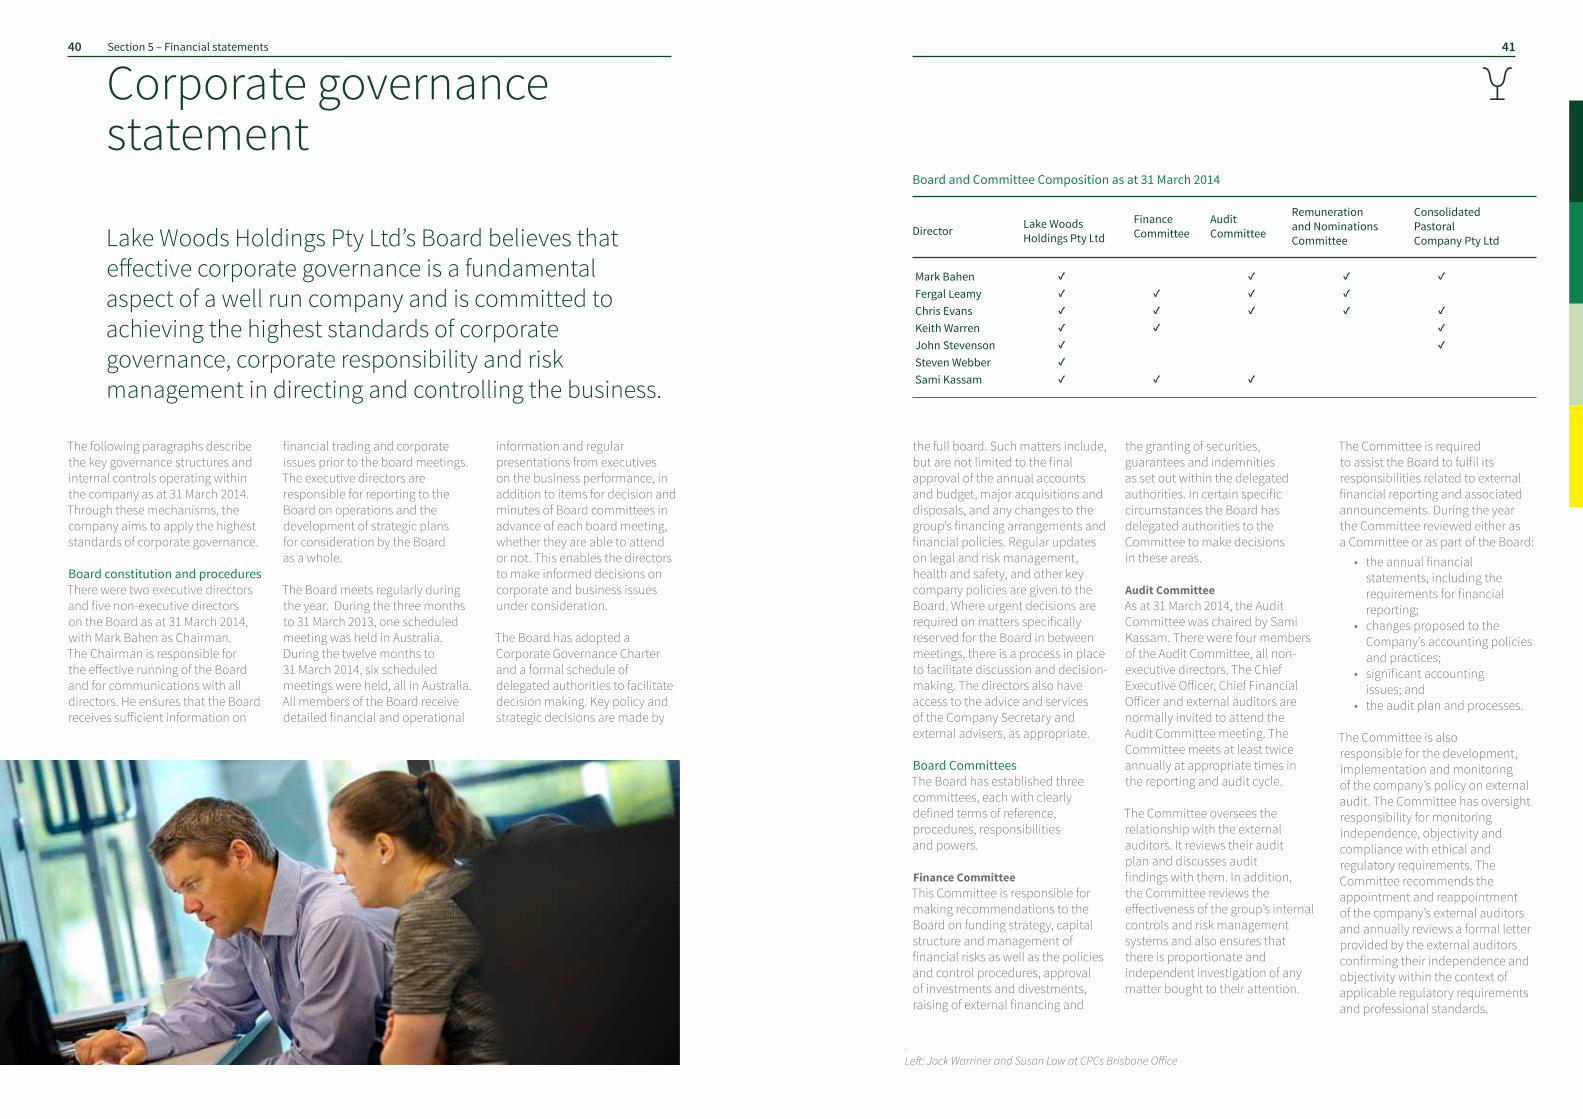
.Left: Jock Warriner and Susan Low at CPCs Brisbane Office
The Committee also reviews the terms of responsibility and scope of the audit (including schedules of unadjusted errors and representation letters) as set out in the external auditors’ engagement letter; the overall work plan for the forthcoming year, together with the cost effectiveness of the audit as well as the auditors’ remuneration and performance; any major issues which arise during the course of the audit and their resolution; key accounting and audit judgements; the level of errors identified during the audit; and the recommendations made to management by the auditors and management’s response. Remuneration and nominations Committee During the twelve months to 31 March 2014, the Remuneration and Nominations Committee was chaired by Mark Bahen and comprised three non-executive directors. The Committee meets at least twice a year and at such other times as the Board requires. The Committee’s specific duties and responsibilities are as follows: • to establish criteria to be used in selecting Directors and ensure the remuneration packages are designed to attract, motivate and retain staff of the highest calibre;
• to approve the remuneration of the executive directors and management, to provide independent and objective assessment of any benefits granted to directors and management; and • to ensure that the super- annuation arrangements throughout the Group are appropriate, well supervised and conform to applicable law.
The Committee will also review the design of incentive and performance related pay plans for approval by the Board and will review the company’s remuneration policies as a whole and remuneration trends across the group.
Operating board A meeting of the Consolidated Pastoral Company Pty Ltd Board is held quarterly as a minimum. During the three months to 31 March 2013, two scheduled meetings were held. During the 12 months to 31 March 2014, five scheduled meetings were held. This Board was chaired by Keith Warren and comprised two executive directors and two non-executive directors.
The Operating Board oversees the day to day management of the group’s on-property operations and reports to the Lake Woods Holdings Pty Ltd Board in accordance with
the Corporate Governance Charter and Board Delegated Authorities.
Change to year-end The Board of Directors of the company approved a change in the company’s financial year end from 31 December to 31 March annually effective from 31 March 2013.
This aligns with the growing season which starts at the completion of the wet season in Northern Australia and assists with forecasting and cash flow management. CPC prepared financial accounts for a three month accounting period from 1 January 2013 to 31 March 2013 then twelve month accounting periods followed. The 1 January 2013 to 31 March 2013 financial results are included within this Annual Report. CashpositionandfinancefacilitiesDuring the year the existing bank financing, which matured in 2014 was replaced with a new facility maturing in 2018. Debt finance facilities increased by $26.0m from 31 March 2013 to 31 March 2014 due to further drawdowns on the secured bank loans in order to fund capital expenditure projects to maintain and develop the group’s operating capacity, as well as to meet interest repayment obligations on the facility.
Borrowings comprise a single bilateral loan of $298.0m that is jointly funded by Rabo Bank ($200m) and ANZ ($98m). $269.5m of the facility has been utilised leaving $28.5m undrawn at 31 March 2014. Interest rates payable are hedged by agreements that covered approximately sixty percent of the drawn principal at 31 March 2014. As at the end of 2014, the outstanding loan to security value ratio was 38% compared to 34% at 31 March 2013. Cash on hand at 31 March 2014 was $18.1m including $15.0m deposited as security under the loan facility. Risk management and internal controls The company’s aim is to manage risk and to control its business and financial activities cost-effectively and in a manner that enables it to exploit profitable business opportunity in a disciplined way. The Board has overall responsibility for the systems of internal controls, which are designed to manage risk of failure to achieve the objectives of the business where such risk cannot be eliminated. The Board has considered the systems of internal control for the accounting year under review and is satisfied that they are appropriate.
Key business risksThe company and its subsidiaries in carrying out their principal business activities are affected by business risks arising from their trading environment and from an uncertain global economic environment.
The key business risks are highlighted below:
Seasonal risksWhilst CPC’s geographic spread of properties provides a natural hedge against seasonal variations, extreme occurrences (eg flood, droughts, fires) will have an impact on operations. Competition riskCPC operates in a competitive global protein market with varied competitors from other beef producers and other protein sources (eg pork, chicken).
Risk of market fluctuationAny material decrease in global beef prices will impact the sales and profitability of the company.
Risk of change in government policyAny change in the governments of Australia, Indonesia or China with regard to the sale and transport of cattle can affect the sales and profitability of the company.
Risk on currency movementsCPC’s major markets are overseas (particularly Indonesia) and any material movements in the Australian dollar will impact profits.
Disease riskThe Australian cattle industry is disease free and has an exceptional reputation worldwide for provision of high quality beef. As we have seen recently in other countries with foot and mouth disease, if these standards are compromised the reputational risk to Australian beef producers would be significant.
Workplace injury The nature of CPC’s business means employees are working with animals and machinery in remote locations. CPC engages a designated WH&S officer who develops and monitors group safety policies and formal operating procedures. A workplace injury could have an impact on business operations.
Key person riskCPC’s key management positions require considerable knowledge and expertise. The loss of people in key positions would impact the operation of the company.
4342 Section 5 – Financial statements
continued
Corporate governance statement
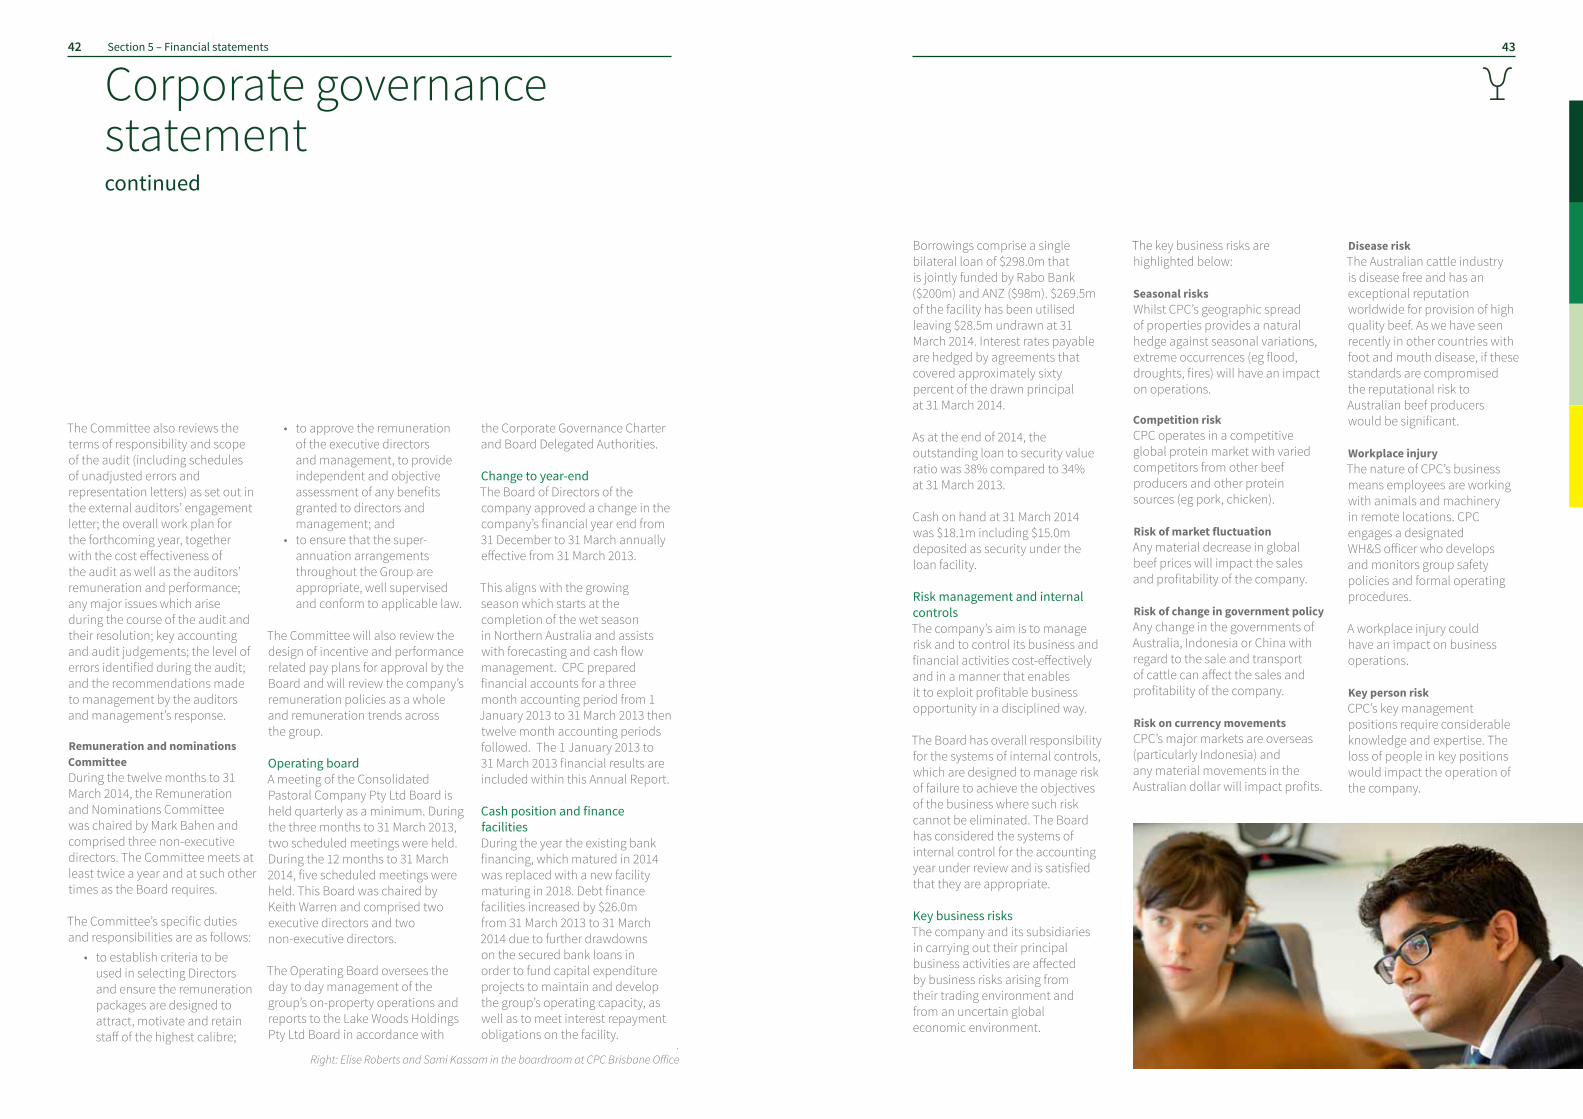
.Right: Elise Roberts and Sami Kassam in the boardroom at CPC Brisbane Office
The directors present their report together with the financial report of Lake Woods Holdings Pty Limited (“the Company”) and of the Group, being the Company, its subsidiaries and the Group’s interest in associates for the year ended 31 March 2014 and the auditor’s report thereon.
4544 Section 5 – Financial statements as at 31 March 2014
Directors’ report
Directors The directors of the Company at any time during or since the end of the financial period are:
Mark Bahen
Christopher Evans
Michael Kinski (Resigned on 21/10/13)
John Stevenson (Resigned on 04/04/14)
Steven Webber (Resigned on 14/05/14)
Fergal Leamy
Keith Warren (Appointed on 22/08/13 and resigned on 08/07/14)
Sami Kassam (Appointed on 22/10/13)
Elizabeth Walker (Appointed on 23/06/14)
Troy Setter (Appointed on 08/07/14)
Principal activitiesThe principal activities of the Group during the course of the financial year were ownership and operation of pastoral properties producing beef cattle. There were no significant changes in the nature of the activities of the Group during the year.
OperatingandfinancialreviewThe loss from operations for the Group after income tax amounted to $26,158K for the twelve months period ended 31 March 2014 versus a loss of $6,413K for the three months period ended 31 March 2013. The Group’s earnings before finance costs, income tax, depreciation, amortisation and impairment amounted to a profit of $95K for the twelve months ended 31 March 2014 versus a loss of $4,036K for the 3 month period ended 31 March 2013. The Group’s livestock assets increased in value to $256,926K as at 31 March 2014 versus $251,665K as at 31 March 2013. Livestock assets together with property, plant and equipment comprised 94.5% of the Group’s total assets as at year end. DividendsNo dividends were paid or declared by the Company to members during the period ended 31 March 2014 (2013: Nil). Likely developmentsThe Group will continue to pursue its policy of increasing profitability and market share during the next financial year. Further information about likely developments in the operations of the Group and
the expected results of those operations in future financial years has not been included in this report because disclosure of the information would be likely to result in unreasonable prejudice to the Group. Reporting periodThe Company altered its financial year end from 31 December to 31 March in the previous period to better align the Company’s financial reporting to the growing season which starts at the completion of the wet season in Northern Australia. This is consistent with a number of other pastoral operators in the region. The current financial period is a twelve month period from 1 April 2013 to 31 March 2014, whereas the comparative period is a three month period from 1 January 2013 to 31 March 2013. Events subsequent to reporting dateThere has not arisen in the interval between the end of the financial year and the date of this report any item, transaction or event of a material and unusual nature likely, in the opinion of the directors of the Company, to affect significantly
.Right: Roadtrains leaving Nockatunga Station
the operations of the Company, the results of those operations, or the state of affairs of the Company, in future financial years. Environmental regulationsThe Group’s operations are subject to various environmental regulations under both Commonwealth and State legislation. The Board believes that the Company has adequate systems in place for the management of its environment requirements and is not aware of any breaches of those environmental requirements as they apply to the Group.
RoundingoffThe Company is of a kind referred to in ASIC Class Order 98/100 dated 10 July 1998 and in accordance with that Class Order, amounts in the financial report and directors’ report have been rounded off to the nearest thousand dollars, unless otherwise stated. Lead auditor’s independence declaration under Section 307C of the Corporations Act 2001The Lead Auditor’s Independence Declaration is set out on page 46 and forms part of the directors’ report for the period ended 31 March 2014.
This report is made with a resolution of the directors:
Fergal Leamy Director BrisbaneDated this 14th day of July 2014

As at 31 March 2014
The notes on pages 52–66 are an integral part of these financial statements.
Consolidated Company
Note 31 Mar 2014
$’000
31 Mar 2013
$’000
31 Mar 2014
$’000
31 Mar 2013
$’000
Assets
Cash and cash equivalents 21(a) 3,187 2,502 8 28
Trade and other receivables 11 10,096 8,208 81,032 62,004
Biological assets 12 256,926 251,665 - -
Inventories 13 1,097 1,797 - -
Other assets 16 3,221 1,647 - -
Total current assets 274,527 265,819 81,040 62,032
Trade and other receivables 11 - 4,076 271,789 271,789
Investment in equity accounted investees 6,145 6,182 - -
Investment in subsidiaries 15 - - 95,846 95,846
Property, plant and equipment 14 407,527 423,161 - -
Deferred tax assets - - 60,498 43,844
Other assets 16 15,000 15,000 - -
Total non-current assets 428,672 448,419 428,133 411,479
Total assets 703,199 714,238 509,173 473,511
Liabilities
Trade and other payables 17 8,885 7,448 - -
Loans and borrowings 18 758 751 - -
Employee benefits 19 1,042 851 - -
Deferred income 285 692 - -
Total current liabilities 10,970 9,742 - -
Trade and other payables 17 678 4,258 - -
Loans and borrowings 18 269,500 243,500 82,741 61,182
Deferred tax liabilities 3,423 14,595 - -
Total non-current liabilities 273,601 262,353 82,741 61,182
Total liabilities 284,571 272,095 82,741 61,182
Net assets 418,628 442,143 426,432 412,329
Equity
Share capital 20 368,934 368,934 368,934 368,934
Reserves (81) (2,724) - -
Retained earnings 49,775 75,933 57,498 43,395
Total equity 418,628 442,143 426,432 412,329
4746 Section 5 – Financial statements as at 31 March 2014
Lead auditor’s independent declaration
Lead Auditor’s Independence Declaration under Section 307C of the Corporations Act 2001
To: the directors of Lake Woods Holdings Pty Limited I declare that, to the best of my knowledge and belief, in relation to the audit for the financial year ended 31 March 2014 there have been: (i) no contraventions of the auditor independence requirements as set out in the Corporations Act 2001 in relation to the audit; and (ii) no contraventions of any applicable code of professional conduct in relation to the audit.
KPMG
Matthew McCarron Partner Sydney 14 July 2014
Statement of financial position

For the year ended 31 March 2014
Consolidated Company
Note 12 months ended 31 Mar 2014
$’000
3 months ended 31 Mar 2013
$’000
12 months ended 31 Mar 2014
$’000
3 months ended 31 Mar 2013
$’000
Revenue 6 61,090 13,186 - -
Other income 7 2,882 613 - -
Personnel expenses (14,988) (2,694) - -
Livestock expenses (27,174) (11,350) - -
Property repairs and maintenance (5,597) (818) - -
Other expenses 8 (16,082) (3,029) (23) -
Share of net profit of equity accounted investees (net of income tax)
(36) 56 - -
Profit/(loss) from continuing operations before finance costs, income tax, depreciation, amortisation and impairment
95 (4,036) (23) -
Depreciation and amortisation (7,441) (1,195) - -
Impairment of properties (14,126) - - -
Profit/(loss) before finance costs and income tax expense
(21,472) (5,231) (23) -
Net finance income/(costs) 9 (16,990) (3,949) 19,025 4,691
Profit/(loss) before income tax (38,462) (9,180) 19,002 4,691
Income tax benefit/(expense) 10 12,304 2,767 (4,899) (1,407)
Profit/(loss) for the year (26,158) (6,413) 14,103 3,284
Other comprehensive income
Fair value revaluation of properties 195 - - -
Effective portion of changes in fair value of cash flow hedges
3,580 1,200 - -
Income tax on other comprehensive income (1,132) (360) - -
Other comprehensive income for the year, net of income tax
2,643 840 - -
Total comprehensive (loss)/ income for the year (23,515) (5,573) 14,103 3,284
The notes on pages 52–66 are an integral part of these financial statements.
For the year ended 31 March 2014
Consolidated Company
Issued capital
$’000
Hedging reserve
$’000
Revaluation reserve
$’000
Retained earnings
$’000
Total equity $’000
Balance at 1 January 2013 368,934 (3,820) 115 82,487 447,716
Total comprehensive income for the period
Profit for the period - - - (6,413) (6,413)
- - - (6,413) (6,413)
Other comprehensive income
Change in allocation of reserve - - 141 (141) -
Effective portion of changes in fair value of cash flow hedges, net of tax
- 840 - - 840
Total other comprehensive income for the period - 840 141 (141) 840
Balance at 31 March 2013 368,934 (2,980) 256 75,933 442,143
Balance at 1 April 2013 368,934 (2,980) 256 75,933 442,143
Total comprehensive income for the year
Loss for the year - - - (26,158) (26,158)
- - - (26,158) (26,158)
Other comprehensive income
Net change in fair value of properties - - 137 - 137
Effective portion of changes in fair value of cash flow hedges, net of tax
- 2,506 - - 2,506
Total other comprehensive income for the period - 2,506 137 - 2,643
Balance at 31 March 2014 368,934 (474) 393 49,775 418,628
The amounts recognised directly in equity are disclosed net of tax.The notes on pages 52–66 are an integral part of these financial statements.
4948 Section 5 – Financial statements as at 31 March 2014
Statement of comprehensive income
Statement of changes in equity Consolidated
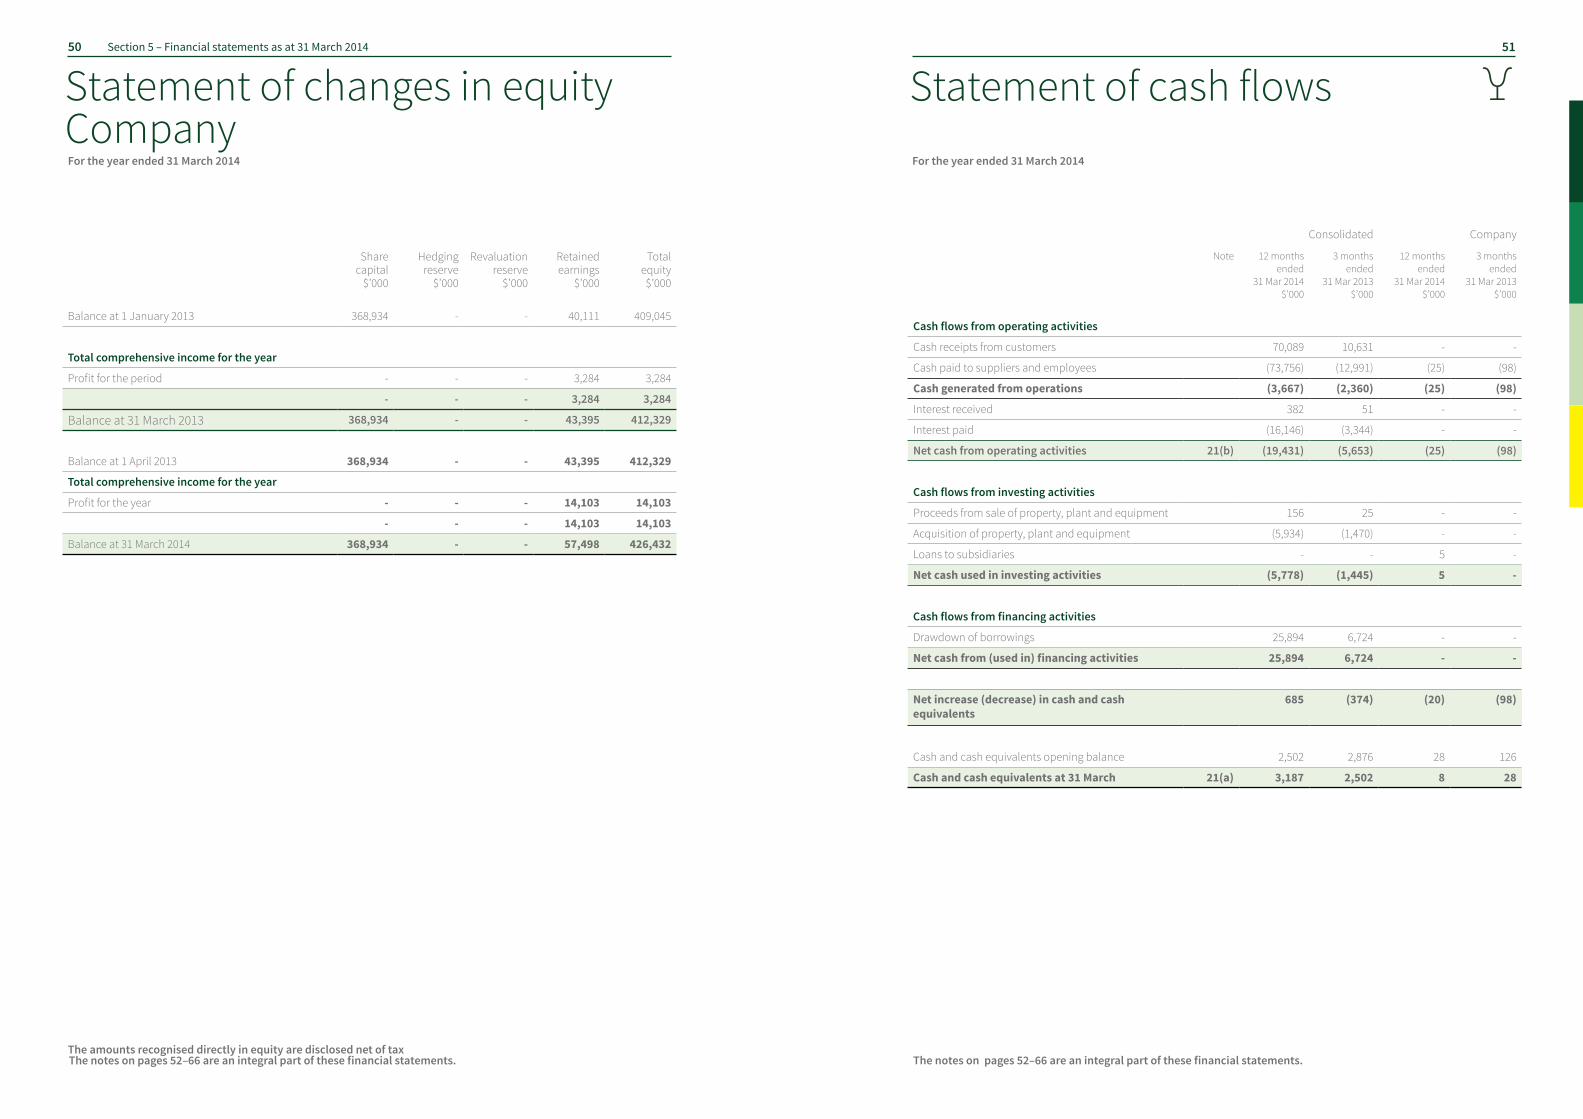
For the year ended 31 March 2014
Consolidated Company
Share capital
$’000
Hedging reserve
$’000
Revaluation reserve
$’000
Retained earnings
$’000
Total equity $’000
Balance at 1 January 2013 368,934 - - 40,111 409,045
Total comprehensive income for the year
Profit for the period - - - 3,284 3,284
- - - 3,284 3,284
Balance at 31 March 2013 368,934 - - 43,395 412,329
Balance at 1 April 2013 368,934 - - 43,395 412,329
Total comprehensive income for the year
Profit for the year - - - 14,103 14,103
- - - 14,103 14,103
Balance at 31 March 2014 368,934 - - 57,498 426,432
The amounts recognised directly in equity are disclosed net of taxThe notes on pages 52–66 are an integral part of these financial statements.
For the year ended 31 March 2014
Consolidated Company
Note 12 months ended
31 Mar 2014 $’000
3 months ended
31 Mar 2013 $’000
12 months ended
31 Mar 2014 $’000
3 months ended
31 Mar 2013 $’000
Cash flows from operating activities
Cash receipts from customers 70,089 10,631 - -
Cash paid to suppliers and employees (73,756) (12,991) (25) (98)
Cash generated from operations (3,667) (2,360) (25) (98)
Interest received 382 51 - -
Interest paid (16,146) (3,344) - -
Net cash from operating activities 21(b) (19,431) (5,653) (25) (98)
Cash flows from investing activities
Proceeds from sale of property, plant and equipment 156 25 - -
Acquisition of property, plant and equipment (5,934) (1,470) - -
Loans to subsidiaries - - 5 -
Net cash used in investing activities (5,778) (1,445) 5 -
Cash flows from financing activities
Drawdown of borrowings 25,894 6,724 - -
Net cash from (used in) financing activities 25,894 6,724 - -
Net increase (decrease) in cash and cash equivalents
685 (374) (20) (98)
Cash and cash equivalents opening balance 2,502 2,876 28 126
Cash and cash equivalents at 31 March 21(a) 3,187 2,502 8 28
The notes on pages 52–66 are an integral part of these financial statements.
5150 Section 5 – Financial statements as at 31 March 2014
Statement of changes in equity Company
Statement of cash flows
1. Reporting entity Lake Woods Holdings Pty Limited (the “Company”) is a Company domiciled in Australia. The address of the Company’s registered office is Newcastle Waters Station, Drovers Drive, Newcastle Waters, Northern Territory, Australia. The consolidated financial statements of the Company as at and for the period ended 31 March 2013 comprise the Company and its subsidiaries (together referred to as the “Group” and individually as “Group entities”) and the Group’s interest in associates and jointly controlled entities.
The Group is a for-profit entity and primarily is involved in producing beef cattle.
In the opinion of the directors, the Group is not a reporting entity. The financial statements of the Group and the Company have been drawn up as special purpose financial statements for distribution to the members and for the purpose of fulfilling the requirements of the Corporations Act 2001.
2. Basis of preparation Statement of compliance The special purpose financial statements have been prepared in accordance with the requirements of the Corporations Act 2001 and the recognition, measurement and classification aspects of all applicable Australian Accounting Standards (AASBs) adopted by the Australian Accounting Standards Board (AASB). The financial report does not include the disclosure requirements of all AASBs except for the following minimum requirements: AASB 101 Presentation of Financial Statements AASB 107 Statement of Cash Flows AASB 108 Accounting Policies, Changes in Accounting Estimates and Errors
AASB 1031 Materiality AASB 1048 Interpretation and Application of Standards AASB 1054 Australian Additional Disclosures Basis of measurement The consolidated financial statements have been prepared on the historical cost basis except for the following material items in the statement of financial position: • Derivative financial instruments are measured at fair value • Biological assets are measured at fair value less costs to sell • Land, buildings and improvements included within property, plant and equipment are measured at fair value. Functional and presentation currency These consolidated financial statements are presented in Australian dollars, which is the Company’s functional currency. The Company is of a kind referred to in ASIC Class Order 98/100 dated 10 July 1998 and in accordance with that Class Order, amounts in the financial report and directors’ report have been rounded off to the nearest thousand dollars, unless otherwise stated. Use of estimates and judgements The preparation of financial statements in conformity with AASBs requires management to make judgements, estimates and assumptions that affect the application of accounting policies and the reported amounts of assets, liabilities, income and expenses. Actual results may differ from these estimates. Estimates and underlying assumptions are reviewed on an ongoing basis. Revisions to accounting estimates are recognised in the period in which the estimate is revised and in any future periods affected.
Reporting period The Company has altered its financial year end from 31 December to 31 March in the previous period to better align the Company’s financial reporting to the growing season which starts at the completion of the wet season in Northern Australia. This is consistent with a number of other pastoral operators in the region. The current financial period is a twelve month period from 1 April 2013 to 31 March 2014, whereas the comparative period is a three month period from 1 January 2013 to 31 March 2013.
3. Significant accounting policies The accounting policies set out below have been applied consistently to all periods presented in these consolidated financial statements, and have been applied consistently by the Group entities. Certain comparative amounts have been reclassified to conform with the current year’s presentation. Basis of consolidation (i) Subsidiaries Subsidiaries are entities controlled by the Group. Control exists when the Group has the power to govern the financial and operating policies of an entity so as to obtain benefits from its activities. In assessing control, potential voting rights that currently are exercisable are taken into account. The financial statements of subsidiaries are included in the consolidated financial statements from the date that control commences until the date that control ceases. The accounting policies of subsidiaries have been changed when necessary to align them with the policies adopted by the Group.
continued
In the Company’s financial statements, investments in subsidiaries are carried at cost. (ii) Investments in associates and jointly controlled entities (equity- accounted investees) Associates are those entities in which the Group has significant influence, but not control, over the financial and operating policies. Significant influence is presumed to exist when the Company holds between 20 and 50 percent of the voting power of another entity. Jointly controlled entities are those entities over whose activities the Group has joint control, established by contractual agreement and requiring unanimous consent for strategic financial and operating decisions. Investments in associates and jointly controlled entities are accounted for using the equity method (equity-accounted investees) and are initially recognised at cost. The Group’s investment includes goodwill identified on acquisition, net of any accumulated impairment losses. The consolidated financial statements include the Group’s share of the profit or loss and other comprehensive income of equity-accounted investees, after adjustments to align the accounting policies with those of the Company, from the date that significant influence or joint control commences until the date that significant influence or joint control ceases. When the Group’s share of losses exceeds its interest in an equity-accounted investee, the carrying amount of that interest, including any long-term investments that form part thereof, is reduced to zero, and the recognition of further losses is discontinued except to the extent that the Group has an obligation or has made payments on behalf of the investee. In the Company’s financial statements, investments in jointly controlled entities are carried at cost.
(iii) Transactions eliminated on consolidation Intra-group balances and transactions, and any unrealised income and expenses arising from intra-group transactions are eliminated in preparing the consolidated financial statements. Unrealised gains arising from transactions with equity accounted investees are eliminated against the investment to the extent of the Group’s interest in the investee. Unrealised losses are eliminated in the same way as unrealised gains, but only to the extent that there is no evidence of impairment. Gains and losses are recognised when the contributed assets are consumed or sold by the equity accounted investees or, if not consumed or sold by the equity accounted investee, when the Group’s interest in such entities is disposed of. Foreign currency transactions Transactions in foreign currencies are translated to the respective functional currencies of the Group at exchange rates at the dates of the transactions. Monetary assets and liabilities denominated in foreign currencies at the reporting date are retranslated to the functional currency at the exchange rate at that date. The foreign currency gain or loss on monetary items is the difference between amortised cost in the functional currency at the beginning of the period, adjusted for effective interest and payments during the period, and the amortised cost in foreign currency translated at the exchange rate at the end of the year. Non-monetary assets and liabilities denominated in foreign currencies that are measured at fair value are retranslated to the functional currency at the exchange rate at the date that the fair value was determined. Foreign currency differences arising on retranslation are recognised in profit or loss. Non-monetary items in a foreign currency that are measured in terms of historical cost are translated using the exchange rate at the date of the transaction.
Financial instruments (i) Non-derivative financial assets The Group initially recognises loans and receivables and deposits on the date that they are originated. All other financial assets (including assets designated at fair value through profit or loss) are recognised initially on the trade date at which the Group becomes a party to the contractual provisions of the instrument. The Group derecognises a financial asset when the contractual rights to the cash flows from the asset expire, or it transfers the rights to receive the contractual cash flows on the financial asset in a transaction in which substantially all the risks and rewards of ownership of the financial asset are transferred. Any interest in transferred financial assets that is created or retained by the Group is recognised as a separate asset or liability. Financial assets and liabilities are offset and the net amount presented in the statement of financial position when, and only when, the Group has a legal right to offset the amounts and intends either to settle on a net basis or to realise the asset and settle the liability simultaneously. The Group has the following non-derivative financial assets: held-to-maturity financial assets and loans and receivables. Held to maturity financial assets If the Group has the positive intent and ability to hold debt securities to maturity, then such financial assets are classified as held to maturity. Held to maturity financial assets are recognised initially at fair value plus any directly attributable transaction costs. Subsequent to initial recognition held-to-maturity financial assets are measured at amortised cost using the effective interest method, less any impairment losses. Any sale or reclassification of a more than insignificant amount of
5352 Section 5 – Financial statements as at 31 March 2014
Notes to the financial statements
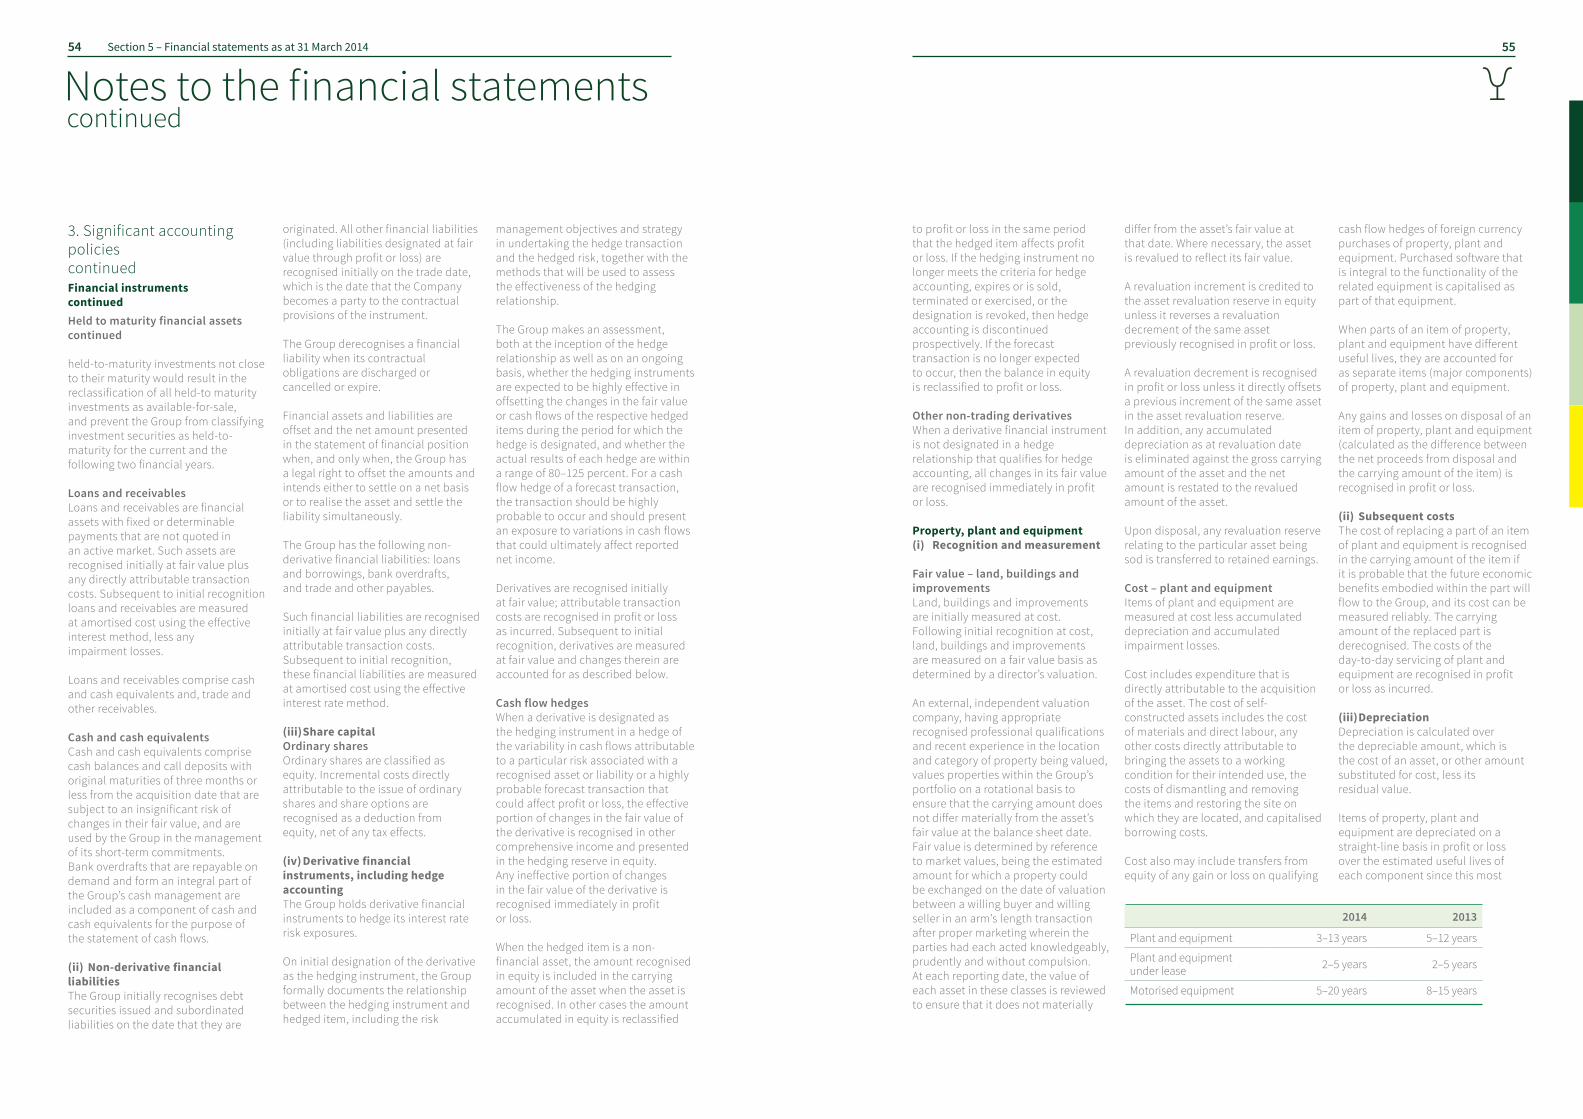
3. Significant accounting policies continued Financial instruments continued Held to maturity financial assets continued held-to-maturity investments not close to their maturity would result in the reclassification of all held-to maturity investments as available-for-sale, and prevent the Group from classifying investment securities as held-to-maturity for the current and the following two financial years. Loans and receivables Loans and receivables are financial assets with fixed or determinable payments that are not quoted in an active market. Such assets are recognised initially at fair value plus any directly attributable transaction costs. Subsequent to initial recognition loans and receivables are measured at amortised cost using the effective interest method, less any impairment losses. Loans and receivables comprise cash and cash equivalents and, trade and other receivables. Cash and cash equivalents Cash and cash equivalents comprise cash balances and call deposits with original maturities of three months or less from the acquisition date that are subject to an insignificant risk of changes in their fair value, and are used by the Group in the management of its short-term commitments. Bank overdrafts that are repayable on demand and form an integral part of the Group’s cash management are included as a component of cash and cash equivalents for the purpose of the statement of cash flows. (ii) Non-derivative financial liabilities The Group initially recognises debt securities issued and subordinated liabilities on the date that they are
originated. All other financial liabilities (including liabilities designated at fair value through profit or loss) are recognised initially on the trade date, which is the date that the Company becomes a party to the contractual provisions of the instrument. The Group derecognises a financial liability when its contractual obligations are discharged or cancelled or expire. Financial assets and liabilities are offset and the net amount presented in the statement of financial position when, and only when, the Group has a legal right to offset the amounts and intends either to settle on a net basis or to realise the asset and settle the liability simultaneously. The Group has the following non-derivative financial liabilities: loans and borrowings, bank overdrafts, and trade and other payables. Such financial liabilities are recognised initially at fair value plus any directly attributable transaction costs. Subsequent to initial recognition, these financial liabilities are measured at amortised cost using the effective interest rate method. (iii) Share capital Ordinary shares Ordinary shares are classified as equity. Incremental costs directly attributable to the issue of ordinary shares and share options are recognised as a deduction from equity, net of any tax effects. (iv) Derivative financial instruments, including hedge accounting The Group holds derivative financial instruments to hedge its interest rate risk exposures. On initial designation of the derivative as the hedging instrument, the Group formally documents the relationship between the hedging instrument and hedged item, including the risk
management objectives and strategy in undertaking the hedge transaction and the hedged risk, together with the methods that will be used to assess the effectiveness of the hedging relationship. The Group makes an assessment, both at the inception of the hedge relationship as well as on an ongoing basis, whether the hedging instruments are expected to be highly effective in offsetting the changes in the fair value or cash flows of the respective hedged items during the period for which the hedge is designated, and whether the actual results of each hedge are within a range of 80–125 percent. For a cash flow hedge of a forecast transaction, the transaction should be highly probable to occur and should present an exposure to variations in cash flows that could ultimately affect reported net income. Derivatives are recognised initially at fair value; attributable transaction costs are recognised in profit or loss as incurred. Subsequent to initial recognition, derivatives are measured at fair value and changes therein are accounted for as described below. Cash flow hedges When a derivative is designated as the hedging instrument in a hedge of the variability in cash flows attributable to a particular risk associated with a recognised asset or liability or a highly probable forecast transaction that could affect profit or loss, the effective portion of changes in the fair value of the derivative is recognised in other comprehensive income and presented in the hedging reserve in equity. Any ineffective portion of changes in the fair value of the derivative is recognised immediately in profit or loss. When the hedged item is a non-financial asset, the amount recognised in equity is included in the carrying amount of the asset when the asset is recognised. In other cases the amount accumulated in equity is reclassified
to profit or loss in the same period that the hedged item affects profit or loss. If the hedging instrument no longer meets the criteria for hedge accounting, expires or is sold, terminated or exercised, or the designation is revoked, then hedge accounting is discontinued prospectively. If the forecast transaction is no longer expected to occur, then the balance in equity is reclassified to profit or loss. Other non-trading derivatives When a derivative financial instrument is not designated in a hedge relationship that qualifies for hedge accounting, all changes in its fair value are recognised immediately in profit or loss. Property, plant and equipment (i) Recognition and measurement Fair value – land, buildings and improvements Land, buildings and improvements are initially measured at cost. Following initial recognition at cost, land, buildings and improvements are measured on a fair value basis as determined by a director’s valuation. An external, independent valuation company, having appropriate recognised professional qualifications and recent experience in the location and category of property being valued, values properties within the Group’s portfolio on a rotational basis to ensure that the carrying amount does not differ materially from the asset’s fair value at the balance sheet date. Fair value is determined by reference to market values, being the estimated amount for which a property could be exchanged on the date of valuation between a willing buyer and willing seller in an arm’s length transaction after proper marketing wherein the parties had each acted knowledgeably, prudently and without compulsion. At each reporting date, the value of each asset in these classes is reviewed to ensure that it does not materially
differ from the asset’s fair value at that date. Where necessary, the asset is revalued to reflect its fair value. A revaluation increment is credited to the asset revaluation reserve in equity unless it reverses a revaluation decrement of the same asset previously recognised in profit or loss. A revaluation decrement is recognised in profit or loss unless it directly offsets a previous increment of the same asset in the asset revaluation reserve. In addition, any accumulated depreciation as at revaluation date is eliminated against the gross carrying amount of the asset and the net amount is restated to the revalued amount of the asset. Upon disposal, any revaluation reserve relating to the particular asset being sod is transferred to retained earnings. Cost – plant and equipment Items of plant and equipment are measured at cost less accumulated depreciation and accumulated impairment losses. Cost includes expenditure that is directly attributable to the acquisition of the asset. The cost of self-constructed assets includes the cost of materials and direct labour, any other costs directly attributable to bringing the assets to a working condition for their intended use, the costs of dismantling and removing the items and restoring the site on which they are located, and capitalised borrowing costs. Cost also may include transfers from equity of any gain or loss on qualifying
cash flow hedges of foreign currency purchases of property, plant and equipment. Purchased software that is integral to the functionality of the related equipment is capitalised as part of that equipment. When parts of an item of property, plant and equipment have different useful lives, they are accounted for as separate items (major components) of property, plant and equipment. Any gains and losses on disposal of an item of property, plant and equipment (calculated as the difference between the net proceeds from disposal and the carrying amount of the item) is recognised in profit or loss. (ii) Subsequent costs The cost of replacing a part of an item of plant and equipment is recognised in the carrying amount of the item if it is probable that the future economic benefits embodied within the part will flow to the Group, and its cost can be measured reliably. The carrying amount of the replaced part is derecognised. The costs of the day-to-day servicing of plant and equipment are recognised in profit or loss as incurred. (iii) Depreciation Depreciation is calculated over the depreciable amount, which is the cost of an asset, or other amount substituted for cost, less its residual value. Items of property, plant and equipment are depreciated on a straight-line basis in profit or loss over the estimated useful lives of each component since this most
2014 2013
Plant and equipment 3–13 years 5–12 years
Plant and equipment under lease 2–5 years 2–5 years
Motorised equipment 5–20 years 8–15 years
5554 Section 5 – Financial statements as at 31 March 2014
continuedNotes to the financial statements
3. Significant accounting policies continued Property, plant and equipment continued closely reflects the expected pattern of consumption of the future economic benefits embodied in the asset. Leased assets are depreciated over the shorter of the lease term and their useful lives unless it is reasonably certain that the Group will obtain ownership by the end of the lease term. The estimated useful lives for the current and comparative years of significant items of property, plant and equipment are as follows: Depreciation methods, useful lives and residual values are reviewed at each reporting date and adjusted if appropriate. (iv) Pastoral leases The Group has pastoral leases in the Northern Territory, Queensland and Western Australia. The Northern Territory leases are either pastoral lease for term with right to apply for extension or perpetual pastoral lease. The Queensland and Western Australia leases are fixed term with the right to apply for a new lease at the expiration of the term of the existing lease. Intangible assets (i) Goodwill/discount on acquisition Goodwill (discount on acquisition) arises on the acquisition of subsidiaries, associates and jointly controlled entities. Goodwill represents the excess of the cost of the acquisition over the Group’s interest in the net fair value of the identifiable assets, liabilities and contingent liabilities of the acquiree.
Goodwill is measured at cost less accumulated impairment losses. In respect of equity accounted investees, the carrying amount of goodwill is included in the carrying amount of the investment. Biological assets Biological assets are comprised of livestock (cattle and horses) and are measured at fair value less estimated point-of-sale costs, with any change therein recognised in profit or loss. Point-of-sale costs include all costs that would be necessary to sell the assets (eg. road transport costs, agent commissions). An external, independent valuation company, having appropriate recognised professional qualifications and recent experience in the location and nature of cattle held by the Group performs a valuation for the reporting date. Fair value is determined by reference to market values for cattle of similar age, weight, breed and genetic make-up. The fair value represents the estimated amount for which cattle could be sold on the date of valuation between a willing buyer and willing seller in an arm’s length transaction after proper marketing wherein the parties had each acted knowledgably, prudently and without compulsion. Where market-determined prices or values may not be available for a biological asset in its present condition, the Group use the present value of expected net cash flows from the asset discounted at a current market-determined rate in determining fair value. Leased assets Leases in terms of which the Group assumes substantially all the risks and rewards of ownership are classified as finance leases. On initial recognition the leased asset is measured at an amount equal to the lower of its fair value and the present value of the minimum lease payments. Subsequent to initial recognition,
the asset is accounted for in accordance with the accounting policy applicable to that asset. Other leases are operating leases and are not recognised in the Group’s statement of financial position. Impairment (i) Non-derivative financial assets A financial asset not carried at fair value through profit or loss is assessed at each reporting date to determine whether there is objective evidence that it is impaired. A financial asset is impaired if there is objective evidence of impairment as a result of one or more events that occurred after the initial recognition of the asset, and that the loss event had a negative effect on the estimated future cash flows of that asset that can be estimated reliably. Objective evidence that financial assets (including equity securities) are impaired includes default or delinquency by a debtor, restructuring of an amount due to the Group on terms that the Group would not consider otherwise, indications that a debtor or issuer will enter bankruptcy, the disappearance of an active market for a security. In addition, for an investment in an equity security, a significant or prolonged decline in its fair value below its cost is objective evidence of impairment. The Group considers evidence of impairment for receivables and held-to-maturity investment securities at both a specific asset and collective level. All individually significant assets are assessed for specific impairment. Those found not to be specifically impaired are then collectively assessed for any impairment that has been incurred but not yet identified. In assessing collective impairment the Group uses historical trends of the probability of default, timing of recoveries and the amount of loss incurred, adjusted for management’s
judgement as to whether current economic and credit conditions are such that the actual losses are likely to be greater or less than suggested by historical trends. An impairment loss in respect of a financial asset measured at amortised cost is calculated as the difference between its carrying amount and the present value of the estimated future cash flows discounted at the asset’s original effective interest rate. Losses are recognised in profit or loss and reflected in an allowance account against receivables. Interest on the impaired asset continues to be recognised through the unwinding of the discount. When an event occurring after the impairment was recognised causes the amount of impairment loss to decrease, the decrease in impairment loss is reversed through profit or loss. (ii) Non-financial assets The carrying amounts of the Group’s non financial assets, other than biological assets and deferred tax assets, are reviewed at each reporting date to determine whether there is any indication of impairment. If any such indication exists, then the asset’s recoverable amount is estimated. The recoverable amount of an asset or CGU is the greater of its value in use and its fair value less costs to sell. In assessing value in use, the estimated future cash flows are discounted to their present value using a pre-tax discount rate that reflects current market assessments of the time value of money and the risks specific to the asset or CGU. For the purpose of impairment testing, assets that cannot be tested individually are grouped together into the smallest group of assets that generates cash inflows from continuing use that are largely independent of the cash inflows of other assets or CGUs.
The Group’s corporate assets do not generate separate cash inflows. If there is an indication that a corporate asset may be impaired, then the recoverable amount is determined for the CGU to which the corporate asset belongs. An impairment loss is recognised if the carrying amount of an asset or its CGU exceeds its estimated recoverable amount. Impairment losses are recognised in profit or loss. Impairment losses recognised in respect of CGUs are allocated to reduce the carrying amount of assets in the CGU (group of CGUs) on a pro rata basis. Impairment losses recognised in prior periods are assessed at each reporting date for any indications that the loss has decreased or no longer exists. An impairment loss is reversed if there has been a change in the estimates used to determine the recoverable amount. An impairment loss is reversed only to the extent that the asset’s carrying amount does not exceed the carrying amount that would have been determined, net of depreciation or amortisation, if no impairment loss had been recognised. Employee benefits (i) Defined contribution plans A defined contribution plan is a post-employment benefit plan under which an entity pays fixed contributions into a separate entity and will have no legal or constructive obligation to pay further amounts. Obligations for contributions to defined contribution pension plans are recognised as an employee benefit expense in profit or loss in the periods during which services are rendered by employees. Prepaid contributions are recognised as an asset to the extent that a cash refund or a reduction in future payments is available. Contributions to a defined contribution plan that are due more than 12 months after the end of the period in which the employees render the service are discounted to their present value.
(ii) Other long term employee benefits The Group’s net obligation in respect of long term employee benefits other than defined benefit plans is the amount of future benefit that employees have earned in return for their service in the current and prior periods; that benefit is discounted to determine its present value, and the fair value of any related assets is deducted. (iii) Termination benefits Termination benefits are recognised as an expense when the Group is committed demonstrably, without realistic possibility of withdrawal, to a formal detailed plan to either terminate employment before the normal retirement date, or to provide termination benefits as a result of an offer made to encourage voluntary redundancy. Termination benefits for voluntary redundancies are recognised as an expense if the Group has made an offer of voluntary redundancy, it is probable that the offer will be accepted, and the number of acceptances can be estimated reliably. If benefits are payable more than 12 months after the reporting date, then they are discounted to their present value. (iv) Short-term employee benefits Short-term employee benefit obligations are measured on an undiscounted basis and are expensed as the related service is provided. A liability is recognised for the amount expected to be paid under short term cash bonus or profit sharing plans if the Group has a present legal or constructive obligation to pay this amount as a result of past service provided by the employee, and the obligation can be estimated reliably. Revenue (i) Livestock Revenue from the sale of livestock is measured at the fair value of the consideration received or receivable. Revenue is recognised when the
5756 Section 5 – Financial statements as at 31 March 2014
continuedNotes to the financial statements
3. Significant accounting policies continued Revenue continued (i) Livestock continued significant risks and rewards of ownership have been transferred to the buyer, recovery of theconsideration is probable, the associated costs and possible return of goods can be estimated reliably, there is no continuing management involvement with the goods, and the amount of revenue can be measured reliably. The timing of the transfers of risks and rewards varies depending on the individual terms of the contract of sale. For export sales of cattle, usually transfer occurs when the product is received at the customer’s port. (ii) Change in fair value of biological assets Any increase or decrease in the fair value of biological assets is recognised as revenue in the Statement of Comprehensive Income. The movement is determined as the difference between the net market value at the beginning and the end of the period adjusted for purchases and sales during the period. Leases Payments made under operating leases are recognised in profit or loss on a straight line basis over the term of the lease. Lease incentives received are recognised as an integral part of the total lease expense, over the term of the lease. Minimum lease payments made under finance leases are apportioned between the finance expense and the reduction of the outstanding liability. The finance expense is allocated to each period during the lease term so
as to produce a constant periodic rate of interest on the remaining balance of the liability. Contingent lease payments are accounted for by revising the minimum lease payments over the remaining term of the lease when the lease adjustment is confirmed. Finance income and finance costs Finance income comprises interest income on funds. Interest income is recognised as it accrues in profit or loss, using the effective interest method. Finance costs comprise interest expense on borrowings, impairment losses recognised on financial assets, and losses on hedging instruments that are recognised in profit or loss. Borrowing costs that are not directly attributable to the acquisition, construction or production of a qualifying asset are recognised in profit or loss using the effective interest method. Foreign currency gains and losses are reported on a net basis. Income tax Income tax expense comprises current and deferred tax. Current tax and deferred tax are recognised in profit or loss except to the extent that it relates to items recognised directly in equity or in other comprehensive income. Current tax is the expected tax payable or receivable on the taxable income or loss for the year, using tax rates enacted or substantively enacted at the reporting date, and any adjustment to tax payable in respectof previous years. Deferred tax is recognised in respect of temporary differences between the carrying amounts of assets and liabilities for financial reporting
purposes and the amounts used for taxation purposes. Deferred tax is not recognised for: • temporary differences on the initial recognition of assets or liabilities in a transaction that is not a business combination and that affects neither accounting nor taxable profit or loss; and • temporary differences related to investments in subsidiaries and jointly controlled entities to the extent that it is probable that they will not reverse in the foreseeable future. Deferred tax is measured at the tax rates that are expected to be applied to temporary differences when they reverse, using tax rates enacted or substantively enacted at the reporting date. In determining the amount of current and deferred tax the Group takes into account the impact of uncertain tax positions and whether additional taxes and interest may be due. The Company believes that its accruals for tax liabilities are adequate for all open tax years based on its assessment of many factors, including interpretations of tax law and prior experience. This assessment relies on estimates and assumptions and may involve a series of judgements about future events. New information may become available that causes the Group to change its judgement regarding the adequacy of existing tax liabilities; such changes to tax liabilities will impact tax expense in the period that such a determination is made. Deferred tax assets and liabilities are offset if there is a legally enforceable right to offset current tax liabilities and assets, and they relate to income taxes levied by the same tax authority on the same taxable entity, or on different tax entities, but they intend to settle current tax liabilities and assets on
a net basis or their tax assets and liabilities will be realised simultaneously. A deferred tax asset is recognised for unused tax losses, tax credits and deductible temporary differences, to the extent that it is probable that future taxable profits will be available against which they can be utilised. Deferred tax assets are reviewed at each reporting date and are reduced to the extent that it is no longer probable that the related tax benefit will be realised. Additional income tax expenses that arise from the distribution of cash dividends are recognised at the same time that the liability to pay the related dividend is recognised. The Company does not distribute non-cash assets as dividends to its shareholders. (i) Tax consolidation The Company and its wholly-owned Australia resident entities are part of a tax-consolidated group. As a consequence, all members of the tax-consolidated group are taxed as a single entity. The head entity within the tax-consolidated group is Lake Woods Holdings Pty Limited. Current tax expense/income, deferred tax liabilities and deferred tax assets arising from temporary differences of the members of the tax-consolidated group are recognised in the separate financial statements of the members of the tax-consolidated group using the ‘separate taxpayer within group’ approach by reference to the carrying amounts of the assets and liabilities in the separate financial statements of each entity and their tax values applying under tax consolidation. Any current tax liabilities (or assets) and deferred tax assets arising from unused tax losses of the subsidiaries are assumed by the head entity of the tax-consolidated group and are recognised as amounts payable
(receivable) to other entities in the tax-consolidated group in conjunction with any tax funding arrangement amounts (refer below). Any difference between these amounts is recognised by the Company as an equity contribution from or distribution to the head entity. The Company recognises deferred tax assets arising from unused tax losses of the tax-consolidated group to the extent that it is probable that future taxable profits of the tax-consolidated group will be available against which the assets can be utilised. The Company assesses the recovery of its unused tax losses and tax credits only in the period in which they arise, and before assumption by the head entity, in accordance with AASB 112 applied in the context of the tax-consolidated group. Any subsequent period adjustments to deferred tax assets arising from unused tax losses as a result of revised assessments of the probability of recoverability are recognised by the head entity only. (ii) Nature of tax funding arrangement and tax sharing agreements The head entity, in conjunction with other members of the tax-consolidated group, has entered into a tax funding arrangement which sets out the funding obligations of members of the tax-consolidated group in respect of tax amounts. The tax funding arrangements require payments to/from the head entity equal to the current tax liability (asset) assumed by the head entity and any tax-loss deferred tax asset assumed by the head entity, resulting in the head entity recognising an inter-entity receivable/(payable) equal in amount to the tax liability/(asset) assumed. The inter-entity receivables/(payables) is at call. Contributions to fund the current tax liabilities are payable as per the tax funding arrangement and reflect the timing of the head entity’s obligation
to make payments for tax liabilities to the relevant tax authorities. The head entity, in conjunction with other members of the tax-consolidated group, has also entered into a tax sharing agreement. The tax sharing agreement provides for the determination of the allocation of income tax liabilities between the entities should the head entity default on its tax payment obligations. No amounts have been recognised in the financial statements in respect of this agreement as payment of any amounts under the tax sharing agreement is considered remote. Goods and services tax Revenue, expenses and assets are recognised net of the amount of goods and services tax (GST), except where the amount of GST incurred is not recoverable from the taxation authority. In these circumstances, the GST is recognised as part of the cost of acquisition of the asset or as part of the expense.
Receivables and payables are stated with the amount of GST included. The net amount of GST recoverable from, or payable to, the ATO is included as a current asset or liability in the statement of financial position. Cash flows are included in the statement of cash flows on a gross basis. The GST components of cash flows arising from investing and financing activities which are recoverable from, or payable to, the ATO are classified as operating cash flows. New standards and interpretations not yet adopted A number of new standards, amendments to standards and interpretations are effective for annual periods beginning after 1 January 2013, and have not been applied in preparing these financial statements. None of these is expected to have
5958 Section 5 – Financial statements as at 31 March 2014
continuedNotes to the financial statements
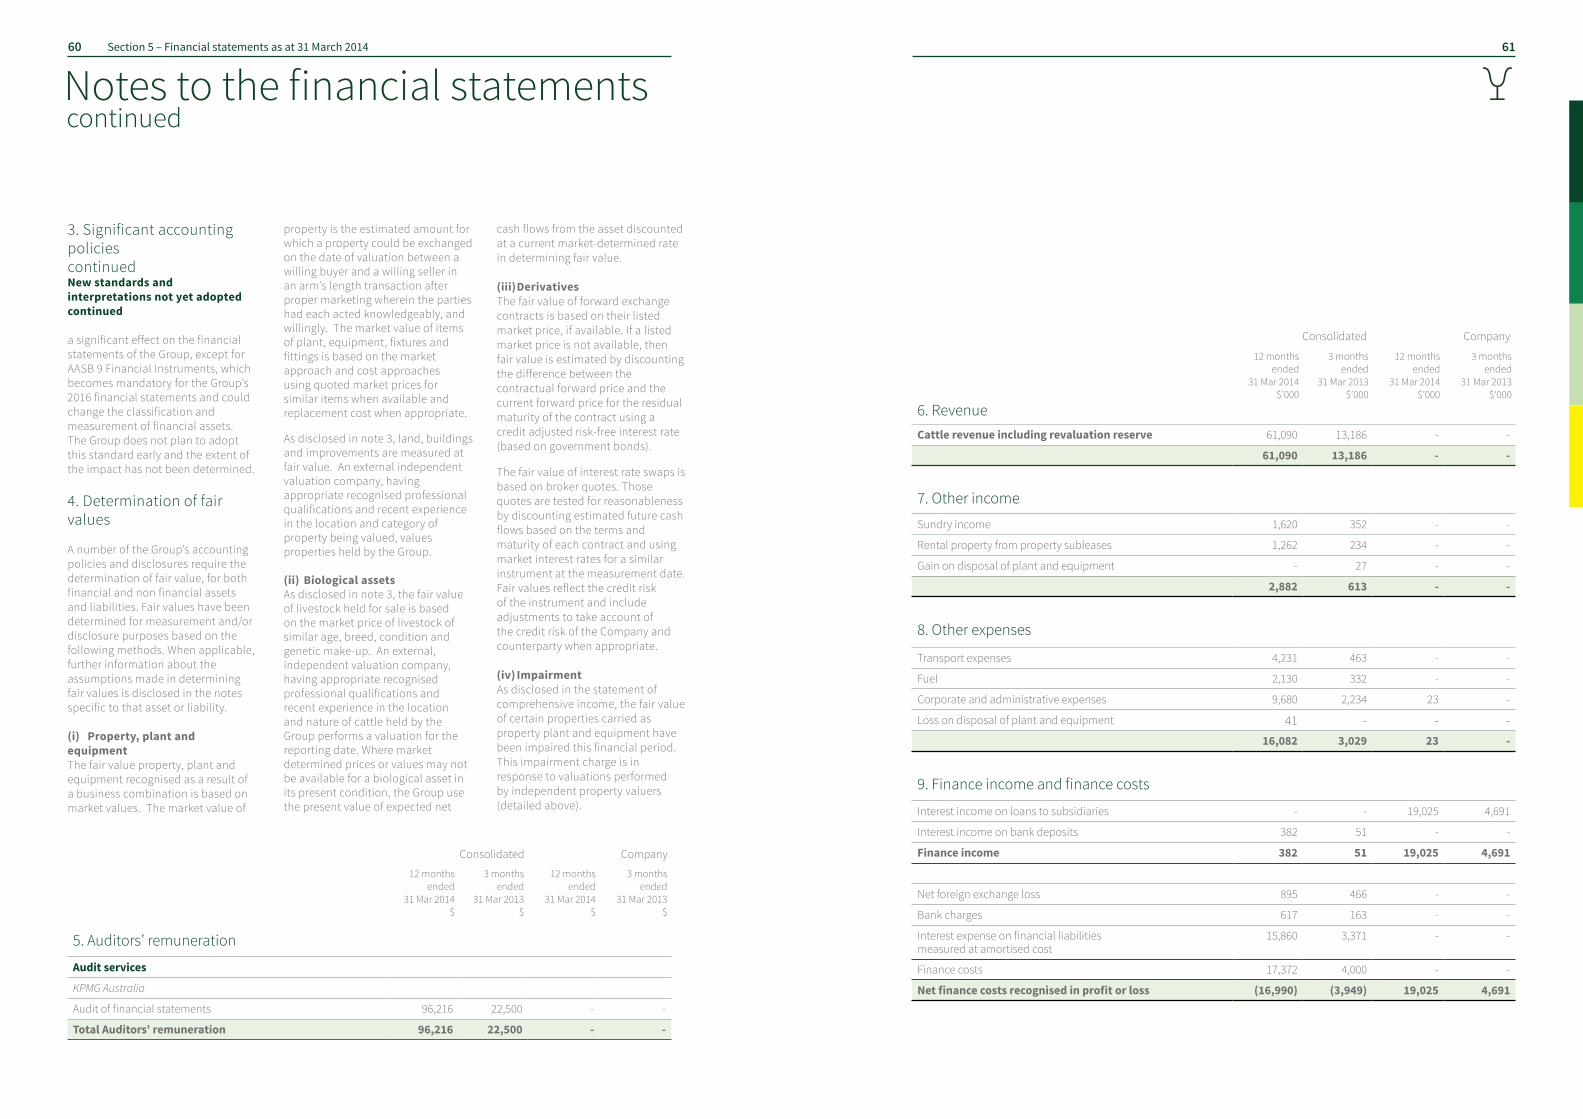
3. Significant accounting policies continued New standards and interpretations not yet adopted continued a significant effect on the financial statements of the Group, except for AASB 9 Financial Instruments, which becomes mandatory for the Group’s 2016 financial statements and could change the classification and measurement of financial assets. The Group does not plan to adopt this standard early and the extent of the impact has not been determined.
4. Determination of fair values A number of the Group’s accounting policies and disclosures require the determination of fair value, for both financial and non financial assets and liabilities. Fair values have been determined for measurement and/or disclosure purposes based on the following methods. When applicable, further information about the assumptions made in determining fair values is disclosed in the notes specific to that asset or liability. (i) Property, plant and equipment The fair value property, plant and equipment recognised as a result of a business combination is based on market values. The market value of
property is the estimated amount for which a property could be exchanged on the date of valuation between a willing buyer and a willing seller in an arm’s length transaction after proper marketing wherein the parties had each acted knowledgeably, and willingly. The market value of items of plant, equipment, fixtures and fittings is based on the market approach and cost approaches using quoted market prices for similar items when available and replacement cost when appropriate.
As disclosed in note 3, land, buildings and improvements are measured at fair value. An external independent valuation company, having appropriate recognised professional qualifications and recent experience in the location and category of property being valued, values properties held by the Group. (ii) Biological assets As disclosed in note 3, the fair value of livestock held for sale is based on the market price of livestock of similar age, breed, condition and genetic make-up. An external, independent valuation company, having appropriate recognised professional qualifications and recent experience in the location and nature of cattle held by the Group performs a valuation for the reporting date. Where market determined prices or values may not be available for a biological asset in its present condition, the Group use the present value of expected net
cash flows from the asset discounted at a current market-determined rate in determining fair value. (iii) Derivatives The fair value of forward exchange contracts is based on their listed market price, if available. If a listed market price is not available, then fair value is estimated by discounting the difference between the contractual forward price and the current forward price for the residual maturity of the contract using a credit adjusted risk-free interest rate (based on government bonds).
The fair value of interest rate swaps is based on broker quotes. Those quotes are tested for reasonableness by discounting estimated future cash flows based on the terms and maturity of each contract and using market interest rates for a similar instrument at the measurement date. Fair values reflect the credit risk of the instrument and include adjustments to take account of the credit risk of the Company and counterparty when appropriate. (iv) Impairment As disclosed in the statement of comprehensive income, the fair value of certain properties carried as property plant and equipment have been impaired this financial period. This impairment charge is in response to valuations performed by independent property valuers (detailed above).
Consolidated Company
Consolidated Company
12 months ended
31 Mar 2014 $’000
3 months ended
31 Mar 2013 $’000
12 months ended
31 Mar 2014 $’000
3 months ended
31 Mar 2013 $‘000
6. RevenueCattle revenue including revaluation reserve 61,090 13,186 - -
61,090 13,186 - -
7. Other income
Sundry income 1,620 352 - -
Rental property from property subleases 1,262 234 - -
Gain on disposal of plant and equipment - 27 - -
2,882 613 - -
8. Other expenses
Transport expenses 4,231 463 - -
Fuel 2,130 332 - -
Corporate and administrative expenses 9,680 2,234 23 -
Loss on disposal of plant and equipment 41 - - -16,082 3,029 23 -
9. Finance income and finance costs
Interest income on loans to subsidiaries - - 19,025 4,691
Interest income on bank deposits 382 51 - -
Finance income 382 51 19,025 4,691
Net foreign exchange loss 895 466 - -
Bank charges 617 163 - -
Interest expense on financial liabilities measured at amortised cost
15,860 3,371 - -
Finance costs 17,372 4,000 - -
Net finance costs recognised in profit or loss (16,990) (3,949) 19,025 4,691
6160 Section 5 – Financial statements as at 31 March 2014
continuedNotes to the financial statements
12 months ended
31 Mar 2014 $
3 months ended
31 Mar 2013 $
12 months ended
31 Mar 2014 $
3 months ended
31 Mar 2013 $
5. Auditors’ remuneration
Audit services
KPMG Australia
Audit of financial statements 96,216 22,500 - -
Total Auditors’ remuneration 96,216 22,500 - -
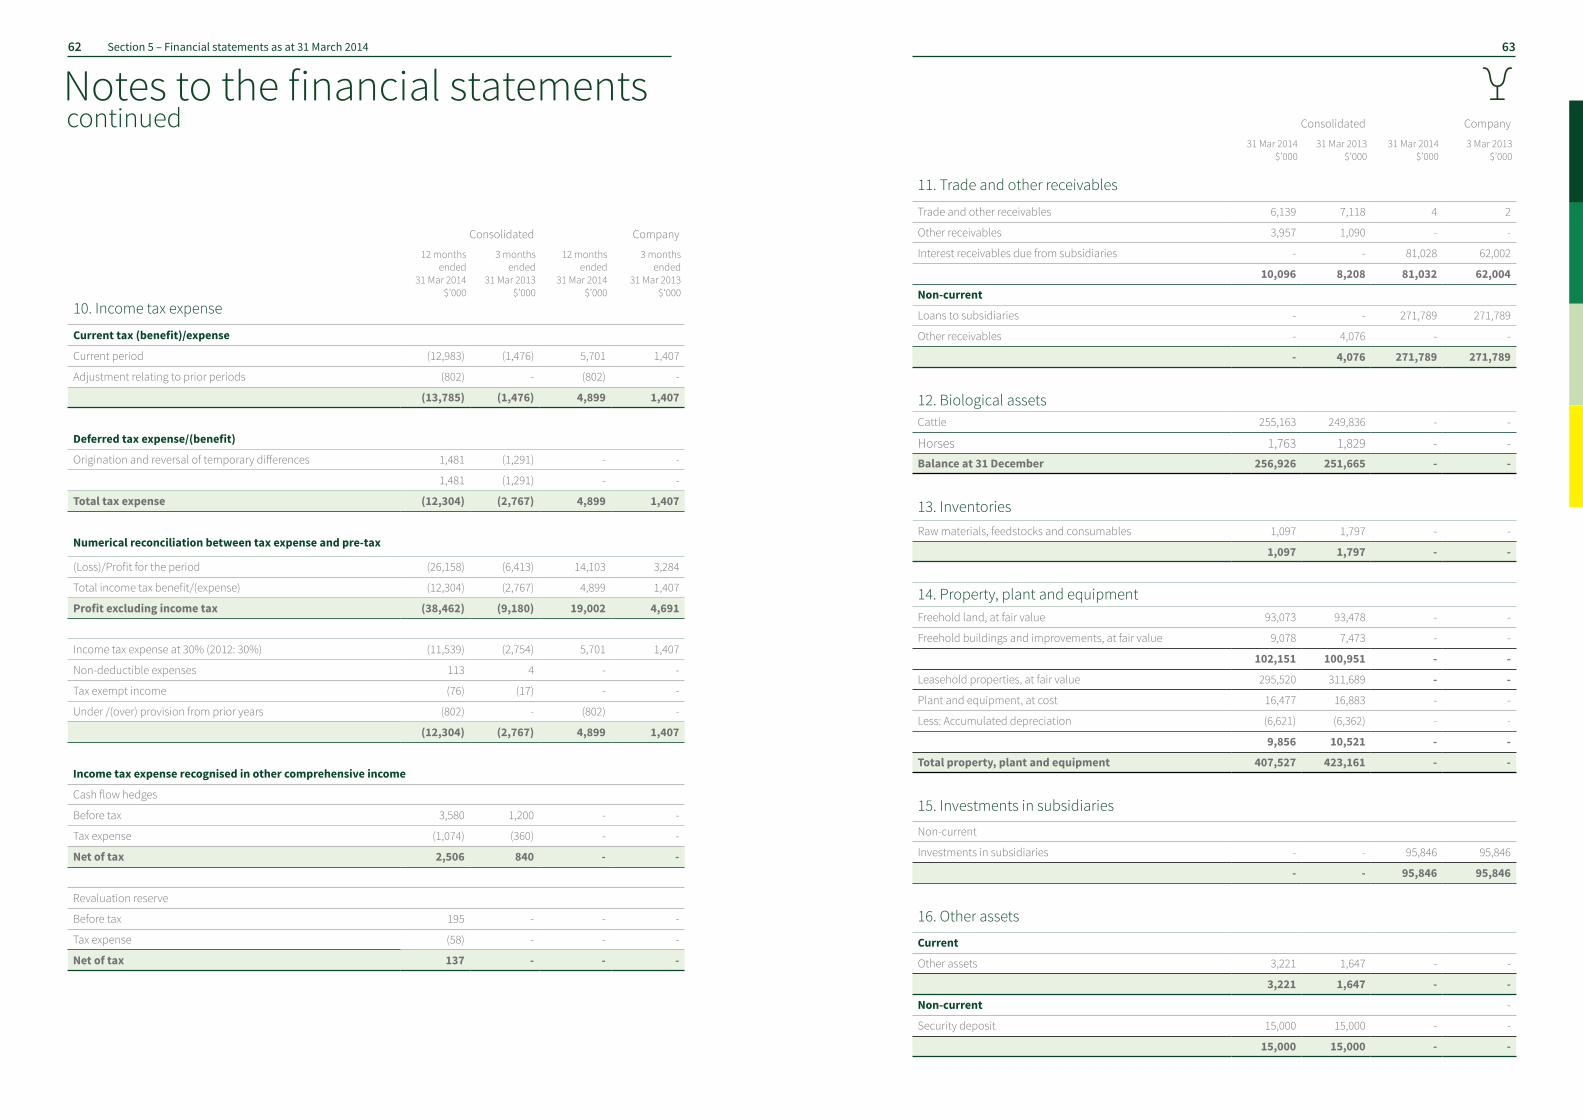
Consolidated Company
12 months ended
31 Mar 2014 $’000
3 months ended
31 Mar 2013 $’000
12 months ended
31 Mar 2014 $’000
3 months ended
31 Mar 2013 $‘000
10. Income tax expense
Current tax (benefit)/expense
Current period (12,983) (1,476) 5,701 1,407
Adjustment relating to prior periods (802) - (802) -
(13,785) (1,476) 4,899 1,407
Deferred tax expense/(benefit)
Origination and reversal of temporary differences 1,481 (1,291) - -
1,481 (1,291) - -
Total tax expense (12,304) (2,767) 4,899 1,407
Numerical reconciliation between tax expense and pre-tax
(Loss)/Profit for the period (26,158) (6,413) 14,103 3,284
Total income tax benefit/(expense) (12,304) (2,767) 4,899 1,407
Profit excluding income tax (38,462) (9,180) 19,002 4,691
Income tax expense at 30% (2012: 30%) (11,539) (2,754) 5,701 1,407
Non-deductible expenses 113 4 - -
Tax exempt income (76) (17) - -
Under /(over) provision from prior years (802) - (802) -
(12,304) (2,767) 4,899 1,407
Income tax expense recognised in other comprehensive income
Cash flow hedges
Before tax 3,580 1,200 - -
Tax expense (1,074) (360) - -
Net of tax 2,506 840 - -
Revaluation reserve
Before tax 195 - - -
Tax expense (58) - - -
Net of tax 137 - - -
Consolidated Company
31 Mar 2014 $’000
31 Mar 2013 $’000
31 Mar 2014 $’000
3 Mar 2013 $’000
11. Trade and other receivables
Trade and other receivables 6,139 7,118 4 2
Other receivables 3,957 1,090 - -
Interest receivables due from subsidiaries - - 81,028 62,002
10,096 8,208 81,032 62,004
Non-current
Loans to subsidiaries - - 271,789 271,789
Other receivables - 4,076 - -
- 4,076 271,789 271,789
12. Biological assetsCattle 255,163 249,836 - -
Horses 1,763 1,829 - -Balance at 31 December 256,926 251,665 - -
13. InventoriesRaw materials, feedstocks and consumables 1,097 1,797 - -
1,097 1,797 - -
14. Property, plant and equipmentFreehold land, at fair value 93,073 93,478 - -
Freehold buildings and improvements, at fair value 9,078 7,473 - -
102,151 100,951 - -
Leasehold properties, at fair value 295,520 311,689 - -
Plant and equipment, at cost 16,477 16,883 - -
Less: Accumulated depreciation (6,621) (6,362) - -
9,856 10,521 - -
Total property, plant and equipment 407,527 423,161 - -
15. Investments in subsidiaries
Non-current
Investments in subsidiaries - - 95,846 95,846
- - 95,846 95,846
16. Other assets
Current
Other assets 3,221 1,647 - -
3,221 1,647 - -
Non-current -
Security deposit 15,000 15,000 - -
15,000 15,000 - -
6362 Section 5 – Financial statements as at 31 March 2014
continuedNotes to the financial statements
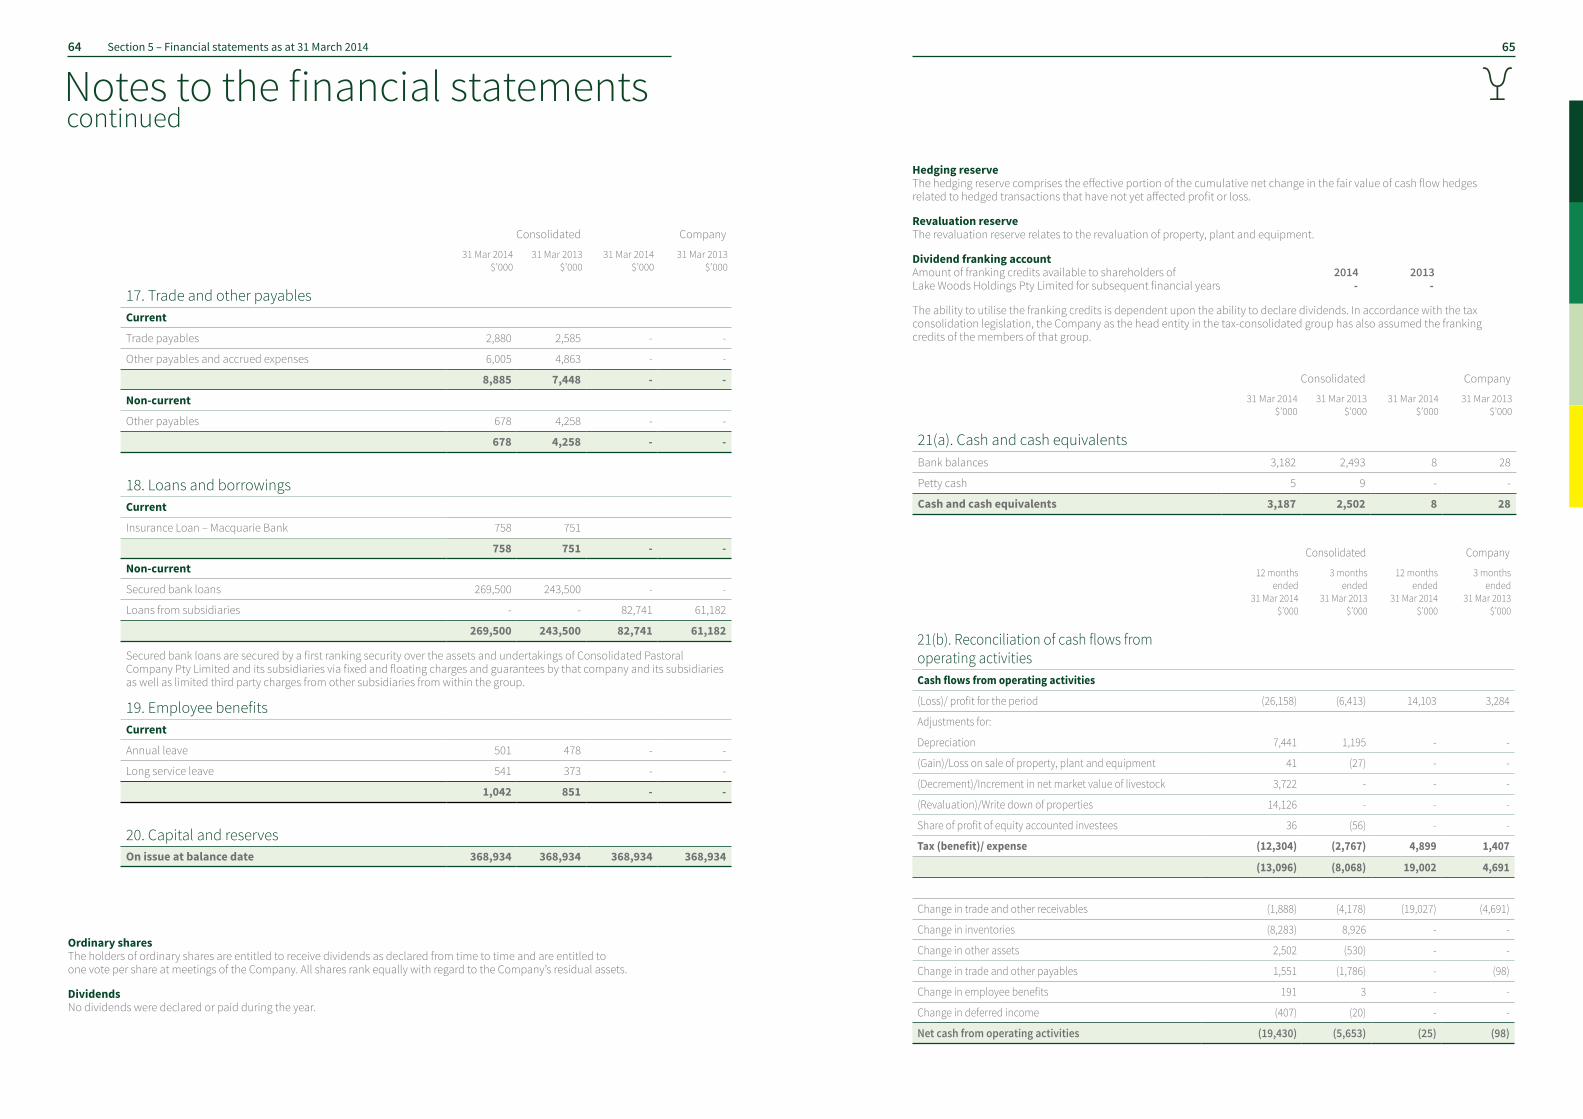
Consolidated Company
31 Mar 2014 $’000
31 Mar 2013 $’000
31 Mar 2014 $’000
31 Mar 2013 $’000
17. Trade and other payablesCurrent
Trade payables 2,880 2,585 - -
Other payables and accrued expenses 6,005 4,863 - -
8,885 7,448 - -
Non-current
Other payables 678 4,258 - -
678 4,258 - -
18. Loans and borrowingsCurrent
Insurance Loan – Macquarie Bank 758 751
758 751 - -
Non-current
Secured bank loans 269,500 243,500 - -
Loans from subsidiaries - - 82,741 61,182
269,500 243,500 82,741 61,182
Secured bank loans are secured by a first ranking security over the assets and undertakings of Consolidated Pastoral Company Pty Limited and its subsidiaries via fixed and floating charges and guarantees by that company and its subsidiaries as well as limited third party charges from other subsidiaries from within the group.
19. Employee benefitsCurrent
Annual leave 501 478 - -
Long service leave 541 373 - -
1,042 851 - -
20. Capital and reserves On issue at balance date 368,934 368,934 368,934 368,934
Ordinary shares The holders of ordinary shares are entitled to receive dividends as declared from time to time and are entitled to one vote per share at meetings of the Company. All shares rank equally with regard to the Company’s residual assets.
Dividends No dividends were declared or paid during the year.
Consolidated Company
31 Mar 2014 $’000
31 Mar 2013 $’000
31 Mar 2014 $’000
31 Mar 2013 $’000
21(a). Cash and cash equivalentsBank balances 3,182 2,493 8 28
Petty cash 5 9 - -
Cash and cash equivalents 3,187 2,502 8 28
Hedging reserve The hedging reserve comprises the effective portion of the cumulative net change in the fair value of cash flow hedges related to hedged transactions that have not yet affected profit or loss.
Revaluation reserve The revaluation reserve relates to the revaluation of property, plant and equipment.
Dividend franking account Amount of franking credits available to shareholders of 2014 2013 Lake Woods Holdings Pty Limited for subsequent financial years - -
The ability to utilise the franking credits is dependent upon the ability to declare dividends. In accordance with the tax consolidation legislation, the Company as the head entity in the tax-consolidated group has also assumed the franking credits of the members of that group.
Consolidated Company
12 months ended
31 Mar 2014 $’000
3 months ended
31 Mar 2013 $’000
12 months ended
31 Mar 2014 $’000
3 months ended
31 Mar 2013 $’000
21(b). Reconciliation of cash flows from operating activitiesCash flows from operating activities
(Loss)/ profit for the period (26,158) (6,413) 14,103 3,284
Adjustments for:
Depreciation 7,441 1,195 - -
(Gain)/Loss on sale of property, plant and equipment 41 (27) - -
(Decrement)/Increment in net market value of livestock 3,722 - - -
(Revaluation)/Write down of properties 14,126 - - -
Share of profit of equity accounted investees 36 (56) - -
Tax (benefit)/ expense (12,304) (2,767) 4,899 1,407
(13,096) (8,068) 19,002 4,691
Change in trade and other receivables (1,888) (4,178) (19,027) (4,691)
Change in inventories (8,283) 8,926 - -
Change in other assets 2,502 (530) - -
Change in trade and other payables 1,551 (1,786) - (98)
Change in employee benefits 191 3 - -
Change in deferred income (407) (20) - -
Net cash from operating activities (19,430) (5,653) (25) (98)
6564 Section 5 – Financial statements as at 31 March 2014
continuedNotes to the financial statements

24. Subsequent event There has not arisen in the interval between the end of the financial year and the date of this report any item, transaction or event of a material and unusual nature likely, in the opinion of the directors of the Company, to affect significantly the operations of the Company, the results of those operations, or the state of affairs of the Company, in future financial years.
25. Contingencies
During the normal course of business, the Group is involved in legal claims and litigations. There is significant uncertainty as to whether a future liability will arise in respect of these items. The amount of liability, if any, which may arise cannot be measured reliably at this time. The Directors are of the opinion that all known liabilities have been brought to account and that adequate provision has been made for any anticipated losses.
26. Reporting period
The Company and the Group have altered their financial year end from 31 December to 31 March in the previous period to better align the Group’s financial reporting to the growing season which starts at the completion of the wet season in Northern Australia. This is consistent with a number of other pastoral operators in the region. The current financial period is a twelve month period from 1 April 2013 to 31 March 2014, whereas the comparative period is a three month period from 1 January 2013 to 31 March 2013.
27.Change in accounting estimate
Useful life The Group reviewed the residual value and the useful life of plant and equipment with effect from 1 April 2013. The revisions were accounted for prospectively as a change in the accounting estimates and as a result, the depreciation charges of the Group for the current financial year end have been increased by $2m.
Livestock The Group reviewed the branding accrual policy due to the movement of its financial year end to 31 March. The policy now reflects management’s conservative estimate of calves born but not yet branded between the last muster and year end. Total amount accrued is $14.8m.
continuedNotes to the financial statements
22. Capital commitmentsThe Group and Company did not have any capital commitments at year end.
23. Group entitiesCountry of
incorporationOwnership
interest (%)
Parent entity
Lake Woods Holdings Pty Limited Australia
Significant subsidiaries
Lake Woods Group Pty Limited Australia 100
Lake Woods Acquisitions Pty Limited Australia 100
Consolidated Pastoral Company Pty Limited Australia 100
Consolidated Pastoral Property Pty Limited Australia 100
Baines River Cattle Company Pty Limited Australia 100
Laverton Nominees Pty Limited Australia 100
Crosswalk Pty Limited Australia 100
CPC (China) Holdings Pty Limited Australia 100
Directors’ declaration
In the opinion of the directors of Lake Woods Holdings Pty Limited (“the Company”): (a) the Company and Group are not reporting entities; (b) the financial statements and notes, set out on pages 47 to 66, are in accordance with the Corporations Act 2001, including: (i) giving a true and fair view of the financial position of the Company and the Group as at 31 March 2014 and of their performance, as represented by the results of their operations and their cash flows, for the financial year ended on that date in accordance with the statement of compliance and basis of preparation described in Notes 1 and 2; and (ii) complying with Australian Accounting Standards (including the Australian Accounting Interpretations) to the extent described in Notes 1 and 2, and the Corporations Regulations 2001; and (c) there are reasonable grounds to believe that the Company and the Group will be able to pay its debts as and when they become due and payable.
Signed in accordance with a resolution of directors.
Fergal Leamy Director
Dated at Brisbane this 14th day of July 2014
6766 Section 5 – Financial statements as at 31 March 2014
Independent audit report to the members of Lake Woods Holdings Pty Limited
We have audited the accompanying financial report, being a special purpose financial report, of Lake Woods Holdings Pty Limited (the Company), which comprises the statements of financial position as at 31 March 2014, and the statements of comprehensive income, statements of changes in equity and statements of cash flows for the year ended on on that date, notes 1 to 27 comprising a summary of significant accounting policies and other explanatory information, and the directors’ declaration of the Company and the Group comprising the Company and the entities it controlled at the year’s end or from time to time during the financial year. Directors’ responsibility for the financial report The directors of the Company are responsible for the preparation of the special purpose financial report that gives a true and fair view and have determined that the basis of preparation described in Notes 1 to 3 to the financial statements is appropriate to meet the requirements of the Corporations Act 2001 and is appropriate to meet the needs of the members. The directors’ responsibility also includes such internal control as the directors determine necessary to enable the preparation of a financial report that gives a true and fair view and is free from material misstatement, whether due to fraud or error. Auditor’s responsibility Our responsibility is to express an opinion on the financial report based on our audit. We conducted our audit in accordance with Australian Auditing Standards. These Auditing Standards require that we comply with relevant ethical requirements relating to audit engagements and plan and perform the audit to obtain reasonable assurance whether the financial report is free from material misstatement. An audit involves performing procedures to obtain audit evidence about the amounts and disclosures in the financial report. The procedures selected depend on the auditor’s judgement, including the assessment of the risks of material misstatement of the financial report, whether due to fraud or error. In making those risk assessments, the auditor considers internal control relevant to the entity’s preparation of the financial report that gives a true and fair view in order to design audit procedures that are appropriate in the circumstances, but not for the purpose of expressing an opinion on the effectiveness of the entity’s internal control. An audit also includes evaluating the appropriateness of accounting policies used and the reasonableness of accounting estimates made by the directors, as well as evaluating the overall presentation of the financial report. These procedures have been undertaken to form an opinion whether, in all material respects, the financial report is presented fairly in accordance with the basis of accounting described in Notes 1 to 3 to the financial statements so as to present a true and fair view which is consistent with our understanding of the Company’s and the Group’s financial position, and of their performance. We believe that the audit evidence we have obtained is sufficient and appropriate to provide a basis for our audit opinion.
Independent audit report to the members of Lake Woods Holdings Pty Limited (continued) Independence In conducting our audit, we have complied with the independence requirements of the Corporations Act 2001. Auditor’s opinion In our opinion the financial report of Lake Woods Holdings Pty Ltd is in accordance with the Corporations Act 2001, including: (a) giving a true and fair view of the Company’s and the Group’s financial position as at 31 March 2014 and oftheir performance for the year end on that date. (b) complying with Australian Accounting Standards to the extent described in Note 2 and the Corporations Regulations 2001. Basis of Accounting Without modifying our opinion, we draw attention to Note 2 to the financial report, which describes the basis of accounting. The financial report has been prepared for the purpose of fulfilling the directors’ financial reporting responsibilities under the Corporations Act 2001. As a result, the financial report may not be suitable for another purpose.
KPMG
Matthew McCarron Partner Sydney 14 July 2014
6968 Section 5 – Financial statements as at 31 March 2014
Independent Audit Report
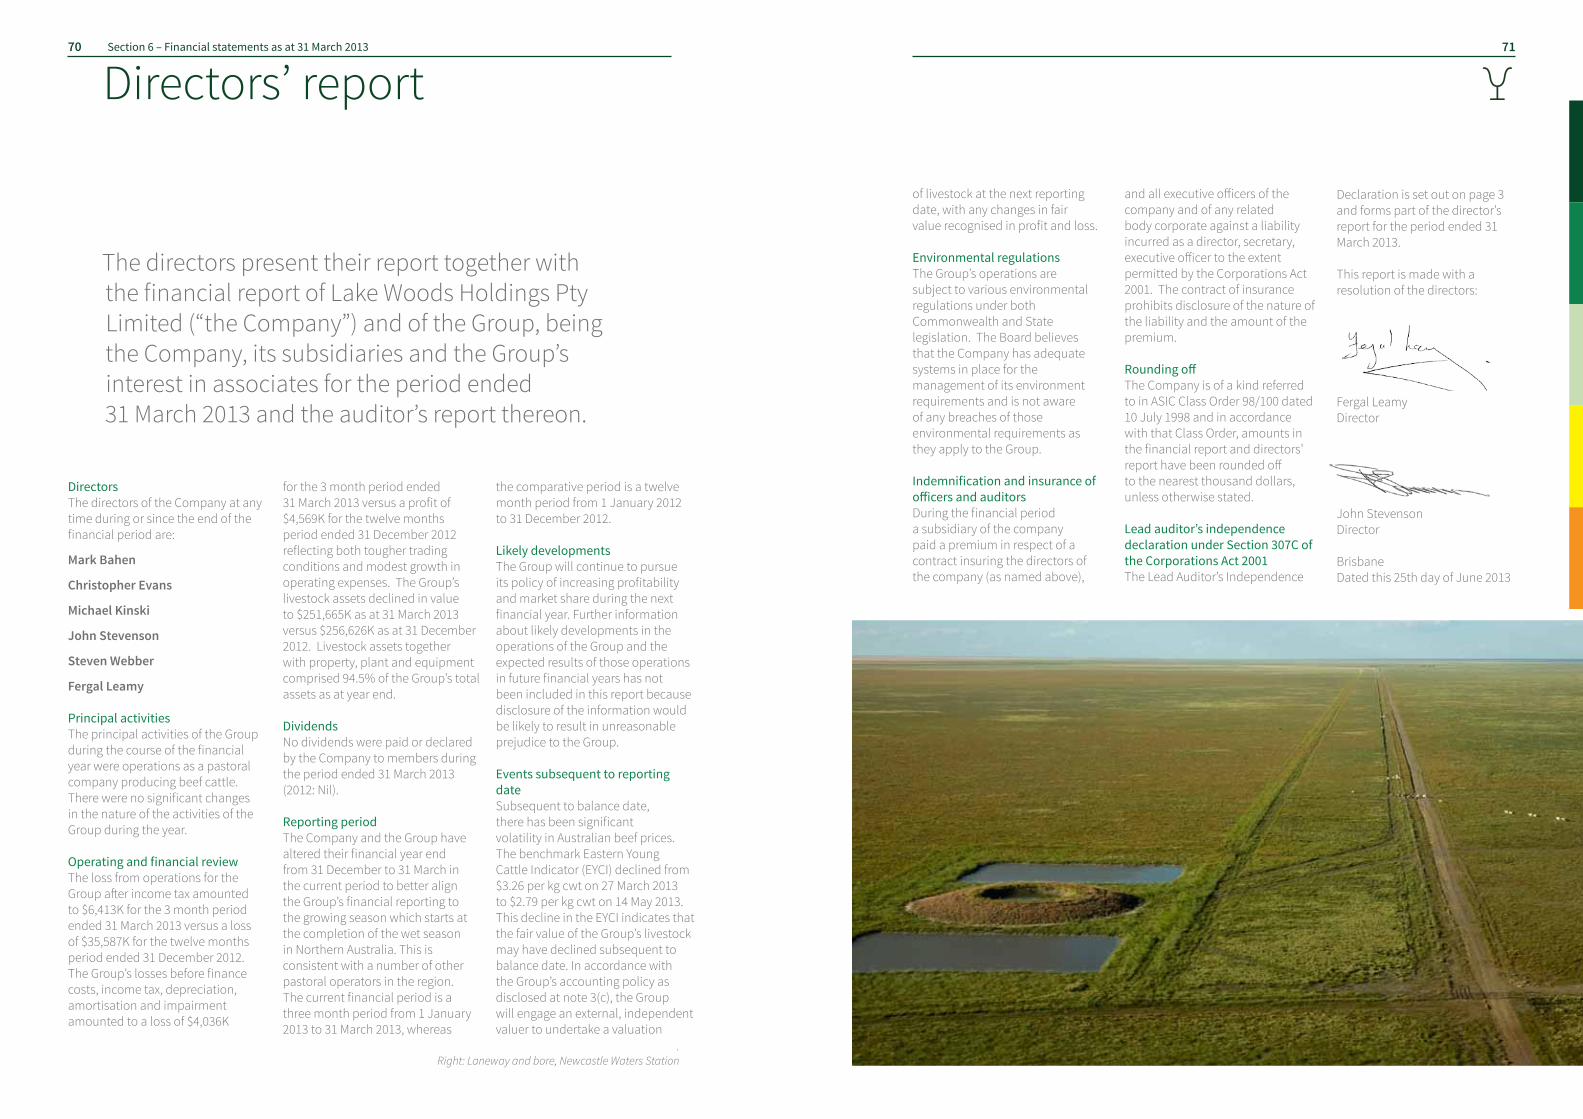
The directors present their report together with the financial report of Lake Woods Holdings Pty Limited (“the Company”) and of the Group, being the Company, its subsidiaries and the Group’s interest in associates for the period ended 31 March 2013 and the auditor’s report thereon.
70 71Section 6 – Financial statements as at 31 March 2013
Directors’ report
Directors The directors of the Company at any time during or since the end of the financial period are:
Mark Bahen
Christopher Evans
Michael Kinski
John Stevenson
Steven Webber
Fergal Leamy
Principal activitiesThe principal activities of the Group during the course of the financial year were operations as a pastoral company producing beef cattle. There were no significant changes in the nature of the activities of the Group during the year.
OperatingandfinancialreviewThe loss from operations for the Group after income tax amounted to $6,413K for the 3 month period ended 31 March 2013 versus a loss of $35,587K for the twelve months period ended 31 December 2012. The Group’s losses before finance costs, income tax, depreciation, amortisation and impairment amounted to a loss of $4,036K
for the 3 month period ended 31 March 2013 versus a profit of $4,569K for the twelve months period ended 31 December 2012 reflecting both tougher trading conditions and modest growth in operating expenses. The Group’s livestock assets declined in value to $251,665K as at 31 March 2013 versus $256,626K as at 31 December 2012. Livestock assets together with property, plant and equipment comprised 94.5% of the Group’s total assets as at year end. DividendsNo dividends were paid or declared by the Company to members during the period ended 31 March 2013 (2012: Nil).
Reporting periodThe Company and the Group have altered their financial year end from 31 December to 31 March in the current period to better align the Group’s financial reporting to the growing season which starts at the completion of the wet season in Northern Australia. This is consistent with a number of other pastoral operators in the region. The current financial period is a three month period from 1 January 2013 to 31 March 2013, whereas
the comparative period is a twelve month period from 1 January 2012 to 31 December 2012.
Likely developmentsThe Group will continue to pursue its policy of increasing profitability and market share during the next financial year. Further information about likely developments in the operations of the Group and the expected results of those operations in future financial years has not been included in this report because disclosure of the information would be likely to result in unreasonable prejudice to the Group.
Events subsequent to reporting dateSubsequent to balance date, there has been significant volatility in Australian beef prices. The benchmark Eastern Young Cattle Indicator (EYCI) declined from $3.26 per kg cwt on 27 March 2013 to $2.79 per kg cwt on 14 May 2013. This decline in the EYCI indicates that the fair value of the Group’s livestock may have declined subsequent to balance date. In accordance with the Group’s accounting policy as disclosed at note 3(c), the Group will engage an external, independent valuer to undertake a valuation
.Right: Laneway and bore, Newcastle Waters Station
of livestock at the next reporting date, with any changes in fair value recognised in profit and loss.
Environmental regulationsThe Group’s operations are subject to various environmental regulations under both Commonwealth and State legislation. The Board believes that the Company has adequate systems in place for the management of its environment requirements and is not aware of any breaches of those environmental requirements as they apply to the Group. IndemnificationandinsuranceofofficersandauditorsDuring the financial period a subsidiary of the company paid a premium in respect of a contract insuring the directors of the company (as named above),
and all executive officers of the company and of any related body corporate against a liability incurred as a director, secretary, executive officer to the extent permitted by the Corporations Act 2001. The contract of insurance prohibits disclosure of the nature of the liability and the amount of the premium.
RoundingoffThe Company is of a kind referred to in ASIC Class Order 98/100 dated 10 July 1998 and in accordance with that Class Order, amounts in the financial report and directors’ report have been rounded off to the nearest thousand dollars, unless otherwise stated.
Lead auditor’s independence declaration under Section 307C of the Corporations Act 2001The Lead Auditor’s Independence
Declaration is set out on page 3 and forms part of the director’s report for the period ended 31 March 2013.
This report is made with a resolution of the directors:
Fergal Leamy Director John StevensonDirector BrisbaneDated this 25th day of June 2013
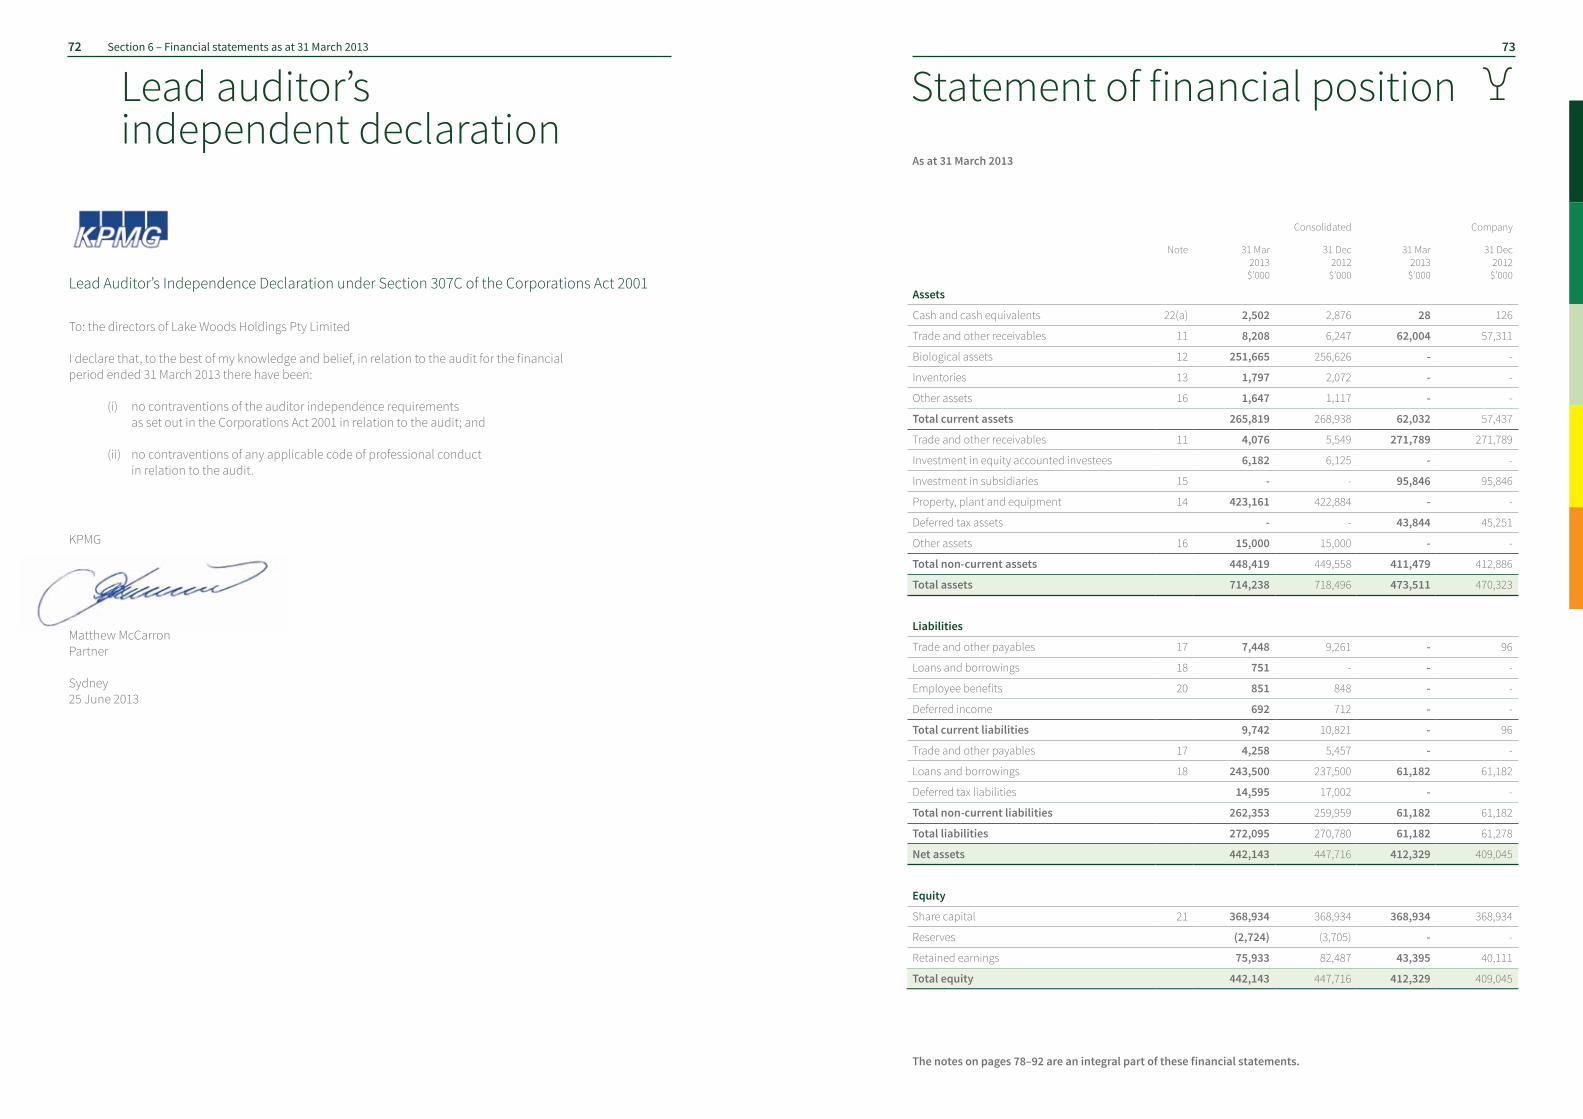
As at 31 March 2013
The notes on pages 78–92 are an integral part of these financial statements.
Consolidated Company
Note 31 Mar 2013
$’000
31 Dec 2012
$’000
31 Mar 2013
$’000
31 Dec 2012
$’000
Assets
Cash and cash equivalents 22(a) 2,502 2,876 28 126
Trade and other receivables 11 8,208 6,247 62,004 57,311
Biological assets 12 251,665 256,626 - -
Inventories 13 1,797 2,072 - -
Other assets 16 1,647 1,117 - -
Total current assets 265,819 268,938 62,032 57,437
Trade and other receivables 11 4,076 5,549 271,789 271,789
Investment in equity accounted investees 6,182 6,125 - -
Investment in subsidiaries 15 - - 95,846 95,846
Property, plant and equipment 14 423,161 422,884 - -
Deferred tax assets - - 43,844 45,251
Other assets 16 15,000 15,000 - -
Total non-current assets 448,419 449,558 411,479 412,886
Total assets 714,238 718,496 473,511 470,323
Liabilities
Trade and other payables 17 7,448 9,261 - 96
Loans and borrowings 18 751 - - -
Employee benefits 20 851 848 - -
Deferred income 692 712 - -
Total current liabilities 9,742 10,821 - 96
Trade and other payables 17 4,258 5,457 - -
Loans and borrowings 18 243,500 237,500 61,182 61,182
Deferred tax liabilities 14,595 17,002 - -
Total non-current liabilities 262,353 259,959 61,182 61,182
Total liabilities 272,095 270,780 61,182 61,278
Net assets 442,143 447,716 412,329 409,045
Equity
Share capital 21 368,934 368,934 368,934 368,934
Reserves (2,724) (3,705) - -
Retained earnings 75,933 82,487 43,395 40,111
Total equity 442,143 447,716 412,329 409,045
72 73Section 6 – Financial statements as at 31 March 2013
Lead auditor’s independent declaration
Lead Auditor’s Independence Declaration under Section 307C of the Corporations Act 2001
To: the directors of Lake Woods Holdings Pty Limited I declare that, to the best of my knowledge and belief, in relation to the audit for the financial period ended 31 March 2013 there have been: (i) no contraventions of the auditor independence requirements as set out in the Corporations Act 2001 in relation to the audit; and (ii) no contraventions of any applicable code of professional conduct in relation to the audit.
KPMG
Matthew McCarron Partner Sydney 25 June 2013
Statement of financial position
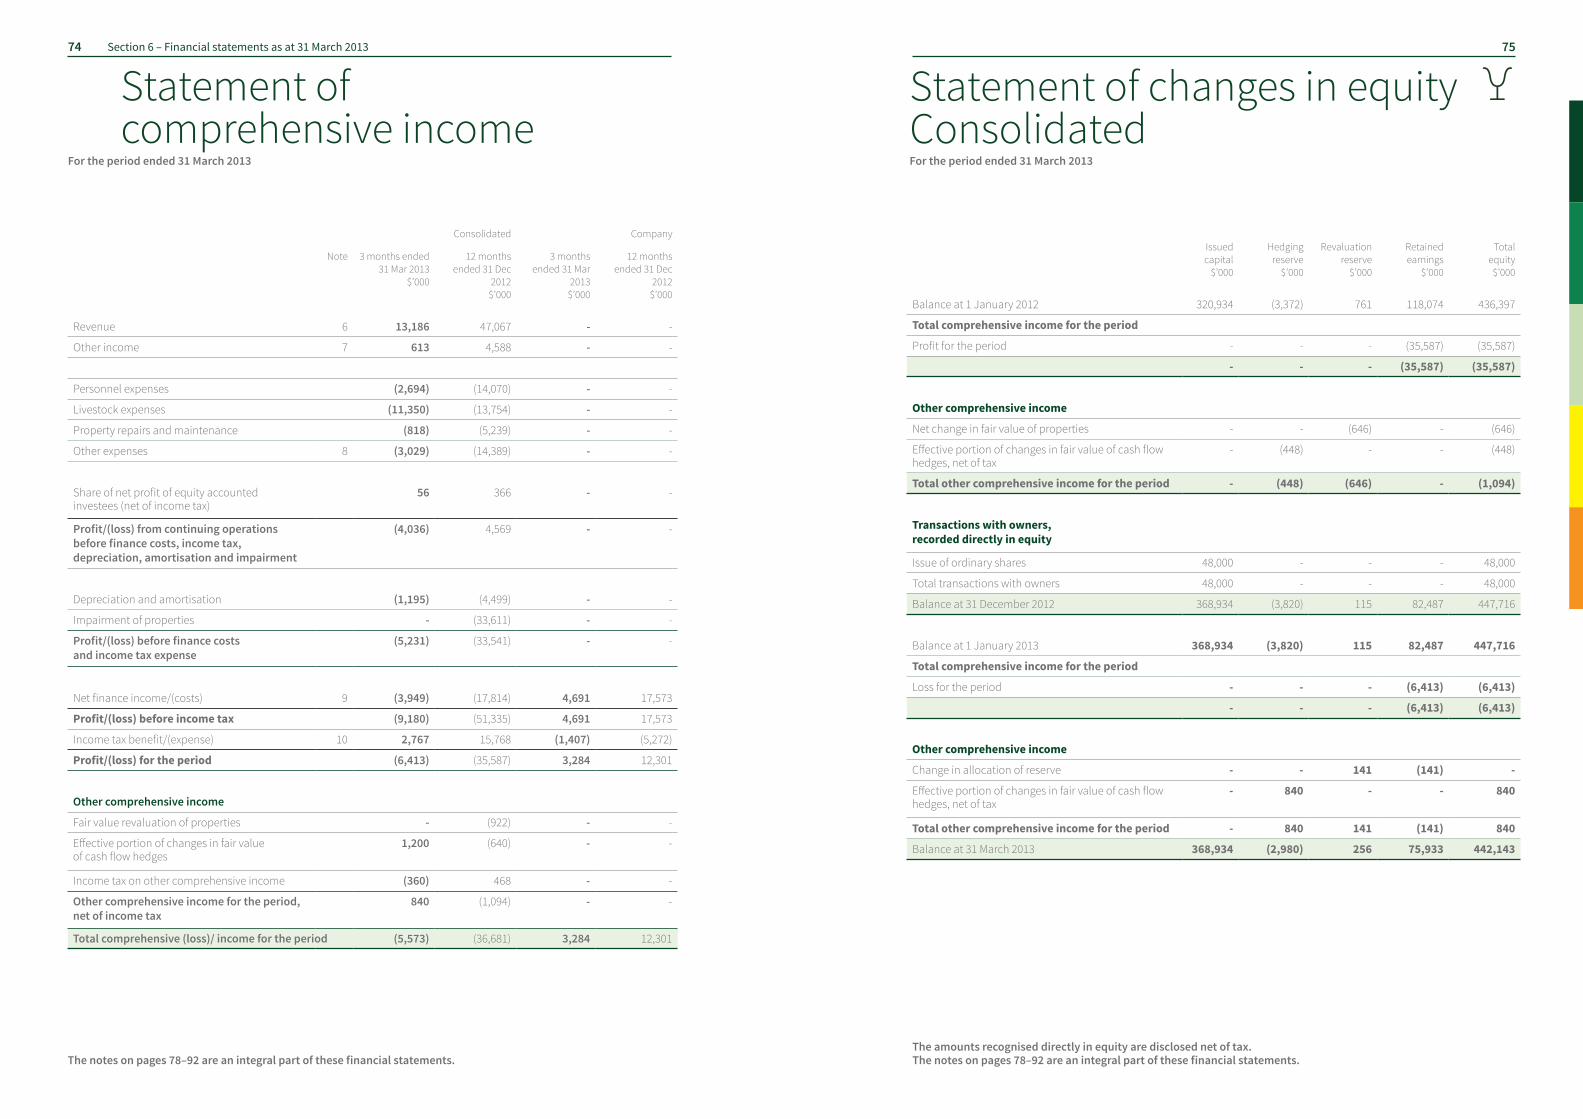
For the period ended 31 March 2013 For the period ended 31 March 2013
Consolidated Company
Note 3 months ended 31 Mar 2013
$’000
12 months ended 31 Dec
2012 $’000
3 months ended 31 Mar
2013 $’000
12 months ended 31 Dec
2012 $’000
Revenue 6 13,186 47,067 - -
Other income 7 613 4,588 - -
Personnel expenses (2,694) (14,070) - -
Livestock expenses (11,350) (13,754) - -
Property repairs and maintenance (818) (5,239) - -
Other expenses 8 (3,029) (14,389) - -
Share of net profit of equity accounted investees (net of income tax)
56 366 - -
Profit/(loss) from continuing operations before finance costs, income tax, depreciation, amortisation and impairment
(4,036) 4,569 - -
Depreciation and amortisation (1,195) (4,499) - -
Impairment of properties - (33,611) - -
Profit/(loss) before finance costs and income tax expense
(5,231) (33,541) - -
Net finance income/(costs) 9 (3,949) (17,814) 4,691 17,573
Profit/(loss) before income tax (9,180) (51,335) 4,691 17,573
Income tax benefit/(expense) 10 2,767 15,768 (1,407) (5,272)
Profit/(loss) for the period (6,413) (35,587) 3,284 12,301
Other comprehensive income
Fair value revaluation of properties - (922) - -
Effective portion of changes in fair value of cash flow hedges
1,200 (640) - -
Income tax on other comprehensive income (360) 468 - -
Other comprehensive income for the period, net of income tax
840 (1,094) - -
Total comprehensive (loss)/ income for the period (5,573) (36,681) 3,284 12,301
The notes on pages 78–92 are an integral part of these financial statements.
Consolidated Company
Issued capital
$’000
Hedging reserve
$’000
Revaluation reserve
$’000
Retained earnings
$’000
Total equity $’000
Balance at 1 January 2012 320,934 (3,372) 761 118,074 436,397
Total comprehensive income for the period
Profit for the period - - - (35,587) (35,587)
- - - (35,587) (35,587)
Other comprehensive income
Net change in fair value of properties - - (646) - (646)
Effective portion of changes in fair value of cash flow hedges, net of tax
- (448) - - (448)
Total other comprehensive income for the period - (448) (646) - (1,094)
Transactions with owners, recorded directly in equity
Issue of ordinary shares 48,000 - - - 48,000
Total transactions with owners 48,000 - - - 48,000
Balance at 31 December 2012 368,934 (3,820) 115 82,487 447,716
Balance at 1 January 2013 368,934 (3,820) 115 82,487 447,716
Total comprehensive income for the period
Loss for the period - - - (6,413) (6,413)
- - - (6,413) (6,413)
Other comprehensive income
Change in allocation of reserve - - 141 (141) -
Effective portion of changes in fair value of cash flow hedges, net of tax
- 840 - - 840
Total other comprehensive income for the period - 840 141 (141) 840
Balance at 31 March 2013 368,934 (2,980) 256 75,933 442,143
The amounts recognised directly in equity are disclosed net of tax.The notes on pages 78–92 are an integral part of these financial statements.
74 75Section 6 – Financial statements as at 31 March 2013
Statement of comprehensive income
Statement of changes in equity Consolidated

Consolidated Company
Share capital
$’000
Hedging reserve
$’000
Revaluation reserve
$’000
Retained earnings
$’000
Total equity $’000
Balance at 1 January 2012 320,934 - - 27,810 348,744
Total comprehensive income for the period
Profit for the period - - - 12,301 12,301
- - - 12,301 12,301
Transactions with owners, recorded directly in equity
Issue of ordinary shares 48,000 - - - 48,000
Total transactions with owners 48,000 - - - 48,000
Balance at 31 December 2012 368,934 - - 40,111 409,045
Balance at 1 January 2013 368,934 - - 40,111 409,045
Total comprehensive income for the period
Profit for the period - - - 3,284 3,284
- - - 3,284 3,284
Balance at 31 March 2013 368,934 - - 43,395 412,329
The amounts recognised directly in equity are disclosed net of taxThe notes on pages 78–92 are an integral part of these financial statements.
Consolidated Company
Note 3 months ended
31 Mar 2013 $’000
12 months ended
31 Dec 2012 $’000
3 months ended
31 Mar 2013 $’000
12 months ended
31 Dec 2012 $’000
Cash flows from operating activities
Cash receipts from customers 10,631 62,138 - 92
Cash paid to suppliers and employees (12,991) (54,099) (98) -
Cash generated from operations (2,360) 8,039 (98) 92
Interest received 51 584 - 1
Interest paid (3,344) (14,854) - -
Net cash from operating activities 22(b) (5,653) (6,231) (98) 93
Cash flows from investing activities
Proceeds from sale of property, plant and equipment 25 1,212 - -
Acquisition of property, plant and equipment (1,470) (5,140) - -
Loans to subsidiaries - - - (36,000)
Investment in subsidiaries - - - (12,000)
Net cash used in investing activities (1,445) (3,928) - (48,000)
Cash flows from financing activities
Proceeds from issue of share capital - 48,000 - 48,000
Drawdown /(Repayment) of borrowings 6,724 (38,000) - -
Net cash from (used in) financing activities 6,724 10,000 - 48,000
Net increase (decrease) in cash and cash equivalents
(374) (159) (98) 93
Cash and cash equivalents opening balance 2,876 3,035 126 33
Cash and cash equivalents closing balance 22(a) 2,502 2,876 28 126
The notes on pages 78–92 are an integral part of these financial statements.
For the period ended 31 March 2013 For the period ended 31 March 2013
76 77Section 6 – Financial statements as at 31 March 2013
Statement of changes in equity Company
Statement of cash flows
1. Reporting entity Lake Woods Holdings Pty Limited (the “Company”) is a Company domiciled in Australia. The address of the Company’s registered office is Newcastle Waters Station, Drovers Drive, Newcastle Waters, Northern Territory, Australia. The consolidated financial statements of the Company as at and for the period ended 31 March 2013 comprise the Company and its subsidiaries (together referred to as the “Group” and individually as “Group entities”) and the Group’s interest in associates and jointly controlled entities.
The Group is a for-profit entity and primarily is involved in producing beef cattle.
In the opinion of the directors, the Group is not a reporting entity. The financial statements of the Group and the Company have been drawn up as special purpose financial statements for distribution to the members and for the purpose of fulfilling the requirements of the Corporations Act 2001.
2. Basis of preparation Statement of compliance The special purpose financial statements have been prepared in accordance with the requirements of the Corporations Act 2001 and the recognition, measurement and classification aspects of all applicable Australian Accounting Standards (AASBs) adopted by the Australian Accounting Standards Board (AASB). The financial report does not include the disclosure requirements of all AASBs except for the following minimum requirements: AASB 101 Presentation of Financial Statements AASB 107 Statement of Cash Flows AASB 108 Accounting Policies, Changes in Accounting Estimates and Errors
AASB 1031 Materiality AASB 1048 Interpretation and Application of Standards AASB 1054 Australian Additional Disclosures Basis of measurement The consolidated financial statements have been prepared on the historical cost basis except for the following material items in the statement of financial position: • Derivative financial instruments are measured at fair value • Biological assets are measured at fair value less costs to sell • Land, buildings and improvements included within property, plant and equipment are measured at fair value. Functional and presentation currency These consolidated financial statements are presented in Australian dollars, which is the Company’s functional currency. The Company is of a kind referred to in ASIC Class Order 98/100 dated 10 July 1998 and in accordance with that Class Order, amounts in the financial report and directors’ report have been rounded off to the nearest thousand dollars, unless otherwise stated. Use of estimates and judgements The preparation of financial statements in conformity with AASBs requires management to make judgements, estimates and assumptions that affect the application of accounting policies and the reported amounts of assets, liabilities, income and expenses. Actual results may differ from these estimates. Estimates and underlying assumptions are reviewed on an ongoing basis. Revisions to accounting estimates are recognised in the period in which the estimate is revised and in any future periods affected.
3. Significant accounting policies The accounting policies set out below have been applied consistently to all periods presented in these consolidated financial statements, and have been applied consistently by the Group entities. Certain comparative amounts have been reclassified to conform with the current year’s presentation. Basis of consolidation (i) Subsidiaries Subsidiaries are entities controlled by the Group. Control exists when the Group has the power to govern the financial and operating policies of an entity so as to obtain benefits from its activities. In assessing control, potential voting rights that currently are exercisable are taken into account. The financial statements of subsidiaries are included in the consolidated financial statements from the date that control commences until the date that control ceases. The accounting policies of subsidiaries have been changed when necessary to align them with the policies adopted by the Group. In the Company’s financial statements, investments in subsidiaries are carried at cost. (ii) Investments in associates and jointly controlled entities (equity- accounted investees) Associates are those entities in which the Group has significant influence, but not control, over the financial and operating policies. Significant influence is presumed to exist when the Company holds between 20 and 50 percent of the voting power of another entity. Jointly controlled entities are those entities over whose activities the Group has joint control, established by contractual agreement and requiring unanimous consent for strategic financial and operating decisions.
continued
Investments in associates and jointly controlled entities are accounted for using the equity method (equity-accounted investees) and are initially recognised at cost. The Group’s investment includes goodwill identified on acquisition, net of any accumulated impairment losses. The consolidated financial statements include the Group’s share of the profit or loss and other comprehensive income of equity-accounted investees, after adjustments to align the accounting policies with those of the Company, from the date that significant influence or joint control commences until the date that significant influence or joint control ceases. When the Group’s share of losses exceeds its interest in an equity-accounted investee, the carrying amount of that interest, including any long-term investments that form part thereof, is reduced to zero, and the recognition of further losses is discontinued except to the extent that the Group has an obligation or has made payments on behalf of the investee. In the Company’s financial statements, investments in jointly controlled entities are carried at cost. (iii) Transactions eliminated on consolidation Intra-group balances and transactions, and any unrealised income and expenses arising from intra-group transactions are eliminated in preparing the consolidated financial statements. Unrealised gains arising from transactions with equity accounted investees are eliminated against the investment to the extent of the Group’s interest in the investee. Unrealised losses are eliminated in the same way as unrealised gains, but only to the extent that there is no evidence of impairment. Gains and losses are recognised when the contributed assets are consumed or sold by the equity accounted
investees or, if not consumed or sold by the equity accounted investee, when the Group’s interest in such entities is disposed of. Foreign currency transactions Transactions in foreign currencies are translated to the respective functional currencies of the Group at exchange rates at the dates of the transactions. Monetary assets and liabilities denominated in foreign currencies at the reporting date are retranslated to the functional currency at the exchange rate at that date. The foreign currency gain or loss on monetary items is the difference between amortised cost in the functional currency at the beginning of the period, adjusted for effective interest and payments during the period, and the amortised cost in foreign currency translated at the exchange rate at the end of the year. Non-monetary assets and liabilities denominated in foreign currencies that are measured at fair value are retranslated to the functional currency at the exchange rate at the date that the fair value was determined. Foreign currency differences arising on retranslation are recognised in profit or loss. Non-monetary items in a foreign currency that are measured in terms of historical cost are translated using the exchange rate at the date of the transaction. Financial instruments (i) Non-derivative financial assets The Group initially recognises loans and receivables and deposits on the date that they are originated. All other financial assets (including assets designated at fair value through profit or loss) are recognised initially on the trade date at which the Group becomes a party to the contractual provisions of the instrument. The Group derecognises a financial asset when the contractual rights to the cash flows from the asset expire, or it transfers the rights to receive the contractual cash flows on the financial asset in a transaction in which substantially all the risks and rewards
of ownership of the financial asset are transferred. Any interest in transferred financial assets that is created or retained by the Group is recognised as a separate asset or liability. Financial assets and liabilities are offset and the net amount presented in the statement of financial position when, and only when, the Group has a legal right to offset the amounts and intends either to settle on a net basis or to realise the asset and settle the liability simultaneously. The Group has the following non-derivative financial assets: held-to-maturity financial assets and loans and receivables. Held to maturity financial assets If the Group has the positive intent and ability to hold debt securities to maturity, then such financial assets are classified as held to maturity. Held to maturity financial assets are recognised initially at fair value plus any directly attributable transaction costs. Subsequent to initial recognition held-to-maturity financial assets are measured at amortised cost using the effective interest method, less any impairment losses. Any sale or reclassification of a more than insignificant amount of held-to-maturity investments not close to their maturity would result in the reclassification of all held-to maturity investments as available-for-sale, and prevent the Group from classifying investment securities as held-to-maturity for the current and the following two financial years. Loans and receivables Loans and receivables are financial assets with fixed or determinable payments that are not quoted in an active market. Such assets are recognised initially at fair value plus any directly attributable transaction costs. Subsequent to initial recognition loans and receivables are measured at amortised cost using the effective interest method, less any impairment losses.
78 79Section 6 – Financial statements as at 31 March 2013
Notes to the financial statements
3. Significant accounting policies continued Financial instruments continued Loans and receivables continued Loans and receivables comprise cash and cash equivalents and, trade and other receivables. Cash and cash equivalents Cash and cash equivalents comprise cash balances and call deposits with original maturities of three months or less from the acquisition date that are subject to an insignificant risk of changes in their fair value, and are used by the Group in the management of its short-term commitments. Bank overdrafts that are repayable on demand and form an integral part of the Group’s cash management are included as a component of cash and cash equivalents for the purpose of the statement of cash flows. (ii) Non-derivative financial liabilities The Group initially recognises debt securities issued and subordinated liabilities on the date that they are originated. All other financial liabilities (including liabilities designated at fair value through profit or loss) are recognised initially on the trade date, which is the date that the Company becomes a party to the contractual provisions of the instrument. The Group derecognises a financial liability when its contractual obligations are discharged or cancelled or expire. Financial assets and liabilities are offset and the net amount presented in the statement of financial position when, and only when, the Group has a legal right to offset the amounts and intends either to settle on a net basis or to realise the asset and settle the liability simultaneously.
The Group has the following non-derivative financial liabilities: loans and borrowings, bank overdrafts, and trade and other payables. Such financial liabilities are recognised initially at fair value plus any directly attributable transaction costs. Subsequent to initial recognition, these financial liabilities are measured at amortised cost using the effective interest rate method. (iii) Share capital Ordinary shares Ordinary shares are classified as equity. Incremental costs directly attributable to the issue of ordinary shares and share options are recognised as a deduction from equity, net of any tax effects. (iv) Derivative financial instruments, including hedge accounting The Group holds derivative financial instruments to hedge its interest rate risk exposures. On initial designation of the derivative as the hedging instrument, the Group formally documents the relationship between the hedging instrument and hedged item, including the risk management objectives and strategy in undertaking the hedge transaction and the hedged risk, together with the methods that will be used to assess the effectiveness of the hedging relationship. The Group makes an assessment, both at the inception of the hedge relationship as well as on an ongoing basis, whether the hedging instruments are expected to be highly effective in offsetting the changes in the fair value or cash flows of the respective hedged items during the period for which the hedge is designated, and whether the actual results of each hedge are within a range of 80–125 percent. For a cash flow hedge of a forecast transaction, the transaction should be highly
probable to occur and should present an exposure to variations in cash flows that could ultimately affect reported net income. Derivatives are recognised initially at fair value; attributable transaction costs are recognised in profit or loss as incurred. Subsequent to initial recognition, derivatives are measured at fair value and changes therein are accounted for as described below. Cash flow hedges When a derivative is designated as the hedging instrument in a hedge of the variability in cash flows attributable to a particular risk associated with a recognised asset or liability or a highly probable forecast transaction that could affect profit or loss, the effective portion of changes in the fair value of the derivative is recognised in other comprehensive income and presented in the hedging reserve in equity. Any ineffective portion of changes in the fair value of the derivative is recognised immediately in profit or loss. When the hedged item is a non-financial asset, the amount recognised in equity is included in the carrying amount of the asset when the asset is recognised. In other cases the amount accumulated in equity is reclassified to profit or loss in the same period that the hedged item affects profit or loss. If the hedging instrument no longer meets the criteria for hedge accounting, expires or is sold, terminated or exercised, or the designation is revoked, then hedge accounting is discontinued prospectively. If the forecast transaction is no longer expected to occur, then the balance in equity is reclassified to profit or loss. Other non-trading derivatives When a derivative financial instrument is not designated in a hedge relationship that qualifies for hedge accounting, all changes in its fair value are recognised immediately in profit or loss.
Property, plant and equipment (i) Recognition and measurement Fair value – land, buildings and improvements Land, buildings and improvements are initially measured at cost. Following initial recognition at cost, land, buildings and improvements are measured on a fair value basis as determined by a director’s valuation. An external, independent valuation company, having appropriate recognised professional qualifications and recent experience in the location and category of property being valued, values properties within the Group’s portfolio on a rotational basis to ensure that the carrying amount does not differ materially from the asset’s fair value at the balance sheet date. Fair value is determined by reference to market values, being the estimated amount for which a property could be exchanged on the date of valuation between a willing buyer and willing seller in an arm’s length transaction after proper marketing wherein the parties had each acted knowledgeably, prudently and without compulsion. At each reporting date, the value of each asset in these classes is reviewed to ensure that it does not materially differ from the asset’s fair value at that date. Where necessary, the asset is revalued to reflect its fair value. A revaluation increment is credited to the asset revaluation reserve in equity unless it reverses a revaluation decrement of the same asset previously recognised in profit or loss. A revaluation decrement is recognised in profit or loss unless it directly offsets a previous increment of the same asset in the asset revaluation reserve. In addition, any accumulated depreciation as at revaluation date is eliminated against the gross carrying amount of the asset and the net amount is restated to the revalued amount of the asset.
Upon disposal, any revaluation reserve relating to the particular asset being sod is transferred to retained earnings. Cost – plant and equipment Items of plant and equipment are measured at cost less accumulated depreciation and accumulated impairment losses. Cost includes expenditure that is directly attributable to the acquisition of the asset. The cost of self-constructed assets includes the cost of materials and direct labour, any other costs directly attributable to bringing the assets to a working condition for their intended use, the costs of dismantling and removing the items and restoring the site on which they are located, and capitalised borrowing costs. Cost also may include transfers from equity of any gain or loss on qualifying cash flow hedges of foreign currency purchases of property, plant and equipment. Purchased software that is integral to the functionality of the related equipment is capitalised as part of that equipment. When parts of an item of property, plant and equipment have different useful lives, they are accounted for as separate items (major components) of property, plant and equipment. Any gains and losses on disposal of an item of property, plant and equipment (calculated as the difference between the net proceeds from disposal and the carrying amount of the item) is recognised in profit or loss.
(ii) Subsequent costs The cost of replacing a part of an item of plant and equipment is recognised in the carrying amount of the item if it is probable that the future economic benefits embodied within the part will flow to the Group, and its cost can be measured reliably. The carrying amount of the replaced part is derecognised. The costs of the day-to-day servicing of plant and equipment are recognised in profit or loss as incurred. (iii) Depreciation Depreciation is calculated over the depreciable amount, which is the cost of an asset, or other amount substituted for cost, less its residual value. Items of property, plant and equipment are depreciated on a straight-line basis in profit or loss over the estimated useful lives of each component since this most closely reflects the expected pattern of consumption of the future economic benefits embodied in the asset. Leased assets are depreciated over the shorter of the lease term and their useful lives unless it is reasonably certain that the Group will obtain ownership by the end of the lease term. The estimated useful lives for the current and comparative years of significant items of property, plant and equipment are as follows: Depreciation methods, useful lives and residual values are reviewed at each reporting date and adjusted if appropriate.
2013 2012
Plant and equipment 5–12 years 5–12 years
Plant and equipment under lease 2–5 years 2–5 years
Motorised equipment 8–15 years 8–15 years
80 81Section 6 – Financial statements as at 31 March 2013
continuedNotes to the financial statements
3. Significant accounting policies continued Property, plant and equipment continued (iv) Pastoral leases The Group has pastoral leases in the Northern Territory, Queensland and Western Australia. The Northern Territory leases are either pastoral lease for term with right to apply for extension or perpetual pastoral lease. The Queensland and Western Australia leases are fixed term with the right to apply for a new lease at the expiration of the term of the existing lease. Intangible assets (i) Goodwill/discount on acquisition Goodwill (discount on acquisition) arises on the acquisition of subsidiaries, associates and jointly controlled entities. Goodwill represents the excess of the cost of the acquisition over the Group’s interest in the net fair value of the identifiable assets, liabilities and contingent liabilities of the acquiree. Goodwill is measured at cost less accumulated impairment losses. In respect of equity accounted investees, the carrying amount of goodwill is included in the carrying amount of the investment. Biological assets Biological assets are comprised of livestock (cattle and horses) and are measured at fair value less estimated point-of-sale costs, with any change therein recognised in profit or loss. Point-of-sale costs include all costs that would be necessary to sell the assets (eg. road transport costs, agent commissions).
An external, independent valuation company, having appropriate recognised professional qualifications and recent experience in the location and nature of cattle held by the Group performs a valuation for the reporting date. Fair value is determined by reference to market values for cattle of similar age, weight, breed and genetic make-up. The fair value represents the estimated amount for which cattle could be sold on the date of valuation between a willing buyer and willing seller in an arm’s length transaction after proper marketing wherein the parties had each acted knowledgably, prudently and without compulsion. Where market-determined prices or values may not be available for a biological asset in its present condition, the Group use the present value of expected net cash flows from the asset discounted at a current market-determined rate in determining fair value. Leased assets Leases in terms of which the Group assumes substantially all the risks and rewards of ownership are classified as finance leases. On initial recognition the leased asset is measured at an amount equal to the lower of its fair value and the present value of the minimum lease payments. Subsequent to initial recognition, the asset is accounted for in accordance with the accounting policy applicable to that asset. Other leases are operating leases and are not recognised in the Group’s statement of financial position. Impairment (i) Non-derivative financial assets A financial asset not carried at fair value through profit or loss is assessed at each reporting date to determine whether there is objective evidence that it is impaired. A financial asset is impaired if there is objective evidence of impairment as a result of one or
more events that occurred after the initial recognition of the asset, and that the loss event had a negative effect on the estimated future cash flows of that asset that can be estimated reliably. Objective evidence that financial assets (including equity securities) are impaired includes default or delinquency by a debtor, restructuring of an amount due to the Group on terms that the Group would not consider otherwise, indications that a debtor or issuer will enter bankruptcy, the disappearance of an active market for a security. In addition, for an investment in an equity security, a significant or prolonged decline in its fair value below its cost is objective evidence of impairment. The Group considers evidence of impairment for receivables and held-to-maturity investment securities at both a specific asset and collective level. All individually significant assets are assessed for specific impairment. Those found not to be specifically impaired are then collectively assessed for any impairment that has been incurred but not yet identified. In assessing collective impairment the Group uses historical trends of the probability of default, timing of recoveries and the amount of loss incurred, adjusted for management’s judgement as to whether current economic and credit conditions are such that the actual losses are likely to be greater or less than suggested by historical trends. An impairment loss in respect of a financial asset measured at amortised cost is calculated as the difference between its carrying amount and the present value of the estimated future cash flows discounted at the asset’s original effective interest rate. Losses are recognised in profit or loss and reflected in an allowance account against receivables. Interest on the
impaired asset continues to be recognised through the unwinding of the discount. When an event occurring after the impairment was recognised causes the amount of impairment loss to decrease, the decrease in impairment loss is reversed through profit or loss. (ii) Non-financial assets The carrying amounts of the Group’s non financial assets, other than biological assets and deferred tax assets, are reviewed at each reporting date to determine whether there is any indication of impairment. If any such indication exists, then the asset’s recoverable amount is estimated. The recoverable amount of an asset or CGU is the greater of its value in use and its fair value less costs to sell. In assessing value in use, the estimated future cash flows are discounted to their present value using a pre-tax discount rate that reflects current market assessments of the time value of money and the risks specific to the asset or CGU. For the purpose of impairment testing, assets that cannot be tested individually are grouped together into the smallest group of assets that generates cash inflows from continuing use that are largely independent of the cash inflows of other assets or CGUs. The Group’s corporate assets do not generate separate cash inflows. If there is an indication that a corporate asset may be impaired, then the recoverable amount is determined for the CGU to which the corporate asset belongs. An impairment loss is recognised if the carrying amount of an asset or its CGU exceeds its estimated recoverable amount. Impairment losses are recognised in profit or loss. Impairment losses recognised in respect of CGUs are allocated to reduce the carrying amount of assets in the CGU (group of CGUs) on a pro rata basis.
Impairment losses recognised in prior periods are assessed at each reporting date for any indications that the loss has decreased or no longer exists. An impairment loss is reversed if there has been a change in the estimates used to determine the recoverable amount. An impairment loss is reversed only to the extent that the asset’s carrying amount does not exceed the carrying amount that would have been determined, net of depreciation or amortisation, if no impairment loss had been recognised. Employee benefits (i) Defined contribution plans A defined contribution plan is a post-employment benefit plan under which an entity pays fixed contributions into a separate entity and will have no legal or constructive obligation to pay further amounts. Obligations for contributions to defined contribution pension plans are recognised as an employee benefit expense in profit or loss in the periods during which services are rendered by employees. Prepaid contributions are recognised as an asset to the extent that a cash refund or a reduction in future payments is available. Contributions to a defined contribution plan that are due more than 12 months after the end of the period in which the employees render the service are discounted to their present value. (ii) Other long term employee benefits The Group’s net obligation in respect of long term employee benefits other than defined benefit plans is the amount of future benefit that employees have earned in return for their service in the current and prior periods; that benefit is discounted to determine its present value, and the fair value of any related assets is deducted.
(iii) Termination benefits Termination benefits are recognised as an expense when the Group is committed demonstrably, without realistic possibility of withdrawal, to a formal detailed plan to either terminate employment before the normal retirement date, or to provide termination benefits as a result of an offer made to encourage voluntary redundancy. Termination benefits for voluntary redundancies are recognised as an expense if the Group has made an offer of voluntary redundancy, it is probable that the offer will be accepted, and the number of acceptances can be estimated reliably. If benefits are payable more than 12 months after the reporting date, then they are discounted to their present value. (iv) Short-term employee benefits Short-term employee benefit obligations are measured on an undiscounted basis and are expensed as the related service is provided. A liability is recognised for the amount expected to be paid under short term cash bonus or profit sharing plans if the Group has a present legal or constructive obligation to pay this amount as a result of past service provided by the employee, and the obligation can be estimated reliably. Revenue (i) Livestock Revenue from the sale of livestock is measured at the fair value of the consideration received or receivable. Revenue is recognised when the significant risks and rewards of ownership have been transferred to the buyer, recovery of theconsideration is probable, the associated costs and possible return of goods can be estimated reliably, there is no continuing management involvement with the goods, and the amount of revenue can be measured reliably.
82 83Section 6 – Financial statements as at 31 March 2013
continuedNotes to the financial statements
3. Significant accounting policies continued Revenue continued (i) Livestock continued The timing of the transfers of risks and rewards varies depending on the individual terms of the contract of sale. For export sales of cattle, usually transfer occurs when the product is received at the customer’s port. (ii) Change in fair value of biological assets Any increase or decrease in the fair value of biological assets is recognised as revenue in the Statement of Comprehensive Income. The movement is determined as the difference between the net market value at the beginning and the end of the period adjusted for purchases and sales during the period. Leases Payments made under operating leases are recognised in profit or loss on a straight line basis over the term of the lease. Lease incentives received are recognised as an integral part of the total lease expense, over the term of the lease. Minimum lease payments made under finance leases are apportioned between the finance expense and the reduction of the outstanding liability. The finance expense is allocated to each period during the lease term so as to produce a constant periodic rate of interest on the remaining balance of the liability. Contingent lease payments are accounted for by revising the minimum lease payments over the remaining term of the lease when the lease adjustment is confirmed.
Finance income and finance costs Finance income comprises interest income on funds. Interest income is recognised as it accrues in profit or loss, using the effective interest method. Finance costs comprise interest expense on borrowings, impairment losses recognised on financial assets, and losses on hedging instruments that are recognised in profit or loss. Borrowing costs that are not directly attributable to the acquisition, construction or production of a qualifying asset are recognised in profit or loss using the effective interest method. Foreign currency gains and losses are reported on a net basis. Income tax Income tax expense comprises current and deferred tax. Current tax and deferred tax are recognised in profit or loss except to the extent that it relates to items recognised directly in equity or in other comprehensive income. Current tax is the expected tax payable or receivable on the taxable income or loss for the year, using tax rates enacted or substantively enacted at the reporting date, and any adjustment to tax payable in respect of previous years. Deferred tax is recognised in respect of temporary differences between the carrying amounts of assets and liabilities for financial reporting purposes and the amounts used for taxation purposes. Deferred tax is not recognised for: • temporary differences on the initial recognition of assets or liabilities in a transaction that is not a business combination and that affects neither accounting nor taxable profit or loss; and
• temporary differences related to investments in subsidiaries and jointly controlled entities to the extent that it is probable that they will not reverse in the foreseeable future. Deferred tax is measured at the tax rates that are expected to be applied to temporary differences when they reverse, using tax rates enacted or substantively enacted at the reporting date. In determining the amount of current and deferred tax the Group takes into account the impact of uncertain tax positions and whether additional taxes and interest may be due. The Company believes that its accruals for tax liabilities are adequate for all open tax years based on its assessment of many factors, including interpretations of tax law and prior experience. This assessment relies on estimates and assumptions and may involve a series of judgements about future events. New information may become available that causes the Group to change its judgement regarding the adequacy of existing tax liabilities; such changes to tax liabilities will impact tax expense in the period that such a determination is made. Deferred tax assets and liabilities are offset if there is a legally enforceable right to offset current tax liabilities and assets, and they relate to income taxes levied by the same tax authority on the same taxable entity, or on different tax entities, but they intend to settle current tax liabilities and assets on a net basis or their tax assets and liabilities will be realised simultaneously. A deferred tax asset is recognised for unused tax losses, tax credits and deductible temporary differences, to the extent that it is probable that future taxable profits will be available against which they can be utilised. Deferred tax
assets are reviewed at each reporting date and are reduced to the extent that it is no longer probable that the related tax benefit will be realised. Additional income tax expenses that arise from the distribution of cash dividends are recognised at the same time that the liability to pay the related dividend is recognised. The Company does not distribute non-cash assets as dividends to its shareholders. (i) Tax consolidation The Company and its wholly-owned Australia resident entities are part of a tax-consolidated group. As a consequence, all members of the tax-consolidated group are taxed as a single entity. The head entity within the tax-consolidated group is Lake Woods Holdings Pty Limited. Current tax expense/income, deferred tax liabilities and deferred tax assets arising from temporary differences of the members of the tax-consolidated group are recognised in the separate financial statements of the members of the tax-consolidated group using the ‘separate taxpayer within group’ approach by reference to the carrying amounts of the assets and liabilities in the separate financial statements of each entity and their tax values applying under tax consolidation. Any current tax liabilities (or assets) and deferred tax assets arising from unused tax losses of the subsidiaries are assumed by the head entity of the tax-consolidated group and are recognised as amounts payable (receivable) to other entities in the tax-consolidated group in conjunction with any tax funding arrangement amounts (refer below). Any difference between these amounts is recognised by the Company as an equity contribution from or distribution to the head entity. The Company recognises deferred tax assets arising from unused tax losses
of the tax-consolidated group to the extent that it is probable that future taxable profits of the tax-consolidated group will be available against which the assets can be utilised. The Company assesses the recovery of its unused tax losses and tax credits only in the period in which they arise, and before assumption by the head entity, in accordance with AASB 112 applied in the context of the tax-consolidated group. Any subsequent period adjustments to deferred tax assets arising from unused tax losses as a result of revised assessments of the probability of recoverability are recognised by the head entity only. (ii) Nature of tax funding arrangement and tax sharing agreements The head entity, in conjunction with other members of the tax-consolidated group, has entered into a tax funding arrangement which sets out the funding obligations of members of the tax-consolidated group in respect of tax amounts. The tax funding arrangements require payments to/from the head entity equal to the current tax liability (asset) assumed by the head entity and any tax-loss deferred tax asset assumed by the head entity, resulting in the head entity recognising an inter-entity receivable/(payable) equal in amount to the tax liability/(asset) assumed. The inter-entity receivables/(payables) is at call. Contributions to fund the current tax liabilities are payable as per the tax funding arrangement and reflect the timing of the head entity’s obligation to make payments for tax liabilities to the relevant tax authorities. The head entity, in conjunction with other members of the tax-consolidated group, has also entered into a tax sharing agreement. The tax sharing agreement provides for the determination of the allocation of income tax liabilities between the entities should the head entity default
on its tax payment obligations. No amounts have been recognised in the financial statements in respect of this agreement as payment of any amounts under the tax sharing agreement is considered remote. Goods and services tax Revenue, expenses and assets are recognised net of the amount of goods and services tax (GST), except where the amount of GST incurred is not recoverable from the taxation authority. In these circumstances, the GST is recognised as part of the cost of acquisition of the asset or as part of the expense.
Receivables and payables are stated with the amount of GST included. The net amount of GST recoverable from, or payable to, the ATO is included as a current asset or liability in the statement of financial position. Cash flows are included in the statement of cash flows on a gross basis. The GST components of cash flows arising from investing and financing activities which are recoverable from, or payable to, the ATO are classified as operating cash flows. New standards and interpretations not yet adopted A number of new standards, amendments to standards and interpretations are effective for annual periods beginning after 1 January 2013, and have not been applied in preparing these financial statements. None of these is expected to have a significant effect on the financial statements of the Group, except for AASB 9 Financial Instruments, which becomes mandatory for the Group’s 2016 financial statements and could change the classification and measurement of financial assets. The Group does not plan to adopt this standard early and the extent of the impact has not been determined.
84 85Section 6 – Financial statements as at 31 March 2013
continuedNotes to the financial statements
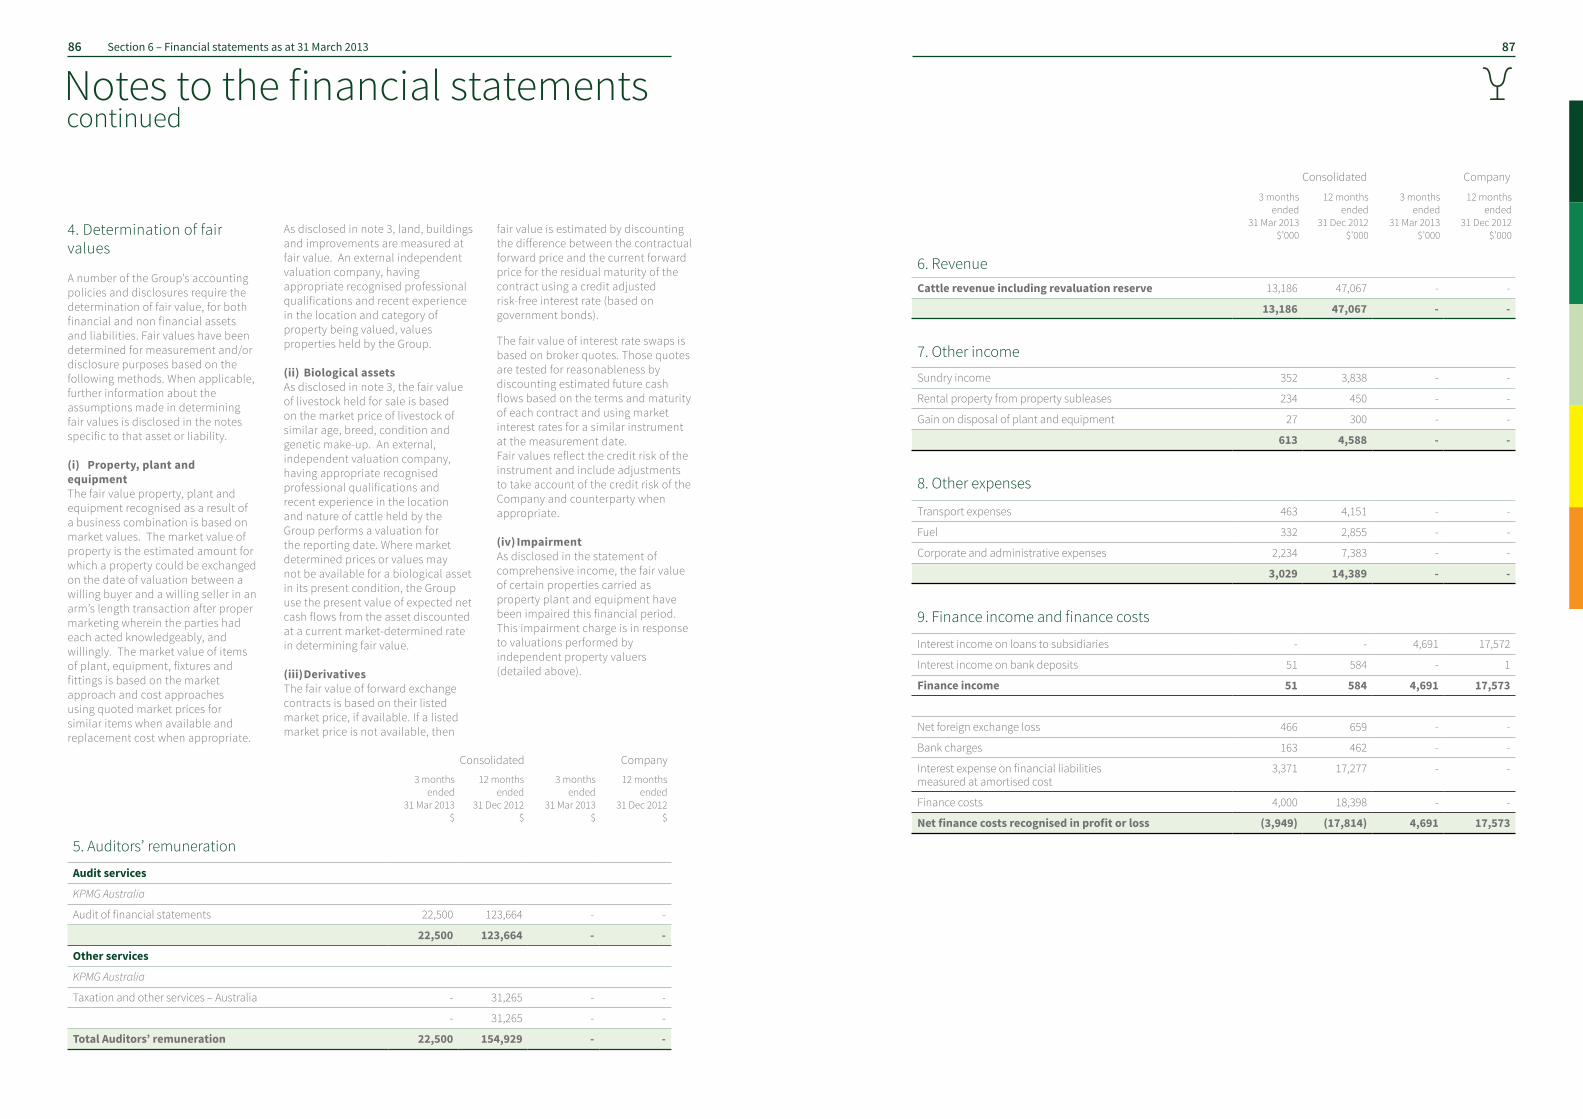
4. Determination of fair values A number of the Group’s accounting policies and disclosures require the determination of fair value, for both financial and non financial assets and liabilities. Fair values have been determined for measurement and/or disclosure purposes based on the following methods. When applicable, further information about the assumptions made in determining fair values is disclosed in the notes specific to that asset or liability. (i) Property, plant and equipment The fair value property, plant and equipment recognised as a result of a business combination is based on market values. The market value of property is the estimated amount for which a property could be exchanged on the date of valuation between a willing buyer and a willing seller in an arm’s length transaction after proper marketing wherein the parties had each acted knowledgeably, and willingly. The market value of items of plant, equipment, fixtures and fittings is based on the market approach and cost approaches using quoted market prices for similar items when available and replacement cost when appropriate.
As disclosed in note 3, land, buildings and improvements are measured at fair value. An external independent valuation company, having appropriate recognised professional qualifications and recent experience in the location and category of property being valued, values properties held by the Group. (ii) Biological assets As disclosed in note 3, the fair value of livestock held for sale is based on the market price of livestock of similar age, breed, condition and genetic make-up. An external, independent valuation company, having appropriate recognised professional qualifications and recent experience in the location and nature of cattle held by the Group performs a valuation for the reporting date. Where market determined prices or values may not be available for a biological asset in its present condition, the Group use the present value of expected net cash flows from the asset discounted at a current market-determined rate in determining fair value. (iii) Derivatives The fair value of forward exchange contracts is based on their listed market price, if available. If a listed market price is not available, then
fair value is estimated by discounting the difference between the contractual forward price and the current forward price for the residual maturity of the contract using a credit adjusted risk-free interest rate (based on government bonds).
The fair value of interest rate swaps is based on broker quotes. Those quotes are tested for reasonableness by discounting estimated future cash flows based on the terms and maturity of each contract and using market interest rates for a similar instrument at the measurement date. Fair values reflect the credit risk of the instrument and include adjustments to take account of the credit risk of the Company and counterparty when appropriate. (iv) Impairment As disclosed in the statement of comprehensive income, the fair value of certain properties carried as property plant and equipment have been impaired this financial period. This impairment charge is in response to valuations performed by independent property valuers (detailed above).
Consolidated Company
Consolidated Company
3 months ended
31 Mar 2013 $’000
12 months ended
31 Dec 2012 $’000
3 months ended
31 Mar 2013 $’000
12 months ended
31 Dec 2012 $’000
6. RevenueCattle revenue including revaluation reserve 13,186 47,067 - -
13,186 47,067 - -
7. Other income
Sundry income 352 3,838 - -
Rental property from property subleases 234 450 - -
Gain on disposal of plant and equipment 27 300 - -
613 4,588 - -
8. Other expenses
Transport expenses 463 4,151 - -
Fuel 332 2,855 - -
Corporate and administrative expenses 2,234 7,383 - -
3,029 14,389 - -
9. Finance income and finance costs
Interest income on loans to subsidiaries - - 4,691 17,572
Interest income on bank deposits 51 584 - 1
Finance income 51 584 4,691 17,573
Net foreign exchange loss 466 659 - -
Bank charges 163 462 - -
Interest expense on financial liabilities measured at amortised cost
3,371 17,277 - -
Finance costs 4,000 18,398 - -
Net finance costs recognised in profit or loss (3,949) (17,814) 4,691 17,573
86 87Section 6 – Financial statements as at 31 March 2013
continuedNotes to the financial statements
3 months ended
31 Mar 2013 $
12 months ended
31 Dec 2012 $
3 months ended
31 Mar 2013 $
12 months ended
31 Dec 2012 $
5. Auditors’ remuneration
Audit services
KPMG Australia
Audit of financial statements 22,500 123,664 - -
22,500 123,664 - -
Other services
KPMG Australia
Taxation and other services – Australia - 31,265 - -
- 31,265 - -
Total Auditors’ remuneration 22,500 154,929 - -
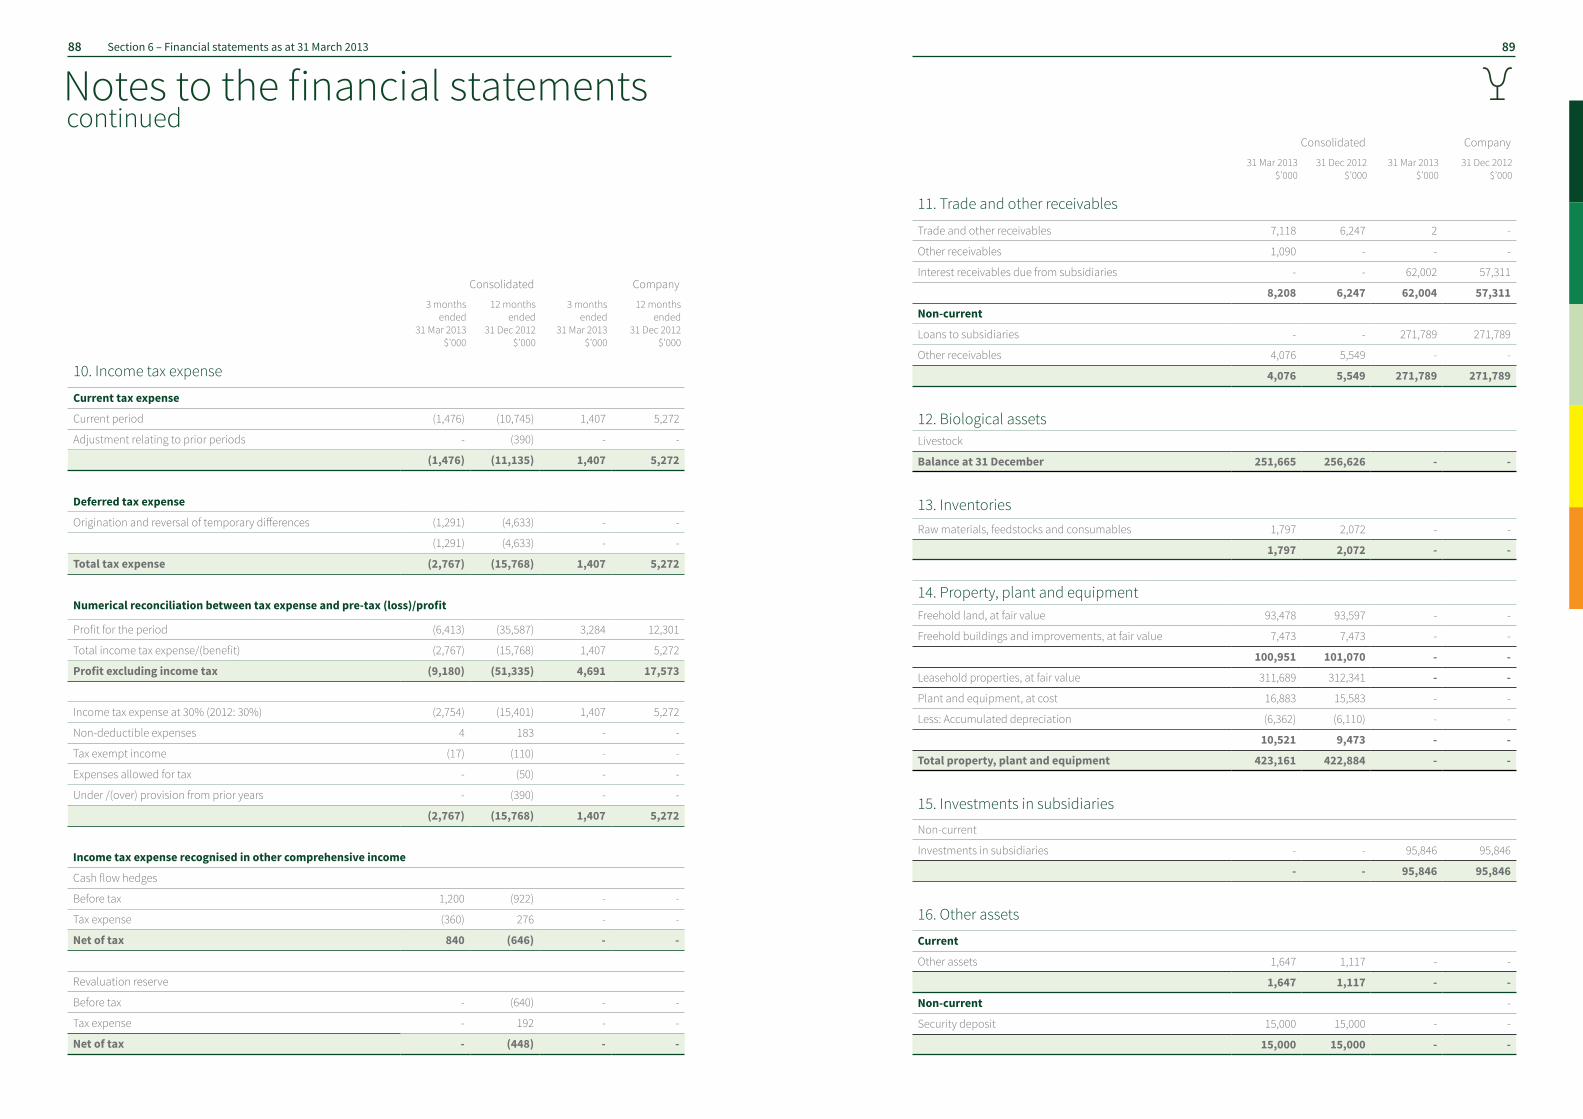
Consolidated Company
3 months ended
31 Mar 2013 $’000
12 months ended
31 Dec 2012 $’000
3 months ended
31 Mar 2013 $’000
12 months ended
31 Dec 2012 $’000
10. Income tax expense
Current tax expense
Current period (1,476) (10,745) 1,407 5,272
Adjustment relating to prior periods - (390) - -
(1,476) (11,135) 1,407 5,272
Deferred tax expense
Origination and reversal of temporary differences (1,291) (4,633) - -
(1,291) (4,633) - -
Total tax expense (2,767) (15,768) 1,407 5,272
Numerical reconciliation between tax expense and pre-tax (loss)/profit
Profit for the period (6,413) (35,587) 3,284 12,301
Total income tax expense/(benefit) (2,767) (15,768) 1,407 5,272
Profit excluding income tax (9,180) (51,335) 4,691 17,573
Income tax expense at 30% (2012: 30%) (2,754) (15,401) 1,407 5,272
Non-deductible expenses 4 183 - -
Tax exempt income (17) (110) - -
Expenses allowed for tax - (50) - -
Under /(over) provision from prior years - (390) - -
(2,767) (15,768) 1,407 5,272
Income tax expense recognised in other comprehensive income
Cash flow hedges
Before tax 1,200 (922) - -
Tax expense (360) 276 - -
Net of tax 840 (646) - -
Revaluation reserve
Before tax - (640) - -
Tax expense - 192 - -
Net of tax - (448) - -
Consolidated Company
31 Mar 2013 $’000
31 Dec 2012 $’000
31 Mar 2013 $’000
31 Dec 2012 $’000
11. Trade and other receivables
Trade and other receivables 7,118 6,247 2 -
Other receivables 1,090 - - -
Interest receivables due from subsidiaries - - 62,002 57,311
8,208 6,247 62,004 57,311
Non-current
Loans to subsidiaries - - 271,789 271,789
Other receivables 4,076 5,549 - -
4,076 5,549 271,789 271,789
12. Biological assetsLivestock
Balance at 31 December 251,665 256,626 - -
13. InventoriesRaw materials, feedstocks and consumables 1,797 2,072 - -
1,797 2,072 - -
14. Property, plant and equipmentFreehold land, at fair value 93,478 93,597 - -
Freehold buildings and improvements, at fair value 7,473 7,473 - -
100,951 101,070 - -
Leasehold properties, at fair value 311,689 312,341 - -
Plant and equipment, at cost 16,883 15,583 - -
Less: Accumulated depreciation (6,362) (6,110) - -
10,521 9,473 - -
Total property, plant and equipment 423,161 422,884 - -
15. Investments in subsidiaries
Non-current
Investments in subsidiaries - - 95,846 95,846
- - 95,846 95,846
16. Other assets
Current
Other assets 1,647 1,117 - -
1,647 1,117 - -
Non-current -
Security deposit 15,000 15,000 - -
15,000 15,000 - -
88 89Section 6 – Financial statements as at 31 March 2013
continuedNotes to the financial statements
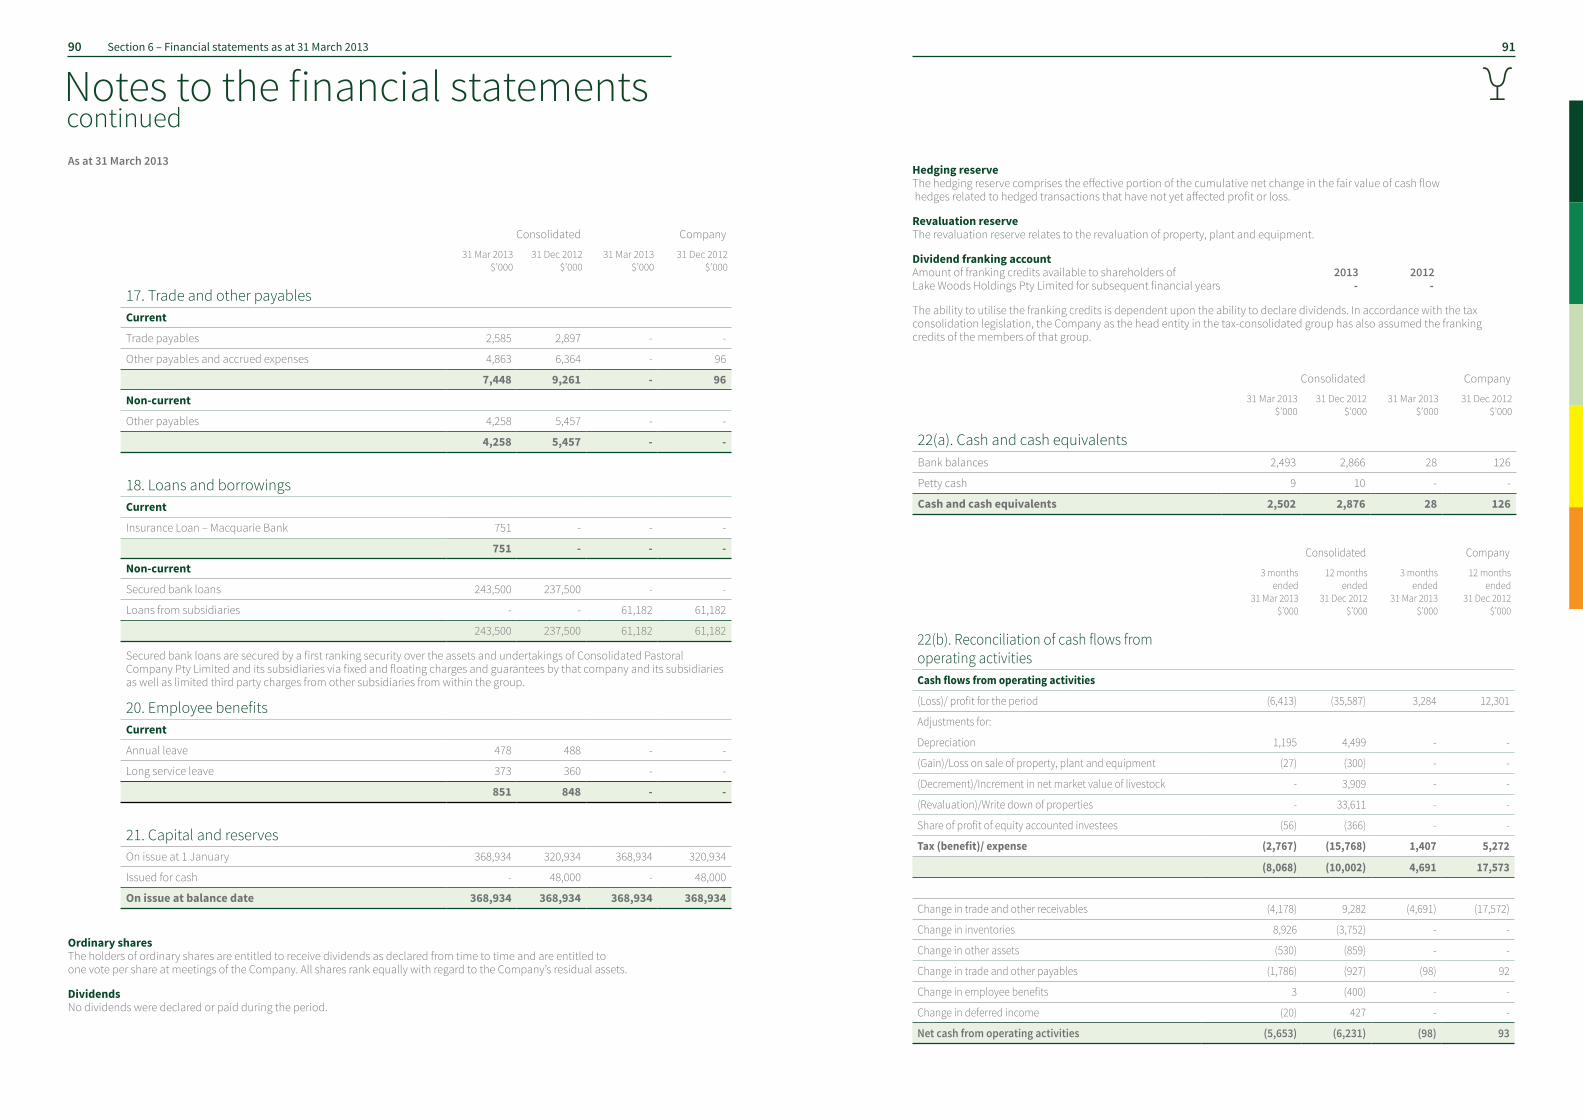
As at 31 March 2013
Consolidated Company
31 Mar 2013 $’000
31 Dec 2012 $’000
31 Mar 2013 $’000
31 Dec 2012 $’000
17. Trade and other payablesCurrent
Trade payables 2,585 2,897 - -
Other payables and accrued expenses 4,863 6,364 - 96
7,448 9,261 - 96
Non-current
Other payables 4,258 5,457 - -
4,258 5,457 - -
18. Loans and borrowingsCurrent
Insurance Loan – Macquarie Bank 751 - - -
751 - - -
Non-current
Secured bank loans 243,500 237,500 - -
Loans from subsidiaries - - 61,182 61,182
243,500 237,500 61,182 61,182
Secured bank loans are secured by a first ranking security over the assets and undertakings of Consolidated Pastoral Company Pty Limited and its subsidiaries via fixed and floating charges and guarantees by that company and its subsidiaries as well as limited third party charges from other subsidiaries from within the group.
20. Employee benefitsCurrent
Annual leave 478 488 - -
Long service leave 373 360 - -
851 848 - -
21. Capital and reserves On issue at 1 January 368,934 320,934 368,934 320,934
Issued for cash - 48,000 - 48,000
On issue at balance date 368,934 368,934 368,934 368,934
Ordinary shares The holders of ordinary shares are entitled to receive dividends as declared from time to time and are entitled to one vote per share at meetings of the Company. All shares rank equally with regard to the Company’s residual assets.
Dividends No dividends were declared or paid during the period.
Consolidated Company
31 Mar 2013 $’000
31 Dec 2012 $’000
31 Mar 2013 $’000
31 Dec 2012 $’000
22(a). Cash and cash equivalentsBank balances 2,493 2,866 28 126
Petty cash 9 10 - -
Cash and cash equivalents 2,502 2,876 28 126
Hedging reserve The hedging reserve comprises the effective portion of the cumulative net change in the fair value of cash flow hedges related to hedged transactions that have not yet affected profit or loss.
Revaluation reserve The revaluation reserve relates to the revaluation of property, plant and equipment.
Dividend franking account Amount of franking credits available to shareholders of 2013 2012 Lake Woods Holdings Pty Limited for subsequent financial years - -
The ability to utilise the franking credits is dependent upon the ability to declare dividends. In accordance with the tax consolidation legislation, the Company as the head entity in the tax-consolidated group has also assumed the franking credits of the members of that group.
Consolidated Company
3 months ended
31 Mar 2013 $’000
12 months ended
31 Dec 2012 $’000
3 months ended
31 Mar 2013 $’000
12 months ended
31 Dec 2012 $’000
22(b). Reconciliation of cash flows from operating activitiesCash flows from operating activities
(Loss)/ profit for the period (6,413) (35,587) 3,284 12,301
Adjustments for:
Depreciation 1,195 4,499 - -
(Gain)/Loss on sale of property, plant and equipment (27) (300) - -
(Decrement)/Increment in net market value of livestock - 3,909 - -
(Revaluation)/Write down of properties - 33,611 - -
Share of profit of equity accounted investees (56) (366) - -
Tax (benefit)/ expense (2,767) (15,768) 1,407 5,272
(8,068) (10,002) 4,691 17,573
Change in trade and other receivables (4,178) 9,282 (4,691) (17,572)
Change in inventories 8,926 (3,752) - -
Change in other assets (530) (859) - -
Change in trade and other payables (1,786) (927) (98) 92
Change in employee benefits 3 (400) - -
Change in deferred income (20) 427 - -
Net cash from operating activities (5,653) (6,231) (98) 93
90 91Section 6 – Financial statements as at 31 March 2013
continuedNotes to the financial statements
As at 31 March 2013
25. Subsequent event Subsequent to balance date, there has been significant volatility in Australian beef prices. The benchmark Eastern Young Cattle Indicator (EYCI) declined from $3.26 per kg cwt on 27 March 2013 to $2.79 per kg cwt on 14 May 2013.
This decline in the EYCI indicates that the fair value of the Group’s livestock may have declined subsequent to balance date. In accordance with the Group’s accounting policy as disclosed at note 3(c), the Group will engage an external, independent valuer to undertake a valuation of livestock at the next reporting date, with any changes in fair value recognised in profit and loss.
26. Contingencies
During the normal course of business, the Group is involved in legal claims and litigations. There is significant uncertainty as to whether a future liability will arise in respect of these items. The amount of liability, if any, which may arise cannot be measured reliably at this time. The Directors are of the opinion that all known liabilities have been brought to account and that adequate provision has been made for any anticipated losses.
27. Reporting period
The Company and the Group have altered their financial year end from 31 December to 31 March in the current period to better align the Group’s financial reporting to the growing season which starts at the completion of the wet season in Northern Australia. This is consistent with a number of other pastoral operators in the region. The current financial period is a three month period from 1 January 2013 to 31 March 2013, whereas the comparative period is a twelve month period from 1 January 2012 to 31 December 2012.
continuedNotes to the financial statements
23. Capital commitmentsThe Group and Company did not have any capital commitments at period end.
24. Group entitiesCountry of
incorporationOwnership
interest (%)
Parent entity
Lake Woods Holdings Pty Limited Australia
Significant subsidiaries
Lake Woods Group Pty Limited Australia 100
Lake Woods Acquisitions Pty Limited Australia 100
Consolidated Pastoral Company Pty Limited Australia 100
Consolidated Pastoral Property Pty Limited Australia 100
Baines River Cattle Company Pty Limited Australia 100
Laverton Nominees Pty Limited Australia 100
Crosswalk Pty Limited Australia 100
CPC (China) Holdings Pty Limited Australia 100
Directors’ declaration
In the opinion of the directors of Lake Woods Holdings Pty Limited (“the Company”): (a) the Company and Group are not reporting entities; (b) the financial statements and notes, set out on pages 73 to 92, are in accordance with the Corporations Act 2001, including: (i) giving a true and fair view of the financial position of the Company and the Group as at 31 March 2013 and of their performance, as represented by the results of their operations and their cash flows, for the financial year ended on that date in accordance with the statement of compliance and basis of preparation described in Notes 1 and 2; and (ii) complying with Australian Accounting Standards (including the Australian Accounting Interpretations) to the extent described in Notes 1 and 2, and the Corporations Regulations 2001; and (c) there are reasonable grounds to believe that the Company and the Group will be able to pay its debts as and when they become due and payable.
Signed in accordance with a resolution of directors.
Fergal Leamy John Stevenson Director Director
Dated at Brisbane this 25th day of June 2013
92 93Section 6 – Financial statements as at 31 March 2013
As at 31 March 2013
Independent audit report to the members of Lake Woods Holdings Pty Limited
We have audited the accompanying financial report, being a special purpose financial report, of Lake Woods Holdings Pty Limited (the Company), which comprises the statements of financial position as at 31 March 2013, and the statements of comprehensive income, statements of changes in equity and statements of cash flows for the period 1 January 2013 to 31 March 2013, notes 1 to 27 comprising a summary of significant accounting policies and other explanatory information, and the directors’ declaration of the Company and the group comprising the Company and the entities it controlled at the period’s end or from time to time during the financial period. Directors’ responsibility for the financial report The directors of the Company are responsible for the preparation of the financial report that gives a true and fair view and have determined that the basis of preparation described in Note 2 to the financial report is appropriate to meet the requirements of the Corporations Act 2001 and is appropriate to meet the needs of the members. The directors’ responsibility also includes such internal control as the directors determine necessary to enable the preparation of a financial report that is free from material misstatement, whether due to fraud or error. Auditor’s responsibility Our responsibility is to express an opinion on the financial report based on our audit. We conducted our audit in accordance with Australian Auditing Standards. These Auditing Standards require that we comply with relevant ethical requirements relating to audit engagements and plan and perform the audit to obtain reasonable assurance whether the financial report is free from material misstatement. An audit involves performing procedures to obtain audit evidence about the amounts and disclosures in the financial report. The procedures selected depend on the auditor’s judgement, including the assessment of the risks of material misstatement of the financial report, whether due to fraud or error. In making those risk assessments, the auditor considers internal control relevant to the entity’s preparation of the financial report that gives a true and fair view in order to design audit procedures that are appropriate in the circumstances, but not for the purpose of expressing an opinion on the effectiveness of the entity’s internal control. An audit also includes evaluating the appropriateness of accounting policies used and the reasonableness of accounting estimates made by the directors, as well as evaluating the overall presentation of the financial report. These procedures have been undertaken to form an opinion whether, in all material respects, the financial report is presented fairly in accordance with the basis of accounting described in Note 2 to the financial statements so as to present a true and fair view which is consistent with our understanding of the Company’s financial position, and of their performance. We believe that the audit evidence we have obtained is sufficient and appropriate to provide a basis for our audit opinion.
Independent audit report to the members of Lake Woods Holdings Pty Limited (continued) Independence In conducting our audit, we have complied with the independence requirements of the Corporations Act 2001. We confirm that the independence declaration required by theCorporations Act 2001, which has been given to the directors of Lake Woods Holdings PtyLimited on 25 June 2013, would be in the same terms if given to the directors as at the time of this auditor’s report. Auditor’s opinion In our opinion the financial report of Lake Woods Holdings Pty Ltd is in accordance with the Corporations Act 2001, including: (a) giving a true and fair view of the Company’s and the Group’s financial position as at 31 March 2013 and oftheir performance for the period from 1 January 2013 to 31 March 2013; and (b) complying with Australian Accounting Standards to the extent described in Note 2 and the Corporations Regulations 2001. Basis of Accounting Without modifying our opinion, we draw attention to Note 2 to the financial report, which describes the basis of accounting. The financial report has been prepared for the purpose of fulfilling the directors’ financial reporting responsibilities under the Corporations Act 2001. As a result, the financial report may not be suitable for another purpose.
KPMG
Matthew McCarron Partner Sydney 2 July 2013
94 95Section 6 – Financial statements as at 31 March 2013
Independent Audit Report

Contact information
Annual report designed by Tania Warriner. Photography by Richard Waite, Tania Warriner and Ross Eason.
96 Section 6 – Financial statements as at 31 March 2013
Registered Office:
Consolidated Pastoral Company Pty Ltd
Newcastle Waters Station
Newcastle Waters NT 0862
P: +61 8 8964 4527
F: +61 8 8964 4533
Corporate Office:
Level 2/72 Newmarket Road
Windsor QLD 4030
P: +61 7 3174 5200
F: +61 7 3861 1707
www.pastoral.com


