236
ANNUAL REPORT 2018 Towards a sustainable data-driven world

ANNUAL REPORT 2018Towards a sustainable
data-driven world

Towards a sustainable data-driven world
We envisage a future where data is the biggest driver for continuously increasing societal and economic value. As digitalization gains momentum, personalized services become the new normal. To address these changes and to continue to be successful, our customers are increasingly looking for data-driven innovations and new revenue streams. We seek a pivotal role in this change and aim to capture the significant opportunities of the data-driven
Our world is changing rapidly, and data sits firmly at the centre of this transformation. As the leading Nordic software and services company, we aim to take advantage of this development and create great everyday experiences for Nordic citizens and consumers. We play an important role in co-creating a sustainable data-driven world.
FULL NAME: Tieto Corporation Company FOUNDED in 1968HEADQUARTERS in Espoo, FinlandLISTED on NASDAQ OMX in Helsinki and Stockholm TOTAL EQUITY: EUR 482.5 millionTOTAL LIABILITIES: EUR 715.0 million
world. With headquarters in Espoo, Finland, we employee around 15 000 people in close to 20 countries. Building on a strong Nordic heritage, we combine global capabilities with local presence. Our annual report consist of four parts: 2018 integrated report including sustainability performance, governance and financial reports as well as sustainability management.
Facts and figures(end of December 2018)
NUMBER OF
OPERATING COUNTRIES
19
NUMBER OF EMPLOYEES
Full time employees
15 190
Headcount
15 739
NET SALES
1 599.5 MEUR
For more information about us, please click here.
HOW TO NAVIGATE: Our annual report consist of four parts: 2018 integrated report including Sustainability performance, Governance and Financial reports as well as Sustainability management. This PDF has a linked navigation that helps you to find the information you are looking for more quickly.
Link to tieto.com
Link to the table of contents page
2
Creating valueTieto 2018 Governance Financials Sustainability
Annual report 2018
FINANCIALS 90
Report by the Board of Directors 92
Calculation of key figures 126
Consolidated Financial Statement 128
Parent company's Financial Statement 189
Dividend proposal, signatures for the Board of Directors' report and Financial Statement and auditor's note 201
Auditor's report 202
Shares and shareholders 206
Information for shareholders 211
Table of contents
SUSTAINABILITY 213
Our approach to sustainability 214
Managing sustainability 216
Sustainability opportunities and risks 219
Materiality analysis 221
Sustainability 2020 plan 223
About sustainability reporting 225
Independent assurance report 227
GRI Content index table 229
GOVERNANCE 63
Corporate Governance Statement 64
Annual General Meeting 65
Shareholders' Nomination Board 65
The Board of Directors 67
The President and CEO and operative management 72
Internal control and risk management 74
Major risks 76
Related-party transactions 79
Insider administration 80
Auditors 80
Remuneration statement 81
Letter from the Chairman of the Remuneration Committee 88
Towards a sustainable data-driven world 2
Table of contents 3
TIETO 2018 4
Highlights 2018 5
CEO statement 8
CREATING VALUE 10
Strategy and operating model 11
Creating value in the data-driven world 13
Dashboard 15
Markets 17
Stakeholder dialogue 19
Creating value for business 20
Creating value for employees 39
Creating value for society and the environment 52
3
Creating valueTieto 2018 Governance Financials Sustainability
Annual report 2018

Highlights 2018 5
CEO statement 8
Tieto 2018
4Annual report 2018
Creating valueTieto 2018 Governance Financials Sustainability

We were recognized as a global technology leader by Thomson Reuters. Explore how we aim to create value in the data-driven world.
Tieto 50 years
As part of our 50-year celebrations,
we focused on giving back to
society and encouraged our
employees to do charity work
together with our societal partners.
Read more
Read more
7%
10%
Customer experience Relationship Net Promoter Score (rNPS)
EBIT margin
+24
2018 highlights
Growth in local currencies
75%
Employee engagement score
5Annual report 2018
Creating valueTieto 2018 Governance Financials Sustainability

In 2018, we celebrated our 50th anniversary as a key player in digitalization and shaping the future of the Nordic societies.
Thomson Reuters nominated Tieto among top 100 Global Tech Leaders.
We signed an agreement to acquire Petrostreamz to strengthen our capabilities in hydrocarbon management solutions.
The signing of an agreement to acquire Swedish security services company NSEC AB brought us further capabilities in managed security operations and security consulting.
Our Artificial Intelligence (AI) Accelerator Programme was launched to support Swedish start-ups in developing new healthcare solutions by utilizing AI.
Tieto and City of Espoo in Finland conducted a unique experiment to prove that AI can be used for targeting services and to identify individuals in need for support, ultimately to prevent social exclusion of the young.
Q1 /2018
2018 highlights
Q2 /2018
6Annual report 2018
Creating valueTieto 2018 Governance Financials Sustainability

Q3 /2018
Q4 /2018
The first socio-economic impact assessment on Tieto Intelligent Wellbeing, a data-driven solution for advanced healthcare and welfare, was conducted.
Non-profit organization Equileap ranked us among the top 25 companies globally in gender equality.
Our commitment to ethical AI development was further strengthened as we became one of the first Nordic companies to join the European AI Alliance. To reinforce our AI ethics efforts, we also introduced AI ethics guidelines and certification for our employees.
We ranked among top 25 global fintech enterprises by IDC Financial Insights.
Acquisition of Sweden-based Meridium AB enhanced our digital customer experience capabilities.
We achieved level B in CDP Climate Change scoring. This score recognized our solid environmental management efforts over the years.
We teamed up with other leading Finnish companies including Asiakastieto, Nordea, OP and Privanet to develop a new blockchain-based platform to digitalize trading of non-listed company shares.
7Annual report 2018
Creating valueTieto 2018 Governance Financials Sustainability

Continued demand for renewal opens opportunities for growth.
Our 50th anniversary made 2018 a special year for everyone at Tieto. The jubilee year demonstrated continuation of our multi-year performance improvement including highest-ever customer experience (rNPS), further improvement in employee engagement, and strong financial results with good cash flow and profitability which enabled continued dividend increase and payout. Furthermore, early in the year we were nominated into a prominent group of companies as a Top 100 Global Technology Leader by Thomson Reuters, and in the autumn we were ranked among the Top 25 companies globally in gender equality by Equileap. I want to thank our employees and all key stakeholders for making this development possible through long-term commitment and collaboration.
Creating great everyday experiences in the data-rich world
We are inspired by the opportunities at hand for advancing our customers’ business and the society-level development with smarter use of data and technology. On 6 February 2019 we launched our new company strategy, with the aim to further enhance value creation for our customers, shareholders and employees. To accelerate customers’ innovation and business creation opportunities, we will expand our design and data-led consulting services, redefine customer engagement and build networked operations and leadership across the company. By this, we aim to be more agile, fast adapting to customer and market needs – and empower Tieto teams to co-create great everyday experiences for Nordic citizens and consumers. As part of the new strategy, we have also upgraded our growth and profitability ambitions for the coming years.
The data-driven world is advancing and expanding, opening new avenues for innovation and business creation. At Tieto we are inspired by these opportunities - helping our customers to become more competitive and enriching society with unique services and experiences.
CEO STATEMENT
“
8Annual report 2018
Creating valueTieto 2018 Governance Financials Sustainability

Employee experience and learning as lifestyle - foundations for success
The next chapter in our renewal is being built on a solid existing foundation supported by increased investments into areas contributing to our future competitiveness. As core part of this, we will in the next few years significantly increase our skills and capabilities in areas and roles such as data science, AI, data engineering, design, customer experience, software development, and cloud solutions.
As the competition over talent intensifies, the focus on employee experience and employer image become more important than ever. We have seen a strong upward trend in our employee engagement since 2014. Building on our Open Source culture with utmost respect for every individual at the core, we are committed to continue this trend and for example empower purpose-driven professional networks, aiming to make Tieto the most engaging workplace in the industry.
We encourage all of us in Tieto to embrace a ‘Learning as a Lifestyle’ mindset and offer an expanding selection of learning modules open for everyone to explore. In 2018 we welcomed around 3 000 new colleagues into our company through recruitment and enhanced our capabilities also through three acquisitions, welcoming Petrostreamz within
Oil & Gas, Swedish NSEC within Security Services and Swedish Meridium within Digital Customer Experience to the Tieto team. Through these activities we further enhance our competitiveness and cultural evolution, contributing to our profile as an employer of choice.
Empowering sustainable societies
Stemming from our strong Nordic value-base, sustainability and social responsibility have always been at the core of Tieto. With a growing amount of technology solutions and explorations in the digital era, new sustainability aspects are emerging and gaining more weight in the minds of all stakeholders. Recent sustainability considerations include for example the ethical use of AI, as well as energy efficiency. At Tieto we are driving our Sustainability 2020 plan with focus on three areas: minimizing environmental impact, being an ethical forerunner and creating value for all stakeholders. As an example of our efforts to lead the way in 2018 we updated our company-wide Code of Conduct to further reflect the global demands of today, and by year end 87% of our employees completed the e-learning. During the year we also reinforced our commitment to drive ethical AI product and service development with
the launch of our AI ethics framework and certificate for employees working within this area. We are also actively engaged in important dialogues to enhance societal equality through digital democracy – a recent example being our collaboration with Startup Refugees in Finland.
Continued demand for renewal opens opportunities for growth
Driven by the speed of innovation and adoption of new technologies by both our customers and ourselves, the overall investment agenda in the market continues to be positively dynamic. Operational agility and innovation of new data-driven business models remain high on our customers’ agenda. In 2018, the market continued its longer-term shift, with reduced spending on basic infrastructure services and increased spending on consulting and application services.
In 2019, the Nordic IT software and services market is anticipated to grow by 2–3%. Customers are expected to shift their spending towards business-led renewal with a focus on both unleashing value from data and on efficiency improvement. This provides a significant opportunity for IT service providers. The market for new services built around data and design is anticipated to grow double-digit over the next few years. In parallel, business
continuity and efficiency continue to be of high importance both to our customers and ourselves. The global market for product development services continues to develop favourably as the demand for advanced software engineering is expected to increase across several industry sectors.
As we operate in this highly dynamic data-rich market, we continue to see new opportunities for innovation, growth and impact on societal level. Grasping these opportunities sets a positive demand for accelerated learning, exchange of ideas and co-innovation. Building on our global talent, multi-year positive progress and the new strategy, we are set to take a very active role in making our customers more competitive - and believe we will see both customer and employee experience reach new record levels as result. In parallel, we look forward to contributing to the societies we live in, through even more advanced and sustainable utilization of modern technologies.
I would like to sincerely thank our customers, employees, partners and shareholders for making our 50th anniversary year a memorable one, and look forward to our close future collaboration.
KIMMO ALKIO President and CEO
9Annual report 2018
Creating valueTieto 2018 Governance Financials Sustainability

Creating valueStrategy and operating model 11
Creating value in the data-driven world 13
Dashboard 15
Markets 17
Stakeholder dialogue 19
Creating value for business 20
Sustainable IT solutions 21
Customer experience 25
Information security and data privacy 29
Sustainable supply chain 32
Ethical culture 35
Creating value for employees 39
Equal opportunities 43
Employee experience 48
Creating value for society and the environment 52
Greenhouse gas emission 53
Economic impact 57
Societal engagements 61
10Annual report 2018
Creating valueTieto 2018 Governance Financials Sustainability

Enterprises and public organizations are increasing their investments in new data-rich services and differentiating service experiences for their customers. Operational agility, innovation and new data-driven business models will be the main drivers for customers’ and Tieto’s competitiveness. Today’s customer agenda opens up significant opportunities to IT service providers as enterprises re-focus their IT investments accordingly.
Tieto will facilitate customers’ innovation and renewal agenda throughout the entire cycle addressing design of service experiences, smart use of data, architecture adoption and application renewal. Digital experience business, driving agile iterations of the innovation and renewal cycle, will form the essence of competitiveness and growth for customers and Tieto. Adaptive hybrid
Strategy and operating modelCreating great everyday experiences in the data-rich world
CREATING VALUE
infrastructures utilizing leading technology platforms and partnerships ensure business agility and cost optimization while supporting customers’ business-critical services.
Operating model
To enable faster time to market and context-rich customer engagement and co-creation with customers, Tieto will adopt networked, simplified ways of working and renew its leadership model during 2019. The new model will empower agile teams to dynamically address evolving customer challenges.
For the key markets of Finland, Sweden and Norway, a new Managing Partner position will be established in each country to focus on market share growth, on leading the country
Tieto is taking the next big leap in its renewal to enhance the future competitiveness of customers and the company alike. With its new strategy, Tieto focuses on accelerating customers’ design and data-led innovation and renewal in the Nordics.
DATA AT THE CORE OF INNOVATION AND VALUE CREATION
Hybrid Infrastructure
Renewapplications
Adapt enterprise
architecture
Design and experience
Data and insights
Agile
11Annual report 2018
Creating valueTieto 2018 Governance Financials Sustainability

management network and on accelerating the Digital Experience business in the respective country.
In addition to accelerating digital experience services, the company will continue to focus on the Industry Software, Hybrid Infrastructure and Product Development Services businesses:
• DIGITAL EXPERIENCE: the core of Nordic customers’ data-driven innovation and renewal, including design of service experiences, smart use of data, architecture adoption and application renewal.
• HYBRID INFRA: the hybrid infrastructure foundation to ensure Nordic customers’ business continuity and renewal, including capacity services, hybrid cloud
OUR BUSINESS AND GO-TO-MARKET STRUCTURE
Digital Experience
Hybrid Infra
Industry Software
Product Development
Services
Centers of Excellence and Global Delivery centers
Country Management Network
CUSTOMER
Group management and Support
FI
FI
SE
SE
NO
NO
Operational agility, innovation and new data- driven business models will be the main drivers for customers’ and Tieto’s competitiveness. Learn more
“ IN THE BEGINNING OF
2019 WE LAUNCHED
A NEW STRATEGY TO
CREATE GREAT EVERY-
DAY EXPERIENCES IN
THE DATA-RICH WORLD
orchestration, and managed security services. Tieto is well positioned to manage Nordic customers’ technology complexity.
• INDUSTRY SOFTWARE: best-in-class industry software. Tieto aims to accelerate software businesses with selected spearhead solutions and continues to drive international expansion of selected globally competitive businesses.
• PRODUCT DEVELOPMENT SERVICES:
continued focus on delivering software R&D services to enhance connectivity and data-richness in customers’ products and services. The scope of the services is global and Product Development Services will continue its current strategy to expand its customer base beyond the telecom sector.
12Annual report 2018
Creating valueTieto 2018 Governance Financials Sustainability

Creating value in the data-driven worldIn a world driven by data, every bit of information can be used to provide new and sustainable value. Our value creation model is based on our strategic ambition: creating great everyday experiences and making our customers more competitive. In this report we aim to provide an overall picture of our value creation capabilities. The value creation model below has been prepared using The International <IR> Framework.
Through the foundation, we are able to increase customer value and accelerate innovation.
CREATING VALUE
How our operations create value for our stakeholders
Our main role is to support our customers to renew their business and innovate new services and business models in the data-rich world. Our role varies from advisory and design of services to building and running systems and solutions. We look at the world from our customers’ perspective and aim to offer the best services and solutions from our wide-ranging portfolio. This enables our customers to focus on their core business and create value in their respective sectors. Through the foundation, we are able toincrease customer value and accelerate innovation. We aim to use the opportunities which come with a world increasingly driven
by data to create societal, economic and environmental value. We do this through:
• SMART TECHNOLOGY – with digital and mobile services we enable a better everyday life for millions of people.
• OPTIMIZING BUSINESS AND IT – our customers can benefit from increased scalability and business continuity, while ensuring competitiveness and growth.
• INNOVATE SOLUTIONS – we help create smarter cities, effective care and efficient digital government operation.
• ROBUST FINANCIAL GOVERNANCE
AND CONSISTENT PROFIT
IMPROVEMENT – we are committed to creating shareholder value for our owners as well as positive economic impacts as an employer and taxpayer.
“
13Annual report 2018
Creating valueTieto 2018 Governance Financials Sustainability

Value creation modelIN
PU
T
OU
TP
UT
THOUGHT LEADERSHIP
DEEP INDUSTRY INSIGHTS
STRONG ROLE IN
GLOBAL ECOSYSTEMS
VAST NORDIC
CUSTOMER BASE
COMPETITIVE OWN AND
ECOSYSTEM SOLUTIONS
MATERIALS AND
ENERGY USAGE
FINANCIAL STRENGHT
STANDARDIZED
WAY OF WORKING
BUSINESS Business renewal
Growth opportunitiesBusiness continuityOptimised IT and business
INVESTORSResponsible returns
Attractive dividens
SOCIETY AND THE ENVIRONMENT Economic impactEffective careSmarter cities Digitalization of services CO2 avoidance and CO2 emissions
Electronic waste
EMPLOYEES Good employee experienceMeaningful workEqual opportunities Continous learning
Creating great everyday experiences in the data-rich world
THE WORLD AROUND USDIGITALIZATION AND
DISRUPTIVE TECHNOLOGIESPRIVACY AND
SECURITYCIRCULAR AND
SUSTAINABLE SOCIETYCONSUMER
FIRST
FOUNDATION
OPEN SOURCE CULTURE CUSTOMER CENTRICITY SUSTAINABILITYEMPLOYEE EXPERIENCE
DesignR
enew
RunBuil
d
Co-innovation
14Annual report 2018
Creating valueTieto 2018 Governance Financials Sustainability
\ Tieto 2018 \ Value creation \

Sustainability area Goal Target 2020 Result 2018 Result 2017 Status UN Sustainable Development Goal1)
EQUAL OPPORTUNITIES
Completion of Code of Conduct e-learning for awareness on equality, ratio (%)
100% 87% 88%On
target
EMPLOYEE EXPERIENCE
Employee engagement score, % 73% 75% 73%Target
reached
% of employees who are always or often stressed and unable to recover
Keep low Not reported2) 3%Not
reported
ETHICAL CULTURE
Completion of Code of Conduct e-learning, ratio (%)
100% 87% 88%On
target
INFORMATION SECURITY AND DATA PRIVACY
Total number of substantiated complaints regarding breaches of customers’ privacy and losses of customer data
0 1 0On
target
SUSTAINABLE SUPPLY CHAIN
New or renewed suppliers agreeing to Tieto’s Supplier Code of Conduct, ratio (%)3)
100% 100% 100%Target
reached
GREENHOUSE GAS EMISSIONS
Reduction of CO2 emissions from Tieto's indirect energy consumption4)
-50% -12% -44%Target
reached5)
DashboardGOALS AND RESULTS FOR EACH SUSTAINABILITY AREA
15Annual report 2018
Creating valueTieto 2018 Governance Financials Sustainability

Sustainability area Goal Target 2020 Result 2018 Result 2017 Status UN Sustainable Development Goal1)
SUSTAINABLE IT SOLUTIONS
Total ktons CO2 avoided by customers through use of Tieto's IT services
Increase customers' avoided CO2
emissions exceeding Tieto's
own CO2 emissions
76 kton CO2 75 kton CO2
On target
FINANCIAL PERFORMANCE
% sales growth Above market CAGR4%, or 7% in local
currencies3.0%, or 3.6% in local currencies
Target reached
% EBIT margin Long term >10% 9.7% 9.0%On
target
% adjusted margin Long term >>10% 10.2% 10.7%Target
reached
Annually increasing dividendsAnnual increase in
absolute terms
Base dividend up by 4%,
additional dividend proposed
Base dividend up by 4%,
additional dividend proposed
Target reached
Net debt to EBITDA ratio, limited in the long term
<1.5 long term 0.7 0.8Target
reached
CUSTOMER EXPERIENCE
Relationship Net Promoter Score (rNPS) (-100 to 100)
35 24 21Behind target
Customer eXperience Index (CXI) (1 to 10)
8.20 7.90 7.97Behind target
1) United Nations Sustainable Development Goals: https://sustainabledevelopment.un.org/2) The employee stress indicator was not measured in 2018 due to changes in measuring frequency. The indicator will be followed up in 2019 and reported on in next year’s report. However, actions to resolve causes of stress continued throughout 2018 and all identified stress drivers were improved; access to information (+8%), clarity on roles and responsibilities (+9) and freedom to express ideas/views without fear of negative consequences (+6%).3) Scope: Agreements made through Procurement function.4) Tieto’s CO2 emission reporting follows the methodology of the Greenhouse Gas Protocol Corporate Standard. The greenhouse gas emission reduction goal is reported on market based CO2 emissions.5) Aggregated reduction of CO2 emissions totals 56% comparing to 2016 baseline.
16Annual report 2018
Creating valueTieto 2018 Governance Financials Sustainability
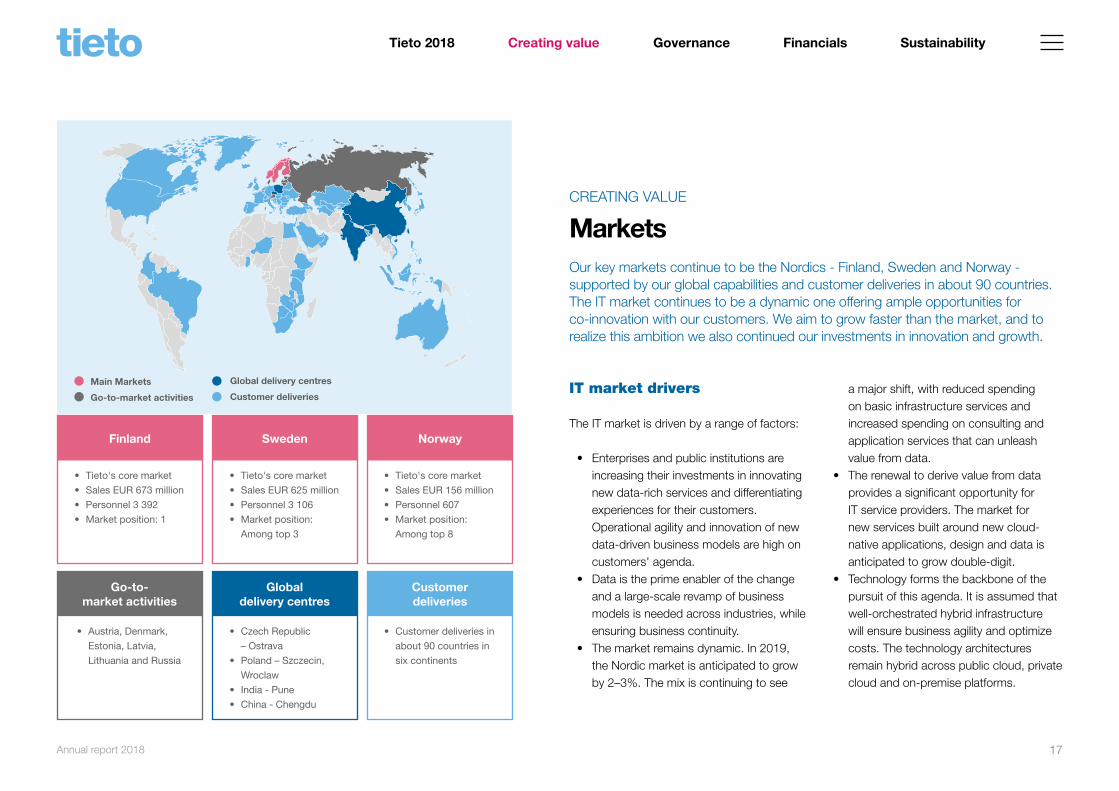
IT market drivers
The IT market is driven by a range of factors:
• Enterprises and public institutions are increasing their investments in innovating new data-rich services and differentiating experiences for their customers. Operational agility and innovation of new data-driven business models are high on customers' agenda.
• Data is the prime enabler of the change and a large-scale revamp of business models is needed across industries, while ensuring business continuity.
• The market remains dynamic. In 2019, the Nordic market is anticipated to grow by 2–3%. The mix is continuing to see
Markets
a major shift, with reduced spending on basic infrastructure services and increased spending on consulting and application services that can unleash value from data.
• The renewal to derive value from data provides a significant opportunity for IT service providers. The market for new services built around new cloud-native applications, design and data is anticipated to grow double-digit.
• Technology forms the backbone of the pursuit of this agenda. It is assumed that well-orchestrated hybrid infrastructure will ensure business agility and optimize costs. The technology architectures remain hybrid across public cloud, private cloud and on-premise platforms.
Our key markets continue to be the Nordics - Finland, Sweden and Norway - supported by our global capabilities and customer deliveries in about 90 countries. The IT market continues to be a dynamic one offering ample opportunities for co-innovation with our customers. We aim to grow faster than the market, and to realize this ambition we also continued our investments in innovation and growth.
CREATING VALUE
• Tieto's core market
• Sales EUR 673 million
• Personnel 3 392
• Market position: 1
• Austria, Denmark,
Estonia, Latvia,
Lithuania and Russia
• Tieto's core market
• Sales EUR 625 million
• Personnel 3 106
• Market position:
Among top 3
• Czech Republic
– Ostrava
• Poland – Szczecin,
Wroclaw
• India - Pune
• China - Chengdu
• Tieto's core market
• Sales EUR 156 million
• Personnel 607
• Market position:
Among top 8
• Customer deliveries in
about 90 countries in
six continents
Finland
Go-to- market activities
Sweden
Global delivery centres
Norway
Customer deliveries
Main Markets
Go-to-market activities
Global delivery centres
Customer deliveries
17Annual report 2018
Creating valueTieto 2018 Governance Financials Sustainability
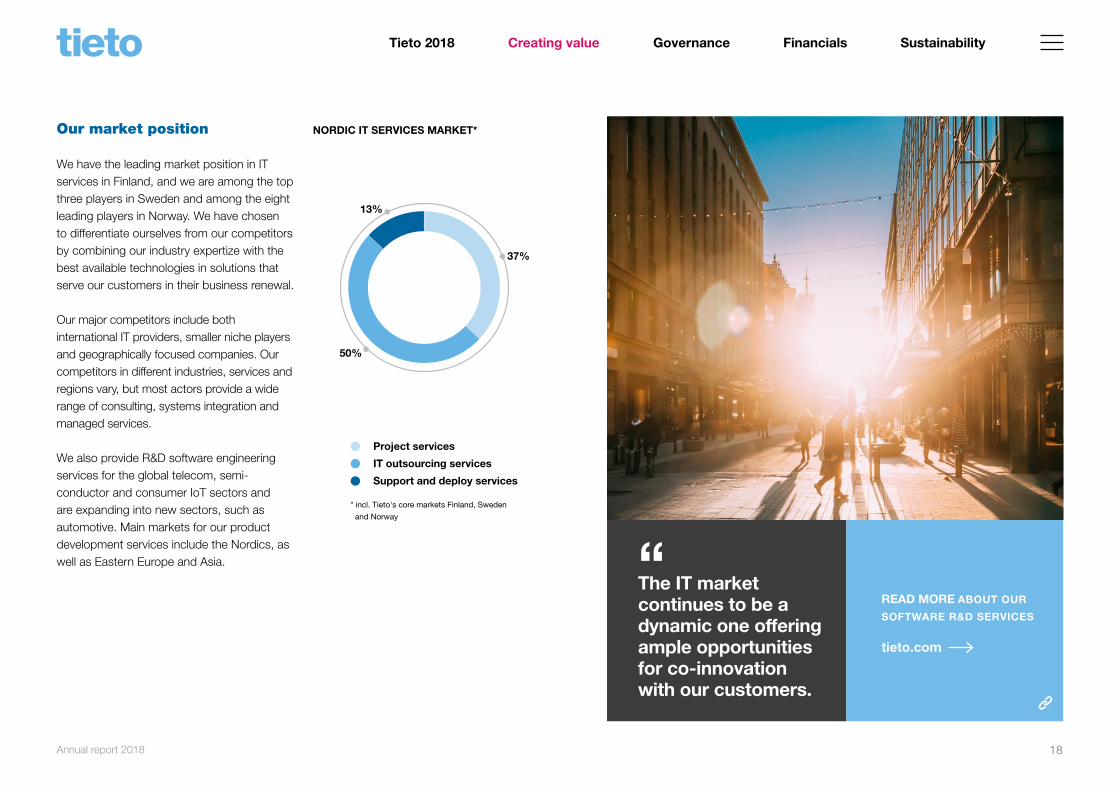
Our market position
We have the leading market position in IT services in Finland, and we are among the top three players in Sweden and among the eight leading players in Norway. We have chosen to differentiate ourselves from our competitors by combining our industry expertize with the best available technologies in solutions that serve our customers in their business renewal.
Our major competitors include both international IT providers, smaller niche players and geographically focused companies. Our competitors in different industries, services and regions vary, but most actors provide a wide range of consulting, systems integration and managed services.
We also provide R&D software engineering services for the global telecom, semi-conductor and consumer IoT sectors and are expanding into new sectors, such as automotive. Main markets for our product development services include the Nordics, as well as Eastern Europe and Asia.
1. FINANCIALS
NORDIC IT SERVICES MARKET*
Project services
IT outsourcing services
Support and deploy services
13%
37%
50%
* incl. Tieto's core markets Finland, Sweden
and Norway
FR work number 1
The IT market continues to be a dynamic one offering ample opportunities for co-innovation with our customers.
READ MORE ABOUT OUR
SOFTWARE R&D SERVICES
tieto.com
“
18Annual report 2018
Creating valueTieto 2018 Governance Financials Sustainability

Our aim is to meet our stakeholders’ sustainability requirements and needs.
FOR INFORMATIONABOUT OUR KEY STAKEHOLDERS,
MAIN TOPICS DISCUSSED AND
ENGAGEMENTS THROUGHOUT
2018, PLEASE VISIT OUR WEBSITE
tieto.com
We engage with a wide range of stakeholders, including employees, customers, business partners, authorities, governments and wider society. Our aim is to meet our stakeholders’ sustainability requirements and needs, both in our daily business and in longer term strategy. We believe that we can raise the sustainability standards both for the industry and wider society.
At the end of 2016, we conducted a new materiality analysis to evaluate stakeholders’ views on our sustainability impacts. The results of the analysis were used to develop the Sustainability 2020 plan and related targets. During 2018, an expert panel made
Stakeholder dialogue
up of several sustainability experts with understanding of our business and our industry verified and validated the current materiality analysis and our reporting content.
We continuously engage in a number of stakeholder dialogues including yearly surveys with customers and employees, as well as conversations with suppliers, business partners, customers, investors and authorities. Our stakeholder relations are managed throughout the organization, except for Investor Relations, which is centralized within the Group support functions. Similarly, supplier relations are mainly handled by our Procurement team.
Through continuous collaboration and open dialogue with our key stakeholders, we not only understand what is expected from us now but are also able to innovate and develop sustainable solutions for the future.
CREATING VALUE
STAKEHOLDERS
Potential employees
Ecosystems
Governments / Public authorities
Employees
Investors
Customers
Suppliers
Business partners
Industry associations
Local communities
Media
Non-governmental organizations
Academia / Universities / Schools
Our Stakeholders
“
19Annual report 2018
Creating valueTieto 2018 Governance Financials Sustainability
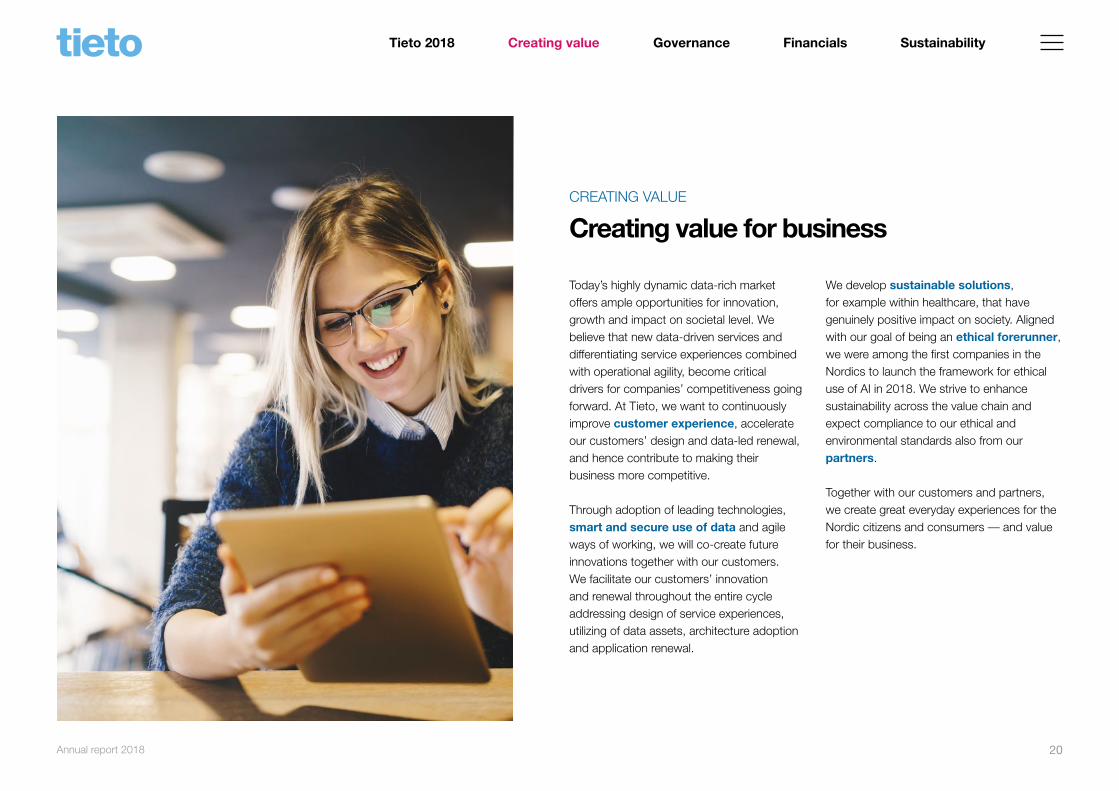
Creating value for businessCREATING VALUE
Today’s highly dynamic data-rich market offers ample opportunities for innovation, growth and impact on societal level. We believe that new data-driven services and differentiating service experiences combined with operational agility, become critical drivers for companies’ competitiveness going forward. At Tieto, we want to continuously improve customer experience, accelerate our customers’ design and data-led renewal, and hence contribute to making their business more competitive.
Through adoption of leading technologies, smart and secure use of data and agile ways of working, we will co-create future innovations together with our customers. We facilitate our customers’ innovation and renewal throughout the entire cycle addressing design of service experiences, utilizing of data assets, architecture adoption and application renewal.
We develop sustainable solutions, for example within healthcare, that have genuinely positive impact on society. Aligned with our goal of being an ethical forerunner, we were among the first companies in the Nordics to launch the framework for ethical use of AI in 2018. We strive to enhance sustainability across the value chain and expect compliance to our ethical and environmental standards also from our partners.
Together with our customers and partners, we create great everyday experiences for the Nordic citizens and consumers –– and value for their business.
20Annual report 2018
Creating valueTieto 2018 Governance Financials Sustainability
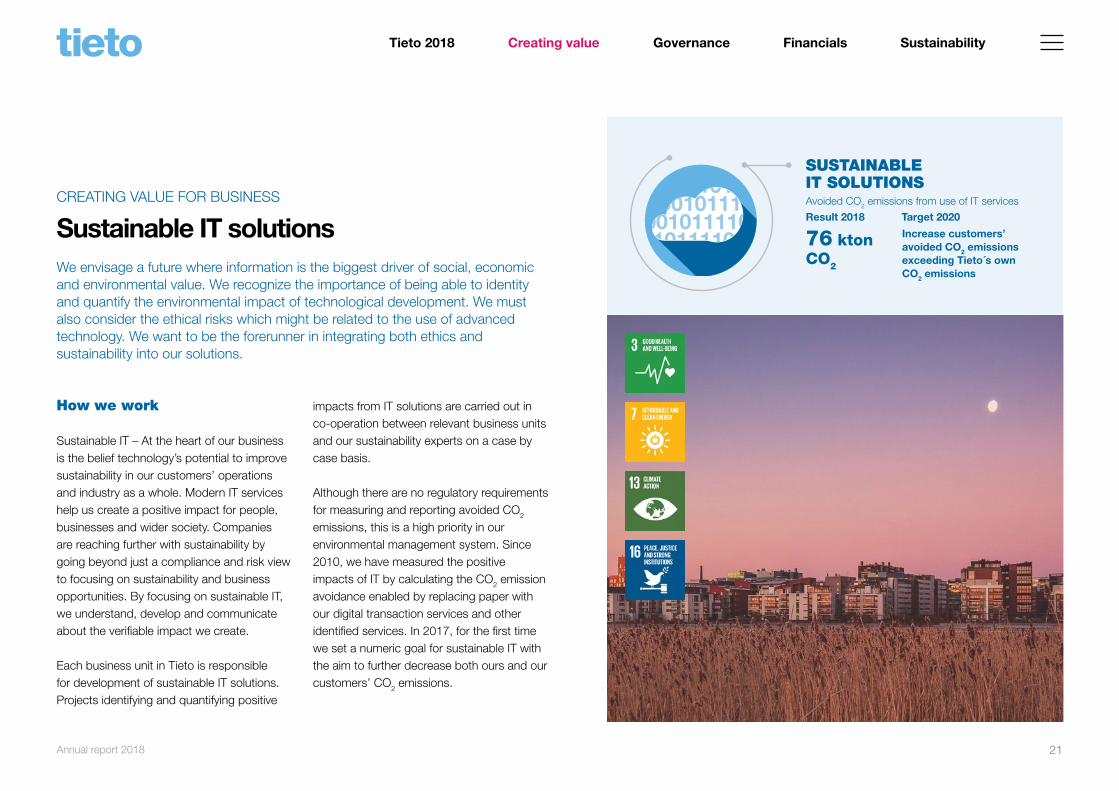
SUSTAINABLEIT SOLUTIONS
76 ktonCO2
Increase customers’ avoided CO2 emissions exceeding Tieto´s own CO2 emissions
Avoided CO2 emissions from use of IT services
Result 2018 Target 2020
How we work
Sustainable IT – At the heart of our business is the belief technology’s potential to improve sustainability in our customers’ operations and industry as a whole. Modern IT services help us create a positive impact for people, businesses and wider society. Companies are reaching further with sustainability by going beyond just a compliance and risk view to focusing on sustainability and business opportunities. By focusing on sustainable IT, we understand, develop and communicate about the verifiable impact we create.
Each business unit in Tieto is responsible for development of sustainable IT solutions. Projects identifying and quantifying positive
Sustainable IT solutions
impacts from IT solutions are carried out in co-operation between relevant business units and our sustainability experts on a case by case basis.
Although there are no regulatory requirements for measuring and reporting avoided CO2 emissions, this is a high priority in our environmental management system. Since 2010, we have measured the positive impacts of IT by calculating the CO2 emission avoidance enabled by replacing paper with our digital transaction services and other identified services. In 2017, for the first time we set a numeric goal for sustainable IT with the aim to further decrease both ours and our customers’ CO2 emissions.
We envisage a future where information is the biggest driver of social, economic and environmental value. We recognize the importance of being able to identity and quantify the environmental impact of technological development. We must also consider the ethical risks which might be related to the use of advanced technology. We want to be the forerunner in integrating both ethics and sustainability into our solutions.
CREATING VALUE FOR BUSINESS
21Annual report 2018
Creating valueTieto 2018 Governance Financials Sustainability

Progress
In 2018, we continued our efforts in analyzing and quantifying the impacts of our solutions. We expanded our focus to cover three different businesses: automation of financial value chain, online bank and insurance services, and new energy solutions focussing on a positive carbon handprint. The use of new technologies such as AI and machine learning for preventative healthcare focused on socio-economic impacts.
During the year we developed a repeatable impact assessment model, which is now ready for further utilization across our business. AI and ethics were the topics for public discussion during the year. Our strategic ambition for AI includes further development and application of ethics and in 2018 we reinforced our commitment of advancing ethical and responsible AI to support this goal. In October 2018 we launched an initial framework which addressed five principles:
• RESPONSIBILITY: Committed to harnessing AI for good, for the planet and humankind
• HUMAN RIGHTS: Ensuring the freedom and liberty of people to serve the social good
• FAIRNESS & EQUALITY: Unbiased, fair and inclusive AI, fostering diversity and equality among people
• SAFETY & SECURITY: AI systems are
built to prevent misuse and reduce the risk of being compromised
• TRANSPARENCY: Striving towards AI that can be explained and explain itself
For employees working with AI, we have introduced an AI certificate. These steps are part of our commitment to drive ethical AI product and service development.
Looking ahead
Stakeholders’ expectations for companies’ value creation is increasing. A company’s ability to be able to verify a positive impact to society and the environment are becoming important factors impacting investors’ decisions. Employees are more attracted to companies that can communicate a purpose beyond just financial performance. Our impact work focuses on how our business can use modern technologies and data to create long-term value to society. Our impact assessments have received positive feedback from our stakeholders and there is a high demand for expanding the work. Our aim is to conduct both qualitative and quantitative impact assessment projects in 2019.
Ethics and technology will continue to be a top priority for us going forward. The development of AI use-cases and deepening of the ethical guidelines continue and we aim to further expand the team and establish new
Ethics and technology will continue to be a top priority for us going forward.
“
AVOIDED CO2 EMISSIONS IN THE FINANCIAL VALUE CHAIN
Savings for the environment can be made by automating business processes such as financial value chains or banking and insurance transactions. We have been measuring the impact of automations in financial value chains and in 2018 we updated and expanded the model. We quantified the CO2 outputs for the following business processes: purchase to pay, order to cash, invoicing, and several services available in online banking and insurance services. The carbon footprint for a relevant (more manual) baseline as well as for the automated process was then calculated. The difference between the two numbers is the avoided emissions, or the carbon handprint. In 2019, we estimated the carbon handprint from the use of our solutions within financial services to 76 ktonnes CO2.
Read more
22Annual report 2018
Creating valueTieto 2018 Governance Financials Sustainability

positions to accelerate this work. New job roles include AI ethics engineers and AI quality assurance experts. Our aim is to develop and enforce best practices to address biases, transparency, security and safety of AI.
While we continue to be active in public discussion, we also see our employees as key resources in understanding the sustainability impact of advanced technologies. Awareness campaigns around different aspects of sustainable IT will continue in 2019. To increase awareness and employee skills in the area, training on sustainable IT, covering CO2 handprint, socio-economic impact and AI ethics will be organized for selected employee groups, such as sales and product development.
DEVELOPING A MODEL TO QUANTIFY THE CO2
HANDPRINT OF OUR ENERGY SOLUTIONS
Our new Distributed Energy Solution (DES) enables and promotes changes in the energy market. The first customer pilot projects were carried out in 2018. DES is an operational business platform integrating assets and ecosystem operators for the management of distributed energy resources related services. The key benefits of the solution include environmental benefits, ability to turn distributed energy assets into profit, and having a virtual overview of the energy value chain. In 2018 we began to map the model for quantifying the environmental benefits. The model will enable us to calculate avoided CO2 emissions per customer case and also illustrate, case by case, how much renewable energy the flexible system can put back into the energy grid. The model will be finalized in 2019.
Read more
IMPROVED WELLBEING THROUGH ARTIFICIAL INTELLIGENCE
Tieto Intelligent Wellbeing is a data-driven healthcare and welfare solution. In 2018, we set to evaluate the socio-economic impacts of the solution. To illustrate the large-scale benefits, we evaluated and quantified the expected benefits of using Tieto Intelligent Wellbeing for identifying those in need of early care for diabetes. The purpose of the holistic assessment was to help key stakeholders and decision makers understand the impacts that smart use of new technologies can bring to individuals, companies and society as a whole. Based on this assessment, three categories of positive impacts were identified: direct savings in healthcare costs, increased productivity due to reduced sick leave, and better health and increased wellbeing for the individual. We extrapolated this impact on a national level for Finland for the period 2018–2030 and found the expected cost savings amount to EUR 1.2 billion. This estimate is based on an assumption that our solutions would impact 5% of the total diagnoses and preventions of complications.
Read more
23Annual report 2018
Creating valueTieto 2018 Governance Financials Sustainability
At Tieto, we play an important role in designing and implementing solutions that can solve the societal problems of today and tomorrow. I also believe that we have a crucial role in driving a broader discussion on what can be achieved through advanced technology and data on a societal level.
In 2018, we conducted a project to better understand what kind of socio-economic impacts our solutions could have. We set out to investigate potential impacts of our Tieto Intelligent Wellbeing solution – a data-driven product family for healthcare and welfare. The idea was to understand the expected large-scale benefits that this specific solution could have for preventative healthcare and welfare services. The project results are concrete and easy for everyone to understand.
And this is exactly what I think we need to do – share concrete examples to increase everyone’s’ understanding of what can be
Creating value for business through sustainable IT solutions
achieved with data and advanced technology. By doing so we can do things differently and thereby improve people’s health and wellbeing.
What excites you about a data-driven future?The possibilities that are ahead of us are what I find most exciting. It is not the actual methodologies per se that trigger me – machine learning and algorithms have existed for many years. What is exciting is the amount of data that is available today. When the right people are brought together, they can take a holistic view on the data available on a certain topic and assess the possibilities of utilizing that data to leverage value. The potential benefits of this approach to a range of stakeholders are huge.
Why do you care about sustainability?I think it is important that whatever we do, we should make sure it benefits the society. On a
STAKEHOLDER INTERVIEW
personal level, it is very important to me that technical and business skills are focused on making solutions that actually create value for society. That is sustainability in a nutshell to me – creating value for society through our knowledge and expertise.
It is very important to me that technical and business skills are focused on making solutions that actually create value for society.
“
MATTI RISTIMÄKI HEAD OF DATA-DRIVEN HEALTH
24Annual report 2018
Creating valueTieto 2018 Governance Financials Sustainability

Customer experienceCREATING VALUE FOR BUSINESS
Customer experience is a top priority for each and every Tieto employee. Understanding our customers’ needs and expectations is essential for our long-term development and success. In line with this, we continously measure customer sentiment, which gives us valuable information about our services, products and processes.
How we work
Having customer experience as a competitive differentiator calls for commitment from the entire Tieto team. Promises to customers need to be fulfilled in every interaction, seamlessly through all touchpoints, every single day. This in turn requires that we treasure a corporate culture where both employee and customer experience are equally valued, recognising their undisputable correlation.
Making the customer´s voice matterOur work with customer experience is addressed in Tieto’s Quality Policy, which stipulates the continuous interaction with customers and the use of customer feedback in developing Tieto’s operations. For us, every
customer feedback holds a promise of further conversation and further insight. Closing the feedback loop with customers requires not only gathering feedback, but also acting upon it as well as sharing both the feedback and related actions with the customers, employees and other relevant stakeholders.
To make this happen, customer experience needs to be everybody's priority. Hence it is included in the goals set for organizational units, customer teams, delivery teams and employees. The status of the customer experience is monitored monthly in the leadership teams at all levels of the organization. Based on the analysis, corrective actions and improvements are implemented whenever needed. Multiple roles across the organization are supporting the analysis and monitoring, e.g. Quality Partners,
CUSTOMER EXPERIENCE
24
7.90
35
8.20
Relationship Net Promoter Score (rNPS) (-100 to 100)
Result 2018 Target 2020
Customer eXperience Index (CXI) (1 to 10)
Result 2018 Target 2020
25Annual report 2018
Creating valueTieto 2018 Governance Financials Sustainability

Business Development Offices as well as the corporate-level Customer Experience and Insights team.
All Tieto employees have access to customer feedback data. They are encouraged to continuously follow the feedback given, especially by their customer contacts, implement improvements based on it and communicate them back to the customer. To identify structural improvement needs for an organization, a process or a product, we use the customer feedback, but also the findings from our internal quality audits and ISO9001 certification audits.
To gain understanding of what our customers think about their relationship with Tieto overall, we carry out the Customer eXperience Survey (CXS) on an annual basis. Our new continous Delivery eXperience (DX) measurement helps us understand how our customers experience our deliveries and what we should improve.
Progress
Holistic approach to customer experienceIn 2018 we continued listening to the voices of our customers in our deliveries and focused on closing the feedback loop with tangible improvements. Through the DX process, we frequently gathered feedback on
topics relevant for our customers at different points of their delivery lifecycles. In customer meetings, we jointly planned and followed up on the improvement actions originating from this feedback.
An internal Customer eXperience community for sharing best practices and learning from each other was launched. The community attracted several hundred participants during the year. Various channels, including monthly calls, social intranet and a community site are being used for activation and sharing.
As a company with multiple business areas, we strive to create a seamless experience for our customers across all the different touchpoints on their journey with us. To advance experience in our digital channels, we onboarded 1 350 customers to our new service management platform, ServiceNow, and launched a fully renewed external website: tieto.com.
Visible resultsAt Tieto, we measure the yearly performance in customer experience through the Customer eXperience Index (CXI) and Relationship Net Promoter Score (rNPS). By 2020, we are targeting a CXI score of 8.20 and a rNPS of +35.
In 2018 we reached an all-time high result for rNPS (+24). Other customer experience KPI’s maintained the same level as in 2017.
In addition, our analyses showed that the correlation between employee engagement, customer experience, revenue growth and profitability was more evident than in 2017.
Our long-term focus and progress in customer experience was acknowledged again in 2018, when we reached the third position in the State of Customer Experience Management study of Finnish companies.
However, we were not able to reach our KPI targets for customer experience in 2018, and reaching our long-term target will demand a step change in the trend. Efforts to boost our customer experience performance are integrated in Tieto’s new strategy and operating model.
Looking ahead
Delivering great customer experience will continue to be a key priority for 2019 and beyond. We will continue to improve our delivery-level customer experience through increased focus on implementation of the improvement actions based on the feedback. We will further develop our capabilities by experimenting new end-user centric ways of working, and by scaling the learnings to the wider organization through the Customer eXperience community and ambassador network. We also strive to create a holistic
and data-driven view of our customers' experiences at different touchpoints along the journey. Our ambition is to build predictive models utilizing data to be able to improve customer experience in real time.
To meet our customers' expectations and improve their experience with us, digitalization and automation of IT service management will continue. In projects we aim to increase the use of design-led, end-user and human-centric approaches.
As a response of the growing interest towards sustainable solutions among our customers, we will continue developing our solutions and services from this viewpoint. In early 2019 we will pilot a project where sustainability and ethics are integrated in the full project cycle – from design to operation, with the aim of creating guidelines for all our customer projects at a later stage.
® Net Promoter is a registered trademark and Net
Promoter Score (NPS) is a trademark of Satmetrix
Systems, Inc., Bain & Company, Inc., and Fred Reichheld.
26Annual report 2018
Creating valueTieto 2018 Governance Financials Sustainability

2016 2017 2018
10
9
8
7
6
5
4
3
2
1
0
1. SUSTAINABILITYCR work number 1
CUSTOMER EXPERIENCE INDEX
7.64 7.97 7.90
2016 2017 2018
25
20
15
10
5
0
3
21
24
XX
2. SUSTAINABILITY
RELATIONSHIP NET PROMOTER SCORE ®
CR work number 23. SUSTAINABILITY
CUSTOMER EXPERIENCE
INDEX VS. REVENUE GROWTH %
CXI laggards
CXI neutrals
CXI leaders
Revenue %
CR work number 34. SUSTAINABILITY
CUSTOMER EXPERIENCE INDEX VS.
EMPLOYEE ENGAGEMENT (VOICE) SCORE
CXI laggards
CXI neutrals
CXI leaders
VOICE Engagement score
CR work number 4
27Annual report 2018
Creating valueTieto 2018 Governance Financials Sustainability

From my point of view, the most important thing for creating an excellent customer experience is to understand the customer and their business needs. These can sound like buzzwords, but I truly see that this approach makes a difference. For me, in practice this means using tools to collect feedback from our customers on a regular basis, following it up face to face and proposing improvement actions. It is absolutely crucial to take those actions, since only with the right actions we can make real improvements.
I think that our increased focus on improving customer experience over the past year has yielded positive results. One of the challenges we have had, and still can improve on, is sharing best practices. On an overall level, our customers can benefit from other customers’ feedback. And for this we need to have a culture where we share openly both successes and challenges. Our Open
Creating value for business through customer experience
Source culture is a good foundation for this,
as well as new efforts such as our internal CX
community where we exchange best practice
about customer experience.
What excites you about a data-driven future?A data-driven future is really exciting! With
the help of massive amounts of data and
technology, we will be able to support our
customers predict and prepare their business
for the future in the best possible way. But
we also must be careful while handling the
increasing amount of data and make sure we
focus on the right data and that data privacy
is always considered.
Why do you care about sustainability?I think this is extremely important from Tieto’s
perspective. I believe that our ability to
expand sustainable partnerships and ensure
STAKEHOLDER INTERVIEW
good revenues relies on our ability to look up, look to the future and understand the wider environment. If we don’t care, we won’t progress. But when sustainability is ensured, we will create long-term value to society and our company. To sum up – I think it is business critical!
We need to have a culture where we share openly about both successes and challenges. Our Open Source culture is a good foundation for this.
SHI YUAN SENIOR CUSTOMER OPERATIONS MANAGER, TSM
“
28Annual report 2018
Creating valueTieto 2018 Governance Financials Sustainability
Information security and data privacyCREATING VALUE FOR BUSINESS
Today’s increasingly complex IT landscape and new regulations set new demands on security measures protecting personal and business-critical information. Constant availability of IT services and good resilience towards cyber threats and attacks are cornerstones of our business and are vital for maintaining our customers’ trust. As a result, we are continuously improving our processes and the security services provided to customers. Where data is stored and how it is handled is extremely important to our customers, therefore we ensure we keep information safe in all circumstances.
How we work
The importance of information and cyber security as well as privacy is continuously increasing. We must make sure that they are part of any process, delivery or work that we do. We do this via our Security Operations Centre (SOC) that daily predicts, prevents, responds and detects different types of attacks and incidents. Risk management, business continuity, awareness and well-functioning security services are all important building blocks for establishing good cyber security resilience and meeting stakeholders’ expectations.
Our comprehensive approach to information security and data privacy covers three areas: confidentiality, integrity, and availability of IT services and data. Updated on an annual basis, these policies guide our information security and data privacy actions and consist of:
• Tieto’s Security Policy• Tieto’s Privacy Policy• Tieto’s Information Classification Rule• Tieto’s Data Transfer Rule.
Our Information Security Management System (ISMS) covers all information security rules. It also provides mandatory information regarding security processes. Our Group-level responsibility for security and data
INFORMATION SECURITY AND DATA PRIVACY
1 0
Total number of substantiated complaints regarding breaches of customers’ privacy and losses of customer data
Result 2018 Target 2020
29Annual report 2018
Creating valueTieto 2018 Governance Financials Sustainability

privacy arrangements is managed by our Chief Security Officer as well as our Chief Risk Officer, who heads the central risk management function.
Throughout our business units, security managers, risk coaches and privacy contacts constantly support the organization on security and privacy topics. Our Security Services unit provides security services (like the SOC) to our customers and also for internal use. Our internal Computer Emergency Response Team handles security incidents, in co-operation with internal and external stakeholders (like authorities and customers). Our Governance, Risk Management and Compliance (GRC) platform supports the daily work of our security organization, in areas like risk management, privacy risk assessments, security incident management and audit follow-up.
We handle any security incidents through our Security Major Incident Management (sMIM) process. This supports efficient management of incidents and aims to minimize the impact on customers and end-users by restoring business-critical IT services and maintaining constant communication with relevant stakeholders. It also defines communication and mitigation actions based on the sensitivity and criticality of the incident.
Monthly and quarterly internal and external audits are conducted on our processes and
management of information security and data privacy. Audit results are regularly followed-up by Tieto Leadership team and by our Board of Directors Audit Risk Committee. We also conduct annual ISAE 3402 audits for our data centres and customer specific infrastructure services, which describe and document the adequate internal controls for information security and financial reporting.
Progress
Throughout 2018 we continued our efforts to increase information security awareness among employees by various means, such as e-learning courses, conferences and training programmes. This included all employees being required to do our mandatory security e-learning, focusing on our Security Policy, information security and IT security, privacy, physical (premises) security and travel security. Mandatory trainings for all employees on our Code of Conduct e-learning (including information security and data privacy topics) as well as on General Data Protection Regulation (GDPR) were also conducted throughout the year.
From the first quarter of 2016 up until the end of October 2018, we also carried out an extensive GDPR programme for all of our employees, with the aim of making sure our organization was prepared for the new GDPR regulation. As a result of our programme, we
developed a Tieto wide Privacy Engineering guideline and we were also among the first companies in the world to publish an ISAE 3000 GDPR reasonable assurance report to demonstrate our readiness towards GDPR.
In 2018 one substantiated complaint regarding breach of customer privacy was reported. The incident concerned an isolated service of a Swedish customer and led to personal data of around 400 persons being shared with wrong recipients.
A data breach notification of the incident has been filed to Swedish Data Protection Authority (Datainspektionen) by the customer, in accordance with GDPR requirements. The investigation by authorities is ongoing.
The quality of our services is of utmost importance to us, and we take all incidents extremely seriously. We are actively collaborating with the customer for solving the potential consequences of the event. There was no impact to Tieto’s other customers due to this incident.
Looking ahead
While our heavy data dependent offerings and services increase, we are committed to developing them in such a way that the data subject rights are considered, and the privacy regulation is adhered to. To continue to live
up to our stakeholders’ expectations and comply with legislation we will maintain our active dialogue on cyber security issues with stakeholders on a societal level.
At an organizational level, we will implement further improvements in our GRC platform, mainly to improve our business continuity management. We will also use feedback on, and experience from, our Privacy Engineering guideline to fine tune and improve the usability of it internally.
Activities to build internal competence and capacity within the area will continue through the coming year through mandatory trainings and other activities.
30Annual report 2018
Creating valueTieto 2018 Governance Financials Sustainability

We had a very interesting but equally challenging 2018 with personal data privacy. The EU’s GDPR came into force and it took a lot of hard work to ensure that we would be compliant with the regulation. Even though there’s always room for improvement, I believe that we have succeeded well in our work. We identified early on that being strategic in our approach would be key to succesfully delivering this objective. Already in 2015, we launched an internal programme to support the alignment and implementation of GDPR.
I am very proud of the programme and the commitment from our employees. Over 13 000 of our people have completed our mandatory GDPR training and have understood that we all need to have a special focus on personal data privacy. I believe that we now have a holistic and systematic approach to data privacy. Our work has also been appreciated by our partners and customers. This is important to us as it shows our reliability as a partner and that
Creating value for business by safeguarding personal data privacy
our commitment to ensuring personal data privacy is a priority.
Going forward we need to make sure that we continue to be proactive and keep up the good work. This means we need to constantly evaluate our privacy governance model, provide employee trainings and continue active communications on data privacy. It is important that we take care of our own compliance, but also help our customers to be compliant. And for this we need to have reliable privacy and security competence throughout our organization.
What excites you about a data-driven future?The data-driven future is already here, and I believe that it will continue to bring solutions that can improve the quality of our everyday life. That's why ensuring privacy is at the forefront of my mind. I see it as my responsibility to make sure that all positive developments arising from technology are combined with thorough data protection to ensure we continue to
STAKEHOLDER INTERVIEW
respect privacy. And that responsibility is both challenging and exciting.
Why do you care about sustainability?I think sustainability is very important for everyone. What I care most about are social issues and more precisely human rights since privacy is a fundamental human right. I have strong feelings when it comes to the freedom and rights of individuals. For all of us at Tieto need to make sure that we protect these rights and the work which we do should concretely support a sustainable development from that perspective.
We need to constantly evaluate our privacy governance model, provide employee training and continue active communications on data privacy.
JARI FRIMAN DATA PROTECTION OFFICER
“
31Annual report 2018
Creating valueTieto 2018 Governance Financials Sustainability
How we work
To support our business, we use suppliers who supply IT products and services needed to deliver solutions to our customers. These include hardware, software and IT consultant resources. We also have suppliers delivering products and services needed for our own operations, such as human resources services, facility management and travel services. In general, addressing sustainability issues with first-tier suppliers is easier than with suppliers further down the supply chain. Therefore, it is important for us to continuously work on consolidating our supplier base. As a result, our procurement today is more centralized and focused on preferred suppliers than it was a few years ago. This also helps us mitigate supply chain related risks.
Sustainable supply chain
Our Supplier Sustainability Programme is the operative framework for supply chain sustainability and signing Tieto’s Supplier Code of Conduct is a basic threshold for all suppliers. As part of the programme, our risk review model guides our prioritised actions in relation to our suppliers. In accordance with the programme, we use self-assessments to conduct follow-ups among prioritised suppliers, with the focus of estimating the Code of Conduct implementation and to mitigate risks. We also conduct sanction checks, as well as other on-boarding checks, prior to entering a co-operation with a new supplier.
Our Group-level Procurement unit has the responsibility for all procurement activities. Procurement managers who work closely with
We understand that a sustainable future is dependent on our business impact as well as on the performance of our suppliers. By making sure our suppliers are cost-efficient and reliable, we ensure business continuity and effectiveness. We also expect our suppliers to uphold human rights, labour rights, health and safety legislation, business ethics, and environmental practices. Through requirements and co-operation with our suppliers, we can support them in applying sustainable practices. This enables us to deliver on our promise to create value to our stakeholders.
CREATING VALUE FOR BUSINESSSUSTAINABLE SUPPLY CHAIN
100% 100%
% ratio of new or renewed supplier contracts agreeing to Tieto´s Supplier Code of Conduct
Result 2018 Target 2020
32Annual report 2018
Creating valueTieto 2018 Governance Financials Sustainability

the business, have the responsibility of making sure that our Procurement Policy is followed and that the Supplier Code of Conduct is accepted and confirmed by all of our suppliers. Discussions on ethical and environmental topics are a regular part of procurement practices.
We have annual performance follow-ups within the area of sustainable supply chain to make sure we are on-track to reach our 2020 long-term goal. Goals of the programme include having all new and renewed suppliers signing Tieto’s Supplier Code of Conduct1), conducting self-assessments to prioritized product categories, and ensuring our e-waste recycling partners are acting sustainably. The overall aims are to strengthen risk management approach and our co-operation with long-term key suppliers.
In 2018, the total monetary value of procurement amounted to EUR 615 million (609), representing 38% per cent of revenues. Approximately 230 of our suppliers represent as much as 80% of the company’s spending. The vast majority of purchases take place in the Nordic countries. Purchases from suppliers invoicing from Finland, Sweden or Norway represent over 70% of the total annual purchase volume.
Progress
In 2018 we took further steps to improve our sustainable supply chain programme to be
in line with developments in legislation and stakeholders’ expectations. Major changes included:
• Complete revision and update of Tieto’s Supplier Code of Conduct, including new chapters on human trafficking, privacy and living wage
• Supplier management reviews – sparring sessions with selected suppliers to get a better understanding of their sustainability performance and to strengthen our collaboration
• Revision and update of our risk management approach
• On site audits (scheduled to commence in 2019).
During the year, we also focused on capacity building and awareness activities among our suppliers. In line with our programme, we carried out supplier management reviews with five of our largest suppliers, who combined, equated to 22% of our total spending. We also focused on internal capacity building delivering awareness training for selected groups.
The consolidation efforts in our supplier base continued in 2018 and the total number of suppliers has significantly decreased over the past few years. Our total number of suppliers was down to 6 100 in 2018 as compared to 7 200 in 2014.
Our aim is that all external businesses undertaking regular provision of goods,
services, technology or sub-contractors to us are compliant with the minimum requirements stated in our Supplier Code of Conduct Rule. By the end of 2018, the coverage represented 86% (86%) of spend among regular suppliers2). In total, 46% (45%) of all of our regular suppliers had accepted our Supplier Code of Conduct Rule. Given the large amount of e-waste which we produce, our priority is to have responsible partners that can ensure the end-life treatment of ICT equipment and servers. The amount of e-waste recycling partners aligned with our Supplier Code of Conduct rose from 80% to 90% in 2018.
Looking ahead
We will continue our work in further improving sustainability in our supply chain. We will focus on carrying out activities in the Sustainable Supply Chain programme, including:
• External auditors carrying out on-site audits on selected suppliers in high-risk countries
• Further implementation of our revised Supplier Code of Conduct Rule, including capacity building and training
• Improve collaboration with main partners and other stakeholders.
Throughout the year, we will continuously evaluate the measures and risks in our supplier programme, and fine tune our approach towards suppliers in different sectors and in different markets. We are
constantly working towards improving our own performance together with our suppliers, and to design and implement changes in a responsible manner.
CR work number 23
TOP TEN COUNTRIES FOR PURCHASE
Finland 47%
Sweden 34%
Norway 6%
The Czech Republic 4%
India 2%
Poland 2%
Austria 2%
Latvia 1%
Denmark 1%
China 1%
47%
6%
34%
CR work number 23
TOP TEN COUNTRIES FOR PURCHASE
Finland 47%
Sweden 34%
Norway 6%
The Czech Republic 4%
India 2%
Poland 2%
Austria 2%
Latvia 1%
Denmark 1%
China 1%
47%
6%
34%
CR work number 23
TOP TEN COUNTRIES FOR PURCHASE
Finland 47%
Sweden 34%
Norway 6%
The Czech Republic 4%
India 2%
Poland 2%
Austria 2%
Latvia 1%
Denmark 1%
China 1%
47%
6%
34%
1) Agreements done through the Procurement process
2) Regular supplier: Minimum invoice/month, total 12
invoices and EUR 20 000 spend annually
33Annual report 2018
Creating valueTieto 2018 Governance Financials Sustainability

We continuously develop our Procurement function to broadly maximise the value of it. Last year we worked with several focus areas, including improving the cost and carbon awareness within our organization, and also further improving our Sustainable Supply Chain Programme. I am pleased with many things we accomplished during the year, but what makes me proud are the moments when all our efforts are combined, and we see how we create value in practice. This can be seen in action when we co-operate with our sales organization in developing an offer to a potential client. By understanding the client’s need and having the possibility to put together an ecosystem of suppliers fulfilling the customers’ sustainability requirements, and at the same time provide optimal solutions and experiences in their digital journey, we create a truly winning concept.
Looking ahead, we know that we, and our customers, are continuously strengthening sustainability efforts to future-proof our
Creating value for business through a sustainable supply chain
businesses. We also understand that to become their first choice for business renewal, we need to support them in these efforts as well. In 2018, we took several steps to further develop our Sustainable Supply Chain Programme to make sure we match our customers’ increased expectations and demands on us, and of course, because it is the right thing to do.
What excites you about a data-driven future?Personally, I think it is exciting as I believe it can enrich everyday life. Imagine living in a sustainable smart building with connected IoT that simplifies your life. You travel with a connected environmental-friendly vehicle in the smart city where you live, where you have access to digital citizen services, predictive healthcare and real-time payments whenever and wherever you make purchases. I think this future will be sustainable for each of us as individuals, since it will save us time and energy and make room for other activities that injects energy.
STAKEHOLDER INTERVIEW
Why do you care about sustainability?I believe that sustainability is everyone’s responsibility. For me, this is a natural part of my life, at home and at work. This makes Tieto a very good match for me, since I genuinely believe in the company’s ambition; creating value for life. At Tieto, I can play an active role in sustainable development at work and in society by selecting suppliers with high ethical standards, buying green energy for our data centres and making sure we use green buildings for our offices.
We, and our customers, are continuously strengthening sustainability efforts to future- proof our businesses.
TOMAS ELKEN CHIEF PROCUREMENT OFFICER
“
34Annual report 2018
Creating valueTieto 2018 Governance Financials Sustainability
How we work
Tieto as a company, including the Board of Directors and top management, has zero tolerance for unethical business behaviour and sees implementation of ethical values and work practices as a vital part of the company’s responsibility. In addition to adhering to local legislation in operating countries, such as the UK Bribery Act and US Foreign Corrupt Practices Act, Tieto’s ethical values are outlined in our company-wide Code of Conduct Policy and related Rules, which apply to all stakeholders. Our Code of Conduct encompasses a wider range of topics and to highlight specific sections of the Code, we have separate rules providing more detailed guidance.
Our business ethics efforts are led by the
Ethical culture
Head of Sustainability in close cooperation with Legal and Internal Audit. Resources allocated to the ongoing work comes from different functions and bodies within the company depending on the nature of the effort. Expertise within different areas are called together when assessing potential breaches of our Code of Conduct Policy or when developing the area to improve performance. These include functions such as our Internal Escalation Function, Internal Audit, Legal and Compliance office, as well as the Sustainability Steering Group.
Our approach to unethical behaviour is communicated in our proactive awareness campaigns and followed up through continuous monitoring. Our risk management approach comprises a risk map for higher-level management, including the Board of
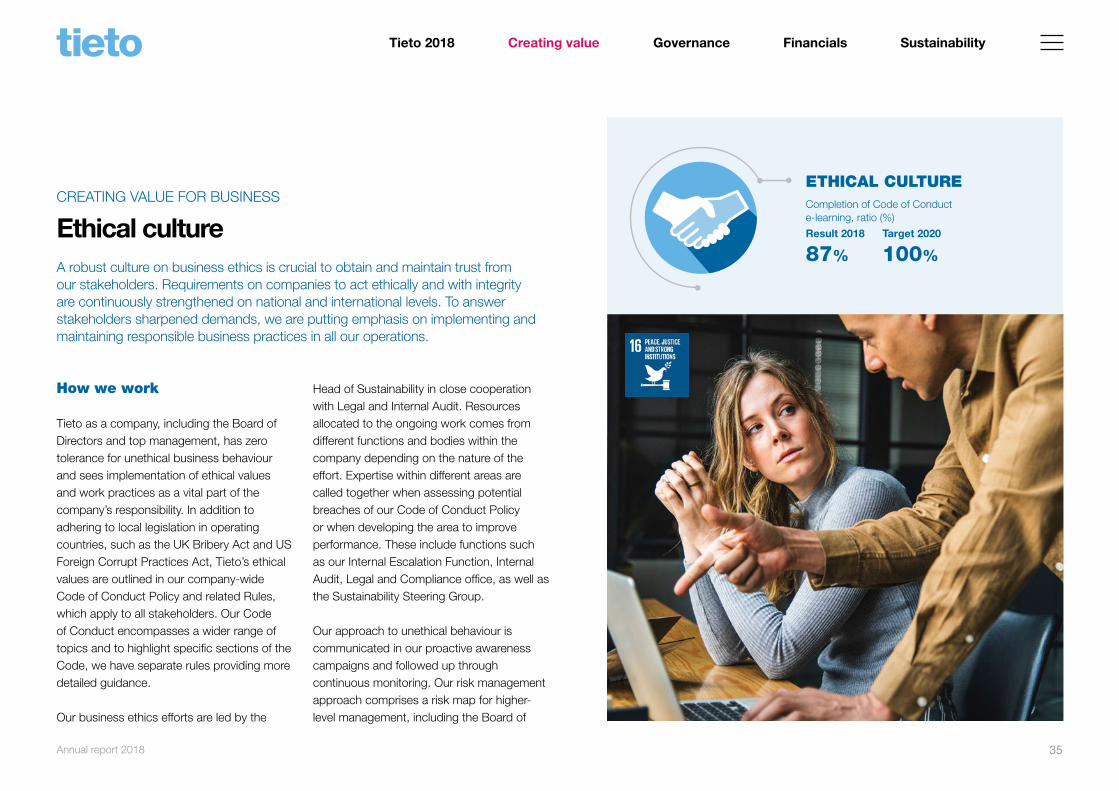
A robust culture on business ethics is crucial to obtain and maintain trust from our stakeholders. Requirements on companies to act ethically and with integrity are continuously strengthened on national and international levels. To answer stakeholders sharpened demands, we are putting emphasis on implementing and maintaining responsible business practices in all our operations.
CREATING VALUE FOR BUSINESSETHICAL CULTURE
87% 100%
Completion of Code of Conduct e-learning, ratio (%)
Result 2018 Target 2020
35Annual report 2018
Creating valueTieto 2018 Governance Financials Sustainability

Directors. The risk categories are compliance, financial, operational, project and strategic. To identify and validate risks of unethical behaviour, we conduct internal as well as external audits on demand.
Internal audits are conducted by the Internal Audit function according to the annual plan based on risks found. The aim is to ensure the company complies with the laws, regulations, and customer agreements in focus, as well as policies and guidelines, in all operations. The Internal Audit Policy outlines the internal audit’s objectives, intentions, directions, responsibilities, and possible consequences in terms of risk control, auditing, expediency, and ethics. The policy applies to all employees and covers governance, risk management, and business processes.
Some internal investigations and audits are also initiated by whistleblowing. Our whistleblowing process allows anonymous and confidential reporting to the General Counsel of the company, about violations of the Code of Conduct, related rules, or any unethical behaviour. The process is designed to ensure that persons reporting violations will not be subject to any retaliation. Failure to act in compliance with the Code of Conduct can result in appropriate disciplinary actions.
External financial audits are conducted by an external party and vary between full scope
and statutory, depending on size of business operations and specific needs. Audits may include, among other things, testing of transactions as well as assessment of possible risks of corruption. The scope of the testing may cover ad-hoc audit assignments to evaluate the efficiency of the risk controls in place.
Our goal is that all employees are aware of and know our Code of Conduct and are proactively implementing ethical culture in all of our operations. In addition to accepting the Code of Conduct when joining the company, employees are expected to refresh their knowledge on the content of the Code on a yearly basis by taking the Code of Conduct e-learning.
Progress
During 2018, business ethics was a core theme across the business. Activities carried out were a complete renewal of our Code of Conduct Policy, to improve alignment with international norms, legislations as well as stakeholder expectations. The policy was introduced to all of our employees through a five weeks long global awareness campaign. The roll-out of the renewed Code was accompanied with face-to-face trainings for all Service Line and Industry Group leadership teams. To support the implementation of the new Code, a completely new e-learning was
Our goal is that all employees are proactively implementing ethical culture in all of our operations.
“
36Annual report 2018
Creating valueTieto 2018 Governance Financials Sustainability

in both employees and managers, in a male dominated industry, we must always keep promoting and advocating for equal opportunities. In 2018, we were acknowledged for our work with gender equality by Equileap and we have high ambitions for this area also going forward. In the coming year, harassment and discrimination will be especially highlighted within the upcoming business ethics awareness efforts.
Going forward, we plan to update our whistleblowing process and escalation function. A communication campaign to increase awareness specifically about our whistleblowing channels will be run in 2019.
also developed and implemented during the year. In the gamified training, employees get to follow a fictious Tieto employee during a full workday and are asked to make decisions across a wide range of situations that might not always be black or white. Other efforts to increase awareness of our business ethics included sustainability awareness trainings for all sales organizations across Tieto, as well as targeted trainings on business ethics for selected customer teams and internal functions. Sustainability awareness training, including business ethics, was also introduced in the Take Off days in Finland and Sweden - introduction trainings to all new employees.
We aim for 100% e-learning coverage on a yearly basis. By the end of 2018, 87% of employees had taken the Code of Conduct training. During autumn 2018, a decision was made by the Sustainability Steering Group to include the Code of Conduct e-learning to a mandatory goal plan for all employees. From 2019, fulfilment of the training will be formally evaluated as part of each employee's annual performance process.
As part of Tieto’s zero tolerance to unethical behaviour, the company has a goal that all employees should also know how to report suspected Code of Conduct breaches. We conduct assessments of our operations with the aim of identifying risk for corruption and fraud. In 2018, operations in four countries,
covering 8.6% of our operations (number of employees) were assessed for risks related to corruption. One significant risk was identified through the risk assessment, which lead to several improvements in background checks and controls of partners and agents.
Internal Code of Conduct related whistle-blowing escalations generated 12 investigations in six different countries during 2018. These investigations included analyses of fraud risks and misuse of company's assets, inappropriate behaviour of individuals and conflict of interest. Out of the 12 investigated cases, eight breaches of the Code of Conduct Policy were confirmed. Additionally, one incident of corruption and misuse of company assests by an employee active in limited business operations in Belarus was confirmed. The case led to termination of the person's employment.
External financial audits in 2018 covered 100% of our employees in all business operations and countries. No findings of misconduct were discovered in these audits.
Looking ahead
During 2019 we continue our focus on increasing awareness and promoting good business ethics. We also recognize that as a company with a male majority
37Annual report 2018
Creating valueTieto 2018 Governance Financials Sustainability
Tieto's Code of Conduct communicates the ethical principles and acts as a guideline for everything we do. Ethics for us means multiple things; taking diversity and equality seriously and actively promoting and communicating them as integral parts of our corporate culture. It also means preventing corruption in any form, in all our operations and always complying with applicable laws, rules and regulations governing anti-bribery and corruption. Ethics for us also mean recognizing the competence, motivation and well-being of our employees. All of these being the key for our company’s long-term success.
In 2018, our focus on business ethics included; complete renewed Code of Conduct Policy, gamifying our mandatory Code of Conduct e-learning and carrying out a global campaign on our ethical standards. Personally, I think that the key to create and maintain culture based on ethical standards, is to not only focus on what our employees shouldn’t do but to help everyone understand how to make right choices and behave
Creating value through an ethical culture
ethically in their daily work. Another important element is to make sure that we have a culture where everyone feels safe to raise any concerns. We see cases that are escalated to our whistleblowing channels increasing, and for me that is a healthy sign. During 2019, we plan to make further improvements to our whistleblowing system and carry out activities to increase our employees’ awareness of it. All of this is to make sure that we have an environment where all employees feel free to speak up, which supports us in maintaining high ethical standards across all our operations.
What excites you about a data-driven future?I see exciting opportunities in a world enriched by data and driven by technology. At Tieto we are inspired about creating great everyday experiences for the Nordic citizens and consumers. This is not just talk, we’ve been able to show how data and AI can help us in our everyday lives through the projects conducted with our customers.
STAKEHOLDER INTERVIEW
At Tieto we are inspired about creating great everyday experiences.
“
KIA HARING VICE PRESIDENT OF COMMUNICATIONS & SUSTAINABILITY
For instance, a trial we conducted with the City of Espoo showed that by analyzing a huge mass of historical citizen data with AI, helps to create services to address and ultimately prevent social exclusion of the young in the future. And this is just one example, there are lots more showing how we can help society with our data-driven solutions in healthcare, traffic or in the education sector. This is where I find my purpose at work.
Why do you care about sustainability? Sustainability is everyone’s responsibility. We all are responsible for Mother Earth and our legacy for future generations. Everyone of us as consumers can impact with the small choices we make every day, and corporations should be more active in supporting sustainable development and taking a stand on societal issues, for the common good.
38Annual report 2018
Creating valueTieto 2018 Governance Financials Sustainability
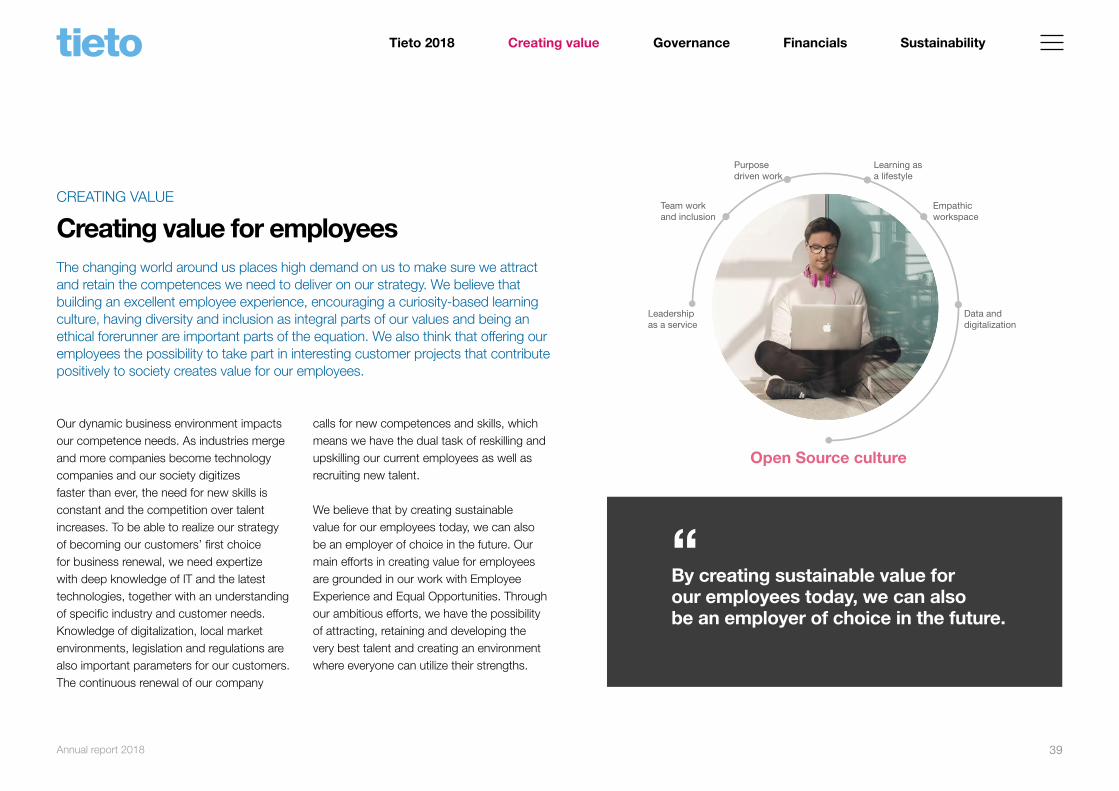
By creating sustainable value for our employees today, we can also be an employer of choice in the future.
Creating value for employeesCREATING VALUE
Our dynamic business environment impacts our competence needs. As industries merge and more companies become technology companies and our society digitizes faster than ever, the need for new skills is constant and the competition over talent increases. To be able to realize our strategy of becoming our customers’ first choice for business renewal, we need expertize with deep knowledge of IT and the latest technologies, together with an understanding of specific industry and customer needs. Knowledge of digitalization, local market environments, legislation and regulations are also important parameters for our customers. The continuous renewal of our company
calls for new competences and skills, which means we have the dual task of reskilling and upskilling our current employees as well as recruiting new talent.
We believe that by creating sustainable value for our employees today, we can also be an employer of choice in the future. Our main efforts in creating value for employees are grounded in our work with Employee Experience and Equal Opportunities. Through our ambitious efforts, we have the possibility of attracting, retaining and developing the very best talent and creating an environment where everyone can utilize their strengths.
The changing world around us places high demand on us to make sure we attract and retain the competences we need to deliver on our strategy. We believe that building an excellent employee experience, encouraging a curiosity-based learning culture, having diversity and inclusion as integral parts of our values and being an ethical forerunner are important parts of the equation. We also think that offering our employees the possibility to take part in interesting customer projects that contribute positively to society creates value for our employees.
Open Source culture
Leadership as a service
Data and digitalization
Empathic workspace
Learning as a lifestyle
Purpose driven work
Team work and inclusion
“
39Annual report 2018
Creating valueTieto 2018 Governance Financials Sustainability

Our people
Our consistent efforts to make Tieto a great place to work has paid off. In 2018 we recruited over 3 100 new employees, in professions such as software developers, architects and consultants. Our commitment to diversity and inclusion is shown in the composition of our employees. We are proud of our 24 nationalities represented at our headquarters in Espoo, Finland, and 34 nationalities at our Stockholm office in Sweden. Targeted efforts to recruit young professionals (aged 30 or younger) were also successful and during the year 1 453 individuals were onboarded.
In 2018 we also continued our growth through focused acquisitions. In February we acquired Petrostreamz and in April NSEC AB, a Swedish security services company. In November, Meridium AB, employing digital customer experience professionals joined the Tieto team in Sweden.
In 2018 we set a goal of halving ofour energy related CO2 burden by 2020.As the total emissions reduction reached by2018 is totaling 56%, we continue our roadmap to achieve even further, and set newambitions for the years to come.This is managed through our environmentalmanagement system.
Listening to the voice of our employees
Tieto supports freedom of association and collective bargaining as defined in the International Labour Organization (ILO) Declaration on Fundamental Principles and Rights at Work as stated in our Code of Conduct. Naturally, local employment laws and practices, collective agreements, and individual contract terms are followed. In the countries of operation where collective bargaining is not applied, for example, China and India, Tieto facilitates local forums where these topics can be addressed. One example is the Anti-Harassment Committee (AHC) in India, a body with representatives from various units of Tieto India, addressing complaints of harassment.
The European Works Council (EWC) in Tieto is our Personnel Representative Body (PRB), allowing us to utilize our employees’ expertise in decision-making concerning issues including business operations, financial matters and personnel considerations. The Head of Human Resources is responsible for facilitating the EWC meetings based on the needs and suggestions of the EWC members. In addition to the EWC, there are country-specific forums, following the local practices and legislation, where the company and employee representatives meet to discuss the business and employment issues. Our personnel elect
two members and two deputy members to the company’s Board of Directors. This is done by the personnel representatives in accordance with the Personnel Representation Cooperation Agreement. One of the aims of personnel representation is increased unity in decision making concerning issues such as business operations, financial and employment related topics.
Human Resources driving the agenda for employee value creation
Tieto’s Human Resources (HR) function is responsible for developing company-wide people practices. The HR function is led by the Group-level Head of HR while country HR teams are responsible for country-specific HR operations. HR introduced a new Interaction Model to better serve business demands and to enhance our manager, employee and candidate experience.
The Tieto Human Resources (HR) Policy serves as the overall strategic direction for our people practices and applies to all employees and operations globally. This policy states that Tieto supports and respects the principles set out in the United Nations Universal Declaration of Human Rights and the ILO Declaration on Fundamental Principles and Rights at Work.
2016 2017 2018
100
80
60
40
20
0
5. SUSTAINABILITY
EMPLOYEE ENGAGEMENT SCORE, %
71% 73% 75%
CR work number 5
40Annual report 2018
Creating valueTieto 2018 Governance Financials Sustainability

2016 2017 2018
18 000
15 000
12 000
9 000
6 000
3 000
0
6. SUSTAINABILITY
FULL-TIME EMPLOYEES BY GENDER,
2016–2018
14 340 14 444 15 132
Male
Female
10 40873%
3 93227%
10 49473%
3 95027%
11 02073%
4 11227%
CR work number 6
2016 2017 2018
16 000
14 000
12 000
10 000
8 000
6 000
4 000
2 000
0
8. SUSTAINABILITY
PERMANENT EMPLOYMENT CONTRACT
BY GENDER, 2016–2018
14 626 14 74315 501
Male
Female
10 54772%
4 07928%
10 64372%
4 10028%
11 21472%
4 28728%
CR work number 8
2016 2017 2018
350
300
250
200
150
100
50
0
9. SUSTAINABILITY
TEMPORARY EMPLOYMENT CONTRACT
BY GENDER, 2016–2018
305 289
238
Male
Female
22273%
8327%
18564%
10436%
14461%
9439%
CR work number 9
2016 2017 2018
800
700
600
500
400
300
200
100
0
7. SUSTAINABILITY
PART-TIME EMPLOYEES BY GENDER,
2016–2018
591 588 607
Male
Female
36161%
23039%
33457%
25443%
33856%
26944%
CR work number 7
41Annual report 2018
Creating valueTieto 2018 Governance Financials Sustainability

10. SUSTAINABILITY
TOTAL NUMBER OF EMPLOYEES BY
EMPLOYMENT CONTRACT BY REGION,
DEC 31 2018
Permanent
Temporary
Total
Finland
Sweden
Norway
Rest of Europe
Asia Pacific
& North America
3 694 (99%)29 (1%)
3 723
2 811 (99%)
2 85039 (1%)
609 (99.5%)3 (0.5%)
612
3 352 (99.9%)5 (0.1%)
3 357
5 035 (97%)
5 197
0 1 000 2 000 3 000 4 000 5 000
162 (3%)
CR work number 1012. SUSTAINABILITY
2016 2017 2018
NEW EMPLOYEES AND EMPLOYEE
TURNOVER BY AGE GROUPS, 2016–2018
< 30
30–50
> 50
2 000
1 500
1 000
500
0
-500
-1 000
-1 500
-2 000
1 49110%
1 0907%
1221%
4193%
1 3119%
5754%
1 1738%
1 4539%
1 50010%
1641%
3392%
1 2958%
7935%
1 0407%
1341%
4043%
1 3519%
6404%Tu
rno
ver
New
em
plo
yees
CR work number 1213. SUSTAINABILITY
2016 2017 2018
NEW EMPLOYEES AND EMPLOYEE
TURNOVER BY REGION, 2016–2018
Finland
Sweden
Norway
Rest of Europe
Asia Pacific & North America
Turn
ove
r
N
ew e
mp
loye
es
1 500
1 200
900
600
300
0
-300
-600
-900
-1 200
-1 500
3732%
2972%
931%
1 0117% 929
6%
9466%
7065%
3652%
4753%
1111%
1201%
4903%
3682%
7655%
6304%
4833%
8065%
1081%
4113%
5874%
5634%
7205%
861%
3813%
5554%
8435%
1 3238%
2292%
3893%
771%
CR work number 13
2016 2017 2018
11. SUSTAINABILITY
3 000
2 500
2 000
1 500
1 000
500
0
-500
-1 000
-1 500
-2 000
-2 500
-3 000
NEW EMPLOYEES AND EMPLOYEE
TURNOVER BY GENDER, 2016–2018
Total
Male
Female
2 70318%
1 96613%
7375%
6484%
1 65711%
2 30515%
2 34716%
3 117
2 25072%
86728%
6114%
1 76211%
2 37315%
1 71411%
6334%
6474%
1 74812%
2 39516%
Turn
ove
r
N
ew e
mp
loye
es
CR work number 11
42Annual report 2018
Creating valueTieto 2018 Governance Financials Sustainability

How we work
Inclusion is a key driver for employee engagement and hence a positive driver for customer experience. Our commitment to diversity and inclusion is business critical, and part of Tieto’s global operating plan.
Our Code of Conduct Policy and our Human Resource Policy outline the principles for diversity and inclusion. Each Tieto country is responsible for planning and conducting activities which support our overall diversity and inclusion goals. Activities and their results, company-wide, are reported to both our HR Leadership Team and Tieto’s Leadership Team.
As a company, we also strive to maintain
Equal opportunities
a high priority on active collaboration with personnel representation bodies. In 2018, 43% of our employees were covered by collective bargaining agreements. However, the differences between countries varies extensively, with the highest participation being in Sweden (99%) and in Finland (98%). In countries of operation where collective bargaining is not applied, for example, China and India, we strive to facilitate local forums where these topics can be addressed.
We measure our equal opportunity efforts through a range of means. Cultural assessments are done through our global employee survey, VOICE. One of the measures we use is understanding how safe employees feel about speaking up. Incidents of non-compliance, which relate to equal
A truly eclectic mix of people is fundamental in creating an inspirational workplace, helping to build our competitiveness and future innovations. Diversity and inclusion are critical components for creating great everyday experiences and making our customers competitive. To grasp future opportunities, we need to continuously develop our culture, attitudes and structures and foster an environment of open thinking and contrasting perspectives.
CREATING VALUE FOR EMPLOYEESEQUAL OPPORTUNITIES
87% 100%
Completion of Code of Conduct e-learning
for awareness on equality, ratio (%)
Result 2018 Target 2020
43Annual report 2018
Creating valueTieto 2018 Governance Financials Sustainability
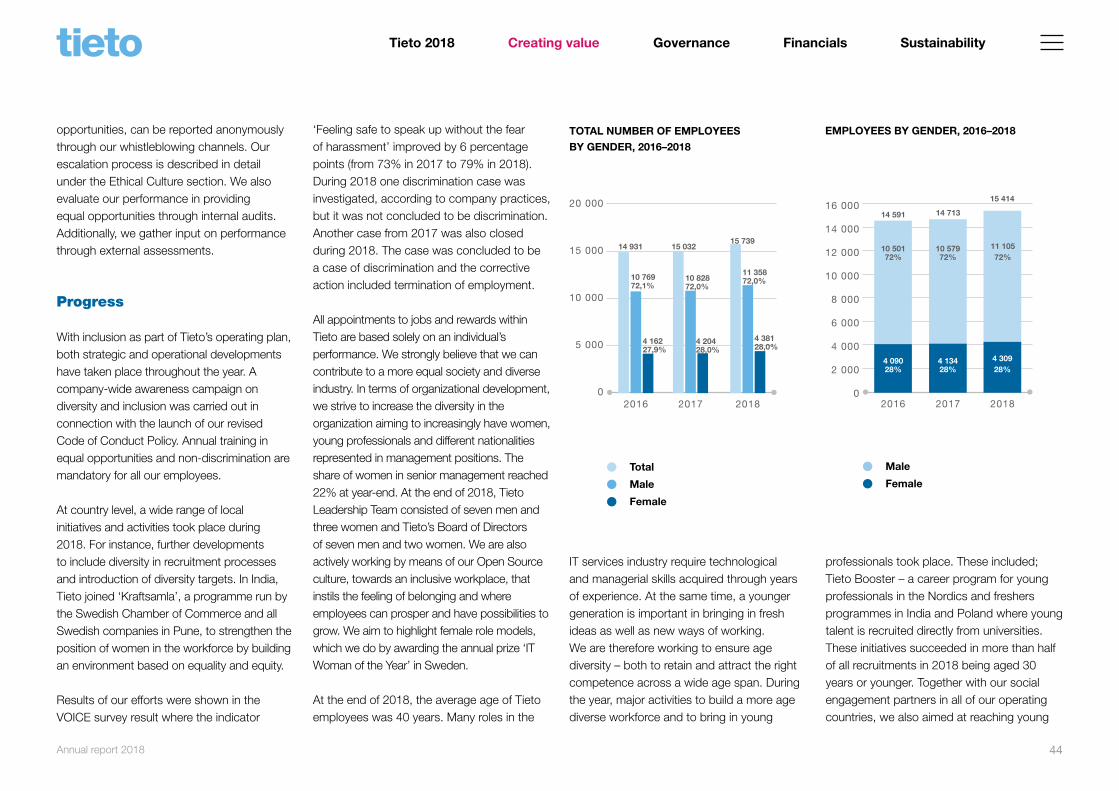
opportunities, can be reported anonymously through our whistleblowing channels. Our escalation process is described in detail under the Ethical Culture section. We also evaluate our performance in providing equal opportunities through internal audits. Additionally, we gather input on performance through external assessments.
Progress
With inclusion as part of Tieto’s operating plan, both strategic and operational developments have taken place throughout the year. A company-wide awareness campaign on diversity and inclusion was carried out in connection with the launch of our revised Code of Conduct Policy. Annual training in equal opportunities and non-discrimination are mandatory for all our employees.
At country level, a wide range of local initiatives and activities took place during 2018. For instance, further developments to include diversity in recruitment processes and introduction of diversity targets. In India, Tieto joined ‘Kraftsamla’, a programme run by the Swedish Chamber of Commerce and all Swedish companies in Pune, to strengthen the position of women in the workforce by building an environment based on equality and equity.
Results of our efforts were shown in the VOICE survey result where the indicator
‘Feeling safe to speak up without the fear of harassment’ improved by 6 percentage points (from 73% in 2017 to 79% in 2018). During 2018 one discrimination case was investigated, according to company practices, but it was not concluded to be discrimination. Another case from 2017 was also closed during 2018. The case was concluded to be a case of discrimination and the corrective action included termination of employment.
All appointments to jobs and rewards within Tieto are based solely on an individual’s performance. We strongly believe that we can contribute to a more equal society and diverse industry. In terms of organizational development, we strive to increase the diversity in the organization aiming to increasingly have women, young professionals and different nationalities represented in management positions. The share of women in senior management reached 22% at year-end. At the end of 2018, Tieto Leadership Team consisted of seven men and three women and Tieto’s Board of Directors of seven men and two women. We are also actively working by means of our Open Source culture, towards an inclusive workplace, that instils the feeling of belonging and where employees can prosper and have possibilities to grow. We aim to highlight female role models, which we do by awarding the annual prize ‘IT Woman of the Year’ in Sweden.
At the end of 2018, the average age of Tieto employees was 40 years. Many roles in the
IT services industry require technological and managerial skills acquired through years of experience. At the same time, a younger generation is important in bringing in fresh ideas as well as new ways of working. We are therefore working to ensure age diversity – both to retain and attract the right competence across a wide age span. During the year, major activities to build a more age diverse workforce and to bring in young
professionals took place. These included; Tieto Booster – a career program for young professionals in the Nordics and freshers programmes in India and Poland where young talent is recruited directly from universities. These initiatives succeeded in more than half of all recruitments in 2018 being aged 30 years or younger. Together with our social engagement partners in all of our operating countries, we also aimed at reaching young
2016 2017 2018
14. SUSTAINABILITY
20 000
15 000
10 000
5 000
0
TOTAL NUMBER OF EMPLOYEES
BY GENDER, 2016–2018
Total
Male
Female
14 931 15 03215 739
10 76972,1%
10 828 72,0%
11 358 72,0%
4 381 28,0%
4 204 28,0%
4 162 27,9%
CR work number 14
2016 2017 2018
16. SUSTAINABILITY
16 000
14 000
12 000
10 000
8 000
6 000
4 000
2 000
0
EMPLOYEES BY GENDER, 2016–2018
14 591 14 713
15 414
Male
Female
10 501 72%
4 090 28%
10 579 72%
4 134 28%
11 10572%
4 30928%
CR work number 16
44Annual report 2018
Creating valueTieto 2018 Governance Financials Sustainability

students to instil curiosity in technology.
Throughout the year we were recognized for our work with diversity and inclusion by a range of organizations. Tieto was ranked among the top 25 companies in Equileap's 2018 Global Gender Equality Ranking. More than 3 000 companies across 23 countries were evaluated on 19 gender equality criteria with Tieto being the highest placed technology company on the list. In Estonia, we received ‘The Diversity Badge’ from the Estonian Ministry of Social Affairs as the first and only IT company for our strategic efforts within the area. In India, Tieto received the ‘Employee Excellence Award’ from BD Foundation, a global diversity consultancy. The award recognizes a company which has been able to demonstrate its impact in shaping and driving the diversity and inclusion agenda while also demonstrating a sustained business value. We were also listed as one of the top three finalists for the Sandvik India Diversity Awards as well as one of the top 100 Best Companies for Women in India by the Working Mothers and Avtar group.
Looking ahead
We are committed to continuously strenghten diversity and inclusion within the company. As part of our global operating plan, inclusion will continue to be a company-wide top priority going forward. We continue to build
awareness about our vision, values and ways of working and will specifically focus on harassment and discrimination through a global awareness campaign.
We aim to improve employees’ knowledge about our whistleblowing channels through an awareness campaign and further strengthen
the fundamentals in our Open Source culture. Another focus area will be to evaluate our global governance of inclusion and investigate possibilities to further strengthen and align efforts and initiatives across our operating countries.
2016 2017 2018
15. SUSTAINABILITY
400
300
200
100
0
SENIOR MANAGEMENT BY GENDER,
2016–2018
340319 325
Male
Female
26879%
7221%
24978%
7022%
25378%
7222%
CR work number 15
2016 2017 2018
250
200
150
100
50
0
17. SUSTAINABILITY
SENIOR MANAGEMENT BY AGE GROUPS,
2016–2018
< 30
30–50
> 50
0 0 0
20861%
18357%
188 58%
137 42%
13643%
13239%
CR work number 17
2016 2017 2018
18. SUSTAINABILITY
10 000
8 000
6 000
4 000
2 000
0
EMPLOYEES BY AGE GROUPS, 2016–2018
< 30
30–50
> 50
8 85361%
2 96220%
8 86360%
2 99920%
3 18121%
9 252 60%
2 981 19%
2 85119%
2 77619%
CR work number 18
45Annual report 2018
Creating valueTieto 2018 Governance Financials Sustainability

2016 2017 2018
10
8
6
4
2
0
19. SUSTAINABILITY
Board of directors
Board of directors
Board of directors
Leadership team
Leadership team
Leadership team
BOARD OF DIRECTORS AND LEADERSHIP TEAM BY AGE GROUPS, 2016–2018
< 30
30–50
> 50
440%
550%
440%
444%
222%
7 78%
440%
660%
556%
660%
550%
660%
0 0 0 0 0 0
CR work number 19
10
8
6
4
2
0
20. SUSTAINABILITY
BOARD OF DIRECTORS AND LEADERSHIP TEAM BY GENDER, 2016–2018
Male
Female
880%
880%
7 78%
770%
330%
222%
770%
660%
330%
330%
220%
220%
CR work number 20
2016 2017 2018
Board of directors
Board of directors
Board of directors
Leadership team
Leadership team
Leadership team
46Annual report 2018
Creating valueTieto 2018 Governance Financials Sustainability

We all, as human beings, have a responsibility to stand up for the society that we want to live in.
PONTUS HEMMINGSSON HEAD OF APPLICATION SERVICES SWEDEN AND NORWAY
Our company's success depends on our people. We are dependent on competent people and hence where you are from, your sexual preference, age, physical ability or gender says very little about your ability to perform a job. Having a diverse group of people in a team enables us to see things from several perspectives. I believe this develops us all as human beings, but also benefits our company and our customers.
As an employer, what can we do to make sure that we attract and retain the best possible people? I think we need to be able to remove any barriers that might be in the way for each person to realize their full potential. This is not only a leadership responsibility, but up to all of us working at Tieto. And it is a responsibility we need to act on every day, in every action and interaction.
In 2018, we continued our internal focus on diversity and inclusion, but also expanded our
Creating value through diversity and inclusion
work to actively involve our customers. We took concrete actions to onboard people into current customer projects from groups that are under-represented within Tieto including age, gender and ethnicity. The response from our customers has been very positive and we are convinced that this will help us understand our customers even better. I hope that we will not only continue this initiative going forward, but also expand it.
What excites you about a data-driven future?On a personal level, I enjoy how digital solutions make everyday life easier. For example, I like that I now receive information that I need automatically and without having to ask for it. On a societal level, I think that a data-driven world can bring along many new possibilities and developments. But I also believe that we all need to commit and drive the ethical and secure use of new technologies.
STAKEHOLDER INTERVIEW
Why do you care about sustainability?I believe everyone should have the same opportunities no matter who they are or where they come from. And that we all, as human beings, have a responsibility to stand up for the society that we want to live in. For me that means an inclusive, democratic society where we treat each other in the same way as we want to be treated ourselves.
“
47Annual report 2018
Creating valueTieto 2018 Governance Financials Sustainability
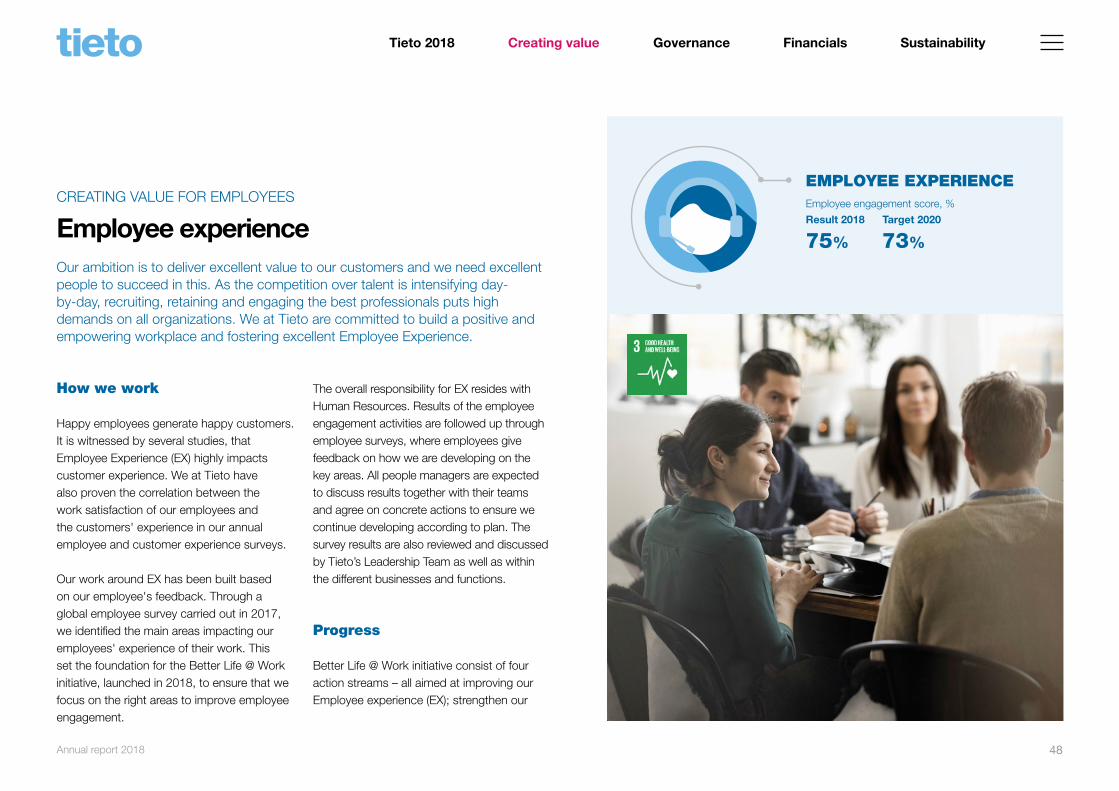
Employee experienceCREATING VALUE FOR EMPLOYEES
Our ambition is to deliver excellent value to our customers and we need excellent people to succeed in this. As the competition over talent is intensifying day-by-day, recruiting, retaining and engaging the best professionals puts high demands on all organizations. We at Tieto are committed to build a positive and empowering workplace and fostering excellent Employee Experience.
How we work
Happy employees generate happy customers. It is witnessed by several studies, that Employee Experience (EX) highly impacts customer experience. We at Tieto have also proven the correlation between the work satisfaction of our employees and the customers' experience in our annual employee and customer experience surveys.
Our work around EX has been built based on our employee's feedback. Through a global employee survey carried out in 2017, we identified the main areas impacting our employees' experience of their work. This set the foundation for the Better Life @ Work initiative, launched in 2018, to ensure that we focus on the right areas to improve employee engagement.
The overall responsibility for EX resides with Human Resources. Results of the employee engagement activities are followed up through employee surveys, where employees give feedback on how we are developing on the key areas. All people managers are expected to discuss results together with their teams and agree on concrete actions to ensure we continue developing according to plan. The survey results are also reviewed and discussed by Tieto’s Leadership Team as well as within the different businesses and functions.
Progress
Better Life @ Work initiative consist of four action streams – all aimed at improving our Employee experience (EX); strengthen our
EMPLOYEE EXPERIENCE
75% 73%
Employee engagement score, %
Result 2018 Target 2020
48Annual report 2018
Creating valueTieto 2018 Governance Financials Sustainability

HUMAN RESOURCES – There are many repetitive administrative tasks across the entire Tieto employee life cycle. We have automated many of these through robotics, freeing up employee’s time so they can focus on more qualified tasks.
FINANCE OPERATIONS – Complex finance processes in the areas of accounts payable, accounts receivable, fixed asset management and general ledger have transitioned to automation. Improvements include increased accuracy, and standardization, as well as increased bandwidth of our Finance Operation team members.
ADMINISTRATION AND FACILITIES – We have made progress in our administration and facilities functions with the automation of travel invoicing and payments related processes. Through this we are increasing our employee and external vendor experience and freeing up time for our administration and facilities specialists.
SERVICE DESK – Robotics is being used to improve our support operations. Examples of automated tasks include notifications on tickets created, unlocking user accounts and resetting passwords. Additionally, robotic process automatization is effectively used to automate standard instruction-based ticket resolutions. These automation initiatives have increased the efficiency of the service desk teams and improved our employee and customer experience.
Open Source culture, boost learning for the future, simplify Tieto and improve digital tools.
Strengthening of Open Source cultureTieto´s Open Source culture is a core foundation for building a good EX and is supported by advanced technology and a modern working environment. Our Open Source culture is based on openness and transparency, to make employees feel included, empowered, and able to influence their work as well as contribute to an inspiring working environment. During the year we focused on two main areas for boosting our culture: Leadership as a Service and Inclusion.
Leadership as a serviceAt Tieto, our leaders play a significant role in creating a great employee experience and retaining key talent. We believe that leadership is about putting people first and the primary focus for our leaders should be to support the success of others. As means to support the realization of our vision we offer leadership development trainings, coaching, mentorship programmes and workshops on team development, feedback and engagement. Measurements during the year also show that our efforts in improving leadership are paying off. Leadership and coaching have improved by 11 percentage points in our employee survey VOICE compared to 2017 (from 66% in 2017 to 77% in 2018).
Customer and employee experience development supported by robotics
We have introduced robotic automation processes in a range of our functions. This enables us to shift focus to tasks where we can really create value, resulting in improved employee and customer experience.
49Annual report 2018
Creating valueTieto 2018 Governance Financials Sustainability

networking, learning and sharing expertise grew in 2018 with nine new communities, including Blockchain, Virtual Reality and Sales communities, among others.
Simplify TietoIn 2018 we initiated the OneTieto@Work-programme to simplify our staffing processes and increase transparency for available competences for customer work. The programme supports personal growth as well as smooth allocation of people to projects across Tieto businesses. Through this initiative, we have been able to encourage the whole Tieto crew to take the lead in their own personal growth. Other benefits include higher internal mobility, faster customer fulfillment and diverse career opportunities for people across business units.
Improve technical toolsWe have also taken actions to improve the digital tools used by our employees. Initiatives included the introduction of robotics in our HR function to support with administrative tasks, freeing up employee’s time for more value-creating tasks. In addition, we took several steps towards creating one digital environment, which included the introduction of a new cloud solution - Office 365 - as well as a renewal of our intranet both in terms of content and structure, making it easier for employees to find information
they need. During the year we also made further investments in our video conferencing equipment to improve team work and the quality of team meetings. Additionally, we digitalized and centralized generic HR services to a new Ask HR function, making real time support possible via chat and request form. As a consequence of the above actions - our employees’ user experience of technical tools has improved during the year, from 58% in 2017 to 72% in 2018.
Employee engagement, the outcome measure of the Employee Experience, is measured through our employee survey. The overall employee engagement score continued showing slight improvements in 2018, and increased with 2 percentage points compared to 2017 (75% vs. 73%).
Looking ahead
Better Life @ Work makes a good foundation for our continued efforts in creating an inspiring place to work with the well-being of our employees at the centre. Implementation of the actions will continue during 2019 across our global operations with additional focus on strengthening the feedback culture and the ability of employees to challenge the status quo i.e. innovate and renew our ways of working to further simplify Tieto.
To show our commitment for developing both customer and employee experience, we have, in 2019, established a new Chief Experience Officer position in Tieto Leadership team.
Inclusion Team work and inclusion are also crucial for creating a culture where employees thrive and are an integral part of our Open Source culture. We believe that a wide mix of people, across gender, age and cultural backgrounds, is needed to stay competitive. In 2018 we carried out a number of activities to further improve inclusion. Read more about our approach and activities under Equal Opportunities.
Data from our VOICE-survey also shows that our measures have had an effect. In 2018 we improved our rating measuring Open Source culture by four percentage points from 66% in 2017 to 70% in 2018.
Boost learning for the futureCuriosity and lifelong learning are crucial parts of our culture and success. We want to create a working environment where employees are curious, and find it motivating to learn new technologies and ways of working. Our Learning as a Lifestyle initiative focuses on supporting employees in gaining strategic competencies for the future and enable proactive reskilling and upskilling. In 2018 we moved all Tieto learning modules to our new learning experience platform. By the end of 2018, 91% of our employees and 99% of our managers had used the new learning environment. Tieto's expert communities for
50Annual report 2018
Creating valueTieto 2018 Governance Financials Sustainability

Research shows that employee and customer experience have a positive correlation. This has been validated with our own findings, which indicates that our employees’ thinking is very much aligned with our customers’ wishes. When the customer experience is great, this generates more business. And engaged employees are successful in providing those experiences. Throughout the year, we placed a big emphasis on improving our employee experience approach which has paid dividends across the organization. We have shifted the mindset and focused on engaging our people by creating great experiences for them. We want to build a workplace where people get fulfillment from their work and feel they have a positive impact on our business and our customers’ success.
In 2019, I see so many possibilities for applying this mindset to various areas. In 2018, we used employees’ feedback to improve our recruitment and onboarding processes. It’s satisfying to see that Tieto as
Creating value by focusing on employee experience
a potential employer has been put on the radar of more candidates and we’ve been able to build on the great experiences for those who have joined. We have also involved many employees in various design workshops to really dig in to what they see as the optimal way of working and utilized this input to improve employee experience in many areas. Going forward, we want to focus on some of the other moments that matter most to our employees: promotions, role changes, parental leave and retirement.
What excites you about a data-driven future?If we think about employee experience, having the relevant data at our use is everything. It enables us to focus on the right experiences, right decisions and right improvements.
The possibilities that new technologies and digitalization bring are amazing and we are at the very heart of it. We have these skills in-house which means we can really make
STAKEHOLDER INTERVIEW
the most of opportunities as they arise. I’ve been working with our experts from e.g. Robotics Process Automation and AI to create learning opportunities for our people in these interesting topics. Being curious towards new technologies is evident among our employees, with people wanting to refresh their skills or learn totally new skill sets. In addition, HR has worked together to test the automation of certain repetitive and manual tasks that take a lot of HR’s time. Our very first robot, Bob, sends job certificates to people ending their employment with us. Bob saves valuable time freeing up the HR team to focus on more complex and value-adding tasks.
Why do you care about sustainability?Sustainability is crucial – we need to act fast in the coming years to save our planet. What makes me proud and hopeful at the same time is that we have a lot of solutions at Tieto that enable us to be an important player in using technology to build a sustainable planet.
The possibilities that new technologies and digitalization bring are amazing and we are at the very heart of it.
INNA LINDQVIST HEAD OF TALENT AND LEADERSHIP DEVELOPMENT
“
51Annual report 2018
Creating valueTieto 2018 Governance Financials Sustainability

Creating value for society and the environment
CREATING VALUE
Our value creation goes beyond just business and employees. We minimize negative impacts from our operations while at the same time aim at creating positive value for society and the environment. Through technologies and smart use of data, we can positively impact everyday life for millions of people. Our solutions can help create smarter cities, preventive healthcare and efficient governmental operations.
Economic responsibility is multi-faceted. We create long-term sustainable value for our shareholders and owners, but we also have a positive economic impact as an employer and tax payer. Our local presence in multiple cities creates job opportunities for residents in areas and countries where we operate. We pay competitive salaries and benefits and
provide our employees with a meaningful place to work. Where possible, we prioritize local suppliers in our markets as this creates value for other stakeholders and stimulates local economies.
We are continuously exploring new ways to minimize our environmental impact and reduce our greenhouse gas emissions. We do this by creating environmentally certified offices, purchasing renewable energy for our data centers and reducing travel and consequently the environmental impact of it.
We also actively pursue opportunities to contribute to societies where we operate through our societal engagements.
52Annual report 2018
Creating valueTieto 2018 Governance Financials Sustainability

How we work
We aim to minimize our environmental impact throughout the value chain. We continuously strive to improve and support the precautionary approach to tackling environmental challenges. Increasing energy efficiency in our offices and data centres and reducing business travel are key actions in our focus to reduce CO2 emissions. In 2016 we set a goal of halving of our energy related CO2 burden by 2020. As the total emissions reduction reached by 2018 is totaling 56%, we continue our road map to achieve even further, and set new ambitions for the years to come. This is managed through our environmental management system.
Our Environmental Rule defines our approach to managing the company’s environmental
Greenhouse gas emission
impact. Accordingly, in our offices and data centres we have implemented energy-efficient measures and relocated to BREEAM or LEED certified buildings with upgrading facilities to reduce direct and indirect energy consumption. Both environmental certificates and the energy efficiency (kwh/m2) of a building have become important new site selection criterion. For all of data centres, our target is to drive and maintain operations as energy efficiently as possible. We regularly collect, monitor and report energy consumption data to ensure we maintain the highest efficiency possible.
Our travel rule encourages only essential travel. We provide and encourage employees to use internal conference solutions and various digital collaboration platforms to help minimize our environmental travel footprint.
Greenhouse gas emissions generated by human activities are the main drivers for climate change. The best way for us to combat global warming is to improve the energy efficiency in our operations and reduce emissions. Our aggregated CO2 emission reduction since 2016 totals 56% and we are continuously examining ways to reduce our energy related CO2 emissions even further.
CREATING VALUE FOR SOCIETY AND THE ENVIRONMENTGREENHOUSE GAS EMISSIONS
-12% -50%
ktons CO2 from indirect energy consumption
Result 2018 Target 2020
Total emissions reduction from 2016-2018 amounts to 56%.
53Annual report 2018
Creating valueTieto 2018 Governance Financials Sustainability

Our Chief Procurement Officer is responsible for the environmental management of our offices, procurement, and business travel. The Head of Data Centres has the same responsibility for our data centres. All Nordic data centres and offices with more than 50 employees are covered by our ISO 14001-certified Environmental Management System (EMS). The responsibility for the implementation of the EMS, as well as energy reduction actions, lies with an Environmental Manager who has responsibility for one or more countries of operations. Our data centre teams are responsible for regular energy consumption monitoring.
Possible risks or incidents related to environmental issues can be reported via the EMS in each country or our global risk reporting portal.
Progress
At a Group level, the annual energy consumption goal is to reduce indirect energy consumption in operations by -3.5%. In 2018, the indirect energy consumption decreased by 7% (-4%) compared to the previous year, reaching total consumption of 106 959MWh (115 326). The total decrease of roughly 7 gigawatt hours, is equal to a full year’s heating for around 350 detached households. This resulted in a -12% decrease in related CO2
emissions, mainly as the result of energy reduction activities in offices and data centres (-7%), but partly due to a methodological change in reporting (-5%). This means that we are making steady progress on our energy CO2 reduction roadmap. We achieved our long-term target ahead of schedule with 2018 resulting in a a -56% decrease, as compared with our baseline year 2016.
Green buildings and smart use of office space Providing sustainable, efficient, and activity-based office space is the primary target for our facility operations. In 2018 we continued our work towards consolidating and creating flexible and multi-use square meters in our offices. In Scandinavia, the Baltic region and India this was a particular focus and it resulted in a decrease in energy consumption across many sites. In 2018 we met our long-term 2020 goal of having 60% of our employees located in environmentally certified office buildings. Our KPI, ‘office area per employee’, guides us in reducing the area dedicated to a workplace or person and leads to more efficient use of square meters and reduces energy consumption. Our 2020 goal to reduce the usage to 12.3 sqm per person was achieved ahead of schedule in 2018.
Renewable energy in our data centres In our data centres we continuously work
to improve energy efficiency by: optimizing cooling capacity, utilizing intelligent airflow management and deploying low energy infrastructure solutions. In Espoo, Finland, excess heat generated by data centres is recycled back to society and heats nearby households. In Stockholm, Sweden we continued to use solutions that warm the facilities and also redirect any excess energy generated to nearby houses. Meanwhile, the data centre in Norway - located deep inside a mountain in Stavanger - is run with 100% renewable energy and cooled by cold water from the adjacent fjord.
Over a period of time, we have also worked strategically towards minimizing the number of data centres that we operate. In 2018, we closed down one data centre located in Finland. Consolidation and concentration of our data centre services enables us to reduce our overall energy consumption.
During the year we continued to use green energy and recycle excess heat from all of our Nordic data centres. This meant we heated roughly 750 detached households in the Espoo area alone.
With the aim of reducing greenhouse gases in our purchases we evaluated our supply chain emission intensity during 2018. Relevant categories for evaluation, according to Greenhous Gas Protocol was purchased
goods and services, capital goods, waste generated in operations and business travel. All of these categories are managed within our supplier sustainability programme. Currently, greenhouse gas emissions are reported on business travel, which is a category most visible to our employees and clearly connected to deliverables.
Reducing and changing methods of business travel is a tangible way to reduce CO
2 emissions from our operations. We constantly try to find new and innovative ways to support smart travel and reduce the environmental impact of business commuting. In 2018, we continued our efforts in changing employee travel habits by encouraging employees to use internal online conferencing and various digital collaboration platforms. CO2 emissions from business travel with private cars decreased by 9% in 2018 and CO2 emissions from flights in 2018 were 13.7 tonne CO2. During the 2018 data collection process, we found inaccuracies in CO2-emission data from flights for 2016 and 2017 which were not resolvable, making comparability of the data impossible. Therefore, the data from 2018 is set as the new baseline for CO2 emissions from flights.
Looking ahead
We are committed to continuing activities and evaluating the impact of reducing our
54Annual report 2018
Creating valueTieto 2018 Governance Financials Sustainability

CO2 emissions in the coming year. Our focus longer-term we will be on two major areas: increasing the usage of renewable energy and implementing energy efficiency measures in offices and data centres. We will also revisit our long-term targets with the aim of stretching them further.
We will continue managing the environmental footprint of the relevant procurement categories and explore opportunities for expanding supply chain emissions reporting.
In 2019 our travel rule will be updated to include acceptable reasons for business travel to further support our employees in changing their travel habits. The aim of revising the rule is to reduce the number of trips and encourage employees to plan travel so that several meetings can be combined in one trip. In addition, we will continue steering our travellers to use public transport and trains instead of private vehicles.
ENERGY AND GHG EMISSION HIGHLIGHTS
ENERGY CONSUMPTION
EMISSION INTENSITY
TIETO’S TOTAL CO2 EMISSIONS
25 553tCO2
16tCO2 / MEUR =
Annual energy consumption of
8 400 detached houses
CHANGE
−12%
10 814tCO2
CHANGE
−7%
106 959MWh
55Annual report 2018
Creating valueTieto 2018 Governance Financials Sustainability

This year we have seen tangible results from the efforts we launched in 2017 to address energy usage and CO2 emissions from our data centres. We only use renewable energy in our Nordic data centres and are working strategically to consolidate the data centres to reduce energy even more.
In practice, today's data centres should be the flexible backbone, supporting innovation and helping to realize our strategy in an efficient and sustainable manner. Going forward, we will be facing the challenge to maintain a low CO2 footprint, while at the same time provide a robust infrastructure for the data that comes from new digital solutions. We need to be able to deliver on both parameters so that we can support our customers in their digital journey and do so in a sustainable way.
Creating value by minimizing greenhouse gas emissions
What excites you about a data-driven future?As we work at the front line in data centres, it is exciting to link the long-term challenges and possibilities. The development towards a data- driven world challenges us to be continuously innovative and strategic, making sure we are efficient and sustainable as the amount of data – and thus the amount of energy needed – is constantly growing.
Why do you care about sustainability? I think caring about sustainability is non-negotiable, since it has to do with our survival on this planet. It must be everyone’s responsibility to be concerned with sustainability. Sustainability is very much the driving force for making continual improvements to our data centres.
STAKEHOLDER INTERVIEW
In think caring about sustainability is non-negotiable, since it has to do with our survival on this planet. It must be everyone’s responsibility to be concerned with sustainability.
“
TOMMY WAHLEDOW HEAD OF DATA CENTRE BUSINESS
56Annual report 2018
Creating valueTieto 2018 Governance Financials Sustainability

How we work
Our Group-level finance operations are handled by our Chief Financial Officer’s (CFO) office. In addition, each Industry Group and Service Line has a dedicated finance partner, who works closely with business and supports management in financial processes and reporting. Our shared service centre in Riga, Latvia, supports accounting and master data maintenance services to fulfil both Group reporting and statutory reporting needs and requirements.
We have a common accounting and reporting platform, Tieto ERP. Group consolidation and reporting are based on the reporting system, facilitating common control requirements for all legal entities reporting to the Group. Financial reporting consists of monthly performance reports, including
Economic impact
all the key performance indicators, rolling forecasts and interim financial reports. The correctness of our financial reporting, including interim and annual reports, and the compliance of financial reporting with regulatory requirements are ensured through our internal control practices. The Audit and Risk Committee of our Board of Directors has the role of overseeing our external financial reporting.
Our financial reports are regularly reviewed by the Leadership Team and the Board of Directors. The follow-up is based on a thorough comparison of the actual figures with the set objectives, forecasts and previous periods. If there are deviations in the figures, the Leadership Team members are responsible for initiating corrective actions.
Our Financial Handbook includes internal
For us, economic responsibility means creating long-term sustainable value for our stakeholders. Through running our business in profitable manner, we are contributing to a global and sustainable economy. In 2018, our profitability remained at a healthy level and net cash flow from operations was significantly up over the year.
CREATING VALUE FOR SOCIETY AND THE ENVIRONMENTFINANCIAL
PERFORMANCE
% sales growth
% EBIT margin
% adjusted EBIT margin
Annually increasing dividends
Net debt to EBITDA ratio, limited in
the long term
Target 2020
Above market CAGR
Long term
>10%
Long term
>>10%
<1.5long term
Annual increase in
absolute terms
4%, or 7% inlocal currencies
9.7%
10.2%
0.7
Base dividend up by 4%, additional
dividend proposed
Result 2018
57Annual report 2018
Creating valueTieto 2018 Governance Financials Sustainability

financial information that is directed at people involved in the financial planning and reporting or working with finance matters. The information covers a broad spectrum from the steering system to detailed timetables for reporting, as well as descriptions of reporting systems and financial guidelines. Our financial reporting follows the International Financial Reporting Standards (IFRS) and IFRIC interpretations as adopted by the European Union. As a listed company, we are compliant with the regulations of the NASDAQ Helsinki and Stockholm Stock Exchanges.
Progress
According to the long-term financial objectives, launched in 2016, Tieto aim to achieve IT services growth above the market (CAGR) and 10% reported operating margin (EBIT) to increase base dividend annually in absolute terms, and to have net debt/EBITDA of 1.5 as an upper limit in the long run. In 2018 net sales increased by 4%, or 7% in local currencies. It is estimated that the IT services market relevant ot Tieto grew by 2%. Operating margin was close to the long-term ambition at 9.7% (9.0). The proposed dividend is up by 4% to EUR 1.25 (1.20) and additionally, an extra dividend of EUR 0.20 is proposed. Dividend yield is 6% and the payout ratio 87%, including extra dividend. Our capital structure remained strong and net debt/EBITDA was 0.7.
Our strategic tax aim is to comply with all local tax legislation and other regulations in all jurisdictions. We are committed to operating in a responsible way and to comply with ethically acceptable principles in all our activities. This means that we fulfil all our reporting requirements and pay all legally imposed direct, indirect and other taxes in those countries where the Group has operations. Furthermore, we shall always operate with full co-operation with the authorities and aim to disclose all information that is needed for determining tax consequences. Our general objective is to avoid uncertain tax positions. In case of uncertainty, all tax positions taken should be supportable. Our Tax Strategy is approved by the Audit and Risk Committee (ARC). The Group Tax team reports on the status of Group tax issues biannually to the ARC. We also have a written Tax Function Model including roles, tasks and responsibilities of the Group Tax Team and other relevant internal and external stakeholders in managing taxes. External tax advisors are used, for example, in complex M&A cases. Tax risks are identified and managed as part of an enterprise wide approach to risk management.
Our economic contribution to stakeholders is summarized in the graph below. It illustrates our economic impact on customers, employees, suppliers, governments and society at large.
Tieto Corporation is in a co-operative compliance programme with the Finnish Tax
Authorities. Large Taxpayers' Office of Finland has conducted a compliance scan assurance of all tax management processes and controls including internal controls related to tax reporting at Tieto during 2017, and in 2018 the collaboration continued. During the year, we received financial assistance from local governments in some of our operating countries. In Austria, we received EUR 0.3 million from the EU for research funding. In Sweden, we received EUR 0.3 million, of which the majority is from Vinnova, the Swedish Innovation Agency and a smaller portion for employment support. In Finland, we received EUR 0.3 million from Business Finland, the Finnish Funding Agency for Technology and Innovation, for projects to support digitalization in various industries and the adoption of a real-time experimental business model, as well as for product development purposes in our Product Development Services unit.
Looking ahead
We will maintain our capacity to invest in future growth both organically and inorganically after dividends. In connection with the 2018 reporting and strategy renewal, we upgraded our growth and profitability ambitions. According to the new long-term financial objectives, Tieto aims to achieve over 5% growth and 13%
adjusted operating margin (EBIT). Dividend policy and the objective for net debt/EBITDA remain unchanged. Our offering development costs remained at 5% of sales and capital expenditure represented 2.8% (3.3) of net sales. Additionally, acquisitions will support the ambition of accelerating growth. Aggregated annual sales of the companies acquired in 2018 amounted to around EUR 13 million, of which EUR 4 million was included in our sales in 2018.
See Financial Review
FOR A FULL DESCRIPTION
OF OUR FINANCIAL PERFORMANCE,
PLEASE READ OUR FINANCIAL
REVIEW 2018.
58Annual report 2018
Creating valueTieto 2018 Governance Financials Sustainability

Economic value for different stakeholders, EUR million
2018 2017 2016
Revenues 1 623.8 1 562.3 1 514.5
Operating costs 509.7 496.8 493.8
Employee wages and benefits 905.0 873.3 827.1
Payments to providers of funds 108.6 105.7 104.3
Payments to governments1) 26.7 21.5 22.7
Economic value retained 73.8 65.0 66.61) of which
2018 2017 2016
Finland 12.1 7.2 4.2
Sweden 7.9 9.2 10.0
Norway 0 -0.4 0.7
Czech Republic 1.6 1.5 2.1
India 2.2 2.3 4.6
Other 2.9 1.7 1.1
Total 26.7 21.5 22.7
59Annual report 2018
Creating valueTieto 2018 Governance Financials Sustainability

Growth faster than the market, continued profit improvement and attractive dividend policy are cornerstones in our value creation.
“
TANJA LOUNEVIRTA, HEAD OF INVESTOR RELATIONS
Creating value for investors
During 2018, our growth accelerated, operating margin improved and for another year, dividends were up from the previous year. Innovation is bearing fruit and growth was also supported by a number of bolt-on acquisitions. While investing in the future operating margin (EBIT) improved from 9% to close to 10%.We see great opportunities to accelerate growth further.
We are well positioned to lead innovation and renewal across industries. Clients’ increased focus on providing exciting customer experience and the need for design of new business models and related renewal drive demand. Through context-rich customer engagement we are well equipped to drive competitiveness for our clients and Tieto.
We have upgraded our growth ambitions for the coming years and solid performance creates a good foundation for good
Creating value for investors
development and attractive dividend policy to continue. Tieto is an exciting place to work at.
Why I am excited about Investor RelationsGood investor dialogue is based on all the components of value creation. Understanding the market around us, strategy and performance drivers are the essence and it really is rewarding – for the company and for me personally – to be challenged by demanding investors.
What is driving value creationGrowth faster than the market, continued profit improvement and attractive dividend policy are cornestones of our value creation. With focus on innovation and data-driven business opportunities, Tieto is well positioned for gaining market share in the Nordics.
STAKEHOLDER INTERVIEW
60Annual report 2018
Creating valueTieto 2018 Governance Financials Sustainability

We believe that the future lies in the youth of today and therefore we want to focus on investing in young people and their education.
“ CASEWE COLLABORATED
WITH STARTUP
REFUGEES TO
STRENGTHEN DIGITAL
EQUALITY
Read more
We engage in long term societal projects with several established partners. During 2018, we continued our co-operation with My Dream Now in Sweden, Identity Foundation and Lila Poonawalla Foundation in India and Children and Youth Foundation in Finland. We also started new collaborations in 2018 with Startup Refugees in Finland, HelloWorld in Sweden and Gi Bort Dagen in Norway. In addition to our long-term cooperations, we also partnered with Pride Helsinki and Pride Stockholm to promote equality, diversity and inclusion.
Our societal engagements are aligned with our business strategy. We believe that the future lies in the youth of today and therefore
Societal engagementsWe want to be an active corporate citizen in the societies where we operate. We believe that we can create lasting value by engaging with partners that develop societies and at the same time support our long-term business strategy.
CREATING VALUE FOR SOCIETY AND THE ENVIRONMENT
we want to focus on investing in young people and their education. In addition, the main theme for 2018 was improving digital equality in society with a focus on strengthening digital competencies and skills among disadvantaged groups. Our Sustainability Steering Group, authorised by the Board of Directors, annually reviews our societal engagements. Our selection of partners is based on community-need assessments made in co-operation with local business operations. Our societal engagements give our employees the opportunity to take part in these projects and do good for the society around us. This was especially highlighted during 2018 as part of Tieto's 50-year celebration activities.
61Annual report 2018
Creating valueTieto 2018 Governance Financials Sustainability

MY DREAM NOW HELPS CHILDREN
PURSUE THEIR FUTURE DREAMS
My Dream Now is an organization focussed on building bridges between companies and schools with the aim of inspiring young students to fulfil their dreams. As part of the mission, My Dream Now prioritizes schools in areas with the greatest potential and need, for instance, where unemployment is high. Over several years we have engaged in My Dream Now’s operations in various ways. In 2018, we had employees volunteering as class coaches, as well as students participating in study visits and job shadowing to inspire and increase their understanding of daily work life.
IDENTITY FOUNDATION HELPS
UNDERPRIVILEGED CHILDREN
Founded in 2003, Identity Foundation is a charitable trust in Pune, working with underprivileged children. Since 2017, we have supported Identity Foundation's Mobile Learning and Infotainment Centre (MLIC) buses. In the two mobile learning and infotainment buses, underprivileged children, such as street children, are given literacy and life skills education. The MLIC
also serve as information facilities giving children exposure to positive entertainment and providing useful information.
LILA POONAWALLA FOUNDATION
EMPOWERS WOMEN TO PURSUE
HIGHER EDUCATION
Lila Poonawalla Foundation (LPF) is an Educational Trust in India whose vision is to contribute through scholarship and pursuit of higher education, to the empowerment of Indian women by supporting academically outstanding and financially deserving girls.
THE CHILDREN AND YOUTH
FOUNDATION
The Children and Youth Foundation supports children in achieving their dreams by organizing workshops and discussing the skills that are needed in future work life.
DRIVING INCLUSION THROUGH
STARTUP REFUGEES
StartUp Refugees is a network that supports newcomers with starting businesses and entering the Finnish labour market. Our collaboration with StartUp
Refugees helps refugees and asylum seekers strengthen digital competencies and supports integration to the Finnish labour market and wider society. Together with StartUp Refugees and Tieto volunteers, we have organized workshops for refugees and asylum seekers from different backgrounds to improve their digital skills.
CONTRIBUTING TO THE SOCIETY WITH
GI BORT DAGEN
Gi bort dagen provides guidance and support for organizations that wish to contribute to society. The organization matches employees based on their competences with specific societal projects. In 2018 we facilitated three activities for our employees in collaboration with Gi bort dagen. Activities included a free-of-charge seminar on project
management to non-profit organization, social entrepreneurs and other actors concerned with social responsibility as well as coaching to non-profit organizations and social entrepreneurs on project management. We also organized a possibility for employees to contribute with a day’s work at the Blå Kors center, which is a low-threshold offer for people with drug and alcohol abuse problems.
INTRODUCING KIDS TO THE WORLD OF
CODING THROUGH HELLOWORLD
HelloWorld is a coding camp aimed at teaching children everything they need to start them on the rewarding journey of coding. The organization also encourages more young girls to participate in coding, where they are vastly underrepresented at the moment.
In 2018, our key societal engagements included:
62Annual report 2018
Creating valueTieto 2018 Governance Financials Sustainability

GovernanceCorporate Governance Statement 64
Annual General Meeting 65
Shareholders' Nomination Board 65
The Board of Directors 67
The President and CEO and operative management 72
Internal control and risk management 74
Major risks 76
Related-party transactions 79
Insider administration 80
Auditors 80
Remuneration statement 81
Letter from the Chairman of the Remuneration Committee 88
63Annual report 2018
Creating valueTieto 2018 Governance Financials Sustainability
63
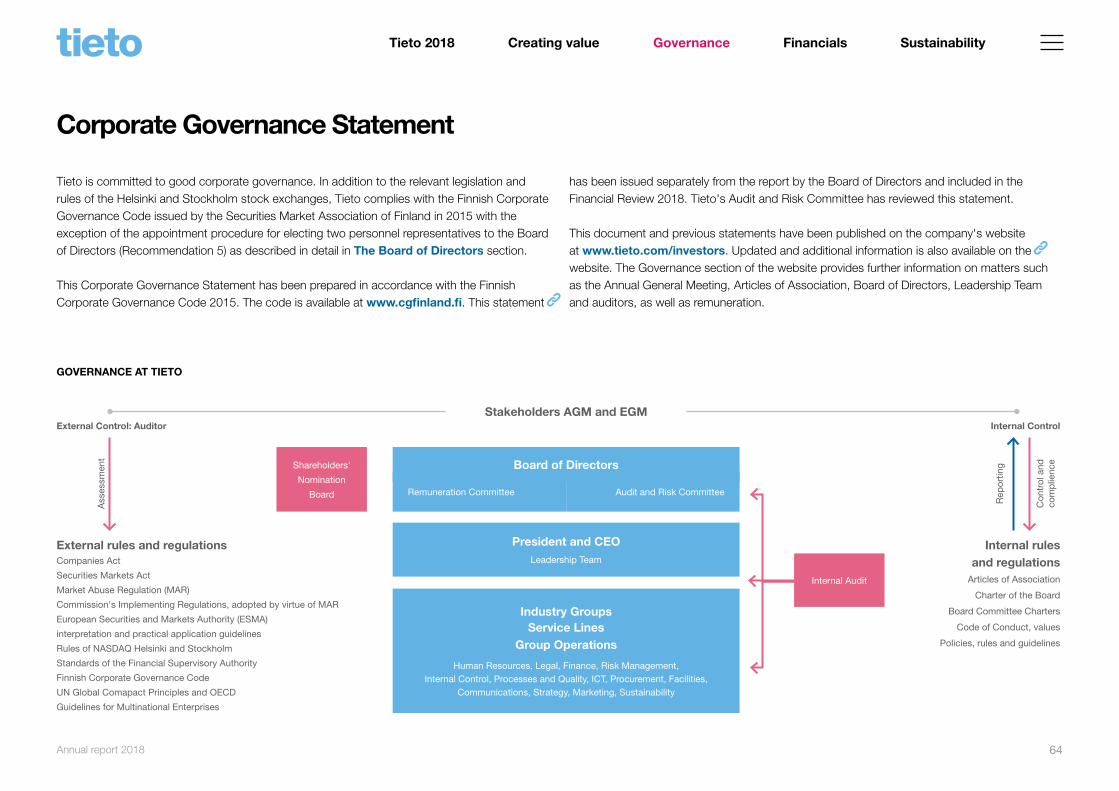
Corporate Governance Statement
Tieto is committed to good corporate governance. In addition to the relevant legislation and rules of the Helsinki and Stockholm stock exchanges, Tieto complies with the Finnish Corporate Governance Code issued by the Securities Market Association of Finland in 2015 with the exception of the appointment procedure for electing two personnel representatives to the Board of Directors (Recommendation 5) as described in detail in The Board of Directors section.
This Corporate Governance Statement has been prepared in accordance with the Finnish Corporate Governance Code 2015. The code is available at www.cgfinland.fi. This statement
has been issued separately from the report by the Board of Directors and included in the Financial Review 2018. Tieto's Audit and Risk Committee has reviewed this statement.
This document and previous statements have been published on the company's website at www.tieto.com/investors. Updated and additional information is also available on the website. The Governance section of the website provides further information on matters such as the Annual General Meeting, Articles of Association, Board of Directors, Leadership Team and auditors, as well as remuneration.
GOVERNANCE AT TIETO
Stakeholders AGM and EGM
Board of Directors
President and CEOLeadership Team
Industry GroupsService Lines
Group Operations
Human Resources, Legal, Finance, Risk Management, Internal Control, Processes and Quality, ICT, Procurement, Facilities,
Communications, Strategy, Marketing, Sustainability
Remuneration Committee Audit and Risk Committee
Shareholders'
Nomination
Board
Internal Audit
External rules and regulationsCompanies Act
Securities Markets Act
Market Abuse Regulation (MAR)
Commission's Implementing Regulations, adopted by virtue of MAR
European Securities and Markets Authority (ESMA)
interpretation and practical application guidelines
Rules of NASDAQ Helsinki and Stockholm
Standards of the Financial Supervisory Authority
Finnish Corporate Governance Code
UN Global Comapact Principles and OECD
Guidelines for Multinational Enterprises
Internal rules and regulations
Articles of Association
Charter of the Board
Board Committee Charters
Code of Conduct, values
Policies, rules and guidelines
External Control: Auditor Internal Control
Ass
essm
ent
Con
trol
and
co
mp
lienc
e
Rep
ortin
g
64Annual report 2018
Creating valueTieto 2018 Governance Financials Sustainability

Annual General Meeting
Tieto’s supreme decision-making body is the Annual General Meeting (AGM). Every shareholder has a right to participate in the AGM and each share in Tieto entitles its holder to one vote. However, no shareholder is allowed to vote at a General Meeting with more than one fifth (1/5) of the votes represented at the meeting.
The AGM elects the members of the Board of Directors (including the Chairman) and appoints auditors, decides on their compensation and discharges the members of the Board and President and CEO from liability. The AGM’s approval is required for option programmes as well as Board authorizations for share repurchases and share issues. The meeting also makes the decision on the Board’s dividend proposal.
The following persons are present at Tieto’s AGM:• Board of Directors: Chairman, Board members and new Board member candidates• Leadership Team: President and CEO, CFO• Auditors
For more information regarding the AGM 2019 and previous meetings, shareholders and participation possibilities, please visit www.tieto.com/agm.
Tieto’s AGM 2018• In 2018, the AGM convened on 22 March at Tieto’s headquarters in Espoo, Finland.
Altogether 391 shareholders and 48 503 546 shares (65.4% of the total outstanding shares) were represented at the meeting.
• No Extraordinary General Meetings were held in 2018.
Shareholders' Nomination Board
Tieto’s AGM decided in 2010 to establish a Shareholders’ Nomination Board (SNB), which is a body of shareholders responsible for preparing the proposals to the AGM for the election and remuneration of the members of the Board of Directors.
The SNB consists of five members. Four of the members represent the four major shareholders who on 31 August held the largest number of votes conferred by all shares in the company and who wished to participate in the nomination process. The fifth member is the Chairman of the Board of Directors of Tieto Corporation. The term of office of the SNB members expires when a new SNB has been appointed. The SNB itself is an organ that has been established for the time being. The charter of the SNB is available on the company’s website at www.tieto.com/investors.
The SNB preparing the proposals to AGM 2019 consists of the following representatives announced by Tieto’s shareholders:
Nominated by Cevian Capital Partners Ltd:Martin OliwMain occupation: Partner, Cevian Capital AB Born: 1977Nationality: SwedishEducation: MSc. (Econ.), MSc. (Eng.)
Nominated by Solidium Oy:Petter SöderströmMain occupation: Investment Director, Solidium Oy Born: 1976Nationality: Finnish Education: MSc. (Econ.)
65Annual report 2018
Creating valueTieto 2018 Governance Financials Sustainability
Nominated by Ilmarinen Mutual Pension Insurance Company:Mikko MursulaMain occupation: Chief Investment Officer, Ilmarinen Mutual Pension Insurance CompanyBorn: 1966 Nationality: FinnishEducation: MSc. (Econ.) Nominated by Elo Mutual Pension Insurance Company:Satu HuberMain occupation: Chief Executive Officer, Elo Mutual Pension Insurance CompanyBorn: 1958 Nationality: FinnishEducation: MSc. (Econ.)
Representing the Board of Directors of Tieto Corporation:Kurt Jofs
The SNB decided that Martin Oliw shall act as Chairman. The SNB convened three times and provided Tieto's Board of Directors on 22 January 2019 with its proposals for the AGM 2019. The SNB proposes to the Annual General Meeting that the Board of Directors shall have eight members and that the current Board members Kurt Jofs, Harri-Pekka Kaukonen, Timo Ahopelto, Liselotte Hägertz Engstam, Johanna Lamminen and Endre Rangnes be re-elected and in addition, Tomas Franzén and Niko Pakalén are proposed to be elected as new Board members. Jonas Synnergren has informed that he is not available for re-election. The Shareholders’ Nomination Board proposes that Kurt Jofs shall be re-elected as the Chairman of the Board of Directors.
The biographical details of the candidates and information on their holdings in Tieto are available on the company’s website at www.tieto.com/cv.
The Shareholders’ Nomination Board proposes that the remuneration of the Board of Directors will be annual fees as follows: EUR 98 000 (current EUR 91 000) to the Chairman, EUR 58 000 (current EUR 55 000) to the Deputy Chairman and EUR 38 000 (current EUR 36 000) to the ordinary members of the Board of Directors. The same fee as to the Board Deputy Chairman will be paid to the Chairman of Board Committee unless the same individual is also the Chairman or Deputy Chairman of the Board. In addition to these fees it is proposed that the Deputy Chairman and ordinary members of the Board of Directors be paid EUR 800 for each Board meeting and for each permanent or temporary committee meeting. It is the company’s practice not to pay fees to Board members who are also employees of the Tieto Group.
The Shareholders’ Nomination Board is of the opinion that increasing long-term shareholding of the Board members will benefit all the shareholders. Every member of the Board of Directors is expected to over a five year period accumulate a shareholding in Tieto that exceeds his/hers one-time annual remuneration. The Shareholders’ Nomination Board therefore proposes that part of the fixed annual remuneration may be paid in Tieto Corporation’s shares purchased from the market. An elected member of the Board of Directors may, at his/her discretion, choose to receive the fee from the following five alternatives:
(i) No cash, 100 percent in shares(ii) 25 percent in cash, 75 percent in shares(iii) 50 percent in cash, 50 percent in shares(iv) 75 percent in cash, 25 percent in shares, or(v) 100 percent in cash, no shares.
The shares will be purchased in accordance with an acquisition program prepared by the company. If the remuneration cannot be paid in shares due to insider regulation, termination of the Board member’s term of office or other reason relating to the member of the Board, the remuneration shall be paid fully in cash.
66Annual report 2018
Creating valueTieto 2018 Governance Financials Sustainability

The Board of Directors
It is the general obligation of Tieto’s Board of Directors to safeguard the interests of the company and its shareholders.
Composition and election of Tieto’s Board of Directors
According to Tieto’s Articles of Association, the Board of Directors shall consist of at least six and no more than twelve members. Board members have a term of office of one year, expiring at the closing of the first AGM following the election.
The company has defined as an objective that in addition to professional competence, Tieto’s Board members shall be diversified in terms of gender, occupational and professional background and that the Board as a group shall have sufficient knowledge of and competence in, inter alia, the company’s field of business and markets.
The SNB, which consists of representatives nominated by the company’s largest shareholders, prepares a proposal on the composition of the Board to be presented to the AGM for its decision. In addition to the Board of Directors having established the diversity principles and included them in the Board charter, the company has taken steps to ensure that the principles have been included in the charter of the SNB and taken into account in the candidate search. The ratio of gender diversity of the members elected by the AGM has remained stable since 2012 and been either 2:6 or 2:5 (approximately 29% female and 71% male members).
In addition to the members proposed by the SNB and elected by the AGM, Tieto’s personnel elects two members and two deputy members to the Board of Directors. The term of office for the personnel representatives is two years. This special appointment procedure is a departure from Recommendation 5 “Election of the Board of Directors” of the Corporate Governance Code 2015. Personnel representation is based on the Finnish Act on Personnel Representation in the Administration of Undertakings and was originally agreed between Tieto Corporation and the personnel of the Group by way of a Personnel Representation Cooperation Agreement in 2001.
The objectives of personnel representation are, inter alia, to provide opportunities for the personnel to influence and affect the organization, to improve communication and decision making within the Group, to increase mutual trust and confidence between corporate management and the personnel as well as to increase and develop the feeling of security among the personnel. The personnel representatives, however, are not entitled to participate in the handling of matters that concern the appointment or dismissal of corporate management, the contractual terms of the management, the terms of employment of staff or matters related to industrial actions.
67Annual report 2018
Creating valueTieto 2018 Governance Financials Sustainability

Board of Directors as at 31 December 2018
Name Born Nationality Education Main occupation
Kurt Jofs (Chairman) 1958 Swedish MSc. (Eng.) Entrepreneur, investor and Board member
Harri-Pekka Kaukonen (Deputy Chairman) 1963 Finnish DSc. (Tech.) Professional Board member
Timo Ahopelto 1975 Finnish MSc. (Tech.) Entrepreneur, investor and Board member
Liselotte Hägertz Engstam 1960 Swedish MSc. (Civ. Eng.) Expert advisor, Board member
Johanna Lamminen 1966 Finnish DSc. (Tech.), MBA CEO, Gasum Ltd
Endre Rangnes 1959 Norwegian BBA (Econ.) Professional Board member
Jonas Synnergren 1977 Swedish MSc. (Econ.) Partner, Cevian Capital AB
Esa Koskinen (Personnel representative) 1955 Finnish MSc. (Econ.) Test Engineer
Robert Spinelli (Personnel representative) 1957 Swedish General Data Processing Customer Executive
Independence and attendance at Board and its committees’ meetings in 2018
Name Member sinceIndependent of
the companyIndependent of
shareholder BoardAudit and risk
committeeRemuneration
committeeTemporary
committees
Kurt Jofs 2010 yes yes 15/15 8/8
Harri-Pekka Kaukonen 2016 yes yes 15/15 7/7 6/6
Timo Ahopelto 2017 yes no 15/15 5/7 6/6, 1/1
Liselotte Hägertz Engstam1) 2018 yes yes 13/13 6/6 6/6
Johanna Lamminen 2016 yes yes 14/15 1/1 5/5 6/6, 1/1
Sari Pajari2) 2012 yes yes 2/2 3/3
Endre Rangnes 2014 yes yes 14/15 8/8 1/1
Jonas Synnergren 2012 yes no 15/15 7/7 1/1
Jonas Wiström2) 2017 yes yes 2/2 2/3
Esa Koskinen 2014 no yes 15/15
Anders Palklint3) 2014 no yes 2/2
Robert Spinelli4) 2014 no yes 13/13
1) Board member as from 22 March 2018.
2) Board member until 22 March 2018.
3) Personnel representative until 22 March 2018.
4) Personnel representative as from 22 March 2018. Prior to that, he served as the deputy member.
68Annual report 2018
Creating valueTieto 2018 Governance Financials Sustainability

All Board members elected by the AGM of Tieto are independent of the company and five out of seven members are independent of the company’s significant shareholders. The independence of the members is evaluated at the Board’s constitutive meeting. The Board members shall inform the Board if any changes in these circumstances occur, in which case their independence will be re-evaluated.
More detailed background information regarding the Board members, such as working experience, past and present positions of trust and the Remuneration Statement, is presented on the company’s website at www.tieto.com/investors.
Tasks of Tieto’s Board
The main duties and working principles of the Board have been defined in a written charter. Additionally, the work of the Board is based on an annual action plan.
More specifically, the Board:• approves the company’s values, strategy and organizational structure• defines the company’s dividend policy• approves the company’s annual plan and budget and supervises their implementation• monitors management succession issues, appoints and discharges the President and CEO• decides on the President and CEO’s compensation, sets annual targets and evaluates their
accomplishment• decides on the compensation of the President and CEO’s immediate subordinates• addresses the major risks and their management at least once a year• reviews and approves interim reports, annual reports and consolidated financial statements• reviews and approves the company’s key policies• is accountable for guiding the organization’s strategy on environmental and social topics
• meets the company’s auditors at least once a year without the company’s management• appoints the members and Chairmen of the Board’s committees and defines their charters• reviews assessments of its committees as well as the President and CEO• evaluates its own activities.
Work of Tieto’s Board
The Board has scheduled meetings every one to two months. Besides the Board members, the meetings are attended by the President and CEO, Chief Financial Officer (CFO) and General Counsel, who acts as secretary of the meetings. In addition to the scheduled meetings, the Chairman shall convene the Board whenever needed as well as at the request of any of its members or the President and CEO.
Matters to be handled are prepared by the Board committees and the President and CEO. The Board receives information on the company’s financial performance monthly and more detailed financial reports quarterly. Any material related to issues to be handled by the Board is provided four days prior to the meeting. Other case-specific materials are delivered at the management’s initiative or the Board’s request. Board members shall be informed about all significant company events immediately.
Work of Tieto’s Board in 2018
• The Board convened 15 times in 2018 and the average attendance was 98.8%.• The Board met five times during the year without the management present.• The Board held one joint meeting with the auditors.• The Board met the auditors once without the presence of the management.
69Annual report 2018
Creating valueTieto 2018 Governance Financials Sustainability

Assessment of the Board
The performance of Tieto’s Board is assessed annually; the latest assessment was carried out together with an external consultant in late 2018. Assessments review the Board’s knowledge of the company’s operations and management as well as its understanding of the field of business.
Additionally, the effectiveness of the Board work is evaluated. The SNB is informed of the results, which are also taken into consideration when the Board draws up its next annual plan.
Board committees
Tieto’s Board is assisted by two permanent committees that prepare matters for which the Board is responsible. The Board defines the charters of the committees and decides on their composition. The Board establishes temporary committees whenever a subgroup is needed to prepare a specific topic. The entire Board remains responsible for the duties assigned to the committees.
Remuneration Committee
The Remuneration Committee (RC) comprises at least three non-executive directors elected by the Board. The majority of the members shall be independent of the company. The head of Human Resources (HR) acts as secretary of the meetings. In 2018, all committee members were non-executive directors who were independent of the company and of significant shareholders. Based on the Board’s decision, the RC was composed of:
• Kurt Jofs (Chairman)• Johanna Lamminen• Endre Rangnes
The committee meets regularly and at least twice a year. The Chairman of the committee reports to the Board when applicable. The main tasks of the committee are to:
• monitor the targets of the compensation schemes, implementation of the compensation schemes, performance assessment and compensation determination
• ensure that the targets set for earning the bonuses defined in the compensation scheme are met
• prepare a proposal for the Deputy Chairman of the Board• prepare a proposal on the committees (members and Chairmen, and the duties and
responsibilities of the committees)• monitor corporate governance• prepare a compensation proposal concerning the President and CEO and his immediate
subordinates, and the principles of personnel compensation• prepare for the Board option schemes and other share-based incentive schemes• evaluate the performance of the President and CEO• prepare the assessment of the Leadership Team• prepare a proposal on the Board’s charter.
Work of Tieto’s RC in 2018
• The committee convened eight times in 2018 and the average attendance was 93.4%• In addition to the normal responsibility within the scope of its Charter, the committee
concentrated on reviewing, and developing remuneration of the company. The committee also followed the functioning of short and long-term incentive plans to ensure that they supported the achievement of the objectives.
70Annual report 2018
Creating valueTieto 2018 Governance Financials Sustainability

Audit and Risk Committee
The Audit and Risk Committee (ARC) comprises at least three non-executive directors who are independent of the company and out of whom at least one member shall be independent of the significant shareholders. The Chairman and the members are elected by the Board. At least one committee member must have expertise in accounting, bookkeeping or auditing. Tieto’s Deputy General Counsel acts as secretary of the meetings.
In 2018, all committee members were non-executive directors who were independent of the company and two of them independent of significant shareholders. All members have extensive experience in corporate management and financial issues and therefore have the required expertise.
Based on the Board’s decision, the ARC was composed of• Harri-Pekka Kaukonen (Chairman)• Timo Ahopelto• Liselotte Hägertz Engstam• Jonas Synnergren
The committee convenes regularly at least four times a year and meets the company’s auditors, also without the company’s management present. The Chairman of the committee reports to the Board when applicable. The main tasks of the committee are to:
• review and supervise internal control – particularly the financial reporting process – and risk management issues
• discuss and review the interim and annual reports and the consolidated financial statements• assess compliance with legislation, official regulations and the company’s Code of Conduct• evaluate the sufficiency of internal control and the internal audit• examine, assess and approve the internal audit plan• assess the appropriate coverage of risk management and monitor the efficiency of risk
management• review significant risks and unusual business events• prepare for the Board's decision a proposal for the AGM on the nomination of external
auditors and their compensation• evaluate the external auditors’ independence, assess the audit plan and examine the audit
reports • monitor the statutory audit and consult with the auditors regarding matters that should be
brought to the Board’s attention.
Work of Tieto’s ARC in 2018
• The committee convened seven times in 2018 and attendance was 92.9%.• In addition to its regular agenda, the committee followed up progress in project and delivery
management and quality issues as well as arranged the statutory auditor selection process for financial year 2019.
71Annual report 2018
Creating valueTieto 2018 Governance Financials Sustainability

The President and CEO and operative managementTieto Group’s operative management consists of the President and CEO, the Leadership Team and the Industry Group, Service Line and Product Development Services (PDS) organizations. The Industry Solutions Service Line includes the New Data-Driven Businesses unit organized independently of other businesses.
The President and CEO is appointed by the Board and he is responsible for the Group’s operative management, internal efficiency and quality.
The President and CEO is assisted by the Leadership Team, which includes the heads of Industry Groups and Service Lines, head of New Data-Driven Businesses, the CFO and the head of HR. Appointments of Leadership Team members are approved by the Chairman of the Board based on the President and CEO’s proposal.
The Leadership Team members are accountable for the performance and development of their management areas and they supervise the operations of the units belonging to their areas. As a general rule, the business units in both management dimensions (Industry Groups, Service Lines and PDS) make their own operative decisions and are responsible for conducting their operative duties.
The Industry Group, Service Line and PDS organizations have a profit and loss responsibility. Further, the Leadership Team also monitors the company’s sustainability performance and approves the sustainability goals in cooperation with the Board of Directors.
Members of the Leadership Team as at 31 December 2018
Kimmo Alkio President and CEO Born: 1963 Nationality: FinnishEducation: BBA and Executive MBA Joined the company in 2011
Håkan DahlströmExecutive Vice President, Technology Services and ModernizationBorn: 1962 Nationality: Swedish Education: MSc. (Eng.)Joined the company in 2014
Ari JärveläExecutive Vice President, New Data-Driven Businesses,Business Consulting and ImplementationBorn: 1969Nationality: Finnish Education: MSc. (Eng.)Joined the company in 2001
72Annual report 2018
Creating valueTieto 2018 Governance Financials Sustainability
Satu KiiskinenExecutive Vice President, Industrial and Consumer ServicesBorn: 1965 Nationality: FinnishEducation: MSc. (Econ.) Joined the company in 2013
Katariina KraviExecutive Vice President, Human Resources Born: 1967Nationality: FinnishEducation: LL.M., trained on the bench Joined the company in 2012
Tom LeskinenExecutive Vice President, Product Development ServicesBorn: 1966 Nationality: FinnishEducation: LicSc. (Tech.) Joined the company in 2013
Cristina PetrescuExecutive Vice President, Public, Healthcare & WelfareBorn: 1968 Nationality: SwedishEducation: MSc. (Computer Science) Joined the company in 2002
Janne Salminen1)
Acting Chief Financial Officer Born: 1964 Nationality: FinnishEducation: MSc. (Econ.) Joined the company in 2009
Christian SegersvenExecutive Vice President, Financial ServicesBorn: 1975 Nationality: FinnishEducation: MSc. (Tech.) Joined the company in 2013
Markus SuomiChief Technology OfficerBorn: 1971 Nationality: FinnishEducation: MSc. (Eng.) Joined the company in 2018
The remuneration of the Leadership Team is presented in the tables of the Remuneration Statement. More detailed background information, such as full CVs of the Leadership Team, is presented on the company’s website at www.tieto.com/investors.
1) Lasse Heinonen acted as the CFO until 17 July 2018. Tomi Hyryläinen started as the new CFO in February 2019.
73Annual report 2018
Creating valueTieto 2018 Governance Financials Sustainability

Internal control and risk managementTieto’s internal control framework supports the execution of the strategy and ensures regulatory compliance. The foundation for internal control is set by the risk management framework, financial control, internal audit and supporting policies.
The aim of Tieto’s internal control framework is to assure that operations are effective and well aligned with the strategic goals. The internal control framework is intended to ensure correct, reliable, complete and timely financial reporting and management information. The framework endorses ethical values, good corporate governance and risk management practices. The
Q1
Q3
Q2Q4
Risk sections in Annual Reporting
Responsible: CRO
Review of compliance risks
Responsible: CRO, Compliance Officer and Chief IA
Status report of Internal Audit Plan
Responsible: Chief IA
ARC review of risk maps and internal control
Responsible: CRO
IA Annual Report. Review of IA plan
Responsible: Chief IA
ARC review of strategic risks
Responsible: CEO/CROARC review of financial risks
Responsible: CFO
Review of operational risksProject and delivery risks in each
ARC meetingResponsible: CRO, Head of Quality
Risk section in interim reportsResponsible: CRO
CRO: Chief Risk Officer
IA: Internal Audit
activities related to internal control and risk management are part of Tieto’s management practices and integrated into the business and planning processes.
Risk Management Framework
Tieto uses systematic risk management to develop the efficiency and control of business operations as well as their profitability and continuity.
74Annual report 2018
Creating valueTieto 2018 Governance Financials Sustainability

The risk management framework consists of the risk management organization, related policies, operating principles, processes and tools. The risk management organization develops and maintains the company’s risk management framework, including risk reporting, risk management governance and follow-up of risk exposures consisting of strategic, financial, operational and compliance risks.
The risk management organization consists of a central group wide unit and virtual team, whose members are located in the different units.
Each process owner is responsible for the continuous development and improvement of the established procedures, including controls and risk management. The Chief Risk Officer (CRO) has the responsibility to arrange and lead Tieto’s risk management. The Internal Audit (IA) assures the efficiency of the framework and risk management in business operations. The ARC monitors the adequacy of the company’s risk management, financial control, and internal audit functions.
Tieto has also specified its compliance management system, including the compliance organization, steering model and annual plan for compliance-related activities. The Group Compliance Officer is responsible for ensuring the effectiveness and functionality of the governance model and coordinating the compliance work. In 2018, the existing Tieto internal Compliance Board was extended to include Privacy and Security and renamed to Privacy, Security and Compliance Board.
Continuous development of the risk framework
During 2018 the main improvements were implementation and launch of Audit Management module to the GRC platform, also a new version of Privacy Risk Assessment module was implemented and launched during the year.
With the audit management system Tieto gets improved online visibility of the audits from planning to closure regarding scope, time plan, findings and reports to the stakeholders. The system covers Quality, Security, ISO, ISAE and both internal and external audits.
In addition, the company enhanced the Security incident management system that was introduced in 2017, to integrate it better to Tieto Internal SOC/CERT way of working.
The development of the risk management framework is carried out in close cooperation with Risk Coaches, Security Managers, Quality Partners and persons responsible for Privacy in the units and approved by the Tieto Leadership Team and validated by the ARC.
Financial control
The purpose of internal control over financial reporting is to ensure the correctness of financial reporting, including interim and annual reports and the compliance of financial reporting with regulatory requirements.
The ARC has the oversight role in Tieto’s external financial reporting.
75Annual report 2018
Creating valueTieto 2018 Governance Financials Sustainability

Financial reporting process and responsibilities
Tieto has a common accounting and reporting platform. Group consolidation and reporting are based on the reporting system, which facilitates common control requirements for all legal entities reporting to the Group. Tieto does continuous improvements to the common accounting and reporting platform to accommodate the internal needs and new regulatory requirements.
Financial reporting consists of monthly performance reports, including all the key performance indicators, rolling forecasts and interim financial reports.
Financial reports are regularly reviewed by Finance Partners in the units, the Leadership Team and the Board of Directors. The follow-up is based on a thorough comparison of the actual figures with the set objectives, forecasts and previous periods. If the figures deviate, the Leadership Team members are responsible for initiating corrective actions.
Internal audit
Tieto’s Internal Audit function carries out both business- and control-related audit activities.
Business audit activities aim to ensure the efficiency and appropriateness of Tieto’s operations. Control-related audit activities are intended to assess and assure the adequacy and effectiveness of internal controls and the risk management framework within Tieto. Internal audits are planned and carried out independently but in coordination with other control functions and the external auditors. Audits can also be initiated due to escalations/whistleblowing, fraud attempts, misconducts or other breaches of laws or the company’s policies and rules. Internal Audit reports to the Chief Financial Officer (CFO), the President and CEO and the ARC. The annual audit plan and the annual internal audit report are approved by the ARC.
Major risksTieto has four risk categories: strategic, operational, financial and compliance risks.
Strategic risks are related to market volatility, IT market transformation to new technologies (including the rapid digitalization and automatization of society), change management, reskilling ability and speed, agility to respond to new entrants in the market, dependencies on few big customers in some business areas and ensuring delivery quality in the dynamic business environment.
Operational risks refer to changing the business model in business units, risk and continuity management, customer bidding and requirement analysis and maintaining a high professional standard in delivery management and quality assurance.
Financial risks mainly consist of credit risks, currency risks, interest rate risks and liquidity risks.
Compliance risks are connected to the organization failing to recognize or meet the requirements in the areas of legislation or other mandatory regulation (e.g. new General Data Protection Regulation, anti-corruption, anti-bribery, insider matters, sanctions and trade compliance), internal policies and rules or ethics and integrity.
Risks are aggregated by utilizing the corporate GRC platform, resulting in risk maps that are reviewed by Leadership Teams in the units and the ARC. Tieto’s major risks and the measures for their mitigation are described below.
76Annual report 2018
Creating valueTieto 2018 Governance Financials Sustainability

Market volatility
Changes in the Nordic core markets have a direct effect on market conditions and result in volatility that might have a negative impact on Nordic market growth. Changes in the economic environment and customer demand can affect both business volumes and price levels, which might result in lower income or slower income growth than expected.
These potential impacts are partly mitigated through multi-year contracts for continuous services. Tieto also aims to maintain long-term business relations and to be a preferred supplier to its key customers, including full stack IT deliveries. The company executes tight cost and investment control with continuous investment performance monitoring, accompanied with a clear structure for decision rights, which are defined in the Operative Decision Making and Authority Policy and Leadership Team Member Delegation Rights Rule.
Global service capabilities, cross-selling and tough price competition are the main drivers in the IT sector for the development of the global delivery model. Tieto’s position as a leading enterprise cloud service provider in the Nordics is supported by existing and enhanced competencies, and by the choice of right partners.
Change and transformation
In large-scale adaptation to the market by organizational transformation and right-sizing, resistance to change can prolong the transition, which may affect operational efficiency long after the change.
The change management capacity is concentrated in a common programme management office (PMO), which provides standard tools and systems for the change, including communication, target setting and training for the transition period of strategy execution. PMO can also be used to plan reskilling, staffing and retention to respond to challenges from new entrants in the market.
The Results Management Office (RMO) sets common standards in project management and it is used to ensure compliance in project financials management and follow-up.
As a very large share of Tieto’s sales and the majority of profits are generated in Finland, the company’s high market share in this country means that achieving growth there is challenging, but possible. Sweden is the second-biggest market and generates a significant portion of the growth. Additionally, around half of our current consulting-type revenue is from short-term contracts, but a strong order backlog compensates for this.
Sudden changes in the market environment, customer demand and customer strategies or the competitive landscape in these areas might harm Tieto’s operations and profitability.
To diversify the business, Tieto also provides services to several different industries and aims to develop its business mix with a view to providing full stack IT services / new hybrid cloud solutions and thereby strengthen its position amongst both current and new customers. An industrialized and standardized approach to providing services and solutions, employing automated processes, is a means of improving competitiveness and reducing the risk.
Service continuity
Close to 100% availability is the basis of trust among customers, stakeholders and society. Thus, business continuity planning is a high priority in Tieto’s operational management in order to ensure that redundancy and fault tolerance are at the appropriate level.
To reduce the service continuity risk and to better understand the interdependencies in data centres, Tieto constantly reviews, maintains and improves its IT asset management, configuration management and monitoring systems. In addition to a comprehensive business interruption insurance portfolio, Tieto has recovery procedures and backup systems in place to handle potential service interruptions. Root cause analysis, best practices and experiences from previous incidents help in preparing for and mitigating service continuity risk.
Also, a comprehensive and robust Major Incident Management process reduces service interruptions.
77Annual report 2018
Creating valueTieto 2018 Governance Financials Sustainability

Quality costs related to customer bidding and delivery management
Inability to appropriately understand and analyse customers’ changing needs, their business processes and the exact requirements can lead to misjudgements in setting the scope of projects or services and, consequently, difficulties in meeting the specifications of customer agreements. This in turn can result in project overruns, operating losses or termination of customer contracts.
Tieto continuously gathers customer feedback to establish the requirement baselines and checklists for different business areas. Continuous improvement of the bid risk management, requirement analysis, delivery management and the quality assurance of the deliveries are carried out to mitigate the risk. Also, a specific risk management framework is used for better understanding of customer bidding and end-to-end risks, from sales to the closure of the delivery. In case of changes in customers’ business requirements, it is contractually agreed that the consequent changes in project deliveries are managed throughout the project organization in a standardized manner.
Retention of employees
Fresh competition and demand for new services require ability and speed to reskill, attract new and retain existing competences and business knowledge for new service models and offerings. Tieto’s success builds on passion, innovation, attracting talent, skills renewal, business knowledge and the maturity of the organization. In addition, the performance of its employees and managers both locally and in its delivery centres worldwide is key to its success.
Inability to retain key employees and to recruit new talent with the required competence might have a negative impact on the company’s performance and strategy implementation. High employee turnover might also cause delays in customer projects, leading to penalties or loss of customer accounts.
To reduce these risks, Tieto implements unified delivery models across sites and offers its employees challenging jobs, diverse development possibilities, social recognition and training opportunities as well as interesting career paths through job rotation. Furthermore, the company has competitive compensation packages, including a company-wide incentive system. Attractive recruitment tools, strategies, talent management and competence development have a high strategic priority at Tieto. The company also focuses on Employer Branding to build and strengthen Tieto’s image as an attractive employer both internally and externally.
Credit risks
Changes in the general market environment and global economy can usher in additional financial risks. Credit risks might arise if customers or financial counterparties are not able to fulfil their commitments towards Tieto.
Under Tieto’s Credit Policy, the finance department together with the business organization is responsible for assessing customers’ creditworthiness, taking into account past experience, their financial position and other relevant factors. Credit risk regarding financial counterparties is managed by using counterparty limits, as set out in Tieto’s Treasury Policy.
A special focus has been put on raising awareness of credit risks with additional reporting and training processes. The collection process has been adjusted as part of the activities aiming at credit management improvement.
Currency risks
Tieto’s currency transaction exposure arises from foreign trade, cash management and internal funding in foreign currencies. Translating the balance sheets and income statements of Group companies into euros creates a translation exposure.
78Annual report 2018
Creating valueTieto 2018 Governance Financials Sustainability

As a substantial proportion of the Group’s consolidated revenues are generated in Sweden, fluctuations of the Swedish krona against the euro may have an impact on the consolidated financial statements.
Tieto’s Treasury Policy defines the principles and risk limits under which Group Treasury manages currency risks.
Liquidity risks
Exceptional market conditions in the financial market might impose temporary limitations on raising new funding and lead to an increase in funding costs.
Group Treasury monitors and manages Tieto’s liquidity position by maintaining a sufficient loan and investment portfolio. Analyses of alternative financing sources for the company and their pricing are continuously updated. Tieto’s financial risks are described in full in the notes to the consolidated financial statements.
Governance of risk and compliance
At Tieto, governance, risk, and compliance (GRC) are closely linked and consistently defined in corporate policies and rules with proper controls. In the finance function, for example, financial reporting, compliance and risk monitoring are efficiently integrated into daily operations. Thanks to automated processes, Tieto can readily adapt to changes in business conditions, regulations or corporate policy with the necessary risk management controls.
Tieto has invested in process automation, which is seen as a way to improve quality and reduce costs. Well-drafted policies and rules are made available to assure that the implications of automation on risk and compliance are fully understood by all parties in the organization.
Related-party transactionsTieto discloses the information concerning related-party transactions in the report by the Board of Directors and notes of the consolidated financial statements.
Further, the company evaluates, and monitors transactions concluded between the company and its related parties and seeks to ensure that any conflicts of interest shall be taken into account in the decision making. The related-party transactions are summarized in note 28 of the consolidated financial statements. Tieto does not currently consider the related-party transactions material from the perspective of the company.
Furthermore, such transactions neither deviate from the company’s normal business operations nor are they made on terms that deviate from market equivalent.
79Annual report 2018
Creating valueTieto 2018 Governance Financials Sustainability

Insider administrationTieto follows Nasdaq Helsinki’s Rules of the Exchange and Guidelines for Insiders. In addition, Tieto’s Board of Directors has adopted an internal Tieto Insider Rule.
Tieto has specified that the Board of Directors and the President and CEO of the parent company Tieto Corporation are subject to the requirement to notify their transactions. In addition, Tieto has set restrictions on trading for the members of the Leadership Team, persons participating in the preparation of interim reports and consolidated financial statements as well as other persons who are considered to receive information of a confidential and sensitive nature in their position or service. The managers and other persons subject to trading restrictions are prohibited from dealing in Tieto’s shares or other financial instruments during the closed period. The closed period covers 30 calendar days before the disclosure of an interim financial report or a financial statement release including the date of disclosure (= 30 + 1 days).
At Tieto, the General Counsel is in charge of insider administration. Tieto’s Legal department shall monitor the compliance with the insider regulation and takes care of necessary guidance and training.
AuditorsThe ARC prepares a proposal on the appointment of Tieto’s auditors, which is then presented to the Board and finally to the AGM for its decision. The compensation paid to the auditors is decided by the AGM and assessed annually by the ARC.
The Board of Directors proposes to the Annual General Meeting, in accordance with the recommendation of the Audit and Risk Committee of the Board of Directors that the auditor to be elected at the AGM 2019 be reimbursed according to the auditor's invoice and in compliance with the purchase principles approved by the Committee.
The Board of Directors proposes to the Annual General Meeting, in accordance with the recommendation of the Audit and Risk Committee of the Board of Directors, that the firm of authorized public accountants Deloitte Oy be elected as the company's auditor for the financial year 2019. The firm of authorized public accountants Deloitte Oy has notified that Jukka Vattulainen, Authorized Public Accountant, will act as the auditor with principal responsibility.
Auditing
The AGM 2018 re-elected the firm of authorized public accountants PricewaterhouseCoopers Oy as the company’s auditor for the financial year 2018. PricewaterhouseCoopers Oy notified the company that Authorized Public Accountant Tomi Hyryläinen acts as principal auditor. Due to the appointment of Tomi Hyryläinen as Tieto’s CFO as from February 2019, PricewaterhouseCoopers Oy resigned from the audit assignment for the financial year 2018. The Finnish Patent and Registration Office designated Deloitte Oy as the new auditor. Authorized Public Accountant Jukka Vattulainen has acted as the auditor with principal responsibility.
In 2018, Tieto Group paid the auditors a total of EUR 1.1 (0.8) million in audit fees, of which EUR 0.8 (0.8) million to the Group’s auditor PricewaterhouseCoopers and 0.3 (-) million to Deloitte, and a total of EUR 0.8 (0.3) million for other services, of which EUR 0.6 (0.3) million to the Group’s auditor PricewaterhouseCoopers and 0.2 (-) to Deloitte.
80Annual report 2018
Creating valueTieto 2018 Governance Financials Sustainability

Remuneration StatementThe aim of Tieto’s remuneration principles is to attract and retain talent, motivate key people and align the goals of the company’s shareholders and executives in order to enhance the value of the company.
Rules on how the company shall compensate its employees are defined in Tieto’s HR Policy and related rules. The policy is globally applied to all Tieto entities and units to support the company’s strategy, objectives and values.
Remuneration of the Board of Directors is decided by the AGM based on a proposal by the SNB. The RC is responsible for planning the remuneration of the Leadership Team members and preparing the principles underlying the remuneration of Tieto personnel. The Board of Directors decides on the remuneration of the President and CEO and other members of the Leadership Team based on a proposal by the RC.
Remuneration of the Board
According to the decision of AGM 2018, the annual remuneration of the Board of Directors is the following:
• EUR 91 000 to the Chairman,• EUR 55 000 to the Deputy Chairman and• EUR 36 000 to the ordinary members of the Board of Directors.
The same fee as to the Board Deputy Chairman will be paid to the Chairman of the Board Committee unless the same individual is also the Chairman or Deputy Chairman of the Board. In addition, remuneration of EUR 800 is paid for each Board meeting and each permanent or temporary committee meeting.
Further, the AGM 2018 decided that 40% of the fixed annual remuneration will be paid in Tieto Corporation's shares purchased from the market. No restrictions have been set on Board members concerning how they may assign these shares, but the company recommends that Board members should retain ownership of all the shares they have received as remuneration for as long as they serve on Tieto’s Board.
In addition to the aforementioned share remuneration, the Board members do not belong to or are not compensated with other share-based arrangements, nor do the members have any pension plans at Tieto. Tieto executives or employees are not entitled to compensation for their Board positions or meeting attendance in the Group companies. None of the Board members, except the personnel representatives, have an employment relationship or service contract with Tieto.
81Annual report 2018
Creating valueTieto 2018 Governance Financials Sustainability

Compensation of individual Board members and Board in 20181)
Annual remunerationName EUR (60%)2) Shares (40%)3) Meeting based, EURKurt Jofs (Chairman and RC Chairman) 54 600 1 219 15 200Harri-Pekka Kaukonen (Deputy Chairman and ARC Chairman) 33 023 736 19 200Timo Ahopelto 21 607 482 18 400Liselotte Hägertz Engstam4) 21 607 482 17 600Johanna Lamminen 21 607 482 18 400Sari Pajari5) N/A N/A 3 200Endre Rangnes 21 607 482 15 200Jonas Synnergren 21 607 482 15 200Jonas Wiström5) N/A N/A 2 400In total EUR 195 661 4 365 shares EUR 124 800
Board of Directors' shareholdings in Tieto6)
Name At 31 Dec 2018 At 31 Dec 2017Kurt Jofs (Chairman, RC Chairman) 14 930 13 711Harri-Pekka Kaukonen (Deputy Chairman and ARC Chairman) 2 079 1 343Timo Ahopelto 982 500Liselotte Hägertz Engstam4) 482 N/AJohanna Lamminen 1 560 1 078Sari Pajari5) N/A 4 096Endre Rangnes 2 835 2 353Jonas Synnergren 4 578 4 096Jonas Wiström5) N/A 500
1) The Board members have not received any other benefits.2) Gross compensation before taxes.3) Shares were purchased and delivered in May 2018.4) Board member as from 22 March 2018.5) Board member until 22 March 2018.6) Corporations over which the Board members exercise control did not have shares or share-based rights on 31 December 2018.
82Annual report 2018
Creating valueTieto 2018 Governance Financials Sustainability

Summary of Remuneration of the Tieto Leadership Team
Element Purpose Description
Salary Recognizes of continuous daily contribution Fixed compensation for performing defined job responsibilities. In addition to monthly salary, car and mobile phone benefits can be paid as per company policy. Salary is reviewed annually based on individual’s performance and salary market condititions.
Short-term incentives Rewards for company and individual performance
Cash-based plan rewarding for the short term (12-month) company and individual success. The bonus for the President and CEO is 50% and for other Leadership Team members 40% of the annual base salary when the performance is at expected level; the maximum bonus for the President and CEO is 100% and for the other Leadership Team members 75%. The amount of bonuses is decided by the Board of Directors after the consolidated financial statements have been prepared. Weighting of the reward factors for the President and CEO and other Leadership Team members is described in a separate table. The reward targets are set annually by the Board of Directors.
Long-term incentives Encourages ownership culture Share-based plans reward leadership and key employees for company growth and achievement of defined strategic goals. LTI plans are annually commencing plans with three-year performance period. Key principles of Tieto’s share plans, such as the basis and size of rewards, are described on the company’s website at www.tieto.com/investors.
Additional pension Provides appropriate retirement benefits President and CEO: defined contribution (DC) plan where the expenditure is 23% of the annual base salary. Retirement age is 63. Other Leadership team members based in Finland have DC plan where the expenditure is 15% of the annual base salary. Leadership team members based outside Finland are provided with individual pension plans according to local practices. Retirement ages are according to applicable local regulations.
Claw back Ensures pay for performance Claw back provisions apply to STI and LTI plan rewards in exceptional circumstances such as misconduct or misstatement of financial results.
Share ownership Encourages to build meaningful shareholding in Tieto
The recommended minimum investment in the company's shares corresponds to the executive's one-time annual gross base salary.
Service contracts and severance pay
Provides for clear contractual terms President and CEO: if agreement is terminated by Tieto, notice period is twelve months. In the event of termination company shall pay a severance payment equivalent to the base salary and the short-term target incentive for six months in addition to the salary for the notice period. If agreement is terminated by the President and CEO, notice period is six months. Change of control terms are the same as in termination except for the monetary value of the maximum amount of shares granted to him in the most recent long-term incentive plan in addition to the salary for the notice period. For other Leadership Team members termination term vary, amounts correspond to the periods of notice.
83Annual report 2018
Creating valueTieto 2018 Governance Financials Sustainability

Share-based long-term incentives
The terms and conditions of all share-based plans are approved by the Board of Directors.
Long-Term Incentive Plan (LTI) 2015–2017 covered 106 key employees, including Leadership Team members. The plan consists of Performance Shares and Restricted Shares. The performance period was three years from 1 January 2015 to 31 December 2017. Share delivery took place in spring 2018.
Long-Term Incentive Plan (LTI) 2016-2018 covers Leadership Team members and key employees, total 106 participants. The LTI plan consists of Performance Share and Restricted Share Plans. A participant can belong to both share plans or to one plan only. The performance period is three years from 1 January 2016 to 31 December 2018. If the set performance metrics and other requirements are met the shares will be delivered to the participants in spring 2019.
Long-Term Incentive Plan (LTI) 2017-2019 covers Leadership Team members and key employees, total 151 participants. The LTI plan consists of Performance Share and Restricted Share Plans. A participant can belong to both share plans or to one plan only. The performance period is three years from 1 January 2017 to 31 December 2019. If the set performance metrics and other requirements are met the shares will be delivered to the participants in spring 2020.
Long-Term Incentive Plan (LTI) 2018-2020 covers Leadership Team members and key employees, total 246 participants. The LTI plan consists of Performance Share and Restricted Share Plans. A participant can belong to both share plans or to one plan only. The performance period is three years from 1 January 2018 to 31 December 2020. If the set performance metrics and other requirements are met the shares will be delivered to the participants in spring 2021.
The authorizations required by the Board to repurchase the company’s own shares and to issue shares shall be proposed to be approved at the AGM on an annual basis. In connection with authorizing the Board to issue shares, the AGM 2018 decided that no more than 700 000 shares, corresponding to less than 1% of all of the shares in the company, may be issued as part of share-based incentive programmes.
Tieto has not established new option plans since AGM 2009. The last option programme 2009 expired when the subscription period for the 2009C series ended on 31 March 2016.
Pension plans
Tieto operates a number of different pension plans in accordance with national requirements and practices. In addition to statutory pension plans, the Leadership Team members are provided with additional pension schemes.
Currently, all additional schemes are classified as defined contribution plans.1) In contribution-based plans, the payments to the plans are recognized as expenses for the period to which they relate. After the payment of the contribution, the company has no further obligations in respect of such plans.
1) Last fund-based pension scheme was closed in August 2017.
84Annual report 2018
Creating valueTieto 2018 Governance Financials Sustainability

President and CEO
Kimmo Alkio
Salary 2018 (2017) EUR 637 500 (EUR 600 000).
Benefits 2018 (2017) EUR 3 366 (EUR 3 235)
Bonus 2018 (2017) Estimated EUR 440 194 (EUR 399 415 paid in 2018 for performance in 2017).
Basis of bonus 2018 Target 50% of base salary based on the Group's external revenue and profit, PDS external revenue and profit and strategy implementation when achievements meet the targets.Maximum 100% of base salary based on the Group's external revenue and profit, PDS external revenue and profit and strategy implementation when achievements exceed the targets.Weighting of the reward factors• Profit of the company and PDS 30%• External revenue of the company and PDS 40%• Strategy implementation 30%
Additional success-based incentive An additional success-based incentive can be paid to the President and CEO in 2020. The incentive is subject to Tieto reaching in 2019 challenging profitability targets (EBIT) set by the Board of Directors in accordance with the company’s renewed strategy and financial objectives.The maximum gross number of shares to be earned is 50 000, however not exceeding EUR 3 million. The payable incentive includes Tieto’s shares and a cash proportion for covering taxes and tax-related costs arising from the reward.
Long-Term Incentive Plan 2015–2017 In March 2018 based on criteria attainment a total of 9 950 shares were transferred to the President and CEO. In addition, a cash portion was paid corresponding to a value of 11 110 shares. The total value of paid gross reward was EUR 609 721.1)
Long-Term Incentive Plan 2016–2018 Entitled to 20 000 Performance Shares if the target levels of the performance metrics are met, 40 000 shares at maximum. The performance period of the plan is 2016-2018. The fair value of these allocations amounts to EUR 537 624.1)
Long-Term Incentive Plan 2017–2019 Entitled to 20 000 Performance Shares if the target levels of the performance metrics are met, 40 000 shares at maximum and 5 000 Restricted Shares. The performance period of the plan is 2017-2019. The fair value of these allocations amounts to EUR 617 796.1)
Long-Term Incentive Plan 2018–2020 Entitled to 22 881 Performance Shares if the target levels of the performance metrics are met, 45 762 shares at maximum. The performance period of the plan is 2018-2020. The share allocation equaled to 100% of annual base salary at the time of grant. The fair value of these allocations amounts to EUR 647 441.12
Expenditures related to share-based incentives EUR 660 246 (EUR 399 081)
Pension expenditure EUR 314 530 (EUR 277 593)2)
1) The fair market value for the Long-term Incentive Plans is calculated using the latest performance estimates and the value of the Tieto share on 31 December 2018, EUR 23.58.
2) Payments to defined contribution plans are recognized as expenses for the period to which they relate. After payment of the contribution the Group has no further obligations in respect of such plans.
Updated information on the shares and options held by the President and CEO is available on the company’s website at www.tieto.com/investors under the insider register.
85Annual report 2018
Creating valueTieto 2018 Governance Financials Sustainability

Remuneration of Leadership Team members
The table below summarizes the remuneration of the Leadership Team members.
Leadership Team (excluding the President and CEO)
Total salaries 2018 (2017) EUR 2 312 039 (EUR 2 789 836)
Total benefits 2018 (2017) EUR 115 178 (EUR 122 444)
Special payments 2018 (2017) EUR 0 (EUR 477 137 (Severance pay))
Total bonuses 2018 (2017) Estimated EUR 782 506 (EUR 825 218 paid in 2018 for performance in 2017).
Basis of bonus 2018 Target 40% of base salary, maximum 75% of the base salary. The purpose of the bonus is to reward for company performance and individual performance.These two form the overall performance evaluation (OPE). OPE for each LT member is confirmed by the Board.CFO: in addition to individual performance measurement, the bonus is based on company performance, measured by the following factors• Profit of the company• External revenue• Cash flow improvement
Other LT members: in addition to individual performance measurement, the bonus is based on• company and/or• own Industry Group- or Service Line-related performance criteria (operative margin, external revenue and other operational targets)
Long-Term Incentive Plan 2015–2017 In March 2018 based on criteria attainment a total of 25 292 shares were transferred to the Leadership Team members. In addition, a cash portion was paid corresponding to a value of 29 380 shares. The total value of paid gross reward was EUR 1 582 842.
Long-Term Incentive Plan 2016–2018 Leadership Team members are entitled to 81 000 Performance Shares if the maximum levels of the performance metrics are met and 9 000 Restricted Shares. The performance period of the plan is 2016–2018. The fair value of these allocations is EUR 1 300 909.1)
Long-Term Incentive Plan 2017–2019 Leadership Team members are entitled to 112 800 Performance Shares if the maximum levels of the performance metrics are met. The performance period of the plan is 2018–2020. The fair value of these allocations is EUR 1 595 894.1)
Long-Term Incentive Plan 2018–2020 Leadership Team members are entitled to 112 800 Performance Shares if the maximum levels of the performance metrics are met. The performance period of the plan is 2018–2020. The fair value of these allocations is EUR 1 595 894.1)
Expenditures related to share-based incentives EUR 1 727 068 (EUR 1 102 133)
Pension expenditure EUR 772 335 (EUR 1 058 548).2)
1) The fair market value for Long-term Incentive Plan 2016–2018, Long-term Incentive Plan 2017–2019 and Long-term Incentive Plan 2018–2020 is calculated using the latest performance estimates and the value of the
Tieto share on 31 December 2018, EUR 23.58.
2) Payments to defined contribution plans are recognized as expenses for the period to which they relate. After payment of the contribution the Group has no further obligations in respect of such plans.
86Annual report 2018
Creating valueTieto 2018 Governance Financials Sustainability
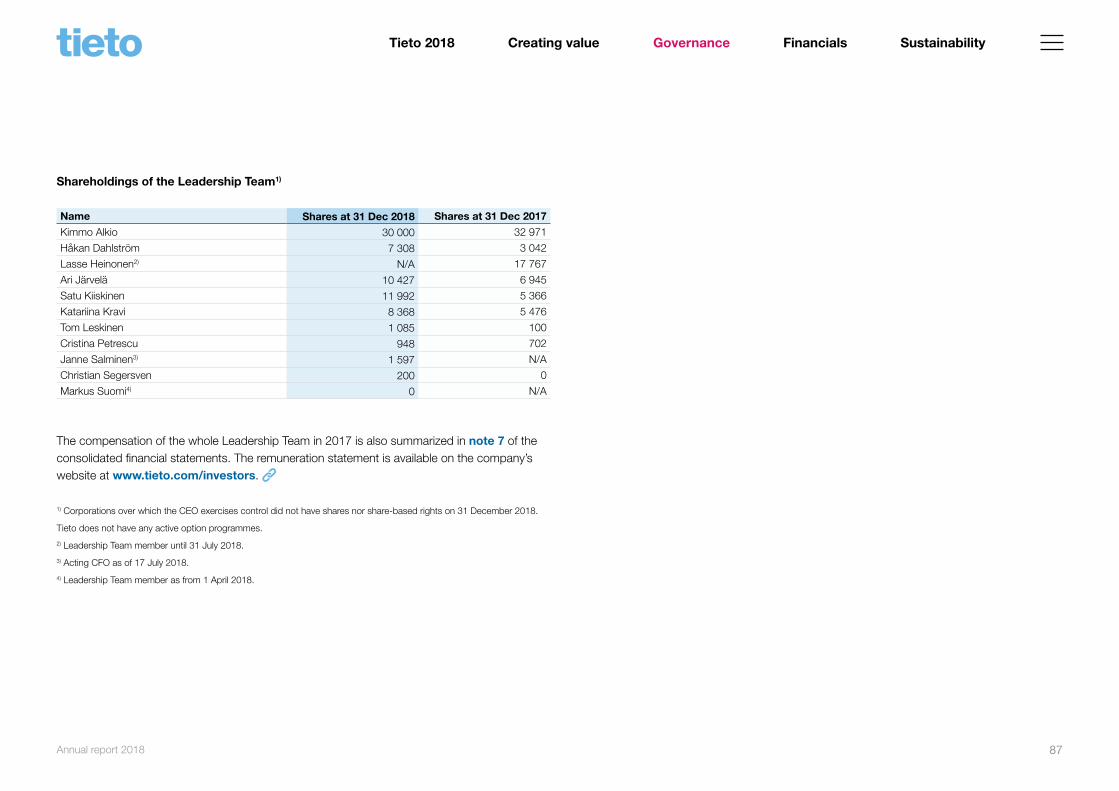
Shareholdings of the Leadership Team1)
Name Shares at 31 Dec 2018 Shares at 31 Dec 2017
Kimmo Alkio 30 000 32 971
Håkan Dahlström 7 308 3 042
Lasse Heinonen2) N/A 17 767
Ari Järvelä 10 427 6 945
Satu Kiiskinen 11 992 5 366
Katariina Kravi 8 368 5 476
Tom Leskinen 1 085 100
Cristina Petrescu 948 702
Janne Salminen3) 1 597 N/A
Christian Segersven 200 0
Markus Suomi4) 0 N/A
The compensation of the whole Leadership Team in 2017 is also summarized in note 7 of the consolidated financial statements. The remuneration statement is available on the company’s website at www.tieto.com/investors.
1) Corporations over which the CEO exercises control did not have shares nor share-based rights on 31 December 2018.
Tieto does not have any active option programmes.
2) Leadership Team member until 31 July 2018.
3) Acting CFO as of 17 July 2018.
4) Leadership Team member as from 1 April 2018.
87Annual report 2018
Creating valueTieto 2018 Governance Financials Sustainability
Letter from the Chairman of the Remuneration CommitteeDear Shareholder,
Our strategy execution becoming customers’ first choice for business renewal is in well underway. The breadth of our services and software, coupled with our targeted investments, have established a solid foundation for growth. In the coming years we will continue building on this strong foundation to further accelerate growth.
Our rewarding approach
The aim of Tieto’s reward practices is to ensure that we can hire and retain top talent and offer market competitive total compensation. Also, we want to reward our employees for high performance in achieving both individual and company objectives. Tieto rewarding structures are designed to generate attraction and motivation which impact employee satisfaction and engagement. We are proud of improvement in employee engagement score which correlates directly with improvement in our customer experience results measured by Net Promoter Score.
Focus areas and remuneration activities in 2018
The Remuneration Committee agenda for 2018 continued on ensuring the reward practices are market competitive and thus support strategy execution. Our focused efforts in talent acquisition have paid off and over 3000 specialists, developers, architects and consultants have joined Tieto during 2018.
At the beginning of 2018, the Remuneration Committee approved the incentive payouts for the financial year 2017. Tieto paid out a total of EUR 30.6 million to the management and employees as short-term incentives and bonuses. The CEO and Leadership Team members received total of EUR 1.2 million as paid incentives.
We have provided strong value to all our key stakeholders. This is also reflected in our Long-Term Incentive Program (LTI) 2015–2017 result and share delivery to 123 plan participants took place in March 2018. The President and CEO received 9 950 net shares and other Leadership Team members in total 25 292 net shares.
A new Long-Term Incentive Plan for 2018–2020 was approved by the Board of Directors in early 2018, based on the recommendation from the Remuneration Committee. The purpose of the Long-Term Incentive Plan is to ensure that the company will meet the long-term targets, to align the interests of the management and shareholders, and reward selected employees who act as a role model our values. It is also a key element in the total compensation of Tieto management, which directly links the paid compensation to the company’s success. Plan participation was extended to selected employees who demonstrate first-rate technical skills and are critical in ensuring successful execution of the next phase of our strategy. For the 2018–2020 plan, the performance metrics were agreed to be earnings per share (30%), total shareholder return (20%) and growth (50%) as in the previous plan.
88Annual report 2018
Creating valueTieto 2018 Governance Financials Sustainability

Remuneration for 2018
The short-term incentive plan for 2018 to the President and CEO was based on both the agreed financial goals and success in strategy execution. Based on performance against the targets set, bonuses earned in 2018 (payable in spring 2019) ranged from 26% to 69% of salary for the President and CEO and Leadership Team members.
Share-based program 2016-2018 included 106 participants on 31 December 2018. Final share delivery from this plan is taking place in spring 2019 following the criteria set for the plan.
Remuneration for 2019
At the end of 2018, the Remuneration Committee started preparing a new long-term incentive plan for the years 2019–2021 with a continued focus on growth and profitability. In addition to senior management of the company, we will continue to nominate key technical talent into this new long-term incentive plan.
Short-term incentive measures are designed to further direct senior management focus into company profitability, growth and strategically important initiatives within own responsibility areas. In 2019 we are introducing more agile and flexible rewarding by increasing the use of anytime spot reward noticeably thus sharing our success with personnel.
Kurt JofsChairman of the Board of DirectorsChairman of the Remuneration Committee
89Annual report 2018
Creating valueTieto 2018 Governance Financials Sustainability
Report by the Board of Directors 92
Calculation of key figures 126
Consolidated Financial Statement 128
Parent company's Financial Statement 189
Dividend proposal, signatures for the Board of Directors' report and Financial statement and Auditor's note 201
Auditor's report 202
Shares and shareholders 206
Information for shareholders 211
Financials
More detailed table of contents for the Financials section can be found on the next page
Annual report 2018 90
Creating valueTieto 2018 Governance Financials Sustainability

Report by the Board of Directors and Financial Statements
Report by the Board of Directors 92
Five-year key figures 92
IT market development 93
Strategy 95
Financial performance 98
Cash flow and financing 103
Investments and development 104
Order backlog 104
Major agreements 105
Changes in Group structure 108
Personnel 109
Non-financial information 112
Shareholders' Nomination Board 116
The Board of Directors 116
The President and CEO and operative management 118
Auditors 120
Shares and shareholders 121
Dividend 124
Near-term risks and uncertainties 124
Events after the period 125
Full-year outlook for 2019 125
Financial calendar 2019 125
Calculation of key figures 126
Consolidated Financial Statements 128
Income statement 128
Statement of other comprehensive income 128
Statement of financial position 129
Statement of cash flows 130
Statement of changes in shareholders' equity 131
Notes to the Consolidated Financial Statements (IFRS) 133
ACCOUNTING POLICIES FOR THE CONSOLIDATED ACCOUNTS 133
PERFORMANCE FOR THE YEAR 146
1. Segment information 146
2. Revenue 150
3. Other operating income 151
4. Other operating expenses 151
5. Financial income and expenses 152
6. Earnings per share 153
EMPLOYEE BENEFITS 153
7. Employee benefit expenses 153
8. Share-based incentive plans 155
9. Pension plans 157
INCOME TAXES 160
10. Income taxes 160
ASSETS 163
11. Intangible assets 163
12. Property, plant and equipment 165
13. Non-current and current trade and other receivables 167
14. Cash and cash equivalents 167
EQUITY AND LIABILITIES 167
15. Share capital and reserves 167
16. Interest-bearing loans and borrowings 168
17. Provisions 169
18. Lease commitments 169
19. Trade and other payables 170
FINANCIAL INSTRUMENTS - FAIR VALUES AND RISK MANAGEMENT 170
20. Management of financial risks 170
21. Financial assets and liabilities - carrying amount and fair value and fair value hierarchy 179
22. Derivates 180
GROUP STRUCTURE AND GOODWILL 180
23. Subsidiaries 180
24. Interest in joint ventures 182
25. Acquisitions and disposals 183
26. Impairment testing of goodwill 186
OTHER INFROMATION 188
27. Commitments and contingencies 188
28. Related party transactions 188
29. Events after the reporting period 188
Parent company's Financial Statements 189
Income statement (FAS) 189
Balance sheet (FAS) 190
Statement of cash flows (FAS) 191
Notes to the parent company's Financial Statements (FAS) 192
1. Net sales 193
2. Other operating income 193
3. Personnel expenses 193
4. Other operating expenses 193
5. Management remuneration 193
6. Financial income and expences 194
7. Income taxes 194
8. Intangible assets 194
9. Tangible assets 195
10. Investments 195
11. Long-term receivables 196
12. Current intercompany receivables 196
13. Prepaid expenses and accrued income 196
14. Changes in shareholders' equity 197
15. Provisions 197
16. Non-current liabilities 197
17. Current liabilities 198
18. Accrued liabilities and deferred income 198
19. Deferres tax assets and liabilities 199
20. Contingent liabilities 199
21. Derivatives 200
22. Management of financial risks 200
Dividend proposal, signatures for the Board of Directors' report and Financial Statements and Auditor's note 201
Auditor's report 202
Shares and shareholders 206
Information for shareholders 211
Annual report 2018 91
Creating valueTieto 2018 Governance Financials Sustainability

REPORT BY THE BOARD OF DIRECTORS
Five-year key figures2018 20171) 2016 2015 2014
Net sales, EUR million 1 599.5 1 543.4 1 492.6 1 460.1 1 522.5
Operating profit (EBIT), EUR million 154.7 139.1 140.8 125.2 61.1
Operating margin, % 9.7 9.0 9.4 8.6 4.0
Profit before taxes, EUR million 152.8 135.7 136.8 119.3 56.6
Earnings per share, EUR
Basic 1.67 1.46 1.46 1.23 0.48
Diluted 1.66 1.46 1.46 1.23 0.48
Equity per share, EUR 6.54 6.46 6.62 6.57 6.44
Dividend per share, EUR 1.45 1.40 1.37 1.35 1.30
Capital expenditure, EUR million 45.0 50.8 61.6 50.5 42.5
Acquisitions, EUR million 14.5 49.3 37.6 86.2 1.1
Return on equity, 12-month rolling, % 25.7 22.3 22.1 19.0 7.1
Return on capital employed, 12-month rolling, % 20.9 20.5 21.6 20.4 9.8
Gearing, % 28.5 32.7 22.5 2.7 -12.6
Interest-bearing net debt, EUR million 137.4 155.7 109.7 13.2 -59.2
Net debt/EBITDA 0.7 0.8 0.6 0.1 -0.4
Equity ratio, % 41.3 42.5 47.3 46.2 47.8
Personnel on average 14 907 13 889 13 472 13 184 14 007
Personnel on 31 Dec 15 190 14 329 13 876 13 083 13 7201) 2017 comparative figures have been restated due to the adoption of IFRS 15.
See calculation of key figures on page Calculation of key figures.
Annual report 2018 92
Creating valueTieto 2018 Governance Financials Sustainability

IT market development Operational agility and innovation of new data-driven business models are high on customers’ agenda. Enterprises and public institutions are increasing their investments in innovating new data-rich services and differentiating experiences for their customers.
Data is the prime enabler of this change and the use cases cross over traditional industry boundaries, utilizing multiple sources of data and data-rich platforms. A large-scale revamp of business models is needed across industries, while ensuring business continuity.
Due to customers’ need for business renewal and adoption of new technologies, the market remains dynamic. In 2019, the Nordic market is anticipated to grow by 2–3%. The mix is continuing to see a major shift, with reduced spending on basic infrastructure services and increased spending on consulting and application services that can unleash value from data. Investments in co-creating data-driven value propositions and utilizing data assets are increasing. Over 70% of customers’ IT budgets are spent on business-led renewal to ensure competitiveness, and this provides a significant opportunity for IT service providers to support this renewal to derive value from data. The market for new services built around
new cloud-native applications, design and data is anticipated to grow by over 20%.
Value creation for customers requires continuous renewal and innovation, including:
• Design of service experiences and defining the business models
• Building and accessing the data assets needed for the new business models and experiences
• Adapting the enterprise architecture • Rationalization of the application portfolio
– renew, refactor, retire, rewrite and develop new applications to realize new business models
Technology forms the backbone of the pursuit of this agenda. It is assumed that well-orchestrated hybrid infrastructure will ensure business agility and optimize costs. The technology architectures remain hybrid across public cloud, private cloud and on-premise platforms. Public cloud is assuming a greater significance while demand for private cloud and traditional infrastructure services is expected to remain good. Spending on public cloud is expected to grow annually by 25–30% and private cloud by 10–15% in the coming years.
Industry sector drivers
• In the FINANCIAL SERVICES sector, the digital transformation and core system renewals continue. Compliance with new regulations, open banking digitalization and real-time payments are driving fundamental changes in the sector. The rapid market changes have also increased demand for a variety of competences, resulting in temporarily increased cost inflation pressures across the Nordic countries. In Industry Solutions, there is a clear shift towards Software as a Service delivered on secure cloud platforms and consumption-based models. In infrastructure services, price pressure has remained strong and there is a clear trend for demand to shift towards the public cloud.
• In the PUBLIC sector, the digitalization of services and processes will continue with efficiency and citizen experience as key drivers. High demand for consulting services and system administration is attributable to the fact that many customers are experiencing a shortage of skilful competences. In Finland, Tieto is actively participating in Government development programmes and demand is
good for case management solutions and new data-driven offerings, for example.
• In the HEALTHCARE AND WELFARE sector, the digitalization trend will continue to support easier and faster access to healthcare for citizens. All the Nordic countries are planning ambitious large-scale projects to enhance eHealth. The prevailing trend is to move towards integrated healthcare and welfare systems supporting seamless care. Additionally, there is increased interest in artificial intelligence-based solutions, which is also attracting new startups into the market. In Finland, the social and healthcare reform has been postponed, resulting in some delays in the large-scale renewal of the Electronic Health Record; however, the reform is expected to provide good opportunities in the coming years. In Sweden, the focus is on the ongoing procurement of the Electronic Health Record.
• The Nordic MANUFACTURING sector continues to experience a shift from traditional production and distribution models to a more service-driven business model, and clients are seeking ways to adapt their ways of working accordingly. This is leading to the renewal of core
Annual report 2018 93
Creating valueTieto 2018 Governance Financials Sustainability

business processes and systems as well as increased investments in intelligent data-driven solutions. Customer experience is becoming increasingly important in the B2B segment, while at the same time there is a continuous focus on efficiency improvements.
• In the FOREST sector, there is a greater focus on finding new innovative applications for wood-based products as an alternative to fossil-based materials. In the paper industry, the need to lower production costs continues to drive the adoption of new digital solutions, such as Smart Manufacturing using IoT, advanced robotics and analytics. Companies in the PULP AND PAPER sector in the Nordics are starting to prepare for the modernization of their enterprise applications in the coming years to enable themselves to be more agile and adaptive to market demands.
• In the RETAIL AND LOGISTICS sector, enterprises are investing in new digital commerce, marketing and payment capabilities to be able to provide a seamless customer experience in all interaction across different touchpoints. In logistics, smart turnkey delivery solutions and new legislation supporting peer-to-peer logistic solutions is poised
to revolutionize consumer deliveries in the Nordics, particularly in the urban landscape. The instore experience is increasing its importance as a means of differentiation in online retail competition. Retailers use data and analytics to better understand and predict consumer demand and plan their assortments accordingly.
• The ENERGY UTILITY market is going through many changes, mainly driven by regulatory requirements. The Advanced Meter Infrastructure market is preparing for the second generation of Smart Meters, helping consumers increase awareness of their energy consumption. The first signs of a more dynamic market are evident, with consumers starting to play an active role in the distributed energy market. In the oil & gas market, the market for new development projects is experiencing continued recovery, and demand for solutions that target increased productivity is improving.
• In the TELECOM sector, new opportunities based on 5G will enable telecom providers to diversify into new value-added services and provide key platforms for IoT- and cognitive automation-based innovations. Telecom service providers continue to explore
new areas and services to generate additional revenue. The sector continues to pursue increased efficiency through automation and cloudification of core operations. Closer co-operation between telecom and media companies with a view to providing convenient consumer-specific content is anticipated to provide growth opportunities in both segments. Additionally, data and consumer insight is expected to be a growth driver for both the telecom and media sector.
Annual report 2018 94
Creating valueTieto 2018 Governance Financials Sustainability

Strategy Based on the strategy launched in 2016, Tieto aims to accelerate value to customers through the co-creation of new data-driven experience and business models, end-to-end industry-specific software and solutions, and modernization of customers’ technology architecture (applications and infrastructure). Tieto continued to consistently execute the strategy based on the objectives set for the year. In 2018, the focus was on areas such as innovation with a special emphasis on the renewal of industry solutions, accelerating the company’s data-driven businesses, customer experience, productivity and ensuring future skills.
Tieto’s growth of 7% in local currencies clearly exceeds market growth and was supported by acquisitions, including Avega (December 2017), Petrostreamz (February 2018), NSEC (April 2018) and Meridium (November 2018). Growth in Sweden was strong, 11% in local currencies.
Active investments in improving the functionality and technological renewal of industry solutions continued during the year, and a number of important launches were completed. Related development investments increased by EUR 10 million during 2018. Tieto has pursued significant renewal to enable standardized software products, open
technologies and scalable architectures, especially in the case of Payments, Lifecare and SmartUtilities products. The renewal will enable faster development of functionality, access to a larger customer base and future growth. It proceeded according to plan, with a focus on the following solutions:
• Payments: The main investments have been made in renewing the architecture and technology platform of Tieto’s Virtual Account Management solution, which will enable further scalability, better functionality and more flexible integration. The modernization of the product was completed during the summer and rollout to existing customers and onboarding new customers on the product are ongoing.
• Lifecare: The main investments are made in the development of the Healthcare Information System, which will also be compliant with open Electronic Health Records specifications. Several launches took place during the autumn and further development of functionalities in the renewed product will continue.
• SmartUtilities: The investments involve creating a standard Nordic platform for customer engagement for Nordic utility companies, building on the knowledge in the industry and consolidating multiple customized products in a common
SmartUtility platform that can be delivered as a service. Initial releases of the product were made available to pilot customers during 2018. The development of the platform will continue during 2019.
Growth businesses
In 2018, Tieto continued to invest in accelerating growth based on selected businesses. The largest portion of investments was targeted at selected industry solutions, including the use cases in Tieto’s Data-Driven Businesses. The large-scale renewal in 2018 provides a good foundation for accelerated growth in the coming years. The focus is on the following solutions and services: Selected industry solutions with aggregated annual sales of around EUR 410 million in 2018
• Lifecare (Healthcare and welfare)• Case Management (Public sector)• Credit solutions (Financial services)• Payments (Financial services)• Hydrocarbon Management (Oil and gas
segment)• Production Excellence (Manufacturing
sector)• SmartUtilities (Energy)
Selected growth services with annual sales of around EUR 200 million in 2018
• Data-Driven Businesses (annual sales around EUR 5 million)
• Cloud services (annual sales around EUR 125 million1))
• Customer Experience Management (annual sales close to EUR 60 million)
• Security Services (annual sales over EUR 10 million).
In the full year, sales of the growth businesses increased by around 7% in local currencies, comprising growth of 3% in the selected industry solutions and 17% in selected growth services.
In Data-Driven Businesses, several artificial intelligence-related projects for diverse uses are ongoing across industries. Tieto engages in intensive co-creation activities with customers through a well-tested process and technology stack. The focus has been on driving scale for solutions such as Intelligent Wellbeing, enabling predictive treatment models using healthcare and welfare data, and Empathic Building, utilizing IoT, analytics and system integration to ensure employee wellbeing and efficient workspaces. Additionally, Tieto’s Digital Data Platform (Platform as a Service) solution contributed to the significant growth of this
Annual report 2018 95
Creating valueTieto 2018 Governance Financials Sustainability

business. The Digital Data Platform processes massive amounts of data scattered across several sources, and has been well received by customers in a number of industries. Tieto together with its clients has achieved good results, for example, from combining data from the healthcare, social welfare and education segments with a view to preventing social exclusion.
Sales of Tieto’s infrastructure cloud1) (Infrastructure as a Service and Platform as a Service), mainly comprising the company’s private cloud offerings, increased by 15% in local currencies in the full year. In addition to its infrastructure cloud, Tieto provides public cloud services through its OneCloud infrastructure solution as well as through several other public cloud-enabled service practices, including cloud native development, the company’s Datalake solution and Software as a Service, provided by both Tieto and its partners. Tieto is forging ahead with its initiatives to ensure the leading position as a cloud service provider for both application renewal and infrastructure optimization. The implementation of the Public Cloud Programme and the internal training programme to scale up public cloud-certified professionals across service practices continues.
Customer Experience Management (CEM) posted growth of 16% in local currencies in the full year. There is an increasing need for partners that can combine strategy, design and technology in a cost-efficient way. Tieto has gained a strong position due to its holistic, agile and technology-agnostic approach combined with its global delivery capabilities. In November, Tieto acquired Meridium AB, a Swedish company employing about 60 digital customer experience professionals.
Security Services’ growth accelerated further in the fourth quarter with growth of over 50% in local currencies. In the full year, net sales increased by 16% in local currencies. Demand for security services is good due to customers’ increased use of cloud as well as regulatory requirements. Along with the integration of NSEC, acquired in April, Tieto is able to serve customers with demanding requirements related to Nordic cybersecurity services.
1) Based on infrastructure cloud (Infrastructure as a Service
and Platform as a Service), excl. selected services such as
cloud-enabled consulting and shared integration services,
previously included in cloud services sales.
New strategy and financial objectives launched
On 6 February 2019, Tieto launched a new strategy to take advantage of the rapidly developing opportunities in the data-rich world – and to continue to elevate financial performance and shareholder value.
The cornerstones of the renewed strategy are to
• significantly grow design- and data-led services, driving customers’ innovation and modernization,
• simplify operations, as well as • continue to focus on the Software,
Infrastructure and Product Development Services businesses.
Implementation of the new strategy will gradually begin during the second quarter. More details available atwww.tieto.com/investors.
Accelerated value creation is reflected in Tieto’s updated financial objectives:
• Growth over 5% (CAGR 2019–2022) – with continued active M&As supporting growth
• Adjusted operating margin 13%1) – main drivers include growth, simplified operations and automation
• Net debt/EBITDA below 2.0 in the long term2)
• Aim is to increase base dividend annually in absolute terms
1) Adjusted for amortization of acquisition-related
intangible assets, restructuring costs, capital gains/losses,
goodwill impairment charges and other items affecting
comparability. In accordance with IFRS16, taking effect on
1 Jan 2019.
2) In accordance with IFRS 16, taking effect on 1 Jan 2019
– equals around 1.5 prior to IFRS 16
Annual report 2018 96
Creating valueTieto 2018 Governance Financials Sustainability

Performance drivers 2019
Tieto aims to grow faster than the market during the year. To support this ambition, Tieto is committed to actions driving competitiveness and will continue its investments in innovation and growth.
In 2019, acquisitions will support the ambition of accelerating growth. Aggregated annual sales of the companies acquired in 2018 amounted to around EUR 13 million, of which EUR 4 million was included in Tieto’s sales in 2018.
Performance drivers also include:• investments in offering development • recruitments in new service areas and
related competence development• salary inflation• continued drive for competitiveness and
efficiency.
At the Group level, full-year offering development costs are anticipated to remain at around 5% of Group sales. Capital expenditure (CAPEX) is anticipated to remain below 4% of Group sales.
Tieto continues to invest in new capabilities and competencies. In 2018, Tieto recruited around 850 employees (net amount, including attrition), which will also affect the cost base in 2019. Salary inflation is anticipated to amount to over EUR 30 million in 2019, partly offset by increasing offshoring and the management of the competence pyramid.
The new strategy aims to enhance Tieto’s competitiveness with targeted investments in high-growth digital services and software, increased activity in customer engagement and agile teams functioning with higher autonomy. The simplified operations will ensure faster access to relevant capabilities for customers while reducing the need for internal coordination and administration. Tieto currently anticipates that operational simplification will affect around 700 roles globally and result in annualized gross savings of EUR 30–35 million, partially affecting performance already in 2019. The design of operations continues over the upcoming months and the impact on each business and country will be specified during the process. In parallel, Tieto will increase investments in design- and data-centric capabilities and anticipates that the company will add 2 500–3 000 competences for these roles during the strategy period.
Annual report 2018 97
Creating valueTieto 2018 Governance Financials Sustainability

Financial performance Net sales increased by 3.6% to EUR 1 599.5 (1 543.4) million, growth of 6.6% in local currencies. Acquisitions added EUR 45 million in sales, mainly affecting Business Consulting and Implementation, and the impact of divestments on sales was EUR 7 million. Currency fluctuations had a negative impact of EUR 47 million on sales, mainly due to the weaker Swedish Krona.
2 000
1 500
1 000
500
0
1 522 1 460 1 493
1 5431 600
2. FINANCIALS
14 15 16 17 18
%
NET SALES AND GROWTH
EUR million
FR work number 2
-5% -4%
2%
3%
4%
5
2.5
0
-2.5
-5
800
600
400
200
0
25
20
15
10
5
0
-5
3. FINANCIALS
740
%
245
479
136
NET SALES AND GROWTH BY SERVICE LINE
Technology Services and Modernization
Business Consulting and Implementation
Industry Solutions
Product Development Services
EUR million
FR work number 3
1%
25%
8%
-1%
Annual report 2018 98
Creating valueTieto 2018 Governance Financials Sustainability

Operating profit (EBIT) amounted to EUR 154.7 (139.1) million, representing a margin of 9.7% (9.0). Adjusted1) operating profit stood at EUR 162.8 (161.4) million, or 10.2% (10.5) of net sales. Further details on adjustments are available in the table on page Calculation of key figures. At the Group level, offering development costs were up by EUR 6 million, of which EUR 3.6 million were capitalized (net impact on operating profit over EUR 2 milion). With respect to investments in Industry Solutions, part of development costs related to the Healthcare Information System platform are capitalized, according to the company’s accounting policies. Additionally, currency changes had a negative impact of around EUR 8 million on operating profit, and profitability was also affected by salary inflation.
Depreciation and amortization amounted to EUR 55.0 (54.7) million, including EUR 5.2 (4.3) million in amortization of acquisition-related intangible assets. Net financial expenses stood at EUR 1.9 (3.4) million in the full year. Net interest expenses were EUR 2.1 (2.1) million and net gains from foreign exchange transactions EUR 1.0 (-0.2) million. Other financial income and expenses amounted to EUR -0.8 (-1.1) million.
Earnings per share (EPS) totalled EUR 1.67 (1.46). Adjusted1) earnings per share amounted to EUR 1.76 (1.69).
1) Adjusted for restructuring costs, capital gains/losses,
goodwill impairment charges and other items affecting
comparability
600
500
400
300
200
100
0
4. FINANCIALS
%
378
531
5556
4
2
0
-2
-4
-6
NET SALES AND GROWTH BY
INDUSTRY GROUP
Financial Services
Public, Healthcare and Welfare
Industrial and Consumer Services
EUR million
FR work number 4
-2%
6%
4%
500
400
300
200
100
0
406 404422
367
5. FINANCIALS
Q1 Q2 Q3 Q4
NET SALES BY QUARTER
EUR million
FR work number 5
Annual report 2018 99
Creating valueTieto 2018 Governance Financials Sustainability

200
160
120
80
40
0
10
8
6
4
2
0
6. FINANCIALS
14 15 16 17 18
%
OPERATING PROFIT (EBIT) AND MARGIN
125.2
140.8 139.1
154.7
61.1
4.0%
9.4%
8.6%9.0%
9.7%
EUR million
FR work number 6
50
30
10
0
30
20
10
0
7. FINANCIALS
Q1 Q2 Q3 Q4
%
ADJUSTED OPERATING PROFIT (EBIT) AND
MARGIN BY QUARTER
EUR million
FR work number 7
36.634.8
41.6
49.8
9.0% 8.6%
11.3% 11.8%
100
80
60
40
20
0
20
16
12
8
4
0
8. FINANCIALS
%
ADJUSTED OPERATING PROFIT
BY SERVICE LINE
Technology Services and Modernization
Business Consulting and Implementation
Industry Solutions
Product Development Services
12.5%
7.6%
10.4%10.7%
EUR million
92.4
51.1
18.614.1
FR work number 8
20
16
12
8
4
014 15 16 17 18
200
160
120
80
40
0
22. FINANCIALS/BOD
%
ADJUSTED OPERATING PROFIT (EBIT)
AND MARGIN
150.2 150.8 152.2161.5 162.8
9.9% 10.2%10.3% 10.5%
10.2%
EUR million
FR work number 22 (Lisätty 26.1.)
Annual report 2018 100
Creating valueTieto 2018 Governance Financials Sustainability

Financial performance by service line
EUR million
Customer sales 2018
Customer sales 2017
Change, %
Operating profit 2018
Operating profit 2017
Technology Services and Modernization 740.0 735.4 1 85.4 78.5
Business Consulting and Implementation 244.6 195.9 25 18.9 16.1
Industry Solutions 478.9 486.0 -1 54.4 54.4
Product Development Services 135.8 126.1 8 13.9 12.0
Support Functions and Global Management - - - -18.1 -21.9
Total 1 599.5 1 543.4 4 154.7 139.1
Operating margin by service line
%
Operating margit
2018
Operating margit
2017
Adjusted1)
operating margin
2018
Adjusted1)
operating margin
2017
Technology Services and Modernization 11.5 10.7 12.5 12.1
Business Consulting and Implementation 7.7 8.2 7.6 8.3
Industry Solutions 11.4 11.2 10.7 11.9
Product Development Services 10.2 9.5 10.4 9.7
Total 9.7 9.0 10.2 10.5
1) Adjusted for restructuring costs, capital gains/losses, goodwill impairment charges and other items affecting comparability
In TECHNOLOGY SERVICES AND
MODERNIZATION, sales in local currencies were up by 3%. Strong growth of application services and infrastructure cloud1) continued. Sales of infrastructure cloud were up by 15% and application services by 7% in local currencies. The decline in traditional infrastructure services continued and amounted to 3%. Adjusted operating margin somewhat improved, mainly due to good volume development.
In BUSINESS CONSULTING AND
IMPLEMENTATION, the acquisition of Avega supported strong growth while also organically, sales were up by 5%. The acquisition of Avega implemented in 2017 has strengthened Tieto’s market position in business consulting in Sweden. In Customer Experience Management, strong development continued across the markets and sales were up by 16%. Adjusted operating profit improved, mainly due to good volume development and the acquisitions.
In INDUSTRY SOLUTIONS, sales in local currencies were up by 2%, organically up by 3%. The Hydrocarbon Management and Content Management solutions had strong growth while the architectural renewal affected growth in Payments and SmartUtilities, Tieto’s solution for the energy utility segment. Growth for the Payment solutions turned positive after the launch of renewed Virtual Account Management and Tieto continued to expand its customer base towards the year end. Growth of Lifecare was in line with the market, somewhat affected by the ongoing reform in the Finnish healthcare segment. Operating profit, including an increase of around EUR 10 million in offering development costs, was down.
In PRODUCT DEVELOPMENT SERVICES, sales growth in local currencies was 13%. Growth was attributable to strong volume development with the largest key customers and good development in the automotive segment. Operating profit improved due to strong volume development.
1) Based on infrastructure cloud (Infrastructure as a Service
and Platform as a Service), excl. selected services such as
cloud-enabled consulting and shared integration services,
previously included in cloud services sales.
Annual report 2018 101
Creating valueTieto 2018 Governance Financials Sustainability

Customer sales by industry group
EUR million
Customer sales 2018
Customer sales 2017
Change, %Financial Services 377.6 384.4 -2Public, Healthcare and Welfare 530.8 501.7 6Industrial and Consumer Services 554.9 531.2 4IT services 1 463.7 1 417.3 3Product Development Services 135.8 126.1 8Total 1 599.5 1 543.4 4
M&A impact by service line
EUR million
Sales growth, % (in local currencies)
2018
Organic growth, % (in local currencies)
2018Technology Services and Modernization 3 3Business Consulting and Implementation 28 5Industry Solutions 2 3IT services 6 3Product Development Services 13 13Total 7 4
M&A impact by industry group
EUR million
Sales growth, % (in local currencies)
2018
Organic growth, % (in local currencies)
2018Financial Services 1 -1Public, Healthcare and Welfare 9 8Industrial and Consumer Services 7 1IT services 6 3Product Development Services 13 13Total 7 4
In FINANCIAL SERVICES, sales in local currencies were up by 1%. Growth was strongest in the Business Consulting and Implementation area whereas the architectural renewal affected growth in Industry Solutions. Growth for Tieto’s Payments solutions turned positive after the launch of renewed Virtual Account Management and Tieto continued to expand its customer base towards the year end.
In PUBLIC, HEALTHCARE AND WELFARE, sales in local currencies were up by 9%. Growth was healthy in the public sector across the markets. Overall, the market is active with several digitalization initiatives and transition projects ongoing.
In INDUSTRIAL AND CONSUMER
SERVICES, sales in local currencies were up by 7%, supported by the acquisition of Avega. Good development was experienced especially in Hydrocarbon Management whereas sales development in SmartUtilities was negative due to the ongoing large-scale renewal.
Annual report 2018 102
Creating valueTieto 2018 Governance Financials Sustainability

Cash flow and financing Net cash flow from operations amounted to EUR 174.2 (151.0) million, including an increase of EUR 3.2 (15.3) million in net working capital. Payments for restructuring amounted to EUR 8.4 (21.3) million.
Full-year tax payments were EUR 21.4 (16.9) million.
The equity ratio was 41.3% (42.5). Gearing decreased to 28.5% (32.7). Interest-bearing net debt totalled EUR 137.4 (155.7) million, including EUR 302.4 (234.7) million in interest-bearing debt, EUR 1.7 (2.5) million in finance lease liabilities, EUR 1.6 (2.8) million in finance lease receivables, EUR 0.5 (0.5) million in other interest-bearing receivables and EUR 164.6 (78.2) million in cash and cash equivalents.
Interest-bearing long-term loans amounted to EUR 185.5 (102.5) million at the end of December. Tieto’s EUR 100 million bond will mature in September 2024 and it carries a coupon of fixed annual interest of 1.375%. A loan of EUR 85 million was drawn from the European Investment Bank in November 2018 and it will be amortized within nine years.
Interest-bearing short-term loans amounted to EUR 118.6 (134.6) million, including the EUR 100 million bond maturing in May 2019. The syndicated revolving credit facility of EUR 150 million expiring in May 2021 was not in use at the end of December.
30
25
20
15
10
5
0
9. FINANCIALS
14 15 16 17 18
%
RETURN ON EQUITY
19.0
22.1 22.3
25.7
7.1
FR work number 9
25
20
15
10
5
0
10. FINANCIALS
14 15 16 17 18
%
RETURN ON CAPITAL EMPLOYED
20.421.6
20.5 20.9
9.8
FR work number 10
Annual report 2018 103
Creating valueTieto 2018 Governance Financials Sustainability

Investments and development Order backlogTieto is seeking to grow faster than the market in the long term. Tieto will accelerate future growth through offering development and new competencies as well as acquisitions. Additionally, the company will continue to invest in standardization and automation to drive improvements in productivity and quality.
Full-year capital expenditure totalled EUR 45.0 (50.8) million. Capital expenditure represented 2.8% (3.3) of net sales and was mainly related to data centres. Net payments for acquisitions totalled EUR 14.5 (49.3) million.
The significance of traditional measures for the order backlog is impacted by the shift from traditional large outsourcing agreements towards agile methods and consumption-based business models. Additionally, traditional development programmes are cut into smaller projects. While this change in customer behaviour affects the order backlog levels, it is not expected to have any significant impact on Tieto’s market opportunities and business outlook.
Tieto’s offering development costs amounted to around EUR 80 million in 2018, representing 5.0% of Group sales (EUR 75 million in 2017, representing 5.0% of net sales). These costs comprise service and product development, which in 2018 focused especially on large-scale technology renewal in industry solutions. Additionally, the costs for related internal development, e.g. automation in infrastructure services, are included in this amount. In 2018, Tieto capitalized EUR 3.6 million of the development costs (in 2017, no development costs were capitalized).
The order backlog was impacted by a negative currency effect and amounted to EUR 1 698 (1 860) million. Of the backlog, 54% (52) is expected to be invoiced during 2019. The order backlog includes all signed customer orders that have not been recognized as revenue, including estimates of the value of consumption-based contracts.
Annual report 2018 104
Creating valueTieto 2018 Governance Financials Sustainability

Major agreements During the year, Tieto signed a number of new agreements with customers across all the industry groups. However, according to the terms and conditions of these agreements, Tieto is not able to disclose most of the contracts.
In January, Tieto signed a new agreement with Nynäshamn municipality under which it will provide IT services to support the municipality’s digitalization journey. The four-year contract is worth around SEK 43 million and includes an option to extend for up to five years.
In February, Posti, Finland’s postal service, and Tieto agreed on a partnership covering data centre and cloud services with the objective of modernizing Posti’s IT infrastructure. Responding to a changing industry landscape, Posti focuses on improving both quality and customer experience. The co-operation supports Posti’s business-oriented solutions.
In February, Värmdö municipality selected Tieto's cloud-based solution to modernize its document and case management. The solution is based on Tieto's leading and standardized public sector solution, Public 360° Online, which includes all
core processes such as billing, domain management and plan management. The system enables a more efficient way of working and improves the service provided to citizens. The contract period extends over four years, with the possibility of renewal for another three years.
In February, Suomen Osuuskauppojen Keskuskunta (SOK) Corporation, a Finnish network of retail and service companies, chose Tieto to modernize its IT infrastructure by integrating legacy applications into a SAP environment. With the solution SOK Corporation focuses on modernizing legacy applications.
In February, Asfinag, an Austrian publicly owned corporation that plans, finances, builds and maintains Austrian autobahns and handles their toll collection, signed an agreement with Tieto on IT service delivery for 2018, which contains, for example, services for SAP and software development. As the main full-service IT partner for Asfinag, Tieto will contribute to sustainable improvement and increase efficiency in the customer’s processes. The agreement has an estimated value of EUR 7 million.
In March, Högland Såg & Hyvleri, a family-owned sawmill and wood processing company in Sweden, signed an agreement with Tieto to replace its present wood supply system with Tieto's TIFF solution. TIFF, a Software-as-a-Service (SaaS) solution, optimizes wood and fibre supply operations with a comprehensive set of industry-specific modules that digitalize the processes from contract signing to invoicing and from harvesting to mill delivery.
In March, Kraft Bank, a new Norwegian bank that was launched in spring 2018 to help customers with financial difficulties, chose Tieto's AI solution for core banking to offer end-to-end automated loan processing. Tieto's solution includes processing for home loans, unsecured loans, debit cards and savings accounts, including Vipps and direct withdrawal. The engine for credit rating analysis has built-in machine learning and will provide more accurate decisions. Through open APIs, Kraft will have the opportunity to make use of a wide range of channels, such as financial institutions and partner banks, and also to utilize third-party FinTech partners. The five-year contract is worth around NOK 20 million.
In March, Tieto signed a contract extension with Sodexo, one of the world's largest multinational corporations providing the on-site business community and public sector with support services. Based on the contract, Tieto will provide service desk and data centre services to support Sodexo’s digitalization journey. The five-year contract extension is worth around SEK 120 million.
In March, Tieto signed a new agreement, following a public procurement, with Haninge municipality for the delivery of IT services as part of the municipality's continued digitalization journey. The agreement includes application management, server capacity, cloud services and system operation, as well as consulting services for further development. It also gives the municipality increased access to cost-effective services on Tieto's platforms. The three-year contract is worth approximately SEK 18 million, with an option to extend it with three additional years.
In April, Tieto signed a contract with Suomen voimatieto (SVT) and SPS Energiapalvelut (SPS) to deliver the Tieto SmartUtilities solution for Billing and Customer Management. Tieto SmartUtilities is a modular Software as a Service solution designed for Nordic energy
Annual report 2018 105
Creating valueTieto 2018 Governance Financials Sustainability

companies. The scalable cloud service meets strict information security requirements. The contract is for four years with an option to extend it with additional years.
In April, Tieto signed a contract with Palm Paper Group to deliver ProductionExcellence services for six corrugated packaging mills. Based on the solution, Palm Paper Group will harmonize sales, warehouse and logistic processes, running on a centralized Business and Production platform. The three-year contract is worth approximately EUR 2 million, with an option to roll out the solution at Palm Paper Group’s 20 other corrugated packaging mills.
In May, Singapore LNG Corporation (SLNG) chose Tieto to provide the Transport and Revenue modules of Tieto Energy Components to manage hydrocarbon accounting for the entire LNG import value chain. Energy Components takes care of business processes for planning, unloading, inventory control, re-gasification, gas sales and gas delivery.
In May, the Finnish Border Guard chose Tieto to provide a new maritime search and rescue (SAR) command and control system. The system is scheduled for commissioning
by the end of 2020. It will digitalize the exchange of information between maritime SAR command centres and search and rescue units and make it more effective. The command and control system will also offer a variety of ready-made interfaces to connect new, external services and functions to the management of maritime SAR operations.
In June, Tieto signed a comprehensive agreement with Region Skåne to deliver IT services that support the region's continued digitalization journey. The goal is to support the region’s efforts to create safer and more equal healthcare services. The agreement is for four years with the option to extend until 2031. The contract is worth SEK 410 million.
In June, Wiener Netze, one of the biggest energy distribution companies in Europe, accepted the bid submitted by a consortium consisting of Siemens, Landis+Gyr and Iskraemeco. Wiener Netze will implement the rollout of 1.6 million smart meters in Vienna and its surroundings jointly with Siemens as the prime contractor supported by the consortium and technology partners, with Tieto as one key contributor. The Tieto SmartUtilities solution enables Siemens to manage a fully digitalized flow from planning to installation of smart meters with a high degree of automation and security.
In July, Facevalue, a business banking platform company that specializes in working capital solutions and electronic invoicing, selected Tieto to provide Card Suite software services. Tieto Card Suite will enable Facevalue to manage multiple card programmes in collaboration with different banks in key regions as part of its networked banking application for businesses and individuals across Europe. As one of the first organizations to use Tieto Card Suite in SaaS, Facevalue will gain benefits from the service, as it is not only efficient, resilient and open, but also complies with the Payment Card Industry Data Security Standard (PCI DSS).
In July, Tieto and FläktGroup, the European market leader for energy efficient indoor air technology solutions, signed a five-year extension agreement on OneCloud IaaS Onsite. Based on the agreement, Tieto provides FläktGroup with a platform for the applications running in the customer’s premises. The extension is part of a prior significant agreement under which Tieto provides OneCloud datacenter and cloud services to modernize and harmonize FläktGroup’s infrastructure services.
In July, OTP Bank, a significant financial services provider in Central and Eastern
Europe, selected Tieto to replace its legacy card back-office system in Hungary. The modernization will streamline and improve the bank’s card issuing and merchant management services. Through a single platform, Tieto will automate the bank’s new business and card management systems, and enable a faster time to market for launching new payment products and services.
In August, Automatia Pankkiautomaatit renewed its service agreement with Tieto. The length of the renewed agreement is five years. The agreement covers ICT infrastructure services, including production, development and test environments. Automatia delivers high-quality services to its customers based on 100% availability.
In September, APA, Australia’s largest natural gas infrastructure business, partnered with Tieto to implement the Capacity Trading and Auctioning functionality. In addition to the upgrade, implementation and test automation services, Tieto will provide deliverables and consulting services to help APA adapt to the changes in the capacity trading reform package recommended by the Australian Energy Market Commission (AEMC) and achieve business value.
Annual report 2018 106
Creating valueTieto 2018 Governance Financials Sustainability

In September, Tieto signed an agreement to provide Nynäshamn municipality with a digitalized document and case management system. The solution, based on Tieto’s new version 5.0 of Public 360°, enables more efficient and digitalized work flows for the municipality’s operations, which will in turn produce better services for citizens. Hence, it supports Nynäshamn’s goal to be an innovative municipality that digitally handles central processes such as cases, registers, documents and committees. The agreement is for four years with an option to extend.
In October, Tieto extended its collaboration with Skellefteå municipality through a new agreement for the delivery of an operational system for social services that will simplify everyday tasks for employees and help the municipality offer better e-services to citizens. The system is based on the Tieto Lifecare solution and will support the management of processes within healthcare, social care and family care. The contract is worth around SEK 20 million and runs over six years, with three optional periods of three years each.
In November, Tieto signed a new infrastructure contract for a front-end environment with International Card Service
B.V., the leading Dutch credit card issuer. In combination with the new contract, ICS B.V. extended its current agreement for back-end infrastructure services with two years. Based on the contract, Tieto will provide PCI-DSS compliant infrastructure services and cloud solutions for both front- and back-end until 2022 with an option to extend with two additional years.
In November, SSAB and Tieto renewed their service agreement as a continuation of their long-term cooperation. The renewal is based on the contract signed in 2015. The contract covers a wide range of services from capacity services to application development for business-critical manufacturing, logistics and sales operations worldwide. Tieto is providing SSAB with an attractive model for productivity improvement and modernizing IT operations in the mainframe environment.
In December, the Scandinavian finance company EnterCard Group AB expanded and renewed its existing outsourcing agreement with Tieto. The new contract includes continuous modernization of EnterCard's IT environment with new technical solutions based on Tieto's OneCloud and Tieto Compliance Cloud. With these solutions
EnterCard’s modernized environment will be more efficient, secure and suitable for future business needs. The contract runs for five years with an option to extend.
In December, Tieto signed a three-year contract with Volvo Car Dealers and TANKA in Sweden. Based on the contract, Tieto will provide Network and End User Service to Volvo Car Dealers across Sweden. The services enable Volvo Car Dealers to adopt a more efficient way of working and improve the service provided to customers. The contract is worth around SEK 30 million and includes an option to extend it with one to two additional years.
In December, Tieto signed a contract extension with Region Skåne, one of Sweden’s largest county councils. Based on the contract, Tieto will take full responsibility for delivering user-friendly IT to Region Skåne’s 35 000 employees. The services cover a number of areas such as printing, workplace support, multimedia and video conferencing as well as service desk and local service with related accessories and extra technician support. The two-year contract extension is worth around SEK 300 million and includes an option to extend for another six years.
In December, If Insurance, the leading property and casualty insurer in the Nordic region, extended its IT infrastructure agreement with Tieto for a fourth period. Based on the agreement, Tieto will help If on its journey to modernize the holistic IT infrastructure by exploiting the best technologies, and provide access to modern and cost-effective cloud services to support its hybrid infrastructure transformation. The new contract runs for five years with an option for two more years.
Annual report 2018 107
Creating valueTieto 2018 Governance Financials Sustainability
Changes in Group structure On 31 January, Tieto divested its ProArc unit with a solution for technical document management to Constellation Software Inc. The unit was part of Software Innovation and focused on enterprise content management. Sales of the disposed business were around EUR 7 million.
On 28 February, Tieto signed an agreement to acquire Petrostreamz AS, a rapidly growing provider of advanced software and services for integrated asset modelling (IAM) in the oil and gas industry. By combining Tieto’s solution Energy Components with Pipe-It, Petrostreamz software, into a forward-looking decision-making tool, the company will be better positioned to help upstream and midstream oil and gas clients derive value from data.
On 19 April, Tieto announced the acquisition of NSEC AB, a Swedish security services company employing about 30 security professionals. The acquisition further strengthens Tieto’s cybersecurity capabilities and adds to Tieto’s growing portfolio of security services. Headquartered in Stockholm, NSEC brings Tieto further
capabilities in managed security operations, security consulting, as well as product resell and deployment services, and thereby strengthens Tieto’s position as a leading Nordic best of suite security services provider. Net sales of the acquired company amounted to EUR 4 million in 2017.
On 31 August, Tieto divested the assets and rights of its cross-advertising services to Atex Media Command AB due to limited synergies with its businesses. Cross-advertising is a cloud-based solution that provides end-to-end multi-channel advertising management, covering the whole process from sales, CRM and booking to production and invoicing. The divested business had annual sales of around EUR 2 million and was part of Industry Solutions.
On 5 November, Tieto acquired Meridium AB, a Swedish company employing about 60 digital customer experience professionals. With the acquisition of Meridium AB, Tieto strengthens its presence in Sweden and enhances its capabilities to serve Nordic customers in developing ways to interact with their customers in the digital world.
Annual report 2018 108
Creating valueTieto 2018 Governance Financials Sustainability

Personnel The number of full-time employees amounted to 15 190 (14 329) at the end of December. The number of full-time employees in the global delivery centres totalled 7 690 (6 979), or 50.6% (48.7) of all personnel.
In the full year, the number of full-time employees was up by a net amount of around 900, including net recruitments of around 750 in IT services, close to 100 in Product Development Services. Additionally, acquisitions added around 50 employees (net of acquisitions and divestments).
Attrition was on the rise during 2018 across Tieto’s markets. The company, however, has been very successful in attracting and retaining talent. The 12-month rolling employee turnover stood at 12.2% (11.3) at the end of December. Group-level salary inflation is expected to be close to 4% on average in 2019.
The dynamic business environment is placing high demands on competence development and good employee experience. The emergence of new business models and the constant need to accelerate innovation and efficiency continue to drive competence renewal.
Tieto’s Human Resources (HR) is responsible for developing people practices at Tieto. The HR function is led by the Group-level Head of HR while country HR teams are responsible for country-specific HR operations. In addition, Business HR support is also assigned to the respective service lines and industry groups.
Tieto has identified three main areas that impact how employees experience their work: culture, technology and physical space. This laid the foundation for the Better Life@Work initiative, which was launched in 2018. The priorities of Better Life@Work consist of four key action streams: strengthen Open Source Culture, boost learning for the future, simplify Tieto and improve digital tools.
Tieto’s Open Source Culture is a foundation for building a good employee experience, supported by advanced technology and a modern working environment. The company’s Open Source Culture is based on openness and transparency, and it aims to make employees feel included, empowered, and able to influence their work as well as contribute to an inspiring working environment.
Curiosity and life-long learning are crucial parts of the company’s success and culture. Building an environment where employees are curious to learn about new technologies and ways of working motivates them. The Learning as a Lifestyle initiative focuses on supporting employees in gaining future strategic competencies and ensures that reskilling and upskilling take place proactively. In 2018, Tieto finalized moving all Tieto learning modules to our new learning experience platform.
In addition to carrying out development programmes, Tieto strengthened its competences in 2018 across different businesses with recruitments and acquisitions. New recruitments included roles such as industry and solution consultants, architects and software developers. Being a responsible, active and engaged corporate citizen in a larger ecosystem and collaborating with the company’s partners from suppliers to universities and industry networks enabled Tieto to bring in hundreds of new employees.
Employee engagement, as an outcome measure of the perceived Employee
Experience, is measured on an annual basis through Tieto’s internal employee survey, VOICE. The overall employee engagement score was good at 75%, showing positive development since 2014.
The Tieto Human Resources (HR) Policy serves as the overall strategic direction for Tieto’s people practices, and applies to all employees and operations globally. This policy states that Tieto supports and respects the principles set out in the United Nations Universal Declaration of Human Rights and the ILO Declaration on Fundamental Principles and Rights at Work.
Annual report 2018 109
Creating valueTieto 2018 Governance Financials Sustainability

11. FINANCIALS
2016
2017
2018
< 30
30–50
> 50
PERSONNEL BY AGE
0% 20% 40% 60% 80%
Years
FR work number 1112. FINANCIALS
< 1
1–5
6–10
11–15
16–20
21–25
> 25
2016
2017
2018
LENGTH OF EMPLOYMENT
Years
0% 10% 20% 30% 40%
FR work number 12
50
40
30
20
10
0
13. FINANCIALS
14 15 16 17 18
40 40 40 40 40
AVERAGE AGE OF EMPLOYEES, 2014–2018
FR work number 13
Annual report 2018 110
Creating valueTieto 2018 Governance Financials Sustainability

14. FINANCIALS
PERSONNEL BY COUNTRY
Finland 22%
Sweden 20%
India 18%
The Czech Republic 17%
Latvia 4%
Norway 4%
Poland 4%
China 3%
Estonia 2%
Austria 1%
Lithuania 1%
Other 3%
22%
20%
18%
17%
15 190
Total
FR work number 1415. FINANCIALS
PERSONNEL BY SERVICE LINE
Technology Services and Modernization
Business Consulting and Implementation
Industry Solutions
Product Development Services
Industry Groups
Support funcions and global management
4%2%
11%
40%
16%
27%
15 190
Total
FR work number 15
Annual report 2018 111
Creating valueTieto 2018 Governance Financials Sustainability

Non-financial information Non-financial information
This section describes Tieto’s sustainability activities as required in Chapter 3a of the Finnish Accounting Act on non-financial information (NFI). The linkages between NFI areas and Tieto's sustainability focus areas are identified in the chart describing policies and processes. More information is available in the Sustainability Report.
Description of Tieto's business model
Tieto is one of the largest software and IT service companies in the Nordics. The company’s value-adding services comprise new data-driven services, business critical software solutions, infrastructure services, product development services and related capabilities to support customers’ business renewal, innovation and efficient operations.
Tieto’s role varies from advisory and consulting services and the design of services to building and running IT solutions. Tieto aims to co-create new solutions and innovate new data-driven business models with customers and partners. Value creation
and competitiveness are based on solutions combining best-of-breed technologies with integration capabilities, industrialized service delivery and strong global delivery capability.
Description of management of NFI topics
Tieto has a systematic approach to managing sustainability, including appropriate policies, processes, governance and organization, competences and communication.
Tieto’s sustainability work is facilitated by the company’s Sustainability Team and supported by the Sustainability Steering Group, chaired by the Vice President, Communication and Sustainability. The steering group advises the Leadership Team and Board of Directors and approves the sustainability section of the integrated annual report. The Sustainability Steering Group represents different functions and units of Tieto, ensuring that the voices of various internal and external stakeholders are considered. Tieto’s aim is to maintain a balanced male and female representation in the steering group, as well as younger and more experienced management representation.
Tieto’s Leadership Team and the Board of Directors reviewed sustainability matters on five occasions during 2018. The topics included the review of the renewed Code of Conduct and annual integrated report, review and approval of the Sustainability 2020 Plan, and review of NFI information, including relevant sustainability-related risks and Tieto’s societal engagements in 2019, among other things.
Tieto’s Sustainability 2020 Plan comprises nine focus areas that are developed through engagement with relevant external stakeholders as well as through internal prioritizations. As digitalization can advance wellbeing and environmental conditions in other industries, sustainability is regarded as an opportunity rather than a risk for the company. Tieto’s sustainability areas are the material topics covering capabilities, products, services and facilities needed to serve customers. The focus areas also include sustainability benefits that IT solutions can deliver to customers, such as helping them to reduce their CO
2 emissions, combat the grey economy or improve people’s health and wellbeing. Each sustainability area has publicly stated goals, and the action plans, implementation and reporting are run by nominated sustainability area owners and
partners. Sustainability area goals and results for 2018 are presented in the table in this section.
The Sustainability 2020 Plan is developed and managed according to Tieto’s Sustainability management process, which follows the United Nations Global Compact Management Model and GRI standards. Linkages to United Nations Sustainable Development Goals, which are considered a strategic tool enabling corporations to contribute to a more sustainable society, are established where relevant. The management of the sustainability areas – including policies, processes, due diligence and escalation channels – is illustrated in the chart in this section.
Tieto’s ethical values are summarized in the Code of Conduct Policy, which applies to all of Tieto’s employees, and a separate Supplier Code of Conduct Rule applied to any third party contributing to the company’s services, products and other business activities. Those are based on the United Nations Global Compact principles regarding human rights, labour rights, anti-corruption and the environment as well as the OECD Guidelines for Multinational Enterprises. The policies cover all of the sustainability areas,
Annual report 2018 112
Creating valueTieto 2018 Governance Financials Sustainability

which are also linked to other, topic-specific policies and more detailed rules. The policies cover the relevant legal, certification and other best practice requirements and are reviewed annually. In 2018, substantial updates were carried out to the Code of Conduct and Supplier Code of Conduct including policy, stakeholder training and communication updates.
Escalations involving possible Code of Conduct breaches are reported to the General Counsel. All escalations are investigated confidentially through a predefined process by an escalation function consisting of the General Counsel, Compliance Officer, Chief Audit Executive and Vice President, Communication and Sustainability. The outcomes of all investigations are reported as part of compliance risk reporting to the Compliance and Privacy Board and Audit and Risk Committee of the Board of Directors. In addition, sustainability areas have separate channels for incident reporting and continuous improvement.
POLICIES AND PROCESSES OF NFI MATTERS
CODE OF CONDUCT POLICY
SUSTAINABILITY MANAGEMENT PROCESS, SUSTAINABILITY MATERIALITY ASSESSMENT FOR 2017–2020 PLAN
WHISTLEBLOWING ON CODE OF CONDUCT ISSUES
Pol
icie
sD
ue d
ilige
nce
pro
cess
es
Code of Conduct (1), Internal audit policy (1), Anti-corruption rule (1), Competition compliance rule (1), Procurement policy (2),
Supplier Code of Conduct Rule (2,4), Environmental Rule (2,4,5), Information classification rule (3), Data transfer rule (3), Security Policy (3),
Privacy Policy (3), AI ethics guideline (5), Occupational Health and Safety Policy (6), HR Policy (6,7)
Internal and external audits (1), Governance, risk and compliance management (1,3), Sourcing to pay (2), Supplier self assessment (2),
Environmental management process (EMS) ISO14001 (2,4,5), ISO27001 (3), ISO31000 (3), ISAE3402 audits in Data Centers (3),
Information and cyber security audits and assessments (3), CDP Climate Change program (4,5), HR processes (6,7),
Employee survey Voice (6,7), EDGE equality certification (7)
CREATE VALUE FOR STAKEHOLDERSETHICAL CULTURE
1 Ethical culture
2 Sustainable supply chain
5 Sustainable IT solutions
3 Information security and data privacy
6 Employee experience 7 Equal opportunities
4 Greenhouse gas emissions
Respecting human rights Anti-corruption and –bribery matters
Social and employee mattersEnvironmental matters
MINIMIZE ENVIRONMENTAL IMPACT
Sus
tain
abili
ty a
reas
Annual report 2018 113
Creating valueTieto 2018 Governance Financials Sustainability
Main risks in non-financial area
The aim of Tieto’s internal control framework is to assure that operations are effective and well aligned with the strategic goals. The internal control framework is intended to ensure correct, reliable, complete and timely financial reporting and management information. The framework endorses ethical values, good corporate governance and risk management practices. Risk management and major risks are described in detail in the Corporate Governance Statement.
The risk management framework consists of the risk management organization, related policies, operating principles and tools. The risk management organization develops and maintains the company’s risk management framework, including risk reporting, risk management governance and follow-up of risk exposures consisting of strategic, financial, operational and compliance risks.
Tieto’s risks with respect to sustainability and NFI topics are mainly compliance risks. These risks include a reputational factor, which in
addition to negative publicity could lead to score drops in sustainability indices and deviations in audits. Severe breaches in these areas could also lead customers relying on highly reputable partners to lose their trust in us.
Fraudulent, unethical, or even illegal actions by individuals in areas such as corruption or conflict of interest can occur if anti-corruption awareness and team culture are not at a sufficiently high level. Such situations can have negative consequences ranging from disqualification from public tenders to sanctions. Compliance trainings, audits and follow-up are used to mitigate the risk.
Stress-related health issues as well as discrimination and harassment are human and labour rights related risks. From an operational perspective, deliveries could be compromised if key resources go on long sick leaves. Health issues have an impact on costs as well. Both health issues and discrimination and harassment can lead to environments where employees may not reach their full potential. Discrimination could also hinder the company’s ability to develop solutions to societal problems.
Tieto believes that diversity in personnel, whether in terms of gender, age or cultural background, is needed to stay competitive in the fast-paced ICT industry. Diversity and inclusion are an integral part of the company’s Open Source Culture as well as Human Resources activities. Being able to unwind and maintain wellbeing is equally crucial. The employee health and wellbeing index is measured and follow-up actions taken where necessary to improve employee wellbeing.
Tieto’s supplier base consists of direct and indirect suppliers. Supply chains may include compliance risks related to the environment, human and labour rights or even corruption. Severe breaches against international conventions in the supply chain could lead to customers deciding to terminate contracts. Tieto mitigates these risks through its supplier sustainability programme and on-boarding practices, consisting of both compliance and audit activities.
Annual report 2018 114
Creating valueTieto 2018 Governance Financials Sustainability

Sustainability area Goal Target 2020 Result 2018 Result 2017 Status Sustainable Development Goal1)
EQUAL OPPORTUNITIES
Completion of Code of Conduct e-learning for awareness on equality, ratio
100% 87% 88%On
target
EMPLOYEE EXPERIENCE
Employee engagement score 73% 75% 73%Target
reached
% of employees who are always or often stressed and unable to recover
Keep lowNot
reported2) 3%Not
reported
ETHICAL CULTURE
Completion of Code of Conduct e-learning, ratio
100% 87% 88%On
target
INFORMATION SECURITY AND DATA PRIVACY
Total number of substantiated complaints regarding breaches of customers’ privacy and losses of customer data
0 1 0On
target
SUSTAINABLE SUPPLY CHAIN
New or renewed suppliers agreeing to Tieto’s Supplier Code of Conduct, ratio3) 100% 100% 100%
Target reached
GREENHOUSE GAS EMISSIONS
Reduction of CO2 emissions from Tieto's indirect energy consumption4)
-50% -12% -44%Target
reached5)
SUSTAINABLE IT SOLUTIONS
Total ktons CO2 avoided by customers through use of Tieto's IT services
Increase customers' avoided CO2emissions exceeding Tieto's own
CO2 emissions
76 kton CO2 75 kton CO2
On target
1) United Nations Sustainable Development Goals: https://sustainabledevelopment.un.org/2) The employee stress indicator was not measured in 2018 due to changes in measuring frequency. The indicator will be followed up in 2019 and reported on in next year’s report. However, actions to resolve causes of stress continued throughout 2018 and all identified stress drivers were improved; access to information (+8%), clarity on roles and responsibilities (+9) and freedom to express ideas/views without fear of negative consequences (+6%).3) Scope: Agreements made through Procurement function.4) Tieto’s CO2 emission reporting follows the methodology of the Greenhouse Gas Protocol Corporate Standard. The greenhouse gas emission reduction goal is reported on market based CO2 emissions.5) Aggregated reduction of CO2 emissions totals 56% comparing to 2016 baseline.
Goals and results for each sustainability area
Annual report 2018 115
Creating valueTieto 2018 Governance Financials Sustainability

Shareholders’ Nomination Board The Board of DirectorsIn September, the shareholders who wished to participate in the work of the Shareholders’ Nomination Board nominated the following members:
• Martin Oliw, Partner, Cevian Capital AB,• Petter Söderström, Investment Director,
Solidium Oy,• Mikko Mursula, Chief Investment Officer,
Ilmarinen Mutual Pension Insurance Company,
• Satu Huber, Chief Executive Officer, Elo Mutual Pension Insurance Company and
• Kurt Jofs, Chairman of the Board of Directors, Tieto Corporation.
The largest shareholders were determined on the basis of the shareholdings registered in the Finnish and Swedish book-entry systems on 31 August 2018.
It is the general obligation of Tieto’s Board of Directors to safeguard the interests of the company and its shareholders.
Composition and election of Tieto’s Board of Directors
According to Tieto’s Articles of Association, the Board of Directors shall consist of at least six and no more than twelve members. Board members have a term of office of one year, expiring at the closing of the first AGM following the election.
The company has defined as an objective that in addition to professional competence, Tieto’s Board members shall be diversified in terms of gender and educational/professional background and that the Board as a group shall have sufficient knowledge of and competence in, inter alia, the company’s field of business and markets.
The SNB, which consists of representatives nominated by the company’s largest shareholders, prepares a proposal on the composition of the Board to be presented to the AGM for its decision. In addition to the Board of Directors having established the diversity principles and included them in
the Board charter, the company has taken steps to ensure that the principles have been included in the charter of the SNB and taken into account in the candidate search. The ratio of gender diversity of the members elected by the AGM has remained stable since 2012 and been either 2:6 or 2:5 (currently 40.0% female and 60.0% male members).
In addition to the members proposed by the SNB and elected by the AGM, Tieto’s personnel elects two members and two deputy members to the Board of Directors. The term of office for the personnel representatives is two years. This special appointment procedure is a departure from Recommendation 5 “Election of the Board of Directors” of the Corporate Governance Code 2015. Personnel representation is based on the Finnish Act on Personnel Representation in the Administration of Undertakings and was originally agreed between Tieto Corporation and the personnel of the Group by way of a Personnel Representation Cooperation Agreement in 2001.
The objectives of personnel representation are, inter alia, to provide opportunities for the personnel to influence and affect the organization, to improve communication
Annual report 2018 116
Creating valueTieto 2018 Governance Financials Sustainability

and decision making within the Group, to increase mutual trust and confidence between corporate management and the personnel as well as to increase and develop the feeling of security among the personnel. The personnel representatives, however, are not entitled to participate in the handling of matters that concern the appointment or dismissal of corporate management, the contractual terms of the management, the terms of employment of staff or matters related to industrial actions.
All Board members elected by the AGM of Tieto are independent of the company and
five out of seven members are independent of the company’s significant shareholders. The independence of the members is evaluated at the Board’s constitutive meeting. The Board members shall inform the Board if any changes in these circumstances occur, in which case their independence will be re-evaluated.
More detailed background information regarding the Board members, such as working experience, past and present positions of trust and the Remuneration Statement, is presented on the company’s website at www.tieto.com/investors.
Board of Directors as at 31 December 2018
Name Born Nationality Education Main occupation
Kurt Jofs (Chairman)
1958 Swedish MSc. (Eng.) Entrepreneur, investor and Board member
Harri-Pekka Kaukonen (Deputy Chairman)
1963 Finnish DSc. (Tech.) Professional Board member
Timo Ahopelto 1975 Finnish MSc. (Tech.) Entrepreneur, investor and Board member
Liselotte Hägertz Engstam 1960 Swedish MSc. (Civ. Eng.)
Expert advisor, Board member
Johanna Lamminen 1966 Finnish DSc. (Tech.), MBA
CEO, Gasum Ltd
Endre Rangnes 1959 Norwegian BBA (Econ.)
Professional Board member
Jonas Synnergren 1977 Swedish MSc. (Econ.) Partner, Cevian Capital AB
Esa Koskinen (Personnel representative)
1955 Finnish MSc. (Econ.)
Test Engineer
Robert Spinelli (Personnel representative)
1957 Swedish General Data Processing
Customer Executive
Annual report 2018 117
Creating valueTieto 2018 Governance Financials Sustainability
The President and CEO and operative management Tieto Group’s operative management consists of the President and CEO, the Leadership Team and the Industry Group, Service Line and Product Development Services (PDS) organizations. The Industry Solutions Service Line includes the New Data-Driven Businesses unit organized independently of other businesses.
The President and CEO is appointed by the Board and he is responsible for the Group’s operative management, internal efficiency and quality.
The President and CEO is assisted by the Leadership Team, which includes the heads of Industry Groups and Service Lines, head of New Data-Driven Businesses, the CFO and the head of HR. Appointments of Leadership Team members are approved by the Chairman of the Board based on the President and CEO’s proposal.
The Leadership Team members are accountable for the performance and development of their management areas and they supervise the operations of the units belonging to their areas. As a general rule, the business units in both management
dimensions (Industry Groups, Service Lines and PDS) make their own operative decisions and are responsible for conducting their operative duties.
The Industry Group, Service Line and PDS organizations have a profit and loss responsibility. Further, the Leadership Team also monitors the company’s corporate responsibility (CR) performance and approves the CR goals in cooperation with the Board of Directors.
Tieto announced the following changes in its Leadership Team during the year:
• Ari Järvelä was appointed as Head of Business Consulting and Implementation service line as from 1 April. He also continues in his role as head of Data-Driven Businesses and as a member of Tieto’s Leadership Team.
• In July, Tieto appointed Tomi Hyryläinen (M.Sc., Econ.) as Chief Financial Officer (CFO) and a member of the company’s Leadership Team as of February 2019. Janne Salminen, currently Head of Treasury and Group reporting, took on the role of acting CFO as of 17 July 2018.
• In March, Tieto appointed Markus Suomi (M.Sc., Software Engineering and Industrial Economics) as Chief Technology Officer (CTO) and a member of the company’s Leadership Team as of 1 April. Suomi will drive collaboration and co-innovation with global technology partners as well as fast adoption of the latest technologies for the benefit of Tieto and its Nordic customers.
• In November, Tieto appointed Julius Manni (M.Sc., Economics and Business Administration) as Chief Experience Officer and a member of the company’s Leadership Team as of 1 March 2019. Manni will be responsible for driving holistic customer experience and identity development, taking an active role in the company’s innovation agenda and leading marketing and communications.
Annual report 2018 118
Creating valueTieto 2018 Governance Financials Sustainability
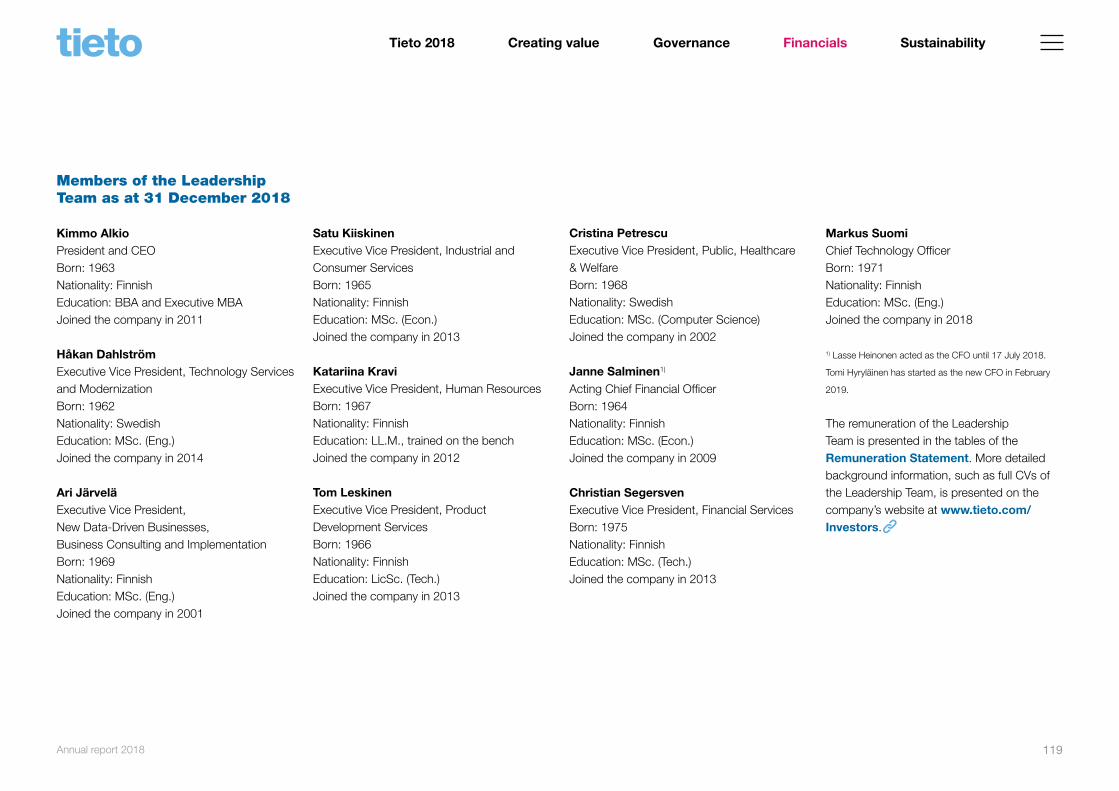
Members of the Leadership Team as at 31 December 2018
Kimmo Alkio President and CEO Born: 1963 Nationality: FinnishEducation: BBA and Executive MBA Joined the company in 2011
Håkan DahlströmExecutive Vice President, Technology Services and ModernizationBorn: 1962 Nationality: Swedish Education: MSc. (Eng.)Joined the company in 2014
Ari JärveläExecutive Vice President, New Data-Driven Businesses, Business Consulting and ImplementationBorn: 1969Nationality: Finnish Education: MSc. (Eng.)Joined the company in 2001
Satu KiiskinenExecutive Vice President, Industrial and Consumer ServicesBorn: 1965 Nationality: FinnishEducation: MSc. (Econ.) Joined the company in 2013
Katariina KraviExecutive Vice President, Human Resources Born: 1967Nationality: FinnishEducation: LL.M., trained on the bench Joined the company in 2012
Tom LeskinenExecutive Vice President, Product Development ServicesBorn: 1966 Nationality: FinnishEducation: LicSc. (Tech.) Joined the company in 2013
Cristina PetrescuExecutive Vice President, Public, Healthcare & WelfareBorn: 1968 Nationality: SwedishEducation: MSc. (Computer Science) Joined the company in 2002
Janne Salminen1)
Acting Chief Financial Officer Born: 1964 Nationality: FinnishEducation: MSc. (Econ.) Joined the company in 2009
Christian SegersvenExecutive Vice President, Financial ServicesBorn: 1975 Nationality: FinnishEducation: MSc. (Tech.) Joined the company in 2013
Markus SuomiChief Technology OfficerBorn: 1971 Nationality: FinnishEducation: MSc. (Eng.) Joined the company in 2018
1) Lasse Heinonen acted as the CFO until 17 July 2018.
Tomi Hyryläinen has started as the new CFO in February
2019.
The remuneration of the Leadership Team is presented in the tables of the Remuneration Statement. More detailed background information, such as full CVs of the Leadership Team, is presented on the company’s website at www.tieto.com/Investors.
Annual report 2018 119
Creating valueTieto 2018 Governance Financials Sustainability

AuditorsThe ARC prepares a proposal on the appointment of Tieto’s auditors, which is then presented to the Board and finally to the AGM for its decision. The compensation paid to the auditors is decided by the AGM and assessed annually by the ARC.
The Board of Directors proposes to the Annual General Meeting, in accordance with the recommendation of the Audit and Risk Committee of the Board of Directors that the auditor to be elected at the AGM 2019 be reimbursed according to the auditor's invoice and in compliance with the purchase principles approved by the Committee.
The Board of Directors proposes to the Annual General Meeting, in accordance with the recommendation of the Audit and Risk Committee of the Board of Directors, that the firm of authorized public accountants Deloitte Oy be elected as the company's auditor for the financial year 2019. The firm of authorized public accountants Deloitte Oy has notified that Jukka Vattulainen, Authorized Public Accountant, will act as the auditor with principal responsibility.
Auditing
The AGM 2018 re-elected the firm of authorized public accountants PricewaterhouseCoopers Oy as the company’s auditor for the financial year 2018. PricewaterhouseCoopers Oy notified the company that Authorized Public Accountant Tomi Hyryläinen acts as principal auditor. Due to the appointment of Tomi Hyryläinen as Tieto’s CFO as from February 2019, PricewaterhouseCoopers Oy resigned from the audit assignment for the financial year 2018. The Finnish Patent and Registration Office designated Deloitte Oy as the new auditor. Authorized Public Accountant Jukka Vattulainen has acted as the auditor with principal responsibility.
In 2018, Tieto Group paid the auditors a total of EUR 1.1 (0.8) million in audit fees, of which EUR 0.8 (0.8) million to the Group’s auditor PricewaterhouseCoopers and 0.3 (-) million to Deloitte, and a total of EUR 0.8 (0.3) million for other services, of which EUR 0.6 (0.3) million to the Group’s auditor PricewaterhouseCoopers and 0.2 (-) to Deloitte.
Annual report 2018 120
Creating valueTieto 2018 Governance Financials Sustainability

Shares and shareholdersTieto Corporation’s issued and registered share capital on 31 December 2018 totalled EUR 76 555 412.00 and the number of shares was 74 109 252.
Tieto’s shares have no par value and their book counter value is one euro. Tieto’s shares are listed on NASDAQ in Helsinki and Stockholm. The company has one class of shares, with each share conferring equal dividend rights and one vote. The company’s Articles of Association include a restriction on voting at the Annual General Meeting, where no-one is allowed to vote with more than one-fifth of the votes represented at the meeting.The Articles of Association are available at www.tieto.com/investors.
Shareholders and holding of own shares
The company had 26 746 registered shareholders at the end of 2018. Based on the ownership records of the Finnish and Swedish central securities depositories, 34.1% of Tieto’s shares were held by Finnish and 2.9% by Swedish investors. In total, there
were 25 012 retail investors in Finland and Sweden and they held 12% of Tieto’s shares.
The members of the Board of Directors, the President and CEO and their close associates together held 0.1% of the shares and votes registered in the book-entry system on 31 December 2018. The President and CEO is also participating in Tieto’s long-term share-based incentive plans. Potential rewards will be paid partly in Tieto shares. As the number of additional shares related to these incentives is dependent on the company’s performance these are not included in this aggregate number.
Tieto has three longer-term shareholders holding 10% or more of the shares: Cevian Capital Partners Ltd, Solidium Oy and Silchester International Investors LLP. Based on the latest information (31 August 2018), Cevian Capital's holding was 11 066 684 shares, representing 14.9% of the shares and voting rights. Solidium Oy held 10.0% of Tieto’s shares on 31 December 2018. Based on its announcement made on 23 June 2015, Silchester International Investors LLP’s aggregate holding in Tieto was 7 401 027
shares, which represents 10.0% of the shares and voting rights.
Tieto is not aware of any shareholder agreements or cross-shareholdings that would limit the amount of shares available for trading. The free float of the shares, excluding the treasury shares currently held by the company, can be considered to be 100%.
At the end of 2018, the number of shares in the company’s or its subsidiaries’ possession totalled 282 903, representing 0.4% of the total number of shares and voting rights. Related to the company’s share-based reward plan, a total of 103 224 shares held by Tieto were transferred to the participants of the plan. The number of outstanding shares, excluding the treasury shares, was 73 826 349 at the end of the year.
Share-based incentive plans
Tieto has three share-based incentive plans, a Performance Share Plan 2016, 2017 and 2018 and a Restricted Share Plan 2016, 2017 and 2018. The potential rewards will be paid
partly in the company’s shares and partly in cash, in 2019, 2020 and 2021 respectively. The share rewards to be delivered to the participants will consist of shares to be acquired from the market. Thus, no new shares will be issued in connection with the plans. The rewards to be paid on the basis of the plans correspond to the value of an approximate maximum total of 1 500 000 Tieto shares (including the proportion to be paid in cash). The company has not issued any bonds with warrants and does not have any stock option programmes.
Board authorizations
The 2018 Annual General Meeting authorized the Board of Directors to decide on the repurchase of the company's own shares. The amount of own shares to be repurchased shall not exceed 7 400 000 shares, which currently corresponds to approximately 10% of all the shares in the company. The authorization is intended to be used to develop the company’s capital structure.
Annual report 2018 121
Creating valueTieto 2018 Governance Financials Sustainability

Share information
2018 2017 2016 2015 2014Number of shares
Number of shares 74 109 252 74 109 252 74 109 252 74 009 953 73 675 903
Outstanding shares1)
At year end 73 826 349 73 723 125 73 697 570 73 544 869 73 165 084
Average 73 809 855 73 722 565 73 660 433 73 426 563 72 944 228
Share capital at year end, EUR 76 555 412 76 555 412 76 555 412 76 555 412 76 555 412
Per share data
Earnings per share, EUR
Basic 1.67 1.46 1.46 1.23 0.48
Diluted 1.66 1.46 1.46 1.23 0.48
Equity per share, EUR 6.54 6.46 6.62 6.57 6.44
Share price performance and trading volumes
NASDAQ Helsinki
Highest price of share, EUR 30.74 29.98 28.47 25.00 22.64
Lowest price of share, EUR 22.86 24.39 22.20 19.98 16.15
Average price of share, EUR 27.56 26.85 24.83 22.48 19.45
Turnover, number of shares 29 333 439 35 895 771 34 827 778 37 041 013 28 085 320
Turnover, % 39.6 48.4 47.0 50.0 38.1
2018 2017 2016 2015 2014
NASDAQ Stockholm
Highest price of share, SEK 318.80 289.50 275.90 246.10 207.90
Lowest price of share, SEK 235.40 232.20 205.70 183.00 142.10
Average price of share, SEK 283.89 259.19 229.09 210.32 177.45
Turnover, number of shares 1 829 632 2 540 715 1 802 382 1 802 615 3 138 593
Turnover, % 2.5 3.4 2.4 2.4 4.3
Market capitalization, EUR million 1 747.5 1 925.4 1 920.9 1 829.5 1 584.8
Dividends
Dividend, EUR 1 000 103 465 103 212 101 001 99 290 95 177
Dividend per share, EUR 1.45 1.40 1.37 1.35 1.30
Payout ratio, % 86.8 95.9 93.8 109.8 270.8
Price-weighted ratios
NASDAQ Helsinki
Price per earnings ratio (P/E) 14 18 18 20 45
Dividend yield, % 6.1 5.4 5.3 5.5 6.0
NASDAQ Stockholm
Price per earnings ratio (P/E) 14 18 18 20 45
Dividend yield, % 6.1 5.4 5.3 5.5 6.0
1) Adjusted for shares held by the company
Annual report 2018 122
Creating valueTieto 2018 Governance Financials Sustainability

Major shareholders on 31 December 2018
Shares %1 Cevian Capital1) 11 066 684 14.92 Solidium Oy 7 415 418 10.03 Silchester International Investors LLP2) 7 401 027 10.04 Ilmarinen Mutual Pension Insurance Co. 1 443 415 1.95 Swedbank Robur fonder 1 423 054 1.96 Elo Pension Co. 810 000 1.17 The State Pension fund 773 000 1.08 Svenska litteratursällskapet i Finland r.f. 636 345 0.99 Åbo Akademi University Foundation 495 500 0.710 Nordea Funds 383 816 0.5Top 10 shareholders total 31 848 259 43.0- of which nominee registered 18 467 711 24.9
Nominee registered other 29 901 319 40.3Others 12 359 674 16.7Total 74 109 252 100.0
Based on the ownership records of Euroclear Finland Oy and Euroclear Sweden AB.1) Based on the ownership records of Euroclear Finland Oy, Cevian Capital's holding on 31 August 2018 was 11 066 684
shares, representing 14.9% of the shares and voting rights. 2) On 23 June 2015, Silchester International Investors LLP announced that its holding in Tieto Corporation was 7 401 027
shares, which represents 10.0% of the shares and voting rights.
Number of shares
Shareholders SharesNo % No %
1–100 6 573 39.0 354 830 0.5101–500 6 679 39.7 1 737 417 2.3501–1 000 1 793 10.6 1 374 688 1.91 001–5 000 1 494 8.9 3 173 873 4.35 001–10 000 149 0.9 1 042 806 1.410 001–50 000 105 0.6 2 152 190 2.950 001–100 000 25 0.1 1 767 017 2.4100 001–500 000 17 0.1 3 757 132 5.1500 001– 8 0.0 58 738 739 79.3
Based on the ownership records of Euroclear Finland Oy
16. FINANCIALS
OWNERSHIP STRUCTURE ON 31 DEC 2018,
% OF SHARES
Corporations
Finance and insurance institutions
Public organizations
Households
Non-profit organizations
Foreign
Nominee registered
2.9%
14.9%
10.1%
4.4%
0.6%
1.8%
65.3%
FR work number 16
Annual report 2018 123
Creating valueTieto 2018 Governance Financials Sustainability

DividendThe distributable funds of the parent company amount to EUR 642.7 million, of which net profit for the current year amounts to EUR 139.6 million. The Board of Directors proposes a dividend of EUR 1.25 (1.20) per share for 2018. In light of the company’s strong cash flow and targeted capital structure, the Board of Directors proposes an additional dividend of EUR 0.20 (0.20). Tieto will maintain its capacity to invest in growth both organically and inorganically after dividends. The proposed dividend payout does not endanger the solvency of the company.
The dividend shall be paid to shareholders who are recorded in the shareholders’ register held by Euroclear Finland Ltd or the register of Euroclear Sweden AB on the proposed dividend record date, 25 March 2019.
Near-term risks and uncertaintiesConsolidated net sales and profitability are sensitive to volatility in exchange rates, especially that of the Swedish Krona and Norwegian Krona. Sales to Sweden and Norway represent close to half of the Group’s sales. Further details on management of currency risks are provided in the Financial Statements and on currency impacts at www.tieto.com/currency.
Tieto’s ambition to drive customer transformation poses a risk of lower prices in existing services while it also expands the company’s sales opportunities. At the same time, new disruptive technologies, such as cloud computing, drive customer demand towards standardized and less labour-intensive solutions. These changes might result in the need for continuous restructuring and the need to recruit new competences. That may lead to temporarily overlapping personnel costs.
The transformation to the new operating model, announced on 6 February, may affect performance in the short term while the impact of the simplified structure on the full-year results is anticipated to be positive.
The company’s development is relatively sensitive to changes in the demand from large customers as Tieto’s top 10 customers currently account for 29% of its net sales,
with Product Development Services having the highest customer concentration in the company. However, the share has decreased by several percentage points during the past years.
Typical risks faced by the IT service industry relate to the development and implementation of new technologies and software. In Tieto’s case these relate to both own software development and implementation of third-party software for service delivery. Furthermore, additional technology licence fees, the quality of deliveries and related project overruns and penalties pose potential risks.
The new EU General Data Protection Regulation took effect in May 2018. Tieto is well prepared for the new regulation although there is increased uncertainty with regards to how the authorities will interpret the regulation. As many customers still continue to finalize their preparations for the regulation changes, Tieto can tap into opportunities in businesses such as security and application services.
Companies around the world are facing new risks arising from tax audits and some countries may introduce new regulation. Additionally, changes in the tax authorities’ interpretations could have unfavourable impacts on taxpayers.
Annual report 2018 124
Creating valueTieto 2018 Governance Financials Sustainability
Events after the period Full-year outlook for 2019
Financial calendar 2019
On 6 February, Tieto launched a new strategy to take advantage of the rapidly developing opportunities in the data-rich world – and to continue to elevate financial performance and shareholder value. More details available atwww.tieto.com/investors.
Tieto expects its full-year adjusted1) operating profit (EBIT) to increase from the previous year’s level (EUR 168.0 million2) in 2018). The definition of adjusted operating profit has been revised to improve comparability of operating profit also in light of the company’s acquisitions.
1) Adjusted for amortization of acquisition-related intangible
assets, restructuring costs, capital gains/losses, goodwill
impairment charges and other items affecting comparability
2) Not restated for IFRS 16
21 MARCH
Annual General Meeting
Tieto will publish three interim reports in 2019:25 APRIL Interim report 1/2019 (8.00 am EET)
19 JULY Interim report 2/2019 (8.00 am EET)
24 OCTOBER
Interim report 3/2019 (8.00 am EET)
Annual report 2018 125
Creating valueTieto 2018 Governance Financials Sustainability

Earnings per share = Net profit for the period
Average number of shares
Calculation of alternative performance measures
Tieto presents certain financial measures, which, in accordance with the “Alternative Performance Measures” guidance issued by the European Securities and Markets Authority, are not accounting measures defined or specified in IFRS and are, therefore, considered alternative performance measures. Tieto believes that alternative performance measures provide meaningful supplemental information to the financial measures presented in the consolidated financial statements prepared in accordance with IFRS and increase the understanding of the profitability of Tieto’s operations. Alternative performance measures are not accounting measures defined or specified in IFRS and, therefore, they are considered non-IFRS measures, which should not be viewed in isolation or as a substitute to the IFRS financial measures.
Calculation of key figuresAdjusted earnings per share = Net profit for the period excluding adjustments, net of tax
Average number of shares
Adjustments = Restructuring costs + capital gains/losses + goodwill impairment charges + other items affecting comparability
Adjusted operating profit (EBIT) = Operating profit + adjustments
Adjusted operating profit margin (EBIT), %
= Adjusted operating profit (EBIT)Net sales
Equity per share = Total equityNumber of shares at the year-end
Capital expenditure = Acquisitions of intangible assets and property, plant and equipment
Acquisitions = Acquisitions of subsidiaries and business operations, net of cash acquired
Return on equity, 12-month rolling, %
= Profit before taxes and non-controlling interests – income taxes * 100Total equity (12-month average)
Return on capital employed, 12-month rolling, %
= Profit before taxes and non-controlling interests + interest and other financial expenses * 100Total assets – non-interest-bearing liabilities (12-month average)
Equity ratio, % = Total equity * 100Total assets – advance payments
Interest-bearing net debt = Interest-bearing liabilities – interest-bearing receivables – cash and cash equivalents – securities carried as current assets
Net debt/EBITDA = Interest-bearing net debt EBITDA (12-month average, excluding capital gains)
Gearing, % = Interest-bearing net debt * 100Total equity
Annual report 2018 126
Creating valueTieto 2018 Governance Financials Sustainability

Reconciliation of alternative performance measures
Adjusted operating profit (EBIT)
EUR million 2018 2017
Operating profit (EBIT) 154.7 139.1
+ restructuring costs 9.3 22.7
+ premises related expenses 0.3 -
- capital gains -4.6 -
+ capital losses - 0.3
+/- M&A related items 1.4 -0.2
+/- other items 1.8 -0.5
Adjusted operating profit (EBIT) 162.8 161.4
Annual report 2018 127
Creating valueTieto 2018 Governance Financials Sustainability
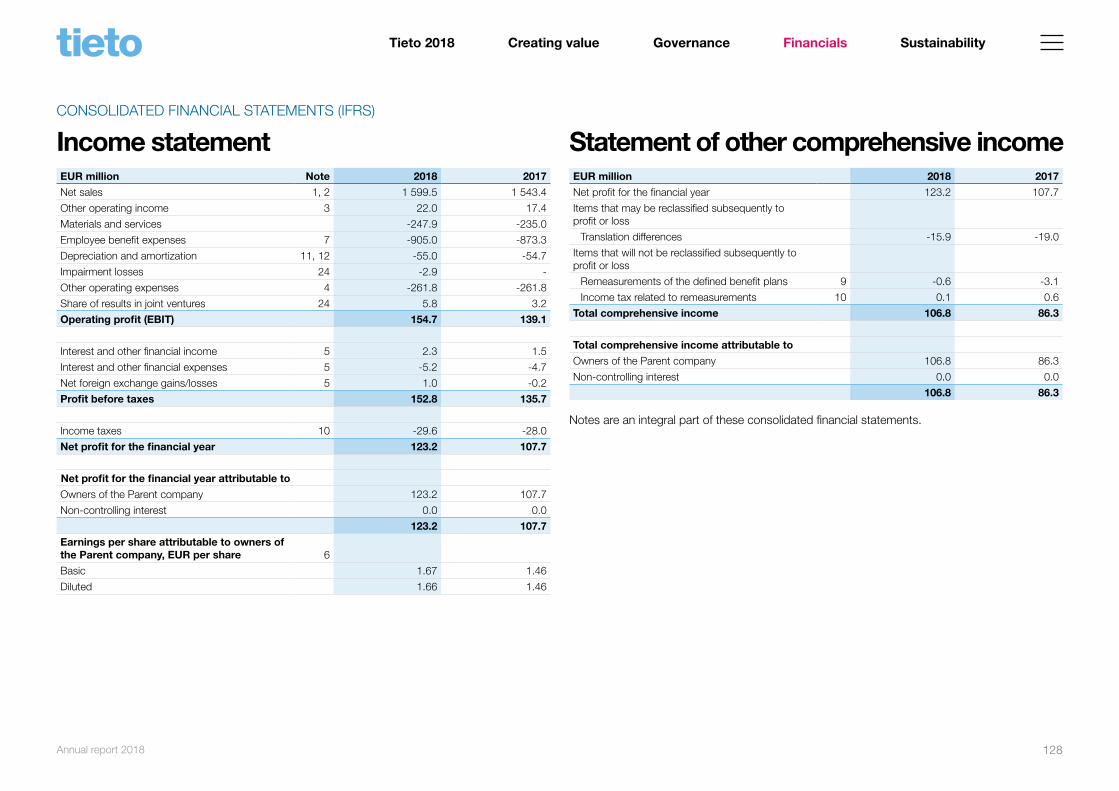
EUR million Note 2018 2017
Net sales 1, 2 1 599.5 1 543.4
Other operating income 3 22.0 17.4
Materials and services -247.9 -235.0
Employee benefit expenses 7 -905.0 -873.3
Depreciation and amortization 11, 12 -55.0 -54.7
Impairment losses 24 -2.9 -
Other operating expenses 4 -261.8 -261.8
Share of results in joint ventures 24 5.8 3.2
Operating profit (EBIT) 154.7 139.1
Interest and other financial income 5 2.3 1.5
Interest and other financial expenses 5 -5.2 -4.7
Net foreign exchange gains/losses 5 1.0 -0.2
Profit before taxes 152.8 135.7
Income taxes 10 -29.6 -28.0
Net profit for the financial year 123.2 107.7
Net profit for the financial year attributable to
Owners of the Parent company 123.2 107.7
Non-controlling interest 0.0 0.0
123.2 107.7
Earnings per share attributable to owners of the Parent company, EUR per share 6
Basic 1.67 1.46
Diluted 1.66 1.46
EUR million 2018 2017
Net profit for the financial year 123.2 107.7
Items that may be reclassified subsequently to profit or loss
Translation differences -15.9 -19.0
Items that will not be reclassified subsequently to profit or loss
Remeasurements of the defined benefit plans 9 -0.6 -3.1
Income tax related to remeasurements 10 0.1 0.6
Total comprehensive income 106.8 86.3
Total comprehensive income attributable to
Owners of the Parent company 106.8 86.3
Non-controlling interest 0.0 0.0
106.8 86.3
Notes are an integral part of these consolidated financial statements.
Income statement Statement of other comprehensive incomeCONSOLIDATED FINANCIAL STATEMENTS (IFRS)
Annual report 2018 128
Creating valueTieto 2018 Governance Financials Sustainability

Statement of financial positionAssets
EUR million Note 31 Dec 2018 31 Dec 2017Non-current assets
Goodwill 11, 25, 26 442.6 441.3
Other intangible assets 11 45.6 51.1
Property, plant and equipment 12 92.3 94.9
Interests in joint ventures 24 16.0 16.3
Deferred tax assets 10 23.6 25.7
Defined benefit plan assets1) 9 5.5 7.4
Finance lease receivables 18 0.7 0.8
Other financial assets at amortized cost 0.5 0.4
Other financial assets at fair value through profit or loss 0.5 0.5
Other non-current receivables1) 13 14.9 8.9
Total non-current assets 642.3 647.4Current assets
Trade and other receivables1) 13 382.9 413.6
Finance lease receivables 18 0.9 2.0
Current tax assets 6.9 8.7
Cash and cash equivalents 14 164.6 78.2
Total current assets 555.3 502.5
Total assets 1 197.6 1 149.9
1) Comparative figures reclassified from current to non-current assets.
Equity and liabilitites
EUR million Note 31 Dec 2018 31 Dec 2017Equity 15
Share capital 76.6 76.6
Share premium and other reserves 41.5 42.6
Invested unrestricted equity reserve 12.8 12.8
Retained earnings 351.7 343.8
Equity attributable to owners of the Parent company 482.5 475.8
Non-controlling interest 0.0 0.4
Total equity 482.5 476.1Non-current liabilities
Loans 16, 18 185.5 102.5
Deferred tax liabilities 10 38.0 38.5
Provisions 17 3.3 2.6
Defined benefit obligations 9 9.9 11.9
Other non-current liabilities 3.2 4.5
Total non-current liabilities 240.0 160.0Current liabilities
Trade and other payables 19 340.1 362.9
Current tax liabilities 8.9 5.9
Provisions 17 7.4 10.3
Loans 16, 18 118.6 134.6
Total current liabilities 475.0 513.7
Total equity and liabilities 1 197.6 1 149.9
Notes are an integral part of these consolidated financial statements.
Annual report 2018 129
Creating valueTieto 2018 Governance Financials Sustainability

Statement of cash flowsEUR million Note 2018 2017Cash flow from operating activities
Net profit for the financial year 123.2 107.7
Adjustments
Depreciation, amortization and impairment losses 11, 12, 24 57.9 54.7
Profit/loss on sale of property, plant and equipment, subsidiaries and business operations 3, 25 -5.0 0.0
Share of results in joint ventures 24 -5.8 -3.2
Other adjustments -0.1 -3.5
Net financial expenses 5 1.9 3.4
Income taxes 10 29.6 28.0
Change in net working capital
Change in current receivables 20.3 -27.9
Change in current non-interest-bearing liabilities -23.5 12.5
Cash generated from operating activities before interests and taxes 198.6 171.8
Interest received 2.1 1.6
Interest paid -3.9 -3.6
Other financial income received 7.7 9.8
Other financial expenses paid -12.0 -15.2
Dividends received 24 3.2 3.5
Income taxes paid -21.4 -16.9
Cash flow from operating activities 174.2 151.0
EUR million Note 2018 2017Cash flow from investing activities
Acquisition of subsidiaries and business operations, net of cash acquired 25 -14.5 -43.7
Capital expenditure -45.0 -47.0
Disposal of subsidiaries and business operations, net of cash disposed 25 8.4 -0.3
Proceeds from sale of property, plant and equipment 0.6 0.4
Change in loan receivables 1.2 2.7
Cash flow from investing activities -49.3 -87.9
Cash flow from financing activities
Dividends paid -103.4 -101.0
Repayments of finance lease liabilities 16 -0.8 -1.0
Short-term financing, net (increase +/decrease -) 16 -116.9 61.6
Proceeds from long-term borrowings 16 185.0 0.5
Repayments of long-term borrowings 16 -1.6 -0.3
Other financing cash flow -3.5 -
Cash flow from financing activities -41.2 -40.2
Change in cash and cash equivalents 83.7 22.9
Cash and cash equivalents at the beginning of period 14 78.2 56.7
Foreign exchange differences 2.7 -1.4
Change in cash and cash equivalents 83.7 22.9
Cash and cash equivalents at the end of period 164.6 78.2
Notes are an integral part of these consolidated financial statements.
Annual report 2018 130
Creating valueTieto 2018 Governance Financials Sustainability

Owners of the Parent company
EUR million NoteShare
capital
Share premium and
other reservesOwn
sharesTranslation differences
Invested unrestricted
equity reserveRetained earnings Total
Non-controlling
interest
Total
equity31 Dec 2017 76.6 42.6 -11.6 -78.5 12.8 433.8 475.8 0.4 476.1
Adjustment on initial application of IFRS 9, net of tax - - - - - -0.4 -0.4 - -0.4
Adjustment on initial application of IFRS 2 amendment - - - - - 4.0 4.0 - 4.0
Other adjustment - - 3.9 - - -3.9 0.0 - 0.0
1 Jan 2018 76.6 42.6 -7.7 -78.5 12.8 433.5 479.4 0.4 479.7
Comprehensive income
Net profit for the financial year - - - - - 123.2 123.2 0.0 123.2
Other comprehensive income, net of tax
Remeasurements of the defined benefit plans, net of tax - - - - - -0.5 -0.5 - -0.5
Translation differences - -1.1 - -14.8 - 0.0 -15.9 - -15.9
Total comprehensive income - -1.1 - -14.8 - 122.7 106.8 0.0 106.8
Transactions with owners
Contributions and distributions
Share-based incentive plans 8 - - 2.6 - - 0.1 2.7 - 2.7
Dividends - - - - - -103.4 -103.4 - -103.4
Changes in ownership interests
Acquisition of non-controlling interest without change in control - - - - - -2.9 -2.9 -0.4 -3.3
Total transactions with owners - - 2.6 - - -106.2 -103.6 -0.4 -104.0
31 Dec 2018 76.6 41.5 -5.1 -93.3 12.8 450.0 482.5 0.0 482.5
Notes are an integral part of these consolidated financial statements.
Statement of changes in shareholders' equity
Annual report 2018 131
Creating valueTieto 2018 Governance Financials Sustainability
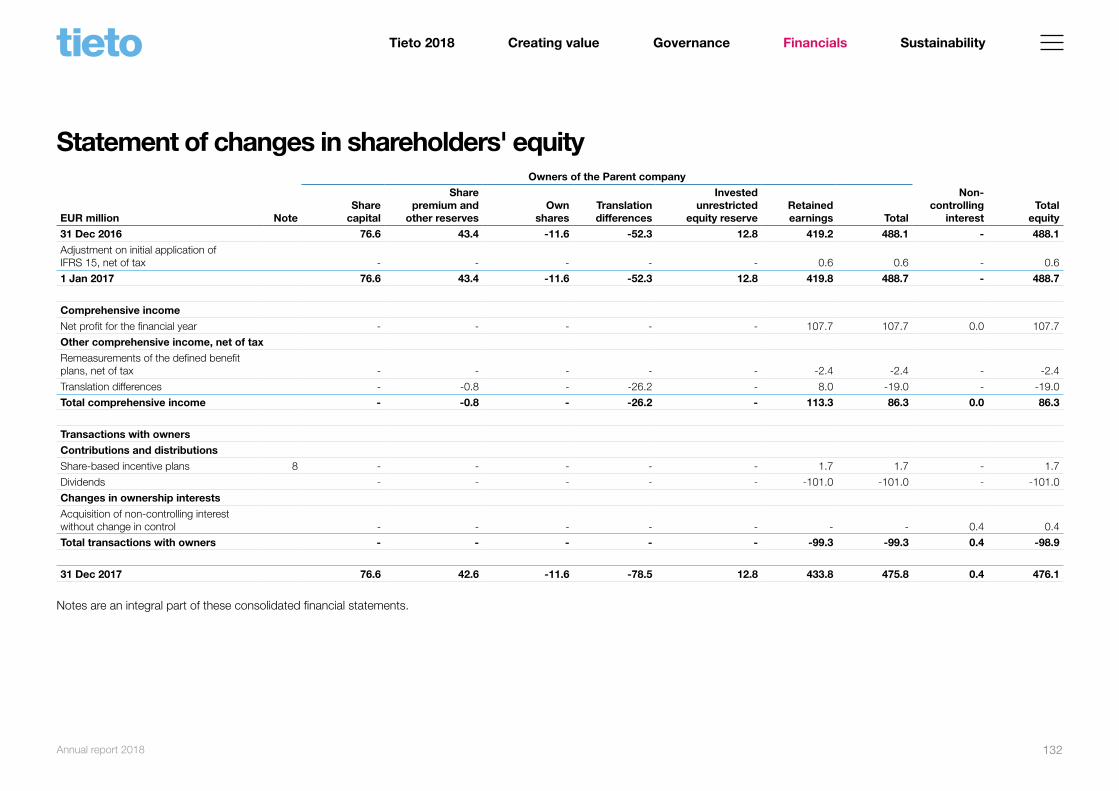
Owners of the Parent company
EUR million NoteShare
capital
Share premium and
other reservesOwn
sharesTranslation differences
Invested unrestricted
equity reserveRetained earnings Total
Non- controlling
interestTotal
equity 31 Dec 2016 76.6 43.4 -11.6 -52.3 12.8 419.2 488.1 - 488.1
Adjustment on initial application of IFRS 15, net of tax - - - - - 0.6 0.6 - 0.6
1 Jan 2017 76.6 43.4 -11.6 -52.3 12.8 419.8 488.7 - 488.7
Comprehensive income
Net profit for the financial year - - - - - 107.7 107.7 0.0 107.7
Other comprehensive income, net of tax
Remeasurements of the defined benefit plans, net of tax - - - - - -2.4 -2.4 - -2.4
Translation differences - -0.8 - -26.2 - 8.0 -19.0 - -19.0
Total comprehensive income - -0.8 - -26.2 - 113.3 86.3 0.0 86.3
Transactions with owners
Contributions and distributions
Share-based incentive plans 8 - - - - - 1.7 1.7 - 1.7
Dividends - - - - - -101.0 -101.0 - -101.0
Changes in ownership interests
Acquisition of non-controlling interest without change in control - - - - - - - 0.4 0.4
Total transactions with owners - - - - - -99.3 -99.3 0.4 -98.9
31 Dec 2017 76.6 42.6 -11.6 -78.5 12.8 433.8 475.8 0.4 476.1
Notes are an integral part of these consolidated financial statements.
Statement of changes in shareholders' equity
Annual report 2018 132
Creating valueTieto 2018 Governance Financials Sustainability

Corporate information
Tieto Corporation (business identity code 0101138-5) is a Finnish public limited IT service and software company organized under the laws of Finland. It is domiciled in Espoo and the address of the Group head office is Keilalahdentie 2-4, 02101 Espoo, Finland. The company is listed on NASDAQ Helsinki and Stockholm. The Board of Directors approved these consolidated financial statements to be published on 28 February 2019. According to the Limited Liability Companies Act, the shareholders have the right at the Annual General Meeting to either approve, amend or reject the consolidated financial statements after the publication.
Basis of preparation
These consolidated financial statements of Tieto Corporation have been prepared in accordance with International Financial Reporting Standards (IFRS) and IFRIC interpretations as adopted by the European Union. The financial statements also comply with Finnish accounting principles and corporate legislation complementing the IFRSs. The consolidated financial statements are presented in millions of euros and have been prepared under the historical cost convention, unless otherwise stated in these accounting policies. All figures presented have been rounded, and consequently the sum of individual figures can deviate from the presented sum figure. Key figures have been calculated using exact figures.
Adoption of new and amended IFRS standards and interpretations
The Group has applied the following new or amended standards starting from 1 January 2018.
IFRS 15 Revenue from Contracts with CustomersIFRS 15 is based on the principle that revenue is recognized when control of a good or service transfers to a customer. The adoption of IFRS 15 resulted in changes in accounting policies and adjustments to the amounts recognized in the financial statements. In accordance with
Accounting policies for the consolidated accountsthe transition provisions in IFRS 15, the new principles have been adopted retrospectively and comparatives for the 2017 financial year have been restated. The Group applied the following practical expedients when adopting IFRS 15: completed contracts were not restated, the variable consideration amounts were not estimated for the comparative accounting periods and contracts were not retrospectively restated for contract modifications. According to IFRS 15, the set-up costs related to transition projects are capitalized and amortized during the period when the revenue for related continuous operating service contract is recognized. This resulted to EUR 0.6 million change on opening retained earnings as of 1 January 2017. The impact on 2017 net sales was EUR 0.2 million, on costs EUR 0.3 million and on operating profit EUR -0.1 million. The revised accounting policy on revenue recognition is described under heading Revenue recognition.
IFRS 9 Financial InstrumentsIFRS 9 addresses the following aspects of Financial Instruments accounting: Recognition and derecognition, Classification and measurement, including impairment and Hedge accounting. The Group applied the exemption, as allowed by the standard, not to restate comparative periods. Differences in the carrying amounts of financial assets and financial liabilities resulting from the adoption of IFRS 9 have been recognized as a decrease of EUR 0.4 million (net of tax) in opening retained earnings for 1 January 2018. IFRS 9 implementation also resulted in changes in the accounting policies applied to financial instruments which are described under heading Financial Instruments.
Amendments to IFRS 2 ‘Share-based Payments – Classification and Measurement of Share-based Payment Transactions’The amendments clarify the accounting for certain types of arrangements. Three accounting areas are covered: measurement of cash-settled share-based payments, classification of share-based payments settled net of tax withholdings, and accounting for a modification of a share-based payment from cash-settled to equity-settled.
The Group has share-based incentive plans for key employees for which more information is disclosed in these financial statements. The amendment regarding the classification of share-based incentive plans net of tax withholdings had an impact on the consolidated
NOTES TO THE CONSOLIDATED FINANCIAL STATEMENTS (IFRS)
Annual report 2018 133
Creating valueTieto 2018 Governance Financials Sustainability

financial statements of the Group. As Tieto’s share-based incentive plans will according to the amendment be fully accounted for as equity-settled, the fair values of the programmes over the vesting period will be fully determined based on the share price at the grant date. On transition, the Group has reclassified EUR 4.0 million from liabilities to equity.
The group has not yet applied the following new and amended standards and interpretations already issued. Those will be adopted as of the effective date.
IFRS 16 Leases (effective for the financial years beginning on or after 1 January, 2019) IFRS 16 will result in almost all leases being recognized on the statement of financial position, as the distinction between operating and finance leases is removed. Under the new standard, an asset (the right to use the leased item) and a financial liability to pay rentals are recognized in the statement of financial position. The Group will apply exceptions allowed by the standard for short-term and low-value leases. The accounting for lessors will not significantly change.
The Group will adopt the modified retrospective approach upon transition, resulting with all transition impact being reported as adjustment to opening retained earnings and comparative periods are not restated. The Group will use practical expedient not to reassess definition of a lease and apply IFRS 16 to all existing operating leases as of 31 Dec 2018.
On the reporting date, the Group has non-cancellable operating lease commitments of EUR 182.0 million, see note 27. It is estimated that IFRS 16 has the following impact on the Group financial statements:
Income Statement (EUR million)
As reported in 2018 IFRS 16 Impact
Employee benefit expenses (currently including car benefit expenses) -905.0 decrease of <1%
Depreciation, amortization and impairment losses -55.0 increase of ~90%
Other operating expenses -261.8 decrease of ~20%
EBIT 154.7 increase of ~2.5–3.0%
Interest expenses -5.2 increase of 100–115%
Profit before taxes 152.8 decrease of ~1%
Statement of Financial Position (EUR million)
Lessee reporting1) IFRS 16 Impact2)
Right of use assets (increase) EUR 155–165 million
Lease liabilities (increase) EUR 158–168 million
Deferred rent and Accrued lease payments as of 31 Dec 2018 (decrease) EUR 1.5–2.0 million
1) Impact on Lessor accounting not material.
2) Impacts premises, cars and equipment.
Key figures As reported in 2018 IFRS 16 Impact
Net debt 137.4 increase of 115–125%
Net debt/EBITDA 0.7 increase of ~0.5
Other standardsOther new or amended IFRS standards or IFRIC interpretations that are not yet effective are not expected to have a material impact on Tieto’s consolidated financial statements in the current or future reporting periods.
Annual report 2018 134
Creating valueTieto 2018 Governance Financials Sustainability

Consolidation principles
The consolidated financial statements include the Parent company Tieto Corporation and all subsidiaries over which the Parent company has directly or indirectly more than one half of the voting rights, or the Parent company is otherwise in control of the company. Control exists when Tieto is exposed to, or has rights to, variable returns from its involvement with the entity and can affect those returns through its power over the entity.
Subsidiaries are consolidated from the date on which control is achieved until the date on which control ceases by using the acquisition method. The consideration transferred for the acquisition of a subsidiary is the fair values of the assets transferred, the liabilities incurred and the equity interests issued by the Group and it includes also the fair value of any asset or liability resulting from a contingent consideration. Contingent consideration classified as liability is remeasured at its fair value at each reporting date and the subsequent changes to fair value are recognized in profit or loss. Acquisition related costs are expensed as incurred. Identifiable assets acquired and liabilities and contingent liabilities assumed in a business combination are measured initially at their fair values at the acquisition date. On an acquisition-by-acquisition basis, the Group recognizes any non-controlling interest in the acquiree either at fair value or at the non-controlling interest's proportionate share of the acquiree's net assets.
The excess of the consideration transferred, the amount of any non-controlling interest in the acquiree and the acquisition-date fair value of any previous equity interest in the acquiree over the fair value of the identifiable net assets acquired is recognized as goodwill at the acquisition date. If the cost of the acquisition is less than the fair value of the net assets acquired in the case of a bargain purchase, the resulting gain is recognized in profit or loss.
Intra-group receivables, payables and transactions including dividends and internal profit are eliminated on consolidation. When necessary, subsidiaries’ accounting policies have been aligned to correspond to the Group’s accounting policies. The result for the period and items of other comprehensive income are allocated to the equity holders of the company
and non-controlling interests and presented in the income statement and statement of other comprehensive income. Non-controlling interests are shown separately under shareholders' equity.
Companies, where Tieto has assumed management responsibility, has contractually based joint control with a third party and has right to the net assets of the company based on the contractual arrangement are included in the consolidated financial statements as joint ventures. Joint ventures are accounted by using the equity method under which the investments in joint ventures are initially recognized at cost and adjusted thereafter to recognize the Group's share of the post-acquisition profits or losses and movements in other comprehensive income. When the Group's share of joint venture’s losses exceeds the carrying amount of the investment, the investment is recognized at zero value in the statement of financial position and the Group does not recognize further losses, unless it has incurred obligations or made payments on behalf of the joint venture.
Sales to and purchases from joint ventures are made on normal market terms and conditions and at market prices. The Group’s share of the joint ventures’ result for the period is separately disclosed in the income statement.
Segment reporting
Tieto's operating model comprises of a matrix structure of service lines and industry groups, of which the service line dimension constitutes the main operating segments in which the strategic decisions are made. The reportable operating segments in the service line dimension are Technology Services and Modernization, Business Consulting and Implementation, Industry Solutions and Product Development Services. The operating segments are reported in a manner consistent with the internal reporting provided to the Leadership team which has been identified as Tieto’s chief operating decision maker being responsible for allocating resources and assessing performance of the operating segments as well as deciding on strategy. Segment reporting is prepared according to IFRS accounting principles.
Annual report 2018 135
Creating valueTieto 2018 Governance Financials Sustainability
No internal sales occur between the reportable segments as in the internal reporting, revenue and costs are recognized directly to the respective customer projects in the service lines. The performance of segments is assessed based on operating profit (EBIT).
Group level costs related to Global management, Support functions and other non-allocated costs are not included in the service line segments but are reported under Support Functions and Global Management in the segment reporting.
Foreign currency transactions
Items included in the financial statements of each of the Group's entities are measured using the currency of the primary economic environment in which the entity operates (the functional currency). The consolidated financial statements are presented in euros, which is the Parent company’s functional and presentation currency.
Foreign currency transactions are translated into local functional currencies using the exchange rates prevailing on the transaction date. The foreign currency monetary items are translated using period end exchange rates. The foreign currency non-monetary items held at fair value are translated into the functional currency using the exchange rate prevailing at the date when the fair value was determined or remeasured. Other non-monetary items are recognized at the exchange rate prevailing on the transaction date.
For internal, long-term loans to subsidiaries, when classified as net investment in foreign operation, all related unrealized foreign exchange gains and losses are recognized in profit or loss in the separate financial statements. In the consolidated financial statements, such exchange differences are recognized initially in other comprehensive income and reclassified from equity to profit or loss on disposal of the net investment.
Other foreign exchange gains and losses related to business operations are included in operating profit. Foreign exchange gains and losses associated with financing are recognized in finance income and expenses.
For those Group entities whose functional and presentation currency is not the euro, the income statements and statements of financial position are translated into the Group presentation currency as follows:
• assets and liabilities for each statement of financial position presented are translated using the exchange rates prevailing at the reporting date;
• income and expenses for each income statement are translated using the average exchange rates of the reporting period;
• all resulting translation differences are recognized in other comprehensive income.
When a subsidiary is sold, any translation differences are recognized in the consolidated income statement as part of the gain or loss on the sale.
Goodwill and fair value adjustments to the carrying amounts of assets and liabilities arising on the acquisition of a foreign entity are treated as assets and liabilities of the foreign entity and translated into euro using the exchange rates prevailing at the reporting date. Translation differences arising are recognized in other comprehensive income.
Revenue recognition
The business models of the Group consist of continuous services, software solutions, projects and consulting. Goods mainly include sales of software licenses. Revenue comprises the fair value for the sale of IT services and goods, net of value-added tax, discounts and exchange rate differences.
Revenue from service contracts is based on service volumes or time and materials and the performance obligations are recognized over the accounting period in which the services are rendered or project completed. The services are generally satisfied and the control transferred to the customer over time given that either the customer simultaneously receives and consumes the benefits provided by the Group, or the Group’s performance does not create an asset with an alternative use for the Group, in which case there is an enforceable right to payment for work completed to date.
Annual report 2018 136
Creating valueTieto 2018 Governance Financials Sustainability

In majority of the businesses, covering continuous services, time and material projects and consulting, the performance obligations satisfied are invoiced on monthly basis and the consideration is payable when invoiced. The standard payment term is 30 days, net, according to the Group’s Credit Policy. Goods, typically distinct licenses, are invoiced on delivery. The license revenue is recognized at a point in time when the license is delivered, the legal title has passed, the customer has accepted the license and has access to the licensed software. The contract assets or liabilities do not typically arise in the businesses described above.
For contracts comprising fixed-price projects, revenue is recognized based on the actual service provided by the reporting date as a proportion of the total services to be provided. This is determined based on the cost of actual labour hours spent relative to the total expected cost of labour hours, as it best depicts the transfer of control to the customer. Estimates of revenues, costs or progress towards completion are revised if circumstances change and any resulting increases or decreases in estimated revenues or costs are reflected in profit or loss in the period in which the circumstances that give rise to the revision become known by the management. Invoicing and customer payments in the fixed-price projects follow the payment schedule defined in the customer contract. If the services rendered by the Group exceed the payment, a contract asset is recognized, and if the payments exceed the services rendered, a contract liability is recognized.
The customer contracts of the Group typically comprise several of the business models described above. The most appropriate presentation on how the nature, amount, timing and uncertainty of revenue and cash flows are affected by economic factors is considered to be the disaggregation of revenue presented in the segment reporting in note 1. The disaggregation of Customer sales from long-term fixed-price contracts by segment represents the revenue from contracts for which the risks are different compared to other contracts with customers.
Some contracts include delivery of hardware together with variety of services from the Group. Hardware is usually provided by another service provider. The installation of hardware is simple, does not include an integration service from Tieto and could be performed by another party. It is, therefore, accounted for as a separate performance obligation. In these contracts, Tieto
usually acts as an agent, as the Group does not obtain control of the hardware provided by another party before it is transferred to the customer.
Where the contracts include multiple performance obligations, the transaction price is allocated to each performance obligation based on the stand-alone selling prices, which are observable from the contracts and represent prices for services rendered in similar circumstances to similar customers. Revenue from contracts granting a discount retrospectively to the customer is recognized based on the price specified in the contract, net of the estimated discounts. Accumulated customer specific experience is used to estimate and provide for the discounts and revenue is only recognized to the extent that it is highly probable that a significant reversal will not occur.
Tieto grants assurance type of warranties which guarantee that the delivery complies with agreed specifications. These are accounted for in accordance with IAS 37 Provisions, Contingent Liabilities and Contingent Assets.
The Group does not have any contracts where the period between the transfer of the promised goods or services to the customer and payment by the customer exceeds one year. Consequently, the Group does not adjust any of the transaction prices for the time value of money.
The Group capitalizes material costs of set-up activities related to transition projects in the initial phase of continuous operating service contracts, when the criteria for capitalization according to IFRS 15 are met. The set-up activities do not result in the transfer of a promised good or service and are not identified as a performance obligation to the customer. The capitalized costs of a contract are amortized during the period when the revenue for related continuous operating service contract is recognized.
Management judgement is required when estimating recognition of revenue for fixed price projects and amounts of retrospective discounts. Judgment is also used when determining what is the contract and what are the set-up costs to be capitalized. More information is disclosed under heading Critical accounting estimates and assumptions.
Annual report 2018 137
Creating valueTieto 2018 Governance Financials Sustainability

Income taxes
Tax expense for the period includes current taxes of the Group companies based on taxable profit for the year, together with tax adjustments for previous years and changes in deferred taxes. Tax is recognized in the income statement, except to the extent that it relates to items recognized in other comprehensive income or directly in equity, in which case the related income tax is also recognized in other comprehensive income or directly in equity, respectively. The share of results in joint ventures is reported in the income statement based on the net result and thus, including the income tax effect.
Deferred income tax is recognized, using the liability method, on temporary differences between the tax bases of assets and liabilities and their carrying amounts in the consolidated financial statements. Deferred income tax is determined using the tax rates and laws which have been enacted or substantively enacted at the reporting date and are expected to apply when the related deferred income tax asset is realized or the deferred income tax liability is settled. The most significant temporary differences arise from depreciation differences, tax losses carried forward and intangible assets. Deferred taxes are accounted for temporary differences except for the following: goodwill not deductible for taxation purposes, the initial recognition of an asset or liability in a transaction other than a business combination that affect neither accounting nor taxable profit or loss, and differences related to investments in subsidiaries to the extent that they will probably not be reversed in the foreseeable future.
A deferred tax asset is recognized only to the extent that it is probable that future taxable profits will be available against which the asset can be utilized. The deferred tax assets and liabilities arising from consolidation are recognized in the consolidated statement of financial position if it is probable that the related tax effects will occur.
Government grants
Government grants are recognized as other operating income on a systematic basis over the periods necessary to match them with the related costs that they are intended to compensate. Investment grants related to acquisitions of property, plant and equipment and intangible assets are deducted from the cost of the asset in question in the statement of financial position and recognized as income on a systematic basis over the useful life of the asset in the form of reduced depreciation or amortization expense.
Research and development costs
Research costs are expensed when incurred. Development costs related to major new software products are capitalized as intangible assets when it is probable that the development will generate future economic benefits for the Group, and certain criteria related to commercial and technological feasibility are met. Development costs comprise service and solution development focusing on, for example, industry-specific software, customer experience management and security services, as well as cloud services. Additionally, the costs for related internal development, e.g. automation in infrastructure services, are included in development costs.
Subsequent to initial recognition, capitalized development costs are measured at cost less accumulated amortization and impairment losses.
Annual report 2018 138
Creating valueTieto 2018 Governance Financials Sustainability

Goodwill and other intangible assets
Goodwill arising on a business combination represents the excess of the aggregate of the consideration transferred, the amount of non-controlling interests in the acquiree and previously held equity interest in the acquiree over the fair value of the Group’s share of the identifiable net assets acquired. Goodwill is not amortized, but tested for impairment at least annually. Goodwill is measured at cost less accumulated impairment losses. In respect of joint ventures, goodwill is included in the carrying amount of the investment.
Other intangible assets than goodwill are recognized initially at cost. An intangible asset is recognized only if it is probable that the future economic benefits attributable to the asset will flow to the Group and the cost of the asset can be measured reliably. All other costs are expensed as incurred. After initial recognition, intangible assets are measured at cost less amortizations and accumulated impairment losses. Intangible assets are amortized over their useful lives with the straight-line method. Tieto does not have any intangible assets with indefinite useful lives.
Intangible assets acquired in business combinations are measured at fair value at the acquisition date. These are usually customer or technology related and have finite useful lives.
Impairment testing of goodwill
Goodwill recognized in a business combination is tested for impairment annually or whenever events or changes in circumstances indicate that the carrying amount may not be recoverable. For the purpose of impairment testing, goodwill is allocated to the operating segments of the Group, which are the cash generating units (CGU) expected to benefit from the synergies of the business combination. If the carrying amount of goodwill allocated to the operating segments exceeds its recoverable amount, an impairment loss equal to the difference is recognized in profit or loss. The recoverable amount is the higher of the value in use represented by the net present value of future cash flows and the fair value less costs to sell. Impairment losses on goodwill are not reversed.
The Group applies the following useful lives:
Years
Software 3
Other intangible assets 3–10
Technology related intangible assets recognized at fair value from acquisitions 3–10
Customer related intangible assets recognized at fair value from acquisitions 2–10
Gains and losses on disposal of intangible assets are included in other operating income and expenses.
Annual report 2018 139
Creating valueTieto 2018 Governance Financials Sustainability

Property, plant and equipment
Property, plant and equipment are measured at cost less accumulated depreciation and impairment losses. Government grants received are deducted from the cost.
Land is not depreciated. Property, plant and equipment acquired in business combinations are measured at fair value at the acquisition date. Depreciation is recognized according to plan based on the estimated economic lives of the individual assets and accounted for in accordance with the straight-line method. The assets' residual useful lives are reviewed, and adjusted if appropriate, at each reporting date. Assets procured under finance lease agreements are capitalized as property, plant and equipment and depreciated during the estimated useful lives.
The group applies the following useful lives:
Years
Buildings and structures 25–40
Data processing equipment1) 1–5
Other machinery and equipment 5
Other tangible assets 5
1) Purchases of personal computers are expensed immediately.
Leases
Group as a lesseeLease agreements are classified as finance or operating leases. Assets procured under finance lease agreements are capitalized at the commencement of the lease term and depreciated during the estimated useful lives. The annual rents are disclosed as amortization of the finance lease liability and interest expenses.
Leases in which a significant portion of the risks and rewards of ownership is retained by the lessor are classified as operating leases. Payments made under operating leases are recognized to the income statement on a straight-line basis over the lease period.
Group as a lessorIf an arrangement conveys a right to use a specific asset to a purchaser, often together with related services, the assets, mainly technical equipment, are classified as embedded finance leases. Sales derived from these embedded finance leases are recognized at the beginning of the agreement period. The annual payments are disclosed as amortization of the finance lease loan receivable and interest income.
Annual report 2018 140
Creating valueTieto 2018 Governance Financials Sustainability

Financial instruments
Application of IFRS 9 as of 1 January 2018, resulted in the following changes in Financial Instruments measurement categories:
Measurement Category Carrying amount, EUR million Original
(IAS 39)New
(IFRS 9) Original New Difference2)
Non-current financial assets Other shares and securities owned by the Parent company
Available for sale
FVPL1) 0.5 0.5 0.0
Finance lease receivables Amortized cost Amortized cost 0.8 0.8 0.0Other interest-bearing receivables Amortized cost Amortized cost 0.4 0.4 0.0 Current financial assets Trade receivables Amortized cost Amortized cost 308.9 308.0 0.9
FVPL1) 3) 0.0 0.4 -0.4Cash and cash equivalents4) Amortized cost Amortized cost 78.2 78.2 0.0Derivatives5) FVPL1) FVPL1) 1.8 1.8 0.0Finance lease receivables Amortized cost Amortized cost 2.0 2.0 0.0 Non-current financial liabilities
Finance lease liabilities Amortized cost Amortized cost 1.7 1.7 0.0Bonds Amortized cost Amortized cost 99.8 99.8 0.0Other interest-bearing loans Amortized cost Amortized cost 1.0 1.0 0.0Other interest-bearing liabilities Amortized cost Amortized cost 3.8 3.8 0.0Current financial liabilitiesDerivatives FVPL1) FVPL1) 0.9 0.9 0.0Trade payables Amortized cost Amortized cost 104.2 104.2 0.0Accrued interest Amortized cost Amortized cost 1.8 1.8 0.0Finance lease liability Amortized cost Amortized cost 0.8 0.8 0.0Cash Pool liabilities towards Joint Ventures Amortized cost Amortized cost 16.4 16.4 0.0Loans Amortized cost Amortized cost 117.4 117.4 0.0
1) FVPL = Fair Value through Profit or Loss
2) The differences noted in this column are the result of applying the new expected credit loss model. The reclassifications of the
financial instruments on adoption of IFRS 9 did not result in any changes to measurements.
3) Trade receivables to be sold via non-recourse factoring
4) Fixed term deposits, principally comprising of funds held with banks and other financial institutions
5) Derivatives, comprising foreign exchange forward contracts, currency options, power derivatives and interest rate swaps.
The classification of Financial assets depends on the business model for managing the financial assets and contractual cash flows.
Recognition, de-recognition and measurement
Regular way purchases and sales of financial assets are accounted for at trade date, the date on which the Group commits to purchase or sell the asset, for all categories of financial assets, where entity hold them and which are not derivatives.
Financial assets are derecognized when the rights to receive cash flows from the investments have expired or have been transferred and the Group has transferred substantially all risks and rewards of ownership. Financial liabilities are derecognized when the obligation is discharged, cancelled or expired.
All financial instruments are initially recognized at fair value. Transaction costs are included in the carrying value only if the financial instrument is not recorded at fair value through profit or loss in which case transaction costs are expensed in profit or loss. Usually the fair value equals the amount received or paid.
Annual report 2018 141
Creating valueTieto 2018 Governance Financials Sustainability
Impairment of financial assets
Financial assets that are subject to impairment calculations include trade receivables, contract assets, finance lease receivables and cash and cash equivalents.
Regarding finance lease receivables, impairment will be evaluated on an individual case-by-case basis, at least on each reporting date. For cash and cash equivalents, the Group considers these not to be subject to impairment unless unexpected circumstances occur.
For all the other assets mentioned above, Tieto has elected to apply the simplified option permitted by IFRS 9 and always calculates lifetime expected credit losses (ECL). The Group has elected to use the practical expedient and calculate ECL based on a pre-defined provision matrix. Therefore, the Group has performed its external customer segmentation so that each customer segment would bear similar credit characteristics, based on the following criteria:
• Country Group (Finland, Sweden, Norway, Other European Union countries, Other countries)• Industry Group (Financial Services, Public Healthcare & Welfare, Industrial Customer
Services, Product Development Services)• Balance due status (Not yet due, overdue 1–7 days, 8–30 days, 31–60 days, 61–90 days,
over 90 days)
For each segment, the ECL rate (expressed as a percentage) indicates the historical average defaults identified during the past three years and also the Group’s assessment of the possible impact from changes in the overall economic environment in which its customers operate. These general provisions can be increased if the customer has filed for bankruptcy but has not yet registered the fact or if there are any facts or circumstances indicating that the customer’s credit risk is above industry/country average.
When calculating ECL for contract assets, the ECL rate set for “not yet due” invoices in the provision matrix is used.
Cash and cash equivalents
Cash and cash equivalents comprise cash balances and call deposits with banks and other liquid investments that are readily convertible to known amount of cash within three months and which are subject to an insignificant risk of changes in value. Bank overdrafts are included in current liabilities in the statement of financial position.
Provisions
A provision is a liability of uncertain timing or amount, which should be recognized when the entity has a present legal or constructive obligation as a result of a past event and it is more likely than not that an outflow of economic benefits will be required to settle the obligation and the amount of the obligation can be measured reliably. Provisions are measured at the present value of the expenditures expected to be required to settle the obligation using a pre-tax rate that reflects current market assessments of the time value of money and the risks specific to the obligation.
Employee benefits
Post-employment benefitsGroup companies in different countries have number of different post-employment benefit plans in accordance with local requirements and practices. The majority of the plans are classified as defined contribution plans. The fixed contributions to defined contribution plans are recognized as employee benefit expenses in the period to which they relate. The Group has no further legal or constructive payment obligations once the contributions have been paid.
Other post-employment benefit plans than defined contribution plans are defined benefit plans. Typically, defined benefit plans define an amount of post-employment benefit that an employee
Annual report 2018 142
Creating valueTieto 2018 Governance Financials Sustainability

will receive on retirement, usually dependent on one or more factors such as age, years of service and compensation. Defined benefit plans are funded with payments to insurance companies. For defined benefit plans the net liability recognized in the statement of financial position equals the present value of the defined benefit obligation at the closing date less the fair value of the plan assets. The present value of the defined benefit obligation is determined separately for each plan by independent actuaries using the projected unit credit method.
Current service costs, past service costs and gains or losses on settlements are recognized in employee benefit expenses. Net interest expense or income is recognized in financial items under interest expense or interest income. All remeasurements of the defined benefit liability or asset arising from experience adjustments and changes in actuarial assumptions are recognized directly in other comprehensive income.
Share-based paymentsTieto has share-based incentive plans for its key employees. The plans are accounted for as equity-settled and they include both market and non-market based vesting conditions. The plans are valued at fair value based on the market price of Tieto share at the grant date, and recognized as an employee benefit expense during the vesting period with a corresponding entry in equity.
The level of the realization of the set financial targets influences the amount in which rewards are recognized and paid. The expense determined at the grant date is based on the Group’s estimate of the number of shares that will ultimately vest. The estimate is reviewed at each reporting date and the potential impact of any adjustments to the initial estimates is recognized in profit or loss and a corresponding adjustment is made to equity.
Equity, dividends and own shares
Dividends proposed by the Board of Directors are not deducted from distributable equity until approved by the Annual General Meeting of Shareholders.
When Tieto Corporation's own shares are repurchased, the amount of the consideration paid, including directly attributable costs, is recognized as a deduction in equity.
Earnings per share
Basic Earnings per share (EPS) is calculated by dividing the net profit attributable to the shareholders of the Parent company by the weighted average number of shares in issue during the year, excluding shares purchased by Tieto and held as treasury shares.
Diluted earnings per share is calculated by adjusting the weighted average number of shares outstanding during the year with the shares estimated to be delivered based on the share-based incentive plans.
Critical accounting estimates and assumptions
The preparation of the financial statements in accordance with IFRS requires management to make estimates and assumptions that affect the reported amounts of assets and liabilities and the disclosure of contingent assets and contingent liabilities at the reporting date as well as the reported amounts of revenues and expenses during the reporting period. In addition, management judgement is required in the application of accounting policies, especially when IFRS standard has alternative accounting, valuation and presentation methods. Although these estimates are based on management's best knowledge of current events and actions, actual results may differ from the estimates.
Annual report 2018 143
Creating valueTieto 2018 Governance Financials Sustainability
Management believes that the following accounting principles represent those matters requiring the exercise of judgement where a different opinion could result in significant changes to reported results.
Revenue recognitionRecognition of revenue for fixed-priced projects requires an estimation of the revenues, costs and progress towards completion for which the actuals may differ from the estimates. The estimates are revised if circumstances change. Any resulting changes to revenues or costs are recognized in profit or loss in the period in which the change become known by the management.
For contracts where the total transaction price is not known when the contract is initiated, the retrospective discounts are estimated based on management’s experiences of the earlier purchases of the customers under similar contracts. This estimation is regularly updated during the contract period. Revenue is only recognized to the extent that it is highly probable that a significant reversal in the amount of cumulative revenue recognized will not occur when the uncertainty associated with the variable consideration is subsequently resolved.
The Group typically provides the customers with wide variety of comprehensive services. The individual service delivery contracts are often structured under a common frame contract where general terms for the service delivery to the customer are defined. The content of the delivery, performance obligations and usually also pricing, are defined in the service delivery contracts. Management judgement is used to identify what is the entirety of which revenue is recognized; either an individual service delivery contract or a group of combined contracts.
Material costs of set-up activities related to transition projects in the initial phase of continuous operating service contracts are capitalized. Management judgement has been used when developing an internal guidance on what kind of tasks are defined as set-up activities in Tieto.
More information on revenue is disclosed in notes 1 and 2.
Valuation of assets acquired and liabilities assumed in business combinationsAssets acquired and liabilities assumed in business combinations are recognized at fair value. The valuation requires management to determine the appropriate valuation techniques and inputs for fair value measurements, such as discount rate. The management believes that the used estimates and assumptions are sufficiently reasonable for determining fair values. Information about the valuation of the assets acquired and liabilities assumed in business combinations are disclosed in note 25.
Valuation of goodwillGoodwill is tested for impairment at least annually. Determining whether goodwill is impaired requires an estimation of the value-in-use of the cash-generating units to which goodwill has been allocated. The value-in-use calculation requires management to estimate the future cash flows expected to arise from the cash-generating units and an appropriate discount rate to calculate present value. Details of the impairment testing and the key assumptions used are explained further in note 26.
Capitalized development costsManagement judgement is required when the Group capitalizes costs of internally generated intangible assets. The most critical judgment areas relate to the fulfilment of the criteria when development costs can be capitalized, the estimation of future economic benefits that are expected from the intangible asset and the depreciation period of the intangible asset. Capitalized development costs are disclosed in note 11.
ProvisionsProvisions require management to assess the best estimate of the future costs needed to settle the present obligation at the reporting date. The actual costs may differ from the estimated costs. The most significant provisions relate to restructurings for which more information is disclosed in note 17.
Annual report 2018 144
Creating valueTieto 2018 Governance Financials Sustainability
Deferred taxesThe group operates globally and is, therefore subject to changing tax laws in multiple jurisdictions. The interpretation of tax legislation requires management judgment, and the applied interpretations may include uncertainties. At each reporting date, the management assesses the amount of probable future taxable profits against which unused tax losses can be utilized. As the actual profits may differ from the forecasts, the change will affect the taxes in future periods. More information on taxes is disclosed in note 10.
Employee benefitsThe present value of pension obligations is based on actuarial calculations in which several financial and demographic assumptions are used. Any change in these assumptions will impact the carrying amount of pension obligations. The assumptions used are disclosed in note 9.
At each reporting date, the number of shares that are expected to vest from the Group’s share-based incentive plans is revised. As part of this evaluation, the changes in the forecasted performance of the Group, the expected turnover of the personnel participating in the plans and other information impacting the number of shares to vest, is taken into consideration. More information on the share-based payment plans is disclosed in note 8.
Valuation of accounts receivablesThe Group estimates the impairment losses on accounts receivables based on expected credit losses. For this purpose, the external customers have been segmented based on customer location and industry so that each customer segment would bear similar credit characteristics. The calculation of expected credit losses rate (expressed as a percentage) requires management judgment as the Group will take into consideration historical average defaults identified during the past 3 years, and these rates are then being adjusted by Group’s assessment of overall market situation in each customer country group. More information on expected credit losses is disclosed in note 20.
Annual report 2018 145
Creating valueTieto 2018 Governance Financials Sustainability

1. Segment information
Tieto's operating model comprises of industry groups and service lines, the service lines forming the reportable operating segments according to IFRS. The service lines are: Techonology Services and Modernization, Business Consulting and Implementation, Industry Solutions (together "IT services") and Product Development Services. In 2018, Tieto implemented internal business transfers that help the Company capture consulting-driven market opportunities as well as further drive customer value. As from 1 April 2018, business transfers from Technology Services and Modernization to Business Consulting and Implementation include enterprise application-related business for cloud-born applications, integration consulting and Value Networks as a related solution. Annual sales of the transferred businesses amount to around EUR 37 million. The comparative figures have been restated.
Techonology Services and ModernizationTieto’s Technology Services and Modernization service line provides enterprises with life cycle management services of customer application and IT infrastructure, covering a wide variety of different technologies. The services include e.g. cloud and other emerging services, security services as well as software application development and management. The service line has a clear geographical focus on Finland, Sweden and Norway, and Tieto is positioned as the number one provider in Finland and among top 3 providers in Sweden. Services are delivered from both onshore locations in the Nordic countries and offshore delivery centres in the Czech Republic, India and Baltic countries.
Business Consulting and ImplementationTieto’s Business Consulting & Implementation (BCI) service line includes IT architecture consulting, customer experience management, business process and change management and transformation and system integration services. BCI focuses on building repeatable concepts for customers with predefined business practises. The segment currently focuses on Finland and Sweden, and it serves customers also in Norway, Austria, the Baltic countries and Russia. Services are delivered primarily by employees based in the Nordic countries but also through delivery centres in the Baltic countries and India. BCI service line has the largest market share in Finland.
Industry Solutions Tieto’s Industry Solutions service line is embedded in its three industry groups having their customers mainly in the Nordic countries. Tieto has industry solutions for its global customer base in the oil and gas, payments and forest sectors. As from 1 May 2018, Tieto’s Financial Digital Channels business (previously part of the Industry Solutions service line), with net sales of EUR 11 million, was transferred to Business Consulting and Implementation. The comparison figures have been restated.
Product Development ServicesProduct Development Services provides product development services with focus on telecom, expanding to new domains such as automotive. Services are provided globally for communications infrastructure companies, consumer electronics and semiconductor companies as well as automotive industry. Global services are currently provided mainly from delivery centres in Poland, China, Sweden, Czech and Finland.
Group level costs, e.g. costs related to Global management, Group's share of support functions and other non-allocated costs are not included in the service line segments but are reported under Support Functions and Global Management in the segment reporting.
PERFORMANCE OF THE YEAR
Annual report 2018 146
Creating valueTieto 2018 Governance Financials Sustainability

Customer sales by service line
EUR million 2018 2017 Change %
Technology Services and Modernization 740.0 735.4 1
Business Consulting and Implementation 244.6 195.9 25
Industry Solutions 478.9 486.0 -1
Product Development Services 135.8 126.1 8
Group total 1 599.5 1 543.4 4
Customer sales by industry group
EUR million 2018 2017 Change %
Financial Services 377.6 384.4 -2
Public, Healthcare and Welfare 530.8 501.7 6
Industrial and Consumer Services 554.9 531.2 4
Product Development Services 135.8 126.1 8
Group total 1 599.5 1 543.4 4
Customer sales by country
EUR million 2018 2017 Change %
Finland 692.7 675.9 2
Sweden 625.1 599.0 4
Norway 155.9 161.2 -3
Other 125.9 107.4 17
Group total 1 599.5 1 543.4 4
Tieto does not have individual significant customers as defined in IFRS 8.
Customer sales from long-term fixed-price contracts by segment
EUR million 2018
Technology Services and Modernization 4.4
Business Consulting and Implementation 3.6
Industry Solutions 19.2
Product Development Services 0.2
Group total 27.5
Comparative information not available.
Operating profit (EBIT) by service line
EUR million 2018 2017 Change %
Technology Services and Modernization 85.4 78.5 9
Business Consulting and Implementation 18.9 16.1 17
Industry Solutions 54.4 54.4 0
Product Development Services 13.9 12.0 16
Support Functions and Global Management -18.1 -21.9 17
Operating profit (EBIT) 154.7 139.1 11
Operating margin (EBIT) by service line
% 2018 2017 Change pp
Technology Services and Modernization 11.5 10.7 1
Business Consulting and Implementation 7.7 8.2 0
Industry Solutions 11.4 11.2 0
Product Development Services 10.2 9.5 1
Operating margin (EBIT) 9.7 9.0 1
Annual report 2018 147
Creating valueTieto 2018 Governance Financials Sustainability

Calculation of alternative performance measuresTieto presents certain financial measures, which, in accordance with the “Alternative Performance Measures” guidance issued by the European Securities and Markets Authority, are not accounting measures defined or specified in IFRS and are, therefore, considered alternative performance measures. Tieto believes that alternative performance measures provide meaningful supplemental information to the financial measures presented in the consolidated financial statements prepared in accordance with IFRS and increase the understanding of the profitability of Tieto’s operations. Alternative performance measures are not accounting measures defined or specified in IFRS and, therefore, they are considered non-IFRS measures, which should not be viewed in isolation or as a substitute to the IFRS financial measures.
Adjusted operating profit (EBIT) by service line
EUR million 2018 2017 Change %
Technology Services and Modernization 92.4 88.6 4
Business Consulting and Implementation 18.6 16.3 14
Industry Solutions 51.1 57.7 -11
Product Development Services 14.1 12.3 14
Support Functions and Global Management -13.4 -13.4 0
Adjusted operating profit (EBIT) 162.8 161.4 1
Adjusted operating margin (EBIT) by service line
% 2018 2017 Change pp
Technology Services and Modernization 12.5 12.1 0
Business Consulting and Implementation 7.6 8.3 -1
Industry Solutions 10.7 11.9 -1
Product Development Services 10.4 9.7 1
Adjusted operating margin (EBIT) 10.2 10.5 0
Adjusted operating profit (EBIT) = Operating profit + adjustments
Adjusted operating profit margin (EBIT), %
= Adjusted operating profit (EBIT)Net sales
Adjustments = Restructuring costs + capital gains/losses + goodwill impairment charges + other items affecting comparability
Reconciliation of alternative performance measures
EUR million 2018 2017
Operating profit (EBIT) 154.7 139.1
+ restructuring costs 9.3 22.7
+ premises related expenses 0.3 -
- capital gains -4.6 -
+ capital losses - 0.3
+/- M&A related items 1.4 -0.2
+/- other items 1.8 -0.5
Adjusted operating profit (EBIT) 162.8 161.4
Annual report 2018 148
Creating valueTieto 2018 Governance Financials Sustainability

Personnel by service line
End of period Average2018 Change % Share % 2017 2018 2017
Technology Services and Modernization 6 123 6 40 5 757 5 973 5 792Business Consulting and Implementation 2 404 8 16 2 224 2 319 1 921Industry Solutions 4 081 4 27 3 925 4 075 3 882Product Development Services 1 608 5 11 1 532 1 573 1 414Service Lines total 14 217 6 94 13 438 13 941 13 009Industry Groups 345 24 2 279 340 261Support Functions and Global Management 628 3 4 612 626 619Group total 15 190 6 100 14 329 14 907 13 889
Personnel by country
End of period Average2018 Change % Share % 2017 2018 2017
Finland 3 392 1 22 3 364 3 396 3 395Sweden 3 106 2 20 3 036 3 078 2 733India 2 721 6 18 2 571 2 697 2 514Czech Republic 2 538 13 17 2 254 2 421 2 243Latvia 671 10 4 612 638 629Norway 607 1 4 600 601 611Poland 662 23 4 538 632 482China 497 8 3 460 483 387Estonia 301 10 2 274 293 291Austria 162 21 1 134 149 135Lithuania 115 9 1 106 112 98Other 418 10 3 381 407 370Group total 15 190 6 100 14 329 14 907 13 889Onshore countries 7 498 2 49 7 350 7 451 7 086Offshore countries 7 692 10 51 6 979 7 456 6 803Group total 15 190 6 100 14 329 14 907 13 889
Non-current assets by country
EUR million 31 Dec 2018 31 Dec 2017 Change %
Finland 81.4 84.6 -4
Sweden 39.7 42.8 -7
Norway 8.1 12.0 -32
Other 8.8 6.5 35
Group total 137.9 145.9 -5
Non-current assets include property, plant and equipment and intangible assets excluding goodwill.
Depreciation by service line
EUR million 2018 2017 Change %
Technology Services and Modernization 31.2 32.5 -4
Business Consulting and Implementation 0.2 0.2 -
Industry Solutions 0.8 0.9 -9
Product Development Services 0.0 0.1 -58
Support Functions and Global Management 6.9 5.7 21
Group total 39.2 39.5 -1
Amortization on intangible assets recognized at fair value from acquisitions by service line
EUR million 2018 2017 Change %
Technology Services and Modernization - - -
Business Consulting and Implementation 1.6 0.5 >100
Industry Solutions 3.6 3.7 -5
Product Development Services - - -
Support Functions and Global Management - - -
Group total 5.2 4.3 22
Annual report 2018 149
Creating valueTieto 2018 Governance Financials Sustainability
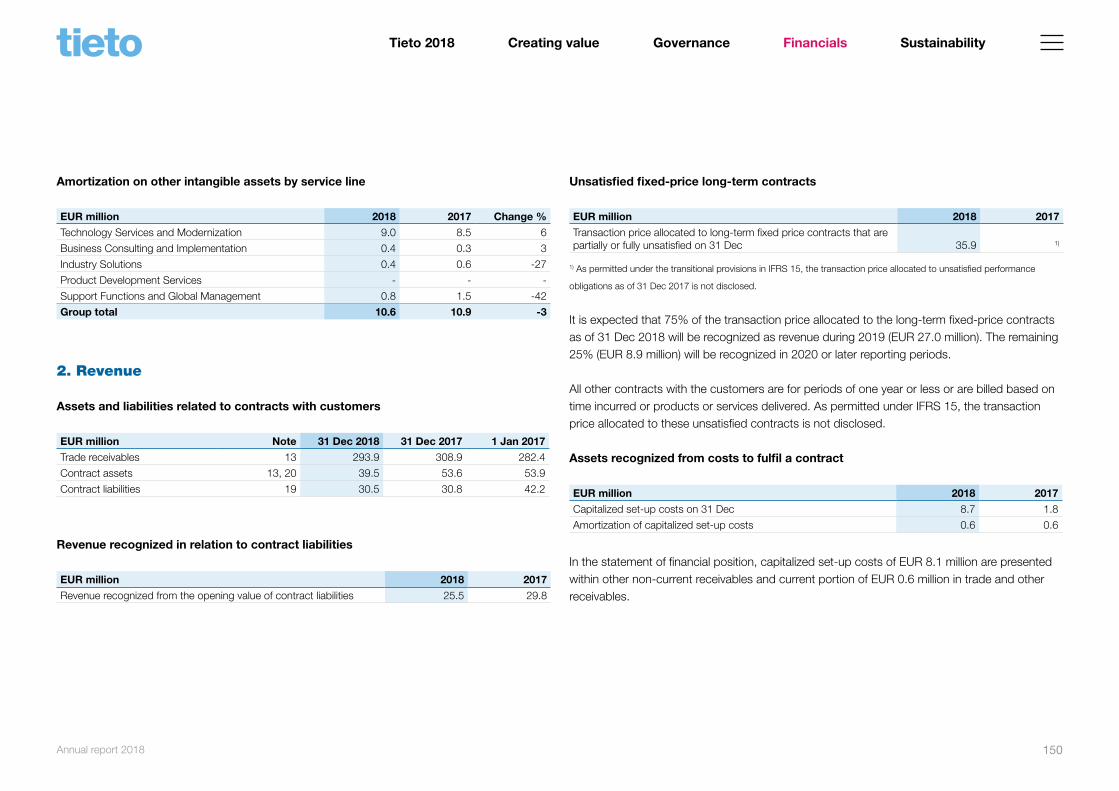
Amortization on other intangible assets by service line
EUR million 2018 2017 Change %
Technology Services and Modernization 9.0 8.5 6
Business Consulting and Implementation 0.4 0.3 3
Industry Solutions 0.4 0.6 -27
Product Development Services - - -
Support Functions and Global Management 0.8 1.5 -42
Group total 10.6 10.9 -3
2. Revenue
Assets and liabilities related to contracts with customers
EUR million Note 31 Dec 2018 31 Dec 2017 1 Jan 2017
Trade receivables 13 293.9 308.9 282.4
Contract assets 13, 20 39.5 53.6 53.9
Contract liabilities 19 30.5 30.8 42.2
Revenue recognized in relation to contract liabilities
EUR million 2018 2017
Revenue recognized from the opening value of contract liabilities 25.5 29.8
Unsatisfied fixed-price long-term contracts
EUR million 2018 2017
Transaction price allocated to long-term fixed price contracts that are partially or fully unsatisfied on 31 Dec 35.9 1)
1) As permitted under the transitional provisions in IFRS 15, the transaction price allocated to unsatisfied performance
obligations as of 31 Dec 2017 is not disclosed.
It is expected that 75% of the transaction price allocated to the long-term fixed-price contracts as of 31 Dec 2018 will be recognized as revenue during 2019 (EUR 27.0 million). The remaining 25% (EUR 8.9 million) will be recognized in 2020 or later reporting periods.
All other contracts with the customers are for periods of one year or less or are billed based on time incurred or products or services delivered. As permitted under IFRS 15, the transaction price allocated to these unsatisfied contracts is not disclosed.
Assets recognized from costs to fulfil a contract
EUR million 2018 2017
Capitalized set-up costs on 31 Dec 8.7 1.8
Amortization of capitalized set-up costs 0.6 0.6
In the statement of financial position, capitalized set-up costs of EUR 8.1 million are presented within other non-current receivables and current portion of EUR 0.6 million in trade and other receivables.
Annual report 2018 150
Creating valueTieto 2018 Governance Financials Sustainability

3. Other operating income
EUR million 2018 2017
Gain on sale of property, plant and equipment 0.4 0.3
Gain on sale of subsidiaries and business operations 4.6 -
Rental income 2.0 2.7
Government grants released 0.7 0.4
Foreign exchange gains on derivatives 3.7 3.7
Decrease of contingent considerations 3.8 1.8
Other 6.8 8.5
Total 22.0 17.4
4. Other operating expenses
EUR million 2018 2017
Rents, licences and maintenance related to software 61.3 61.6
Data and phone communication 11.3 11.4
ICT purchases and services 40.5 37.4
Advertising and marketing 5.8 6.6
Travelling 16.8 19.4
Training 7.4 6.0
Consulting 27.1 24.2
Fees to auditors 1.9 1.1
Premises related 68.8 70.5
Foreign exchange losses on derivatives 1.4 1.2
Other operating expenses 19.5 22.4
Total 261.8 261.8
Fees to auditors
2018 2017EUR million Deloitte PwC PwC
Audit fees 0.3 0.8 0.8
Tax advisory 0.1 0.1 0.1
Other services 0.1 0.5 0.2
Total 0.4 1.4 1.1
Annual report 2018 151
Creating valueTieto 2018 Governance Financials Sustainability

5. Financial income and expenses
2018EUR million
Interest income
Interest expenses
Foreign exchange gains and losses
Other financial income
Other financial expenses Total
Financial assets at fair value through profit or loss - - -3.4 - - -3.4
Financial assets at amortized cost 2.2 - 4.4 0.1 - 6.7
Financial liabilities measured at amortized cost - -4.3 - - -0.9 -5.2
Total according to IFRS 9 classification 2.2 -4.3 1.0 0.1 -0.9 -1.9
Net defined benefit obligation - -0.0 - - - -0.0
Total 2.2 -4.3 1.0 0.1 -0.9 -1.9
2017EUR million
Interest income
Interest expenses
Foreign exchange gains and losses
Other financial income
Other financial expenses Total
Financial assets at fair value through profit or loss - - -4.9 0.0 - -4.9
Loans and receivables 1.5 - 4.7 - - 6.2
Available for sale financial assets - - - - -0.1 -0.1
Financial liabilities measured at amortized cost - -3.6 - - -1.0 -4.6
Total according to IAS 39 classification 1.5 -3.6 -0.2 0.0 -1.1 -3.4
Net defined benefit obligation - -0.0 - - - -0.0
Total 1.5 -3.6 -0.2 0.0 -1.1 -3.4
Foreign exchange gains and losses included in the operating profit were EUR 2.3 (1.5) million in 2018.
Annual report 2018 152
Creating valueTieto 2018 Governance Financials Sustainability

6. Earnings per share
2018 2017
Net profit for the financial year attributable to owners of the Parent company (EUR million) 123.2 107.7
Earnings per share (EUR)
Basic 1.67 1.46
Diluted 1.66 1.46
Weighted average number of shares during the year
Basic 73 809 855 73 722 565
Effect of dilutive share-based incentive plans 189 324 184 114
Diluted 73 999 179 73 906 679
EMPLOYEE BENEFITS
7. Employee benefit expenses
EUR million 2018 2017
Wages and salaries 674.1 633.7
Termination benefits - 21.9
Post-employment benefits
Defined contribution plans 74.3 75.3
Defined benefit plans 2.7 -0.9
Other statutory social costs 126.1 119.4
Share-based payments 7.2 4.4
Other personnel expenses 20.6 19.5
Total 905.0 873.3
Management remuneration
2018 2017
EUR thousandPresident and CEO
Leadership team
President and CEO
Leadership team
Salaries and benefits 640.9 2 427.2 603.2 2 912.3
Bonuses1) 440.2 782.5 399.4 825.2
Share-based payments 660.0 1 727.1 399.1 1 102.1
Statutory pensions 176.3 395.7 139.4 326.3
Supplementary pensions 138.3 376.6 138.2 732.2
Termination benefits - - - 477.1
Total 2 055.7 5 709.1 1 679.3 6 375.2
1) 2018 based on estimated amount. Comparative figure updated with the actual amount paid.
Annual report 2018 153
Creating valueTieto 2018 Governance Financials Sustainability

The President and CEO, Kimmo Alkio is entitled to a bonus corresponding maximum of 100% of base salary based on the Group's external revenue, profit and achievement of strategic goals when achievements exceed the targets set. The annual contribution for the President and CEO's supplementary pension arrangement is 23% of the annual base salary. The President and CEO's retirement age is 63. In case his assingment is terminated, the period of notice is 12 months and the severance payment is equivalent to 12–18 months' salary. The President and CEO participates in the Long-term incentive programmes according to respective terms and conditions decided by the Board of Directors. In 2018, after deductions for applicable taxes, a total of 9 950 (4 256) shares were delivered to the President and CEO.
The other Leadership team members are entitled to a bonus corresponding maximum of 75% of base salary based on their individual goals when achievements exceed the targets set. The annual contribution for the Leadership team members' supplementary pension arrangement is 15% and 23% (for one member) of the annual base salary. The retirement age of the Leadership team members is according to national legislation. The period of notice for the Leadership team members varies between 6 and 12 months and the terms for the termination benefits vary. The Leadership team members participate in the Long-term incentive programmes according to respective terms and conditions decided by the Board of Directors. In 2018, after deductions for applicable taxes, a total of 25 292 (8 731) shares were delivered to the Leadership team members.
Remuneration for the Board of Directors
EUR thousand 2018 2017
Kurt Jofs (Chairman and RC Chairman) 106.2 113.4
Harri-Pekka Kaukonen (Deputy Chairman and ARC Chairman) 74.2 75.0
Timo Ahopelto 54.4 53.6
Johanna Lamminen 54.4 52.8
Sari Pajari 3.2 52.0
Endre Rangnes 51.2 56.0
Jonas Synnergren 51.2 61.6
Jonas Wiström 2.4 48.8
Liselotte Hägertz Engstam 53.6 -
Markku Pohjola - 3.2
Lars Wollung - 1.6
Total 450.8 518.0
Each member of the Board of Directors receives a fixed yearly remuneration and additional meeting based remuneration. According to the decision by the Annual General Meeting, the yearly remuneration is as follows: Chairman EUR 91 000, Deputy Chairman EUR 55 000, ordinary member EUR 36 000 and Committee Chairman EUR 55 000 (if not the Chairman or the Deputy Chairman). The yearly remuneration is compensated in cash (60%) and in shares (40%). The meeting based remuneration is EUR 800 for each Board meeting and for each permanent or temporary Committee meeting.
Annual report 2018 154
Creating valueTieto 2018 Governance Financials Sustainability

8. Share-based incentive plans
The aim of Tieto's share-based incentive plans is to align the objectives of shareholders and key employees in order to increase the value of the company in the long-term. In 2018, Tieto's share-based incentive plans included Performance Share Plans 2016–2018, 2017–2019 and 2018–2020 as well as Restricted Share Plans 2016–2018, 2017–2019 and 2018–2020. The rewards from the plans will be paid partly in the company’s shares and partly in cash. The cash proportion is intended to cover taxes and tax-related costs arising from the reward. As a rule, no reward will be paid, if a participant´s employment or service ends before the reward payment. The Board of Directors anticipates that share rewards to be delivered to the participants under the plans will consist of shares to be acquired from the market. Thus, no new shares will be issued in connection with the plans.
The Performance Share Plan 2015–2017 and the Restricted Share Plan 2015–2017 ended in 2018. Based on the achievements of the targets a total of 220 085 gross shares were earned and of these 103 224 net shares were delivered to the participants. Tieto used its treasury shares for the reward payments.
At the end of the period it is estimated that EUR 9.2 million future cash payment will be paid to the tax authorities from share-based payments.
Annual report 2018 155
Creating valueTieto 2018 Governance Financials Sustainability

Main terms and conditions of the share-based incentive plans
Performance Share Plan2016–2018 2017–2019 2018–2020
Plan launched 3 Feb, 2016 2 Feb, 2017 22 Feb, 2018
Performance Period 2016–2018 2017–2019 2018–2020
Vesting conditions Total Shareholder Return of Tieto share (TSR), strategic target related to Tieto's growth and Tieto's Earnings per Share (EPS). Valid employment or director agreement of a key employee upon the reward payment.
Exercised In shares and cash in 2019 In shares and cash in 2020 In shares and cash in 2021
Number of participants on 31 Dec 2018 105 146 139
Other On 31 Dec 2018, rewards to be paid correspond to the value of approximate number of 337 900 Tieto gross shares.
On 31 Dec 2018, rewards to be paid correspond to the value of approximate number of 392 350 Tieto gross shares.
On 31 Dec 2018, rewards to be paid correspond to the value of approximate number of 392 712 Tieto gross shares.
Restricted Share Plan2016–2018 2017–2019 2018–2020
Plan launched 3 Feb, 2016 2 Feb, 2017 22 Feb, 2018
Vesting period 2016–2018 2017–2019 2018–2020
Vesting conditions Valid employment or director agreement of a key employee upon the reward payment.
Exercised In shares and cash in 2019 In shares and cash in 2020 In shares and cash in 2021
Number of participants on 31 Dec 2018 61 65 171
Other On 31 Dec 2018, rewards to be paid correspond to the value of approximate
number of 31 800 Tieto gross shares.
On 31 Dec 2018, rewards to be paid correspond to the value of approximate
number of 40 700 Tieto gross shares.
On 31 Dec 2018, rewards to be paid correspond to the value of approximate
number of 71 525 Tieto gross shares.
Annual report 2018 156
Creating valueTieto 2018 Governance Financials Sustainability

Assumptions made in determining the fair value of the Share-based incentive plansFor Performance Share Plans and Restricted share plans the fair value has been determined at grant using the fair value of Tieto Corporation share as of the grant date, expected outcome and expected dividends.
The fair value of social costs settled in cash are remeasured at each reporting date until settlement.
For share plan grants made in 2018, the fair value has been determined at grant date using the following share price and expected dividends:
• Share price at grant: EUR 29.06• Expected dividends: EUR 4.42• Share price at year end: EUR 23.58
Share-based payments included in employee benefit expenses
EUR million 2018 2017
Equity-settled share-based incentive plans 6.3 1.9
Cash-settled share-based incentive plans1) 0.9 2.5
Total 7.2 4.4
1) Tieto's share-based incentive plans are accounted for as equity-settled from 1 Jan 2018 onwards. Social costs from the
plans are reported as cash-settled.
9. Pension plans
Tieto manages Defined benefit plans through insurance companies. The employer has guaranteed to the members of the plans a certain level of benefit after their retirement, which depends on the length of service and salary base. The salary base is an average of last years’ salaries indexed with common salary index. After the retirement, the benefit payable is indexed yearly.
In Sweden, the Group’s risk is only on active employees, but in Finland the Group’s risk covers also around 1 000 non-active employees. When the pensioner who has a vested pension, retires, the final amount of the pension is revised in the Finnish pension plan and as a result, the employer may incur additional costs. In addition, in the Finnish pension plan, the index increases that are borne by the employer during the period between the grant date of the vested pension and the beginning of the pension are charged only in the year when the pension is granted. In some insurance contracts, under certain conditions, the insured person has the right to retire earlier than at the normal retirement age. These additional expenses are charged on the beginning of the retirement.
In Finland, the plan covers 6 active employees and it is closed for future pension accruals. The active employees have been able to transfer their defined benefit pension to a defined contribution plan from 1 Jan 2017, and some have chosen this option. As a result, a settlement gain of EUR 2.4 million was recognized in 2017 personnel expenses and the net defined benefit liability decreased by the corresponding amount.
Annual report 2018 157
Creating valueTieto 2018 Governance Financials Sustainability

In Sweden, the plan covers approximately 110 active employees. As the Group does not have actuarial or investment risk for those plan members whose employment has ceased, the plan members are removed from the pension plan and a settlement is recognized annually. In 2018, a settlement loss of EUR 1.7 million was recognized in personnel expenses and the net defined benefit liability increased by the corresponding amount.
Defined benefit cost recognized in income statement and in other comprehensive income
EUR million 2018 2017
Service cost
Current service cost 1.0 1.2
Settlements 1.7 -2.1
Net interest -0.0 -0.0
Total 2.7 -0.9
Amounts recognized in other comprehensive income
Remeasurement
Gains (-)/losses (+) from change in demographic assumptions -1.3 0.0
Gains (-)/losses (+) from change in, financial assumptions -0.4 7.6
Gains (-)/losses (+) from experience adjustments -0.6 0.2
Gains (-)/losses (+) on plan assets 2.9 -4.7
Total 0.6 3.1
Amounts recognized in the statement of financial position
Present value of defined benefit
obligaton1)Fair value of plan assets2) Net liability
EUR million 2018 2017 2018 2017 2018 2017
1 Jan 88.6 93.7 -84.1 -87.3 4.5 6.4
Current service cost 1.0 1.2 - - 1.0 1.2
Interest expense/income 1.6 2.0 -1.5 -1.9 0.0 0.0
Contribution - - -3.6 -4.3 -3.6 -4.3
Benefits paid -2.2 -2.6 2.2 2.6 0.0 0.0
Curtailment and settlement -4.4 -12.3 6.2 10.2 1.7 -2.1
Actuarial gains/losses -2.3 7.8 2.9 -4.7 0.6 3.1
Exchange rate difference -1.5 -1.2 1.8 1.3 0.3 0.1
31 Dec 80.7 88.6 -76.3 -84.1 4.4 4.5
1) Of which EUR 43.8 (50.5) million in Finland and EUR 36.9 (38.1) million in Sweden.
2) Of which EUR 33.9 million (38.7) in Finland and EUR 42.4 million (45.4) in Sweden.
EUR million 2018 2017
Defined benefit obligations 9.9 11.9
Defined benefit plan assets -5.5 -7.4
Net liability 4.4 4.5
Annual report 2018 158
Creating valueTieto 2018 Governance Financials Sustainability

Allocation of plan assets
2018 2017EUR million % EUR million %
In Sweden, plan assets are comprised as follows
Equity instruments 13.6 32.0 16.9 37.2
Debt instruments 19.5 46.1 18.6 40.9
Property 4.5 10.7 5.1 11.3
Other 4.7 11.2 4.8 10.6
Total 42.4 100.0 45.4 100.0
In Finland, the plan assets are accrued from the insurance premiums paid to the insurance company and accumulated up to the reporting date. The assets are part of the insurance company's investment assets and they are responsible for reporting the assets. A specification of the plan assets is not available.
Actuarial assumption % 2018 2017Finland
Discount rate 1.8 1.4
Future salary increases 3.3 3.4
Future pension increases 1.9 2.0
Inflation rate 1.6 1.7
Sweden
Discount rate 2.3 2.4
Future salary increases 3.4 3.3
Future pension increases 1.9 1.8
Inflation rate 1.9 1.8
Sensitivity analysis of actuarial assumptionsThe following table shows how possible change in one assumption, holding other assumptions constant, affect the defined benefit obligation.
Change in assumption
Increase in assumption
Decrease in assumption
Impact on defined benefit obligation in Finland
Discount rate 0.5% -6.6% 7.4%
Future pension increase 0.5% 6.8% -6.2%
Life expectancy +1 year 5.4%
Impact on defined benefit obligation in Sweden
Discount rate 0.5% -11.0% 12.4%
Future salary increase 0.5% 3.5% -3.5%
Future pension increase 0.5% 12.3% -11.1%
Life expectancy +1 year 5.1%
Annual report 2018 159
Creating valueTieto 2018 Governance Financials Sustainability
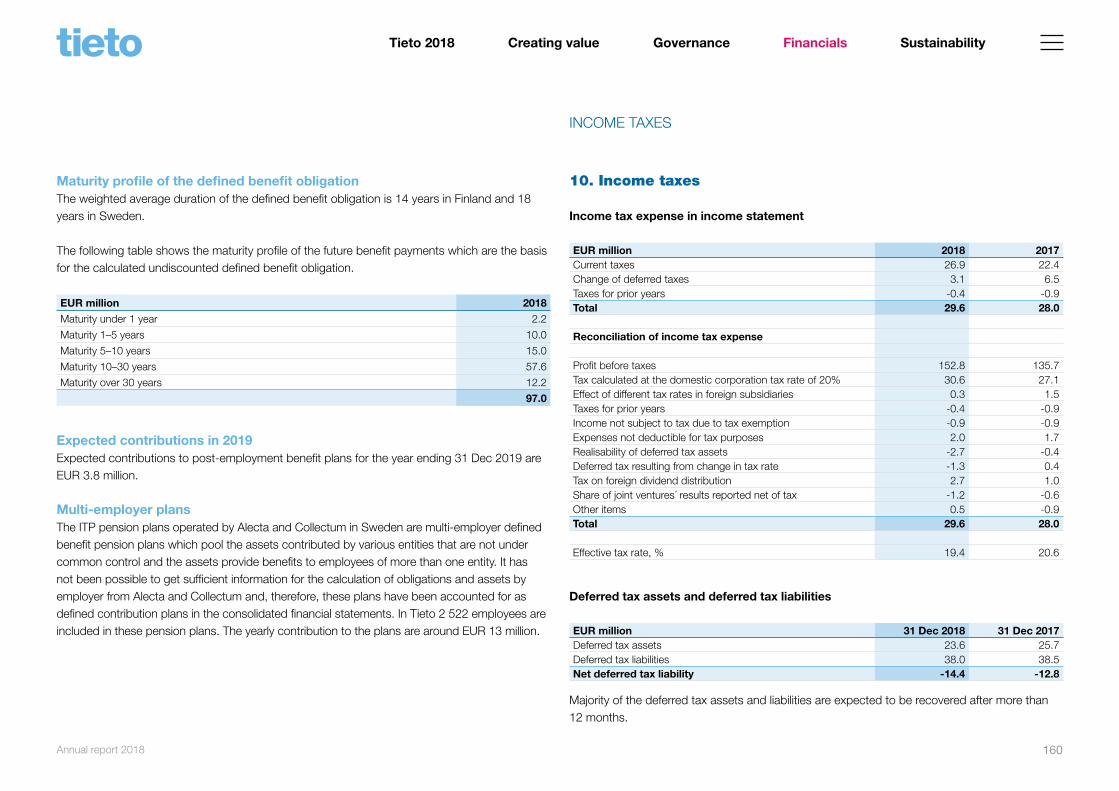
Maturity profile of the defined benefit obligationThe weighted average duration of the defined benefit obligation is 14 years in Finland and 18 years in Sweden.
The following table shows the maturity profile of the future benefit payments which are the basis for the calculated undiscounted defined benefit obligation.
EUR million 2018
Maturity under 1 year 2.2
Maturity 1–5 years 10.0
Maturity 5–10 years 15.0
Maturity 10–30 years 57.6
Maturity over 30 years 12.2
97.0
Expected contributions in 2019Expected contributions to post-employment benefit plans for the year ending 31 Dec 2019 are EUR 3.8 million.
Multi-employer plansThe ITP pension plans operated by Alecta and Collectum in Sweden are multi-employer defined benefit pension plans which pool the assets contributed by various entities that are not under common control and the assets provide benefits to employees of more than one entity. It has not been possible to get sufficient information for the calculation of obligations and assets by employer from Alecta and Collectum and, therefore, these plans have been accounted for as defined contribution plans in the consolidated financial statements. In Tieto 2 522 employees are included in these pension plans. The yearly contribution to the plans are around EUR 13 million.
10. Income taxes Income tax expense in income statement
EUR million 2018 2017Current taxes 26.9 22.4Change of deferred taxes 3.1 6.5Taxes for prior years -0.4 -0.9Total 29.6 28.0
Reconciliation of income tax expense
Profit before taxes 152.8 135.7Tax calculated at the domestic corporation tax rate of 20% 30.6 27.1Effect of different tax rates in foreign subsidiaries 0.3 1.5Taxes for prior years -0.4 -0.9Income not subject to tax due to tax exemption -0.9 -0.9Expenses not deductible for tax purposes 2.0 1.7Realisability of deferred tax assets -2.7 -0.4Deferred tax resulting from change in tax rate -1.3 0.4Tax on foreign dividend distribution 2.7 1.0Share of joint ventures´ results reported net of tax -1.2 -0.6Other items 0.5 -0.9Total 29.6 28.0
Effective tax rate, % 19.4 20.6
Deferred tax assets and deferred tax liabilities
EUR million 31 Dec 2018 31 Dec 2017Deferred tax assets 23.6 25.7Deferred tax liabilities 38.0 38.5Net deferred tax liability -14.4 -12.8
Majority of the deferred tax assets and liabilities are expected to be recovered after more than 12 months.
INCOME TAXES
Annual report 2018 160
Creating valueTieto 2018 Governance Financials Sustainability
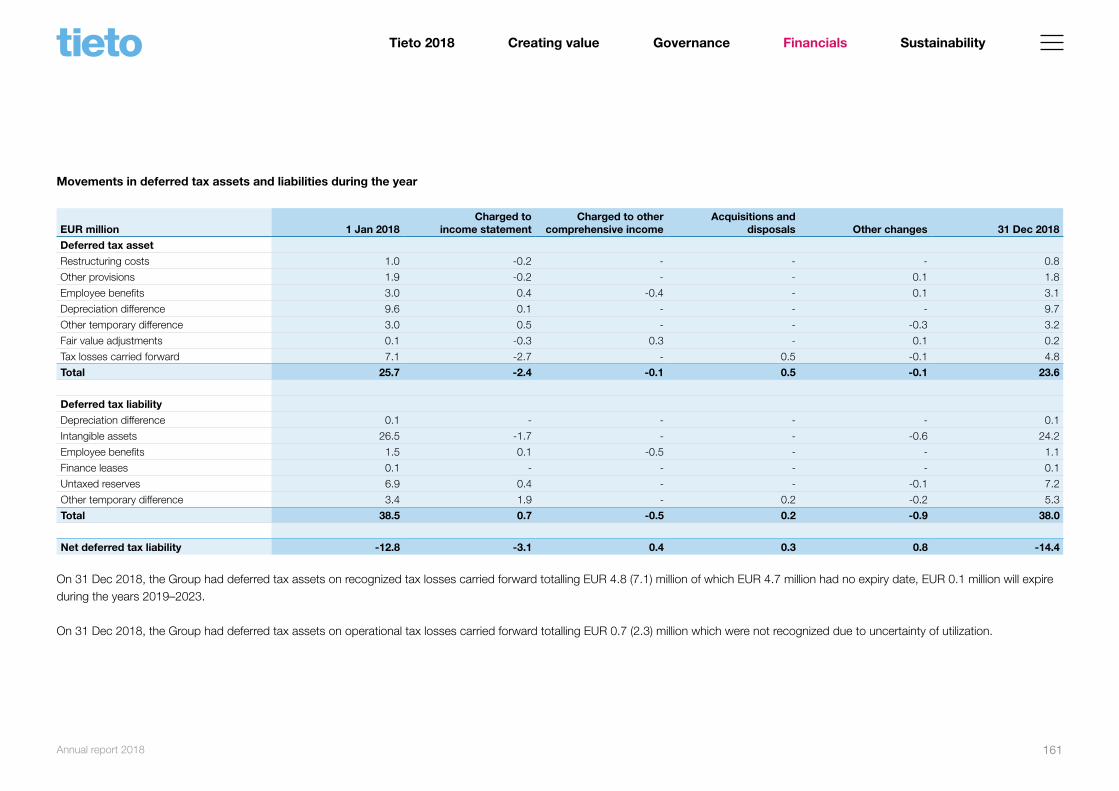
Movements in deferred tax assets and liabilities during the year
EUR million 1 Jan 2018Charged to
income statementCharged to other
comprehensive incomeAcquisitions and
disposals Other changes 31 Dec 2018Deferred tax asset
Restructuring costs 1.0 -0.2 - - - 0.8
Other provisions 1.9 -0.2 - - 0.1 1.8
Employee benefits 3.0 0.4 -0.4 - 0.1 3.1
Depreciation difference 9.6 0.1 - - - 9.7
Other temporary difference 3.0 0.5 - - -0.3 3.2
Fair value adjustments 0.1 -0.3 0.3 - 0.1 0.2
Tax losses carried forward 7.1 -2.7 - 0.5 -0.1 4.8
Total 25.7 -2.4 -0.1 0.5 -0.1 23.6
Deferred tax liability
Depreciation difference 0.1 - - - - 0.1
Intangible assets 26.5 -1.7 - - -0.6 24.2
Employee benefits 1.5 0.1 -0.5 - - 1.1
Finance leases 0.1 - - - - 0.1
Untaxed reserves 6.9 0.4 - - -0.1 7.2
Other temporary difference 3.4 1.9 - 0.2 -0.2 5.3
Total 38.5 0.7 -0.5 0.2 -0.9 38.0
Net deferred tax liability -12.8 -3.1 0.4 0.3 0.8 -14.4
On 31 Dec 2018, the Group had deferred tax assets on recognized tax losses carried forward totalling EUR 4.8 (7.1) million of which EUR 4.7 million had no expiry date, EUR 0.1 million will expire during the years 2019–2023.
On 31 Dec 2018, the Group had deferred tax assets on operational tax losses carried forward totalling EUR 0.7 (2.3) million which were not recognized due to uncertainty of utilization.
Annual report 2018 161
Creating valueTieto 2018 Governance Financials Sustainability
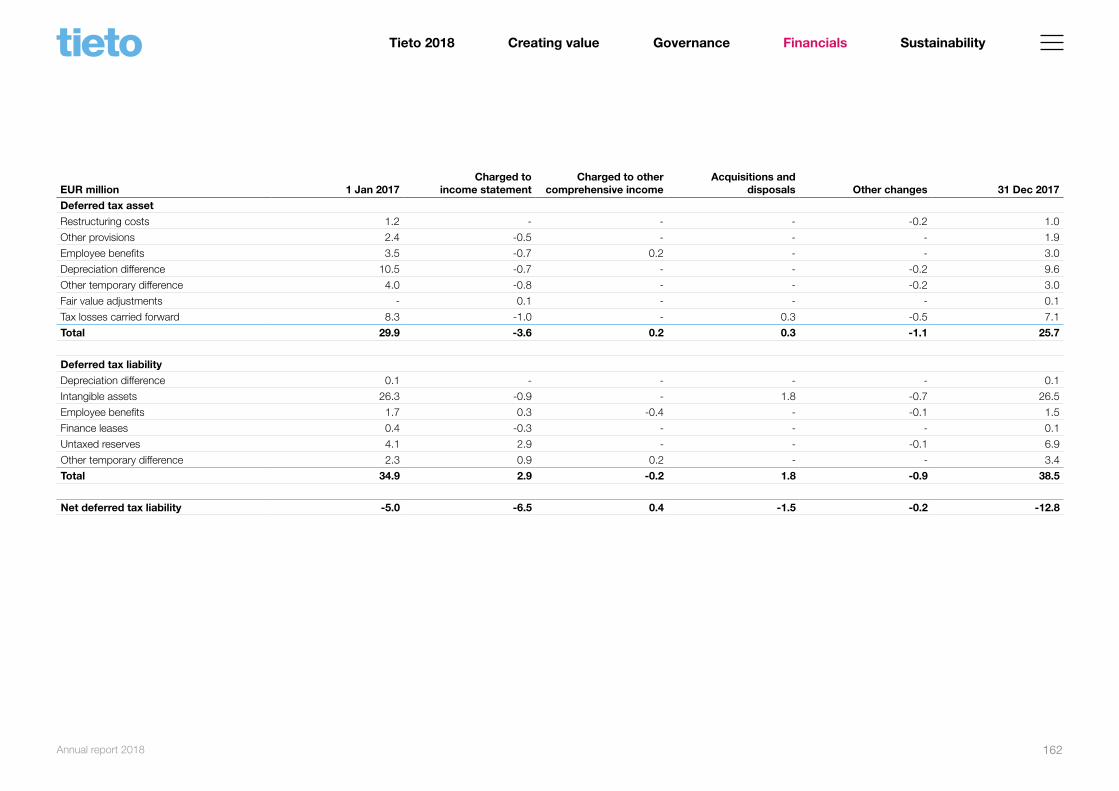
EUR million 1 Jan 2017Charged to
income statementCharged to other
comprehensive incomeAcquisitions and
disposals Other changes 31 Dec 2017Deferred tax asset
Restructuring costs 1.2 - - - -0.2 1.0
Other provisions 2.4 -0.5 - - - 1.9
Employee benefits 3.5 -0.7 0.2 - - 3.0
Depreciation difference 10.5 -0.7 - - -0.2 9.6
Other temporary difference 4.0 -0.8 - - -0.2 3.0
Fair value adjustments - 0.1 - - - 0.1
Tax losses carried forward 8.3 -1.0 - 0.3 -0.5 7.1
Total 29.9 -3.6 0.2 0.3 -1.1 25.7
Deferred tax liability
Depreciation difference 0.1 - - - - 0.1
Intangible assets 26.3 -0.9 - 1.8 -0.7 26.5
Employee benefits 1.7 0.3 -0.4 - -0.1 1.5
Finance leases 0.4 -0.3 - - - 0.1
Untaxed reserves 4.1 2.9 - - -0.1 6.9
Other temporary difference 2.3 0.9 0.2 - - 3.4
Total 34.9 2.9 -0.2 1.8 -0.9 38.5
Net deferred tax liability -5.0 -6.5 0.4 -1.5 -0.2 -12.8
Annual report 2018 162
Creating valueTieto 2018 Governance Financials Sustainability

11. Intangible assets
EUR million Goodwill
Software acquired
separately
Intangible assets recognized
from acquisitions Other1)Advance
payments TotalAcquisition cost 1 Jan 2018 441.3 37.9 43.7 45.4 4.5 572.8
Acquisitions of subsidiaries 12.8 0.0 2.3 0.1 - 15.2
Additions - 6.0 - 4.0 2.1 12.1
Disposals -3.5 -2.8 -3.1 -2.0 - -11.4
Reclassifications - 3.2 - -0.6 -3.7 -1.1
Translation differences -8.0 -0.2 -0.7 -0.1 -0,0 -9.0
Acquisition cost 31 Dec 2018 442.6 44.0 42.2 46.7 3.0 578.5
Accumulated amortization and impairments 1 Jan 2018 - -30.7 -14.4 -34.5 -0.9 -80.5
Acquisitions of subsidiaries - -0,0 - - - -0.0
Disposals - 2.1 1.5 2.0 - 5.6
Amortization - -7.2 -5.2 -3.4 - -15.8
Impairments - - - - - 0.0
Reclassifications - 1.0 - -0.6 - 0.4
Translation differences - 0.2 -0.1 0.0 0.0 0.1
Accumulated amortization and impairments 31 Dec 2018 - -34.6 -18.3 -36.5 -0.9 -90.3
Carrying value 1 Jan 2018 441.3 7.2 29.3 10.9 3.7 492.4
Carrying value 31 Dec 2018 442.6 9.4 23.9 10.2 2.1 488.2
1) Additions in other intangible assets include EUR 3.6 million capitalized development costs.
ASSETS
Annual report 2018 163
Creating valueTieto 2018 Governance Financials Sustainability

EUR million Goodwill
Software acquired
separately
Intangible assets recognized
from acquisitions OtherAdvance
payments TotalAcquisition cost 1 Jan 2017 409.7 126.7 38.1 56.0 7.8 638.3
Acquisitions of subsidiaries 40.6 - 8.1 - - 48.7
Additions - 6.0 - 4.8 2.0 12.8
Disposals - -95.7 -0.9 -4.4 -0.5 -101.5
Reclassifications - 1.1 - -10.7 -4.8 -14.4
Translation differences -9.0 -0.2 -1.6 -0.3 0.0 -11.1
Acquisition cost 31 Dec 2017 441.3 37.9 43.7 45.4 4.5 572.8
Accumulated amortization and impairments 1 Jan 2017 - -120.8 -11.4 -42.8 -1.3 -176.3
Disposals - 95.7 0.9 4.6 0.5 101.7
Amortization - -5.8 -4.3 -5.1 - -15.2
Impairments - - - - - 0.0
Reclassifications - 0.0 - 8.6 0.0 8.6
Translation differences - 0.2 0.4 0.2 0.0 0.8
Accumulated amortization and impairments 31 Dec 2017 - -30.7 -14.4 -34.5 -0.9 -80.5
Carrying value 1 Jan 2017 409.7 5.9 26.7 13.2 6.5 462.0
Carrying value 31 Dec 2017 441.3 7.2 29.3 10.9 3.7 492.4
Annual report 2018 164
Creating valueTieto 2018 Governance Financials Sustainability

12. Property, plant and equipment
EUR million LandBuildings
and structuresMachinery
and equipmentCapitalized
finance leasesOther
tangible assetsAdvance payments
and work in progress TotalAcquisition cost 1 Jan 2018 1.2 3.8 303.4 3.9 53.9 3.1 369.3
Acquisitions of subsidiaries - - 0.2 - 0.3 - 0.5
Additions - - 30.4 - 2.8 4.3 37.4
Disposals - - -17.2 - -1.8 -0.2 -19.2
Reclassifications - - 1.0 - 0.8 -1.2 0.6
Translation differences - - -3.1 - -0.7 -0,0 -3.8
Cost 31 Dec 2018 1.2 3.8 314.6 3.9 55.3 6.0 384.8
Accumulated amortization and impairments 1 Jan 2018 - -1.6 -252.3 -1.6 -18.0 -1.0 -274.4
Acquisitions of subsidiaries - - -0.2 - -0.2 - -0.4
Disposals - - 17.0 - 1.8 0.1 18.9
Depreciation - -0.1 -32.3 -0.8 -6.0 - -39.2
Reclassifications - - 0.0 - -0.4 - -0.4
Translation differences - - 2.5 - 0.5 0.0 3.0
Accumulated amortization and impairments 31 Dec 2018 - -1.7 -265.2 -2.4 -22.3 -0.9 -292.5
Carrying value 1 Jan 2018 1.2 2.2 51.1 2.4 35.9 2.1 94.9
Carrying value 31 Dec 2018 1.2 2.1 49.3 1.6 33.0 5.1 92.3
Annual report 2018 165
Creating valueTieto 2018 Governance Financials Sustainability

EUR million LandBuildings
and structuresMachinery
and equipmentCapitalized
finance leaseOther
tangible assetsAdvance payments
and work in progress TotalAcquisition cost 1 Jan 2017 1.2 3.8 413.2 55.7 23.2 13.5 510.6
Acquisitions of subsidiaries - - 0.0 - - - 0.0
Additions - - 25.8 - 10.8 1.5 38.1
Disposals - - -137.5 -51.6 -0.8 -0.3 -190.2
Reclassifications - - 4.2 - 21.0 -11.5 13.7
Translation differences - - -2.3 -0.2 -0.3 -0.1 -2.9
Acquisition cost 31 Dec 2017 1.2 3.8 303.4 3.9 53.9 3.1 369.3
Accumulated amortization and impairments 1 Jan 2017 - -1.5 -356.4 -50.4 -7.1 -1.3 -416.7
Disposals - - 137.2 49.8 0.6 0.3 187.9
Depreciation - -0.1 -35.1 -1.1 -3.2 - -39.5
Reclassifications - - - - -8.5 0.0 -8.5
Translation differences - - 2.0 0.2 0.2 0.0 2.4
Accumulated amortization and impairments 31 Dec 2017 - -1.6 -252.3 -1.6 -18.0 -1.0 -274.4
Carrying value 1 Jan 2017 1.2 2.3 56.8 5.3 16.1 12.2 93.9
Carrying value 31 Dec 2017 1.2 2.2 51.1 2.4 35.9 2.1 94.9
Annual report 2018 166
Creating valueTieto 2018 Governance Financials Sustainability
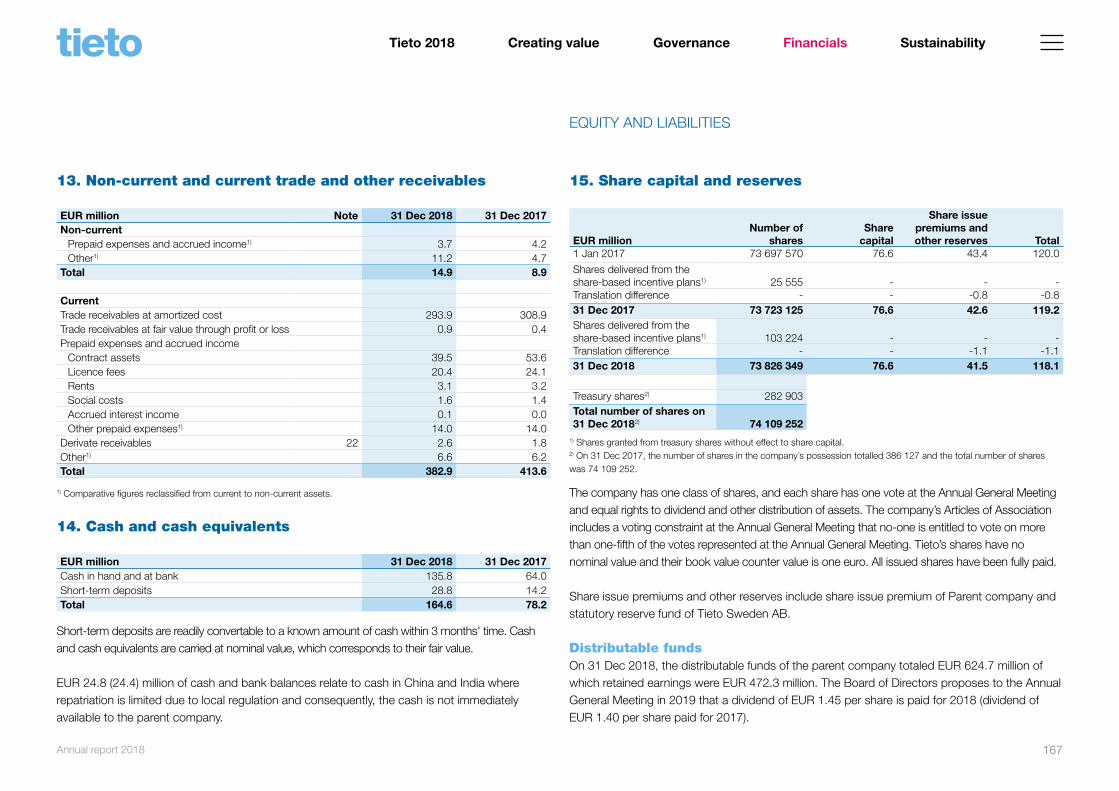
13. Non-current and current trade and other receivables EUR million Note 31 Dec 2018 31 Dec 2017Non-current
Prepaid expenses and accrued income1) 3.7 4.2Other1) 11.2 4.7
Total 14.9 8.9
CurrentTrade receivables at amortized cost 293.9 308.9Trade receivables at fair value through profit or loss 0.9 0.4Prepaid expenses and accrued income
Contract assets 39.5 53.6Licence fees 20.4 24.1Rents 3.1 3.2Social costs 1.6 1.4Accrued interest income 0.1 0.0Other prepaid expenses1) 14.0 14.0
Derivate receivables 22 2.6 1.8Other1) 6.6 6.2Total 382.9 413.6
1) Comparative figures reclassified from current to non-current assets.
14. Cash and cash equivalents
EUR million 31 Dec 2018 31 Dec 2017Cash in hand and at bank 135.8 64.0Short-term deposits 28.8 14.2Total 164.6 78.2
Short-term deposits are readily convertable to a known amount of cash within 3 months' time. Cash and cash equivalents are carried at nominal value, which corresponds to their fair value.
EUR 24.8 (24.4) million of cash and bank balances relate to cash in China and India where repatriation is limited due to local regulation and consequently, the cash is not immediately available to the parent company.
15. Share capital and reserves
EUR millionNumber of
sharesShare
capital
Share issue premiums and other reserves Total
1 Jan 2017 73 697 570 76.6 43.4 120.0
Shares delivered from the share-based incentive plans1) 25 555 - - -Translation difference - - -0.8 -0.831 Dec 2017 73 723 125 76.6 42.6 119.2Shares delivered from the share-based incentive plans1) 103 224 - - -Translation difference - - -1.1 -1.131 Dec 2018 73 826 349 76.6 41.5 118.1
Treasury shares2) 282 903Total number of shares on 31 Dec 20182) 74 109 252
1) Shares granted from treasury shares without effect to share capital. 2) On 31 Dec 2017, the number of shares in the company´s possession totalled 386 127 and the total number of shares was 74 109 252.
The company has one class of shares, and each share has one vote at the Annual General Meeting and equal rights to dividend and other distribution of assets. The company’s Articles of Association includes a voting constraint at the Annual General Meeting that no-one is entitled to vote on more than one-fifth of the votes represented at the Annual General Meeting. Tieto’s shares have no nominal value and their book value counter value is one euro. All issued shares have been fully paid.
Share issue premiums and other reserves include share issue premium of Parent company and statutory reserve fund of Tieto Sweden AB.
Distributable fundsOn 31 Dec 2018, the distributable funds of the parent company totaled EUR 624.7 million of which retained earnings were EUR 472.3 million. The Board of Directors proposes to the Annual General Meeting in 2019 that a dividend of EUR 1.45 per share is paid for 2018 (dividend of EUR 1.40 per share paid for 2017).
EQUITY AND LIABILITIES
Annual report 2018 167
Creating valueTieto 2018 Governance Financials Sustainability
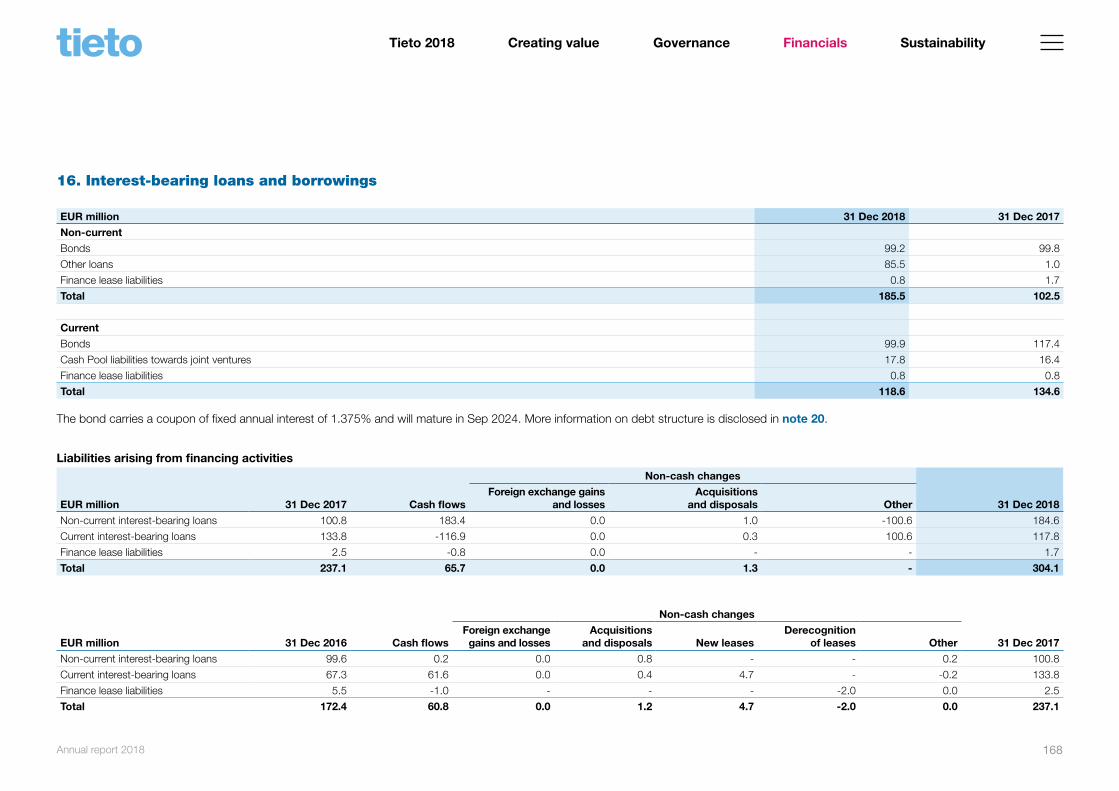
16. Interest-bearing loans and borrowings EUR million 31 Dec 2018 31 Dec 2017Non-current
Bonds 99.2 99.8
Other loans 85.5 1.0
Finance lease liabilities 0.8 1.7
Total 185.5 102.5
Current
Bonds 99.9 117.4
Cash Pool liabilities towards joint ventures 17.8 16.4
Finance lease liabilities 0.8 0.8
Total 118.6 134.6
The bond carries a coupon of fixed annual interest of 1.375% and will mature in Sep 2024. More information on debt structure is disclosed in note 20.
Liabilities arising from financing activitiesNon-cash changes
EUR million 31 Dec 2017 Cash flowsForeign exchange gains
and lossesAcquisitions
and disposals Other 31 Dec 2018
Non-current interest-bearing loans 100.8 183.4 0.0 1.0 -100.6 184.6
Current interest-bearing loans 133.8 -116.9 0.0 0.3 100.6 117.8
Finance lease liabilities 2.5 -0.8 0.0 - - 1.7
Total 237.1 65.7 0.0 1.3 - 304.1
Non-cash changes
EUR million 31 Dec 2016 Cash flowsForeign exchange
gains and lossesAcquisitions
and disposals New leasesDerecognition
of leases Other 31 Dec 2017
Non-current interest-bearing loans 99.6 0.2 0.0 0.8 - - 0.2 100.8
Current interest-bearing loans 67.3 61.6 0.0 0.4 4.7 - -0.2 133.8
Finance lease liabilities 5.5 -1.0 - - - -2.0 0.0 2.5
Total 172.4 60.8 0.0 1.2 4.7 -2.0 0.0 237.1
Annual report 2018 168
Creating valueTieto 2018 Governance Financials Sustainability

17. Provisions
EUR millionProvisions for restructuring
Provisions for loss-making
contractsOther
provisions
1 Jan 2018 7.5 1.9 3.5
Translation differences -0.2 0.0 -0.0
Acquisitions of subsidiaries -0.3 - -0.0
Increases in provisions 7.1 1.4 2.8
Use of provisions -8.4 -1.5 -0.7
Reversal of provisions -0.2 -0.3 -1.8
31 Dec 2018 5.4 1.6 3.8
of which
Non-current 0.5 0.0 2.9
Current 4.9 1.6 0.9
Total 5.4 1.6 3.8
Major part of the new restructuring costs in 2018 are related to efficiency programmes in Sweden.
EUR millionProvisions for restructuring
Provisions for loss-making
contractsOther
provisions
1 Jan 2017 9.9 2.1 4.9
Translation differences -0.2 -0 0 -0 0
Increases in provisions 20.2 1.5 1.6
Use of provisions -21.3 -1.5 -1.8
Reversal of provisions -1.1 -0.2 -1.2
31 Dec 2017 7.5 1.9 3.5
of which
Non-current 0.4 0.0 2.2
Current 7.1 1.9 1.3
Total 7.5 1.9 3.5
18. Lease commitments
Finance leases
Finance lease receivables
EUR million 31 Dec 2018 31 Dec 2017Amortization periods of finance lease gross receivables
Within one year 0.9 2.1Between one and five years 0.7 0.8
Gross investment 1.6 2.9Unearned future finance income 0.1 0.1Net investment 1.6 2.8
Present value of minimum lease payment receivablesWithin one year 0.9 2.0Between one and five years 0.7 0.8
Net investment 1.6 2.8
Tieto treats certain customer dedicated IT hardware assets, normally servers, as finance lease receivables.
Finance lease liabilitiesFuture minimum lease payments and their present value under finance lease agreements: EUR million 31 Dec 2018 31 Dec 2017Finance lease future payments
Within one year 0.9 0.9Between one and five years 0.9 1.7
Total 1.7 2.6
Present value of future minimum lease paymentsWithin one year 0.8 0.8Between one and five years 0.8 1.7
Total 1.7 2.5
Future interest charge 0.1 0.1
Annual report 2018 169
Creating valueTieto 2018 Governance Financials Sustainability

Tieto has finance leases for IT equipment and software. Certain leases include purchase options. Renewals are subject to separate negotiations. Interest rate of financial lease liabilities on 31 Dec 2018 was 3.7% (3.7%).
Operating leasesOperating lease agreements are typically rent agreements for premises, cars, servers and other data equipment and which do not fulfill the criteria for finance lease.
Rental expenses related to operating leases
EUR million 2018 2017
Premises rents 44.5 45.9
Other rental expenses of operating leases 13.9 11.9
Total 58.4 57.8
Future rent and other operating lease commitments are disclosed in note 27.
19. Trade and other payables
EUR million Note 31 Dec 2018 31 Dec 2017
Trade payables 101.5 104.2
Contract liabilities 30.5 30.8
Accrued liabilities
Employee-related accruals 126.0 135.9
Interest 2.2 1.8
Rent 3.0 3.8
Derivative liabilities 22 0.4 0.9
Other accrued expenses 29.8 39.6
Value added tax liabilities 31.8 30.8
Payroll tax liabilities 14.9 15.1
Total 340.1 362.9
20. Management of financial risks
The group's activities expose it to a variety of financial risks: market risk (including currency risk, interest rate risk and commodity risk), credit risk and liquidity risk. The operative management of the treasury activities of Tieto is centralized into Group Treasury. The Group Treasury is responsible for managing the Group’s financial risk position and maintaining adequate liquidity. The Treasury Policy, which has been approved by the Board of Directors, defines the principles for measuring and managing liquidity risk, interest rate risk, foreign exchange risks and counterparty risk of the Group. The Treasury Policy also defines the division of responsibilities with regard to financial risk management. The Group reviews and monitors financial risks on a regular basis.
Market risk
Currency risk managementTRANSACTION RISK
Currency risk means the risk that the result or economic situation of the Group changes due to changes in exchange rates. Foreign trade, Group internal transactions and liquidity management in non-euro countries generate transaction exposure to the Group. The objective of the Groups' currency risk policy is to secure profitability of operative business by managing recognized exposures while maintaining on a Group level a sufficient flexibility to adjust to changing currency markets. The Treasury Policy defines the approved hedging instruments for Tieto, and the Group's policy is to hedge all identified currency exposures within the limits defined in the Policy. The underlying exposure includes financial items such as foreign currency accounts receivables and payables of operating companies, internal funding and foreign currency bank account balances, and estimated cash flows such as firm commitments and future trade transactions.
FINANCIAL INSTRUMENTS – FAIR VALUES AND RISK MANAGEMENT
Annual report 2018 170
Creating valueTieto 2018 Governance Financials Sustainability

Swedish krona, Norwegian krona, Czech koruna, Indian rupee, Polish zloty and US dollar are the largest currencies in the exposure. Russian rouble does not have a material impact on Group exposure. During 2018, Tieto used currency forward contracts and swaps to mitigate the risks. Gains and losses from foreign exchange contracts are recognized in the concolidated income statement.
Group companies must hedge all their identified currency risks with the Group Treasury unless there are legal restrictions preventing this. The benchmark for the Group’s currency position is a situation where all the identified currency risks are eliminated. A deviation from this benchmark is defined as an open position. The following deviations can be made based on the total size of the Group’s gross currency position (identified currency risks, excluding the hedging transactions):
• +/- 15 %: Group Treasury• +/- 25 %: Treasury Committee• Greater deviation: Board of Directors
The overall operational hedging ratio at the end of Dec 2018 was 99% (94%).
Identified currency transaction risk exposure and sensitivity analysis
EUR million
Financial items
exposure
Estimat-ed cash
flows
Total foreign
exchange exposure
External foreign
exchange hedges
Transaction exposure
sensitivity1)
Foreign exchange
hedge sensitivity1)
Net effect gain/(loss)
SEK31 Dec 2018 0.7 23.9 24.6 -25.1 -0.1 2.5 2.431 Dec 2017 -80.0 18.3 -61.7 56.0 8.0 -5.6 2.4
NOK31 Dec 2018 -12.3 -2.0 -14.3 14.2 1.2 -1.4 -0.231 Dec 2017 -13.2 6.8 -6.4 5.6 1.3 -0.6 0.8
PLN31 Dec 2018 -0.1 -6.9 -7.0 6.9 0.0 -0.7 -0.731 Dec 2017 0.1 -9.5 -9.4 9.2 0.0 -0.9 -0.9
CZK31 Dec 2018 -7.0 -44.4 -51.4 51.1 0.7 -5.1 -4.431 Dec 2017 -5.0 -34.4 -39.4 40.1 0.5 -4.0 -3.5
INR31 Dec 2018 - -33.3 -33.3 33.1 - -3.3 -3.331 Dec 2017 - -22.1 -22.1 21.9 - -2.2 -1.9
USD31 Dec 2018 1.7 11.6 13.3 -13.1 -0.2 - -1.331 Dec 2017 0.5 - 0.5 - -0.1 - -0.1
Other31 Dec 2018 -1.8 -1.5 -3.3 1.5 0.2 -0.2 0.031 Dec 2017 -1.6 -2.9 -4.5 2.9 0.2 -0.3 -0.1
1) The maximum pre-tax effect (EUR million) of 10% negative change in exchange rates on the Group's foreign exchange
position over the following year.
Annual report 2018 171
Creating valueTieto 2018 Governance Financials Sustainability
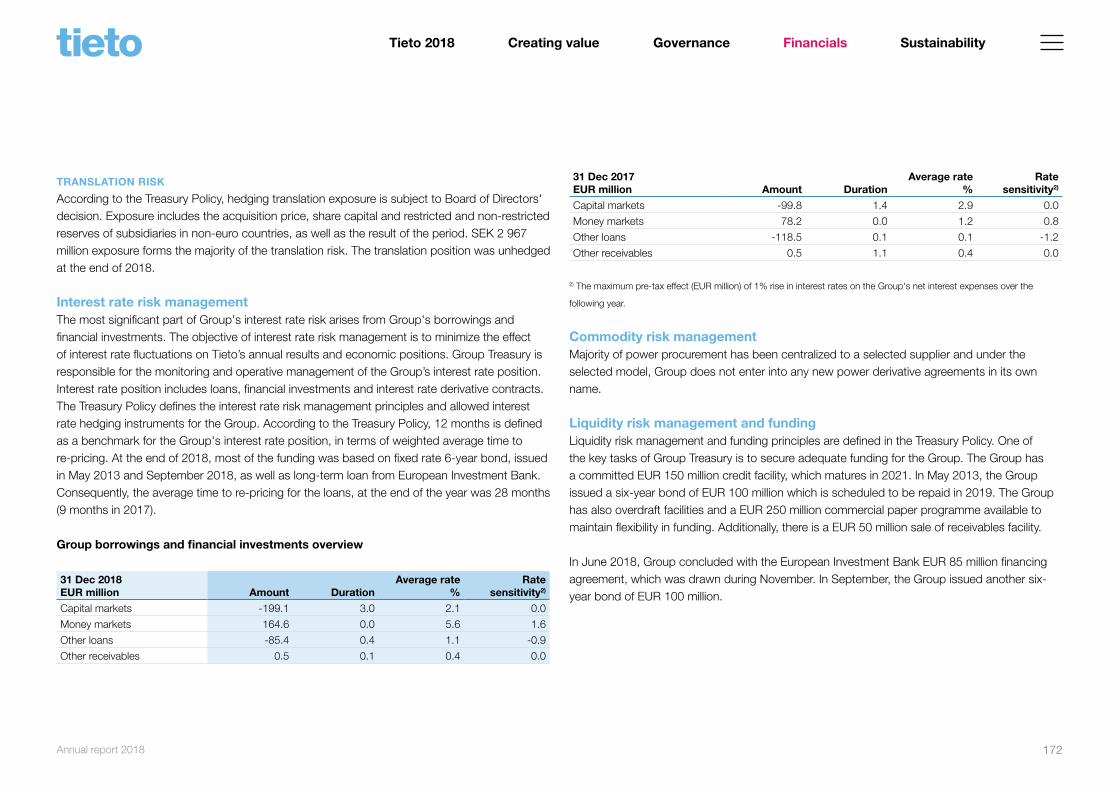
TRANSLATION RISK
According to the Treasury Policy, hedging translation exposure is subject to Board of Directors' decision. Exposure includes the acquisition price, share capital and restricted and non-restricted reserves of subsidiaries in non-euro countries, as well as the result of the period. SEK 2 967 million exposure forms the majority of the translation risk. The translation position was unhedged at the end of 2018.
Interest rate risk managementThe most significant part of Group's interest rate risk arises from Group's borrowings and financial investments. The objective of interest rate risk management is to minimize the effect of interest rate fluctuations on Tieto’s annual results and economic positions. Group Treasury is responsible for the monitoring and operative management of the Group’s interest rate position. Interest rate position includes loans, financial investments and interest rate derivative contracts. The Treasury Policy defines the interest rate risk management principles and allowed interest rate hedging instruments for the Group. According to the Treasury Policy, 12 months is defined as a benchmark for the Group's interest rate position, in terms of weighted average time to re-pricing. At the end of 2018, most of the funding was based on fixed rate 6-year bond, issued in May 2013 and September 2018, as well as long-term loan from European Investment Bank. Consequently, the average time to re-pricing for the loans, at the end of the year was 28 months (9 months in 2017).
Group borrowings and financial investments overview
31 Dec 2018 EUR million Amount Duration
Average rate %
Rate sensitivity2)
Capital markets -199.1 3.0 2.1 0.0
Money markets 164.6 0.0 5.6 1.6
Other loans -85.4 0.4 1.1 -0.9
Other receivables 0.5 0.1 0.4 0.0
31 Dec 2017EUR million Amount Duration
Average rate %
Rate sensitivity2)
Capital markets -99.8 1.4 2.9 0.0
Money markets 78.2 0.0 1.2 0.8
Other loans -118.5 0.1 0.1 -1.2
Other receivables 0.5 1.1 0.4 0.0
2) The maximum pre-tax effect (EUR million) of 1% rise in interest rates on the Group's net interest expenses over the
following year.
Commodity risk managementMajority of power procurement has been centralized to a selected supplier and under the selected model, Group does not enter into any new power derivative agreements in its own name.
Liquidity risk management and fundingLiquidity risk management and funding principles are defined in the Treasury Policy. One of the key tasks of Group Treasury is to secure adequate funding for the Group. The Group has a committed EUR 150 million credit facility, which matures in 2021. In May 2013, the Group issued a six-year bond of EUR 100 million which is scheduled to be repaid in 2019. The Group has also overdraft facilities and a EUR 250 million commercial paper programme available to maintain flexibility in funding. Additionally, there is a EUR 50 million sale of receivables facility. In June 2018, Group concluded with the European Investment Bank EUR 85 million financing agreement, which was drawn during November. In September, the Group issued another six-year bond of EUR 100 million.
Annual report 2018 172
Creating valueTieto 2018 Governance Financials Sustainability

Debt structure
Maturity structure31 Dec 2018EUR million
Amount drawn
Amount available 2019 2020 2021 2022 2023 2024–
Loans Bond 200.0 - 100.0 - - - - 100.0
Commercial paper programme - 250.0 - - - - - -
Revolving credit facility - 150.0 - - - - - -
Liabilities towards joint ventures 17.8 - 17.8 - - - - -
European Investment Bank 85.0 85.0 - - 6.5 13.1 13.1 13.1
Other loans 0.4 - 0.4 - - - - -
303.3 485.0 118.3 - 6.5 13.1 13.1 113.1
Interest payments - - 4.7 1.8 1.8 1.7 1.7 1.9
Trade payables Outflow - - 101.5 - - - - -
Other liabilities Financial lease liability 1.7 - 0.9 0.8 - - - -
Total 305.0 485.0 225.4 2.6 8.3 14.8 14.8 115.0
Annual report 2018 173
Creating valueTieto 2018 Governance Financials Sustainability

31 Dec 2017 Maturity structure
EUR millionAmount
drawnAmount
available 2018 2019 2020 2021 2022 2023–
Loans Bond 100.0 - - 100.0 - - - -
Commercial paper programme 115.0 135.0 115.0 - - - - -
Revolving credit facility - 150.0 - - - - - -
Liabilities towards Joint Ventures 16.0 - 16.0 - - - - -
European Investment Bank - 85.0 - - - - - -
Other loans 3.6 - 2.5 0.9 0.2 - - -
234.6 370.0 133.5 100.9 0.2 - - -
Interest payments - - 2.8 1.1 0.0 - - -
Trade payables Outflow - - 104.2 - - - - -
Other liabilities Financial lease liability 2.6 - 0.9 0.9 0.8 - - -
Total 237.2 370.0 241.4 102.9 1.0 - - -
Annual report 2018 174
Creating valueTieto 2018 Governance Financials Sustainability

Credit risk managementCredit risk is managed on Group level. Credit risk derives from financial investments, derivative contracts and customer-related risks, such as accounts receivables. Group Treasury maintains a list of approved counterparties for commercial paper investment and other financial transactions in accordance with limits set in the Treasury Policy. According to the Treasury Policy, core banks of the Group should have a minimum long-term rating of Baa3 or BBB-. The Credit Policy defines the limits for the acceptable level of customer credit risk in terms of invoicing schedules and payment terms. Customer-related credit risks are assessed based on payment history and financial strength in accordance with the Credit Policy. During the comparative year 2017, bad debt provisions were booked if the customer was late by more than 90 days. Provisions for bad debts increased by EUR 0.5 million and EUR 0.1 million of bad debts were written off in 2017.
Since 2018, the Group has applied the impairment requirements as defined in IFRS 9. The Group elected to use the simplified method of applying life-time expected credit losses for all its financial assets and Provision Matrix for its customer related impairment estimates. Default event is defined as 90 days past due or write off event due to inability of collecting the debt. The Group has performed its external customer segmentation so that each customer segment would bear similar credit characteristics and are subject to separately defined loss rate, based on the following criteria:
• Country Group (Finland, Sweden, Norway, Other European Union countries, Other countries)• Industry Group (Financial Services, Public Healthcare & Welfare, Industrial Customer
Services, Product Development Services)• Balance due status (Not yet due, overdue 1–7 days, 8–30 days, 31–60 days, 61–90 days,
over 90 days)• Expected credit loss rates applied during 2018 are based on historial defaults identified
during years 2015–2017. The Group did not adjust the rates for any macroeconomic conditions, since no significant changes or events were identified in those economic enviroments, where the Group's customers operate.
In addition, the Group uses customer credit insurance, given by global credit insurer, as a collateral. Excluded from credit incurance cover are all Public Sector customers and some other selected customers. For those customer receivables which are covered by insurer, no impairment is calculated, since the Group considers that the credit risk is significantly mitigated by transferring that to the insurer. In case of default by customer under insurance, the credit insurer covers 90% of the open accounts receivables, or up to limit received from credit insurer.
The Group has a sale of receivables facility with one of its core banks. The total facility size is EUR 50 million. Such receivables are classified at fair value through profit or loss and, therefore, no credit losses are calculated, see Note 13. There are no major concentrations of credit risk in the Group, whether through exposure to individual customers, specific industry sectors and/or regions. The maximum exposure to customer related credit risk at the reporting date is the carrying value of trade receivables.
Annual report 2018 175
Creating valueTieto 2018 Governance Financials Sustainability

Group trade receivables maturity and expected credit losses
31 Dec 2018EUR million Not yet due
Overdue 1–7 days
Overdue 8–30 days
Overdue 31–60 days
Overdue 61–90 days
Overdue over 90 days Grand Total
Gross trade receivables subject to impairment 151.2 26.3 1.3 2.0 0.8 0.9 182.4
Average expected loss rate applied -0.1% -0.4% -2.5% -4.0% -5.1% -22.4% -0.4%
Collective loss allowance -0.2 -0.1 -0.0 -0.1 -0.0 -0.2 -0.7
Individual loss allowance -0.0 -0.0 - -0.0 -0.0 -0.1 -0.1
Total loss allowance -0.2 -0.2 -0.0 -0.1 -0.0 -0.3 -0.8Trade receivables net of ECL 150.9 26.1 1.3 1.9 0.8 0.6 181.6
Trade receivables covered by collateral 93.6 15.8 1.4 0.5 0.5 0.5 112.3
Total trade receivables at amortized cost 244.5 42.0 2.7 2.3 1.2 1.1 293.9
When calculating ECL for contract assets, the ECL rate set for “not yet due” invoices in the provision matrix is used, based on the same customer segmentation groups.
Annual report 2018 176
Creating valueTieto 2018 Governance Financials Sustainability
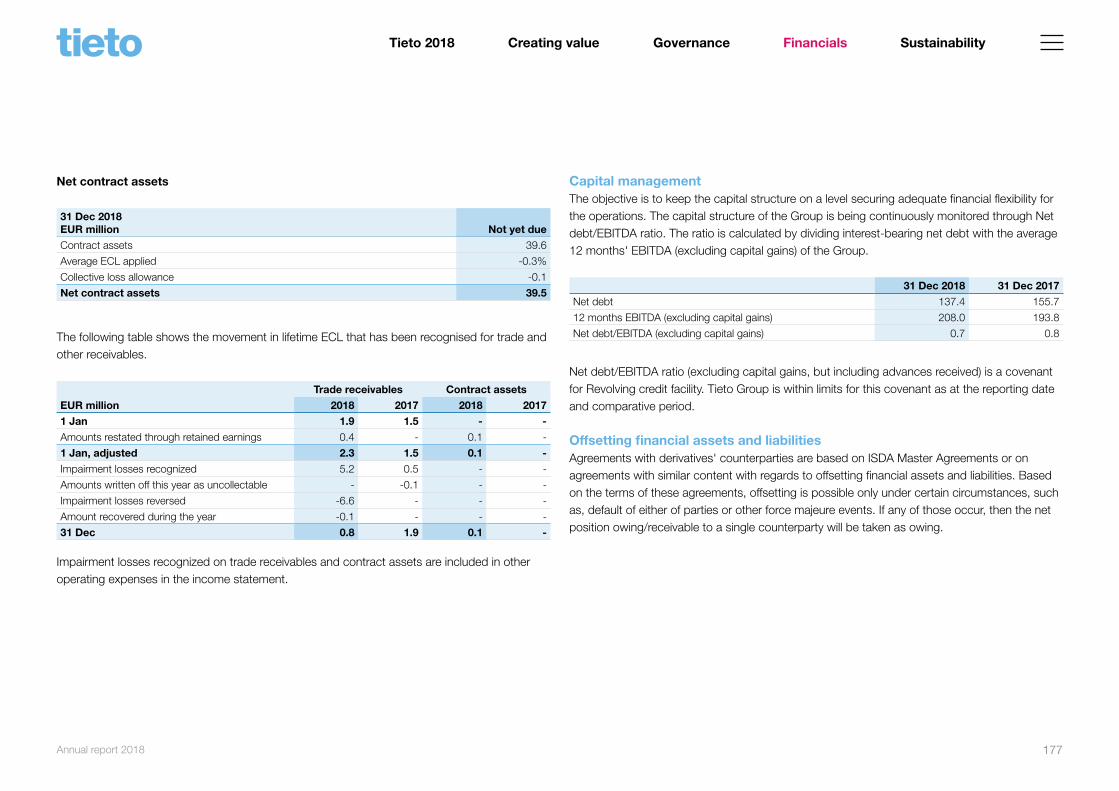
Net contract assets
31 Dec 2018EUR million Not yet due
Contract assets 39.6
Average ECL applied -0.3%
Collective loss allowance -0.1
Net contract assets 39.5
The following table shows the movement in lifetime ECL that has been recognised for trade and other receivables.
Trade receivables Contract assetsEUR million 2018 2017 2018 20171 Jan 1.9 1.5 - -
Amounts restated through retained earnings 0.4 - 0.1 -
1 Jan, adjusted 2.3 1.5 0.1 -
Impairment losses recognized 5.2 0.5 - -
Amounts written off this year as uncollectable - -0.1 - -
Impairment losses reversed -6.6 - - -
Amount recovered during the year -0.1 - - -
31 Dec 0.8 1.9 0.1 -
Impairment losses recognized on trade receivables and contract assets are included in other operating expenses in the income statement.
Capital managementThe objective is to keep the capital structure on a level securing adequate financial flexibility for the operations. The capital structure of the Group is being continuously monitored through Net debt/EBITDA ratio. The ratio is calculated by dividing interest-bearing net debt with the average 12 months' EBITDA (excluding capital gains) of the Group.
31 Dec 2018 31 Dec 2017
Net debt 137.4 155.7
12 months EBITDA (excluding capital gains) 208.0 193.8
Net debt/EBITDA (excluding capital gains) 0.7 0.8
Net debt/EBITDA ratio (excluding capital gains, but including advances received) is a covenant for Revolving credit facility. Tieto Group is within limits for this covenant as at the reporting date and comparative period.
Offsetting financial assets and liabilitiesAgreements with derivatives' counterparties are based on ISDA Master Agreements or on agreements with similar content with regards to offsetting financial assets and liabilities. Based on the terms of these agreements, offsetting is possible only under certain circumstances, such as, default of either of parties or other force majeure events. If any of those occur, then the net position owing/receivable to a single counterparty will be taken as owing.
Annual report 2018 177
Creating valueTieto 2018 Governance Financials Sustainability

Derivative financial assets and liabilities
Related amounts not set off in the statement of financial position
31 Dec 2018EUR million
Gross amounts of recognized financial
instruments in statement of financial position
Gross amounts set off in the statement of
financial positionNet amounts of financial instruments recognized Financial Instruments Cash collateral received Net amount
Derivative financial assets 2.6 - 2.6 -0.3 - 2.3
Derivative financial liabilities -0.4 - -0.4 0.3 - -0.1
31 Dec 2017EUR million
Derivative financial assets 1.8 - 1.8 -0.5 - 1.3
Derivative financial liabilities -0.9 - -0.9 0.5 - -0.4
Annual report 2018 178
Creating valueTieto 2018 Governance Financials Sustainability

21. Financial assets and liabilities - carrying amount and fair value and fair value hierarchy
Financial assets31 Dec 2018 31 Dec 2017
EUR millionCarrying amounts
Fair values
Carrying amounts
Fair values
Fair value hierarchy
Financial assets at fair value through profit or loss
Trade receivables at fair value through profit or loss1) 0.9 0.9 0.4 0.4 Level 2Current derivative receivables 2.6 2.6 1.8 1.8 Level 2Other financial assets at fair value through profit or loss 0.5 0.5 0.5 0.5 Level 3
Financial assets at amortized costNon-current
Loan receivables, interest-bearing 1.1 1.1 1.2 1.2 Level 2Current
Loan receivables, interest-bearing 0.9 0.9 2.0 2.0 Level 2Trade receivables 293.9 293.9 308.9 308.9 Level 2Accrued interest income 0.1 0.1 0.0 0.0 Level 2Cash and cash equivalents 164.6 164.6 78.2 78.2 Level 2
Total 464.8 464.8 393.1 393.1
31 Dec 2018 31 Dec 2017
EUR millionCarrying amounts
Fair values
Carrying amounts
Fair values
Fair value hierarchy
Financial liabilities at fair value through profit or loss
Current derivative liabilities 0.4 0.4 0.9 0.9 Level 2Financial liabilities measured at amortized cost
Non-current Finance lease liability 0.8 0.8 1.7 1.7 Level 2Loans2) 184.6 201.3 100.8 103.7 Level 2Other 2.8 2.8 3.8 3.8 Level 2
Current Trade payables 101.5 101.5 104.2 104.2 Level 2Accrued interest 2.2 2.2 1.8 1.8 Level 2Finance lease liability 0.8 0.8 0.8 0.8 Level 2Loans 117.8 117.8 133.8 133.8 Level 2
Total 411.0 427.6 347.8 350.6
Foreign exchange derivatives' fair values are calculated according to foreign exchange and interest rates on the closing date.
Loans and receivables and financial liabilities are held at amortized cost using the effective interest rate method. Their
carrying amounts are considered to approximate their fair value except for:
1) Trade receivables sold under non-recourse factoring agreements (EUR 0.9 million on 31 Dec 2018) are classified as
Financial assets at fair value through profit or loss and presented separately from other trade receivables. Group estimates
that the carrying amout approximates the fair value due to their short-term nature.
2) Fixed rate bond where carrying amount has not been adjusted to match the fair value. Fair value of the bond has been
calculated based on the prevailing market rate at the end of the reporting period.
Financial liabilities
Annual report 2018 179
Creating valueTieto 2018 Governance Financials Sustainability

22. Derivatives
Nominal amounts of derivativesIncludes the gross amount of all nominal values for contracts that have not yet been settled or closed. The amount of nominal value outstanding is not necessarily a measure or indication of market risk, as the exposure of certain contracts may be offset by other contracts.
EUR million 31 Dec 2018 31 Dec 2017
Foreign exchange forward contracts 170.0 179.6
Electricity price futures contracts - 0.9
Fair values of derivatives
The net fair values of derivative financial instruments at the reporting date
31 Dec 2018 31 Dec 2017
Foreign exchange forward contracts 2.2 0.8
Electricity price futures contracts - 0.1
Derivatives are used for economic purposes only.
Gross positive fair values of derivatives 31 Dec 2018 31 Dec 2017
Foreign exchange forward contracts 2.6 1.7
Electricity price futures contracts - 0.1
Gross negative fair values of derivatives 31 Dec 2018 31 Dec 2017
Foreign exchange forward contracts -0.4 -0.9
Electricity price futures contracts - 0,0
Foreign exchange derivatives' fair values are calculated according to foreign exchange and interest rates on the closing date.
23. Subsidiaries
Subsidiary shares owned by the Parent company
Company name Domicile
Parent company´s
holding %
31 Dec 2018 Book value in the Parent company
EUR million
Tieto Austria GmbH Austria 100.0 0.8
Tieto (Beijing) Technology Co., Ltd. China 100.0 0.4
Tieto Canada Inc. Canada 100.0 1.0
Tieto China Co., Ltd. China 100.0 4.3
Tieto Czech s.r.o. Czech Republic 100.0 8.0
Tieto Czech Support Services s.r.o. Czech Republic 100.0 0.0
Tieto Denmark A/S Denmark 100.0 5.3
Tieto DK A/S Denmark 100.0 1.6
Tieto Estonia AS Estonia 100.0 3.3
Tieto Finland Oy Finland 100.0 137.2
Tieto Finland Support Services Oy Finland 100.0 1.6
Tieto Germany GmbH Germany 100.0 0.5
Tieto Global Oy Finland 100.0 1.1
Tieto Great Britain Ltd. Great-Britain 100.0 0.5
Tieto Latvia SIA Latvia 100.0 10.3
Tieto Lietuva UAB Lithuania 100.0 2.6
Tieto Netherlands Holding B.V. Netherlands 100.0 24.5
Tieto Norway AS Norway 100.0 172.5
Tieto Poland Sp. z o.o Poland 100.0 3.3
Tieto Sdn Bhd Malaysia 100.0 0.2
Tieto Singapore Pte. Ltd. Singapore 100.0 0.3
Tieto Support Services Sp. z o.o. Poland 100.0 0.4
Tieto Sweden AB Sweden 100.0 549.3
TietoEnator Inc. The United States 100.0 8.0
Total 937.0
GROUP STRUCTURE AND GOODWILL
Annual report 2018 180
Creating valueTieto 2018 Governance Financials Sustainability

Shares in Group companies owned by subsidiaries
Company name Domicile
Group holding
%
31 Dec 2018 Book value in the Parent company
EUR millionAvega Affero AB Sweden 100.0 0.2Avega Amplio AB Sweden 100.0 0.5Avega Aqilo AB Sweden 100.0 0.1Avega Catalyst AB Sweden 100.0 0.4Avega Complius AB Sweden 90.2 0.0Avega Dinamiko AB Sweden 90.1 0.0Avega Effectus AB Sweden 100.0 0.9Avega Group AB Sweden 100.0 45.9Avega Kipeo AB Sweden 100.0 1.6Avega Kite AB Sweden 100.0 0.0Avega Miundo AB Sweden 100.0 0.0Avega Mtoni AB Sweden 90.2 0.0Avega Nuvem AB Sweden 90.2 0.0Avega Primero AB Sweden 100.0 0.1Avega Proferio AB Sweden 100.0 0.9Avega Qurio AB Sweden 98.2 2.8Avega Scire AB Sweden 100.0 0.2Avega Senso AB Sweden 100.0 0.0Emric AB Sweden 100.0 34.9Emric d.o.o. Beograd Serbia 100.0 0.0Emric Operations AB Sweden 100.0 0.4Meridium AB Sweden 100.0 6.8Petrostreamz Software e Serviços de Consultoria em Oil & Gas Ltda Brazil 100.0 0.0PT Emric Asia Indonesia 100.0 0.0Tieto India Pvt. Ltd. India 100.0 80.8Tieto Netherlands B.V. Netherlands 100.0 2.9Tieto Rus OOO Russia 100.0 2.3Tieto Sweden Support Services AB Sweden 100.0 0.0Tieto U.S. Inc. The United States 100.0 1.0Total 182.7
All subsidiary undertakings are included in the consolidation. In India, the official reporting period is 1.4.–31.3. according to the Indian legislation.
Tieto Great Britain Ltd. is exempt from the requirements of the Companies Act relating to the audit by virtue of section 479A of the Companies Act. The parent company Tieto Oyj has given a parent undertaking guarantee for all the outstanding liabilities of Tieto Great Britain Ltd at the end of the financial year 2018.
Annual report 2018 181
Creating valueTieto 2018 Governance Financials Sustainability

24. Interests in joint ventures
Tieto has established the following joint ventures in order to be able to produce high quality IT services required by the customer. All joint ventures are located in Finland.
Joint ventures
Number of sharesParent company´s
share % Voting right %Carrying value
EUR million31 Dec 2018 2017 2018 2017 2018 2017 2018 2017
Tieto Esy Oy 7 300 7 300 80.0 80.0 34.0 34.0 5.5 4.9
TietoIlmarinen Oy 3 570 3 570 70.0 70.0 30.0 30.0 3.0 2.5
Tietokarhu Oy 8 000 8 000 80.0 80.0 20.0 20.0 7.5 8.9
16.0 16.3
Reconciliation to carrying value
EUR million 2018 2017
Acquisition cost, 1 Jan 3.7 3.7
Acquisition cost, 31 Dec 3.7 3.7
Equity adjustments, 1 Jan 12.6 12.8
Share of results 5.8 3.2
Dividends received -3.2 -3.5
Impairment -2.9 -
Equity adjustments, 31 Dec 12.3 12.6
Carrying value, 31 Dec 16.0 16.3
Equity adjustments include Group level goodwill of EUR 7.4 (10.3) million.
Financial and personnel information of Joint ventures
31 Dec 2018 EUR million Tieto Esy Oy TietoIlmarinen Oy Tietokarhu Oy
Non-current assets 0.0 0.2 0.1
Current assets 4.9 2.1 16.2
Total 4.9 2.3 16.2
Non-current liabilities 0.1 0.1 1.0
Current liabilities 1.1 0.9 9.4
Total 1.1 1.0 10.3
Net sales 6.1 4.8 32.8
Expenses -4.7 -4.2 -25.6
Profit before taxes 1.3 0.7 7.2
Income taxes -0.3 -0.0 -1.6
Net profit for the financial year 1.1 0.7 5.6
Dividends paid to Tieto 0.3 - 2.9
Average full-time personnel during the financial year 40 25 146
Annual report 2018 182
Creating valueTieto 2018 Governance Financials Sustainability

31 Dec 2017 EUR million Tieto Esy Oy TietoIlmarinen Oy Tietokarhu Oy
Non-current assets 0,1 0,2 0,1
Current assets 4,4 1,4 16,2
Total 4,4 1,6 16,3
Non-current liabilities 0,1 0,1 0,3
Current liabilities 1,3 0,8 12,0
Total 1,4 0,9 12,3
Net sales 6,5 4,2 29,1
Expenses -6,1 -4,2 -24,5
Profit before taxes 0,4 0,0 4,6
Income taxes -0,1 -0,0 -0,9
Net profit for the financial year 0,3 0,0 3,7
Dividends paid to Tieto 1,0 - 2,5
Average full-time personnel during the financial year 50 27 172
There are no commitments or contingencies related to joint ventures.
25. Acquisitions and disposals
Acquisitions in 2018 Tieto completed the following acquisition during 2018:
* Petrostreamz AS, ownership 100% of the shares, effective from 1 February 2018* NSEC AB, ownership 100% of the shares, effective from 1 May 2018* Meridium AB, ownership 100% of the shares, effective from 1 November 2018
Petrostreamz ASPetrostreamz AS is a growing provider of advanced software and services for integrated asset modeling (IAM) onshore and offshore in the oil and gas industry. The acquisition further expands Tieto’s portfolio of advanced solutions and capabilities in the upstream business of oil and gas industry. Petrostreamz AS is part of Industry Solutions segment.
The following table summarizes the acquisition date fair values of the consideration transferred as well as the recognized amounts of assets acquired and liabilities assumed.
Consideration
EUR million
Paid in cash 3.4
Contingent consideration 3.7
Total 7.1
Annual report 2018 183
Creating valueTieto 2018 Governance Financials Sustainability

Recognized amounts of identifiable assets acquired and liabilities assumed
EUR million
Property, plant and equipment 0.0
Intangible assets 1.3
Deferred tax assets 0.5
Trade and other receivables 0.9
Cash and cash equivalents 0.1
Loans -1.3
Deferred tax liabilities -0.3
Trade and other payables -0.5
Goodwill 6.3
Total 7.1
Contingent consideration is mainly determined by the margin development of the acquired and combined business during 3-year period starting from the acquisition date.
The identified intangible assets relate to customer relationships and technology. Goodwill is attributable to market share, synergies and new competencies. It will not be deductible for tax purposes. Acquisition-related costs of EUR 0.1 million are included in other operating expenses in the income statement and in cash flow from operating activities.
Since the date of acquisition, the acquired entity has contributed approximately EUR 0.9 million to the revenue and EUR -0.9 million to the operating profit of the Group. If the business combination had taken place at the beginning of the year, the revenue for the Group would have been approximately EUR 1.0 million and profit approximately EUR -0.9 million.
NSEC AB and Meridium ABThe acquisitions of NSEC AB and Meridium AB are not individually material to the consolidated financial statements. Consequently, combined information is presented from these acquisitions.
NSEC AB was a Swedish security services company, currently merged to Tieto Sweden AB. The acquisition will further enlarge Tieto's capabilities in managed security operations, security consulting, as well as product resell and deployment services.
Meridium AB is a focused player in the customer experience area in the Swedish market with Episerver technology as its core. With the acquisition of Meridium AB, Tieto strengthens its presence in Sweden and enhances its capabilities to serve Nordic customers in developing ways to interact with their customers in the digital world.
The following table summarizes the acquisition date fair values of the consideration transferred as well as the recognized amounts of assets acquired and liabilities assumed.
Consideration
EUR million
Paid in cash 8.1
Contingent consideration 0.7
Total 8.8
Annual report 2018 184
Creating valueTieto 2018 Governance Financials Sustainability

Recognized amounts of identifiable assets acquired and liabilities assumed
EUR million
Property, plant and equipment 0.1
Intangible assets 1.0
Trade and other receivables 1.6
Cash and cash equivalents 1.6
Deferred tax liabilities -0.4
Trade and other payables -1.7
Goodwill 6.5
Total 8.8
Contingent consideration is mainly determined by retention of key-employees.
The identified intangible assets relate to customer relationships and technology. Goodwill is attributable to market share, synergies and new competencies. It will not be deductible for tax purposes. Acquisition-related costs of EUR 0.1 million are included in other operating expenses in the income statement and in cash flow from operating activities.
Since the date of acquisition, the acquired entities have contributed approximately EUR 2.8 million to the revenue and EUR 0.2 million to the operating profit of the Group. If the business combinations had taken place at the beginning of the year, the revenue for the Group would have been approximately EUR 9.2 million and profit approximately EUR 0.7 million.
Acquisition of non-controlling interest in subsidiaries of AvegaDuring 2018, Tieto increased its ownership in the Avega Group by acquiring non-controlling interests with a total amount of EUR 3.0 million.
Change in contingent consideration from acquisitions completed in 2015 and 2016Contingent consideration related to 2015 and 2016 acquisitions and respective contingent liability decreased with EUR 3.8 million.
EUR million
Contingent consideration on 1 Jan 2018 3.8
Change recognized in 2018 -3.8
Remaining contingent consideration -
Annual report 2018 185
Creating valueTieto 2018 Governance Financials Sustainability

Disposals in 2018Tieto disposed of the following businesses during 2018:
* ProArc business in Norway, as of January 2018 * Cross-advertising business in the Nordic countries, as of August 2018
ProArc ProArc is a technical document management solution with focus mainly on oil, gas and engineering. The unit was part of Software Innovation focused on enterprise content management. Sales of the disposed business were around EUR 7 million. ProArc was part of Industry Solutions segment. The capital gain related to the disposed businesses is specified below.
EUR million
Intangible assets 1.7
Deferred tax liabilities -0.4
Current liabilities -0.3
Fair value of net assets 1.0
Goodwill allocation on disposals 3.1
Total net asset allocation on disposals 4.1
Transaction costs 0.7
Received in cash 7.8
Capital gain 3.0
Transaction costs are included in the cash flow from investing activities.
Cross-advertising Cross-advertising is an advertising order management platform. It is a cloud-based solution that provides end-to-end multi-channel advertising management, covering the whole process from sales, CRM, booking to production and invoicing. The business was part of Industry Solutions segment. The capital gain recognized on the disposal is EUR 1.6 million. The disposal is not significant and therefore no separate disclosures are presented.
26. Impairment testing of goodwill
Goodwill acquired in business combinations is allocated to cash-generating units (CGU), which are the reportable segments (service lines) of the Group. All CGUs contain goodwill that may be considered significant in comparison with the Group’s total carrying amount of goodwill. Every CGU represent business operations providing services to selected customers in their market segments. During 2018, Tieto implemented internal business transfers mainly from Technology Services and Modernization and Industry Solutions to Business Consulting and Implementation. These business transfers were accompanied by relative amounts of goodwill, the most material amount of goodwill being EUR 22 million from Technology Services and Modernization to Business Consulting and Implementation. Goodwill of the Group has been allocated as follows:
Carrying amount of goodwill by CGU
EUR million 31 Dec 2018 31 Dec 2017
Technology Services and Modernization 148.2 167.4
Business Consulting and Implementation 95.4 65.9
Industry Solutions 144.8 150.1
Product Development Services 54.2 57.9
Total 442.6 441.3
Annual report 2018 186
Creating valueTieto 2018 Governance Financials Sustainability
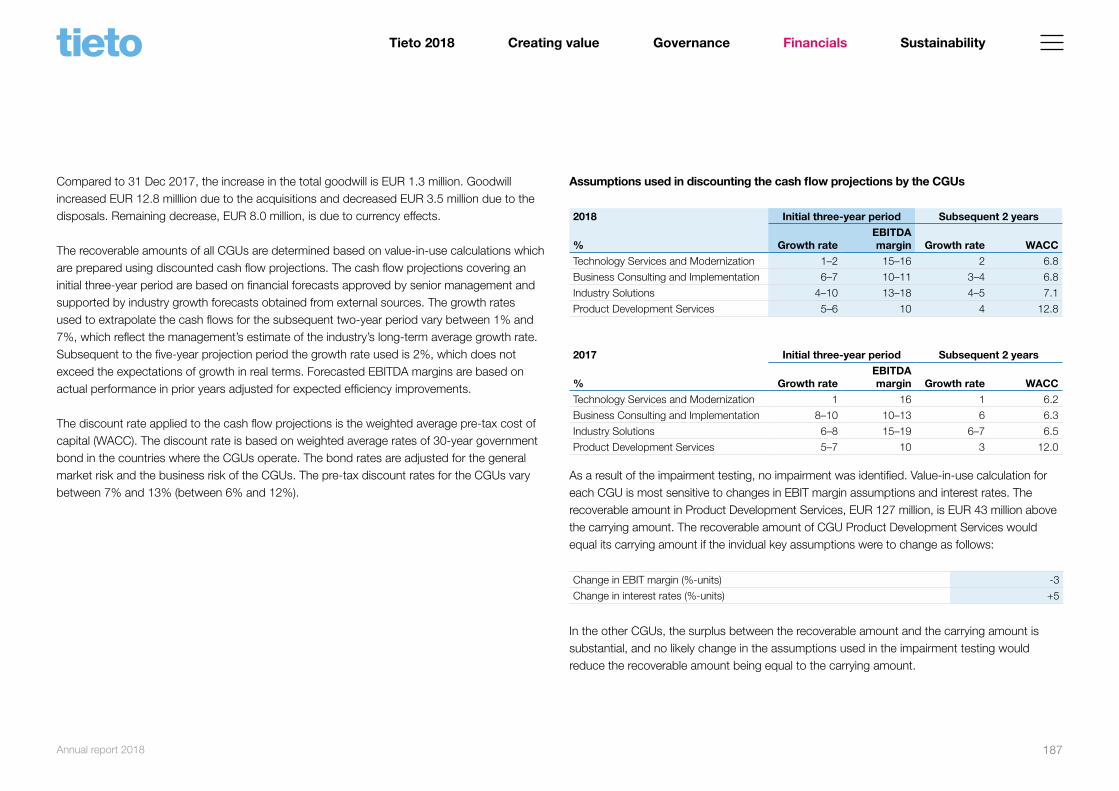
Compared to 31 Dec 2017, the increase in the total goodwill is EUR 1.3 million. Goodwill increased EUR 12.8 milllion due to the acquisitions and decreased EUR 3.5 million due to the disposals. Remaining decrease, EUR 8.0 million, is due to currency effects.
The recoverable amounts of all CGUs are determined based on value-in-use calculations which are prepared using discounted cash flow projections. The cash flow projections covering an initial three-year period are based on financial forecasts approved by senior management and supported by industry growth forecasts obtained from external sources. The growth rates used to extrapolate the cash flows for the subsequent two-year period vary between 1% and 7%, which reflect the management’s estimate of the industry’s long-term average growth rate. Subsequent to the five-year projection period the growth rate used is 2%, which does not exceed the expectations of growth in real terms. Forecasted EBITDA margins are based on actual performance in prior years adjusted for expected efficiency improvements.
The discount rate applied to the cash flow projections is the weighted average pre-tax cost of capital (WACC). The discount rate is based on weighted average rates of 30-year government bond in the countries where the CGUs operate. The bond rates are adjusted for the general market risk and the business risk of the CGUs. The pre-tax discount rates for the CGUs vary between 7% and 13% (between 6% and 12%).
Assumptions used in discounting the cash flow projections by the CGUs
2018 Initial three-year period Subsequent 2 years
% Growth rate EBITDA margin Growth rate WACC
Technology Services and Modernization 1–2 15–16 2 6.8
Business Consulting and Implementation 6–7 10–11 3–4 6.8
Industry Solutions 4–10 13–18 4–5 7.1
Product Development Services 5–6 10 4 12.8
2017 Initial three-year period Subsequent 2 years
% Growth rate EBITDA margin Growth rate WACC
Technology Services and Modernization 1 16 1 6.2
Business Consulting and Implementation 8–10 10–13 6 6.3
Industry Solutions 6–8 15–19 6–7 6.5
Product Development Services 5–7 10 3 12.0
As a result of the impairment testing, no impairment was identified. Value-in-use calculation for each CGU is most sensitive to changes in EBIT margin assumptions and interest rates. The recoverable amount in Product Development Services, EUR 127 million, is EUR 43 million above the carrying amount. The recoverable amount of CGU Product Development Services would equal its carrying amount if the invidual key assumptions were to change as follows:
Change in EBIT margin (%-units) -3
Change in interest rates (%-units) +5
In the other CGUs, the surplus between the recoverable amount and the carrying amount is substantial, and no likely change in the assumptions used in the impairment testing would reduce the recoverable amount being equal to the carrying amount.
Annual report 2018 187
Creating valueTieto 2018 Governance Financials Sustainability

27. Commitments and contingencies
EUR million 31 Dec 2018 31 Dec 2017
For Tieto obligations
Pledges1) - 1.6
Mortgages1) - 3.4
Guarantees2)
Performance guarantees 26.5 0.9
Lease guarantees 8.1 8.6
Other 0.8 0.5
Other Tieto obligations
Rent commitments due in one year 39.6 41.6
Rent commitments due in 1–5 years 113.7 98.0
Rent commitments due after 5 years 8.3 17.9
Operating lease commitments due in one year 8.8 10.9
Operating lease commitments due in 1–5 years 11.6 12.0
Operating lease commitments due after 5 years 0.0 0.4
Commitments to purchase assets 5.3 7.4
Other 0.8 1.6
1) The Group has cancelled local credit facilities (EUR 1.0 million) of group ompanies that were acquired shortly before the
year-end 2017. As a collateral for the facilities, companies had pledged subsidiary shares (carrying value of those shares
were EUR 1.6 million) and in addition, a General Business mortgage of EUR 3.4 million.
2) In addition, commitments of EUR 8.0 (8.6) million related to liabilities in the consolidated statement of financial position.
28. Related party transactions
Related parties of Tieto include subsidiaries, joint ventures and key management of the company and their close family members. Key management includes the members of the Board of Directors, Leadership team and the President and CEO.
Sales to and purchases from related parties are made on normal market terms and conditions and at market prices. There are no commitments or contingencies on behalf of related parties.
The transactions with related parties are presented below. More information on joint ventures is disclosed in note 24 and subsidiaries are listed in note 23. Information on management remuneration is disclosed in note 7.
Transactions and balances with joint ventures
EUR million 31 Dec 2018 31 Dec 2017
Sales 1.5 1.6
Other operating income 3.8 4.5
Purchases 4.1 3.1
Receivables 0.7 0.7
Liabilities including cash pool 18.2 16.3
For some joint ventures, Tieto Corporation has committed, together with the other owners, to contribute in proportion to its ownership, to financing arrangements that are based on approved strategy plans.
29. Events after the reporting period
There have been no events after the reporting period that would have an impact on the consolidated financial statements.
On 6 February 2019, Tieto launched a new strategy to take advantage of the rapidly developing opportunities in the data-rich world – and to continue to elevate financial performance and shareholder value.
OTHER INFORMATION
Annual report 2018 188
Creating valueTieto 2018 Governance Financials Sustainability

Income statementEUR Note 2018 2017
Net sales 1 166 343 633.36 176 960 216.82
Other operating income 2 32 382 596.33 51 414 641.68
Personnel expenses 3 -16 877 285.94 -17 621 001.44
Depreciation and impairment losses 8, 9 -4 450 668.78 -4 711 944.36
Other operating expenses 4 -191 001 184.75 -205 636 356.40
Operating profit -13 602 909.78 405 556.30
Financial income and expenses 6 90 523 243.01 63 086 108.02
Profit before appropriations and taxes 76 920 333.23 63 491 664.32
Appropriations
Change in cumulative accelerated depreciation 49 462.49 -49 462.49
Group contribution 74 100 000.00 45 400 000.00
Profit before taxes 151 069 795.72 108 842 201.83
Income taxes 7 -11 503 353.77 -5 385 238.55
Net profit for the financial year 139 566 441.95 103 456 963.28
PARENT COMPANY´S FINANCIAL STATEMENTS (FAS)
Annual report 2018 189
Creating valueTieto 2018 Governance Financials Sustainability

Balance sheetAssets
EUR Note 31 Dec 2018 31 Dec 2017Non-current assetsIntangible assets 8 8 164 547.97 9 263 664.19Tangible assets 9 3 858 368.33 5 648 961.93Investments 10 940 868 684.69 940 868 684.69Total non-current assets 952 891 600.99 955 781 310.81
Current assetsLong-term receivables
Receivables from Group companies 11 44 546 039.77 46 285 726.27Other receivables 11 876 313.23 212 418.03
45 422 353.00 46 498 144.30Current receivables
Accounts receivables 3 130.08 398 956.87Receivables from Group companies 12, 13 96 466 044.92 67 573 692.56Receivables from joint ventures 12, 13 138 114.20 143 252.10Other receivables 2 663 616.62 2 535 590.56Prepaid expenses and accrued income 13 5 326 458.37 6 149 601.88
104 597 364.19 76 801 093.97
Cash and cash equivalents 117 681 035.04 35 205 017.12Total current assets 267 700 752.23 158 504 255.39
Total assets 1 220 592 353.22 1 114 285 566.20
Shareholders' equity and liabilities
EUR Note 31 Dec 2018 31 Dec 2017Shareholders' equity 14Share capital 76 555 412.00 76 555 412.00Share issue premiums 13 791 579.51 13 791 579.51Invested unrestricted equity reserve 12 843 921.39 12 843 921.39Retained earnings 472 259 988.62 469 181 758.56Net profit for the financial year 139 566 441.95 103 456 963.28Total equity 715 017 343.47 675 829 634.74
AppropriationsCumulative accelerated depreciation - 49 462.49
Provisions 15 206 715.14 609 667.48 LiabilitiesNon-current liabilities
Bonds 16 100 000 000.00 100 000 000.00Loans 16 85 000 000.00 -Other non-current liabilities 16 2 348.13 5 834.27
185 002 348.13 100 005 834.27
Current liabilities 17Accounts payables 7 472 320.18 8 519 021.30Liabilities to Group companies 17, 18 179 546 085.68 183 772 402.12Liabilities to joint ventures 17, 18 17 843 192.08 16 425 726.14Bonds 17 100 000 000.00 -Loans - 114 931 506.91Other current liabilities 719 980.76 1 729 704.12Accrued liabilities and deferred income 18 14 784 367.78 12 412 606.63
320 365 946.48 337 790 967.22
Total liabilities 505 368 294.61 437 796 801.49
Total equity and liabilities 1 220 592 353.22 1 114 285 566.20
Annual report 2018 190
Creating valueTieto 2018 Governance Financials Sustainability

Statement of cash flowEUR 2018 2017Cash flow from operating activities
Net profit before appropriations and taxes 76 920 333.23 63 491 664.32
Adjustments
Depreciation, amortization and impairment losses 4 450 668.78 4 711 944.36
Net financial income -90 523 243.01 -63 086 108.02
Other adjustments -350.87 -14 323 663.19
Other non-cash items 266 561.97 -101 650.30
Cash generated from operating activities before net working capital -8 886 029.90 -9 307 812.83
Change in net working capital
Change in current receivables 10 127 609.05 18 230 024.50
Change in current non-interest-bearing liabilities -10 837 417.05 -1 226 988.831)
Cash generated from operating activities -9 595 837.90 7 695 222.84
Interest expenses and other financial expenses paid -15 505 905.97 -18 611 043.32
Interest income received 10 038 904.86 10 787 730.68
Dividend received and equity refund 94 246 754.12 66 514 017.67
Income taxes paid -5 431 565.33 -229 534.38
Cash flow from operating activities 73 752 349.78 66 156 393.49
EUR 2018 2017
Cash flow from investing activities
Purchase of tangible and intangible assets -2 263 737.51 -5 586 732.99
Proceeds from sale of tangible and intangible assets 702 778.55 214 520.00
Acquisition of subsidiaries, net of cash acquired - -993 772.36
Disposal of subsidiaries, net of cash disposed - 15 568 071.00
Loans granted -7 841 504.75 -106 696 981.30
Proceeds from repayments of loans 7 888 523.08 66 662 490.53
Cash flow from investing activities -1 513 940.63 -30 832 405.12
Cash flow from financing activities
Dividends paid -103 356 888.60 -101 000 681.25
Conveyance of own shares 2 276 314.10 432 763.55
Proceeds from long-term borrowings 185 000 000.00 -
Proceeds from short-term borrowings 982 114 590.08 1 661 071 287.25
Repayments of short-term borrowings -1 089 077 991.55 -1 614 343 805.53
Change in intercompany cash pool, net -12 118 415.26 -21 578 073.271)
Group contributions received 45 400 000.00 47 200 000.00
Cash flow from financing activities 10 237 608.77 -28 218 509.25
Change in cash and cash equivalents 82 476 017.92 7 105 479.12
Cash and cash equivalents at the beginning of period 35 205 017.12 28 099 538.00
Cash and cash equivalents at the end of period 117 681 035.04 35 205 017.12
82 476 017.92 7 105 479.12
1) Subsidiary cash pool transferred to cash flow from financing activities.
Annual report 2018 191
Creating valueTieto 2018 Governance Financials Sustainability

Notes to the parent company´s financial statements (FAS)Parent company accounting principles
The financial statements of the Parent company Tieto Corporation are prepared in accordance with Finnish Accounting Standards (FAS).
Tieto Corporation (business identity code 0101138-5) is a Finnish public limited IT service and software company organized under the laws of Finland and domiciled in Espoo: Keilalahdentie 2-4, 02101 Espoo, Finland. The company is listed on NASDAQ Helsinki and Stockholm. The Board of Directors approved the financial statements to be published 28 February 2019. According to the Limited Liability Companies Act the shareholders have at the Annual General Meeting the right to approve, disapprove or change the financial statements after the publication.
Foreign currency itemsForeign currency transactions are initially translated at the exchange rate prevailing on the transaction date. Foreign currency items at the end of the financial period are valued at the exchange rates on the balance sheet date. Foreign currency items are hedged using derivative contracts.
Exchange gains and losses on net financial liabilities are reported in the income statement under financial items, while other exchange gains or losses are included in operating profit. Gains and losses arising from revaluation of derivative contracts are, depending on their nature, reported either under financial items or operating profit.
Net sales Net sales include internal service fees and exchange rate differences from accounts receivables, less indirect taxes such as value added tax.
Other operating income Other operating income includes mainly rental income and gains from asset disposals.
Pension arrangements The company’s pension obligations are administered through pension insurance institutions. Pension obligations are fully covered.
Financial instrumentsThe company applies the Finnish Accounting Act chapter 5 section 2a and records financial instruments initially at fair value.
See financial instruments accounting policies in the consolidated financial statements.
AppropriationsGroup contributions are included in appropriations.
Valuation of fixed assetsFixed assets are carried at cost less accumulated depreciation. Depreciation is charged according to plan based on the estimated economic lives of the individual assets and accounted for in accordance with the straight-line method.
The company applies the following economic lives:
Years
Intangible assets (software) 3
Other capitalized expenditure 3–10
Buildings 25–40
Data processing equipment1) 3–5
Other machinery and equipment 5
Other tangible assets 5
1) Purchases of personal computers are expensed immediately.
Income taxesThe income statement includes the company’s income taxes based on taxable profit for the period according to local tax regulations as well as adjustments to prior-year taxes. The information related to deferred tax items is included in the notes.
Annual report 2018 192
Creating valueTieto 2018 Governance Financials Sustainability

1. Net sales
EUR 2018 2017
Internal service fees 166 343 633.36 176 960 216.82
Total 166 343 633.36 176 960 216.82
2017 has been reclassified to reflect 2018.
Net sales by country 2018 2017
Finland 74 186 976.18 70 030 152.05
Sweden 54 455 131.29 53 961 076.59
Norway 15 148 151.59 15 296 063.00
Other 22 553 374.30 37 672 925.18
Total 166 343 633.36 176 960 216.82
2. Other operating income
EUR 2018 2017
Gain from sale of other fixed assets and shares - 14 641 489.19
Rental income 28 411 786.16 32 477 103.63
Other income 3 970 810.17 4 296 048.86
Total 32 382 596.33 51 414 641.68
3. Personnel expenses
EUR 2018 2017
Wages and salaries 14 251 625.35 14 389 229.73
Pension expenses 2 204 018.56 2 611 259.90
Other pay-related statutory social costs 421 642.03 620 511.81
Total 16 877 285.94 17 621 001.44
The parent company had an average of 130 employees during 2018 and 142 employees in 2017.
4. Other operating expenses
EUR 2018 2017
Voluntary personnel expenses 915 984.76 840 854.51
Licenses and maintenance 11 827 767.32 11 180 475.00
ICT and data communication expenses 8 356 420.43 7 823 981.36
Internal service fees 120 119 813.25 121 272 705.35
Rents and other premises expenses 23 453 244.04 29 001 879.88
Loss on sale of shares - 317 825.62
Advertising and marketing 3 521 868.61 3 781 679.78
Leased labour 1 624 140.18 1 258 015.23
Consulting and lawyers 6 474 910.70 9 168 993.77
Meetings 843 029.72 1 285 380.29
Recruiting 898 372.56 744 993.17
Derivative Exchange Rate Losses on Other Expenses 5 096 501.49 4 420 699.99
Other operating expenses 7 869 131.69 14 538 872.45
Total 191 001 184.75 205 636 356.40
Fees to auditors
2018 2017EUR Deloitte PwC PwC
Audit fees 150 000.00 200 000.00 183 500.00
Tax consultation 13 000.00 - 2 000.00
Other services 27 000.00 450 000.00 228 000.00
Total 190 000.00 650 000.00 413 500.00
5. Management remuneration
See Note 7 in Notes to the consolidated financial statements.
Annual report 2018 193
Creating valueTieto 2018 Governance Financials Sustainability

6. Financial income and expenses
EUR 2018 2017
Dividend income
Dividend income from Group companies 91 047 254.12 63 035 917.67
Dividend income from joint ventures 3 199 500.00 3 477 300.00
Dividend income from other companies - 800.00
94 246 754.12 66 514 017.67
Other interest and financial income
From Group companies 2 369 199.59 1 179 841.78
From other companies 15 421 294.38 18 424 733.82
17 790 493.97 19 604 575.60
Investment write-downs - -113 928.37
Interest and other financing expenses
To Group companies -463 808.60 -436 272.09
To other companies -21 050 196.48 -22 482 284.79
-21 514 005.08 -22 918 556.88
Total 90 523 243.01 63 086 108.02
7. Income taxes
EUR 2018 2017
Taxes for the financial year / appropriations 14 820 000.00 9 080 000.00
Taxes for the financial year / regular operations -26 299 212.99 -14 466 336.46
Taxes for the previous years -24 140.78 1 097.91
Total -11 503 353.77 -5 385 238.55
8. Intangible assets
EUR 31 Dec 2018 31 Dec 2017Intangible rights
Acquisition cost, 1 Jan 12 212 823.14 11 262 764.90
Additions 702 778.55 950 058.24
Disposals -702 778.55 -
Acquisition cost, 31 Dec 12 212 823.14 12 212 823.14
Accumulated amortization, 1 Jan 11 919 775.27 11 048 149.58
Amortization for the period 277 099.15 871 625.69
Accumulated amortization, 31 Dec 12 196 874.42 11 919 775.27
Book value, 31 Dec 15 948.72 293 047.87
Other capitalized expenditures
Acquisition cost, 1 Jan 18 804 046.70 15 209 107.90
Additions 1 085 244.00 3 419 748.45
Disposals -470 100.23 -33 650.92
Reclassifications - 208 841.27
Acquisition cost, 31 Dec 19 419 190.47 18 804 046.70
Accumulated amortization, 1 Jan 9 833 430.38 8 369 327.60
Accumulated amortization for disposals and reclassifications -470 100.23 -15 634.47
Amortization for the period 1 907 261.07 1 479 737.25
Accumulated amortization, 31 Dec 11 270 591.22 9 833 430.38
Book value, 31 Dec 8 148 599.25 8 970 616.32
Advance payments
Acquisition cost, 1 Jan - 792 728.30
Additions - -
Reclassifications - -792 728.30
Acquisition cost, 31 Dec - -
Total 8 164 547.97 9 263 664.19
Annual report 2018 194
Creating valueTieto 2018 Governance Financials Sustainability

9. Tangible assets EUR 31 Dec 2018 31 Dec 2017Land
Acquisition cost, 1 Jan 60 270.13 60 270.13
Acquisition cost, 31 Dec 60 270.13 60 270.13
Machinery and equipment
Acquisition cost, 1 Jan 31 859 468.66 30 406 902.64
Additions 422 239.96 1 814 611.80
Disposals -78 026.40 -153 204.51
Reclassifications 9 237.70 -208 841.27
Acquisition cost, 31 Dec 32 212 919.92 31 859 468.66
Accumulated depreciation, 1 Jan 26 313 792.44 23 982 494.90
Accumulated depreciation for disposals and reclassifications -127 908.98 -26 204.66
Depreciation for the period 2 266 308.56 2 357 502.20
Accumulated depreciation, 31 Dec 28 452 192.02 26 313 792.44
Book value, 31 Dec 3 760 727.90 5 545 676.22
Other tangible assets
Acquisition cost, 1 Jan 46 608.00 46 608.00
Reclassifications -9 237.70 -
Acquisition cost, 31 Dec 37 370.30 46 608.00
Accumulated depreciations, 1 Jan 3 592.42 513.20
Accumulated depreciation for reclassifications -3 592.42 -
Depreciation for the period - 3 079.22
Accumulated depreciation, 31 Dec - 3 592.42
Book value, 31 Dec 37 370.30 43 015.58
Total 3 858 368.33 5 648 961.93
10. Investments EUR 31 Dec 2018 31 Dec 2017Subsidiary shares
Acquisition cost, 1 Jan 937 013 913.29 937 325 863.87
Additions - 993 772.36
Disposals - -1 305 722.94
Acquisition cost, 31 Dec 937 013 913.29 937 013 913.29
Book value, 31 Dec 937 013 913.29 937 013 913.29
Shares in joint ventures
Acquisition cost, 1 Jan 3 691 233.78 3 691 233.78
Acquisition cost, 31 Dec 3 691 233.78 3 691 233.78
Book value, 31 Dec 3 691 233.78 3 691 233.78
Other shares and interests
Acquisition cost, 1 Jan 163 537.62 292 265.99
Disposals - -128 728.37
Acquisition cost, 31 Dec 163 537.62 163 537.62
Book value, 31 Dec 163 537.62 163 537.62
Total 940 868 684.69 940 868 684.69
Subsidiary shares See Note 23 in Notes to the consolidated financial statements.
Joint ventures owned and managed by the parent companySee Note 24 in Notes to the consolidated financial statements.
Annual report 2018 195
Creating valueTieto 2018 Governance Financials Sustainability

11. Long-term receivables
EUR 31 Dec 2018 31 Dec 2017
Loan receivables from Group companies
Subordinated loan 41 248 976.09 42 971 210.30
Other loan receivables 3 297 063.68 3 314 515.97
Other receivables 876 313.23 212 418.03
Total 45 422 353.00 46 498 144.30
12. Current intercompany receivables
EUR 31 Dec 2018 31 Dec 2017
Receivables from Group companies
Accounts receivable 11 245 926.58 16 050 524.26
Loan receivables 2 927 110.23 1 234 442.06
Other receivables 4 572 105.53 4 690 290.41
Group contribution receivables 74 100 000.00 45 400 000.00
Prepaid expenses and accrued income 3 620 902.58 198 435.83
Total 96 466 044.92 67 573 692.56
Receivables from joint ventures
Accounts receivable 137 694.54 143 252.10
Prepaid expenses and accrued income 419.66 -
Total 138 114.20 143 252.10
13. Prepaid expenses and accrued income
EUR 31 Dec 2018 31 Dec 2017
Prepaid expenses and accrued income from Group companies
Other 3 620 902.58 198 435.83
Prepaid expenses and accrued income from joint ventures 419.66 -
Prepaid expenses and accrued income from other companies
Licence fees 3 213 385.27 3 821 882.44
Rents 738 059.07 978 974.63
Social costs 77 124.16 88 363.77
Other 1 297 889.87 1 260 381.04
5 326 458.37 6 149 601.88
Total 8 947 780.61 6 348 037.71
Annual report 2018 196
Creating valueTieto 2018 Governance Financials Sustainability

14. Changes in shareholders' equity EUR 31 Dec 2018 31 Dec 2017Restricted equityShare capital, 1 Jan 76 555 412.00 76 555 412.00Share capital, 31 Dec 76 555 412.00 76 555 412.00
Share issue premiums, 1 Jan 13 791 579.51 13 791 579.51Share issue premiums, 31 Dec 13 791 579.51 13 791 579.51
Restricted equity total 90 346 991.51 90 346 991.51
Unrestricted equity Invested unrestricted equity reserve, 1 Jan 12 843 921.39 12 843 921.39Invested unrestricted equity reserve, 31 Dec 12 843 921.39 12 843 921.39
Retained earnings, 1 Jan 572 638 721.84 569 513 867.32Shares distributed to personnel 2 978 155.38 668 572.49Dividend distributions -103 356 888.60 -101 000 681.25Retained earnings, 31 Dec 472 259 988.62 469 181 758.56
Net profit for the financial year 139 566 441.95 103 456 963.28
Unrestricted equity total 624 670 351.96 585 482 643.23
Shareholders' equity, total 715 017 343.47 675 829 634.74
Distributable funds Invested unrestricted equity reserve 12 843 921.39 12 843 921.39Retained earnings 472 259 988.62 469 181 758.56Net profit for the financial year 139 566 441.95 103 456 963.28Total 624 670 351.96 585 482 643.23
Breakdown of the parent's share capitalNumber of shares 74 109 252 74 109 252Euros 76 555 412.00 76 555 412.00
15. Provisions EUR 31 Dec 2018 31 Dec 2017Restructuring commitments 206 715.14 609 667.48Total 206 715.14 609 667.48
16. Non-Current liabilities
EUR 31 Dec 2018 31 Dec 2017Bonds 100 000 000.00 100 000 000.00Loans 85 000 000.00 -Other non-current liabilities 2 348.13 5 834.27
Total 185 002 348.13 100 005 834.27
Fair value of bond based on prevailing market rate at the reporting date was EUR 100 174 000 (EUR 103 651 000 in 2017).
Annual report 2018 197
Creating valueTieto 2018 Governance Financials Sustainability

17. Current liabilities
EUR 31 Dec 2018 31 Dec 2017
Liabilities to Group companies
Accounts payable 5 601 603.12 1 154 662.49
Other liabilities including cash pool 168 321 245.00 172 834 189.16
Accrued liabilities and deferred income 5 623 237.56 9 783 550.47
179 546 085.68 183 772 402.12
Liabilities to joint ventures
Accounts payable 11 121.56 9 413.35
Other liabilities including cash pool 17 832 070.52 16 416 312.79
17 843 192.08 16 425 726.14
Liabilities to other companies
Accounts payable 7 472 320.18 8 519 021.30
Bonds 100 000 000.00 -
Commercial papers - 114 931 506.91
Other current liabilities 719 980.76 1 729 704.12
Accrued liabilities and deferred income 14 784 367.78 12 412 606.63
122 976 668.72 137 592 838.96
Total 320 365 946.48 337 790 967.22
Loans and receivables and financial liabilities are held at amortized cost using the effective interest rate method. Their carrying amounts are considered to approximate their fair value, except for the fixed rate bond where carrying amount has not been adjusted to match the fair value.
Fair value of bond based on prevailing market rate at the reporting date was EUR 101 043 000.
18. Accrued liabilities and deferred income
EUR 31 Dec 2018 31 Dec 2017
Accrued liabilities and deferred income from Group companies
Personnel related expenses 713 575.56 541 277.77
Service fee 4 527 393.99 9 241 052.15
Interest 5 144.27 1 220.55
Other 377 123.74 -
5 623 237.56 9 783 550.47
Accrued liabilities and deferred income from other companies
Vacation pay and related social costs 1 757 482.54 1 868 031.76
Other accrued payroll and related social costs 1 283 952.55 1 749 253.78
Other social costs 767.00 196 760.75
Interest 2 200 445.57 1 764 647.16
Rents 2 091 166.63 3 412 691.43
Taxes 6 133 258.01 785 270.57
Other 1 317 295.48 2 635 951.18
14 784 367.78 12 412 606.63
Total 20 407 605.34 22 196 157.10
Annual report 2018 198
Creating valueTieto 2018 Governance Financials Sustainability

19. Deferred tax assets and liabilities EUR 31 Dec 2018 31 Dec 2017
Deferred tax assets
From temporary differences 228 964.69 234 091.40
From appropriations 75 108.81 -
Total 304 073.50 234 091.40
Deferred tax liabilities
From appropriations - 9 892.50
Total - 9 892.50
Deferred tax items are not included in the balance sheet.
20. Contingent liabilities
EUR 31 Dec 2018 31 Dec 2017
On behalf of Group companies
Guarantees 35 376 938.43 9 571 470.64
Other Tieto obligations
Rent commitments due in 2019 (2018) 12 071 944.00 14 404 125.00
Rent commitments due later 35 918 027.00 50 033 809.00
Lease commitments due in 2019 (2018) 284 563.02 284 032.34
Lease commitments due later 362 678.82 350 554.99
Lease commitments are principally three-year lease agreements that do not include buyout clauses. In addition, to the above mentioned contingent liabilities, the Parent company has provided security relating to certain major contracts, regarding IPR indemnity clauses. The maximum amount of these liabilities does not exceed EUR 15 (15) million.
Tieto Great Britain Ltd. is exempt from the requirements of the Companies Act relating to the audit by virtue of section 479C of the Companies Act. The parent company Tieto Oyj has given a parent undertaking guarantee for all the outstanding liabilities of Tieto Great Britain Ltd at the end of the financial year 2018.
Annual report 2018 199
Creating valueTieto 2018 Governance Financials Sustainability

21. Derivatives
Notional amounts of derivativesIncludes the gross amount of all nominal values for contracts that have not yet been settled or closed. The amount of nominal value outstanding is not necessarily a measure or indication of market risk, as the exposure of certain contracts may be offset by other contracts.
EUR 31 Dec 2018 31 Dec 2017
Foreign exchange forward contracts 267 000 855.88 246 907 775.63
Electricity price futures contracts - 939 306.00
Fair values of derivativesForeign exchange derivatives' fair values are calculated according to foreign exchange and interest rates on the closing date. The net fair values of derivative financial instruments at the balance sheet date 31 Dec 2018 31 Dec 2017
Foreign exchange forward contracts 53 693.86 -169 373.49
Electricity price futures contracts - 66 259.57
Derivatives are used for economic purposes only.
Gross positive fair values of derivatives 31 Dec 2018 31 Dec 2017
Foreign exchange forward contracts 2 823 146.98 2 006 702.80
Electricity price futures contracts - 71 364.22
Gross negative fair values of derivatives 31 Dec 2018 31 Dec 2017
Foreign exchange forward contracts -2 769 453.13 -2 176 076.29
Electricity price futures contracts - -5 104.64
The Company has been hedging highly probable forecast transactions denominated in foreign currency externally with banks on behalf of its' subsidiaries with equal back-to-back internal transactions.
Fair value measurement of financial assets and liabilitiesSee note 21 in Notes to the consolidated financial statements.
22. Management of financial risks
The operative management of the treasury activities of Tieto is centralized into Group Treasury, which is operated from Parent company. The Group Treasury is responsible for managing the Group’s financial risk position and maintaining adequate liquidity. The Treasury Policy, which has been approved by the board of directors, defines the principles for measuring and managing liquidity risk, interest rate risk, foreign exchange risks and counterparty risk of the Group. The Treasury Policy also defines the division of responsibilities with regard to financial risk management. The Group reviews and monitors financial risks on a regular basis.
Financal risks are assessed, measured and managed on a Group level. See Note 20 in Notes to the consolidated financial statements.
Annual report 2018 200
Creating valueTieto 2018 Governance Financials Sustainability

DIVIDEND PROPOSAL, SIGNATURES FOR THE BOARD OF DIRECTORS’ REPORT AND FINANCIAL STATEMENTS AND AUDITOR’S NOTE
Dividend proposal
Distributable funds in the parent company 624 670 351.96
of which net profit for the current year 139 566 441.95
The Board of Directors proposes that the distributable funds mentioned above be used as follows:
a total dividend of EUR 1.45 per share to be paid to shareholders 107 048 206.05
EUR 1.25 (ordinary)
EUR 0.20 (additional)
- the remainder be carried forward 517 622 145.91
In the opinion of the Board of Directors the proposed dividend distribution does not endanger the solvency of the company.
Signatures for the Financial statements and Board of Directors’ reportEspoo, 27 February 2019
Kurt Jofs Chairman
Harri-Pekka KaukonenDeputy Chairman
Timo Ahopelto Liselotte Hägertz Engstam
Johanna Lamminen Endre Rangnes Jonas Synnergren
Esa Koskinen Robert Spinelli
Kimmo Alkio President and CEO
The Auditors’ NoteOur auditors’ report has been issued today.Espoo, 28 February 2019
Deloitte OyAudit Firm
Jukka Vattulainen Authorised Public Accountant (KHT)
Annual report 2018 201
Creating valueTieto 2018 Governance Financials Sustainability
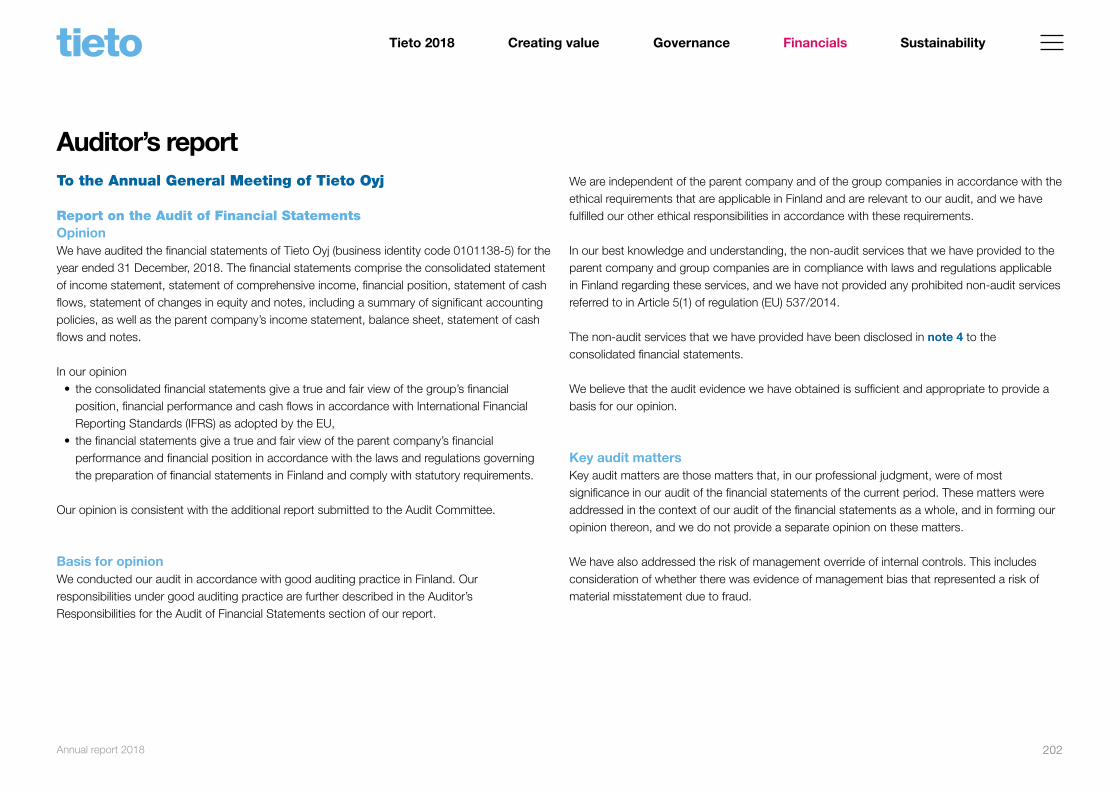
Auditor’s report To the Annual General Meeting of Tieto Oyj
Report on the Audit of Financial StatementsOpinionWe have audited the financial statements of Tieto Oyj (business identity code 0101138-5) for the year ended 31 December, 2018. The financial statements comprise the consolidated statement of income statement, statement of comprehensive income, financial position, statement of cash flows, statement of changes in equity and notes, including a summary of significant accounting policies, as well as the parent company’s income statement, balance sheet, statement of cash flows and notes.
In our opinion• the consolidated financial statements give a true and fair view of the group’s financial
position, financial performance and cash flows in accordance with International Financial Reporting Standards (IFRS) as adopted by the EU,
• the financial statements give a true and fair view of the parent company’s financial performance and financial position in accordance with the laws and regulations governing the preparation of financial statements in Finland and comply with statutory requirements.
Our opinion is consistent with the additional report submitted to the Audit Committee.
Basis for opinionWe conducted our audit in accordance with good auditing practice in Finland. Our responsibilities under good auditing practice are further described in the Auditor’s Responsibilities for the Audit of Financial Statements section of our report.
We are independent of the parent company and of the group companies in accordance with the ethical requirements that are applicable in Finland and are relevant to our audit, and we have fulfilled our other ethical responsibilities in accordance with these requirements.
In our best knowledge and understanding, the non-audit services that we have provided to the parent company and group companies are in compliance with laws and regulations applicable in Finland regarding these services, and we have not provided any prohibited non-audit services referred to in Article 5(1) of regulation (EU) 537/2014.
The non-audit services that we have provided have been disclosed in note 4 to the consolidated financial statements.
We believe that the audit evidence we have obtained is sufficient and appropriate to provide a basis for our opinion.
Key audit mattersKey audit matters are those matters that, in our professional judgment, were of most significance in our audit of the financial statements of the current period. These matters were addressed in the context of our audit of the financial statements as a whole, and in forming our opinion thereon, and we do not provide a separate opinion on these matters.
We have also addressed the risk of management override of internal controls. This includes consideration of whether there was evidence of management bias that represented a risk of material misstatement due to fraud.
Annual report 2018 202
Creating valueTieto 2018 Governance Financials Sustainability

Key audit matter How our audit addressed the key audit matterImpairment testing of Goodwill
Refer to Note 26 in the Financial Statements. As part of our audit procedures we assessed key controls by each cash generating unit.
Consolidated financial statements includes goodwill of EUR 442.6 million.
In addition, we have assessed the key assumptions in the impairment testing performed by management for the Products Service Development cash generating by:
Management has conducted annual goodwill impairment testing and as a result no impairment was identified.
Goodwill impairment testing requires substantial management judgment over the projected future business performance, cash flows and applied discount rate.
As described in note 26, management concluded that goodwill related to Tieto Product Development Services, EUR 54.2 million, is more sensitive to risk of impairment.
• assessing the growth and profitability estimates and comparing them to historical performance;
• comparing the estimates with the latest approved budgets and strategic plans;
• comparing applied discount rates to independent third party sources;
• testing the accuracy and the underlying calculations.
This matter is a significant risk of material misstatement referred to in EU Regulation No 537/241, point (c) of Article 10(2).
We also assessed the adequacy of the related disclosure information.
Revenue recognition
Refer to accounting policies for the consolidated financial statements and notes 1 and 2.
Tieto Oyj consolidated Net Sales amounted to EUR 1 599.5 million.
We evaluated the IT systems used in the determination of revenue recognition by testing access and change management controls. We also evaluated process level controls by performing walkthroughs of each significant class of revenue transactions, assessed the design effectiveness of key controls and tested the operating effectiveness of those controls.
The Net Sales consist mostly of continuous services, software solutions and consulting. In addition to this, the Company has to some extent fixed-price projects.
Key audit matter How our audit addressed the key audit matterRevenue from service contracts, software solutions and consulting is based on service volumes or time and materials; and the performance obligations are recognized over the accounting period in which the services are rendered. For contracts comprising fixed-price projects, revenue is recognized based on the actual service provided by the reporting date as a proportion of the total services to be provided.
Our substantive audit procedures to address the identified risk relating to revenue cut-off in projects and services sales consisted among others, performing transactional testing procedures to validate the recognition of revenue throughout the year as well as year-end.
Our substantive audit procedures to address the risk of inappropriate accounting for major fixed-price projects were focused around judgements used by management in creating project estimates.
In 2018, IFRS 15 was adopted, which changed the concept on how the revenue is accounted for. This did not result to any material change how the revenue is recognised.
We selected a sample of contracts and performed the following:
• Ensured that the revenue recognition method applied was appropriate based on the terms of the arrangement;
• Agreed project revenue estimate against the sales agreement, including contract amendments;
• Tested the accuracy of the cost estimate by taking a sample of cost components and traced those to supporting documentation; and
• Recalculated the revenue based on stage of completion of the project. Assessed the appropriateness of the stage of completion by comparing actual costs per the company’s accounting records to the estimated total costs of the project.
We identified two specific risks of error and fraud in respect of improper revenue recognition given the nature of the Group’s services, as follows:• Inappropriate revenue cut-off in project and
services sales; and• Inappropriate accounting for major projects.
Revenue recognition due to its size require specific attention both from the accounting and the auditing perspective. In addition, management applies judgement when considering revenue recognition for fixed-price projects.
Annual report 2018 203
Creating valueTieto 2018 Governance Financials Sustainability
Responsibilities of the Board of Directors and the President and CEO for the financial statementsThe Board of Directors and the President and CEO are responsible for the preparation of consolidated financial statements that give a true and fair view in accordance with International Financial Reporting Standards (IFRS) as adopted by the EU, and of financial statements that give a true and fair view in accordance with the laws and regulations governing the preparation of financial statements in Finland and comply with statutory requirements. The Board of Directors and CEO are also responsible for such internal control as they determine is necessary to enable the preparation of financial statements that are free from material misstatement, whether due to fraud or error.
In preparing the financial statements, the Board of Directors and CEO are responsible for assessing the parent company’s and the group’s ability to continue as going concern, disclosing, as applicable, matters relating to going concern and using the going concern basis of accounting. The financial statements are prepared using the going concern basis of accounting unless there is an intention to liquidate the parent company or the group or cease operations, or there is no realistic alternative but to do so.
Auditor’s responsibilities in the audit of financial statementsOur objectives are to obtain reasonable assurance on whether the financial statements as a whole are free from material misstatement, whether due to fraud or error, and to issue an auditor’s report that includes our opinion. Reasonable assurance is a high level of assurance, but is not a guarantee that an audit conducted in accordance with good auditing practice will always detect a material misstatement when it exists. Misstatements can arise from fraud or error and are considered material if, individually or in aggregate, they could reasonably be expected to influence the economic decisions of users taken on the basis of the financial statements.
As part of an audit in accordance with good auditing practice, we exercise professional judgment and maintain professional skepticism throughout the audit. We also:
• Identify and assess the risks of material misstatement of the financial statements, whether due to fraud or error, design and perform audit procedures responsive to those risks, and obtain audit evidence that is sufficient and appropriate to provide a basis for our opinion. The risk of not detecting a material misstatement resulting from fraud is higher than for one resulting from error, as fraud may involve collusion, forgery, intentional omissions, misrepresentations, or the override of internal control.
• Obtain an understanding of internal control relevant to the audit in order to design audit procedures that are appropriate in the circumstances, but not for the purpose of expressing an opinion on the effectiveness of the parent company’s or the group’s internal control.
• Evaluate the appropriateness of accounting policies used and the reasonableness of accounting estimates and related disclosures made by management.
• Conclude on the appropriateness of the Board of Directors’ and the President and CEO’s use of the going concern basis of accounting and based on the audit evidence obtained, whether a material uncertainty exists related to events or conditions that may cast significant doubt on the parent company’s or the group’s ability to continue as a going concern. If we conclude that a material uncertainty exists, we are required to draw attention in our auditor’s report to the related disclosures in the financial statements or, if such disclosures are inadequate, to modify our opinion. Our conclusions are based on the audit evidence obtained up to the date of our auditor’s report. However, future events or conditions may cause the company to cease to continue as a going concern.
• Evaluate the overall presentation, structure and content of the financial statements, including the disclosures, and whether the financial statements represent the underlying transactions and events so that the financial statements give a true and fair view.
• Obtain sufficient appropriate audit evidence regarding the financial information of the entities or business activities within the group to express an opinion on the consolidated financial statements. We are responsible for the direction, supervision and performance of the group audit. We remain solely responsible for our audit opinion.
Annual report 2018 204
Creating valueTieto 2018 Governance Financials Sustainability

We communicate with those charged with governance regarding, among other matters, the planned scope and timing of the audit and significant audit findings, including any significant deficiencies in internal control that we identify during our audit.
We also provide those charged with governance with a statement that we have complied with relevant ethical requirements regarding independence, and communicate with them all relationships and other matters that may reasonably be thought to bear on our independence, and where applicable, related safeguards.
From the matters communicated with those charged with governance, we determine those matters that were of most significance in the audit of the financial statements of the current period and are therefore the key audit matters. We describe these matters in our auditor’s report unless law or regulation precludes public disclosure about the matter or when, in extremely rare circumstances, we determine that a matter should not be communicated in our report because the adverse consequences of doing so would reasonably be expected to outweigh the public interest benefits of such communication.
Other Reporting RequirementsInformation on our audit engagementWe were first appointed as auditors by the The Finnish Patent and Registration office on 29 November 2018, for the financial year 1.1.-31.12.2018.
Other informationThe Board of Directors and CEO are responsible for the other information. The other information comprises the report of the Board of Directors and the information included in the Annual Report, but does not include the financial statements and our report thereon. We have obtained the report of the Board of Directors prior to the date of the auditor’s report, and the Annual Report is expected to be made available to us after that date.
Our opinion on the financial statements does not cover the other information.
In connection with our audit of the financial statements, our responsibility is to read the other information identified above and, in doing so, consider whether the other information is materially inconsistent with the financial statements or our knowledge obtained in the audit, or otherwise appears to be materially misstated. With respect to report of the Board of Directors, our responsibility also includes considering whether the report of the Board of Directors has been prepared in accordance with the applicable laws and regulations.
In our opinion, the information in the report of the Board of Directors is consistent with the information in the financial statements and the report of the Board of Directors has been prepared in accordance with the applicable laws and regulations.
If, based on the work we have performed on the other information that we obtained prior to the date of this auditor’s report, we conclude that there is a material misstatement of this other information, we are required to report this fact. We have nothing to report in this regard.
Espoo, 28 February 2019
Deloitte OyAudit Firm
Jukka VattulainenAuthorised Public Accountant (KHT)
Annual report 2018 205
Creating valueTieto 2018 Governance Financials Sustainability

Share capital and shares
Tieto Corporation’s issued and registered share capital on 31 December 2018 totalled EUR76 555 412.00 and the number of shares was 74 109 252.
Tieto’s shares have no par value and their book counter value is one euro. Tieto’s shares are listed on NASDAQ in Helsinki and Stockholm. The company has one class of shares, with each share conferring equal dividend rights and one vote. The company’s Articles of Association include a restriction on voting at the Annual General Meeting, where no-one is allowed to vote with more than one-fifth of the votes represented at the meeting. The Articles of Association are available at www.tieto.com/investors.
Shareholders and holding of own shares
The company had 26 746 registered shareholders at the end of 2018. Based on the ownership records of the Finnish and Swedish central securities depositories, 34.1% of Tieto’s shares were held by Finnish and 2.9% by Swedish investors. In total, there were 25 012 retail investors in Finland and Sweden and they held 12% of Tieto’s shares.
The members of the Board of Directors, the President and CEO and their close associates together held 0.1% of the shares and votes registered in the book-entry system on 31 December 2018. The President and CEO is also participating in Tieto’s long-term share-based incentive plans. Potential rewards will be paid partly in Tieto shares. As the number of additional shares related to these incentives is dependent on the company’s performance these are not included in this aggregate number.
Tieto has three longer-term shareholders holding 10% or more of the shares: Cevian Capital Partners Ltd, Solidium Oy and Silchester International Investors LLP. Based on the latest information (31 August 2018), Cevian Capital's holding was 11 066 684 shares, representing 14.9% of the shares and voting rights. Solidium Oy held 10.0% of Tieto’s shares on 31 December 2018. Based on its announcement made on 23 June 2015, Silchester International
Shares and shareholdersInvestors LLP’s aggregate holding in Tieto was 7 401 027 shares, which represents 10.0% of the shares and voting rights.
Tieto is not aware of any shareholder agreements or cross-shareholdings that would limit the amount of shares available for trading. The free float of the shares, excluding the treasury shares currently held by the company, can be considered to be 100%.
At the end of 2018, the number of shares in the company’s or its subsidiaries’ possession totalled 282 903 representing 0.4% of the total number of shares and voting rights. Related to the company’s share-based reward plan, a total of 103 224 shares held by Tieto were transferred to the participants of the plan. The number of outstanding shares, excluding the treasury shares, was 73 826 349 at the end of the year.
Share-based incentive plans
Tieto has three share-based incentive plans, a Performance Share Plan 2016, 2017 and 2018 and a Restricted Share Plan 2016, 2017 and 2018. The potential rewards will be paid partly in the company’s shares and partly in cash, respectively in 2019, 2020 and 2021. The share rewards to be delivered to the participants will consist of shares to be acquired from the market. Thus, no new shares will be issued in connection with the plans.
The rewards to be paid on the basis of the plans, correspond to the value of an approximate maximum total of 1 500 000 Tieto shares (including the proportion to be paid in cash).
The company has not issued any bonds with warrants nor has any stock options programmes.
Annual report 2018 206
Creating valueTieto 2018 Governance Financials Sustainability

Board authorizations
The 2018 Annual General Meeting authorized the Board of Directors to decide on the repurchase of the company's own shares. The amount of own shares to be repurchased shall not exceed 7 400 000 shares, which currently corresponds to approximately 10% of all the shares in the company. The authorization is intended to be used to develop the company’s capital structure.
Share performance and trading
In 2018, the turnover of Tieto’s shares totalled EUR 808.5 million (29 333 439 shares) in Helsinki and SEK 519.4 million (1 829 632 shares) in Stockholm. The combined trading volume represented 42% of the shares. On NASDAQ Helsinki, the volume- weighted average share price in 2018 was EUR 27.56. At the end of the year, the share price was EUR 23.58. The highest price was EUR 30.74 and the lowest EUR 22.86. At the end of the year, the company’s market capitalization totalled EUR 1 747.5 (1 925.4) million. The share price declined by 9% from the year-end 2017 in Helsinki and declined by 5% in Stockholm during the year. At the same time, the OMX Helsinki Price Index declined by 6%. The OMX Stockholm Price Index declined by 8% in 2018.
In addition to NASDAQ Helsinki and Stockholm, Tieto’s share is traded on multilateral trading facilities (MTF), such as Turquoise and BATS Europe. The aggregate number of Tieto’s shares traded on these marketplaces was 17 074 545 shares, or approximately 35% of the total trading volume.
For additional information on shares and shareholders, see www.tieto.com/investors/Shares.
17. FINANCIALS
8
6
4
2
0
30
15
014 15 16 17 18
SHARE PRICE DEVELOPMENT AND TURNOVER, HELSINKI
Tieto
NASDAQ OMX Helsinki
Turnover per monthSource: Thomson Reuters
Million shares
EUR
FR work number 17
Annual report 2018 207
Creating valueTieto 2018 Governance Financials Sustainability

18. FINANCIALS
300
150
0
8
6
4
2
0
14 15 16 17 18
SHARE PRICE DEVELOPMENT AND TURNOVER, STOCKHOLM
Tieto
NASDAQ OMX Stockholm
Turnover per monthSource: Thomson Reuters
Million shares
SEK
FR work number 1819. FINANCIAL
14 15 16 17 18
DIVIDEND / SHARE
1.301.35 1.37 1.40 1.45
0.301)0.251)
0.221) 0.201) 0.201)
1.001.10
1.15 1.20 1.25
1) Additional dividend, EUR
EUR
1.50
1.20
0.90
0.60
0.30
0
FR work number 1920. FINANCIALS
14 15 16 17 18
1 585
1 8301 921 1 925
1 7872 000
1 500
1 000
500
0
MARKET CAPITALIZATION
EURmillion
FR work number 20
Annual report 2018 208
Creating valueTieto 2018 Governance Financials Sustainability

Major shareholders on 31 December 2018
Shares %
1 Cevian Capital1) 11 066 684 14.9
2 Solidium Oy 7 415 418 10.0
3 Silchester International Investors LLP2) 7 401 027 10.0
4 Ilmarinen Mutual Pension Insurance Co. 1 443 415 1.9
5 Swedbank Robur fonder 1 423 054 1.9
6 Elo Pension Co. 810 000 1.1
7 The State Pension fund 773 000 1.0
8 Svenska litteratursällskapet i Finland r.f. 636 345 0.9
9 Åbo Akademi University Foundation 495 500 0.7
10 Nordea Funds 383 816 0.5
Top 10 shareholders total 31 848 259 43.0- of which nominee registered 18 467 711 24.9
Nominee registered other 29 901 319 40.3
Others 12 359 674 16.7
Total 74 109 252 100.0
Based on the ownership records of Euroclear Finland Oy and Euroclear Sweden AB.
1) Based on the ownership records of Euroclear Finland Oy, Cevian Capital's holding on 31 August 2018 was 11 066 684
shares, representing 14.9% of the shares and voting rights.
2) On 23 June 2015, Silchester International Investors LLP announced that its holding in Tieto Corporation was 7 401 027
shares, which represents 10.0% of the shares and voting rights.
16. FINANCIALS
OWNERSHIP STRUCTURE ON 31 DEC 2018,
% OF SHARES
Corporations
Finance and insurance institutions
Public organizations
Households
Non-profit organizations
Foreign
Nominee registered
2.9%
14.9%
10.1%
4.4%
0.6%
1.8%
65.3%
FR work number 16
Annual report 2018 209
Creating valueTieto 2018 Governance Financials Sustainability

Number of shares
Shareholders SharesNo % No %
1–100 6 573 39.0 354 830 0.5101–500 6 679 39.7 1 737 417 2.3501–1 000 1 793 10.6 1 374 688 1.91 001–5 000 1 494 8.9 3 173 873 4.35 001–10 000 149 0.9 1 042 806 1.410 001–50 000 105 0.6 2 152 190 2.950 001–100 000 25 0.1 1 767 017 2.4100 001–500 000 17 0.1 3 757 132 5.1500 001– 8 0.0 58 738 739 79.3
Based on the ownership records of Euroclear Finland Oy
Changes in share capital
(1 share = 1 vote) Shares Share capital, EURTotal on 31 December 2006 75 841 462 75 841 462Nullifying of the company’s own shares, registered in 2007 1 883 350 0Bonds with options subscribed, registered in 2007 61 61Nullifying of the company’s own shares, registered in 2008 1 935 000 0Total on 31 December 2011 72 023 173 75 841 523Subscriptions with stock options, registered in 2012 354 040 110 651Total on 31 December 2012 72 377 213 75 952 174Subscriptions with stock options, registered in 2013 755 154 603 238Total on 31 December 2013 73 132 367 76 555 412Subscriptions with stock options, registered in 2014 543 536 0Total on 31 December 2014 73 675 903 76 555 412Subscriptions with stock options, registered in 2015 334 050 0Total on 31 December 2015 74 009 953 76 555 412Subscriptions with stock options, registered in 2016 99 299 0Total on 31 December 2016 74 109 252 76 555 412Subscriptions with stock options, registered in 2017 0 0Total on 31 December 2017 74 109 252 76 555 412Subscriptions with stock options, registered in 2018 0 0Total on 31 December 2018 74 109 252 76 555 412
Trading codes
NASDAQ OMX Helsinki TIETO
NASDAQ OMX Stockholm TIETOS
Thomson Reuters, Helsinki TIETO.HE
Thomson Reuters, Stockholm TIETOS.ST
Bloomberg, Helsinki TIETO:FH
Bloomberg, Stockholm TIETOS:SS
ISIN Code FI0009000277
Annual report 2018 210
Creating valueTieto 2018 Governance Financials Sustainability

Information for shareholdersShareholder calendar 2019
• Record date for the AGM 11 March• Registration period 6 February–15 March 3.00 pm EET• Annual General Meeting 21 March • Ex-dividend date 22 March• Record date for dividend payment 25 March• Payment of the dividend as from 9 April• Interim report 1/2019 25 April• Interim report 2/2019 19 July• Interim report 3/2019 24 October
Annual general meeting
The Annual General Meeting of Tieto Corporation will be held on Thursday 21 March 2019 at 4.00 pm (Finnish time) at the Tieto headquarters, address Keilalahdentie 2-4, Espoo, Finland.
Documents of the AGMThe documents of the AGM are available on the company’s website at www.tieto.com/agm.
The right to participate and registrationShareholders registered in the shareholders’ registerEach shareholder registered on 11 March 2019 in the shareholders' register of the company, has the right to participate in the AGM. A shareholder, whose shares are registered on his/her Finnish book-entry account, is registered in the shareholders' register of the company.
A shareholder, who wishes to participate in the AGM, may register for the meeting by giving a prior notice of participation no later than 15 March 2019 by 3.00 pm (EET) either:
• through Tieto’s website at www.tieto.com/agm• by e-mail agm(at)tieto.com• by phone +358 20 727 1740 (Mon–Fri 9.00 am–3.00 pm (EET) or• by mail to Tieto, Legal/AGM, P.O. Box 2, FI-02101 Espoo, Finland
Possible proxy documents should be delivered in originals to Tieto, Legal/AGM, P.O. Box 2, FI-02101 Espoo, Finland before 15 March 2019.
Holders of nominee registered sharesA holder of nominee registered shares has the right to participate in the general meeting by virtue of such shares, based on which he/she on the record date of the general meeting, i.e. on 11 March 2019, would be entitled to be registered in the shareholders’ register of the company held by Euroclear Finland Oy.
The right to participate in the general meeting requires, in addition, that the shareholder on the basis of such shares has been registered into the temporary shareholders’ register held by Euroclear Finland Oy at the latest by 18 March 2019 by 10 am (EET). As regards nominee registered shares this constitutes due registration for the general meeting.
A holder of nominee registered shares is advised to request without delay necessary instructions regarding the registration in the temporary shareholder’s register of the company, the issuing of proxy documents and registration for the general meeting from his/her custodian bank.
The account management organization of the custodian bank will register a holder of nominee registered shares, who wants to participate in the Annual General Meeting, into the temporary shareholders' register of the company at the latest by 18 March 2019 by 10 am (EET).
Annual report 2018 211
Creating valueTieto 2018 Governance Financials Sustainability
Shares registered in Euroclear Sweden ABA shareholder with shares registered in Euroclear Sweden AB’s Securities System who wishes to attend and vote at the Annual General Meeting must:
1. be registered in the shareholders’ register maintained by Euroclear Sweden AB not later than on 11 March 2019. Shareholders whose shares are registered in the name of a nominee must, in order to be eligible to request a temporary registration in the shareholders’ register of Tieto Oyj maintained by Euroclear Finland Oy, request that their shares are re-registered in their own names in the register of shareholders maintained by Euroclear Sweden AB, and procure that the nominee sends the above mentioned request for temporary registration to Euroclear Sweden AB on their behalf. Such reregistration must be made as of 11 March 2019 and the nominee should therefore be notified well in advance.
2. request temporary registration in the shareholders’ register of Tieto Corporation maintained
by Euroclear Finland Oy. Such request shall be submitted in writing to Euroclear Sweden AB no later than on 12 March 2019 at 15.00 Swedish time. This temporary registration made through written request to Euroclear Sweden AB is considered a notice of attendance at the general meeting. Proxy representative and power of attorney.
A shareholder may participate in the Annual General Meeting and exercise his/her rights at the meeting by way of proxy representation. A proxy representative shall produce a dated proxy document or otherwise in a reliable manner demonstrate his/her right to represent the shareholder at the Annual General Meeting. When a shareholder participates in the Annual General Meeting by means of several proxy representatives representing the shareholder with shares at different securities accounts, the shares by which each proxy representative represents the shareholder shall be identified in connection with the registration for the Annual General Meeting. Further information on attending the AGM at www.tieto.com/agm.
Dividend paymentThe Board of Directors proposes to the Annual General Meeting that a dividend of EUR 1.25 per share and an additional dividend of EUR 0.20 be paid from the distributable assets for the financial year that ended on 31 December 2018. The dividend shall be paid to shareholders who on the record date for the dividend payment on 25 March 2019 are recorded in the shareholders’ register held by Euroclear Finland Oy or the register of Euroclear Sweden AB. The dividend shall be paid as from 9 April 2019.
Further information on the AGM at www.tieto.com/agm.
Annual report 2018 212
Creating valueTieto 2018 Governance Financials Sustainability

Sustainability management reportOur approach to sustainability 214
Managing sustainability 216
Sustainability opportunities and risks 219
Materiality analysis 221
Sustainability 2020 plan 223
About sustainability reporting 225
Independent assurance report 227
GRI Content index table 229
213Annual report 2018
Creating valueTieto 2018 Governance Financials Sustainability

As a company, we are aligning our sustainability practices with international norms, frameworks and legislation covering anti-corruption, environment, human rights and labour rights. Our sustainability approach is founded in the UN Global Compact’s principles (UNGC), the OECD Guidelines for Multinational Enterprises and aligned with the UN’s Global Sustainable Development Goals. But our sustainability efforts are not merely a question of complying with laws and regulations. We are determined to lead the way and be an ethical forerunner, which sometimes means going beyond regulations and applying higher standards.
We also aim at playing an active role in the sustainable development of people, business and society at large. We affiliate ourselves with a number of voluntary industry organizations and initiatives in order to promote long-
Our approach to sustainabilitySustainability at Tieto covers many topics and is regarded as both a responsibility and an opportunity for us. We need to be environmentally, socially and financially responsible in our daily business to meet the requirements and expectations set by our stakeholders. But we must also create sustainable value for our customers and society through our innovative solutions.
SUSTAINABILITY
term, sustainable industry development and regulation at local, national and international level. Some of our affiliations are with:
• Finnish Business & Society (FiBS) in Finland
• CSR Sweden in Sweden• The European AI Alliance• Nätverket för Hållbart Näringsliv (NMC) in
Sweden • Climate Partnership network of City of
Helsinki, Finland• United Nations Global Compact and the
Nordics’ network• Cleantech Finland• CDP (the world’s largest investor index for
carbon disclosures)
As a result of our sustainability performance, we have received a number of acknowledgments for our efforts during the year.
We are determined to lead the way and be an ethical forerunner.
“ DURING 2018,
BUSINESS ETHICS
WAS A CORE THEME
ACROSS TIETO'S
BUSINESS.
Read more
214Annual report 2018
Creating valueTieto 2018 Governance Financials Sustainability

CDP
In 2018, we achieved level B in CDP Climate Change scoring. This score recognizes our solid environmental management efforts over the years. Our CDP score exceeds the IT sector and CDP programme averages and has done so since 2010. We have reduced our CO2 emissions every year since 2012.
OMX GES Sustainability Finland Index
Based on our sustainability performance, Tieto Oyj is included in the OMX GES Sustainability Finland Index.
Equileap's 2018 Global Gender Equality Ranking
Equileap, a non-profit organization, published its second cross-sector ranking showing how well the world’s top companies, across all sectors and countries, perform on gender equality. In Equileap's 2018 Global Gender Equality Ranking, Tieto was the highest placed technology company on the list and ranked among the top 25 companies. The evaluation included more than 3 000 companies across 23 countries and was done based on 19 gender equality criteria.
Swiss EDGE Certified Foundation
We were the first ICT company in the world to receive a gender equality certification from the Swiss EDGE Certified Foundation at the end of 2015 (valid for two years). This was received again in 2017. The certification represents the leading global assessment methodology and business certification standard for gender equality. It assesses policies, practices and numbers across five different areas of analysis: equal pay for equivalent work, recruitment and promotion, leadership development training and mentoring, flexible working and company culture.
The Estonian Diversity Badge
As the first and only IT company in Estonia we received this award from the Estonian Ministry of Social Affairs for our strategic work in the area of non-discrimination and equal opportunities.
The Employee Network Excellence Award in India
In India we received the ‘Employee Network Excellence Award’ from BD Foundation, a global diversity consultant. The award
recognizes an employee network which has been able to demonstrate its impact in shaping and driving the diversity and inclusion agenda; while also demonstrating the sustained value it has added to the business.
The State of Customer Experience Management
The Finnish study, The State of Customer Experience Management, conducted by CXPA Finland and Shirute Ltd, evaluates companies’ customer experience management, taking into consideration organization and leadership, culture, processes, tools and extent of operations. In 2018, we were ranked the third best company in Finland out of 66 companies examined.
215Annual report 2018
Creating valueTieto 2018 Governance Financials Sustainability

Sustainability integrated in the organization
Our sustainability work is facilitated by the company’s Sustainability team and supported by the Sustainability Steering Group, chaired by the Vice President of Communication and Sustainability. The steering group advises the Leadership Team and Board of Directors and approves the annual integrated report from sustainability perspective. The Sustainability Steering Group represents different functions and units of Tieto, ensuring that the voices of various internal and external stakeholders are heard. Our aim is to maintain a balanced male and female representation in the steering group, as well as younger and more experienced management.
Managing sustainabilityWe believe that by integrating sustainability throughout our value chain, we can ensure Tieto's business success for longer term. We need to both mitigate the sustainability related risks and grasp the opportunities to futureproof our business. Through sound governance, compliance, processes, tools and organization, we make this happen.
SUSTAINABILITY
In 2017, the Sustainability Steering Group approved Tieto’s Sustainability operating plan for 2018. The operating plan focuses on implementing activities to reach our long-term objectives: minimizing environmental impact, creating value for stakeholders and being an ethical forerunner in society. During the year, the steering group followed up and discussed the implementation and engagement needed to successfully execute the operating plan and consequently our Sustainability 2020 plan. The steering group also discussed the integrated reporting project and approved the content related to sustainability.
Daily sustainability activities are led and facilitated by the sustainability team. The team is led by the Head of Sustainability, who is
We encourage employees to discuss and promote the positive sustainability impacts that digitalization can bring to customers.
“CODE OF CONDUCT -POLICY
Read more
216Annual report 2018
Creating valueTieto 2018 Governance Financials Sustainability

also the owner of the company's sustainability policies and processes. The Head of Sustainability reports to the Vice President Communication and Sustainability, who reports to the company’s President and CEO. The management of specific sustainability areas, as defined in our materiality analysis, are handled by the appointed sustainability area owners, responsible for reporting on area specific KPI performance. High-priority sustainability goals are presented in the Sustainability 2020 plan, which is approved by the Sustainability Steering Group and Tieto Leadership Team. Management of specific sustainability areas are presented in more detail in the respective sections of this report.
Policies and rules giving strategic direction and practical guidance
Our ethical principles are summarized in our Code of Conduct Policy, which applies to all of our employees as well as any third party contributing to our services, products and other business activities. The Code of Conduct is aligned with international frameworks and norms, as well as local legislations.
We have a separate Supplier Code of Conduct Rule, clarifying the ethical guidelines applying to Tieto's suppliers. This rule is
implemented in all new supplier contracts with regular suppliers.
Our Anti-Corruption Rule provides practical guidelines on how to evaluate and avoid unethical behaviour. Additionally, all employees are expected to adhere to our Competition Law Compliance Rule. We also have an Environmental Rule which outlines our precautionary approach to environmental management within the company and throughout the value chain. This rule is compliant with ISO 14001 requirements. In addition, we also have several other policies and rules supporting the management of specific sustainability areas. All policies and rules as well as processes covering sustainability apply to our entire organization. Policies and rules are reviewed on an annual basis, as part of our compliance program.
Implementing sustainability in daily business operations
To support our organization in further implementing sustainability in daily business operations, we have a Sustainability Management Process, which is included in our business system, Tieto Way. This process utilizes best practices from the United Nations Global Compact Management Model and GRI Standards. The tool demonstrates clear links of process and documents to other
business processes. Among other things, the Sustainability Management Process formally presents the role of a Sustainability Area Owner. Our Code of Conduct e-learning further supports the implementation of sustainable and ethical business practices across the entire organization. In addition, we have an environmental e-learning course that supports the implementation of our Environmental Management System and related ISO 14001 certifications. Mandatory trainings for all employees also cover e-learnings in GDPR, as well as a general security training.
Since sustainability concerns the whole company, we encourage employees to discuss and promote the positive sustainability impacts that digitalization can bring to customers. Our sustainability approach is regularly included in the company’s sales materials. These materials are aimed to help sales teams to learn about sustainability at Tieto and answer customers’ sustainability requests. The sustainability team, together with the sustainability area owners, supports internal functions, such as Procurement, HR, and customer teams in sustainability matters.
Tieto’s Rule for Escalations define our common way of managing all escalations made to Internal Audit, Sustainability and Legal. Our Escalation Function is responsible
for logging, following up and initiating preventive actions based on the case experience. At Tieto, we are committed to a culture where employees feel safe to speak up and report concerns and we adhere to the principle of non-retaliation. The handling of escalations is described in more detail here.
217Annual report 2018
Creating valueTieto 2018 Governance Financials Sustainability
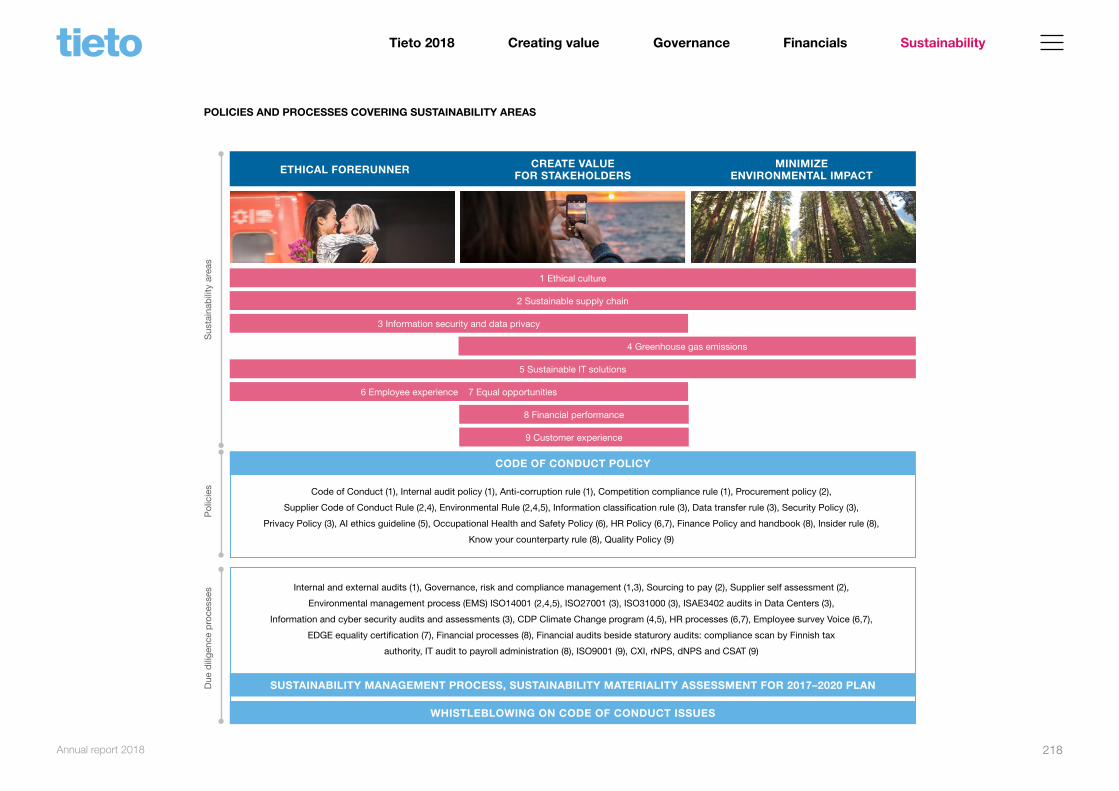
POLICIES AND PROCESSES COVERING SUSTAINABILITY AREAS
CODE OF CONDUCT POLICY
SUSTAINABILITY MANAGEMENT PROCESS, SUSTAINABILITY MATERIALITY ASSESSMENT FOR 2017–2020 PLAN
WHISTLEBLOWING ON CODE OF CONDUCT ISSUES
Sus
tain
abili
ty a
reas
Pol
icie
sD
ue d
ilige
nce
pro
cess
es
Code of Conduct (1), Internal audit policy (1), Anti-corruption rule (1), Competition compliance rule (1), Procurement policy (2),
Supplier Code of Conduct Rule (2,4), Environmental Rule (2,4,5), Information classification rule (3), Data transfer rule (3), Security Policy (3),
Privacy Policy (3), AI ethics guideline (5), Occupational Health and Safety Policy (6), HR Policy (6,7), Finance Policy and handbook (8), Insider rule (8),
Know your counterparty rule (8), Quality Policy (9)
Internal and external audits (1), Governance, risk and compliance management (1,3), Sourcing to pay (2), Supplier self assessment (2),
Environmental management process (EMS) ISO14001 (2,4,5), ISO27001 (3), ISO31000 (3), ISAE3402 audits in Data Centers (3),
Information and cyber security audits and assessments (3), CDP Climate Change program (4,5), HR processes (6,7), Employee survey Voice (6,7),
EDGE equality certification (7), Financial processes (8), Financial audits beside staturory audits: compliance scan by Finnish tax
authority, IT audit to payroll administration (8), ISO9001 (9), CXI, rNPS, dNPS and CSAT (9)
MINIMIZE ENVIRONMENTAL IMPACT
CREATE VALUE FOR STAKEHOLDERSETHICAL FORERUNNER
1 Ethical culture
2 Sustainable supply chain
5 Sustainable IT solutions
3 Information security and data privacy
6 Employee experience 7 Equal opportunities
4 Greenhouse gas emissions
8 Financial performance
9 Customer experience
218Annual report 2018
Creating valueTieto 2018 Governance Financials Sustainability

Sustainability related opportunities and risks
SUSTAINABILITY
Sustainability related opportunities
Our Sustainability 2020 plan captures and details our strategic efforts to maximize opportunities connected to sustainability. These are defined by three overall sustainability objectives.
Minimizing environmental impact Climate change is a global concern and needs to be addressed by all enterprises and organizations. The energy consumption of our business together with travel form the biggest direct environmental burden at Tieto. By simply increasing efficiencies in our daily operations, we have steadily reduced our CO2 emissions. At the end of the 1990s, we implemented an ISO 14001 certified environmental management system (EMS), which currently covers over 90% of our operations. Our offices are green certified, and we are optimizing the use of each square metre. As the need for data increases, we constantly explore new
ways to optimize energy efficiency across our entire data centre network. Our Nordic data centres run with renewable energy and whenever possible, any excess heat is recycled back to benefit nearby neighbourhoods. Virtual meetings have become a natural way of working within Tieto. When travelling is necessary we always try to find the most reliable and sustainable partners.
The bigger opportunity, however, lies in reducing emissions in our customer’s industries through innovative IT solutions and services. According to the Global eSustainability Initiative Smarter 2030 report, ICT can enable a 20% reduction of global CO2e (CO2 equivalent) emissions by 2030. This would mean emissions kept at 2015 levels. We are committed to implementing solutions that improve customers’ sustainability as well as benefitting society at large.
Being an ethical forerunner In a global society, being an ethical forerunner
All companies need to respect and be aware how their operations impact human rights.
“ IN 2018 WE
LAUNCHED AN
INITIAL ETHICAL
FRAMEWORK
FOR AI.
Read more
219Annual report 2018
Creating valueTieto 2018 Governance Financials Sustainability

means setting a good example as a corporate citizen in all our operating countries. Diversity and equality are topics which are of high priority within our company and integral parts of our culture. We want to ensure those values are taken seriously and their value to our business as enablers for innovation is understood by everyone.
Corruption continues to be a global challenge and poses a risk to all businesses, so anti-corruption is one key focus area for us. Our approach to business ethics is detailed in our Code of Conduct Policy and it is the core of our Open Source culture. We believe that by having a strong focus on business ethics and being committed to transparency and openness we can be a trustworthy partner for our customers.
All companies need to respect and be aware of the impact of their operations on human rights across their value chains. We respect our employees’ workplace rights and aim to ensure our suppliers respect human rights in their operations too. This focus also extends to our customers, both through our business relations
and the services and solutions we deliver. Our efforts with information security and data privacy as well as AI ethics marks as concrete examples of this.
Creating value for stakeholders We want to create value for all our key stakeholder groups: customers, employees, and investors, but also for society as a whole. Our ambition is to enhance our customers’ use of digital services and solutions to support their business renewal. When we deliver sustainable IT services and solutions to enterprises and public-sector organizations, we help to improve the economic, social and environmental conditions in the markets where we operate. Simultaneously, our profitability can be strengthened, which is essential for long-term success as a market innovator, employer and taxpayer.
Sustainability related risks
Integrating sustainability into our core business processes and systems is a key priority. In
2018, our operational risks were re-evaluated and identified mainly as compliance risks. Risks come with a potential reputation impact. Negative publicity and associations among stakeholders may lead to a decline in the sustainability indices or deviations in audits. Severe breaches could even lead to loss of customers. Fraudulent, unethical, or illegal actions by individuals, in areas such as corruption or conflict of interest, can occure if anti-corruption awareness and team culture are not sufficiently embedded. The implications from these situations range from disqualification from public tenders to contractual sanctions. Compliance training, audits and follow-ups are used to mitigate risks.
The identified risks associated with human and labour rights are employee wellbeing, stress-related health issues, discrimination, and harassment. We need to take measures to mitigate operational risks, for example the impact long-term employee illness may have on our customers deliveries. Health issues, and discrimination and harassment can all create a working environment where employees don’t
reach their full potential. Discrimination could also hinder our ability to develop innovative solutions to our customers’ challenges. We strongly believe that diversity of personnel, whether based on gender, age or cultural background, is needed to stay competitive in the fast-paced IT industry. Diversity and inclusion are at the core of our Open Source culture. Being able to recharge and maintain wellbeing is equally crucial. Employee health and wellbeing index is measured and followed up across the organization and actions taken where necessary.
Supply chain risks may include compliance risks related to environment, human and labour rights or corruption. Severe breaches against international conventions in the supply chain could lead to customers terminating their contracts. We mitigate these risks through the supplier sustainability programme and on-boarding practices, consisting of both compliance and audit activities. We also continuously develop our partner qualification and third-party risk management processes.
220Annual report 2018
Creating valueTieto 2018 Governance Financials Sustainability

At the end of 2016, we engaged internal and external stakeholders and conducted a materiality assessment in accordance with GRI Standards’ requirements. Stakeholder engagement included a sustainability area survey for employees, partners and suppliers. Selected customers were also engaged in a dialogue on sustainability focus areas, and an open survey, together with a Twitter chat was organized for the general public. As a result, nine sustainability areas were identified and chosen to guide our sustainability approach and form the core of our Sustainability 2020 plan.
Materiality analysisThe nine sustainability areas and our Sustainability 2020 plan are the result of the materiality assessment carried out among key stakeholders in 2016. In 2018, we validated our materiality analysis through an expert panel, to make sure that we stay aligned with our stakeholders’ expectations.
SUSTAINABILITY
MATERIALITY RESULTS 2018
MEDIUM HIGH VERY HIGH
Significance of economic, environmental and social impact
Imp
orta
nce
to s
take
hold
ers'
dec
isio
n m
akin
g
ME
DIU
MH
IGH
VE
RY
H
IGH
1
Greenhouse gas emissions
Financial performance
Sustainable supply chain
2
2
3
3
Employee experience
Customer experience & Information security and data privacy
Sustainable IT solutions
4
5
5
6
6
4
Ethical culture
Equal opportunities
7
7
8
8
1
221Annual report 2018
Creating valueTieto 2018 Governance Financials Sustainability

Our materiality analysis is reviewed on an annual basis to make sure that internal and external stakeholders views are considered and that the right focus remains for our activities. In 2018, we reviewed the analysis through in-depth stakeholder consultations with a few sustainability experts, chosen based on their subject matter expertise in combination with their knowledge about Tieto. The Sustainability 2020 plan was confirmed, and hence our long-term targets will remain. However, through our consultations and internal analysis, we revised our contribution to the United Nations Sustainable Development goals. Goal 5 – gender equality, was replaced with goal 10 – reduced inequalities, as our focus on equality spans beyond gender equality into sex, gender identity, nationality, religion, belief system, race, age, disability, sexual orientation, political opinion, union membership or social or ethnic origin. In addition, goal 7 – affordable and clean energy was added given our positive CO2 impact through Sustainable IT solutions.
Our material topics concern the whole Tieto Corporation, unless otherwise stated, and cover all Tieto’s operating countries.
SUSTAINABILITY AREA BOUNDARIES ACCORDING TO GRI STANDARDS
Suppliers
GHG Emissions GHG Emissions
Equal opportunities
Employee experience
Financial performance
Customer experience
Partners Tieto Customers End-users
Sustainable IT
Information security and data privacy
Sustainable supply chain
Ethical culture
222Annual report 2018
Creating valueTieto 2018 Governance Financials Sustainability

Sustainability 2020 plan SUSTAINABILITY
We know a sustainable approach is necessary to future-proof our business while also ensuring the planet is fit for future generations. Furthermore, we believe that by actively integrating sustainability in all operations we are gaining a competitive advantage, which enhances our business performance. We also recognize that our stakeholders, ranging from employees, investors, customers and suppliers to local societies, citizens and authorities, expect us to conduct our business in a responsible manner and impact positively on sustainable development on society at large.
Sustainability 2020 Plan is the roadmap guiding our efforts for integrated sustainable
Sustainability is both a responsibility and an opportunity for Tieto. We consider social, environmental and economic aspects of it and cover not only our own business operations, services and solutions, but also our partners and suppliers. To succeed in this, we focus on three main objectives; minimizing environmental impact, being an ethical forerunner and creating value for our stakeholders.
practices across our value chain. The plan is created based on the materiality analysis reviewed in 2018, and consists of three main objectives with three focus areas under each. Our objectives include lowering the environmental impact of our own operations as well as those of our customers and our suppliers, being an ethical forerunner in the global society, and creating value for our stakeholders. Our sustainability plan is aligned with global frameworks for sustainable business, such as the United Nations Global Compact and the OECD Guidelines for Multinational Enterprises. It also outlines how we contribute to the United Nations Sustainable Development Goals.
SUSTAINABILITY 2020 PLAN
SUSTAINABILITY 2020 PLAN
Information security and data privacy
Financial performance
Customer experiece
Minimize environmental
impact
Ethical forerunner
Create value for stakeholders
Equal opportunities, Employee experience
Greenhouse gas emissions
Sustainable supply chain
Sustainable IT
Ethical culture
223Annual report 2018
Creating valueTieto 2018 Governance Financials Sustainability
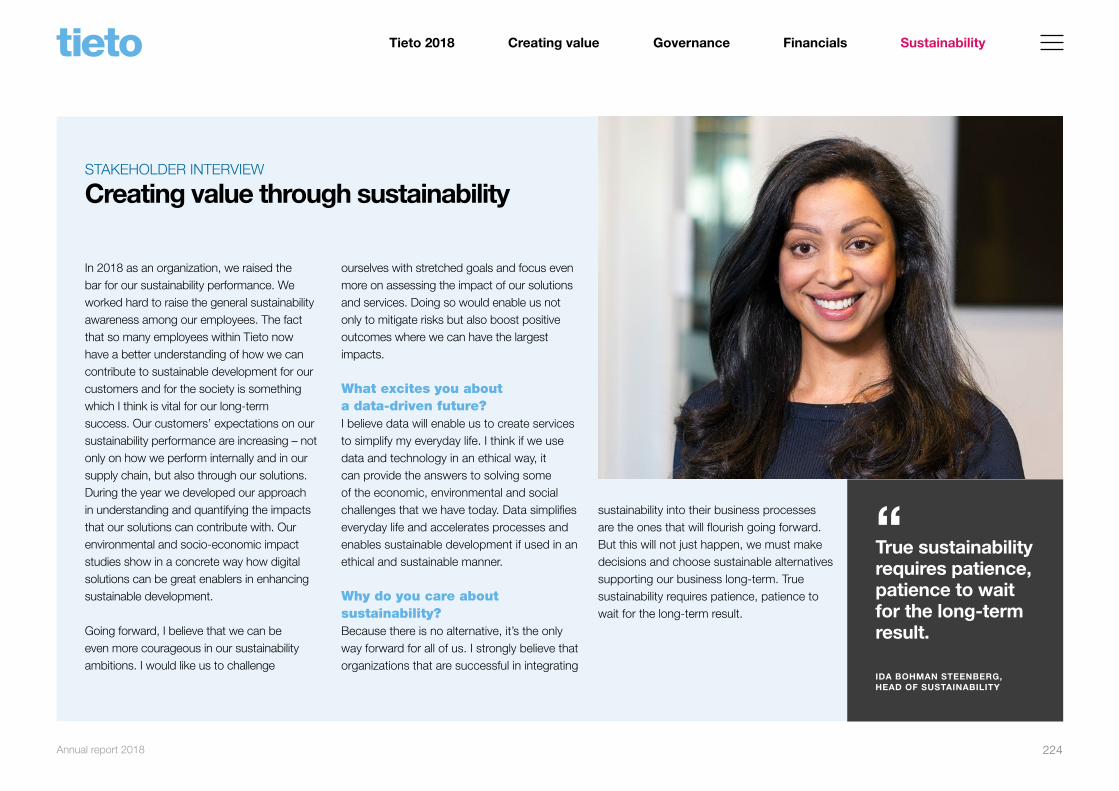
True sustainability requires patience, patience to wait for the long-term result.
“
IDA BOHMAN STEENBERG, HEAD OF SUSTAINABILITY
In 2018 as an organization, we raised the bar for our sustainability performance. We worked hard to raise the general sustainability awareness among our employees. The fact that so many employees within Tieto now have a better understanding of how we can contribute to sustainable development for our customers and for the society is something which I think is vital for our long-term success. Our customers’ expectations on our sustainability performance are increasing – not only on how we perform internally and in our supply chain, but also through our solutions. During the year we developed our approach in understanding and quantifying the impacts that our solutions can contribute with. Our environmental and socio-economic impact studies show in a concrete way how digital solutions can be great enablers in enhancing sustainable development.
Going forward, I believe that we can be even more courageous in our sustainability ambitions. I would like us to challenge
Creating value through sustainability
ourselves with stretched goals and focus even more on assessing the impact of our solutions and services. Doing so would enable us not only to mitigate risks but also boost positive outcomes where we can have the largest impacts.
What excites you about a data-driven future?I believe data will enable us to create services to simplify my everyday life. I think if we use data and technology in an ethical way, it can provide the answers to solving some of the economic, environmental and social challenges that we have today. Data simplifies everyday life and accelerates processes and enables sustainable development if used in an ethical and sustainable manner.
Why do you care about sustainability?Because there is no alternative, it’s the only way forward for all of us. I strongly believe that organizations that are successful in integrating
STAKEHOLDER INTERVIEW
sustainability into their business processes are the ones that will flourish going forward. But this will not just happen, we must make decisions and choose sustainable alternatives supporting our business long-term. True sustainability requires patience, patience to wait for the long-term result.
224Annual report 2018
Creating valueTieto 2018 Governance Financials Sustainability

About sustainability reportingSUSTAINABILITY
The non-financial data and information included in our Annual Report 2018 are prepared in accordance with the core option of the GRI Standards. The disclosures focus on the sustainability topic that are most material regarding our economic, social and environmental performance.
Our material sustainability areas were identified during a materiality analysis in 2016–2017. These areas are the focus of our Sustainability 2020 plan. The materiality analysis was validated in 2018 through an expert panel.
The sustainability disclosures include the Parent company Tieto Corporation and all subsidiaries over which the Parent company has direct or indirect control. Human resource data, Code of Conduct data as well as Greenhouse gas emission data does not cover Tieto's Swedish subsidaries Avega and Meridium (around 400 employees). The GRI General Disclosures cover the entire Tieto Group. Unless otherwise stated, our workforce related figures in the Sustainability section of the report are based on the GRI Standards. The numbers include joint ventures, hence differing from the headcount
in the Financial section. The data sources are company systems which provide data on full-time, part-time, permanent and temporary employees.
Unless otherwise stated, all information and data pertain to activities from 1 January to 31 December 2018. The regional data is divided between HR and financial data due to system restrictions.
Our energy reporting and corresponding scope 1 and 2 emissions cover all operating sites (offices, laboratories and data centres) except Tieto's Swedish subsidaries Avega and Meridium. The scope of the energy data collection was aligned with our Environmental Management System; data is collected from data centres, laboratories and offices with 50 employees or more. The energy consumption of offices with <50 employees was estimated
225Annual report 2018
Creating valueTieto 2018 Governance Financials Sustainability

based on our global average values with a 10% safety margin. The original data sources are internal IT systems and invoices from utility providers. The scope 3 business travel related CO2 emissions include flights and the use of own cars. The CO2 factors used are DEFRA for flights and VTT Lipasto for car use. Data was collected from our own IT system and from our service providers systems. Locations with major operations and a significant amount of travel are within the scope.
Energy and emission calculations follow the Greenhouse Gas Protocol, and emissions are reported as CO2 emissions. Some calculations are manually conducted. The source of the indirect, location-based energy emission factors is the International Energy Agency (IEA). The base year emissions for the scope 2 reporting were updated using three-year average factors for all years. The sources for indirect, market-based energy emission factors are energy companies for the actual factors. Residual mix factors are used for the EU and the IEA factors are used for non-EU countries with no actual market-based factors. For direct energy, DEFRA’s emission factor is applied.
The base year for the scope 1–2 environmental calculations is 2016. Base year for scope 3 environmental calculations from car usage for business travel is also 2016, and for emissions from flights is 2018. In the report, the metric ton/UK tonne equivalent to 1 000 kilograms is stated solely as a ton.
The scope 2 energy consumption of cooling and electricity was restated in 2018 due to alignment with the Greenhouse Gas Protocol. The restatement was of purely methodological character and had no impact on actual consumptions figures, while improving reporting accuracy. During the 2018 data collection process, unresolvable inaccuarcies in CO
2 emission data from flights for 2016 and 2018 were identified, which compromised the comparability of the data. Therefore, the data from 2018 is set as the new base year for CO2 emissions from flights.
An independent third party, PricewaterhouseCoopers Oy, has provided limited assurance on sustainability information disclosed in Tieto's Annual Report 2018. The scope of the assured information is indicated
in the independent practitioner’s assurance report. In our view, third-party, independent assurance increases transparency and is key to delivering a high-quality report.
This report is also our annual Communication on Progress in accordance with the United Nations Global Compact requirements. It qualifies for the Global Compact Advanced level. Our integrated report and sustainability management report 2018 were published on 28 February 2018.
Sustainability contact: KIA HARING
Vice President Communications
and Sustainability
+358 40 765 3700
Twitter: @kiaharing
IDA BOHMAN STEENBERG
Head of Sustainability
+46 722 037 248
Twitter: @BohmanSteenberg
226Annual report 2018
Creating valueTieto 2018 Governance Financials Sustainability

Independent Practitioner’s Assurance Report SUSTAINABILITY
To the Management of Tieto Corporation
We have been engaged by the Management of Tieto Corporation (hereinafter also the Company) to perform a limited assurance engagement on selected sustainability disclosures for the reporting period 1 January to 31 December 2018, disclosed in Tieto Annual Report 2018. The assured information is indicated in the Company’s GRI Content Index 2018 (hereinafter Sustainability Information).
Management’s responsibility
The Management of Tieto Corporation is responsible for preparing the Sustainability Information in accordance with the Reporting criteria as set out in the Company’s reporting instructions and the GRI Sustainability Reporting Standards of the Global Reporting Initiative. The Management of Tieto Corporation is also responsible for such internal control as the management determines is necessary to enable the preparation of the Sustainability Information that is free from material misstatement, whether due to fraud or error.
Practitioner’s independence and quality control
We have complied with the independence and other ethical requirements of the Code of Ethics for Professional Accountants issued by the International Ethics Standards Board for Accountants, which is founded on fundamental principles of integrity, objectivity, professional
competence and due care, confidentiality and professional behaviour.
PricewaterhouseCoopers Oy applies International Standard on Quality Control 1 and accordingly maintains a comprehensive system of quality control including documented policies and procedures regarding compliance with ethical requirements, professional standards and applicable legal and regulatory requirements.
Practitioner’s responsibility
Our responsibility is to express a limited assurance conclusion on the Sustainability Information based on the procedures we have performed and the evidence we have obtained. Our assurance report has been prepared in accordance with the terms of our engagement. We do not accept, or assume responsibility to anyone else, except to Tieto Corporation for our work, for this report, or for the conclusions that we have reached.
We conducted our limited assurance engagement in accordance with the International Standard on Assurance Engagements (ISAE) 3000 “Assurance Engagements Other than Audits or Reviews of Historical Financial Information”. That standard requires that we plan and perform the engagement to obtain limited assurance about whether the Sustainability Information is free from material misstatement.
In a limited assurance engagement the evidence-gathering procedures are more limited than for a reasonable assurance engagement, and therefore less assurance is obtained than in a
227Annual report 2018
Creating valueTieto 2018 Governance Financials Sustainability

reasonable assurance engagement. An assurance engagement involves performing procedures to obtain evidence about the amounts and other disclosures in the Sustainability Information. The procedures selected depend on the practitioner’s judgement, including an assessment of the risks of material misstatement of the Sustainability Information.
Our work consisted of, amongst others, the following procedures: • Interviewing senior management of the Company;• Visiting the Company’s Head Office in Finland as well as one site in Finland;• Conducting one video interview with site in China;• Interviewing employees responsible for collecting and reporting the Sustainability
Information at the Group level and at the site level where our site visits took place;• Assessing how Group employees apply the Company’s reporting instructions and
procedures;• Testing the accuracy and completeness of the information from original documents and
systems on a sample basis;• Testing the consolidation of information and performing recalculations on a sample basis.
Limited assurance conclusion
Based on the procedures we have performed and the evidence we have obtained, nothing has come to our attention that causes us to believe that Tieto Corporation’s Sustainability Information for the reporting period ended 31 December 2018 is not properly prepared, in all material respects, in accordance with the Reporting criteria.
When reading our assurance report, the inherent limitations to the accuracy and completeness of corporate responsibility information should be taken into consideration. Helsinki, 26 February 2019PricewaterhouseCoopers Oy
SIRPA JUUTINEN JUSSI NOKKALA
Partner DirectorSustainability & Climate Change Sustainability & Climate Change
228Annual report 2018
Creating valueTieto 2018 Governance Financials Sustainability

Disclosure Disclosure title Link and reference Tieto area and number UNGC Externally assured
GRI 102: GENERAL DISCLOSURES 2016
Organizational profile
102-1 Name of the organization Tieto in brief COP report profile
102-2 Activities, brands, products and services Tieto in brief COP report profile
102-3 Location of headquarters Tieto in brief COP report profile
102-4 Location of operations Tieto in brief, Markets COP report profile
102-5 Ownership and legal form Tieto in brief COP report profile
102-6 Markets served Markets COP report profile
102-7 Scale of the organization Tieto in brief, Markets COP report profile
102-8 Information on employees and other workers Creating value for employeesPrinciple 6, COP report profile x
102-9 Supply chain Sustainable supply chainCriteria 2, COP report profile
102-10 Significant changes of the organizationStategy and operating model, Shares and shareholders, Sustainable supply chain
Criteria 2, COP report profile
102-11 Precautionary principle Our approach to sustainabilty
102-12 External initiatives Our approach to sustainabilty
102-13 Memberships of associations Our approach to sustainabilty
Strategy
102-14 Statement from senior decision-maker CEO statement Criteria 19
102-15 Key impacts, risks and opportunitiesNFI, Sustainability opportunities and risks, Sustainabilty 2020 plan
Ethics and integrity
102-16Values, principles, standards and norms of behaviour
Ethical culture, Managing sustainability Criteria 12-14, Principle 10
GRI content index table
229Annual report 2018
Creating valueTieto 2018 Governance Financials Sustainability

Disclosure Disclosure title Link and reference Tieto area and number UNGC Externally assured
Governance
102-18 Governance structure Corporate governance statement Criteria 20
102-20Executive-level responsible for economic, environmental and social topics
Managing sustainability Criteria 1, 20
102-21Consulting stakeholders on economic, environmental and social topics
Corporate governance statement, Stakeholder dialogue, Managing sustainability, Materiality analysis
Criteria 1, 20
102-23 Chair of the highest governance body Corporate governance statement Criteria 1, 20
102-32 Highest governance body's role in sustainabilityManaging sustainability, Independent assurance report
Criteria 1, 20
Stakeholder engagement
102-40 List of stakeholder groupsStakeholder relations and materiality mapping
Criteria 21
102-41 Collective bargaining agreements Creating value for employees COP report profile X
102-42 Identifying and selecting stakeholders Stakeholder relations Criteria 21
102-43 Approach to stakeholder engagement Stakeholder relations Criteria 21
102-44 Key topics and concerns raisedStakeholder relations and materiality mapping
Criteria 21
Reporting practice
102-45Entities included in the consolidated financial statements
About sustainability reporting
102-46 Defining report content and topic boundariesMateriality analysis, About sustainability reporting
102-47 List of material topics Materiality analysis
102-48 Restatement of information About sustainability reporting
102-49 Changes in the report About sustainability reporting
102-50 Reporting period About sustainability reporting COP reporting profile
102-51 Date of most recent previous report About sustainability reporting COP reporting profile
102-52 Reporting cycle About sustainability reporting COP reporting profile
102-53 Contact point for the report About sustainability reporting COP reporting profile
102-54Claims for reporting in accordance with the GRI standards
About sustainability reporting COP reporting profile
102-55 GRI content index GRI content index
230Annual report 2018
Creating valueTieto 2018 Governance Financials Sustainability

Disclosure Disclosure title Link and reference Tieto area and number UNGC Externally assured
102-56 External assurance Independent assurance report COP assurance
MATERIAL TOPICS, MANAGEMENT APPROACH AND DISCLOSURES
GRI 200: Economic standard series
GRI 201: Economic performance 2016
103-1 Explanation of the material topic and its Boundary
Sustainabilty 2020 plan, Materiality analysis, Economic impact
8: Financial performance Criteria 15-18, Principle 1-9
103-2 The management approach and its components
Sustainabilty 2020 plan, Economic impact 8: Financial performance Criteria 15-18, Principle 1-10
103-3 Evaluation of the management approach Sustainabilty 2020 plan, Economic impact 8: Financial performance Criteria 15-18, Principle 1-11
201-1Direct economic value generated and distributed
Economic impact 8: Financial performance Criteria 9-11
201-4 Financial assistance received from government Economic impact 8: Financial performance Criteria 9-11
GRI 205: Anti-corruption 2016
103-1 Explanation of the material topic and its Boundary
Sustainabilty 2020 plan, Materiality analysis, Ethical culture
1: Ethical culture Criteria 15-18, Principle 1-9
103-2 The management approach and its components
Sustainabilty 2020 plan, Ethical culture 1: Ethical culture Criteria 15-18, Principle 1-10
103-3 Evaluation of the management approach Sustainabilty 2020 plan, Ethical culture 1: Ethical culture Criteria 15-18, Principle 1-11
205-1Operations assessed for risks related to corruption
Ethical culture 1: Ethical culture Criteria12-14, Principle 10 X
205-3Confirmed incidents of corruption and actions taken
Ethical culture 1: Ethical culture Criteria12-14, Principle 10 X
GRI 300: Environmental standard series
GRI 302: Energy 2016
103-1 Explanation of the material topic and its Boundary
Sustainabilty 2020 plan, Materiality analysis, Greenhouse gas emissions
4: Greenhouse gas emissions Criteria 15-18, Principle 1-9
103-2 The management approach and its components
Sustainabilty 2020 plan, Greenhouse gas emissions
4: Greenhouse gas emissions Criteria 15-18, Principle 1-10
103-3 Evaluation of the management approachSustainabilty 2020 plan, Greenhouse gas emissions
4: Greenhouse gas emissions Criteria 15-18, Principle 1-11
231Annual report 2018
Creating valueTieto 2018 Governance Financials Sustainability

Disclosure Disclosure title Link and reference Tieto area and number UNGC Externally assured
302-1 Energy consumption within the organization Greenhouse gas emissions 4: Greenhouse gas emissions Criteria 9-11, Principle 7 X
GRI 305: Emissions 2016
103-1 Explanation of the material topic and its Boundary
Sustainabilty 2020 plan, Materiality analysis, Greenhouse gas emissions
4: Greenhouse gas emissions Criteria 15-18, Principle 1-7
103-2 The management approach and its components
Sustainabilty 2020 plan, Greenhouse gas emissions
4: Greenhouse gas emissions Criteria 15-18, Principle 1-8
103-3 Evaluation of the management approachSustainabilty 2020 plan, Greenhouse gas emissions
4: Greenhouse gas emissions Criteria 15-18, Principle 1-9
305-1 Direct (Scope 1) GHG emissions Greenhouse gas emissions 4: Greenhouse gas emissions Criteria 9-11, Principle 7 X
305-2 Energy indirect (Scope 2) GHG emissions Greenhouse gas emissions 4: Greenhouse gas emissions Criteria 9-11, Principle 7 X
305-3 Other indirect (Scope 3) GHG emissions Greenhouse gas emissions 4: Greenhouse gas emissions Criteria 9-11, Principle 7 X
GRI 400: Social standard series
GRI 401: Employment 2016
103-1 Explanation of the material topic and its Boundary
Sustainabilty 2020 plan, Materiality analysis, Creating value for employees
103-2 The management approach and its components
Sustainabilty 2020 plan, Creating value for employees
103-3 Evaluation of the management approachSustainabilty 2020 plan, Creating value for employees
Criteria 15-18, Principle 1-9
401-1Total number and rates of new employee hires and employee turnover
Creating value for employees Principle 6 X
GRI 405: Diversity and equal opportunities 2016
103-1 Explanation of the material topic and its Boundary
Sustainabilty 2020 plan, Materiality analysis, Creating value for employees, Equal opportunities
7: Equal opportunities Criteria 15-18, Principle 1-7
103-2 The management approach and its components
Sustainabilty 2020 plan, Creating value for employees, Equal opportunities
7: Equal opportunities Criteria 15-18, Principle 1-8
103-3 Evaluation of the management approachSustainabilty 2020 plan, Creating value for employees, Equal opportunities
7: Equal opportunities Criteria 15-18, Principle 1-9
232Annual report 2018
Creating valueTieto 2018 Governance Financials Sustainability

Disclosure Disclosure title Link and reference Tieto area and number UNGC Externally assured
405-1 Diversity of governance bodies and employees Equal opportunities 7: Equal opportunities Principle 6 X
GRI 406: Non-discrimination 2016
103-1 Explanation of the material topic and its Boundary
Sustainabilty 2020 plan, Materiality analysis, Equal opportunities
7: Equal opportunities Criteria 15-18, Principle 1-7
103-2 The management approach and its components
Sustainabilty 2020 plan, Equal opportunities
7: Equal opportunities Criteria 15-18, Principle 1-8
103-3 Evaluation of the management approachSustainabilty 2020 plan, Equal opportunities
7: Equal opportunities Criteria 15-18, Principle 1-9
406-1Incidents of discrimination and corrective actions taken
Equal opportunities 7: Equal opportunities Criteria 3-5, Principle 6 X
GRI 418: Customer privacy 2016
103-1 Explanation of the material topic and its Boundary
Sustainabilty 2020 plan, Materiality analysis, Information security and data privacy
3: Information security and data privacy
103-2 The management approach and its components
Sustainabilty 2020 plan, Information security and data privacy
3: Information security and data privacy
103-3 Evaluation of the management approachSustainabilty 2020 plan, Information security and data privacy
3: Information security and data privacy
418-1Sustantiated complaints regarding breaches of customer privacy and losses of customer data
Information security and data privacy
3: Information security and data privacy
X
TIETO SPECIFIC DISCLOSURES
Ethical culture
103-1 Explanation of the material topic and its Boundary
Sustainabilty 2020 plan, Materiality analysis, Ethical culture
1. Ethical culture Criteria 15-18, Principle 1-7
103-2 The management approach and its components
Sustainabilty 2020 plan, Ethical culture 1. Ethical culture Criteria 15-18, Principle 1-8
103-3 Evaluation of the management approach Sustainabilty 2020 plan, Ethical culture 1. Ethical culture Criteria 15-18, Principle 1-9
Tieto 1.1 Code of Conduct training coverage Ethical culture 1. Ethical culture Criteria 12-14, Principle 10 X
233Annual report 2018
Creating valueTieto 2018 Governance Financials Sustainability
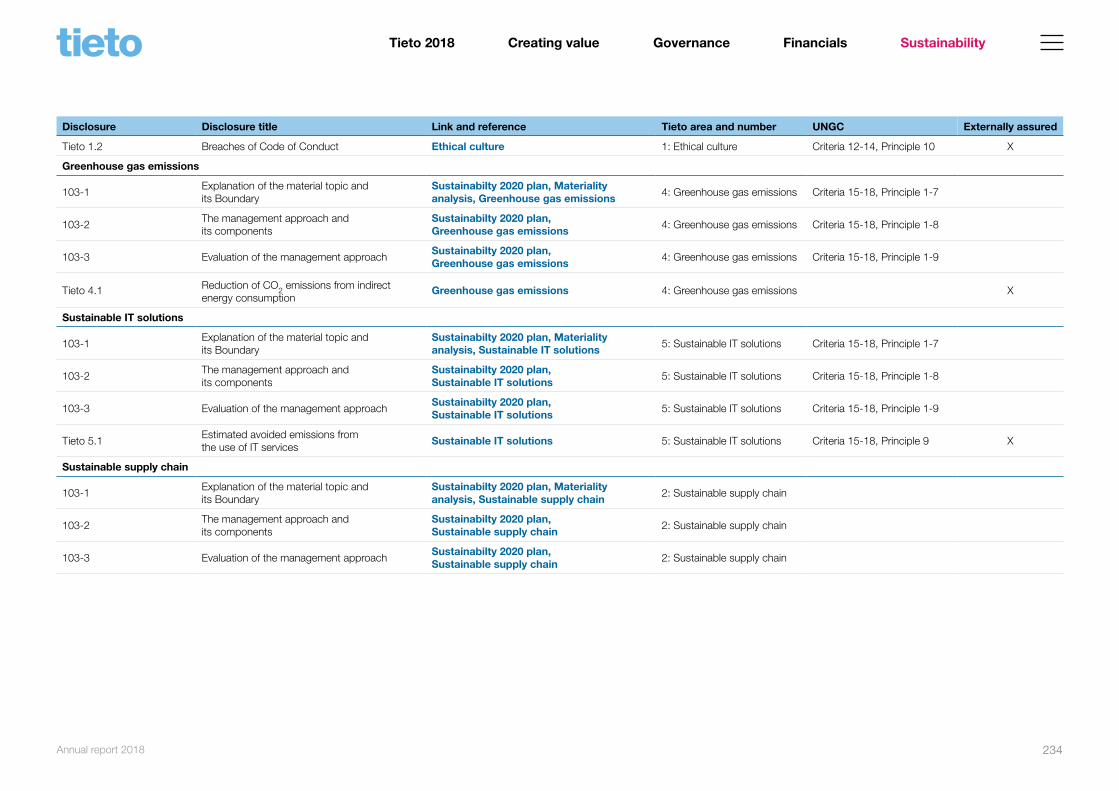
Disclosure Disclosure title Link and reference Tieto area and number UNGC Externally assured
Tieto 1.2 Breaches of Code of Conduct Ethical culture 1: Ethical culture Criteria 12-14, Principle 10 X
Greenhouse gas emissions
103-1 Explanation of the material topic and its Boundary
Sustainabilty 2020 plan, Materiality analysis, Greenhouse gas emissions
4: Greenhouse gas emissions Criteria 15-18, Principle 1-7
103-2 The management approach and its components
Sustainabilty 2020 plan, Greenhouse gas emissions
4: Greenhouse gas emissions Criteria 15-18, Principle 1-8
103-3 Evaluation of the management approachSustainabilty 2020 plan, Greenhouse gas emissions
4: Greenhouse gas emissions Criteria 15-18, Principle 1-9
Tieto 4.1 Reduction of CO2 emissions from indirect energy consumption
Greenhouse gas emissions 4: Greenhouse gas emissions X
Sustainable IT solutions
103-1 Explanation of the material topic and its Boundary
Sustainabilty 2020 plan, Materiality analysis, Sustainable IT solutions
5: Sustainable IT solutions Criteria 15-18, Principle 1-7
103-2 The management approach and its components
Sustainabilty 2020 plan, Sustainable IT solutions
5: Sustainable IT solutions Criteria 15-18, Principle 1-8
103-3 Evaluation of the management approachSustainabilty 2020 plan, Sustainable IT solutions
5: Sustainable IT solutions Criteria 15-18, Principle 1-9
Tieto 5.1Estimated avoided emissions from the use of IT services
Sustainable IT solutions 5: Sustainable IT solutions Criteria 15-18, Principle 9 X
Sustainable supply chain
103-1 Explanation of the material topic and its Boundary
Sustainabilty 2020 plan, Materiality analysis, Sustainable supply chain
2: Sustainable supply chain
103-2 The management approach and its components
Sustainabilty 2020 plan, Sustainable supply chain
2: Sustainable supply chain
103-3 Evaluation of the management approachSustainabilty 2020 plan, Sustainable supply chain
2: Sustainable supply chain
234Annual report 2018
Creating valueTieto 2018 Governance Financials Sustainability

Disclosure Disclosure title Link and reference Tieto area and number UNGC Externally assured
Tieto 2.1% ratio of new or renewed suppliers agreeing to Tieto's Supplier Code of Conduct
Sustainable supply chain 2: Sustainable supply chain X
Employee experience
103-1 Explanation of the material topic and its Boundary
Sustainabilty 2020 plan, Materiality analysis, Employee experience
6: Employee experience
103-2 The management approach and its components
Sustainabilty 2020 plan, Employee experience
6: Employee experience
103-3 Evaluation of the management approachSustainabilty 2020 plan, Employee experience
6: Employee experience
Tieto 6.1% of employees being always or often stressed and not being able to recover
Not measured in 2018 due to changes in measuring frequency.
6: Employee experience X
Tieto 6.2 Employee engagement index Employee experience 6: Employee experience X
Customer experience
103-1 Explanation of the material topic and its Boundary
Sustainabilty 2020 plan, Materiality analysis, Customer experience
9: Customer experience
103-2 The management approach and its components
Sustainabilty 2020 plan, Customer experience
9: Customer experience
103-3 Evaluation of the management approachSustainabilty 2020 plan, Customer experience
9: Customer experience
Tieto 9.1 Relationship Net Promoter Score (rNPS) Customer experience 9: Customer experience X
Tieto 9.2 Customer eXperience Index (CXI) Customer experience 9: Customer experience X
235Annual report 2018
Creating valueTieto 2018 Governance Financials Sustainability

Contact UsTieto CorporationKeilalahdentie 2-4P.O.Box P.O.Box 2, 02101FI-02150 Espoowww.tieto.com
Annual report 2018


