12

P r i n t e d i n J a p a n
Annual Report 2020F i s c a l y e a r e n d e d M a r c h 3 1 , 2 0 2 0
浜松いわた信用金庫_アニュアルレポート表紙A4_H1表4_C

TokyoHamamatsu
Shizuoka Prefecture
Nagoya
Kyoto
Osaka
1 2
HAMAMATSU IWATA SHINKIN BANK Annual Report 2020
Outline of Hamamatsu Iwata Shinkin Bank (As of March 31, 2020)
Head Offi ce: 114-8 Motoshiro-cho, Naka-ku, Hamamatsu, Shizuoka 430-0946, JapanEstablished: April 10, 1950 Deposits: ¥2,475 billion (including certifi cates of deposit) Loans and Bills Discounted: ¥1,229 billionShare Capital: ¥2.34 billion (120,208members)
Number of Employees: Hamamatsu Iwata Shinkin Bank (non-consolidated): 1,828Hamamatsu Iwata Shinkin Bank Group (total): 1,924Number of Branches:88 branches and 79 external ATM corners
Principal Business Operations: Deposits, loans, investments in marketable securities, domestic exchange, foreign exchange, corporate bonds underwriting and registration, incidental services
Business Region:Shizuoka PrefectureHamamatsu City, Iwata City, Fukuroi City, Kosai City, Kakegawa City, Omaezaki City, Kikugawa City, Makinohara City, Shimada City (ex Kawane-cho is excluded), Shuchi-gun, Yoshida-cho (Haibara-gun)Aichi PrefectureToyohashi City, Kitashitara-gun(ex Shitara-cho is excluded)
Overseas Offi ce:Bangkok Representative Offi ce
Established in 1950, Hamamatsu Iwata Shinkin Bank (the Bank) is a shinkin bank headquartered in Naka-ku of Hamamatsu City in Shizuoka Prefecture. With western Shizuoka Prefecture, centering on Hamamatsu, as its business area, Hamamatsu Iwata Shinkin Bank ranks number one in terms of the volume of deposits and loans among the nine shinkin banks within Shizuoka Prefecture. Western Shizuoka Prefecture is situated in the geographic center of Japan and is noted for its mild climate, attributes that have helped spur the development of a diverse range of industries in the region over many years. Renowned as
the birthplace of such leading companies as Suzuki Motor Corporation, Yamaha Corporation and Honda Motor Co., Ltd., this region has witnessed the development of such industries as the automobile, musical instruments and machinery and metals industries, and has supported Japan’s economy as a manufacturing hub. Hamamatsu, the location of our Head Offi ce, is also home to numerous manufacturing plants and has attracted a large number of expat workers from overseas countries, which gives the city a rich international fl avor.
About Hamamatsu Iwata Shinkin Bank
Management Philosophy
The Management Philosophy clearly states the core values of Hamamatsu Iwata Shinkin Bank. The philosophy, declared both internally and externally, represents the Bank’s missions and business objectives and serves as action guidelines for our employees and directors. We have formulated the Management Philosophy so that all employees and directors fully understand its intent and act toward its realization.
For customersWe walk side by side with customers toward a bright future, regarding their happiness
as our own happiness.
For local communitiesWe create new value and contribute to
community vitalization.
Social responsibilities (CSR, the SDGs and ESG)
We undertake fair and sound management and help to create a sustainable society.
For employees and directors
We continue to spur change and take on challenges in seeking to become a vibrant organization.
Management Philosophy

1 2
HAMAMATSU IWATA SHINKIN BANK Annual Report 2020
The shinkin bank is a fi nancial institution that operates within a limited area and serves local residents and small- and medium-sized enterprises in the area. Unlike a commercial bank, which is a joint stock company, it is a cooperative fi nancial institution operating with capital contributions from its members and
under the fundamental principle of being not-for-profi t and pro-viding mutual cooperation and solidarity.Working closely with local communities and acting fi rst and foremost for the promotion of regional development is what the shinkin bank does and our raison d’etre.
What Is the Shinkin Bank?
About Shinkin Central Bank
* Total assets, the capital adequacy ratio (non-consolidated) and the ratio of bad loans are as of March 31, 2020.
Overseas Business Support ServicesOverseas Business Support Center Bangkok Representative Office
In January 2014, Hamamatsu Iwata Shinkin Bank opened a rep-resentative offi ce in Bangkok, Thailand, a city expected to serve as a business hub in Asia. The offi ce provides various support services, including providing information on Thailand and neighboring countries, assist-ing with site visits and provid-ing referrals to local experts and supporting organizations.
The Overseas Business Support Center collaborates with such external support organizations as the Japan External Trade Orga-nization (JETRO), local governments and Shinkin Central Bank (SCB) to offer overseas business support services matched to customer needs. Our service lineup includes providing informa-tion on local business and other conditions and assisting in the formulation of plans for setting up operations overseas.
Shinkin Central Bank (SCB), established in 1950, is a cooperative fi nancial institution serving as the central bank for shinkin banks in Japan. Its name was changed from the Zenshinren Bank to Shinkin Central Bank on October 1, 2000, and its preferred shares were listed on the Tokyo Stock Exchange on December 22 of the same year.SCB is one of the largest and healthiest fi nancial institutions in Japan, with total assets amounting to ¥40.6 trillion, the capital adequacy ratio (non-con-solidated, domestic standard) standing at 24.31% and the ratio of bad loans standing at 0.26%. It is also one of the few fi nancial institutions to issue debentures. SCB works closely together with its member shinkin banks while assuming three roles, specifi cally as the central bank of shinkin banks, as an institutional investor and as a regional fi nancial institution.
Name Shinkin Central Bank
Established June 1, 1950
Number of Employees and Full-Time Directors
1,223 (including 13 full-time directors)
Network Domestic: 14; Overseas: 5*
Total Assets ¥40,633.2 billion
Paid-in Capital ¥690.9 billion
Capital Adequacy Ratio 24.31%(non-consolidated, domestic standard)
Number of Member Shinkin Banks 255
* Including Shinkin International Ltd. (As of March 31, 2020)
� Corporate Data of Shinkin Central Bank
Phloen Chit Sta.
Chit Lom Sta.Skytrain (BTS) Silom Line
Japanese Chamber of Commerce
Japanese Embassy
Royal Bangkok Sports Club Racetrack
Lumphini Park
Lumphini Sta.
Silom Sta.Sala Daeng Sta.
Ratchadamri Sta.
Rachadamri Road
Wireless Road
Chalerm M
ahanakhon
Expressway
Bangkok Representative Office Location
19F, Athenee Tower
Number of support cases for overseas business advancement and trade: 192
Hamamatsu Iwata Shinkin Bank’s Network in Asia
Hamamatsu Iwata Shinkin Bank Overseas Business Support Center
SCB: Shanghai Representative Office
SCB: Hong Kong Representative Office
SCB: Temporary assignment to BDO Unibank
SCB: Temporary assignment to Bank for Investment and Development in Vietnam, stationed in Ho Chi Minh
SCB: Temporary assignment to Jetro Kuala Lampur
Hamamatsu Iwata Shinkin Bank:Temporary assignmentto Maybank Indonesia
Partner bank: Maybank Indonesia
SCB: Temporary assignmentto Maybank Indonesia
Hamamatsu Iwata Shinkin Bank:Bangkok Representative Office
SCB:Bangkok Representative OfficeTemporary assignment to Bangkok Bank
Partner bank: Metrobank of Philippines
Partner bank: Vietcombank
Partner bank:State Bank of India
Address: 19th Floor, 1901, Athenee Tower, 63 Wireless Road, Lumpini, Pathumwan, Bangkok 10330, ThailandTEL: +66-(0)2-168-8303 FAX: +66-(0)2-168-8305
Bangkok Representative Offi ce
Food Japan in Singapore 2019
3 4
HAMAMATSU IWATA SHINKIN BANK Annual Report 2020
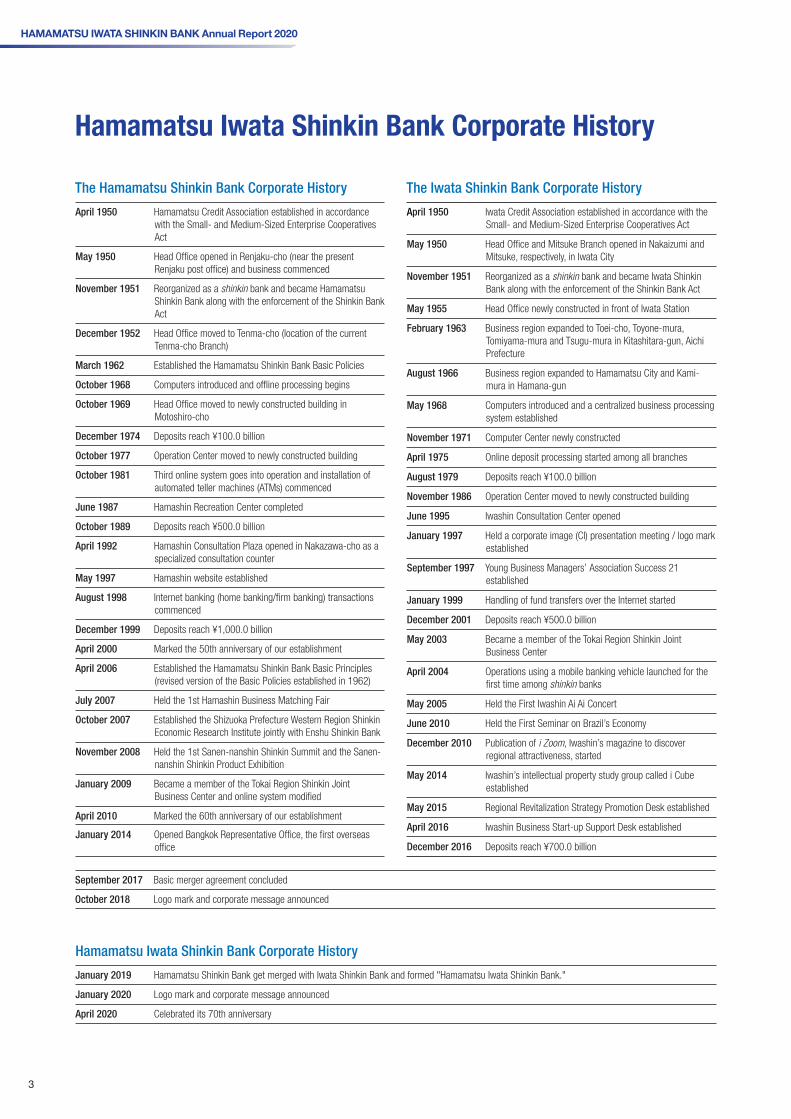
Hamamatsu Iwata Shinkin Bank Corporate History
April 1950 Hamamatsu Credit Association established in accordance with the Small- and Medium-Sized Enterprise Cooperatives Act
May 1950 Head Office opened in Renjaku-cho (near the present Renjaku post office) and business commenced
November 1951 Reorganized as a shinkin bank and became Hamamatsu Shinkin Bank along with the enforcement of the Shinkin Bank Act
December 1952 Head Office moved to Tenma-cho (location of the current Tenma-cho Branch)
March 1962 Established the Hamamatsu Shinkin Bank Basic Policies
October 1968 Computers introduced and offline processing begins
October 1969 Head Office moved to newly constructed building in Motoshiro-cho
December 1974 Deposits reach ¥100.0 billion
October 1977 Operation Center moved to newly constructed building
October 1981 Third online system goes into operation and installation of automated teller machines (ATMs) commenced
June 1987 Hamashin Recreation Center completed
October 1989 Deposits reach ¥500.0 billion
April 1992 Hamashin Consultation Plaza opened in Nakazawa-cho as a specialized consultation counter
May 1997 Hamashin website established
August 1998 Internet banking (home banking/firm banking) transactions commenced
December 1999 Deposits reach ¥1,000.0 billion
April 2000 Marked the 50th anniversary of our establishment
April 2006 Established the Hamamatsu Shinkin Bank Basic Principles (revised version of the Basic Policies established in 1962)
July 2007 Held the 1st Hamashin Business Matching Fair
October 2007 Established the Shizuoka Prefecture Western Region Shinkin Economic Research Institute jointly with Enshu Shinkin Bank
November 2008 Held the 1st Sanen-nanshin Shinkin Summit and the Sanen-nanshin Shinkin Product Exhibition
January 2009 Became a member of the Tokai Region Shinkin Joint Business Center and online system modified
April 2010 Marked the 60th anniversary of our establishment
January 2014 Opened Bangkok Representative Office, the first overseas office
The Hamamatsu Shinkin Bank Corporate History
April 1950 Iwata Credit Association established in accordance with the Small- and Medium-Sized Enterprise Cooperatives Act
May 1950 Head Office and Mitsuke Branch opened in Nakaizumi and Mitsuke, respectively, in Iwata City
November 1951 Reorganized as a shinkin bank and became Iwata Shinkin Bank along with the enforcement of the Shinkin Bank Act
May 1955 Head Office newly constructed in front of Iwata Station
February 1963 Business region expanded to Toei-cho, Toyone-mura, Tomiyama-mura and Tsugu-mura in Kitashitara-gun, Aichi Prefecture
August 1966 Business region expanded to Hamamatsu City and Kami-mura in Hamana-gun
May 1968 Computers introduced and a centralized business processing system established
November 1971 Computer Center newly constructed
April 1975 Online deposit processing started among all branches
August 1979 Deposits reach ¥100.0 billion
November 1986 Operation Center moved to newly constructed building
June 1995 Iwashin Consultation Center opened
January 1997 Held a corporate image (CI) presentation meeting / logo mark established
September 1997 Young Business Managers’ Association Success 21 established
January 1999 Handling of fund transfers over the Internet started
December 2001 Deposits reach ¥500.0 billion
May 2003 Became a member of the Tokai Region Shinkin Joint Business Center
April 2004 Operations using a mobile banking vehicle launched for the first time among shinkin banks
May 2005 Held the First Iwashin Ai Ai Concert
June 2010 Held the First Seminar on Brazil’s Economy
December 2010 Publication of i Zoom, Iwashin’s magazine to discover regional attractiveness, started
May 2014 Iwashin’s intellectual property study group called i Cube established
May 2015 Regional Revitalization Strategy Promotion Desk established
April 2016 Iwashin Business Start-up Support Desk established
December 2016 Deposits reach ¥700.0 billion
The Iwata Shinkin Bank Corporate History
January 2019 Hamamatsu Shinkin Bank get merged with Iwata Shinkin Bank and formed "Hamamatsu Iwata Shinkin Bank."
January 2020 Logo mark and corporate message announced
April 2020 Celebrated its 70th anniversary
Hamamatsu Iwata Shinkin Bank Corporate History
September 2017 Basic merger agreement concluded
October 2018 Logo mark and corporate message announced

3 4
HAMAMATSU IWATA SHINKIN BANK Annual Report 2020
Board of Directors
Senior Managing Director
President
Managing Director
Deputy President
Director
General Members’ Meeting
Management Committee
Board of Corporate Auditors
Corporate Auditor
Organization Chart As of July 1, 2020
General Planning DepartmentStrategic Planning Division
Accounting Department
Legal Risk Management Department
Risk Management Department
Secretarial Office
IT Strategic Planning Office
AML Office
Property Administration Department
Career Development Department
Fund & Securities Administration Department
General Affairs DepartmentGeneral Affairs Division
Human Resource Department
Treasury & Securities Department
Mental Health Consultation Office
Bangkok Representative OfficeInternational Department
Operations Department ⅠOperations Division
Systems Division
Operations Department Ⅱ
Planning & Development Department
Operation & Administration Department
Branch Strategy Office
Branch Management DepartmentBranch Management Division
Customer Service Department
Corporate Strategy Department
Regional Business Development Department
Retail-Banking Department
Retail-Banking Division Custody Assets Management Department
Consultation and Support Plaza
Corporate Credit DepartmentCredit Supervision Division
Personal Credit Department
Credit Assessment Department
Credit Monitoring Department
Business Operations Department
Business Support Department
Loan Operations Department
Business Support Division
Operations Support Division
New Business Creation Office
Committees and others
Risk Management Division
Life Design Division
HR Division
Treasury & Securities Division
Internal Audit Division
Corporate Business Division
SDGs Planning DepartmentSDGs Promotion Division
Community Contributions Department
Area Planning & Business Support Office
Board of Directors and Corporate Auditors As of July 1, 2020
*1 Shinichi Horisaki and Hideto Tago are outside directors appointed as provided for in the Industrial Agreement on Measures to Improve the Functionality of General Members’ Meeting adopted within the shinkin bank industry.
*2 Naoko Tatsumi is an outside corporate auditor appointed as provided for in Article 32-5 of the Shinkin Bank Act.
President Kenichiro Mimuro Deputy President Hirohisa TakayanagiSenior Managing Director Masahiko TsujimuraSenior Managing Director Seidai HiraiManaging Director Masanori TakahashiManaging Director Toshiharu SuzukiManaging Director Mutsumi MuramatsuDirector Hisao Miwa
Director Toru SatoDirector Tomoo TakahashiDirector Kazuhiro HashishitaDirector Hiroaki MatsushimaDirector Shinichi Horisaki*1Director Hiroyasu HanbaDirector Takahiko ShimizuDirector Masayuki Sano
Director Michio InagakiDirector Shoji SatoDirector Hideto Tago*1
Standing Corporate Auditor Yasuyuki KawaguchiStanding Corporate Auditor Masataka ShimaokaCorporate Auditor Kenichi SuzukiCorporate Auditor Naojiro SuzukiCorporate Auditor Naoko Tatsumi*2
Liaison Desk
Customer Support Desk
Loan Consultation DeskBranch

5 6
HAMAMATSU IWATA SHINKIN BANK Annual Report 2020
We posted net income of ¥1.8 billion, and net business profit, which is obtained through our main business, amounted to ¥5.5 billion.
Business Results
FY2020FY2018 FY2019
1,606,3511,665,632
2,414,331
500,000
0
1,000,000
1,500,000
2,000,000
2,500,000Millions of yen
Millions of yen
FY2020FY2018 FY20190
2,000
3,000
1,000
4,000
3,124
2,796
1,891
Millions of yen
FY2020FY2018 FY20190
3,000
6,000
4,500
1,500
4,667
4,2233,999
Millions of yen
FY2020FY2018 FY20190
3,000
6,000
4,500
1,500
4,628 4,445
5,580
1,665,632
2,414,3312,475,318
FY2020FY2018 FY2019
300,000
0
600,000
900,000
1,200,000
1,500,000Millions of yen
904,423
1,228,725 1,229,007
■Net income
Growth in profits
FY2020FY2018 FY2019
1,606,3511,665,632
2,414,331
500,000
0
1,000,000
1,500,000
2,000,000
2,500,000Millions of yen
Millions of yen
FY2020FY2018 FY20190
2,000
3,000
1,000
4,000
3,124
2,796
1,891
Millions of yen
FY2020FY2018 FY20190
3,000
6,000
4,500
1,500
4,667
4,2233,999
Millions of yen
FY2020FY2018 FY20190
3,000
6,000
4,500
1,500
4,628 4,445
5,580
1,665,632
2,414,3312,475,318
FY2020FY2018 FY2019
300,000
0
600,000
900,000
1,200,000
1,500,000Millions of yen
904,423
1,228,725 1,229,007
Balance of deposits (including certificates of deposit)
The data for fiscal 2018 represents the figures of the former Hamamatsu Shinkin Bank.
FY2020FY2018 FY2019
1,606,3511,665,632
2,414,331
500,000
0
1,000,000
1,500,000
2,000,000
2,500,000Millions of yen
Millions of yen
FY2020FY2018 FY20190
2,000
3,000
1,000
4,000
3,124
2,796
1,891
Millions of yen
FY2020FY2018 FY20190
3,000
6,000
4,500
1,500
4,667
4,2233,999
Millions of yen
FY2020FY2018 FY20190
3,000
6,000
4,500
1,500
4,628 4,445
5,580
1,665,632
2,414,3312,475,318
FY2020FY2018 FY2019
300,000
0
600,000
900,000
1,200,000
1,500,000Millions of yen
904,423
1,228,725 1,229,007
Balance of loans and bills discounted
The data for fiscal 2018 represents the figures of the former Hamamatsu Shinkin Bank.
FY2020FY2018 FY2019
1,606,3511,665,632
2,414,331
500,000
0
1,000,000
1,500,000
2,000,000
2,500,000Millions of yen
Millions of yen
FY2020FY2018 FY20190
2,000
3,000
1,000
4,000
3,124
2,796
1,891
Millions of yen
FY2020FY2018 FY20190
3,000
6,000
4,500
1,500
4,667
4,2233,999
Millions of yen
FY2020FY2018 FY20190
3,000
6,000
4,500
1,500
4,628 4,445
5,580
1,665,632
2,414,3312,475,318
FY2020FY2018 FY2019
300,000
0
600,000
900,000
1,200,000
1,500,000Millions of yen
904,423
1,228,725 1,229,007
■Net business profit
The data for fiscal 2018 represents the figures of the former Hamamatsu Shinkin Bank.
FY2020FY2018 FY2019
1,606,3511,665,632
2,414,331
500,000
0
1,000,000
1,500,000
2,000,000
2,500,000Millions of yen
Millions of yen
FY2020FY2018 FY20190
2,000
3,000
1,000
4,000
3,124
2,796
1,891
Millions of yen
FY2020FY2018 FY20190
3,000
6,000
4,500
1,500
4,667
4,2233,999
Millions of yen
FY2020FY2018 FY20190
3,000
6,000
4,500
1,500
4,628 4,445
5,580
1,665,632
2,414,3312,475,318
FY2020FY2018 FY2019
300,000
0
600,000
900,000
1,200,000
1,500,000Millions of yen
904,423
1,228,725 1,229,007
■Ordinary profit
The data for fiscal and 2018 represents the figures of the former Hamashin.
The data for fiscal 2018 represents the figures of the former Hamamatsu Shinkin Bank.

5 6
HAMAMATSU IWATA SHINKIN BANK Annual Report 2020
Our non-consolidated capital adequacy ratio was 13.78% as of the end of March 2020, which markedly surpassed 4.00% of the domestic standard of financial institutions operating in Japan and signifies sound management. Soundness is also evidenced by the majority of shareholders’ equity comprised of a reserve for retained earnings from profits.
Non-Consolidated Capital Adequacy Ratio
Risk-monitored loans are loans with a high risk of turning into bad loans due to such factors as a drop in earnings of borrowers. They represent assets for financial institutions.In fiscal 2020, risk-monitored loans totaled ¥67,473 million, which accounted for 5.49% of total loans and bills discounted. Additionally, the coverage ratio due to collateral and guarantees and reserve for possible loan losses was 86.7%.
Risk-Monitored Loans for Fiscal 2020
* Amount covered by collateral and guarantees includes loans to bankrupt borrowers, delinquent loans, specific reserve as well as general reserve for loans past due three months or more and restructured loans.
We also acquired an upper rank “A” in issuer ratings for fiscal 2020 from Rating and Investment Information, Inc. (R&I), which is a rating institution. The current rank was received in recogni-tion of our enhanced shareholders’ equity, financial stability, finely tuned customer response capabilities and other relevant aspects.
Hamamatsu Iwata Shinkin Bank’s Ratings
R&I Rating Symbols and Definitions(Issuer Rating)Highest creditworthiness supported by many excellent factors.
Creditworthiness is suf�cient, though some factors require attention in times of major environmental changes.
An obligation is in default or highly likely to default. The obligation in default may only be partially recovered.
An obligation is in default or likely to default. The obligation in default may not be recovered in full.
Creditworthiness is questionable and some factors require constant attention.
Creditworthiness is suf�cient for the time being, though some factors require due attention in times of environmental changes.
Very high creditworthiness supported by some excellent factors.
An obligation is in default and may hardly be recovered.
High creditworthiness supported by a few excellent factors.
D
Ratings Ratings are carried out by rating institutions as a means of ranking whether or not the payment of principal and interest of bonds and deposits are made to investors and/or depositors according to respective agreements or to rank the level of security and credit rating of a company from a fair standpoint.
Risk-monitored loansRisk-monitored loans are loans and bills discounted (assets for financial institutions) for which borrowers may not be able to pay back due to various reasons such as the deterioration of business condition. In this respect, in tandem with the FSA’s Financial Inspection Manual, we promote initiatives to comprehend the status of borrowers and appropriately conducts write-offs or transfer to a reserve for possible loan losses through a strict and fair asset assessment.
Capital adequacy ratio The capital adequacy ratio indicates the percentage of capital among total credit risk assets and is a representative indicator of factors that include the security and soundness of management as well as corporate vitality (resistance to risk). The capital adequacy ratio serves as the benchmark for the Financial Services Agency (FSA) to make official announcements including orders to undertake business improvement initiatives or suspend business. FY2018 FY2019 FY2020
0
9.00
12.00
15.00
6.00
3.00
0
120,000
150,000
90,000
60,000
30,000
Shareholders’ equity (Millions of yen)
Non-consolidatedcapital adequacy
ratio (%)
■ ■ Shareholders’ equity Non-consolidated capital adequacy ratio
14.10% 13.92%
125,452
168,238
13.78%
170,822
Domestic standard
4.00%
The data for fiscal 2018 represents the figures of the former Hamamatsu Shinkin Bank.
Risk-monitored loans (coverage ratio)
FY2020
1,477
57,806
192
7,997
67,473
100.0%
92.4%
100.0%
43.1%
86.7%
Unit: Millions of yen
Risk-monitored loans
Total risk-monitored loans
Amount covered by collateral and guarantees
Ratio to total amount of loans
Loans to bankrupt borrowers
Delinquent loans
Loans past due three months or more
Restructured loans
58,528
5.49%
FY2019
1,593
59,357
2
4,480
65,433
100.0%
93.4%
100.0%
49.3%
90.5%
59,235
5.33%
Potentially bankrupt borrowers
Substandard borrowers
Bankrupt borrowers
Effectively bankrupt borrowers
Borrower classification under self-assessment
7 8
HAMAMATSU IWATA SHINKIN BANK Annual Report 2020
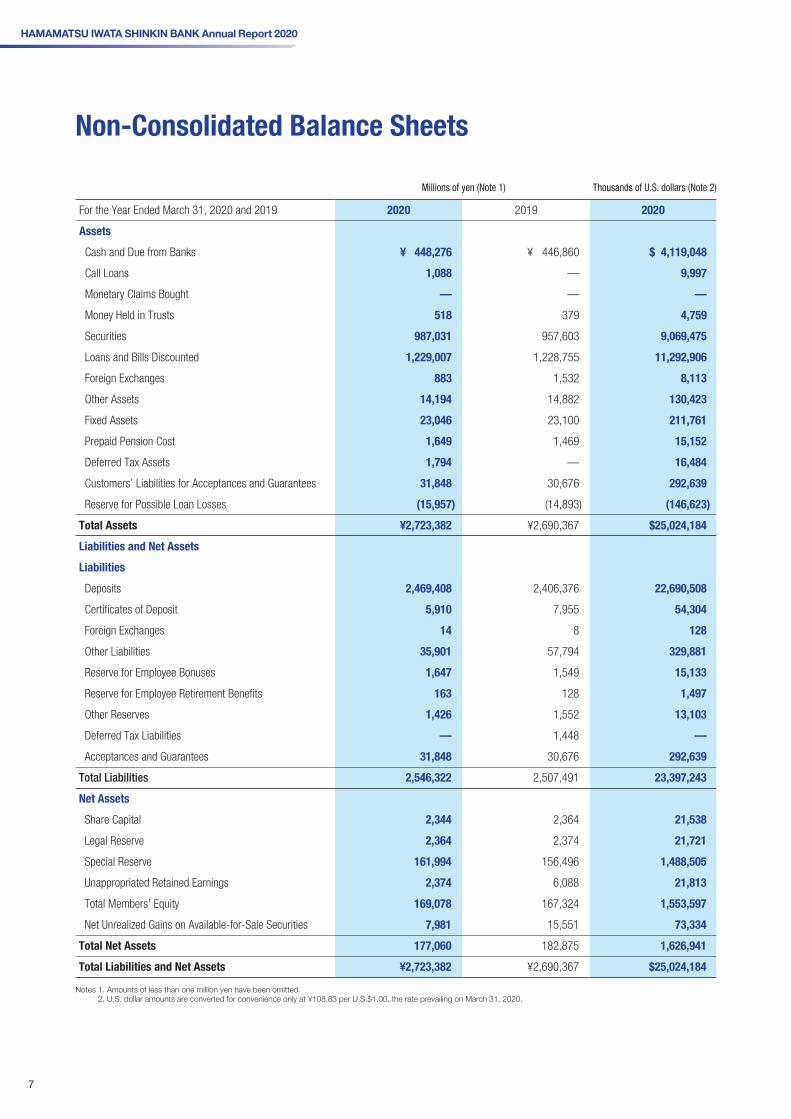
Non-Consolidated Balance Sheets
For the Year Ended March 31, 2020 and 2019 2020 2019 2020
Assets
Cash and Due from Banks ¥ 448,276 ¥ 446,860 $ 4,119,048
Call Loans 1,088 — 9,997
Monetary Claims Bought — — —
Money Held in Trusts 518 379 4,759
Securities 987,031 957,603 9,069,475
Loans and Bills Discounted 1,229,007 1,228,755 11,292,906
Foreign Exchanges 883 1,532 8,113
Other Assets 14,194 14,882 130,423
Fixed Assets 23,046 23,100 211,761
Prepaid Pension Cost 1,649 1,469 15,152
Deferred Tax Assets 1,794 — 16,484
Customers’ Liabilities for Acceptances and Guarantees 31,848 30,676 292,639
Reserve for Possible Loan Losses (15,957) (14,893) (146,623)
Total Assets ¥2,723,382 ¥2,690,367 $25,024,184
Liabilities and Net Assets
Liabilities
Deposits 2,469,408 2,406,376 22,690,508
Certificates of Deposit 5,910 7,955 54,304
Foreign Exchanges 14 8 128
Other Liabilities 35,901 57,794 329,881
Reserve for Employee Bonuses 1,647 1,549 15,133
Reserve for Employee Retirement Benefits 163 128 1,497
Other Reserves 1,426 1,552 13,103
Deferred Tax Liabilities — 1,448 —
Acceptances and Guarantees 31,848 30,676 292,639
Total Liabilities 2,546,322 2,507,491 23,397,243
Net Assets
Share Capital 2,344 2,364 21,538
Legal Reserve 2,364 2,374 21,721
Special Reserve 161,994 156,496 1,488,505
Unappropriated Retained Earnings 2,374 6,088 21,813
Total Members’ Equity 169,078 167,324 1,553,597
Net Unrealized Gains on Available-for-Sale Securities 7,981 15,551 73,334
Total Net Assets 177,060 182,875 1,626,941
Total Liabilities and Net Assets ¥2,723,382 ¥2,690,367 $25,024,184
Notes 1. Amounts of less than one million yen have been omitted. 2. U.S. dollar amounts are converted for convenience only at ¥108.83 per U.S.$1.00, the rate prevailing on March 31, 2020.
Thousands of U.S. dollars (Note 2)Millions of yen (Note 1)

7 8
HAMAMATSU IWATA SHINKIN BANK Annual Report 2020
Non-Consolidated Statements of Income
Unappropriated Retained Earnings
For the Year Ended March 31, 2020 and 2019 2020 2019 2020
Income
Interest on: ¥26,310 ¥20,031 $241,757
Loans and Bills Discounted 15,725 12,760 144,499
Securities 9,665 6,548 88,816
Others 918 722 8,440
Fees and Commissions 3,895 3,222 35,795
Other Income 3,674 3,360 33,762
Total Income 33,880 26,614 311,315
Expenses
Interest on: 522 454 4,798
Deposits 485 427 4,462
Other 36 27 335
Fees and Commissions 2,669 2,125 24,526
General and Administrative Expenses 23,380 19,184 214,832
Other Expenses 4,436 1,354 40,765
Total Expenses 31,008 23,119 284,922
Income Before Income Taxes 2,872 3,494 26,393
Income Taxes
Current 1,438 1,367 13,215
Deferred (457) (668) (4,204)
Net Income ¥ 1,891 ¥ 2,796 $ 17,382
For the Year Ended March 31, 2020 and 2019 2020 2019 2020
At Beginning of the Year ¥2,374 ¥6,089 $21,821
Reversal of Reserve 21 11 200
Appropriation 1,117 5,618 10,264
Transfer to Legal Reserve 0 0 0
Cash Dividends for Member Common Shares 117 118 1,075
Special Reserve 1,000 5,500 9,188
At End of the Year ¥1,279 ¥ 483 $11,757
Notes 1. Amounts of less than one million yen have been omitted. 2. U.S. dollar amounts are converted for convenience only at ¥108.83 per U.S.$1.00, the rate prevailing on March 31, 2020.
Thousands of U.S. dollars (Note 2)Millions of yen (Note 1)
Thousands of U.S. dollars (Note 2)Millions of yen (Note 1)

9 10
HAMAMATSU IWATA SHINKIN BANK Annual Report 2020
Consolidated Balance Sheets
As of March 31, 2020 and 2019 2020 2019 2020
Assets
Cash and Due from Banks ¥ 448,929 ¥ 447,536 $ 4,125,048
Call Loans 1,088 — 9,997
Monetary Claims Bought 518 379 4,759
Monetary Held in Trusts — — —
Securities 986,721 957,300 9,066,626
Loans and Bills Discounted 1,226,447 1,225,716 11,269,383
Foreign Exchanges 883 1,532 8,113
Other Assets 27,897 28,160 256,335
Fixed Assets 22,923 23,032 210,631
Prepaid Pension Cost 1,649 1,469 15,152
Deferred Tax Assets 1,909 100 17,541
Customers’ Liabilities for Acceptances and Guarantees 31,824 30,618 292,419
Reserve for Possible Loan Losses (16,217) (15,139) (149,012)
Total Assets ¥2,734,574 ¥2,700,709 $25,127,023
Liabilities and Net Assets
Liabilities
Deposits ¥2,467,769 ¥2,403,920 $22,675,447
Certificates of Deposit 5,090 6,935 46,770
Other Liabilities 45,205 67,006 415,372
Foreign Exchanges 14 8 128
Reserve for Employee Bonuses 1,684 1,559 15,473
Reserve for Employee Retirement Benefits 240 236 2,205
Other Reserves 1,442 1,573 13,250
Deferred Tax Liabilities — 1,449 —
Acceptances and Guarantees 31,824 30,618 292,419
Total Liabilities 2,553,272 2,513,309 23,461,104
Net Assets
Share Capital 2,344 2,364 21,538
Retained Earnings 170,976 168,600 1,571,037
Total Members’ Equity 173,320 170,964 1,592,575
Net Unrealized Gains on Available-for-Sale Securities 7,981 15,551 73,334
Minority Interests — 884 —
Total Net Assets 181,302 187,400 1,665,919
Total Liabilities and Net Assets ¥2,734,574 ¥2,700,709 $25,127,023
Notes 1. Amounts of less than one million yen have been omitted. 2. U.S. dollar amounts are converted for convenience only at ¥108.83 per U.S.$1.00, the rate prevailing on March 31, 2020.
Thousands of U.S. dollars (Note 2)Millions of yen (Note 1)

9 10
HAMAMATSU IWATA SHINKIN BANK Annual Report 2020
Consolidated Statements of Income
Retained Earnings
For the Years Ended March 31, 2020 and 2019 2020 2019 2020
Income
Operating Income ¥26,279 ¥20,019 $241,471
Loans and Bills Discounted 15,698 12,752 144,251
Securities 9,661 6,544 88,779
Others 918 722 8,440
Fees and Commissions 4,018 3,353 36,926
Other Income 8,420 7,383 77,373
Total Income 38,718 30,756 355,770
Expenses
Operating Expenses 522 454 4,796
Deposits 485 427 4,461
Others 36 27 334
Fees and Commissions 2,480 1,955 22,791
General and Administrative Expenses 23,099 18,991 212,254
Other Expenses 9,315 5,475 85,596
Total Expenses 35,417 26,876 325,439
Income Before Income Taxes 3,300 3,880 30,331
Income Taxes
Current 1,602 1,529 14,720
Deferred (471) (677) (4,336)
Minority Interests in Income 45 48 417
Net Income ¥ 2,125 ¥ 2,979 $ 19,529
Thousands of U.S. dollars (Note 2)Millions of yen (Note 1)
For the Years Ended March 31, 2020 and 2019 2020 2019 2020
At Beginning of the Year ¥168,534 ¥125,983 $1,548,601
Changes During the Year 0 0 0
Net Income 2,125 42,610 19,529
Cash Dividends for Member Common Shares 118 60 1,085
Decrease by Merger 0 — —
At End of the Year ¥170,541 ¥168,534 $1,567,045
Notes 1. Amounts of less than one million yen have been omitted. 2. U.S. dollar amounts are converted for convenience only at ¥108.83 per U.S.$1.00, the rate prevailing on March 31, 2020.
Thousands of U.S. dollars (Note 2)Millions of yen (Note 1)

114-8 Motoshiro-cho, Naka-ku, Hamamatsu, Shizuoka 430-0946, Japan
TEL:+81-53-450-3250
P r i n t e d i n J a p a n
浜松いわた信用金庫_アニュアルレポート表紙A4_H1表4_C


