72
ANNUAL REPORT 2019

ANNUAL REPORT 2019

Ara at a glance 2019
13,808
7,203
Equivalent full time students(EFTS) enrolled at Ara in 2019
Up from 7,042 in 2018
DOMESTICSTUDENTS
1,852 INTERNATIONALSTUDENTS
Parent $114K
Group $1.7m
Total revenue (2018: $113m)
Total revenue (2018: $114m)
1,777 645MĀORI STUDENTS ENROLLED
(14.1% of all SAC students) (4.9% of all SAC students)
PACIFIC STUDENTS ENROLLED
The first students enrolled in many new programmes at Ara, in areas including: Automotive Engineering, Barbering, Hairdressing and Beauty Therapy, Exercise Science, Interior Design, Outdoor and Adventure Education, Postgraduate Health Science and Nursing, Postgraduate Sustainable Practice and Te Reo Māori.
100
SAC successful coursecompletion rate
Of studentssatisfiedor very satisfied
Of graduates in employment or further study in the year following graduation
80
60
40
20
%
84
.0%
83.
3%
86
.2%
87.
2%
84
.0%
85.
0%
2018 2019 2018 2019 2018 2019
FULL TIME EQUIVALENT STAFF923 MAIN CAMPUSES6 Christchurch City (Madras Street),
Manawa, Woolston, Timaru, Ashburton, Oamaru (plus four Ara Connect sites)
Parent $116m
Group $118m
Net surplus(2018: $914K)
Net surplus(2018: $969k)

Ara Annual Report 2019
Table of Contents
Council Chair and Chief Executive Report
Kaupapa – Our values i
Ara Council ii
Senior Leadership Team iii
Strategic Plan iv
Statement of Service Performance vi
Statement of Responsibility 1
Statement of Comprehensive Revenue and Expenses 2
Statement of Financial Position 3
Statement of Cash Flows 4
Statement of Changes in Equity 5
Statement of Childcare Operating Income and Expenditure 6
Statement of Special Supplementary Grants 7
Statement of Compulsory Student Services Fees 8
Notes to the Financial Statements 10
Statement of Resources 43
Auditor's Report 44
Equal Education Opportunities 49
Equal Employment Opportunities 51
Publication Format
The 2019 Ara Annual Report has been specifically designed, published and distributed in keeping with our commitment to sustainable principles as a digital publication online.
In line with legislative requirements, a limited number have been printed.
The digital version can be viewed at: www.ara.ac.nz/about-us/publications/corporate-documents-and-annuals-reports

Ara Annual Report 2019
Te Pūroko a te Kaiwhakahaere Council Chair and Chief Executive Report
The 2019 academic year was one of clearly defined and focussed development for Ara, resulting in a range of significant successful outcomes. We prioritised investment in organisational change and the development of our people, building from our sound foundations and ensuring that we not only set our future focus as a leading tertiary organisation, but positively moved to embrace the key elements of the transition to becoming a New Zealand Institute of Skills and Technology (NZIST) subsidiary and delivering on the new NZIST Charter.
Our work included a number of transformation workstreams with an emphasis on people and culture, systems and processes, innovation and design thinking, and a finalised campus development plan that looks to embrace the component parts of new modes of delivery, new products and our assessment activity. At the forefront of these developments is growing leadership capability and an emphasis on achieving Ara-wide success. Our ‘Growing Inspiring Leaders’ initiative, delivered throughout all parts of the organisation, is fundamental to the future success of Ara, building confidence in the ability of our leaders, to not only grow themselves and their teams, but to set the platform for the collective contribution and convergent thinking of a future-focussed tertiary institute.
Getting greater understanding of the challenges for our Ara colleagues and teams to deliver on our purpose of ‘Transforming Lives through Education’ has been enhanced by changes to our Engagement Survey process. Our 2019 results showed a very positive and meaningful shift in the overall level of colleagues’ engagement and our first wellbeing survey confirmed that the emphasis we have on supporting wellbeing is making an important positive difference for our teams.
Our survey results also provided valuable insight into areas which we are looking to further improve. The feedback into existing and new workstreams is being used to effectively grow and enhance the way that we engage with our learners and colleagues.
Our student numbers for the year showed growth in both domestic and international students; in total 15,660 students equating to 7,203 EFTS. This included 1,852 international students from 49 different countries who chose Ara for a quality education and a cultural experience that is part of our overall internationalisation development. The introduction of a range of new programmes reflects the engagement with a wide range of partners and industry including post Graduate Programmes in Sustainable Practice and Professional Supervision and Certificates and Diplomas in Exercise Science, Interior Design and Barbering Skills.
Te Ōhaka (the Centre for Growth and Innovation), a partnership between the established Ministry of Awesome and Ara, has already achieved a strong presence in the innovation ecosystem of Christchurch. Te Ōhaka is providing not only a resource for ‘Start-Ups’ but is connecting Ara students and colleagues with the opportunity to grow innovation understanding, creating
knowledge that will be so important for economic and social enterprise development in the future.
2019 was the first full academic year for our Nursing, Midwifery and Medical Imaging teams in the Te Papa Hauora Health Precinct. Our teams now work and learn alongside colleagues from the Canterbury District Health Board, University of Canterbury and University of Otago. The access that co-location provides to impressive medical facilities, and other clinical and education professionals and students, is proving highly successful in building multi-disciplinary teams and students who are more than work-ready as a result of the learning experiences they receive.
During the year we progressed the development of Ara’s Framework for Māori Achievement (FMA). This framework articulates the core principles and practices which are important for Māori colleagues and students at Ara. The FMA is designed not only to grow cultural competency but to establish developmental areas for greater embedding into our programmes and support for students. The FMA is directly aligned with and forms a strong connected weave through the Strategic Focus Areas and Priorities which have been agreed for the coming two-year period and the transition to a subsidiary of NZIST.
We have worked positively with the Reform of Vocational Education (RoVE), recognising the opportunities that will come from greater collaboration and the potential changes that could benefit our region. Our Ara strategy is linked effectively to the NZIST Charter and we see a strong Ara subsidiary as not only important to our region, but also to New Zealand and the development of NZIST.
The year brought challenging and sad events for both Christchurch and Ara, starting in March with the tragedy of the Al Noor Mosque shootings – sanatadhakaruk dayimaan, we will always remember them.
During the year, two toka tū moana of the institution passed away.
Stephen Collins served on both the CPIT and Ara Councils for nearly a decade, allowing the organisation to benefit from his commercial and entrepreneurial business acumen, his pragmatic and collaborative approach to work and education; and Ralph Knowles whose 43 years at the institute in a range of senior roles including Council Secretary was underpinned by his passion and commitment for tertiary education and his absolute focus on doing the best by the countless students he supported.
At this time we would also recognise those colleagues for whom 2019 will be their final year on the Ara Council; the institute recognises the significant contributions and commitment of Deputy Chair Janie Annear, John Hunter, Jeremy Boys and Elizabeth Hopkins and thanks them for all their work on behalf of the institute.
As we transition to the NZIST in April 2020, Ara will continue to ensure we support our region, New Zealand and the new entity by delivering on our stated core purpose of ‘transforming lives through education’.
Dr Thérèse Arseneau Ara Council Chair
Tony Gray Chief Executive

Ara Annual Report 2019
i
Our Values
Ara is committed to the following values that underpin the institute's activities and the way in which we operate:
Aroha – Respect
Hono – Connect
Hihiri – Inspire
Our Vision
Successful Students
Value for Employers
Effective Staff
Our Appreciation
Thank you to all students, colleagues, fellow institutions, communities, industries and businesses for contributing to such a successful 2019.
Kaupapa Introduction

Ara Annual Report 2019
ii
Ko Tā te Kaunihera Governance and Accountability
Kā Mema o te KauniheraAra Council Members
Dr Thérèse Arseneau Chair
Ms Janie Annear Deputy Chair
Mr Michael Rondel Independent Chair, Council Audit and Risk Committee
Ms Jane Cartwright Chair, Chief Executive Remuneration and Performance Review Committee
Mr John Hunter Chair, Council Campus Redevelopment Committee
Members appointed by the Minister
Dr Thérèse Arseneau
Ms Janie Annear
Mr Stephen Collins (deceased 27 June 2019)
Mrs Elizabeth Hopkins
Members appointed by the Ara Council
Mr Jeremy Boys
Ms Jane Cartwright
Mr John Hunter
Ms Melanie Taite-Pitama
Advisor to Council
Mr Michael Rondel (as of 15 October 2019)
Kā Āpiha o te KauniheraAra Council Officers
Mr Tony Gray Chief Executive
Mr S Te Marino Lenihan Kaiārahi
Ms Tracey McGill (to 1 May 2019) Council Secretary
Ms Christina Yeates Minute Secretary
Ms Christina Yeates Governance and Strategy Unit Senior Administrator
Ara Council
Ara Institute of Canterbury is a Crown Entity governed by its own council with accountability to the shareholding Minister, through the Tertiary Education Commission (TEC). It is made up of eight members, four of whom are appointed by the Minister for Tertiary Education, and four of whom are appointed by the Ara Council under Council Statute.
As the governing body of Ara, the Council has several key responsibilities: to appoint and manage the performance of the Chief Executive and to reflect the interests of the organisation’s key stakeholders: the government, through the Minister’s appointments, and the businesses and communities of the region, through the council appointments. The council directs the management of Ara to achieve planned outcomes and to ensure that the organisation is acting prudently, legally and ethically.
Ara operates under a number of Acts of Parliament – particularly the Education Act 1989 No 80 and the Local Government Official Information and Meetings Act 1987 No 174.

Ara Annual Report 2019
iii
Kā ManukuraSenior Management
Te Kāhui ManukuraSenior Leadership Team
Mr Tony Gray Chief Executive
Mr S Te Marino Lenihan Kaiārahi
Mr George Nelson Deputy Chief Executive – Academic, Innovation and Research
Mr Darren Mitchell Deputy Chief Executive – Chief Operating Officer
Ms Tracey Berry (until 6 September 2019) Deputy Chief Executive – Customer Experience and Engagement
Ms Karen Te Puke (from 9 September 2019) Acting Deputy Chief Executive – Customer Experience and Engagement
Ms Belinda de Zwart Deputy Chief Executive – People and Culture

Ara Annual Report 2019
iv
Kā Whāika MahereStrategic Plan
Ara Strategic Focus Areas and Priorities for 2019
Outcome 1: Successful Learners
Focus area 1: Students at the heart of everything we do
• Increase Māori and Pacific achievement
• Personalised, lifelong student journeys
• Service, monitoring, and intervention strategies that drive student success
• Opportunities for students to contribute to organisational planning and decision making
as part of their learning
Outcome 2: Prosperous individuals and communities
Focus area 2: Dynamic world-class programmes and delivery
• Teachers and delivery methods are leading edge and inspire students
• Products are responsive, agile, and renewed
• Learning design maximises achievement
• Industry and businesses partner with us to develop and upskill their employees
Outcome 3: Working together
Focus area 3: High performing customer-focussed teams
• A culture of collaboration, information sharing, capability development, responsibility and accountability
• Targets are set, strategies planned, progress monitored
• Continuous improvement underpins everything we do
• We value, prioritise and action cultural competency and confidence
• Relationships with our iwi partners are strong and focussed on improving outcomes for Māori
Outcome 4: Sustainable future
Focus area 4: Investment decisions that deliver a sustainable future
• A thriving and sustainable education business
• Leveraging value from our assets and people
The Ara strategic plan is set by the Council and determines the institution's direction in conjunction with a mix of Government policy directives and regional strategies. It is used to inform the Ara Investment Plan which is prepared in consultation with stakeholders and in collaboration with the Tertiary Education Commission. The 2017–19 Strategic Plan sets our values, vision and outcomes:
Our ValuesAroha – Respect
Hono – Connect
Hihiri – Inspire
Our VisionSuccessful Students
Value for Employers
Effective Staff

Ara Annual Report 2019
v
Kā Whāika MahereStrategic Plan
Outcomes Innovations
1Personalised, flexible student journey to achievement
• Embedding the Ara Advantage
• Aligning to the Ara market segments
2Responsive and agile portfolio and delivery
• Renewing the portfolio
• Enhancing learning design
3 High performing organisation• Developing the organisation
• Lifting planning and performance management
The original Ara Strategic Plan for 2017-2019 had the following outcomes and innovations.
These were the outcomes and innovations included in the 2017-2019 Investment Plan.

Ara Annual Report 2019
vi
The purpose of the Statement of Service Performance (SSP) is to provide evidence of performance against non–financial targets.
Measures included in the Statement of Service Performance include both those specified as performance commitments in the 2019-2021 Investment Plan, other commitments agreed with TEC, plus additional internal measures to provide a balanced view of performance. The measures from the Investment Plan are based on negotiations with the Tertiary Education Commission (TEC). Thus these reflect the outputs expected of Ara by the Ara Council and TEC.
The SSP includes provisional results for student related targets of course completion, qualification completion, progression and retention, based on internal student achievement data processed by 17 January 2020. The final TEC confirmed results are not generally known until mid-2020.
An amendment to the Education Act 1989, s. 220(2C)) requires the Statement of Service Performance for 2019 to comply with Generally Accepted Accounting Principles (GAAP) for the first time. GAAP requires output cost disclosure. Ara has assessed that it has only one output class, being teaching and learning. The costs for this output are included within the statement of comprehensive revenue and expense.
Enrolments
Measure 2018 Actual2019 Investment
Plan Target2019 Revised
Target (1) 2019 Actual
SAC Level 1–2 EFTS enrolled 110 162 128 140
SAC Level 3+ EFTS enrolled 5,523 5,731 5,901 5,518
International EFTS enrolled 854 658 840 980
ACE EFTS enrolled 127 n/a 127 106
Trades Academy EFTS enrolled (2) 134 n/a 132 144
Youth Guarantee EFTS enrolled 108 186 98 95
Other EFTS enrolled 186 n/a 169 221
Total EFTS enrolled 7,042 n/a 7,394 7,203
Responding to TEC Priority: Delivering Skills for Industry
EFTS delivered in healthcare provision at Levels 3-9 1,013 1,059 n/a 1,065
EFTS delivered in STEM subjects at Levels 3-9 1,728 1,332 n/a 1,718
EFTS delivered in Trades provision at Levels 3-9 1,171 1,183 n/a 1,107
15,660 students enrolled at Ara in 2019, across all locations and types of delivery. This equated to 7,203 EFTS (Equivalent Full Time Students), up from 7,042 EFTS in 2018 and just marginally missing the budgeted growth target of 7,394 EFTS. SAC (Student Achievement Component) Level 3+ enrolments made up the majority of Ara provision. The target for the second largest area, provision to international students, was exceeded by 17%.
Enrolments across the polytechnic sector reduced by 6.7% between 2016 and 2017, and reduced by a further 3.9% between 2017 and 2018. In this wider context, it is notable that Ara enrolments reduced by only 0.3% between 2017 and 2018, then grew by 2.3% between 2018 and 2019, indicating that Ara is outperforming sector enrolment trends, and that there is consistent demand for polytechnic provision in the Canterbury region.
SAC 3+ enrolments at degree (Level 7) and postgraduate (Levels 8-9) increased in 2019. Specific areas of growth included health provision, in both long-standing programmes such as the Bachelor of Nursing, as well as newer programmes such as the New Zealand Certificate in Health and Wellbeing, the Bachelor of Musculoskeletal Health, and postgraduate nursing and health offerings. Ara had targeted these areas for growth, with many of these programmes being delivered in the new Manawa building located in the Health Precinct in central Christchurch. Other areas with increased SAC 3+ enrolment numbers included qualifications in hairdressing, beauty and barbering; veterinary nursing; road transport; plus new postgraduate qualifications in sustainable practice.
The 2019 SAC Level 3+ target included 223 EFTS to be delivered wholly online through TANZ eCampus, and although eCampus provision by Ara increased from 120 EFTS in 2018 to 157 EFTS in 2019, the full growth target for eCampus was not achieved. Additionally, domestic enrolment numbers in business programmes across Levels 3 to 7 were below 2018 levels and short of the respective 2019 targets. Several areas in trades, engineering and architectural studies were also short of their domestic enrolments target, noting Ara is continuing to adjust the volume and focus of construction-related provision to support the Canterbury construction workforce as the industry adjusts following the earthquake rebuild. In engineering areas, the reduced number of domestic students was offset by a large increase in international students.
The trends described above contributed to Ara achieving the overall enrolment targets for healthcare and STEM (Science, Technology, Engineering and Mathematics) provision, to support the government goal of "Delivering Skills for Industry".
Ara achieved the revised SAC Levels 1-2 enrolment target, and this delivery increased in 2019. This is mainly provision to domestic students in the areas of foundation studies and English Language. It also includes delivery through the Next Step Centre, which continued to provide a path to formal qualifications for women looking to upskill and return to the workforce.
Statement of Service Performance
He Taukī Hua MahiStatement of Service Performance

Ara Annual Report 2019
vii
ACE (Adult and Community Education) enrolments reduced in 2019, with this funding being used to deliver courses focussed on computing, English language and general life skills, with the decline across all these areas and in both Christchurch and Timaru. Some of the areas where Ara has offered ACE provision in the past have been superseded by the more formalised SAC Level 1-2 programmes described above, as well as higher level computing programmes, with these newer pathways providing formal recognition to learners, which was generally not available through ACE.
The EFTS target for Trades Academy was achieved. These are dual enrolment programmes where secondary school students spend part of their week at their secondary school, and the remainder with Ara. Whilst included in the EFTS totals, Trades Academy is funded on a places basis, and in 2019 Ara enrolled 456 Trades Academy students in areas such as construction, engineering, cookery, hospitality, business, healthcare and outdoor education.
Ara revised the original investment plan Youth Guarantee enrolment target for 2019 due to downward trends in demand for this provision. Whilst the revised targets for Youth Guarantee enrolments in trades programmes and those in Timaru were achieved, those relating to cookery, hospitality and creative industries were not. Ara continues to adjust what, how and where programmes are offered to young people, with Youth Guarantee programmes aimed at full-time tertiary study generally seeing lesser interest from young learners than secondary-tertiary dual enrolment programmes and higher level qualifications.
The target for 'Other EFTS' was exceeded and this provision also increased on 2018 levels. This shift was primarily due to more hours delivered through Intensive Literacy and Numeracy (ILN) programmes, which is discussed in the next section, plus more off-job training for ITO (Industry Training Organisation) apprentices, particularly those in engineering apprenticeships. Enrolments in domestic full-fee provision and STAR (Secondary Tertiary Alignment Resource) were similar to 2018.
Responding to TEC Priority: Improving Adult Literacy and Numeracy
2018 Actual2019 Investment
Plan Target2019 Revised
Target (1) 2019 Actual
EFTS delivered through SAC provision at Levels 1-2 110 162 128 140
EFTS delivered through SAC provision at Level 3 961 1067 n/a 934
Successful course completion rate for SAC learners at Level 1
83.1% 73.4% n/a 82.0%
Successful course completion rate for SAC learners at Level 2
68.1% 69.1% n/a 53.4%
Successful course completion rate for SAC learners at Level 3
75.2% 76.8% n/a 75.9%
Enrolments in specialist literacy and numeracy provision > ILN 41 learners, 5,214 hours
44 learners, 6,486 hours
n/a 43 learners, 5,886 hours
> ILN ESOL
21 learners, 6,611 hours
44 learners, 8,800 hours
n/a 62 learners, 21,852 hours
In response to the TEC priority to improve adult literacy and numeracy, Ara has aimed to increase provision through SAC Levels 1 and 2 and ILN (Intensive Literacy and Numeracy). Overall SAC provision at Level 3 decreased in 2019, due to fewer enrolments in certain trades, business and computing programmes, but there was an increase in enrolments into the New Zealand Certificate in Study and Career Preparation (Level 3) and New Zealand Certificate in English Language (Level 3), both programmes with a strong literacy and numeracy focus. There was also an increase in overall learner numbers and hours of delivery through the two ILN strands, which are entirely focussed on building literacy and numeracy in adult learners with lower skills in these areas.
SAC achievement at Levels 1 and 3 was similar to 2018 levels. The decrease in achievement at Level 2 relates to the New Zealand Certificate in English Language (Level 2), which had an increase in enrolment numbers, and is a programme that has lower achievement rates than others at that level due to a higher number of withdrawals.
When the investment plan target for successful course completion for SAC Learners at Level 1 was set, historical performance by Ara in this metric was lower (2016: 70.2%, 2017: 73.4%). Ara has significantly improved since that time and thus well exceeded the target for 2019. The increased achievement is due to a mix of the changing type of provision in this area, plus continual improvement in how these foundation learners are supported.
(1) The '2019 Revised Target' for enrolments are from the Ara 2019 budget, which was set in December 2018. Revisions are due to changes in the type and volume of provision funded by the Tertiary Education Commission and the Ministry of Education, as well as Ara revising 2019 delivery targets based on actual 2018 performance.
(2) This target was formerly termed 'CTC EFTS enrolled'. The term CTC (Canterbury Tertiary College) is no longer used, and as such, the target has been renamed Trades Academy EFTS. There is no difference to the calculation of target or actual performance.
He Taukī Hua MahiStatement of Service Performance

Ara Annual Report 2019
viii
He Taukī Hua MahiStatement of Service Performance
Student Achievement - SAC (Student Achievement Component) and YG (Youth Guarantee)
2018 Actual2019 Investment
Plan Target 2019 Actual
Successful Course Completion Rate for all SAC-funded students at all levels 84.0% n/a 84.0%
Successful Course Completion Rate for all SAC-funded students at Levels 1-3 75.0% n/a 74.3%
Successful Course Completion Rate for all SAC-funded students at Levels 4-6 80.4% n/a 80.1%
Successful Course Completion Rate for all SAC-funded students at Levels 7+ 90.7% n/a 90.7%
Successful Course Completion Rate for YG-funded students at Levels 1-3 77.1% 80.0% 72.9%
Student progression rate for all SAC-funded students, from level 1-3 to a higher level 25.5% n/a 27.2%
Student progression rate for all YG-funded students, at Levels 1-3 18.8% n/a 32.8%
Number of SAC graduates at levels 1-3 858 n/a 620
Number of YG graduates at all levels 1-3 121 n/a 89
First year retention rate for all students at L4-7 (non-degree) 49.4% n/a 60.8%
First year retention rate for all students at L7 (degree) 74.8% n/a 75.5%
Over the past two years, the Tertiary Education Commission (TEC) has changed some of the performance metrics for assessing student achievement, including how programme levels and ethnicities are grouped. 2019 is the first time Ara has reported using these new measures. Whilst targets were set for Māori, Pacific and non-Māori/non-Pacific as per TEC direction, overall targets were not required and were not set in the Investment Plan. However, overall performance by students of all ethnicities have been included above to provide a holistic view of Ara performance, and 2018 comparatives have also been calculated.
The overall successful course completion rate for SAC learners was the same as 2018 (84.0%), which based on 2018 sector results would place Ara in the top three institutions for this measure. This steady performance is based on the Level 7+ achievement remaining constant at 90.7%, coupled with a higher proportion of SAC provision at those higher levels, and a small drop in achievement at Levels 1-3 and Levels 4-6. Achievement was generally consistent in SAC provision between 2018 and 2019 across departments and subjects.
The successful course completion rate for Youth Guarantee (YG) courses decreased by 4.2% which meant the target was not achieved. This trend was based on steady performance in trades areas, but a decrease in the successful completion rates for cookery, tourism and hospitality programmes.
Graduate numbers and first year retention are two of the new TEC performance metrics for 2019. Graduate numbers for SAC and Youth Guarantee learners at lower NQF levels are below those for 2018, with this due to a mixture of reduced Youth Guarantee enrolment numbers, plus at the time of preparation of the Annual Report many of the 2019 qualification approvals were still being finalised, so the 2019 results are likely to increase. It is also notable that the progression rates for SAC and YG graduates at Levels 1 to 3 have improved, so whilst the numbers of graduates is down at this time, a higher proportion of graduates are remaining with Ara to continue to higher level study.
Regarding the progression of YG learners, the increase in reported rate between 2018 and 2019 is based on a similar number of graduates progressing to higher level study (2018: 39, 2019: 31), and the total number of graduates reducing (2018: 165, 2019: 119). The reduction in graduate numbers is largely a function of reduced Youth Guarantee enrolments between 2017 and 2018, with the learners enrolled in these years being the potential graduates to progress in 2018 and 2019 respectively. This is a positive trend, as despite enrolment numbers reducing in this area aimed at lower-level study for young people, those that do enrol are increasingly likely to qualify and progress to higher level study with Ara.
The first year retention rates improved by 11.4% at Levels 4 to 6 (Ara had no Level 7 non-degree provision in 2019), and by 0.8% at Level 7. Generally there is poorer retention between the first and second years of multi-year study than between subsequent years, so improving performance in this area is a positive shift and Ara continues to focus on supporting and retaining students over this transition.

Ara Annual Report 2019
ix
He Taukī Hua MahiStatement of Service Performance
Māori and Pacific students – Participation
2018 Actual2019 Investment
Plan Target 2019 Actual
Proportion of EFTS enrolled who are Māori students at all Levels 13.1% n/a 14.1%
Proportion of EFTS enrolled who are Pacific students at all Levels 4.8% n/a 4.9%
Proportion of SAC EFTS delivered to non-Māori, non-Pacific, at Levels 1-3 75.6% 75.2% 74.2%
Proportion of SAC EFTS delivered to Māori learners, at Levels 1-3 19.2% 19.2% 20.5%
Proportion of SAC EFTS delivered to Pacific learners, at Levels 1-3 6.6% 6.7% 7.0%
Proportion of SAC EFTS delivered to non-Māori, non-Pacific, at Levels 4-7 non-degree 82.3% 82.4% 81.6%
Proportion of SAC EFTS delivered to Māori learners, at Levels 4-7 non-degree 12.3% 13.5% 13.6%
Proportion of SAC EFTS delivered to Pacific learners, at Levels 4-7 non-degree 6.2% 5.4% 5.5%
Proportion of SAC EFTS delivered to non-Māori, non-Pacific, at Level 7 (degree) 86.6% 87.4% 84.9%
Proportion of SAC EFTS delivered to Māori learners, at Level 7 (degree) 11.2% 11.5% 11.9%
Proportion of SAC EFTS delivered to Pacific learners, at Level 7 (degree) 2.8% 3.8% 3.6%
Proportion of SAC EFTS delivered to non-Māori, non-Pacific, at Level 8 and above 96.1% 87.8% 93.9%
Proportion of SAC EFTS delivered to Māori learners, at Level 8 and above 3.0% 11.4% 3.4%
Proportion of SAC EFTS delivered to Pacific learners, at Level 8 and above 1.0% 3.5% 2.7%
Overall Māori and Pacific participation rates improved in 2019, and continue to be well above the proportions within the Canterbury regional population. This is a positive reflection of Ara engagement activity and relationships with the community and iwi. Most of the targets by level groups were also achieved for both Māori and Pacific, with increased Māori participation rates at Levels 4-7 (non-degree), Level 7 (degree) and postgraduate levels, and increased Pacific rates at degree and postgraduate level. The targets by level group were set in order to achieve parity of participation at all level groups by 2021, and 5 of the 8 targets for 2019 were achieved.
A particular success is the increase of Māori and Pacific participation at higher levels of study, which is a key aim for Ara. There were notably higher Māori in degree programmes in computing, social work, science, broadcasting and performing arts; and higher Pacific in the Bachelor of Nursing, Bachelor of Social Work, plus engineering, construction and architecture programmes. These positive shifts are showing that a number of internal and external initiatives are working, such as the He Toki Iwi Industry Māori Engineering Workforce Partnership between Ara, Otago Polytechnic and Ngai Tahu, as part of the e2e (Engineering Education to Employment) programme.

Ara Annual Report 2019
x
He Taukī Hua MahiStatement of Service Performance
Māori and Pacific students – Achievement
2018 Actual2019 Investment
Plan Target 2019 Actual
Successful Course Completion Rate for non-Māori/non-Pacific SAC-funded students at all levels 86.1% 87.0% 86.0%
Successful Course Completion Rate for Māori SAC-funded students at all levels 74.7% 78.7% 74.9%
Successful Course Completion Rate for Pacific SAC-funded students at all levels 71.7% 75.9% 72.7%
Number of Māori SAC graduates at levels 1-3 124 50 106
Number of Pacific SAC graduates at levels 1-3 49 12 30
Number of non-Māori, non-Pacific SAC graduates at levels 1-3 693 120 493
Number of Māori YG graduates at levels 1-3 22 50 23
Number of Pacific YG graduates at levels 1-3 9 12 7
Number of non-Māori, non-Pacific YG graduates at levels 1-3 95 120 60
Student progression rate for non-Māori/non-Pacific SAC-funded students, from level 1-3 to a higher level 27.8% 49.0% 28.1%
Student progression rate for Māori SAC students from levels 1-3, to a higher level 15.4% 43.0% 22.5%
Student progression rate for Pacific SAC students from levels 1-3, to a higher level 18.3% 49.0% 25.0%
Student progression rate for non-Māori, non-Pacific YG-funded students, at levels 1-3 21.6% 48.0% 35.5%
Student progression rate for Māori YG students from levels 1-3, to a higher level 13.6% 48.0% 18.2%
Student progression rate for Pacific YG students from levels 1-3, to a higher level 18.2% 48.0% 25.0%
First year retention rate for non-Māori, non-Pacific students at L4-7 (non-degree) 49.1% 52.5% 60.5%
First year retention rate for Māori students at L4-7 (non-degree) 54.7% 50.5% 73.5%
First year retention rate for Pacific students at L4-7 (non-degree) 40.7% 49.0% 45.0%
First year retention rate for non-Māori, non-Pacific students at L7 (degree) 75.8% 80.0% 77.3%
First year retention rate for Māori students at L7 (degree) 67.8% 73.0% 66.0%
First year retention rate for Pacific students at L7 (degree) 73.8% 76.0% 60.5%
The overall successful course completion rates for Māori and Pacific learners at Ara improved between 2018 and 2019. Targets were determined based on the ambitious goal of achieving parity of achievement between Māori, Pacific and non-Māori/non-Pacific by 2021, and whilst incremental improvements are being made, the targeted shift in Māori and Pacific achievement has not yet occurred.
The Investment Plan targets for Student Progression are based on TEC-calculated rates. These tend to be 12-20% higher than what Ara calculates internally and included as actuals above, with the reasons for this difference found in the Explanatory Note below. Applying this difference onto the 2019 actuals would increase the Non-Māori/Non-Pacific, Māori, and Pacific progression rates to a level around the 2019 Investment Plan targets.
Graduate numbers is a new metric to be reported in 2019. A key determinant of graduate numbers is enrolment numbers, and the Investment Plan targets for Graduate numbers were set in 2018 based on a combination of planned numbers and types of enrolments and improvements in achievement over 2019-2021, baselined on finalised graduate numbers from 2017. Since then, the actual mix of delivery has changed. Also, 2019 graduate numbers will increase up until mid-March prior to the Autumn Graduation. These factors contribute to the variances between targets and actuals achieved in 2019. A further factor is that between 2018 and 2019 there were fewer enrolments in all the three YG ethnicity groupings at Level 1-3, and with this context, the 2018-2019 trends in graduate numbers and progression rates for YG are positive, particularly for Māori and Pacific students, showing that despite reducing YG enrolment numbers, graduate numbers are steady and the proportion of graduates moving to higher level study with Ara is rising.

Ara Annual Report 2019
xi
Ara exceeded the targets for the numbers of Māori, Pacific and non-Māori/non-Pacific SAC graduates. The decrease on 2018 achievement in this area for Non-Māori/Non-Pacific is primarily due to a drop in enrolment numbers by this group, whereas for Māori and Pacific students a key factor is the shift in the types of programmes that these students were enrolled in, with higher numbers in 2019 in specific foundation pathways rather than in 2018, when more were enrolled in specialised options such as Te Reo Māori programmes, with different graduation rates. Similar to the overall progression achievement described in the previous section, the improvements in progression rates between 2018 and 2019 for Māori and Pacific SAC learners are based on a higher numbers of graduates progressing to higher study, and reduced numbers of graduates. This is, in part, a positive outcome in that those that graduate from lower level qualifications at Ara are increasingly transitioning into higher level qualifications at the institution.
A particular area of improvement for the progression of SAC graduates was in the relatively new NZ2834 New Zealand Certificate in Study and Career Preparation (Level 3). In 2018 that programme had 93 graduates (2017: 18), of which 67 progressed to higher level study (2017: 15), with this positive shift evident across Māori, Pacific and non-Māori/non-Pacific SAC students in that programme. The improvements in the Youth Guarantee progression rates relate to a higher proportion of NZ2100 New Zealand Certificate in Cookery (Level 3) graduates progressing to Level 4 cookery, bakery, and food and beverage service qualifications, plus a higher proportion of NZ2862 New Zealand Certificate in Foundation Skills (Level 2) graduates progressing to Level 3 automotive, construction and engineering qualifications. These are positive trends, and show the adoption and successful delivery of New Zealand qualifications in this area is leading to better student transition to higher level study in apprenticeships and other vocational qualifications.
First year retention is another new TEC measure of achievement. The targets for 2019-2021 were set compared to a 2017 baseline actual. This partly explains some of the larger variances between 2019 targets and actual achievement. Additionally, this metric is relatively prescribed in terms of which learners and programmes are included and excluded, which can create small cohorts not necessarily representative of wider organisational achievement. For example, the low first year retention rate for Pacific learners at Levels 4-7 (non-degree) relates to 9 out of 20 learners being retained, compared to 845 out of 1,119 for the Non-Māori/Non-Pacific Level 7 (degree) cohort. Noting this, the First Year Retention of Māori and Pacific learners in 2019 was mixed, with good improvements in retention at Levels 4 to 6 (Ara had no Level 7 non-degree provision in 2019) but a drop at Level 7 for both groups, and only one out of four targets achieved in this area. First year retention is a proportion calculation and on that basis there was a decrease, however it is notable that there was a significant increase in the absolute number of Māori learners starting Level 7 (degree) level study between 2017 and 2018, and a higher absolute number were retained in 2018 and 2019 respectively, which are positive trends as Ara continues to encourage Māori and Pacific learners into higher level qualifications.
In 2019, there were improvements in the first year retention of Māori and non-Māori/non-Pacific students studying at Level 4-7 (non degree) across a number of areas, including Managed Apprenticeships in carpentry and mechanical engineering, as well as the New Zealand Diploma in Construction and New Zealand Diploma in Architectural Technology. At Level 7, the first year retention of Pacific students decreased in the Bachelor of Nursing and the Bachelor of Applied Management, which resulted in an overall decrease due to the high numbers of Pacific learners in those programmes.
While enrolments numbers for Māori and Pacific students saw positive improvements in 2019, including increased enrolments at higher levels of study, the achievement of these learners at a course level has only incrementally improved, and the gap between the first year retention rates of Māori and Pacific, and Non-Māori/Non-Pacific learners, widened in 2019.
The Ara Framework for Māori Achievement was signed off and initiated in 2019. This, in part, has updated how Ara supports Māori learners and a key aim of that strategy is to accelerate closing the disparity in achievement between Māori and non-Māori students.
International students
2018 Actual2019 Investment
Plan Target2019 Revised
Target2019 Actual
International EFTS enrolled 854 658 840 980
Successful Course Completion Rate for international students
88.5% n/a n/a 89.4%
International enrolment numbers in 2019 were significantly higher than both 2017 and 2018, and both the initial investment plan and revised budget targets were well exceeded. The 2019 result is also higher than 2017 (874 EFTS). Most of the 2019 increase was due to a higher number of students from India. Particular areas of growth were programmes in the areas of business, computing, construction management, and degree-level and postgraduate-level nursing and health. Areas such an English Language and computing continued to enrol high numbers of international students.
Alongside the increased number of international students, the achievement of this group also improved, with overall successful course completion rising by 0.9%, and notable improvements in computing, engineering and creative programmes. The achievement of international students (89.4%) continues to be higher than SAC-funded domestic students (84.0%).

Ara Annual Report 2019
xii
He Taukī Hua MahiStatement of Service Performance
Campus redevelopment programme
Measure 2018 Actual2019 Investment
Plan Target 2019 Actual
Campus Redevelopment Work Programme continues within scope, on time, within budget
Mostly Achieved n/a Achieved
Following the successful delivery of the Campus Design Principles in early 2019, which was a collaborative process involving a wide range of internal and external stakeholders and advisors led by Chow Hill, a major redevelopment of the Regional Master Plan was initiated. Planned for March 2020, this data driven work is based on a comprehensive review of existing facilities and anticipated educational needs. The first draft was released at the end of 2019 and is on schedule for a March release. Further work is anticipated to include the non-educational or commercial needs into the plan, especially for the Southern Campuses.
The latest phase of the landscaping was successfully completed significantly improving undeveloped areas of the campus. The largest on-site student car park was also redeveloped and the quality significantly improved. And with the completion of Kahukura (K Block) in 2017, which removed the need for the majority of C Block (assessed as uneconomic to repair and raise to 67% NBS [New Building Standard]) the partial demolition of C Block was instigated. This work is well underway and is scheduled to complete in April 2020. The budget for Capital Works activity in 2019 included a provision for master planning, campus landscaping, and works related to the partial demolition of C Block. The detail on these projects was developed and the projects progressed during 2019, and the total 2019 spend on these projects was below the initial budget, due to some spend flowing into 2020. This did not impact on the delivery of 2019 programme milestones. C Block partial demolition was scheduled for a Feb 2020 completion. Concealed asbestos discoveries have delayed the programme over two months. COVID-19 has now added further delays.
Student survey results
2018 Actual2019 Investment
Plan Target 2019 Actual
Student Satisfaction 83.3% n/a 85.0%
Proportion of graduates in employment or further study in the year following graduation
86.2% n/a 87.2%
There was a 1.7% improvement in student satisfaction between 2018 and 2019. This was based on more students stating they 'Strongly Agree' or 'Agree' with the statement "Overall, I am satisfied with the programme" compared to the previous year, evidence of a continued improvement in this area. The 2019 result is the highest result since Ara was formed in 2016. Notable positive shifts between 2018 and 2019 included an increase in satisfaction rates for programmes in the Departments of Business and Creative Industries.
There was a 1.0% improvement in the proportion of graduates in employment or further study in the year following graduation. Similar to satisfaction, the 2019 result is also the highest it has been since 2016. This measure is based on how Ara graduates respond to the questions about employment and further education in the Graduate Outcome Survey, and recognises those who were either currently employed, currently enrolled in study, or intend to enrol in further study. The areas with higher proportions of graduates in employment or further study in 2019 than in 2018 were programmes in the Departments of Business, Computing and Engineering and Architectural Studies.
The response rates for both the Student Experience Survey (36.4% to 34.4%) and Graduate Outcome Survey (50.6% to 46.2%) decreased in 2019. Ara continues to adjust the approaches used to maximise the number of survey responses, covering both the initial communication, and the combination of electronic and face-to-face reminders. These rates continue to be high for this type of survey and reflect a broad cross-section of the Ara student and graduate populations in 2019.
The Student Experience Survey sample includes all students, less those on certain short-duration courses and those aimed at learners with low levels of English language skills. The Graduate Outcome Survey sample is all graduates.
Research
2018 Actual2019 Investment
Plan Target 2019 Actual
The amount of External Research Income earned 99,374 90,000 8,000
The number of Research Degrees completed 0 0 0
Ara produced 92 verified, quality-assured research outputs in 2019, compared to 103 in 2018. Noting that only a portion of research conducted by Ara receives external revenue, the amount of External Research Income decreased between 2018 and 2019, due to the amount and type of research activity that was completed in 2019 not resulting in the targeted level of revenue.
In 2019, Ara enrolled students in Level 9 (Masters) level qualifications in the areas of Nursing, Health Science and Sustainable Practice. These offerings are relatively new for Ara and most learners study part-time. As such, learners are yet to complete these qualifications.
Ara Annual Report 2019
xiii
He Taukī Hua MahiStatement of Service Performance
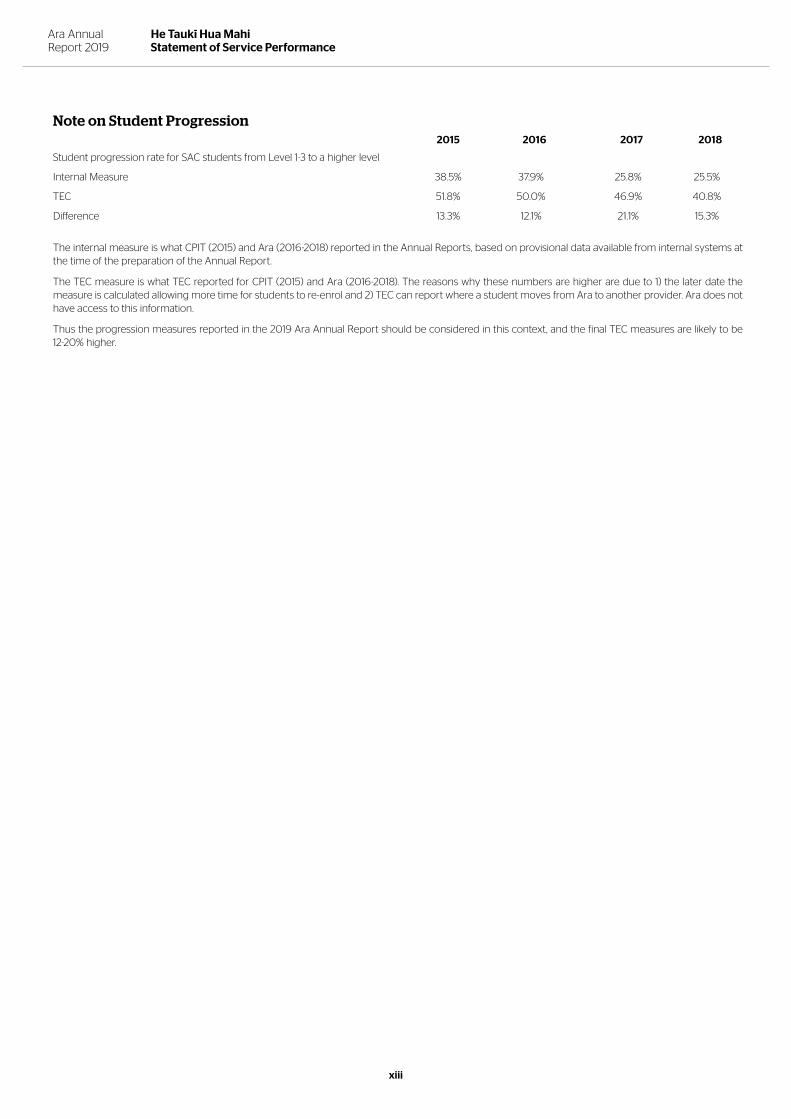
Note on Student Progression2015 2016 2017 2018
Student progression rate for SAC students from Level 1-3 to a higher level
Internal Measure 38.5% 37.9% 25.8% 25.5%
TEC 51.8% 50.0% 46.9% 40.8%
Difference 13.3% 12.1% 21.1% 15.3%
The internal measure is what CPIT (2015) and Ara (2016-2018) reported in the Annual Reports, based on provisional data available from internal systems at the time of the preparation of the Annual Report.
The TEC measure is what TEC reported for CPIT (2015) and Ara (2016-2018). The reasons why these numbers are higher are due to 1) the later date the measure is calculated allowing more time for students to re-enrol and 2) TEC can report where a student moves from Ara to another provider. Ara does not have access to this information.
Thus the progression measures reported in the 2019 Ara Annual Report should be considered in this context, and the final TEC measures are likely to be 12-20% higher.

Ara Annual Report 2019
Kā Pūroko PūteaFinancial Statements
1
Statement of Responsibility
The Ara Institute of Canterbury hereby certifies that:
1 It has been responsible for the preparation of these financial statements and statement of service performance and judgements used therein; and
2 It has been responsible for establishing and maintaining a system of internal control designed to provide reasonable assurance as to the integrity and reliability of financial reporting; and
3 It is of the opinion that these Financial Statements and Statement of Service Performance fairly reflect the financial position and operations of this institution for the year ended 31 December 2019.
The financial statements were authorised for issue by the Ara Institute of Canterbury Council on 31 March 2020.
Dr Thérèse Arseneau Chair of Council
Tony Gray Chief Executive
Darren Mitchell Deputy Chief Executive – Chief Operating Officer

Ara Annual Report 2019
Kā Pūroko PūteaFinancial Statements
2
Parent Group
Notes
Actual 2019
$000
Budget 2019
$000
Actual 2018
$000
Actual 2019
$000
Budget 2019
$000
Actual 2018
$000
Revenue
Government Grants 2 60,349 61,993 62,707 60,349 61,993 62,707
Student Tuition Fees 2 45,003 42,423 40,490 45,003 42,423 40,490
Other Revenue 2 8,467 8,477 8,223 8,655 8,941 8,678
Finance Revenue 2 2,265 2,107 2,049 3,330 2,197 2,282
Gain on Investment Property Revaluations 2 - - - 220 50 130
Total Revenue 116,084 115,000 113,469 117,557 115,604 114,287
Operating Expenses
Employee Benefit Expenses 2 70,500 70,312 70,544 70,500 70,312 70,544
Depreciation Expense 2, 8 11,172 10,234 10,017 11,902 10,785 10,750
Amortisation Expense 2, 9 611 301 364 611 301 364
Finance Costs 2 1,404 - 707 1,940 558 1,252
Other Expenses 2 29,901 32,122 29,203 28,520 31,113 28,130
Loss on Sale of Land and Buildings 2 - - - - - 561
Transformation Expenses 2 2,324 1,800 1,795 2,324 1,800 1,795
Total Operating Expenses 115,912 114,769 112,630 115,797 114,869 113,396
Share of associate (deficit)/surplus 16 (58) - 75 (58) - 78
Net Surplus 114 231 914 1,702 735 969
Other Comprehensive Revenue and Expenses
Gains on Property Revaluations 8 - - 1,863 - - 1,872
Total Other Comprehensive Revenue and Expenses - - 1,863 - - 1,872
Total Comprehensive Revenue and Expenses 114 231 2,777 1,702 735 2,841
Net Operating Surplus analysed for non–recurring items
Parent Group
Actual 2019
$000
Budget 2018
$000
Actual 2018
$000
Actual 2019
$000
Budget 2019
$000
Actual 2018
$000
Net operating surplus 2,438 2,031 2,709 4,026 2,535 2,764
Transformation Expenses* (2,324) (1,800) (1,795) (2,324) (1,800) (1,795)
Net Surplus 114 231 914 1,702 735 969
Items that are non-recurring in nature (not part of normal operations) are indicated with an asterisk.
The accompanying notes form part of these financial statements.
Statement of Comprehensive Revenue and Expensesfor the Year Ended 31 December 2019

Ara Annual Report 2019
Kā Pūroko PūteaFinancial Statements
3
Statement of Financial Positionas at 31 December 2019
Parent Group
Notes
Actual2019
$000
Budget2019
$000
Actual2018
$000
Actual2019
$000
Budget 2019
$000
Actual2018
$000
ASSETS
Current Assets
Cash and Cash Equivalents 3, 18 12,438 6,861 12,943 14,377 11,307 15,773
Trade and Other Receivables 4, 18 3,247 4,005 3,833 3,423 4,055 4,044
Inventories 5 1,027 1,248 1,321 1,027 1,248 1,321
Prepayments 2,291 1,331 1,794 2,291 1,331 1,794
Other Financial Assets 6, 18 60,700 49,000 50,600 60,837 49,000 50,600
Total Current Assets 79,703 62,445 70,491 81,955 66,941 73,532
Non-Current Assets
Land and Buildings 8 295,639 275,259 297,111 320,996 302,039 323,569
Plant and Equipment 8 15,415 15,677 15,109 15,939 15,679 15,284
Investment accounted for using the equity 16 1,151 1,213 1,209 1,151 1,213 1,209
Other Financial Assets 6 - - - 8,659 4,788 6,345
Investment Properties 7 - - - 3,650 2,970 3,000
Intangible Assets 9 2,348 2,149 2,834 2,348 2,149 2,834
Total Non-Current Assets 314,553 294,298 316,263 352,743 328,838 352,241
TOTAL ASSETS 394,256 356,743 386,754 434,698 395,779 425,773
LIABILITIES
Current Liabilities
Trade and Other Payables 10, 18 6,831 6,665 7,903 7,091 6,820 7,968
Finance Leases Current 11 763 583 790 763 583 790
Loans and Borrowings 11 - - - 560 - 467
Employee Benefit Liabilities 12 2,576 1,992 2,424 2,576 1,992 2,424
Revenue Received in Advance 13 17,518 7,607 8,864 17,518 7,607 8,864
Total Current Liabilities 27,688 16,847 19,981 28,508 17,002 20,513
Non-Current Liabilities
Finance Leases Non-current 11 25,266 955 25,585 25,266 955 25,585
Loans and Borrowings 11 - - - 11,895 12,080 12,348
Employee Benefit Liabilities Non current 12 238 238 238 238 239 238
Total Non-Current Liabilities 25,504 1,193 25,823 37,399 13,274 38,171
TOTAL LIABILITIES 53,192 18,040 45,804 65,907 30,276 58,684
NET ASSETS 341,064 338,703 340,950 368,791 365,503 367,089
EQUITY
Accumulated Comprehensive Revenue and Expense
236,408 236,012 236,325 254,245 253,561 252,574
Asset Revaluation Reserve 103,782 101,919 103,782 113,672 111,170 113,672
Trusts and Bequests Reserves 874 772 843 874 772 843
TOTAL EQUITY 341,064 338,703 340,950 368,791 365,503 367,089
The accompanying notes form part of these financial statements

Ara Annual Report 2019
Kā Pūroko PūteaFinancial Statements
4
Statement of Cash Flowsfor the Year Ended 31 December 2019
Parent Group
Notes
Actual2019
$000
Budget2019
$000
Actual2018
$000
Actual2019
$000
Budget 2019
$000
Actual2018
$000
Cash Flows from Operating Activities
Receipts of Government Grants 62,533 61,993 62,721 62,533 61,993 62,721
Receipts of Student Tuition Fees 54,186 41,050 40,108 54,186 41,050 40,108
Receipts of Other Income 6,384 8,663 10,037 6,576 9,127 10,526
Interest Received 2,168 2,107 1,993 2,262 2,197 2,138
Payments to Employees (70,348) (70,347) (71,200) (70,348) (70,347) (71,200)
Payments to Suppliers (31,202) (30,679) (28,541) (29,628) (29,480) (27,369)
Payments relating to transformation costs (2,324) (1,800) (1,795) (2,324) (1,800) (1,795)
Interest Paid - - - (535) (550) (585)
Net Cash Flows from Operating Activities 3 21,397 10,987 13,323 22,722 12,190 14,544
Cash Flows from Investing Activities
Proceeds from Sale of Property, Plant and Equipment 53 - 40 53 - 1,060
Proceeds from Sale and Maturity of Investments 173,948 6,000 178,424 173,948 6,000 178,424
Investment in term deposits - - - (137) - -
Purchase of Investment in Associate - - (374) - - (374)
Purchase of Intangible Assets (125) (550) (869) (125) (550) (869)
Purchase of Property, Plant and Equipment (9,539) (12,666) (8,494) (9,794) (12,816) (8,848)
Purchase of Investments (184,048) - (197,624) (185,405) (50) (198,265)
Net Cash Flows from Investing Activities (19,711) (7,216) (28,897) (21,460) (7,416) (28,872)
Cash Flows from Financing Activities
Equity Scholarship 26 - - 26 - -
Repayments of Loans & Borrowings - - - (467) (560) -
Repayment of Finance Lease Liabilities (2,217) (714) (2,522) (2,217) (714) (2,522)
Net Cash Flows from Financing Activities (2,191) (714) (2,522) (2,658) (1,274) (2,522)
Net (Decrease)/Increase in Cash and Cash Equivalents
(505) 3,057 (18,096) (1,396) 3,500 (16,850)
Cash and Cash Equivalents at the beginning of the year
12,943 3,804 (20,574) 15,773 7,807 32,623
Cash and Cash Equivalents at the end of the year 3 12,438 6,861 12,943 14,377 11,307 15,773
The accompanying notes form part of these financial statements

Ara Annual Report 2019
Kā Pūroko PūteaFinancial Statements
5
Statement of Changes in Equityfor the Year Ended 31 December 2019
Parent Group
Notes
Actual2019
$000
Budget2019
$000
Actual2018
$000
Actual2019
$000
Budget 2019
$000
Actual2018
$000
Balance at 1 January 340,950 338,472 338,173 367,089 356,319 364,248
Total Comprehensive Revenue and Expenses 114 231 2,777 1,702 735 2,841
Revaluation Adjustment - - - - 8,449 -
Balance at 31 December 341,064 338,703 340,950 368,791 365,503 367,089
By Class
Accumulated comprehensive revenue and expense
Balance at 1 January 236,325 235,781 235,482 252,574 252,826 251,675
Net Surplus/(Deficit) for the year 114 231 914 1,702 735 969
Appropriation of Net Surplus to Restricted Reserves (31) - (71) (31) - (70)
Balance at 31 December 236,408 236,012 236,325 254,245 253,561 252,574
Trusts and Bequests Reserves
Balance at 1 January 843 772 772 843 772 772
General bequest funds 26 - 74 26 - 74
Appropriation of Net Surplus 24 - 25 24 - 25
Application of Trusts and Bequests (19) - (28) (19) - (28)
Balance at 31 December 874 772 843 874 772 843
Restricted reserves consist of scholarships, bequests and trust funds held by the Institute on behalf of others.
Asset Revaluation Reserve
Balance at 1 January 103,782 101,919 101,919 113,672 111,170 111,801
Fair Value Revaluation of Land and Buildings - - 1,863 - - 1,872
Balance at 31 December 103,782 101,919 103,782 113,672 111,170 113,672
The asset revaluation reserve is used to record increments and decrements in the fair value of land and buildings to the extent that they offset one another.
Asset Revaluation Reserve is comprised of:
Land 40,104 35,040 40,104 47,674 35,040 47,674
Buildings 63,678 66,879 63,678 65,999 76,130 65,999
103,782 101,919 103,782 113,672 111,170 113,672
The accompanying notes form part of these financial statements

Ara Annual Report 2019
Kā Pūroko PūteaFinancial Statements
6
Statement of Childcare Operating Income and Expenditurefor the Year Ended 31 December 2019 (Parent and Group)
Actual 2019
$
Budget 2019
$
Actual 2018
$
Revenue
Operating Grants 438,081 537,495 511,797
Fees 199,025 245,707 231,832
Total 637,106 783,202 743,629
Expenditure
Salaries and Related Costs 640,031 741,500 666,266
Consumables 4,671 7,040 6,623
Administration 12,662 14,527 8,767
Occupancy Costs 58,000 58,000 58,000
Depreciation 1,203 1,203 1,203
Total 716,567 822,270 740,859
Net Surplus/(Deficit) (79,461) (39,068) 2,770
Total Child Funded Hours 2019 2018
Children Aged Under Two 10,266 11,003
Children Aged Two and Over 9,686 11,009
20 Hours ECE 22,991 27,460
Plus 10 Subsidy 5,264 7,033
Total 48,207 56,505

Ara Annual Report 2019
Kā Pūroko PūteaFinancial Statements
7
*
Statement of Special Supplementary Grants
Ara received funding as Special Supplementary Grants during 2019. These items are subject to Section 199(1)(b) of the Education Act 1989. There is a requirement in Section 199(5) to apply such grants only for the purposes specified. The following statement reports on this obligation and discloses the actual cost to Ara which resulted from the activities funded in this manner.
Grant Title Grant Amount Applied to Salaries & Related Costs
Materials & Services
Total Cost
Net Cost to Ara
$ $ $ $ $
Students with Disabilities 184,402 Students with Disabilities 362,952 18,032 380,984 196,582
Support for Māori and Pacific people
105,363 Support for Māori and Pacific people
179,959 20,672 200,631 95,268
Total 289,765 542,911 38,704 581,615 291,850

Ara Annual Report 2019
Kā Pūroko PūteaFinancial Statements
8
Pu
rsu
ant
to s
ectio
ns
227A
(1) a
nd
235
D(1
) of t
he
Edu
catio
n A
ct 19
89,
Ara
is r
equ
ired
to s
ho
w h
ow
th
e u
se o
f th
e co
mp
uls
ory
fees
for
stu
den
t se
rvic
es is
att
rib
ute
d.
Stu
den
ts a
re c
har
ged
$25
0 in
clu
din
g G
ST fo
r a
full
time
equ
ival
ent
per
an
nu
m.
If th
e st
ud
ent
is e
nro
lled
less
th
an a
full
time
equ
ival
ent
the
fee
is p
ro-r
ated
.
Inco
me
and
exp
end
iture
ass
oci
ated
with
th
e p
rovi
sio
n o
f th
ese
serv
ices
is s
epar
atel
y ac
cou
nte
d fo
r. D
etai
ls o
f th
e ty
pes
of s
ervi
ce a
nd
of t
he
inco
me
and
exp
end
iture
for
the
year
are
set
ou
t b
elo
w:
In 2
019
, In
com
e fr
om
Co
mp
uls
ory
Stu
den
t Se
rvic
e fe
es w
as p
ro-r
ated
acr
oss
cat
ego
ries
on
th
e b
asis
of r
elat
ive
exp
end
iture
.
Stat
emen
t of C
ompu
lsor
y S
tud
ent S
ervi
ces
Fees
Act
ual
20
19To
tal
$00
0A
dvo
cacy
an
d
Leg
al A
dvi
ce
$00
0
Car
eers
In
form
atio
n,
Ad
vice
an
d
Gu
idan
ce $
00
0
Co
un
selli
ng
Se
rvic
es
$00
0
Fin
anci
al
Sup
po
rt a
nd
A
dvi
ce
$00
0
Hea
lth
Ser
vice
s $0
00
Med
ia
Serv
ices
$0
00
Ch
ildca
re
Serv
ices
$0
00
Spo
rts,
Rec
reat
ion
an
d
Cu
ltu
ral A
ctiv
itie
s $0
00
Rev
enu
e
Co
mp
uls
ory
Stu
den
t
Serv
ice
Fees
1,426
40
612
226
177
3430
523
0
Oth
er R
even
ue
99
0-
- -
- 17
0-
637
183
Tota
l Rev
enu
e2,
416
40
612
226
347
349
42
413
Exp
end
iture
3,34
99
61,4
3751
144
1579
717
540
Surp
lus/
(Def
icit
)(9
33)
(56
)(8
25)
(29
)(8
)(6
8)
(45)
225
(127
)
Act
ual
20
18To
tal
$00
0A
dvo
cacy
an
d L
egal
A
dvi
ce
$00
0
Car
eers
In
form
atio
n,
Ad
vice
an
d
Gu
idan
ce $
00
0
Co
un
selli
ng
Se
rvic
es a
nd
P
asto
ral C
are
$00
0
Fin
anci
al
Sup
po
rt a
nd
A
dvi
ce
$00
0
Hea
lth
Ser
vice
s $0
00
Med
ia
Serv
ices
$0
00
Ch
ildca
re
Serv
ices
$0
00
Spo
rts,
Rec
reat
ion
an
d
Cu
ltu
ral A
ctiv
itie
s $0
00
Rev
enu
e
Co
mp
uls
ory
Stu
den
t
Serv
ice
Fees
1,279
344
2731
1922
647
395
100
Oth
er R
even
ue
1,10
0-
- -
- 14
8-
744
208
Tota
l Rev
enu
e2,
379
344
2731
1937
447
1,139
308
Exp
end
iture
2,4
01
64
80
159
364
248
874
118
8
Surp
lus/
(Def
icit
)(2
2)(3
0)
(374
)(2
8)
(17)
(50
)(4
1)39
812
0

Ara Annual Report 2019
Kā Pūroko PūteaFinancial Statements
9
Statement of Compulsory Student Services Fees (continued)
Advocacy and Legal Advice Ara contracts an external agency to provide an independent advocate to directly support students to resolve issues impacting directly on their study or on their ability to study. It also covers the management of student complaints and resolutions including some legal costs. These services are available for all students.
Careers Advice and GuidanceAra provides career development advice and guidance as well as employment information. Career development may start prior to enrolment through assisting people to work through what they want to do and their study options. Students are supported throughout their study to develop the wide range of skills and attributes that will maximise their advantage in the employment market. Students have access to both Career Hub and Student Job Search for finding employment.
"Resources are available for students to work independently, attend workshops/seminars (or drop in sessions) and to have one to one guidance where necessary. These may include topics such as strength/skill identification, strategies to develop skills, attributes and experience, CV writing, letter writing, interview skills and contract negotiation. Students use myGPS app to guide them through the career and work readiness process and to maximise their potential outcomes.
Student Advice and GuidanceStudent advice and guidance includes all generic student advisors (not including the library, learning staff and those who are funded from other sources) who offer support to students to enable them to succeed in their studies, to find solutions and to access services that assist with solving problems they may face. This may include a listening ear, information and support for matters related to Studylink, programme/course selection, accommodation, personal, spiritual, cultural, financial, legal, health and study concerns.
Counselling ServicesAra provides students with access to some free counselling sessions through our health services. Contracts for counselling cover the whole region.
Financial Support and AdviceStudents can access budgeting support with links to effective budgeting and financial management systems as well as support to access scholarships, grants and the Ara (unexpected) financial hardship resource.
Health ServicesThe Christchurch city campus has a Health Centre with doctors and nurses. Woolston campus has an on-site nurse part time during the academic year. In Timaru the Health Centre oversees information about access to low cost health services. In addition, the Health Centre coordinates health promotion events and services that encourage proactive wellbeing and health management to students at all sites. Ara also has agreements in place for students at other campuses to access lower cost (sometimes free) nursing and medical consultations.
Media ServicesAra encourages and supports online learning and communities and maintains information for current students – ‘MyAra’. This holds all key relevant and up to date information for students. A student communications team produce the Ara student Magazine Magazine Waha Kōrero every two months and maintain the student facebook site Ara Student Plug In as well as other documents designed by and for students.
Childcare ServicesThere are two Early Learning Centres on the Madras Campus site, Ara owns and operates the Ara Early Learning Centre and leases facilities to Te Waka Huruhurumanu bilingual centre. Ara has negotiated discounted fees at the Early Learning Centre opposite the Timaru Campus.
Sports, Recreation and Cultural ActivitiesAra provides a wide range of free student events, recreation and activities throughout the academic year at all sites. The events are structured to support student wellbeing and success, fun and connection for example, Freshies for the orientation period.
In addition both Christchurch City and Timaru campuses have gymnasium facilities. Students can purchase a membership to the Christchurch city weights and fitness space at very low cost. There are no other charges for all other classes and facilities including the use of balls, racquets, etc.
Ara supports the development of students groups, club and societies as well as the development of a highly effective student voice and student council. Cultural events include celebration of many language weeks, Polyculture – a celebration of many diverse cultures of Ara students and mark many key ethnic, cultural and spiritual celebrations.

Ara Annual Report 2019
Kā Pūroko PūteaFinancial Statements
10
Notes to the Financial Statements
1 General Information
1.1 Reporting EntityAra Institute of Canterbury (Ara or the Institute) is a Crown Entity established under the Education Act 1989 as a tertiary education institution (TEI). It provides full-time and part-time tertiary education in New Zealand. Ara is established and domiciled in New Zealand. The relevant legislation governing Ara's operations includes the Crown Entities Act 2004 and the Education Act 1989.
The financial statements are for Ara, its subsidiaries, its associate and its joint venture (together, the Group).
Ara and the Group provide educational and research services for the benefit of the community. It does not operate to make a financial return. Accordingly, Ara has designated itself and the Group as public benefit entities (PBEs) for financial reporting purposes.
The financial statements of Ara and Group are for the year ended 31 December 2019. The financial statements were authorised for issue by the Council on 31 March 2020.
1.2 Basis of Preparation The financial statements of the Group have been prepared in accordance with the requirements of the Crown Entities Act 2004 and the Education Act 1989, which include the requirement to comply with New Zealand generally accepted accounting practice (NZ GAAP). The measurement base applied is historical cost except where otherwise identified.
The Minister of Education announced the Government's decisions on the Reform of Vocational Education proposals on 1 August 2019, and has since enacted the Education (Vocational Education and Training Reform) Amendment Act (the Act) on 24 February 2020 to give effect to those reforms.
In essence, the Act reforms the delivery of vocational education in New Zealand by creating a new Crown entity, the New Zealand Institute of Skills and Technology (NZIST) and converting all existing institutes of technology and polytechnics(ITPs) into crown entity companies, which will take over the operational activities of existing ITPs.
The Act disestablishes the Ara Institute of Canterbury and transfers its assets and liabilities to a new company, Ara Institute of Canterbury Ltd on 1 April 2020. As a result Ara Institute of Canterbury has prepared its financial statements on a disestablishment basis.
However, because vocational education will continue to be provided through the Ara Institute of Canterbury no change needs to be made to the measurement or classification of assets and liabilities. Decisions about the future of these assets and liabilities will be the responsibility of the new entity.
The financial statements are presented in New Zealand dollars and all values are rounded to the nearest thousand dollars ($'000). The functional and presentation currency of Ara and the Group is New Zealand dollars ($).
1.3 Budget FiguresThe budget figures for Ara are those approved by the Council prior to the beginning of the financial year. The Group budget figures consists of a combination of the budget of Ara and the individual budgets of the Institute’s subsidiary and associate entities. The budget figures have been prepared in accordance with NZ GAAP, using accounting policies that are consistent with those adopted by Ara in preparing these financial statements.
1.4 Group Structure
Subsidiaries
Ara has the following subsidiaries: Ara Foundation and Ōtautahi Education Development Trust (OEDT). All subsidiaries are incorporated and domiciled in New Zealand.
Associate
Ara holds a 16.7% equity share of its associate TANZ eCampus Limited.
Joint Operation
Ara holds its 50% interest in the Health precinct lease by way of a joint operation. Ara has determined that its interest in the jointly controlled asset constitutes a joint operation, as both parties to the arrangement have rights to the assets,and obligations for the liabilities, relating to the arrangement. Ara recognises its share of assets, liabilities, revenue and expenses of the joint operation. For further details of the lease, refer to note 11.
Principles of Consolidation
The consolidated financial statements comprise the financial statements of Ara (the Parent), its subsidiaries, its associate and its joint operation, as at 31 December each year. The financial statements of subsidiaries and the associate are prepared for the same reporting period as the Parent using consistent accounting policies.
Subsidiaries are entities that are controlled, either directly or indirectly, by the Parent. Subsidiaries are consolidated by aggregating like items of assets, liabilities, revenues, expenses and cash flows on a line-by-line basis. The balances and transactions between subsidiaries and the Parent are eliminated in full.
Subsidiaries are consolidated from the date on which control is transferred to the Group and cease to be consolidated from the date on which control is transferred out of the Group. Where there is loss of control of a subsidiary, the consolidated financial statements include the results for the part of the reporting year during which Ara has control.
Ara Annual Report 2019
Kā Pūroko PūteaFinancial Statements
11
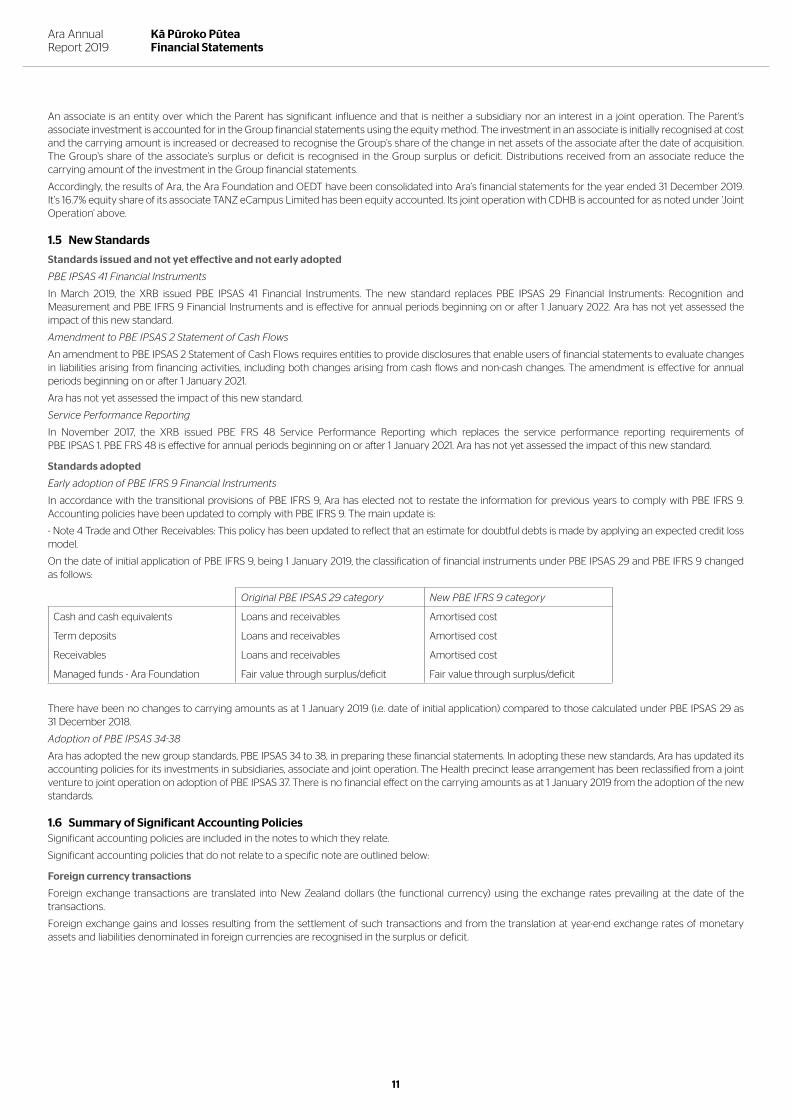
An associate is an entity over which the Parent has significant influence and that is neither a subsidiary nor an interest in a joint operation. The Parent's associate investment is accounted for in the Group financial statements using the equity method. The investment in an associate is initially recognised at cost and the carrying amount is increased or decreased to recognise the Group’s share of the change in net assets of the associate after the date of acquisition. The Group’s share of the associate’s surplus or deficit is recognised in the Group surplus or deficit. Distributions received from an associate reduce the carrying amount of the investment in the Group financial statements.
Accordingly, the results of Ara, the Ara Foundation and OEDT have been consolidated into Ara’s financial statements for the year ended 31 December 2019. It’s 16.7% equity share of its associate TANZ eCampus Limited has been equity accounted. Its joint operation with CDHB is accounted for as noted under 'Joint Operation' above.
1.5 New Standards
Standards issued and not yet effective and not early adopted
PBE IPSAS 41 Financial Instruments
In March 2019, the XRB issued PBE IPSAS 41 Financial Instruments. The new standard replaces PBE IPSAS 29 Financial Instruments: Recognition and Measurement and PBE IFRS 9 Financial Instruments and is effective for annual periods beginning on or after 1 January 2022. Ara has not yet assessed the impact of this new standard.
Amendment to PBE IPSAS 2 Statement of Cash Flows
An amendment to PBE IPSAS 2 Statement of Cash Flows requires entities to provide disclosures that enable users of financial statements to evaluate changes in liabilities arising from financing activities, including both changes arising from cash flows and non-cash changes. The amendment is effective for annual periods beginning on or after 1 January 2021.
Ara has not yet assessed the impact of this new standard.
Service Performance Reporting
In November 2017, the XRB issued PBE FRS 48 Service Performance Reporting which replaces the service performance reporting requirements of PBE IPSAS 1. PBE FRS 48 is effective for annual periods beginning on or after 1 January 2021. Ara has not yet assessed the impact of this new standard.
Standards adopted
Early adoption of PBE IFRS 9 Financial Instruments
In accordance with the transitional provisions of PBE IFRS 9, Ara has elected not to restate the information for previous years to comply with PBE IFRS 9. Accounting policies have been updated to comply with PBE IFRS 9. The main update is:
- Note 4 Trade and Other Receivables: This policy has been updated to reflect that an estimate for doubtful debts is made by applying an expected credit loss model.
On the date of initial application of PBE IFRS 9, being 1 January 2019, the classification of financial instruments under PBE IPSAS 29 and PBE IFRS 9 changed as follows:
Original PBE IPSAS 29 category New PBE IFRS 9 category
Cash and cash equivalents Loans and receivables Amortised cost
Term deposits Loans and receivables Amortised cost
Receivables Loans and receivables Amortised cost
Managed funds - Ara Foundation Fair value through surplus/deficit Fair value through surplus/deficit
There have been no changes to carrying amounts as at 1 January 2019 (i.e. date of initial application) compared to those calculated under PBE IPSAS 29 as 31 December 2018.
Adoption of PBE IPSAS 34-38
Ara has adopted the new group standards, PBE IPSAS 34 to 38, in preparing these financial statements. In adopting these new standards, Ara has updated its accounting policies for its investments in subsidiaries, associate and joint operation. The Health precinct lease arrangement has been reclassified from a joint venture to joint operation on adoption of PBE IPSAS 37. There is no financial effect on the carrying amounts as at 1 January 2019 from the adoption of the new standards.
1.6 Summary of Significant Accounting PoliciesSignificant accounting policies are included in the notes to which they relate.
Significant accounting policies that do not relate to a specific note are outlined below:
Foreign currency transactions
Foreign exchange transactions are translated into New Zealand dollars (the functional currency) using the exchange rates prevailing at the date of the transactions.
Foreign exchange gains and losses resulting from the settlement of such transactions and from the translation at year-end exchange rates of monetary assets and liabilities denominated in foreign currencies are recognised in the surplus or deficit.

Ara Annual Report 2019
Kā Pūroko PūteaFinancial Statements
12
Goods and Services Tax (GST)
All items in the financial statements are stated exclusive of GST, except for trade receivables and payables, which are stated on a GST inclusive basis. Where GST is not recoverable as input tax then it is recognised as part of the related asset or expense.
The net amount of GST recoverable from, or payable to, the Inland Revenue Department (IRD) is included as part of receivables or payables in the Statement of Financial Position.
The net GST paid to, or received from the IRD, including the GST relating to investing and financing activities, is classified as a net operating cash flow in the Statement of Cash Flows.
Commitments and contingencies are disclosed exclusive of GST.
Taxation
Ara and the Group are exempt from the payment of income tax as it is classified by the IRD as a charitable organisation. Accordingly, no charge for income tax applies or has been provided for.
Critical accounting judgements, estimates and assumptions
In preparing these financial statements, Ara has made estimates and assumptions concerning the future. These estimates and assumptions may differ from the subsequent actual results. Estimates and assumptions are continually evaluated and are based on historical experience and other factors, including expectations or future events that are believed to be reasonable under the circumstances.
The estimates and assumptions that have a significant risk of causing a material adjustment to the carrying amounts of assets and liabilities within the next financial year are:
- Estimating the fair value of land, buildings and infrastructure - refer to note 8.
- Long service leave - refer to note 12.
Management has exercised the following critical judgements in applying accounting principles:
- Crown owned land and buildings - refer to note 8.
- Accounting treatment of the Manawa lease - refer to Note 11.
Comparatives
When presentation or classification of items in the financial statements is amended or accounting policies are changed voluntarily, comparative figures are restated to ensure consistency with the current period unless it is impractical to do so.

Ara Annual Report 2019
Kā Pūroko PūteaFinancial Statements
13
Notes to the Financial Statements
2 Revenue and Expenses
Revenue Accounting Policy
Revenue classificationRevenue is measured at fair value. Ara classifies its revenue into exchange and non–exchange transactions.
Exchange transactionsAn exchange transaction is one in which Ara receives assets or services, or has liabilities extinguished, and directly gives approximately equal value (primarily in the form of cash, goods, services, or use of assets) to another entity in exchange.
Non–exchange transactionsA non–exchange transaction is one in which Ara either receives value from another entity without directly giving approximately equal value in exchange, or gives value to another entity without directly receiving approximately equal value in exchange. Included in this category are transfers, which are inflows of future economic benefits or service potential from non–exchange transactions.
The specific accounting policies for significant revenue items are explained below:
Student Achievement Component (SAC) fundingSAC funding is the Institute’s main source of operational funding from the Tertiary Education Commission (TEC). The Institute considers SAC funding to be non-exchange and recognises SAC funding as revenue when the course withdrawal date has passed, based on the number of eligible students enrolled in the course at that date and the value of the course.
Government Fees FreeThe Institute considers Government Fees Free funding to be non-exchange and recognises it as revenue when the course withdrawal date has been passed by an eligible student.
Performance–Based Research Fund (PBRF)PBRF funding is considered to be non-exchange in nature. PBRF funding is specifically identified by the TEC as being for a funding period as required by section 159YA of the Education Act 1989. Ara recognises its confirmed allocation of PBRF funding at the commencement of the specified funding period, which is the same as Ara's financial year. PBRF revenue is measured based on Ara's funding entitlement adjusted for any expected adjustments as part of the final wash-up process. Indicative funding for future periods is not recognised until confirmed for that future period.
Student Tuition FeesDomestic student tuition fees are subsidised by government funding and are considered non-exchange. Revenue is recognised when the course withdrawal date has passed, which is when a student is no longer entitled to a refund for withdrawing from the course. International student tuition fees are accounted for as exchange transactions and recognised as revenue on a course percentage of completion basis. The percentage of completion is measured by reference to the days of the course completed as a proportion of the total course days.
Interest Interest revenue is recognised using the effective interest method.

Ara Annual Report 2019
Kā Pūroko PūteaFinancial Statements
14
Revenue Parent Group
2019$000
2018$000
2019$000
2018$000
Government Grants
Normal Operational Grants 60,059 62,414 60,059 62,414
Special Supplementary Grants 290 293 290 293
Total Government Grants 60,349 62,707 60,349 62,707
Student Tuition Fees 45,003 40,490 45,003 40,490
Other Revenue
Gains on Disposal of Property, Plant and Equipment 53 40 53 40
Revenue from Other Operating Activities 8,414 8,183 8,602 8,638
Total Other Revenue 8,467 8,223 8,655 8,678
Finance Revenue
Interest Earned on Investments (including Bank Deposits) 2,265 2,049 3,330 2,201
Gains on Changes in Investments classified as Fair Value through Profit and Loss
- - - 81
Total Finance Revenue 2,265 2,049 3,330 2,282
Gain on Property Investment Revaluations - - 220 130
Total Revenue 116,084 113,469 117,557 114,287
Revenue under exchange and non exchange transactions
Revenue under exchange transactions
International Student Fees 16,636 14,232 16,636 14,232
Other Revenue 6,862 6,694 7,050 7,149
Finance Revenue 2,265 2,049 3,330 2,282
Gain on Property Investment Revaluations - - 220 130
Total Exchange Revenue 25,763 22,975 27,236 23,793
Other exchange revenue is mainly made up of: teaching delivery to external parties, student accommodation rent, facilities hire and restaurant revenue.
Revenue under non exchange transactions
Government Grants 60,349 62,707 60,349 62,707
Domestic Student Fees 26,941 24,979 26,941 24,979
Student Services Levy 1,426 1,279 1,426 1,279
Other Revenue 1,605 1,529 1,605 1,529
Total Non Exchange Revenue 90,321 90,494 90,321 90,494
Other Non Exchange revenue is mainly Industry Training Organisations (ITOs) revenue.
Total Revenue 116,084 113,469 117,557 114,287
Expenses
Finance Charge* 1,404 707 1,404 707
Interest on Bank Loans - - 536 545
Total Finance Costs 1,404 707 1,940 1,252
*Finance charge arises as a result of the Manawa lease classification. The lease is not funded through loans or borrowings, therefore the interest charge is a non cash item. Refer to Note 11 for an explanation of this charge.
Employee Benefit Expenses
Wages and Salaries 70,348 71,200 70,348 71,200
Increase (Decrease) in Employee Benefit Liabilities 152 (656) 152 (656)
Total Employee Benefit Expenses 70,500 70,544 70,500 70,544

Ara Annual Report 2019
Kā Pūroko PūteaFinancial Statements
15
Parent Group
2019$000
2018$000
2019$000
2018$000
Depreciation Expense 11,172 10,017 11,902 10,750
Amortisation Expense 611 364 611 364
Other Expenses
Audit New Zealand Fees for Financial Statement Audits 192 186 192 186
Other Auditor Fees for Audit of Ara Foundation and OEDT Financial Statements
- - 20 9
Donations Made 14 8 14 8
Impairment of Receivables (Note 4) (19) (8) (19) (8)
Research and Development Expenditure 259 351 259 351
Minimum Lease Payments under Operating Leases 2,073 2,256 2,073 2,256
Other Operating Expenses 27,382 26,410 25,981 25,328
Total Other Expenses 29,901 29,203 28,520 28,130
There are no unfulfilled conditions or other contingencies attached to government grants recognised.
Gains(losses) on sale of land and buildings - - - 561
Transformation Expenses 2,324 1,795 2,324 1,795
Total Expenses 115,912 112,630 115,797 113,396
Notes to the Financial Statements
2 Revenue and Expenses (continued)

Ara Annual Report 2019
Kā Pūroko PūteaFinancial Statements
16
Notes to the Financial Statements
3 Cash and Cash Equivalents
Accounting PolicyCash and cash equivalents comprise cash at bank, cash in hand and short-term deposits with an original maturity of three months or less. The carrying value of short-term deposits with maturity dates of three months or less approximates their fair value. For the purposes of the Statement of Cash Flows, cash and cash equivalents consist of cash and cash equivalents as defined above, net of outstanding bank overdrafts.
Parent Group
2019$000
2018$000
2019$000
2018$000
Cash at Bank and in Hand 12,438 12,943 14,377 15,773
Total Cash and Cash Equivalents 12,438 12,943 14,377 15,773
Included in cash and cash equivalents are unspent funds with restrictions that relate to the delivery of educational services and research by Ara. Other than trust funds, it is not practicable for Ara to provide further detailed information about the restrictions.
Apart from the restricted reserves there is no cash and cash equivalents that can only be used for a specified purpose.
While cash and cash equivalents at 31 December 2019 are subject to the expected credit loss requirements of PBE IFRS 9, no loss allowance has been recognised because the estimated allowance for credit losses is minor.
Reconciliation of net surplus/(deficit) to net cash flows from operating activities
Parent Group
2019$000
2018$000
2019$000
2018$000
Net Surplus 114 914 1,702 969
Add/(Subtract) Non–Cash Items:
Depreciation and Amortisation Expense 11,783 10,381 12,513 11,114
Share of Associate's Deficit/(Surplus) 58 (75) 58 (78)
Gains/(Losses) on the Revaluation of Investments - - (849) 90
Finance Lease Charge 1,404 - 1,404 -
Add/(Subtract) items classified as investing or financing activities:
(Gains)/Losses on Disposal of Property, Plant and Equipment (53) (40) (53) (40)
(Gains)/Losses on Sale of Land & Buildings - - - 561
Revaluation of Investment Properties - - (220) (130)
Equity Scholarship (26) - (26) -
Add/(Subtract) movements in working capital items:
Accounts Receivable 586 173 621 142
Inventories 294 (73) 294 (73)
Prepayments (497) 204 (497) 204
Accounts Payable (1,072) 1,238 (1,031) 1,184
Income in Advance 8,654 1,257 8,654 1,257
Employee Benefits 152 (656) 152 (656)
Net Cash Inflow from Operating Activities 21,397 13,323 22,722 14,544

Ara Annual Report 2019
Kā Pūroko PūteaFinancial Statements
17
Notes to the Financial Statements
4 Trade and Other Receivables
Accounting PolicyStudent fees and other receivables are classified as financial assets measured at amortised cost and carried at the amount due less any allowance for expected credit losses.
Ara applies the simplified expected credit loss model of recognising lifetime expected credit losses for receivables.
In measuring expected credit losses, short-term receivables have been assessed on a collective basis as they possess shared credit risk characteristics. They have been grouped based on the days past due. Short-term receivables are written off when there is no reasonable expectation of recovery.
The expected credit loss rates for receivables at 31 December 2019 are based on the payment profile of revenue in credit over prior years at the measurement date and the corresponding historical credit losses experienced. Estimation of expected credit loss rates incorporates consideration of the proportion of debt referred to debt collection agencies and subsequent non-recovery. The historical loss rates are adjusted for current and forward-looking macroeconomic factors that might affect the recoverability of receivables. Given the short period of credit risk exposure, the impact of macroeconomic factors is not considered significant.
Previous accounting policy for impairment of receivables
For the previous year, an estimate for doubtful debts was made when collection of the full amount was no longer probable.
Parent Group
2019$000
2018$000
2019$000
2018$000
Current
Trade Receivables 2,908 2,891 3,084 3,102
Bank Interest Receivable 391 294 391 294
Related Party Receivables 207 927 207 927
Less: Allowance for credit losses (259) (279) (259) (279)
Total Current Receivables 3,247 3,833 3,423 4,044
The carrying value of trade and other receivables approximates their fair value.
Total Receivables comprise:
Receivables from exchange transactions 1,472 1,973 1,648 2,184
Receivables from non–exchange transactions 1,775 1,860 1,775 1,860
Total Receivables 3,247 3,833 3,423 4,044
Parent Group
2019$000
2018$000
2019$000
2018$000
Maturity Analysis
Current 2,674 3,218 2,850 3,429
Overdue but not Impaired 61 to 90 days 73 112 73 112
Overdue but not Impaired > 90 days 500 503 500 503
3,247 3,833 3,423 4,044
Due to the large number of receivables, the assessment for collectability is based on an analysis of past collection history and write-offs. Ara holds no collateral as security or other credit enhancements over receivables that are either past due or impaired.
Movement in the provision for impairment of receivables is as follows:
Parent Group
2019$000
2018$000
2019$000
2018$000
Allowance for credit losses as at 1 January 2019 calculated under PBE IPSAS 29
279 287 279 287
PBE IFRS 9 expected credit loss adjustment - through opening accumulated surplus/deficit
- n/a - n/a
Opening allowance for credit losses as at 1 January 2019 279 287 279 287
Receivables Written Off During Period (116) 2 (116) 2
Revision in loss allowance made during the year 96 (10) 96 (10)
Closing Balance 259 279 259 279

Ara Annual Report 2019
Kā Pūroko PūteaFinancial Statements
18
Notes to the Financial Statements
5 Inventories
Accounting PolicyInventories are valued at the lower of cost and net realisable value. The cost of inventory is based on a first-in, first-out (FIFO) basis and includes expenditure incurred in acquiring the inventories and in bringing them to their existing location and condition. Net realisable value is the estimated selling price in the ordinary course of activities less the estimated costs necessary to make the sale.
Where inventories are acquired through non-exchange transactions they are measured at fair value at the date of acquisition.
Any write-down from cost to net realisable value or for the loss of service potential is recognised in the surplus or deficit in the year of the write-down.
Parent Group
2019$000
2018$000
2019$000
2018$000
Held for Resale 15 12 15 12
Materials and Consumables 1,012 1,309 1,012 1,309
Total Inventories 1,027 1,321 1,027 1,321
The write–down of inventories held for sale amounted to $Nil (2018 $Nil).

Ara Annual Report 2019
Kā Pūroko PūteaFinancial Statements
19
Notes to the Financial Statements
6 Other Financial Assets and Liabilities
Accounting Policy"Financial assets are initially recognised at fair value plus transaction costs unless they are measured at fair value through surplus or deficit, in which case the transaction costs are recognised in the surplus or deficit. "
Term depositsTerm deposits are initially measured at the amount invested. Where applicable, interest is subsequently accrued and added to the investment balance. Therefore, term deposits are measured at amortised cost.
While term deposits at 31 December 2019 are subject to the expected credit loss requirements of PBE IFRS 9, no loss allowance has been recognised because the estimated allowance for credit losses is minor.
Previous accounting policy:
At year end, term deposits are assessed for indicators of impairment. If they are impaired, the amount not expected to be collected is recognised in the surplus or deficit.
Managed fundThe managed fund is a portfolio of financial assets that are actively traded with the intention of making profits. Therefore, the managed fund is measured at fair value through surplus/deficit.
After initial recognition, the managed fund is measured at fair value, with gains and losses recognised in the surplus or deficit.
Fair value is determined by direct reference to published prices in active markets. Further details can be found in Note 18.
Parent Group
2019$000
2018$000
2019$000
2018$000
Current Portion
Bank Deposits Maturing within 12 months 60,700 50,600 60,837 50,600
Total Current Portion 60,700 50,600 60,837 50,600
Non–current Portion
Bank deposits - OEDT - - 2,900 2,400
Fair Value through Profit and Loss
Managed Funds – Ara Foundation - - 5,759 3,945
Total Non–current Portion - - 8,659 6,345
Effective Interest Rates
Bank Deposits with Maturities of 3–12 months 2.82% 2.92% 2.82% 2.92%
There were no impairment provisions for other financial assets.
Residual Earthquake Insurance proceeds are invested as part of the overall term deposit portfolio. At balance date the insurance proceeds held for future repairs to damaged building stock totalled $28m.
Credit Quality of Financial AssetsThe credit quality of financial assets that are neither past due nor impaired can be assessed by reference to Standard and Poor’s credit ratings (if available) or to historical information about counterparty default rates.

Ara Annual Report 2019
Kā Pūroko PūteaFinancial Statements
20
Parent Group
2019$000
2018$000
2019$000
2018 $000
Counterparties with Credit Ratings
Cash and Cash Equivalents:
AA– Cash at Bank and in Hand 12,438 12,943 14,377 15,773
Total Cash and Cash Equivalents 12,438 12,943 14,377 15,773
Term deposits:
A 12,200 8,500 12,200 8,500
AA– 48,500 42,100 51,537 44,500
Total Term Deposits 60,700 50,600 63,737 53,000
Counterparties without Credit Ratings
Other investments:
Existing Counterparty with no Defaults in the Past – – 5,759 3,945
Total Other Investments – – 5,759 3,945
Notes to the Financial Statements
6 Other Financial Assets and Liabilities (continued)

Ara Annual Report 2019
Kā Pūroko PūteaFinancial Statements
21
Notes to the Financial Statements
7 Investment Properties
Accounting PolicyProperties leased to third parties under operating leases are classified as investment property unless the property is held to meet service delivery objectives, rather than to earn rentals or for capital appreciation. Property held to meet service delivery objectives is classified as property, plant and equipment. Investment properties are initially measured at cost, plus related costs of acquisition.
Where an investment property is acquired at no cost or nominal cost, its cost is deemed to be its fair value as at the date of acquisition.
After initial recognition, investment properties are measured at fair value as determined by independent registered valuers. The fair valuation uses market based evidence. For further details of this type of valuation, refer to the appropriate section of Note 8 discussing market based valuation. Investment properties are valued annually.
Any gains or losses arising from changes in fair value are recognised in the surplus or deficit in the reporting period in which they arise.
Investment properties are derecognised when they have either been disposed of or when the investment property is permanently withdrawn from use and no future benefit is expected from its disposal. The net gain or loss on disposal is calculated as the difference between the carrying amount of the investment property at the time of the disposal and the proceeds on disposal and is included in the surplus or deficit in the reporting period in which the disposal is settled.
Parent Group
2019 $000
2018 $000
2019 $000
2018 $000
Balance 1 January - - 3,000 2,870
Ara Foundation Investment Property Reclassification - - 430 -
Fair Value Gain/(Loss) - - 220 130
Balance 31 December - - 3,650 3,000
The valuation of investment property for OEDT as at 31 December 2019 was performed by an independent registered valuer, Telfer Young, on 17 December 2019. Telfer Young are experienced valuers with extensive market knowledge in the types and location of investment property owned by the Group.
The valuation of investment property for Ara Foundation as at 31 December 2019 was performed by an independent registered valuer, Colliers International Valuation (Chch) Limited, on 13 February 2020. Colliers International Valuation (Chch) Limited are experienced valuers with extensive market knowledge in the types and location of investment property owned by the Group.
Investment property for Ara Foundation was previously recognised in Group Land and Buildings as the investment property was rented by Ara. Ara no longer rent the investment property and, in 2019, there was a reclassification from Group Land and Buildings to Investment Properties. Refer to Note 8 for details on reclassification.
Ara Annual Report 2019
Kā Pūroko PūteaFinancial Statements
22
Notes to the Financial Statements
8 Property, Plant and Equipment
Accounting PolicyProperty, plant and equipment consists of land, buildings, buildings under finance lease, leasehold improvements, computer equipment, computer equipment under finance lease, plant, furniture, vehicles, library collection and art collection.
The measurement basis used for determining the gross carrying amount for each class of assets is as follows:
− Land and buildings are measured at fair value less subsequent accumulated depreciation and impairment losses.
− All other asset classes are measured at cost less accumulated depreciation and impairment losses.
AdditionsThe cost of an item of property, plant, and equipment is recognised as an asset if, and only if, it is probable that future economic benefits or service potential associated with the item will flow to Ara and the Group and the cost of the item can be measured reliably.
Work in progress is recognised at cost less impairment and is not depreciated.
In most instances, an item of property, plant, and equipment is initially recognised at its cost. Where an asset is acquired through a non-exchange transaction at no cost, or for a nominal cost, it is recognised at fair value as at the date of acquisition.
DisposalsGains and losses on disposals are determined by comparing the disposal proceeds with the carrying amount of the asset. Gains and losses on disposals are reported net in the surplus or deficit. When revalued assets are disposed, the amounts included in the asset revaluation reserves in respect of those assets are transferred to retained earnings.
Subsequent costs Costs incurred subsequent to initial acquisition are capitalised only when it is probable that future economic benefits or service potential associated with the item will flow to the Group and the cost of the item can be measured reliably.
The costs of day-to-day servicing of property, plant and equipment are recognised in the surplus or deficit as they are incurred.
DepreciationAll items of property, plant and equipment, other than land and the art collection, are depreciated using the straight-line method, at rates that will write off the cost of assets less their residual values, over their estimated remaining useful lines. Depreciation rates used are as follows:
Ara
− Buildings – 1.1% -3.3%
− Buildings under finance lease – 3.33%
− Computer equipment – 10% - 33.3%
− Plant – 5% - 20%
− Furniture – 10%
− Vehicles – 20%
− Library collection – 10%
− Computer equipment under finance lease – 33.3%
Land and the art collection are not depreciated because they have indefinite or sufficiently long useful lives that any depreciation is considered negligible.
The Group
− Buildings – 1.1% - 4.8%
− Buildings under finance lease – 3.33%
− Computer equipment under finance lease – 10% - 33.3%
− Plant – 5% - 21.6%
− Furniture – 10%
− Vehicles – 20%
− Library collection – 10%
− Computer equipment under finance lease – 33.3%
Land and the art collection are not depreciated because they have indefinite or sufficiently long useful lives that any depreciation is considered negligible.
Impairment of property, plant and equipment held at costProperty, plant and equipment held at cost that have a finite useful life are reviewed for impairment at each balance date and whenever events or changes in circumstances indicate that the carrying amount may not be recoverable. An impairment loss is recognised for the amount by which the asset's carrying amount exceeds its recoverable amount. The recoverable amount is the higher of an asset's fair value less costs to sell and value in use. For revalued assets, any impairment loss is recognised against the revaluation reserve for that class of asset. Where that results in a debit balance in the revaluation reserve, the balance is recognised in the surplus or deficit. For assets not carried at a revalued amount, any impairment loss is recognised in the surplus or deficit.
RevaluationsLand and buildings are revalued with sufficient regularity to ensure their carrying amount does not differ materially from fair value and at least every three years on the basis described below. All other assets are carried at depreciated historical cost. Additions between revaluations are recorded at cost.

Ara Annual Report 2019
Kā Pūroko PūteaFinancial Statements
23
The carrying values of revalued assets are assessed annually to ensure they do not differ materially from fair value. If there is evidence supporting a material difference, then the off-cycle asset classes are revalued. Revaluations for property, plant and equipment are accounted for on a class of asset basis.
The revaluation results are credited or debited to an asset revaluation reserve for that class of asset. Where this results in a debit balance in the asset revaluation reserve, this balance is expensed in the surplus or deficit. Any subsequent increase on revaluation that offsets a previous decrease in value recognised in the surplus or deficit will be recognised first in the surplus or deficit up to the amount previously expensed, and then recognised in the asset revaluation reserve for that class of asset.
LandLand is valued at fair value using market based evidence based on the highest and best use of the land with reference to comparable land values. Restrictions on Ara and the Group's ability to sell land would normally not impair the value of the land because Ara and the Group has operational use of the land and will substantially receive the full benefits of outright ownership.
BuildingsNon-specialised buildings (for example, residential buildings and office buildings) are valued at fair value using market based evidence. Fair values determined by market based evidence is the estimated amount the property would sell for on the date of valuation, between a knowledgeable willing buyer and a knowledgeable willing seller in an arm's length transaction, acting knowledgeably, prudently and without compulsion. The market value methodology takes into account recent sales of comparable properties. Thus, this valuation method is only utilised when there are appropriate comparable property sales to utilise for the valuation. Market based evidence valuation is determined using a number of assumptions. Assumptions used in the 31 December 2018 valuation include:
− Market rents are applied to reflect market value while considering the highest and best use alternatives. An increase (decrease) in the capitalisation rate would decrease (increase) the fair value of non-specialised buildings.
Where market based evidence is inappropriate due to its specialised nature, then buildings are valued on an optimised depreciated replacement cost (DRC) basis. Specialised buildings are buildings specifically designed for educational purposes. They are valued using DRC because no reliable market data is available for such buildings. Depreciated replacement cost valuation is determined using a number of assumptions. Assumptions used in the 31 December 2018 valuation include:
− he replacement costs of the specific assets are adjusted where appropriate for optimisation due to over-design or surplus capacity. There has been no optimisation adjustments for the most recent valuations.
− Replacement costs are derived from construction contracts of like assets, reference to publications such as QV costbuilder, recent costings obtained from construction details and the Property Institute of New Zealand's cost information.
− The remaining useful life of assets is estimated after considering factors such as the condition of the asset, future maintenance and replacement plans, and experience with similar buildings.
− Straight line depreciation has been applied in determining the DRC value of the asset.
Revaluationi) All Parent land and buildings were revalued as at 31 December 2018 in accordance with PBE IPSAS 17. The land and buildings valuation was completed by
independent valuers: Daryl Taggart (BCom (VPM), MPINZ, ANZIV) and Hamish Collins (BCom (VPM), MPINZ) both, Registered Valuers of Quotable Value (QV).
ii) Land and buildings held under the Ara Foundation were revalued as at 31 December 2018 in accordance with PBE IPSAS 17. The valuation was completed by independent valuer Brent McGrath (Bcom (VPM) of Colliers International.
iii) Land and buildings held under the Ōtautahi Education Development Trust were revalued as at 31 December 2017 in accordance with PBE IPSAS 17. The valuation was completed by independent valuer Mark Dunbar (BCom (VPM), ANZIV, SPINZ, AREINZ) of Telfer Young.
iv) The Library resources have been valued by B Roberts of DTZ New Zealand Limited, independent registered valuers, at depreciated replacement cost as at 31 December 2005. This is deemed to be cost. Additions since 31 December 2005 are recorded at cost less accumulated depreciation and any accumulated impairment in value.
Fair value of Christchurch Campus Buildings The buildings at the Christchurch Campus have been valued as if they are undamaged. To reach the fair value of the buildings incorporating earthquake damage, the remaining cost to repair these buildings is deducted from their undamaged value.
The cost to repair estimates have been developed from scopes of work prepared by Pace Project Management. These scopes have been considered and reviewed by consulting engineers and quantity surveyors as part of the insurance settlement process. The estimates have been reviewed by Deloitte, with adjustments made to standardise costs that include project management and preliminary and general costs.
Costs included in the estimates that are actuarial in nature, including escalation, have been removed in determining the fair value. Work completed for earthquake repairs has been deducted from the total expected repair cost, to determine the remaining cost to repair.
Property, Plant and Equipment Critical judgements in applying accounting policies
Crown owned land and buildings
Property in the legal name of the Crown that is occupied by Ara and the Group is recognised as an asset in the Statement of Financial Position. Ara and the Group consider that it has assumed all the normal risks and rewards of ownership of the properties despite legal ownership not being transferred and accordingly it would be misleading to exclude these assets from Ara and the Group's financial statements.

Ara Annual Report 2019
Kā Pūroko PūteaFinancial Statements
24
Not
es to
Fin
anci
al S
tate
men
ts
8 P
rop
erty
, Pla
nt a
nd
Equ
ipm
ent (
con
tin
ued
)
2019
Par
ent
Co
st/
Rev
alu
atio
n1 J
anu
ary
2019
$00
0
Acc
um
ula
ted
Dep
reci
atio
nan
d Im
pai
rmen
t1 J
anu
ary
2019
$00
0
Car
ryin
gA
mo
un
t1 J
anu
ary
2019
$00
0
Cu
rren
t Yea
rA
dd
itio
ns
$00
0R
ecla
ssif
icat
ion
Cu
rren
t Yea
rD
isp
osa
ls$0
00
Cu
rren
t Yea
rD
epre
ciat
ion
$00
0
Rev
alu
atio
nC
han
ges
$00
0
Co
st/
Rev
alu
atio
n
31 D
ecem
ber
20
19$0
00
Acc
um
ula
ted
Dep
reci
atio
nan
d Im
pai
rmen
t31
Dec
emb
er 2
019
$0
00
Car
ryin
gA
mo
un
t31
Dec
emb
er
2019
$00
0
Inst
itutio
n L
and
an
d B
uild
ing
s15
6,3
84
(10
3)15
6,2
81
4,9
799
8,8
48
- (3
,512
)-
260
,211
(3,6
15)
256
,59
6
Cro
wn
Lan
d a
nd
Bu
ildin
gs
115,
517
- 11
5,51
76
28(9
8,8
48
)-
(2,7
09
)-
17,2
97(2
,70
9)
14,5
88
Bu
ildin
gs
un
der
Fin
ance
Lea
se25
,736
(423
)25
,313
- -
- (8
58)
- 25
,736
(1,2
81)
24,4
55
Co
mp
ute
r Eq
uip
men
t15
,50
2(1
1,54
6)
3,9
561,4
94
- (1
41)
(1,6
11)
- 16
,855
(13,
157)
3,6
98
Co
mp
ute
r Eq
uip
men
t u
nd
er
Fin
ance
Lea
se1,1
02
- 1,1
02
46
7-
- (5
77)
- 9
92-
992
Pla
nt
12,5
30(9
,148
)3,
382
1,66
5-
(32)
(873
)-
14,12
5(9
,98
3)4
,142
Furn
iture
11,11
9(7
,78
9)
3,33
055
3-
- (4
96
)-
11,6
72(8
,28
5)3,
387
Veh
icle
s1,9
42
(1,3
18)
624
245
- -
(24
4)
- 2,
182
(1,5
57)
625
Lib
rary
Co
llect
ion
6,3
91
(4,7
72)
1,619
148
- -
(292
)-
6,5
39(5
,06
4)
1,475
Art
Co
llect
ion
1,09
6-
1,09
6-
- -
- 1,0
96
- 1,0
96
Tota
l Par
ent
347,
319
(35,
09
9)
312,
220
10,17
9-
(173
)(1
1,172
)-
356
,70
5(4
5,6
51)
311,
054
2019
Gro
up
Co
st/
Rev
alu
atio
n1 J
anu
ary
2019
$00
0
Acc
um
ula
ted
Dep
reci
atio
nan
d Im
pai
rmen
t1 J
anu
ary
2019
$00
0
Car
ryin
gA
mo
un
t1 J
anu
ary
2019
$00
0
Cu
rren
t Yea
rA
dd
itio
ns
$00
0R
ecla
ssif
icat
ion
Cu
rren
t Yea
rD
isp
osa
ls$0
00
Cu
rren
t Yea
rD
epre
ciat
ion
$00
0
Rev
alu
atio
nC
han
ges
$00
0
Co
st/
Rev
alu
atio
n
31 D
ecem
ber
20
19$0
00
Acc
um
ula
ted
Dep
reci
atio
nan
d Im
pai
rmen
t31
Dec
emb
er 2
019
$00
0
Car
ryin
gA
mo
un
t31
Dec
emb
er
2019
$00
0
Gro
up
Lan
d a
nd
Bu
ildin
gs
186
,659
(3,9
20)
182,
739
4,9
799
8,4
18-
(4,18
3)-
290
,056
(8,10
3)28
1,953
Cro
wn
Lan
d a
nd
Bu
ildin
gs
115,
517
- 11
5,51
76
28(9
8,8
48
)-
(2,7
09
)-
17,2
97(2
,70
9)
14,5
88
Bu
ildin
gs
un
der
Fin
ance
Lea
se25
,736
(423
)25
,313
- -
- (8
58)
- 25
,736
(1,2
81)
24,4
55
Co
mp
ute
r Eq
uip
men
t19
,072
(15,
111)
3,9
61
1,49
4-
(14
1)(1
,611
)-
20,4
25(1
6,7
22)
3,70
3
Co
mp
ute
r Eq
uip
men
t u
nd
er
Fin
ance
Lea
se1,1
02
- 1,1
02
46
7-
- (5
77)
- 9
92-
992
Pla
nt
17,7
02
(14
,151)
3,55
12,
073
- (3
2)(9
32)
- 19
,70
5(1
5,0
45)
4,6
60
Furn
iture
11,11
9(7
,78
9)
3,33
055
3-
- (4
96
)-
11,6
72(8
,28
5)3,
387
Veh
icle
s2,
276
(1,6
51)
625
245
- -
(24
4)
- 2,
516
(1,8
90
)6
26
Lib
rary
Co
llect
ion
6,3
91
(4,7
72)
1,619
148
- -
(292
)-
6,5
39(5
,06
4)
1,475
Art
Co
llect
ion
1,09
6-
1,09
6-
- -
- -
1,09
6-
1,09
6
Tota
l Gro
up
386
,670
(47,
817
)33
8,8
5310
,58
7(4
30)
(173
)(1
1,9
02)
-39
6,0
34(5
9,0
99
)33
6,9
35
Th
ere
was
a r
ecla
ssifi
catio
n o
f Cro
wn
Lan
d a
nd
Bu
ildin
gs
du
rin
g 2
019
as
a re
sult
of t
wo
gaz
ette
no
tices
th
at w
ere
issu
ed. L
egal
ow
ner
ship
on
th
e C
row
n L
and
an
d B
uild
ing
s sp
ecifi
ed in
th
e g
azet
te n
otic
es w
as t
ran
sfer
red
to
Ara
an
d t
he
Gro
up
.
Inve
stm
ent
pro
per
ty f
or
Ara
Fo
un
dat
ion
was
pre
vio
usl
y re
cog
nis
ed i
n G
rou
p L
and
an
d B
uild
ing
as
the
inve
stm
ent
pro
per
ty w
as r
ente
d b
y A
ra. A
ra n
o l
on
ger
ren
t th
e in
vest
men
t p
rop
erty
an
d, i
n 2
019
, th
ere
was
a
recl
assi
ficat
ion
fro
m G
rou
p L
and
an
d B
uild
ing
s to
Inve
stm
ent
Pro
per
ties.
Ref
er to
No
te 7
for
det
ails
on
Inve
stm
ent
Pro
per
ty.

Ara Annual Report 2019
Kā Pūroko PūteaFinancial Statements
25
2018
Par
ent
Co
st/
Rev
alu
atio
n1 J
anu
ary
2018
$00
0
Acc
um
ula
ted
Dep
reci
atio
nan
d Im
pai
rmen
t1 J
anu
ary
2018
$00
0
Car
ryin
gA
mo
un
t1 J
anu
ary
2018
$00
0
Cu
rren
t Yea
rA
dd
itio
ns
$00
0R
ecla
ssif
icat
ion
Cu
rren
t Yea
rD
isp
osa
ls$0
00
Cu
rren
t Yea
rD
epre
ciat
ion
$00
0
Rev
alu
atio
nC
han
ges
$00
0
Co
st/
Rev
alu
atio
n
31 D
ecem
ber
20
18$0
00
Acc
um
ula
ted
Dep
reci
atio
nan
d Im
pai
rmen
t31
Dec
emb
er 2
018
$0
00
Car
ryin
gA
mo
un
t31
Dec
emb
er
2018
$00
0
Inst
itutio
n L
and
an
d B
uild
ing
s16
0,8
14(2
,432
)15
8,3
82
7,147
- -
(2,8
99
)(6
,349
)15
6,3
84
(10
3)15
6,2
81
Cro
wn
Lan
d a
nd
Bu
ildin
gs
112,
220
(2,5
21)
109,
69
912
7-
- (2
,522
)8
,212
115,
517
- 11
5,51
7
Bu
ildin
gs
un
der
Fin
ance
Lea
se-
- -
25,7
36-
- (4
23)
- 25
,736
(423
)25
,313
Co
mp
ute
r Eq
uip
men
t14
,021
(9,9
87)
4,0
341,4
81
- -
(1,5
59)
- 15
,50
2(1
1,54
6)
3,9
56
Co
mp
ute
r Eq
uip
men
t u
nd
er
Fin
ance
Lea
se1,4
58-
1,458
572
- (3
13)
(615
)-
1,10
2-
1,10
2
Pla
nt
12,0
80
(8,2
40
)3,
84
04
60
- 2
(920
)-
12,5
30(9
,148
)3,
382
Furn
iture
10,7
44
(7,3
05)
3,4
3937
5-
- (4
84
)-
11,11
9(7
,78
9)
3,33
0
Veh
icle
s1,8
68
(1,0
78)
790
150
- -
(316
)-
1,94
2(1
,318
)6
24
Lib
rary
Co
llect
ion
6,2
54(4
,49
3)1,7
61
137
- -
(279
)-
6,3
91
(4,7
72)
1,619
Art
Co
llect
ion
1,038
- 1,0
3858
- -
- -
1,09
6-
1,09
6
Tota
l Par
ent
320
,497
(36
,056
)28
4,4
41
36,2
43
- (3
11)
(10
,017
)1,
86
334
7,31
9(3
5,0
99
)31
2,22
0
2018
Gro
up
Co
st/
Rev
alu
atio
n1 J
anu
ary
2018
$00
0
Acc
um
ula
ted
Dep
reci
atio
nan
d Im
pai
rmen
t1 J
anu
ary
2018
$00
0
Car
ryin
gA
mo
un
t1 J
anu
ary
2018
$00
0
Cu
rren
t Yea
rA
dd
itio
ns
$00
0R
ecla
ssif
icat
ion
Cu
rren
t Yea
rD
isp
osa
ls$0
00
Cu
rren
t Yea
rD
epre
ciat
ion
$00
0
Rev
alu
atio
nC
han
ges
$00
0
Co
st/
Rev
alu
atio
n
31 D
ecem
ber
20
18$0
00
Acc
um
ula
ted
Dep
reci
atio
nan
d Im
pai
rmen
t31
Dec
emb
er 2
018
$00
0
Car
ryin
gA
mo
un
t31
Dec
emb
er
2018
$00
0
Gro
up
Lan
d a
nd
Bu
ildin
gs
192,
549
(5,5
42)
187,0
07
7,26
3-
(1,5
85)
(3,6
06
)(6
,34
0)
186
,659
(3,9
20)
182,
739
Cro
wn
Lan
d a
nd
Bu
ildin
gs
112,
220
(2,5
21)
109,
69
912
7-
- (2
,522
)8
,212
115,
517
- 11
5,51
7
Bu
ildin
gs
un
der
Fin
ance
Lea
se-
- -
25,7
36-
- (4
23)
- 25
,736
(423
)25
,313
Co
mp
ute
r Eq
uip
men
t17
,59
1(1
3,55
1)4
,04
01,4
81
- -
(1,5
60
)-
19,0
72(1
5,11
1)3,
96
1
Co
mp
ute
r Eq
uip
men
t u
nd
er
Fin
ance
Lea
se1,4
58-
1,458
572
- (3
13)
(615
)-
1,10
2-
1,10
2
Pla
nt
17,2
47(1
3,21
8)
4,0
294
65
- 2
(94
5)-
17,7
02
(14
,151)
3,55
1
Furn
iture
10,7
44
(7,3
05)
3,4
3937
5-
- (4
84
)-
11,11
9(7
,78
9)
3,33
0
Veh
icle
s2,
202
(1,4
11)
791
150
- -
(316
)-
2,27
6(1
,651
)6
25
Lib
rary
Co
llect
ion
6,2
54(4
,49
3)1,7
61
137
- -
(279
)-
6,3
91
(4,7
72)
1,619
Art
Co
llect
ion
1,038
- 1,0
3858
- -
- -
1,09
6-
1,09
6
Tota
l Gro
up
361,
303
(48
,04
1)31
3,26
236
,36
4-
(1,8
96
)(1
0,7
50)
1,8
7238
6,6
70(4
7,8
17)
338
,853
Not
es to
Fin
anci
al S
tate
men
ts
8 P
rop
erty
, Pla
nt a
nd
Equ
ipm
ent (
con
tin
ued
)
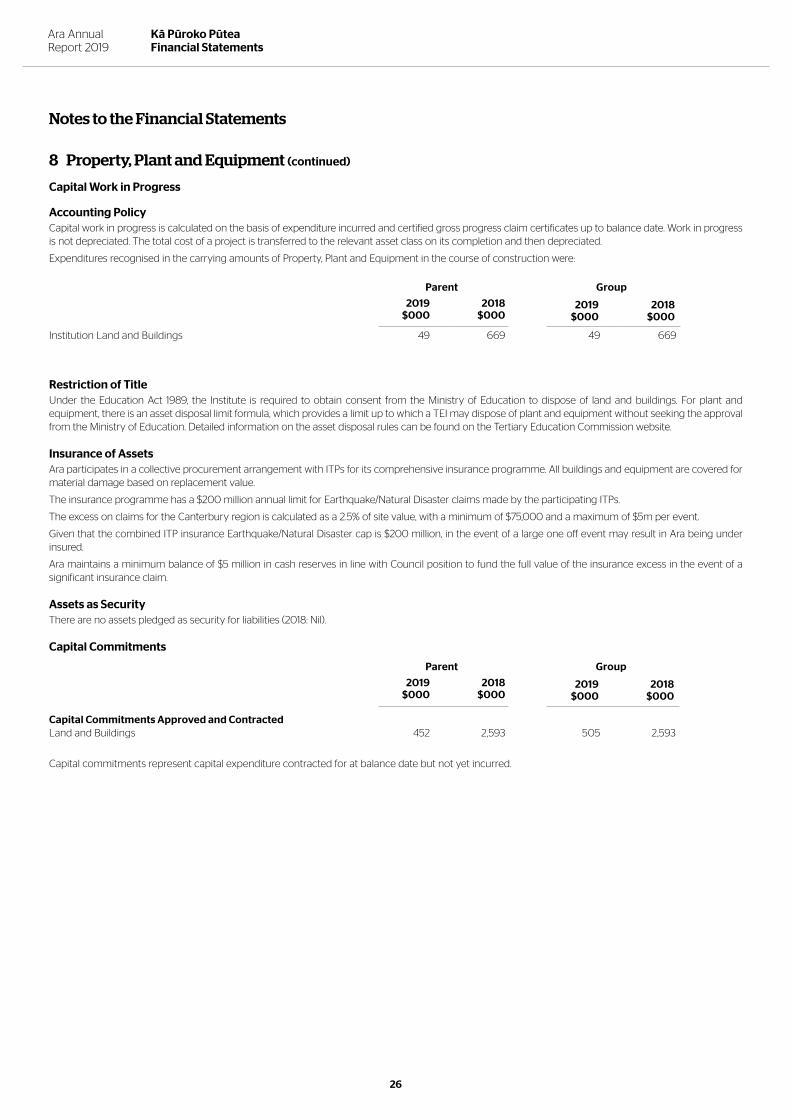
Ara Annual Report 2019
Kā Pūroko PūteaFinancial Statements
26
Notes to the Financial Statements
8 Property, Plant and Equipment (continued)
Capital Work in Progress
Accounting PolicyCapital work in progress is calculated on the basis of expenditure incurred and certified gross progress claim certificates up to balance date. Work in progress is not depreciated. The total cost of a project is transferred to the relevant asset class on its completion and then depreciated.
Expenditures recognised in the carrying amounts of Property, Plant and Equipment in the course of construction were:
Parent Group
2019 $000
2018 $000
2019$000
2018$000
Institution Land and Buildings 49 669 49 669
Restriction of TitleUnder the Education Act 1989, the Institute is required to obtain consent from the Ministry of Education to dispose of land and buildings. For plant and equipment, there is an asset disposal limit formula, which provides a limit up to which a TEI may dispose of plant and equipment without seeking the approval from the Ministry of Education. Detailed information on the asset disposal rules can be found on the Tertiary Education Commission website.
Insurance of AssetsAra participates in a collective procurement arrangement with ITPs for its comprehensive insurance programme. All buildings and equipment are covered for material damage based on replacement value.
The insurance programme has a $200 million annual limit for Earthquake/Natural Disaster claims made by the participating ITPs.
The excess on claims for the Canterbury region is calculated as a 2.5% of site value, with a minimum of $75,000 and a maximum of $5m per event.
Given that the combined ITP insurance Earthquake/Natural Disaster cap is $200 million, in the event of a large one off event may result in Ara being under insured.
Ara maintains a minimum balance of $5 million in cash reserves in line with Council position to fund the full value of the insurance excess in the event of a significant insurance claim.
Assets as SecurityThere are no assets pledged as security for liabilities (2018: Nil).
Capital Commitments
Parent Group
2019$000
2018$000
2019$000
2018$000
Capital Commitments Approved and Contracted Land and Buildings 452 2,593 505 2,593
Capital commitments represent capital expenditure contracted for at balance date but not yet incurred.

Ara Annual Report 2019
Kā Pūroko PūteaFinancial Statements
27
Notes to Financial Statements
9 Intangible Assets
Accounting Policy
Software acquisition and developmentComputer software licenses are capitalised on the basis of the costs incurred to acquire and bring to use the specific software.
Costs that are directly associated with the development of software for internal use are recognised as an intangible asset. Direct costs include software development employee costs and an appropriate portion of relevant overheads.
Staff training costs are recognised as an expense when incurred.
Costs associated with maintaining computer software are recognised as an expense when incurred.
Radio Frequency acquisition and developmentRadio frequency is capitalised on the basis of the costs incurred to acquire.
AmortisationThe carrying value of an intangible asset with a finite life is amortised on a straight line basis over its useful life. Amortisation begins when the asset is available for use and ceases at the date that the asset is derecognised. The amortisation charge for each financial year is expensed in the surplus or deficit.
Gains and losses arising from derecognition of an intangible asset are measured as the difference between the net disposal proceeds and the carrying amount of the asset and are recognised in the surplus or deficit when the asset is derecognised.
The amortisation rates for computer software licenses range from 10-33.3%. The amortisation rates for radio frequency is currently 5%.
Impairment of intangible assetsIntangible assets subsequently measured at cost that have an indefinite useful life, or are not yet available for use, are not subject to amortisation and are tested annually for impairment.
For further details on impairment, refer to the policy for impairment of property, plant and equipment in Note 8. The same approach applies to the impairment of intangible assets.
Research and course development costsResearch and course development costs are recognised as an expense in the year in which they are incurred.

Ara Annual Report 2019
Kā Pūroko PūteaFinancial Statements
28
Not
es to
Fin
anci
al S
tate
men
ts 9
Inta
ngi
ble
Ass
ets
(con
tin
ued
)
2019
Gro
ss C
arry
ing
Am
ou
nt
1 Jan
uar
y 20
19
$00
0
Acc
um
ula
ted
Am
ort
isat
ion
1 Jan
uar
y 20
19
$00
0
Net
Car
ryin
gA
mo
un
t1 J
anu
ary
2019
$0
00
Cu
rren
t Yea
rA
dd
itio
ns
$00
0
Cu
rren
t Yea
rD
isp
osa
ls
$00
0
Cu
rren
t Yea
rA
mo
rtis
atio
n
$00
0
Gro
ss C
arry
ing
Am
ou
nt
31 D
ecem
ber
20
19
$00
0
Acc
um
ula
ted
Am
ort
isat
ion
31 D
ecem
ber
20
19
$00
0
Net
Car
ryin
gA
mo
un
t31
Dec
emb
er 2
019
$0
00
Par
ent
and
Gro
up
– R
adio
Fr
equ
ency
950
(16
8)
782
3-
(20
9)
953
(377
)57
6
Par
ent
and
Gro
up
– S
oft
war
e3,
98
5(1
,933
)2,
052
122
- (4
02)
4,10
7(2
,335
)1,7
72
Tota
l Gro
up
4,9
35(2
,10
1)2
,834
125
- (6
11)
5,0
60
(2,7
12)
2,3
48
2018
Gro
ss C
arry
ing
Am
ou
nt
1 Jan
uar
y 20
18
$00
0
Acc
um
ula
ted
Am
ort
isat
ion
1 Jan
uar
y 20
18
$00
0
Net
Car
ryin
gA
mo
un
t1 J
anu
ary
2018
$0
00
Cu
rren
t Yea
rA
dd
itio
ns
$00
0
Cu
rren
t Yea
rD
isp
osa
ls
$00
0
Cu
rren
t Yea
rA
mo
rtis
atio
n
$00
0
Gro
ss C
arry
ing
Am
ou
nt
31 D
ecem
ber
20
18
$00
0
Acc
um
ula
ted
Am
ort
isat
ion
31 D
ecem
ber
20
18
$00
0
Net
Car
ryin
gA
mo
un
t31
Dec
emb
er 2
018
$0
00
Par
ent
and
Gro
up
– R
adio
Fr
equ
ency
410
(138
)27
254
0-
(30
)9
50(1
68
)78
2
Par
ent
and
Gro
up
– S
oft
war
e3,
656
(1,5
99
)2,
057
329
- (3
34)
3,9
85
(1,9
33)
2,0
52
Tota
l Gro
up
4,0
66
(1,7
37)
2,3
298
69
- (3
64
)4
,935
(2,1
01)
2,8
34
All
inta
ng
ible
ass
ets
are
exte
rnal
ly a
cqu
ired
.
In 2
019
, th
ere
was
no
imp
airm
ent
or
dis
po
sal o
f in
tan
gib
le a
sset
s.
In 2
018
, th
ere
was
no
imp
airm
ent
or
dis
po
sal o
f in
tan
gib
le a
sset
s.
Wo
rk in
Pro
gre
ss
Exp
end
iture
s re
cog
nis
ed in
th
e ca
rryi
ng
am
ou
nts
of I
nta
ng
ible
s in
th
e co
urs
e o
f cre
atio
n w
ere:
Par
ent
Gro
up
2019
$00
020
18$0
00
2019
$00
020
18$0
00
Soft
war
e3,
90
73,
784
3,9
07
3,78
4

Ara Annual Report 2019
Kā Pūroko PūteaFinancial Statements
29
Notes to Financial Statements
10 Trade and Other Payables
Accounting Policy
Trade payables are recorded at the amount payable.
Parent Group
Actual2019
$000
Actual2018
$000
Actual2019
$000
Actual2018
$000
Trade Payables 3,694 4,350 3,954 4,415
Other Payables 2,989 2,939 2,989 2,939
Related Party Payables 148 614 148 614
Total Payables 6,831 7,903 7,091 7,968
Trade and other payables are non–interest bearing and are normally settled by the 20th of the month following invoice, therefore the carrying value of trade and other payables approximates their fair value.
Payables under Exchange Transactions
Trade Payables 3,842 4,962 3,842 4,961
Other Payables 842 818 842 818
Total Payables under Exchange Transactions 4,684 5,780 4,684 5,779
Payables under Non–exchange Transactions
Taxes payable (GST and rates) 1,804 1,828 1,809 1,842
Other Payables 343 295 598 347
Total Payables under Non–exchange Transactions 2,147 2,123 2,407 2,189
Total Payables 6,831 7,903 7,091 7,968
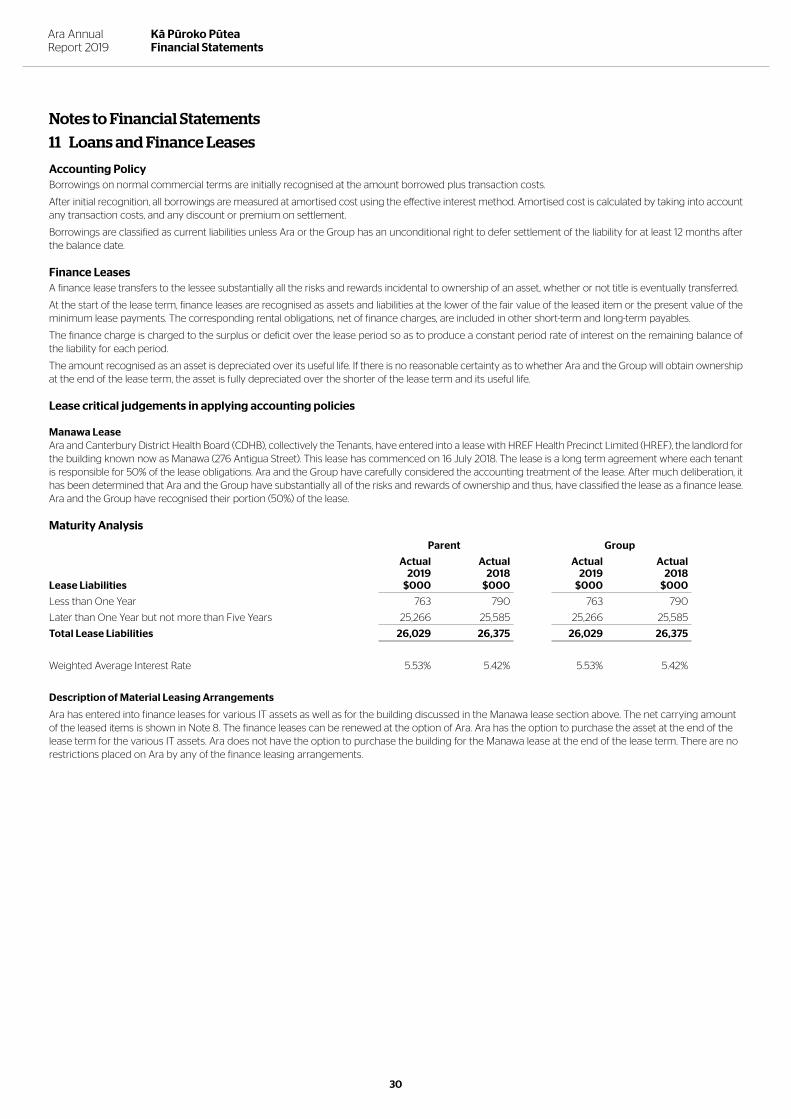
Ara Annual Report 2019
Kā Pūroko PūteaFinancial Statements
30
Notes to Financial Statements
11 Loans and Finance Leases
Accounting PolicyBorrowings on normal commercial terms are initially recognised at the amount borrowed plus transaction costs.
After initial recognition, all borrowings are measured at amortised cost using the effective interest method. Amortised cost is calculated by taking into account any transaction costs, and any discount or premium on settlement.
Borrowings are classified as current liabilities unless Ara or the Group has an unconditional right to defer settlement of the liability for at least 12 months after the balance date.
Finance LeasesA finance lease transfers to the lessee substantially all the risks and rewards incidental to ownership of an asset, whether or not title is eventually transferred.
At the start of the lease term, finance leases are recognised as assets and liabilities at the lower of the fair value of the leased item or the present value of the minimum lease payments. The corresponding rental obligations, net of finance charges, are included in other short-term and long-term payables.
The finance charge is charged to the surplus or deficit over the lease period so as to produce a constant period rate of interest on the remaining balance of the liability for each period.
The amount recognised as an asset is depreciated over its useful life. If there is no reasonable certainty as to whether Ara and the Group will obtain ownership at the end of the lease term, the asset is fully depreciated over the shorter of the lease term and its useful life.
Lease critical judgements in applying accounting policies
Manawa LeaseAra and Canterbury District Health Board (CDHB), collectively the Tenants, have entered into a lease with HREF Health Precinct Limited (HREF), the landlord for the building known now as Manawa (276 Antigua Street). This lease has commenced on 16 July 2018. The lease is a long term agreement where each tenant is responsible for 50% of the lease obligations. Ara and the Group have carefully considered the accounting treatment of the lease. After much deliberation, it has been determined that Ara and the Group have substantially all of the risks and rewards of ownership and thus, have classified the lease as a finance lease. Ara and the Group have recognised their portion (50%) of the lease.
Maturity Analysis
Parent Group
Lease Liabilities
Actual 2019
$000
Actual 2018
$000
Actual 2019
$000
Actual2018
$000
Less than One Year 763 790 763 790
Later than One Year but not more than Five Years 25,266 25,585 25,266 25,585
Total Lease Liabilities 26,029 26,375 26,029 26,375
Weighted Average Interest Rate 5.53% 5.42% 5.53% 5.42%
Description of Material Leasing Arrangements
Ara has entered into finance leases for various IT assets as well as for the building discussed in the Manawa lease section above. The net carrying amount of the leased items is shown in Note 8. The finance leases can be renewed at the option of Ara. Ara has the option to purchase the asset at the end of the lease term for the various IT assets. Ara does not have the option to purchase the building for the Manawa lease at the end of the lease term. There are no restrictions placed on Ara by any of the finance leasing arrangements.

Ara Annual Report 2019
Kā Pūroko PūteaFinancial Statements
31
Contractual Maturity Analysis of Financial LiabilitiesThe table below analyses financial liabilities into relative maturity groupings based on the remaining period at balance date to the contractual maturity date. Future interest payments on floating rate debt are based on the floating rate on the instrument at balance date. The amounts disclosed are the contractual undiscounted cash flows.
CarryingAmount
$000
ContractualCash
Flows$000
Less than
6 months$000
6 to 12months
$000
1 to 2years$000
2 to 3years$000
More than
3 years$000
Parent 2019
Finance Leases 26,029 52,953 1,087 1,067 1,971 1,780 47,048
Secured Loans - - - - - - -
Total 26,029 52,953 1,087 1,067 1,971 1,780 47,048
Group 2019
Finance Leases 26,029 52,953 1,087 1,067 1,971 1,780 47,048
Secured Loans 12,455 16,557 477 477 936 917 13,750
Total 38,484 69,510 1,564 1,544 2,907 2,697 60,798
Group Property Finance Lease Reconciliation 2019
The property lease is disclosed above at the contractual undiscounted cash flows. It is reconciled to the total minimum lease payments at balance date below.
ContractualCash
Flows$000
Less than
6 months$000
6 to 12months
$000
1 to 2years$000
2 to 3years$000
More than
3 years$000
Total minimum lease payments payable 51,959 826 839 1,689 1,665 46,940
Future Finance Charges (26,923) (697) (693) (1,373) (1,355) (22,805)
Present value of minimum lease payments 25,036 129 146 316 310 24,135
Present value of minimum lease payments
Finance leases 25,036 129 146 316 310 24,135
Total present value of minimum lease payments 25,036 129 146 316 310 24,135
CarryingAmount
$000
ContractualCash
Flows$000
Less than
6 months$000
6 to 12months
$000
1 to 2years$000
2 to 3years$000
More than
3 years$000
Parent 2018
Finance Leases 26,375 54,743 1,088 1,148 2,210 1,692 48,605
Secured Loans – – – – – – –
Total 26,375 54,743 1,088 1,148 2,210 1,692 48,605
Group 2018
Finance Leases 26,375 54,743 1,088 1,148 2,210 1,692 48,605
Secured Loans 12,815 17,239 511 511 1,000 978 14,239
Total 39,190 71,982 1,599 1,659 3,210 2,670 62,844
Group Property Finance Lease Reconciliation 2018
The property lease is disclosed above at the contractual undiscounted cash flows. It is reconciled to the total minimum lease payments at balance date below.
ContractualCash
Flows$000
Less than
6 months$000
6 to 12months
$000
1 to 2years$000
2 to 3years$000
More than
3 years$000
Total minimum lease payments payable 53,640 855 826 1,665 1,689 48,605
Future Finance Charges (28,327) (704) (700) (1,390) (1,373) (24,160)
Present value of minimum lease payments 25,313 151 126 275 316 24,445
Present value of minimum lease payments
Finance leases 25,313 151 126 275 316 24,445
Total present value of minimum lease payments 25,313 151 126 275 316 24,445
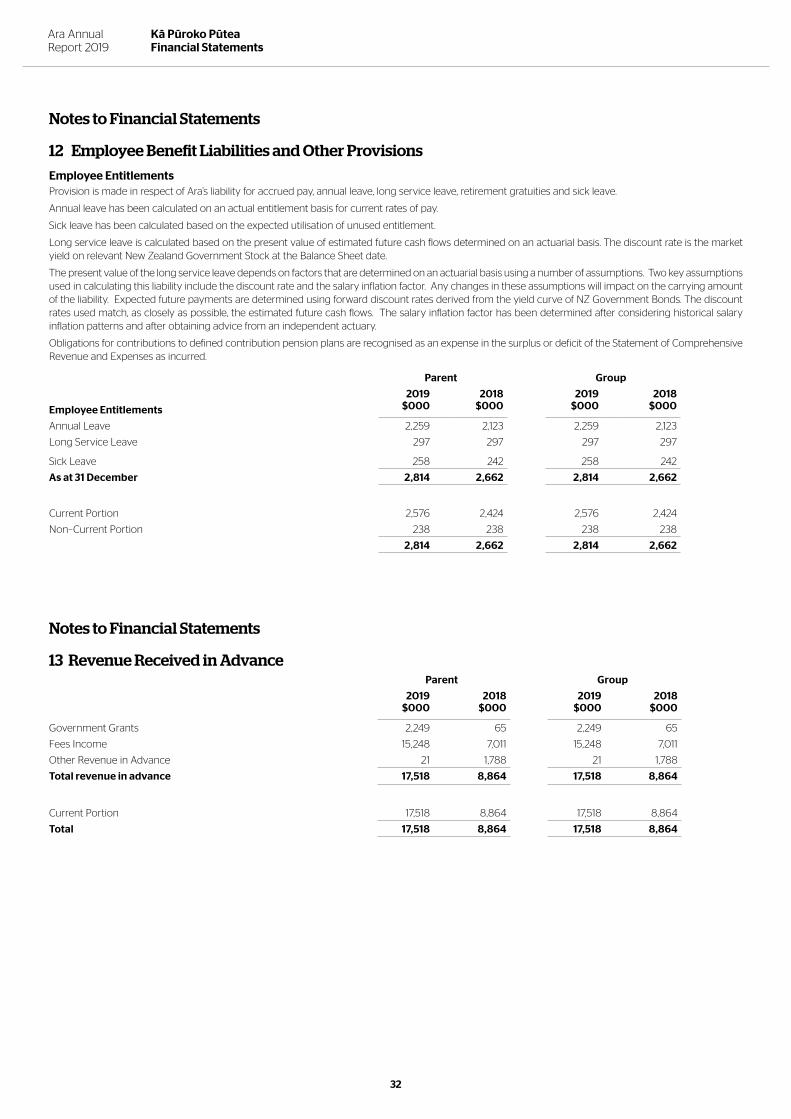
Ara Annual Report 2019
Kā Pūroko PūteaFinancial Statements
32
Notes to Financial Statements
12 Employee Benefit Liabilities and Other Provisions
Employee EntitlementsProvision is made in respect of Ara’s liability for accrued pay, annual leave, long service leave, retirement gratuities and sick leave.
Annual leave has been calculated on an actual entitlement basis for current rates of pay.
Sick leave has been calculated based on the expected utilisation of unused entitlement.
Long service leave is calculated based on the present value of estimated future cash flows determined on an actuarial basis. The discount rate is the market yield on relevant New Zealand Government Stock at the Balance Sheet date.
The present value of the long service leave depends on factors that are determined on an actuarial basis using a number of assumptions. Two key assumptions used in calculating this liability include the discount rate and the salary inflation factor. Any changes in these assumptions will impact on the carrying amount of the liability. Expected future payments are determined using forward discount rates derived from the yield curve of NZ Government Bonds. The discount rates used match, as closely as possible, the estimated future cash flows. The salary inflation factor has been determined after considering historical salary inflation patterns and after obtaining advice from an independent actuary.
Obligations for contributions to defined contribution pension plans are recognised as an expense in the surplus or deficit of the Statement of Comprehensive Revenue and Expenses as incurred.
Parent Group
2019$000
2018$000
2019$000
2018$000Employee Entitlements
Annual Leave 2,259 2,123 2,259 2,123
Long Service Leave 297 297 297 297
Sick Leave 258 242 258 242
As at 31 December 2,814 2,662 2,814 2,662
Current Portion 2,576 2,424 2,576 2,424
Non–Current Portion 238 238 238 238
2,814 2,662 2,814 2,662
Notes to Financial Statements
13 Revenue Received in AdvanceParent Group
2019 $000
2018$000
2019$000
2018$000
Government Grants 2,249 65 2,249 65
Fees Income 15,248 7,011 15,248 7,011
Other Revenue in Advance 21 1,788 21 1,788
Total revenue in advance 17,518 8,864 17,518 8,864
Current Portion 17,518 8,864 17,518 8,864
Total 17,518 8,864 17,518 8,864

Ara Annual Report 2019
Kā Pūroko PūteaFinancial Statements
33
Notes to Financial Statements
14 Operating Leases
Accounting PolicyAn operating lease is a lease that does not transfer substantially all the risk and rewards incidental to ownership of an asset to the lessee. Lease payments under an operating lease are recognised as an expense on a straight line basis over the lease term. Lease incentives received are recognised in the surplus or deficit as a reduction of rental expense over the lease term.
Non–cancellable Operating Lease CommitmentsProperty Leases
Parent Group
Actual 2019
$000
Actual 2018
$000
Actual 2019
$000
Actual 2018
$000
Not later than One Year 1,773 1,881 194 303
Later than One Year and not later than Five Years 4,867 5,048 102 283
Later than Five Years 13,754 14,936 - -
Total Operating Leases 20,394 21,865 296 586
The total of minimum future sublease payments expected to be received under non-cancellable subleases at balance date is $31,236 (2018: $51,525).
Equipment Leases
Not later than One Year 1,482 413 1,482 413
Later than One Year and not later than Five Years 2,578 18 2,578 18
Later than Five Years - - - -
Total Equipment Leases 4,060 431 4,060 431
Description of Material Leasing Arrangements
Property LeasesThe property leases can be renewed at the option of Ara. Ara does not have the option to purchase the property asset at the end of the lease term. There are no restrictions placed on Ara by any of the property leasing arrangements.
Equipment LeasesThe equipment leases can be renewed at the option of Ara. Ara does have the option to purchase the equipment asset at the end of the lease term. There are no restrictions placed on Ara by any of the equipment leasing arrangements.

Ara Annual Report 2019
Kā Pūroko PūteaFinancial Statements
34
Notes to Financial Statements
15 Contingent Assets and Liabilities
ParentAs at 31 December 2019, Ara had no contingent liabilities.
Holiday Act Compliance
Many public and private sector entities, including Ara Institute of Canterbury (Ara), are continuing to investigate potential historic underpayment of holiday entitlements.
For employers such as Ara that have workforces that include differential occupational groups with complex entitlements, non-standard hours, allowances and/or overtime, the process of assessing compliance with the Act and determining the potential underpayment is time consuming and complicated.
To address this issue, management have appointed a payroll specialist, to undertake a full review of Ara’s system, processes and records to determine the scale of the potential issue. There is uncertainty over any actual costs which may arrive from this audit, so any future liability cannot be reasonably estimated.
Ara has not made an estimate and instead disclosed a contingent liability note in its financial statements.
As at 31 December 2018, Ara had no contingent liabilities.
As at 31 December 2018, Ara had no contingent assets.
GroupAs at 31 December 2019, OEDT had no contingent liabilities.
As at 31 December 2018, OEDT had a contingent liability for remedial work to be carried out on the air ventilation system at Ōtautahi House 2, costing
OEDT $100,000-$200,000. No other entities in the Group had any contingencies.

Ara Annual Report 2019
Kā Pūroko PūteaFinancial Statements
35
Notes to Financial Statements
16 Related Party Transactions
Ara is the Parent of the Group and controls two entities, being Ōtautahi Education Development Trust and Ara Foundation, and has an investment in an associate, TANZ eCampus Limited.
Ara is deemed to have significant influence in the investment in TANZ e-Campus as the Ara Chief Executive is a board member and as such is deemed to have power to participate in the financial and operating policy decisions.
Significant transactions with government–related entities The government influences the roles of Ara as well as being a major source of revenue.
Ara has received funding and grants from the Tertiary Education Commission totalling $60 million (2018: $63 million) to provide education and research services for the year ended 31 December 2019.
Ara also leases at a nil rental amount, land and buildings legally owned by the Crown. Further information on the accounting for Crown-owned land and buildings is disclosed in Note 1.6 under the "Critical accounting judgements, estimates and assumptions" section.
Collectively, but not individually, significant transactions with government–related entities In conducting its activities, the Group is required to pay various taxes and levies (such as GST, PAYE and ACC levies) to the Crown and entities related to the Crown. The payment of these taxes and levies is based on the standard terms and conditions that apply to all tax and levy payers. Ara is exempt from paying income tax and FBT.
Ara purchases goods and services from entities related to the Crown and it also provides services to entities related to the Crown. The purchase and provision of goods and services to government-related entities for the year ended 31 December 2019 are small when compared to total expenditure by Ara.
The purchase of goods and services included the purchase of electricity from Meridian, air travel from Air New Zealand and postal services from New Zealand Post. The provision of services to government-related entities is mainly related to the provision of educational courses.
Inter–Group Transactions
Ara Foundation
Ara Foundation is accounted for as a subsidiary of Ara.
The Foundation runs an annual grants programme for staff, students and projects associated with Ara, as well as other initiatives which promote education and enterprise in the region.
Ara appoints four of the nine trustees of the Ara Foundation.
These transactions are not on an arm's length basis as grant applications can only be received from Ara staff and students.
During 2019, Ara's revenue included the following transactions with the Ara Foundation:
2019 $000
2018 $000
Grants 39 27
During 2019, Ara's expenditure included the following transactions with the Ara Foundation:
2019 $000
2018 $000
Lease of ML Block - 34
At 31 December 2019, Ara owed the Foundation $148,374 for earthquake repair insurance proceeds. The Foundation did not owe Ara any monies.
At 31 December 2018, Ara owed the Foundation $148,374 for earthquake repair insurance proceeds. The Foundation did not owe Ara any monies.

Ara Annual Report 2019
Kā Pūroko PūteaFinancial Statements
36
Ōtautahi Education Development TrustŌtautahi Education Development Trust is accounted for as a subsidiary of Ara.
For accounting purposes only the OEDT is a controlled entity under PBE IPSAS 20.
Ara appoints three of the seven trustees of the Ōtautahi Education Development Trust.
During 2019, Ara's revenue included the following transactions with the Trust:
2019 $000
2018 $000
Income 330 24
During 2019, Ara's expenditure included the following transactions with the Trust:
2019 $000
2018 $000
Lease of Student Accommodation Block 1,100 1,100
Lease of B Block Car Park 23 17
Lease of Paxus House 395 395
Lease of ground for Jazz School Building 82 82
At 31 December 2019, OEDT owed Ara $153,139. Ara did not owe OEDT any monies.
At 31 December 2018, neither Ara nor OEDT had monies owing to the other.
TANZ eCampus LtdDuring 2017, TANZ eCampus Limited was established to acquire the intangible asset associated with eCampus and to operate the eCampus business. The members of TANZ each have a 16.7% shareholding in the Company.
2019 $000
2018 $000
Parent and Group - Equity accounted carrying amount 1,151 1,209
Summarised financial information of associate presented on a gross basis
Assets 7,565 8,107
Liabilities 660 853
Revenues 6,422 5,795
Surplus / (deficit) (267) 472
Group's Interest 16.7% 16.7%
At 31 December 2019, TANZ eCampus Limited did not owe Ara any monies, Ara owed Tanz eCampus Limited $92,258
At 31 December 2018, TANZ eCampus Limited did not owe Ara any monies, Ara owed TANZ eCampus Limited $275,569.
Canterbury District Health BoardIn 2018, Ara entered into a joint lease with the CDHB. Ara holds its 50% interest in the Health precinct lease by way of a joint operation. Ara recognises its share of assets, liabilities, revenue and expenses of the joint operation.
During 2019, Ara's revenue included the following transactions with the CDHB:
2019 $000
2018 $000
Manawa Lease & Facility Costs 452 5,010
During 2019, Ara's expenditure included the following transactions with the CDHB:
2019 $000
2018 $000
Manawa lease and facility costs 2,384 1,458
At 31 December 2019, Ara owed the CDHB $46,000. The CDHB owed Ara $53,666.
At 31 December 2018, Ara owed the CDHB $190,044. The CDHB owed Ara $926,765.

Ara Annual Report 2019
Kā Pūroko PūteaFinancial Statements
37
Notes to Financial Statements
16 Related Party Transactions (continued)
Key Management Related Party TransactionsThe Ara Council and Senior Management Team may be directors or officers of other organisations with whom Ara may transact. Such transactions are all carried out independently on an arm's length basis.
During the year, the following people were members of organisations that have entered into transactions with Ara as part of its normal operations.
2019
Purchases Actual
$000
Sales Actual
$000
Accounts Payable
Actual $000
Accounts Receivable
Actual $000
Council Members
Christchurch Symphony Orchestra - 2 - -
Nurse Maude 18 - - -
ChristchurchNZ 110 - 9 -
Rangiora High School - 1 - -
University of Canterbury 6 211 - 1
2018
Purchases Actual
$000
Sales Actual
$000
Accounts Payable
Actual $000
Accounts Receivable
Actual $000
Council Members
Christchurch Symphony Orchestra – 1 – –
Canterbury Employers' Chamber of Commerce 6 – – –
Nurse Maude 18 – – –
J Ballantynes and Company Ltd – 1 – –
ChristchurchNZ 115 – – –

Ara Annual Report 2019
Kā Pūroko PūteaFinancial Statements
38
Other Related PartiesAra is a member of the Tertiary Accord of New Zealand (TANZ), a separate entity launched in early 2000 as an alliance between six of New Zealand's leading tertiary education institutes, to promote best practice in applied education.
During 2019, TANZ invoiced $Nil Ara core fees (2018: $Nil) and $1,317 eCampus project fees (2018: $76,763).
During 2019, Ara invoiced $Nil fees (2018: $Nil) for various services.
At 31 December 2019, neither Ara nor TANZ had monies owing to the other. At 31 December 2018, neither Ara nor TANZ had monies owing to the other. There were no other related party transactions.
Key Management Personnel Compensation
FTE Parent
2019 2018 2019$000
2018$000
Council Members
Council Member Fees 175 184
Executive Management Team, including the Chief Executive
Full time equivalent members 7 8
Salaries and Other Short–term Employee Benefits 1,565 1,871
Termination Benefits - 499
Total Executive Management Team Compensation 1,565 2,370
Total key management personnel compensation 7 8 1,740 2,554
Key management personnel includes all Council Members, the Chief Executive and Division Directors.
RemunerationCouncillor fees paid during the year were:
Group
2019$000
2018$000
T Arseneau (Chairperson) 40 40
J Annear (Deputy Chairperson) 25 25
J Cartwright 20 20
S Collins 10 20
E Hopkins 20 20
J Hunter 20 20
J Boys 20 19
M Taite 20 20
Total Councillors' Remuneration 175 184
No Councillors received compensation or other benefits in relation to cessation (2018: $Nil).

Ara Annual Report 2019
Kā Pūroko PūteaFinancial Statements
39
Notes to Financial Statements
17 Financial Instrument Rules
Ara has a series of policies to manage the risks associated with financial instruments. Ara is risk averse and seeks to minimise exposure from its treasury activities. Ara has an established Council approved Financial Management Policy.
Price riskPrice risk is the risk that the value of a financial instrument will fluctuate as a result of changes in market prices. As the Parent only engages in non-speculative investment it is not exposed to undue price risk. The Group is exposed to equity securities price risk on its investments. This price risk arises due to market movements in listed securities. This price risk is managed by diversification of the investment portfolio.
Currency riskCurrency risk is the risk that the value of a financial instrument will fluctuate due to changes in foreign exchange rates. Ara is not exposed to currency risk as it does not hold financial instruments denominated in foreign currencies.
Interest rate riskThe interest rates on Ara's investments are disclosed in note 6 and on Ara's lease liabilities in note 11. Ara has undertaken a sensitivity analysis of its exposure to interest rate risk on both investments and borrowings. If weighted average interest rates on bank deposits throughout 2019 had fluctuated by plus or minus 2% the effect would have been to increase/decrease the net surplus by $1,601,774 (2018: $1,406,289) as a result of higher/lower interest income on bank deposits.
Fair value interest rate risk Fair value interest rate risk is the risk that the value of a financial instrument will fluctuate due to changes in market interest rates. Borrowing issued at fixed rates exposes Ara to fair value interest rate risk. Ara has a Debt Management policy designed to ensure debt levels are sustainable and servicing costs are minimised.
Cash flow interest rate riskCash flow interest rate risk is the risk that the cash flows from a financial instrument will fluctuate because of changes in market interest rates. Borrowings and investments issued at variable interest rates expose Ara to cash flow interest rate risk. Ara has a Debt Management policy designed to ensure debt levels are sustainable and servicing costs are minimised.
Credit riskCredit risk is the risk that a third party will default on its obligation to Ara causing Ara to incur a loss. In the normal course of business, Ara is exposed to credit risk from cash and term deposits with banks and receivables. Where appropriate Ara undertakes credit checks on potential debtors before granting credit terms. Ara has no significant concentrations of credit risk in relation to debtors and other receivables. The Parent invests funds only in deposits with registered banks and its Financial Management Policy limits the amount of credit exposure to any one institution to 30% of total investment. The Group's exposure to credit risk on its investments is managed by diversification of the investment portfolio. The maximum credit exposure is best represented by the carrying amount in the statement of financial position.
Liquidity riskLiquidity risk is the risk that Ara will encounter difficulty raising liquid funds to meet commitments as they fall due. Ara's Financial Management policy allows short term borrowing to be used to manage liquidity/working capital. Such borrowing takes cognisance of cash flow forecasting and any contingencies which may arise and does not exceed the maximum approved by the Minister of Education.
Concentration of risk
Apart from exposure to the institutions holding the Group's investments and borrowings, the Group is not exposed to any significant concentration of risk.

Ara Annual Report 2019
Kā Pūroko PūteaFinancial Statements
40
Notes to Financial Statements
18 Financial Instrument Categories
Ara considers that the carrying amounts of financial assets and financial liabilities recorded in the financial statements approximate their fair values. The fair values and net fair values of financial assets and financial liabilities are determined as follows:
− The fair value of financial assets and financial liabilities with standard terms and conditions and traded on active liquid markets are determined with reference to quoted market prices.
− For investments in other companies where quoted market prices are not available and valuation techniques are not appropriate, Ara has determined fair value using cost less impairment.
The carrying amounts of financial assets and liabilities in each of the financial instrument categories are as follows:
Parent Group
2019 $000
2018 $000
2019 $000
2018 $000
Financial assets mandatorily measured at fair value through surplus or deficit (2018: Held for trading)
Managed Investment Portfolio - - 5,893 4,937
Total - - 5,893 4,937
Financial assets measured as amortised cost (2018: Loans and receivables)
Cash & cash equivalents 12,438 12,943 14,377 15,773
Receivables 3,247 3,833 3,423 4,044
Bank Deposits Maturing within 12 months 60,700 50,600 60,837 50,600
Total Financial assets at amortised cost 76,385 67,376 78,637 70,417
Financial liabilities measured at amortised cost
Payables 6,831 7,903 7,091 7,968
Secured loans - - 560 467
Finance Leases 26,029 26,375 26,029 26,375
Total Financial Liabilities at Amortised Cost 32,860 34,278 33,680 34,810
For those instruments recognised at fair value in the Statement of Financial Position, fair values are determined according to the following hierarchy:
1 Quoted market price (Level 1) - Financial instruments with quoted prices for identical instruments in active markets.
2 Valuation technique using observable inputs (Level 2) - Financial instruments with quoted prices for similar instruments in active markets or quoted prices for identical or similar instruments in active markets and financial instruments valued using models where all significant inputs are observable.
3 Valuation techniques with significant non-observable inputs (Level 3) - Financial instruments valued using models where one or more significant inputs are not observable.
The following table analyses the basis of the valuation of classes of financial instruments measured at fair value in the Statement of Financial Position:
Valuation Technique
Total Quoted MarketObservable Inputs Price
Significant Non-Observable
Inputs Price
$000 $000 $000 $000
31 December 2019 -Group Financial Assets
Managed Investment Portfolio 5,893 5,893 - -
31 December 2019 -Group Financial Assets
Managed Investment Portfolio 4,937 4,937 - -
There were no transfers between the different levels of the fair value hierarchy.
Ara Annual Report 2019
Kā Pūroko PūteaFinancial Statements
41
Notes to Financial Statements
19 Capital Management
Ara's capital is its equity which comprise general funds, restricted reserves and revaluation reserves. Equity is represented by net assets. Ara manages its revenues, expenses, assets, liabilities, and general financial dealings prudently. Ara’s equity is largely managed as a by-product of managing income, expenses, assets, and liabilities.
The objective of managing Ara’s equity is to ensure Ara effectively achieves its goals and objectives for which it has been established, whilst remaining a going concern.
20 Variances to Budget
This note is prepared in respect of the Group.
Statement of Comprehensive Revenue and ExpensesGovernment Grants were below budget by $1.7m due to lower delivery in some areas of Ministry funded activity.
Student Tuition Fees were above budget by $2.6m, due to international student numbers exceeding targets.
Employee Benefit Expenses were $0.2m above budget due to a mix of restructuring from transformation activities and savings targets not being fully realised within the financial year.
Depreciation was above budget by $1.1m due to recognition of depreciation on a finance leased building.
Overall, the Net Surplus was $1m above the budget.
Statement of Financial PositionCash and Cash equivalents and Other Financial Assets were greater than budget due to better than forecasted cash flow.
Land and buildings was above budget by $19m due to the inclusion of a finance leased building.
Revenue in Advance was $10m above budget due to the timing of payments from students for 2020 delivery as compared to expectation a greater proportion of these payments were received in 2019.
Finance leases exceeded budget due to the treatment of the Manawa lease as a finance lease.
The Asset Revaluation Reserve was ahead of budget as the budget was set prior to the 2018 year end where a revaluation was required to be undertaken which increased the Reserve.
Statement of Cash FlowsThe Statement of Cash Flows largely reflects the variances noted above.
Purchase of Property, Plant and Equipment was $3.0m below budget, due to changes in timing on Campus Development expenditure.
Proceeds from sale and maturity of investments and purchase of investments are monies going onto, and coming off term deposits. These are not budgeted.
Repayment of Finance Lease Liabilities was $1.5m above budget due to the treatment of the Manawa lease as a finance lease.
Statement of Changes in EquityThe Asset Revaluation Reserve was ahead of budget as noted above

Ara Annual Report 2019
Kā Pūroko PūteaFinancial Statements
42
21 Subsequent Events
On 11 March 2020 the World Health Organisation declared the outbreak of a coronavirus (COVID-19) a pandemic and two weeks later the New Zealand Government declared a State of National Emergency. From this the country is at Alert Level 4, and in lockdown. As a result, economic uncertainties have arisen which are likely to negatively affect operations and services.
Described below are the more significant possible effects identified on the Ara institute of Canterbury as a result of the COVID-19 pandemic.
• Government Tuition Funding has been guaranteed, including full payment of expected first year student fee subsidy, regardless of the actual number of students that enrol in 2020. There will also be no recovery of Government funding arising from non-attainment of Educational Performance Indicators. Government Tuition Funding accounts for 61% of Ara’s revenue.
• Student fees revenue will likely be impacted due to the risk that Semester 2 enrolments do not occur to the level expected. Ara typically enrols 20% of its students for Semester 2. Further impact on revenue may arise from students withdrawing from studies. Ara is endeavouring to mitigate this risk as much as possible by implementing distance and online delivery methods for teaching and learning.
• Revenue sources for other than Government funded teaching and learning activity and International student tuition fees, are minimal, approximately 9% of revenue. The most significant risk to other revenue would be the impact on interest revenue arising from the reduction in the Official Cash Rate (OCR) made by the Reserve Bank. All Parent entity investments are in Bank Deposits held with NZ Trading banks. One subsidiary holds a managed fund, which at balance date was valued at $5.759 million consisting of 60% of growth assets and 40% of defensive assets (note 6).
• Ara is not expecting a materially significant increased cost of working arising from the lockdown period. Exploration of cost reduction opportunities is underway including the review of all leases paid to 3rd parties, reduced services to facilities not being utilised, and deferring hire of new staff where feasible until the crisis passes.
• Ara has no loans or borrowings so will not breach any covenants with banks or 3rd party lenders.
• Ara does not expect any impairment to the value of its fixed or intangible assets arising from this event.
• Ara offers a minimal student accommodation service that is generally oversubscribed. Refunds arising from students leaving their accommodation is expected not to be material on the total accommodation revenue earned.
• Across the Ara portfolio of programmes and courses work is well underway to resume teaching and learning using a range of on-line and distance delivery modes where ever possible.
At this time it is difficult to determine the full effect of the COVID-19 pandemic on revenue and expenditure, and there could be other matters that affect the Ara Institute of Canterbury.

Ara Annual Report 2019
Kā Pūroko PūteaFinancial Statements
43
Statement of Resourcesas at 31 December 2019
Workforce (Full-time Equivalent Staff)
Allied Management Teaching Total
Academic, Innovation and Research
Female 69.5 0.5 237.3 307.3
Male 59.5 1.0 212.9 273.5
129.0 1.5 450.3 580.8
Customer Experience and Engagement
Female 158.8 1.0 0.2 160.0
Male 42.9 0.1 43.1
201.7 1.0 0.3 203.1
Corporate Services
Female 42.0 42.0
Male 68.8 1.0 69.8
110.7 1.0 111.7
People and Culture
Female 14.0 1.0 15.0
Male 5.1 5.1
19.1 1.0 20.1
Executive
Female 2.8 2.8
Male 0.2 2.0 2.2
3.0 2.0 5.0
Total
Female 287.1 2.5 237.6 527.1
Male 176.6 4.0 213.1 393.6
Other/Gender Diverse 2.0 2.0
465.6 6.5 450.6 922.8
Percentage by Gender
Female 61.6% 38.4% 52.7% 57.1%
Male 37.9% 61.6% 47.3% 42.7%
Other/Gender Diverse 0.4% 0.0% 0.0% 0.2%
Note: This data is rounded to one decimal place.
Library Collection 2019 2018
Printed books 35,335 42,498
Electronic books 56,420 42,312
Print serial titles 257 235
Electronic serial titles 73,986 28,951
Artworks Collection 2019 2018
Number of artworks 454 398

Ara Annual Report 2019
Te Reta a te Kaitātari KauteAuditor's Report
44Ara Institute of Canterbury and group 2019 Opinion.docx
Independent Auditor’s Report
To the readers of Ara Institute of Canterbury and group’s financial statements and statement of service performance
for the year ended 31 December 2019
The Auditor-General is the auditor of Ara Institute of Canterbury (the Polytechnic) and group. The Auditor-General has appointed me, John Mackey, using the staff and resources of Audit New Zealand, to carry out the audit of the financial statements and statement of service performance of the Polytechnic and group on his behalf.
Opinion
We have audited:
• the financial statements of the Polytechnic and group on pages 2 to 5 and 10 to 42, that comprise the statement of financial position as at 31 December 2019, the statement of comprehensive revenue and expenses, statement of changes in equity and statement of cash flows for the year ended on that date and the notes to the financial statements that include accounting policies and other explanatory information; and
• the statement of service performance of the Polytechnic and group on pages iv to xiii.
In our opinion:
• the financial statements of the Polytechnic and group on pages 2 to 5 and 10 to 42, which have been prepared on a disestablishment basis:
present fairly, in all material respects:
• the financial position as at 31 December 2019; and
• the financial performance and cash flows for the year then ended; and
comply with generally accepted accounting practice in New Zealand in accordance with Public Benefit Entity Reporting Standards; and
• the statement of service performance on pages iv to xiii:
presents fairly, in all material respects, the Polytechnic and group’s service performance achievements as compared with the forecast outcomes included in the investment plan for the year ended 31 December 2019; and
complies with generally accepted accounting practice in New Zealand.
Our audit was completed on 31 March 2020. This is the date at which our opinion is expressed.

Ara Annual Report 2019
Te Reta a te Kaitātari KauteAuditor's Report
45 2
The basis for our opinion is explained below, and we draw your attention to the financial statements being appropriately prepared on a disestablishment basis, and on the possible effects to the Polytechnic as a result of the COVID-19 pandemic.
In addition, we outline the responsibilities of the Council and our responsibilities relating to the financial statements and the statement of service performance, we comment on other information, and we explain our independence.
The financial statements have been appropriately prepared on a disestablishment basis
Without modifying our opinion, we draw your attention to the note on page 10 about the financial statements being prepared on a disestablishment basis. We consider the disestablishment basis to be appropriate because the Polytechnic will cease as an entity and transfer its assets and liabilities to Ara Institute of Canterbury Limited on 1 April 2020 as a result of the reform of the institutes of technology and polytechnics sector.
COVID-19
Without modifying our opinion, we draw your attention to the disclosures in note 21 on page 42 which outline the possible effects to the Polytechnic as a result of the COVID-19 pandemic. It is difficult to determine the full effect of it on the Polytechnic at this time.
Basis for our opinion
We carried out our audit in accordance with the Auditor-General’s Auditing Standards, which incorporate the Professional and Ethical Standards and the International Standards on Auditing (New Zealand) issued by the New Zealand Auditing and Assurance Standards Board. Our responsibilities under those standards are further described in the Responsibilities of the auditor section of our report.
We have fulfilled our responsibilities in accordance with the Auditor-General’s Auditing Standards.
We believe that the audit evidence we have obtained is sufficient and appropriate to provide a basis for our opinion.
Responsibilities of the Council for the financial statements and the statement of service performance
The Council is responsible on behalf of the Polytechnic and group for preparing financial statements that are fairly presented and that comply with generally accepted accounting practice in New Zealand.
The Council is also responsible on behalf of the Polytechnic and group for preparing a statement of service performance that is fairly presented and that complies with generally accepted accounting practice in New Zealand.

Ara Annual Report 2019
Te Reta a te Kaitātari KauteAuditor's Report
46 3
The Council is responsible for such internal control as it determines is necessary to enable it to prepare financial statements and a statement of service performance that are free from material misstatement, whether due to fraud or error.
In preparing the financial statements and the statement of service performance, the Council is responsible on behalf of the Polytechnic and group for assessing the Polytechnic and group’s ability to continue as a going concern. If the Council concludes that the going concern basis of accounting is inappropriate, the Council is responsible for preparing financial statements on a non-going concern basis and making appropriate disclosures.
The Council’s responsibilities arise from the Crown Entities Act 2004 and the Education Act 1989.
Responsibilities of the auditor for the audit of the financial statements and the statement of service performance
Our objectives are to obtain reasonable assurance about whether the financial statements and the statement of service performance, as a whole, are free from material misstatement, whether due to fraud or error, and to issue an auditor’s report that includes our opinion.
Reasonable assurance is a high level of assurance, but is not a guarantee that an audit carried out in accordance with the Auditor-General’s Auditing Standards will always detect a material misstatement when it exists. Misstatements are differences or omissions of amounts or disclosures, and can arise from fraud or error. Misstatements are considered material if, individually or in the aggregate, they could reasonably be expected to influence the decisions of readers taken on the basis of these financial statements and statement of service performance.
For the budget information reported in the financial statements and the statement of service performance, our procedures were limited to checking that the information agreed to the Polytechnic and group’s approved budgets.
We did not evaluate the security and controls over the electronic publication of the financial statements and the statement of service performance.
As part of an audit in accordance with the Auditor-General’s Auditing Standards, we exercise professional judgement and maintain professional scepticism throughout the audit. Also:
• We identify and assess the risks of material misstatement of the financial statements and the statement of service performance, whether due to fraud or error, design and perform audit procedures responsive to those risks, and obtain audit evidence that is sufficient and appropriate to provide a basis for our opinion. The risk of not detecting a material misstatement resulting from fraud is higher than for one resulting from error, as fraud may involve collusion, forgery, intentional omissions, misrepresentations, or the override of internal control.
• We obtain an understanding of internal control relevant to the audit in order to design audit procedures that are appropriate in the circumstances, but not for the purpose of expressing an opinion on the effectiveness of the Polytechnic and group’s internal control.

Ara Annual Report 2019
Te Reta a te Kaitātari KauteAuditor's Report
47
4
• We evaluate the appropriateness of accounting policies used and the reasonableness of accounting estimates and related disclosures made by the Council.
• We conclude on the appropriateness of the non-going concern basis of accounting by the Council.
• We evaluate the overall presentation, structure and content of the financial statements and the statement of service performance, including the disclosures, and whether the financial statements and the statement of service performance represent the underlying transactions and events in a manner that achieves fair presentation.
• We obtain sufficient appropriate audit evidence regarding the financial statements and the statement of service performance of the entities or business activities within the group to express an opinion on the consolidated financial statements and the consolidated statement of service performance. We are responsible for the direction, supervision and performance of the group audit. We remain solely responsible for our audit opinion.
We communicate with the Council regarding, among other matters, the planned scope and timing of the audit and significant audit findings, including any significant deficiencies in internal control that we identify during our audit.
Our responsibilities arise from the Public Audit Act 2001.
Other information
The Council is responsible for the other information. The other information comprises the information included on pages B to D, i to iii, 1, 6 to 9, 43, and 49 to 52 but does not include the financial statements and the statement of service performance, and our auditor’s report thereon.
Our opinion on the financial statements and the statement of service performance does not cover the other information and we do not express any form of audit opinion or assurance conclusion thereon.
In connection with our audit of the financial statements and the statement of service performance, our responsibility is to read the other information. In doing so, we consider whether the other information is materially inconsistent with the financial statements and the statement of service performance or our knowledge obtained in the audit, or otherwise appears to be materially misstated. If, based on our work, we conclude that there is a material misstatement of this other information, we are required to report that fact. We have nothing to report in this regard.
Independence
We are independent of the Polytechnic and group in accordance with the independence requirements of the Auditor-General’s Auditing Standards, which incorporate the independence requirements of Professional and Ethical Standard 1: International Code of Ethics for Assurance Practitioners (including International Independence Standards) (New Zealand) issued by the New Zealand Auditing and Assurance Standards Board.

Ara Annual Report 2019
Te Reta a te Kaitātari KauteAuditor's Report
48
5
Other than the audit, we have no relationship with or interests in the Polytechnic or any of its subsidiaries.
John Mackey Audit New Zealand On behalf of the Auditor-General Christchurch, New Zealand

Ara Annual Report 2019
Whakaōriteka Whiwhika MataurakaEqual Education Opportunities
49
Learning ServicesThroughout 2019, Learning Services sought to continually improve service delivery and processes to meet the needs of Ara students across levels, campuses, in blended and distance learning and particularly those at risk of not succeeding. Group engagements focused on class teaching (190 hours) and workshops (67 hours) including new topics like the importance of a growth mindset. Maths question and answer sessions supported 500 students with queries around specific maths topics. The class teaching remained focused on supporting the development of academic literacies in students at foundation level and in their first year of study.
Ara’s focus on early identification of students at risk and developing a consistent referral process resulted in 3,106 one-on-one engagements in 2019 (12% increase on 2018). The development of online resources continued, with particular focus on information and academic literacy resources for postgraduate students. In collaboration with the Library, a research subject guide was developed for students in postgraduate study.
Disability ServicesIn 2019, 1,768 students self-identified as having a disability (1,790 in 2018) and 207 students registered with Disability Services (a 17% increase on 2018). Of the students registered with Disability Services in 2019, 55% had a Specific Learning Disability e.g. dyslexia, 11% had mental health difficulties (mostly anxiety and depression) and 15% of students had medical or physical conditions/impairments. The remaining students were made up of those with impairments such as autism and sensory disabilities. 69% of students seen by Disability Services were under the age of 25 and 14% of students seen were Māori.
Disability Services ran development workshops for colleagues about supporting students with dyslexia, ADHD, autism and anxiety disorders during 2019. The department was part of a team that delivered a session to Youth Workers at Christchurch’s Festival of Youth. In addition, Disability Services provided training for colleagues and students on the use of Texthelp Read and Write Gold and Inspiration Assistive Technology. The team provided notetaking support for 54 students across 115 courses and NZSL interpreting support for eight deaf students.
Gender
2019 2018
Male students 46.4% 46.1%
Female students 53.5% 53.9%
Ara supports women in non-traditional vocations through scholarships, individual support and regular events that assist students to be successful learners and to build awareness of opportunities, career development skills, work experience, supportive networks and job acquisition. These sessions assist students to be prepared for vocations where they will be in the minority, to succeed in the learning environment and to transition into the workplace. Ara offers this service to relevant students on all campuses.
ChildcareAra endeavours to offer early learning education options through direct service provision and relationships with other operators. Ara operates an Early Learning Centre at the City campus; there is also a privately-run Bilingual Centre (Te Waka Huruhurumanu ki Ōtautahi) at the City campus; in Timaru the North Haven Childcare and Education Centre operate directly opposite the campus. Ara assists Māori and Pacific students with childcare subsidies.
Eliminating HarassmentInformation about harassment is included in student information and on MyAra, the student app. Ara is explicit that discrimination, harassment or intimidation are unacceptable and that the Harassment Complaint Procedure applies to all colleagues, students and visitors.
All students are made aware of their rights and responsibilities during course orientation. They are informed about how and where to seek support if they are experiencing or observing harassment.
Academic and support staff know who to contact to ensure Ara policy and process is adhered to. They are vigilant observers and quick to intervene to stop and manage unacceptable behaviour and ensure appropriate support is offered to victims.
Equal Education Opportunities
SAC course completion
rate
74.9%SAC course completion
rate
Pacific studentsMāori students
72.7%
Student Ethnicity68.4% Pākehā/European
11.3% NZ Māori
5.0% Other
4.1% Pacific
Note: Students may identify with more than one ethnicity.
5.6% Indian
9.7% Other Asian
5.6% Chinese
This chart shows the proportion of enrolled students in 2019 who identify with each ethnic group. Note that the sum adds to more than 100.0% due to students being able to identify with multiple ethnicities.

Ara Annual Report 2019
Whakaōriteka Whiwhika MataurakaEqual Education Opportunities
50
Secondary-Tertiary PathwaysIn 2019, Ara enrolled 456 students in Trades Academy provision, where students spend part of their week at Ara and part at their secondary school. This included students from Timaru, Oamaru, and the wider Christchurch area. Students study in a number of subject areas including retail, cookery, hospitality, hair and beauty, construction, engineering, digital technologies and sustainability and outdoor education.
Targeted FundingAra delivered 44.3 EFTS of Targeted Funding to 106 students covering Intensive Literacy and Numeracy for adults during 2019. An additional 36 students received literacy and numeracy education through the Refugee English Fund.
Adult and Community Education1,273 students enrolled in Adult and Community Education (ACE) courses at Ara in 2019. This included courses in English language, computing, Te Reo Māori and life skills for women through the Next Step Centre. ACE courses were delivered at seven different Ara sites - Christchurch City campus, Bishopdale, New Brighton, Hornby, Rangiora, Timaru and Oamaru.
Māori and PacificIncreasing the participation and achievement of Māori and Pacific students remained a key focus for Ara during 2019. During the year, the institute held a number of events to welcome, support and celebrate Māori and Pacific students and their achievements. Ara continues to be committed to the recruitment and pastoral support of Māori and Pacific students to support their journey. For further details on 2019 participation and achievement of Māori students, please refer to the Statement of Service Performance.

Ara Annual Report 2019
Whakaōriteka Whiwhika MahiEqual Employment Opportunities
51
Equal Employment Opportunities
Colleague Diversity and InclusionIn 2019 Ara started to have shifting conversations which evolved our approach from one of Equal Employment Opportunities to a broader Ara Diversity and Inclusion approach. By the end of the year, Diversity and Inclusion was one of the seven key elements of the People and Culture Strategic Framework and it has been incorporated into the Ara-wide Strategic Focus Areas and Priorities. A three-year, high-level tactical plan has been written, which,with the endorsement of Te Kahui Manukura, the Diversity and Inclusion Working Group, expects to bring into realisation.
Ara has expanded the participant numbers in the group who were informally meeting monthly to explore how the organisation could extend its diverse team and be more inclusive. Diversity Works NZ has been engaged to see what we could gain from their experience. Two colleagues have attended training to determine how Ara can best set up a Diversity and Inclusion Working Group and this will be progressed in 2020.
Age Pro�le
30.2% 50–59
22% >=60
0.1% Unknown
20% 40–49
10.2% 29 >
17.5% 30–39
20% 40% 60%
Women (Gender) at Ara Pro�le
Women as a percentageof all colleagues
Representation ofwomen in leadership- Level 200
Representation ofwomen in leadership- Level 300
Representation ofwomen in leadership- Level 400
62%
40%
55%
36%
NOTE: the ability of colleagues to identify themselves accurately (eg ethnicity, gender) is restricted due to limitations of our HRIS system
Colleague Ethnic DemographicsNoting that Ara data is limited due to the current restrictions of entry in our HRIS system, the demographic representation remains similar year–on-year. There is a very small increase in NZ Māori representation and there is clearer reporting with only a small amount now in the “Unknown” category (compared to 13% in 2018). Ara has increased its engagement with Diversity Works NZ and engaged with their leadership to explore how the institution may get more value from its membership. This will include doing a diagnostic of Ara’s Diversity and Inclusion approach to help shape where to put focus to lift performance in this area.
Colleague Age DemographicsEmployee demographics show a similar aging trend with colleagues aged 40+ at 72.2% compared with 73.6% in 2018. Ara balances the needs of colleagues transitioning towards retirement with operational needs and navigates jointly beneficial solutions. Work in 2019 in the recruitment area was about improving systems to create efficiencies and deliver a better employee experience. As this is embedded, Ara will be able to shift its focus to looking at how the institute markets itself to a wider population group and becomes more inclusive in its offer to a younger market.
20%
Ethnicity Pro�le
New ZealandEuropean/Pakeha
NZ Māori
Pacific
Asian Ethnicities
Other Caucasian (including Europe, UK, Australia, UK and South Africa)
Other
Unknown
7%
2%
67%
14%
7%
2%
1%
40% 60%

Ara Annual Report 2019
Whakaōriteka Whiwhika MahiEqual Employment Opportunities
52
Colleague Gender DemographicsStatistics on gender identification are limited as our HRIS system continues to be restrictive in what can be entered. Some statistics on those who identify themselves as women can be drawn. Overall 62% of Ara’s workforce are women and there is good representation in upper leadership positions. There remains an opportunity to explore what the reasons are behind the lower representation in the middle leadership roles at Ara, which remains at 36%.
Colleague WellbeingThe ‘discovery phase’ of Ara’s Transformation journey identified that a more embedded approach to wellbeing was needed. It was acknowledged that to deliver the strategic focus area of “High Performing Customer-Focused Teams” in a constantly changing environment, wellbeing needs to be ‘built in’ to Ara’s approach. A Health and Wellbeing Manager was appointed in October 2018 and the role is fixed term for two years. Key deliverables include the design and implementation of an Ara Wellbeing Strategy and programme. This programme of work has progressed well with several of the implemented initiatives outlined below.
1 Wellbeing Strategic Framework commenced
Ara’s Wellbeing Strategic Framework (He Ara Hauora – Pathways to Wellbeing) was endorsed by Te Kahui Manukura in February 2019. It has eight key elements focused around My Self, My Organisation and My Team. A more detailed strategy document detailing key focus areas over a three-year period was also produced. Guided by the strategy document, implementation of the Wellbeing Framework is now well advanced.
2 Wellbeing Champions Network
A network of Wellbeing Champions, called the Wellbeing Action Group (WAG), has been established. The group is responsible for planning and implementing several wellbeing initiatives throughout the year. Members of the WAG also act as the wellbeing eyes and ears of the organisation, and a contact point for the dissemination of wellbeing information to the workforce.
3 Wellbeing Workshop
Throughout 2019 a programme of over 30 wellbeing workshops was delivered across Ara’s three Christchurch campuses and the Timaru campus. Around 450 colleagues attended. Key outcomes for the workshops were to increase wellbeing literacy, build a common Ara language related to wellbeing, and introduce attendees to several wellbeing tools they could use to help more actively manage their wellbeing. Workshops were delivered by the New Zealand Institute of Wellbeing and Resilience and were very well received.
4 Colleague Wellbeing Survey
In September 2019 all colleagues were invited to participate in Ara’s inaugural Wellbeing Survey. The survey (run in parallel with the Engagement Survey) was designed to measure aspects of the three key focus areas of the Wellbeing Framework - Self, Team and Organisation. Around 780 colleagues responded to the survey. Managers attended workshops to help them interpret their results and discuss expectations related to acting on the results prior to receiving their results for Self and Team. The Organisation level results will be considered by the Health, Safety and Wellbeing Leadership Group.
Other wellbeing approaches that have continued:
5 Health and Wellness
The provision of health initiatives such as flu inoculations and other health checks have continued to be popular and beneficial to colleagues. Access to physical wellbeing activities (including circuits, futsal, badminton, boxing, yoga, tai chi and Zumba) and discounted gym membership are well received.
6 Smokefree at Ara
Support continues to be provided by the Health Centre and campus signage reflects the Ara Smokefree status.
7 Free Counselling Service for Colleagues
Ara continued to offer free and confidential counselling for colleagues via its external Employee Assistance Programme provider – OCP. During 2019, 108 colleagues (or their immediate family members) accessed counselling sessions through OCP (up from 68 during 2018). This increase may be partly explained by the rise in use of the service following the mosque attacks of March 2019.
Future FocusAra continues to be committed to a diverse, inclusive and resilient workforce and those elements were key enablers of the institute’s Strategic Focus Area of “high performing customer focused teams”. Ara has laid strong foundations in 2019 for an expanded focus and this will be realised by doing the following:
• Establish a Diversity and Inclusion Working Group with a terms of reference and a plan of delivery
• Complete the Diversity Works diagnostic to help shape the plan
• Undergo a Design Thinking process to explore the employee experience of Ara’s current approach to Diversity and Inclusion
• Define priorities and resource bi-cultural capability at Ara, supporting the implementation of the Framework for Māori Achievement
• Continue to further define and roll out the Ara Wellbeing strategy, embedding it into the institute’s practice
• Invest in the enhancement of Ara’s HRIS system to better determine the makeup of the workforce and be more inclusive
• Set goals on how Ara will increase its diversity profile over time to reflect New Zealand and Canterbury of the future

Ara Annual Report 2019

Ara is proud to be a smokefree institute
PO Box 540, Christchurch 8140, New ZealandTelephone 0800 24 24 76 ı Facsimile +64 3 366 6544
www.ara.ac.nz
04347


