Annual Report to Congress on Federal Government Energy Management and Conservation Programs Fiscal Year 2003 August 9, 2005 U.S. Department of Energy Assistant Secretary, Energy Efficiency and Renewable Energy Federal Energy Management Program Washington, DC 20585
Transcript
Annual Report to Congress on Federal Government Energy Management andConservation ProgramsFiscal Year 2003
August 9, 2005
U.S. Department of EnergyAssistant Secretary, Energy Efficiency and Renewable EnergyFederal Energy Management ProgramWashington, DC 20585
Table 3-B Agency Direct Appropriations for Energy Conservation Retrofits and Capital Equipment, FY 1985 through FY 2003 (Thousands of Constant 2003 Dollars) . . . . . . . . . . . . . . . . . . . . . . . . . . . . . A-6
Table 4-A Primary Energy Consumption in Federal Standard Buildings . . . . . . . . . . . . A-7Table 4-B Site-Delivered Energy Consumption in Federal Standard Buildings . . . . . . . A-8Table 5 Consumption and Costs of Federal Standard Buildings Energy
by Fuel Type in FY 2003, FY 2002, and FY 1985 . . . . . . . . . . . . . . . . . . . A-9Table 6-A Federal Standard Buildings Site-Delivered Energy Use
Per Gross Square Foot, FY 1985 and FY 2003 . . . . . . . . . . . . . . . . . . . . . A-10Table 6-B Federal Standard Buildings Primary Energy Use
Per Gross Square Foot, FY 1985 and FY 2003 . . . . . . . . . . . . . . . . . . . . . A-11Table 7 Site-Delivered Energy Consumption in Federal Energy
1Primary energy consumption considers all energy resources used to generate and transport electricity and steam.
Tables 1-A, 4-A, and 6-B show primary energy consumption for comparison with site-delivered consumption shown
in Tables 1-B, 4-B, and 6-A respectively. Conversion factors of 11,850 Btu per kilowatt hour for electricity and
1,390 Btu per pound of steam are used to calculate gross energy consumption.
2DOE/EIA-0384(2003), Annual Energy Review 2003, September 2004, Table 1.3. Data for calendar year 2003.
3Based on site-delivered energy consumption estimates for 2000 in the residential, commercial, industrial, and
transportation sectors (328.1 trillion Btu). Source: DOE/EIA-0214(00), State Energy Consumption Data, 2000 , Table
R1.
4Analytical Perspectives, Budget of the United States Government, Fiscal Year 2003
5Unless otherwise noted, all costs cited in this report are in constant 2003 dollars, calculated using Gross
Domestic Product implicit price deflators. See DOE/EIA-0384(2003), Annual Energy Review 2003, Table D1;
September 2004. Costs noted as nominal dollars reflect the price paid at the time of the transaction and have not
been adjusted to remove the effect of changes in the spending power of the dollar.
1
I. OVERVIEW OF FEDERAL ENERGY CONSUMPTION AND COSTS
This report on Federal Energy Management for fiscal year (FY) 2003 provides information onenergy consumption in Federal buildings, operations, and vehicles and documents activitiesconducted by Federal agencies to meet the statutory requirements of Title V, Part 3, of theNational Energy Conservation Policy Act (NECPA), as amended, 42 U.S.C. §§ 8251-8259,8262, 8262b-k and Title VIII of NECPA, 42 U.S.C. § 8287-8287c. Activities undertaken duringFY 2003 by the Federal agencies under the Energy Policy Act of 1992 (EPACT) are alsodiscussed in this report.
Based on reports submitted to the Department of Energy (DOE) by 29 Federal agencies, the totalprimary energy consumption of the Government of the United States, including energyconsumed to produce, process, and transport energy, was 1.6 quadrillion British Thermal Units(quads) during FY 2003. (Table 1-A)1 These 1.6 quads consumed by the Government inbuildings and operations to provide essential services to its citizens, including the defense of theNation, represent approximately 1.6 percent of the total 98.16 quads2 used in the United States. In total, the Federal Government is the single largest energy consumer in the Nation, although itspattern of consumption is widely dispersed geographically.
The Government consumed 1.1 quadrillion British Thermal Units (quads) during FY 2003 whenmeasured in terms of energy delivered to the point of use (site-delivered energy consumption)(Table 1-B). Unless otherwise noted, this report uses the site-measured conversion factors toconvert common units for electricity and steam to British Thermal Units (Btu). The total site-delivered energy consumption in FY 2003 was 22.7 percent less than the FY 1985 base year. This reduction of 328.2 trillion Btu, which reflects both a drop in Government activity and thesuccess of energy management efforts, could have satisfied the calendar year 2000 energy needsof the State of New Hampshire for more than one year.3
The total cost of the 1.1 quads was $9.6 billion in FY 2003 and represented approximately 0.4percent of the total Federal expenditures of $2.163 trillion4 for all purposes in FY 2003.5 This is$861.9 million less than the $10.5 billion reported in FY 1985, an 8.2 percent decrease in
2
nominal costs. In constant 2003 dollars, this equates to a decrease of 46.6 percent from $18.0billion in FY 1985 to $9.6 billion in FY 2003. (Table 13) The reductions in energy costs from1985 are attributable primarily to reduced energy prices and reduced Government activity,although they also reflect the effects of agency energy management efforts. Many othervariables also contribute to fluctuations in annual energy consumption and costs, includingchanges in building square footage, building stock, weather, tempo of operations, fuel mix, andvehicle, naval, and aircraft fleet composition.
The Federal energy bill for FY 2003 decreased 3.8 percent compared to the previous year.Overall, the unit cost of all fuel types used decreased 10.3 percent, from $9.58 per million Btu to$8.59 per million Btu. Contributing to the overall decrease in unit costs were decreases in theprices paid by the Government for:# Jet Fuel (18.6 percent decrease)# Fuel Oil (9.3 percent decrease)# Electricity (3.4 percent decrease)# Diesel Fuel (15.9 percent decrease)
In addition to prices and Federal energy management activities, many other variables contributeto changes in annual energy use and costs, including changes in square footage, building stock,weather, tempo of operations, fuel mix, and vehicle, naval, and aircraft fleet composition.
In FY 2003, the Department of Defense (DOD) spent $6.9 billion for energy out of the totalFederal energy expenditure of $9.6 billion. Overall, DOD used 27.7 percent less site-deliveredenergy in FY 2003 than in FY 1985—a reflection of reduced Defense-related activity andsuccessful energy management efforts.
FY 2003 was the first year for reporting by the Department of Homeland Security. Significantdeclines in energy use were evident across the sectors for agencies such as the Departments ofTransportation and the Treasury which transferred functions to the new Department.
Figures 1 and 2 depict the percentage of total energy used by the Federal Government in FY2003 and its cost. As illustrated, jet fuel and electricity account for approximately 62.9 percentof the total energy consumption represented in Figure 1 and approximately 70.5 percent of thetotal energy costs in Figure 2.
In FY 2003, petroleum-based fuels accounted for 0.76 quads (758,721.7 billion Btu) of the total1.1 quads consumed by the Federal Government (Table 2). Of that, approximately 0.70 quads(696,160.9 billion Btu) were used by DOD primarily for jet fuel and distillate/diesel for vehiclesand equipment energy. Only 0.04 quads (37,712.7 billion Btu) of petroleum-based fuels wereused for Federal standard buildings energy.
Federal agencies report energy consumption under four categories: 1) standard buildings; 2) industrial, laboratory and other energy intensive facilities; 3) exempt facilities; and 4) vehicles and equipment.
Source: Federal Agency Annual Energy M anagement Data Reports
Note: Sum of components may not equal 100 percent due to independent rounding.
6Cost and consumption figures for FY 1985 may be different from those published in last year’s Annual Report
since Federal agencies update their files and provide revisions to their data.
5
A. Standard Buildings
In FY 2003, the Federal Government used 320.2 trillion Btu to provide energy to 3.0 billionsquare feet of standard buildings space (Table 4-B). This consumption represents a 22.9 percentdecrease compared to FY 1985 and a 0.9 percent increase relative to FY 2002. The significantdrop from FY 1985 reflects the success of Federal energy management efforts in reducing fossilfuel use in Federal facilities. The cost of energy for buildings and facilities in FY 2003 was $3.7billion, a decrease of approximately $79.5 million from FY 2002 expenditures, and a decrease of38.8 percent from the FY 1985 expenditure of $6.1 billion (Table 5).6 Of the $3.7 billion spentfor energy used in standard buildings, $2,158.8 million was spent by DOD with the remaining$1,553.1 million spent by the civilian agencies.
B. Industrial, Laboratory and Other Energy Intensive Facilities
In FY 2003, the Federal Government used 62.4 trillion Btu of energy in energy intensiveoperations, approximately 5.6 percent of the total 1.1 quads consumed. Total energyconsumption in this category decreased 10.3 percent relative to FY 1990 and increased 2.0percent relative to FY 2002 (Table 7). These changes resulted from both changes in agencyactivity levels and energy management efforts.
The Federal Government spent $648.4 million on energy intensive operations in FY 2003 (Table8), $40.1 million less than the FY 2002 expenditure of $608.3 million in constant dollars. Of the$648.4 million spent for energy used in energy intensive operations, $260.0 million was spent bythe Department of Defense with the remaining $388.4 million spent by the civilian agencies.
The industrial, laboratory, and other energy intensive facilities reported by the agencies underthis category are listed at www.eere.energy.gov/femp/pdfs/eifacilities03.pdf.
C. Exempt Facilities
Nine agencies, the Departments of Defense, Energy, Health and Human Services, State, andTransportation, the National Archives and Records Administration (NARA), the NationalAeronautics and Space Administration (NASA), the General Services Administration (GSA),and the Tennessee Valley Authority have chosen to exempt facilities from energy managementrequirements. These facilities are listed at www.eere.energy.gov/femp/pdfs/exemptfac03.pdfand include:
# Structures such as outside parking garages which consume essentially only lightingenergy, yet are classed as buildings.
# Buildings where energy usage is skewed significantly due to reasons such as: buildingsentering or leaving the inventory during the year, buildings down-scaled operationally toprepare for decontamination, decommissioning and disposal, and buildings undergoingmajor renovation and/or major asbestos removal.
6
# Federal ships that consume “Cold Iron Energy,” (energy used to supply power and heatto ships docked in port) and airplanes or other vehicles that are supplied with utility-provided energy.
# Buildings and facilities in which it is technically infeasible to implement energyefficiency measures or where conventional performance measures are renderedmeaningless by an overwhelming proportion of process-dedicated energy.
In addition, the U.S. Postal Service has reported electricity consumption used in mail processingautomation under the exempt category without reporting associated facility square footage.
Energy used in exempt facilities totaled 23.3 trillion Btu in FY 2003 (Table 9), approximately2.1 percent of the total 1.1 quads used by the Federal Government. Electricity constitutes 71.4percent of the energy used in exempt facilities, 10.8 percent is accounted for by natural gas, and8.5 percent by fuel oil. Small amounts of purchased steam, liquefied petroleum gas(LPG)/propane, and “other” energy account for the remaining 9.4 percent.
The energy used in exempt facilities in FY 2003 accounted for approximately 4.0 percent of thetotal Federal energy bill. The Federal Government spent approximately $386.2 million for thiscategory’s energy during the fiscal year (Table 10).
D. Vehicles and Equipment
Vehicles and equipment energy includes aircraft and naval fuels, automotive gasoline, diesel fuelconsumed by Federally-owned and leased vehicles and privately-owned vehicles used forofficial business, and the energy used in Federal construction.
In FY 2003, the Federal Government used approximately 714.6 trillion Btu of energy in vehiclesand equipment, 63.8 percent of the total 1.1 quads consumed (Table 11). Total energyconsumption in vehicles and equipment decreased 23.5 percent relative to FY 1985 and was 11.3percent greater than the FY 2002 consumption of 642.0 trillion Btu. Most of this increase isattributable to increased use of jet fuel by DOD. DOD consumed 662.1 trillion Btu or 92.7percent of all vehicles and equipment energy used by the Federal Government.
The Federal Government spent $4.9 billion on vehicles and equipment energy in FY 2003,$304.0 million less than the FY 2002 expenditure, a 5.9 percent decrease in constant dollars. Forall fuels, the cost per million Btu decreased from $8.07 in FY 2002 to $6.82 in FY 2003. Theunit costs of the two most-used fuels, jet fuel and diesel/distillate fuel oil, decreased 18.6 percentand 15.9 percent respectively. Gasoline prices paid by the Government increased 13.4 percentfrom the previous year.
7
II. REQUIREMENTS OF THE NATIONAL ENERGY CONSERVATION POLICY ACT (NECPA) AND ENERGY POLICY ACT OF 1992 (EPACT)
KEY REQUIREMENTS OF STATUTORY AUTHORITIES AND FY 2003 FINDINGS
Statute/Directive Requirement FY 2003 Findings
Section 543,NECPA, 42 U.S.C.,§ 8253(a)(1)
20 percent reduction (Btu/GSF)in Federal buildings by 2000from 1985.
Federal agencies reported a 24.8percent decrease in energy intensityof standard buildings in FY 2003,compared to FY 1985.
Section 544,NECPA, 42 U.S.C.,§ 8254
DOE to establish life-cycle costmethods to determine cost-effectiveness of proposedenergy efficiency projects.
The 2003 edition of the energy priceindices and discount factors for life-cycle cost analysis was published anddistributed to Federal energymanagers.
Section 545,NECPA, 42 U.S.C.,§ 8255
Transmit to Congress theamount of appropriationsrequested in each agencybudget for electric and energycosts incurred in operating andmaintaining facilities and forcompliance with applicablestatutes and directives.
Approximately $168.9 million wasappropriated and spent on energyefficiency projects in Federalfacilities.
Section 546,NECPA, 42 U.S.C.,§ 8256(a)
Establishment of a program ofincentives within Federalagencies to expedite ESPCs.
In FY 2003, 62 ESPC contracts anddelivery orders were awarded underDOE Super ESPCs and other agencycontracts.
Section 546,NECPA, 42 U.S.C.,§ 8256(b)
DOE to establish a FederalEnergy Efficiency Fund toprovide grants to agencies.
There have been no appropriationsfor the Fund since FY 1995.
Section 157,EPACT, 42 U.S.C.,§ 8262(c)
Federal agencies to establishand maintain programs to trainenergy managers and toincrease the number of trainedenergy managers within eachagency.
Federal agencies reported spending$2.3 million to train 6,391 Federalpersonnel in energy efficiency,renewable energy, and waterconservation subjects.
8
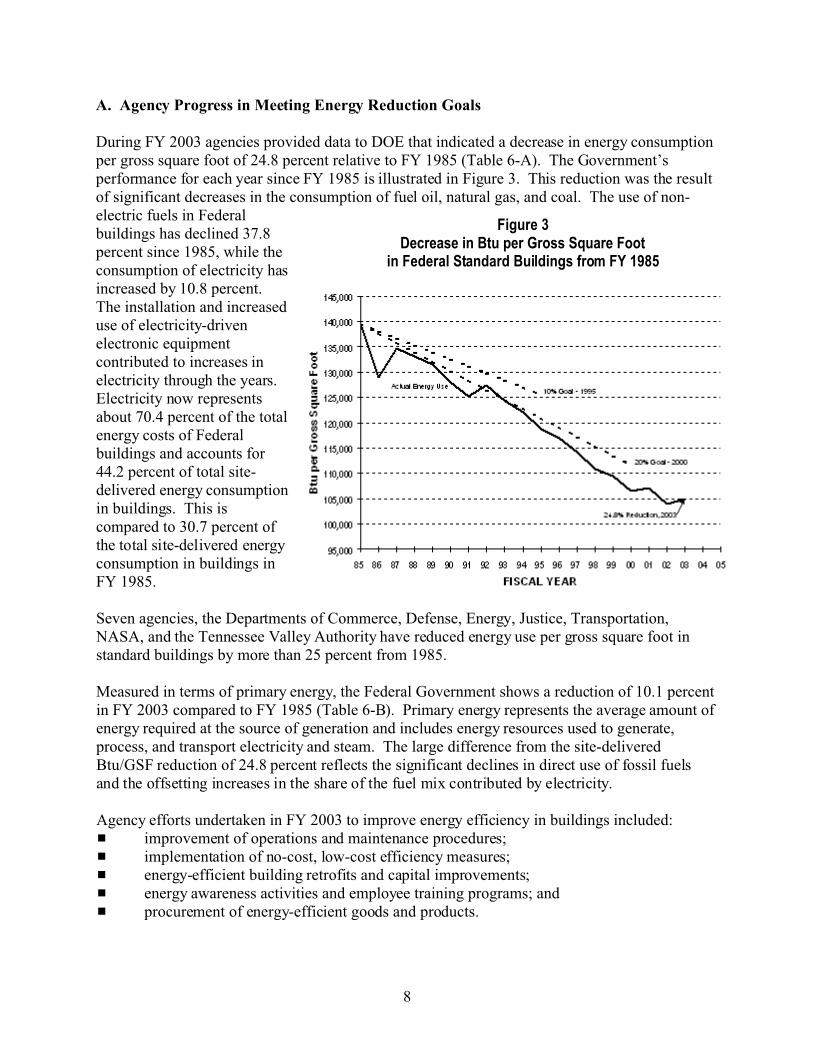
Figure 3Decrease in Btu per Gross Square Foot
in Federal Standard Buildings from FY 1985
A. Agency Progress in Meeting Energy Reduction Goals
During FY 2003 agencies provided data to DOE that indicated a decrease in energy consumptionper gross square foot of 24.8 percent relative to FY 1985 (Table 6-A). The Government’sperformance for each year since FY 1985 is illustrated in Figure 3. This reduction was the resultof significant decreases in the consumption of fuel oil, natural gas, and coal. The use of non-electric fuels in Federalbuildings has declined 37.8percent since 1985, while theconsumption of electricity hasincreased by 10.8 percent. The installation and increaseduse of electricity-drivenelectronic equipmentcontributed to increases inelectricity through the years. Electricity now representsabout 70.4 percent of the totalenergy costs of Federalbuildings and accounts for44.2 percent of total site-delivered energy consumptionin buildings. This iscompared to 30.7 percent ofthe total site-delivered energyconsumption in buildings inFY 1985.
Seven agencies, the Departments of Commerce, Defense, Energy, Justice, Transportation,NASA, and the Tennessee Valley Authority have reduced energy use per gross square foot instandard buildings by more than 25 percent from 1985.
Measured in terms of primary energy, the Federal Government shows a reduction of 10.1 percentin FY 2003 compared to FY 1985 (Table 6-B). Primary energy represents the average amount ofenergy required at the source of generation and includes energy resources used to generate,process, and transport electricity and steam. The large difference from the site-deliveredBtu/GSF reduction of 24.8 percent reflects the significant declines in direct use of fossil fuelsand the offsetting increases in the share of the fuel mix contributed by electricity.
Agency efforts undertaken in FY 2003 to improve energy efficiency in buildings included:# improvement of operations and maintenance procedures;# implementation of no-cost, low-cost efficiency measures;# energy-efficient building retrofits and capital improvements;# energy awareness activities and employee training programs; and# procurement of energy-efficient goods and products.
9
B. Investments in Energy Efficiency
During FY 2003, Federal agencies had three primary options for financing energy efficiency,water conservation, and renewable energy projects in buildings and facilities: directappropriated funding, energy savings performance contracts (ESPCs), and utility energy servicecontracts (UESCs). Known funding from the three sources totaled approximately $737 millionin FY 2003. Direct appropriations accounted for approximately $168.9 million. ESPC contractsawarded in FY 2003 resulted in approximately $446.1 million in estimated contractor investment($251.8 million from DOE Super ESPC delivery orders and $194.3 million from other agencyESPCs), and approximately $121.9 million in private sector investment came from utility energyservice contracts. While these three categories of funding are not entirely comparable, they doindicate that ESPCs and UESCs have become the dominant source of support for efficiencyinvestments throughout the Federal Government. In FY 2003, direct funding identified byagencies for energy conservation retrofits and capital equipment increased 35.3 percent to$168.9 million from $124.8 million dollars in FY 2002.
Since 1985, The Government has invested approximately $6.2 billion in energy efficiency,almost $3.3 billion of which was direct appropriations and $2.8 billion from alternative financingmechanisms ($1.8 billion from ESPCs and $1.0 billion from UESCs).
1. Direct Appropriations
NECPA requires each agency, in support of the President’s annual budget request to Congress,to specifically set forth and identify funds requested for energy conservation measures. Table 3-A presents agency funding (in nominal dollars) reported from FY 1985 through FY 2003for energy conservation retrofits and capital equipment. Table 3-B presents the sameinformation in constant 2003 dollars. Reports from Federal agencies indicated that $168.9million was spent on retrofit expenditures in FY 2003, compared with $124.8 million in FY2002. In some cases, the data provided by the agencies include funding from operation andmaintenance accounts that was specifically identified as contributing to energy efficiency. DOD funded $103.5 million for energy efficiency projects in FY 2003, an increase of 65.7percent from the previous year (Table 3-B).
2. Energy Savings Performance Contracting
During FY 2003, 62 ESPC contracts or delivery orders were awarded at 11 agencies. Theseinclude delivery orders awarded through the DOE/FEMP Super ESPC programs as well asprojects awarded by the DOD and other agencies. Contractor investment from these projectstotaled approximately $446.1 million, providing the Government with an opportunity to savemore than 4.8 trillion Btu each year. These ESPCs include 34 by DOD; nine by GSA; seven bythe Department of Veterans Affairs; three by the Department of Transportation (DOT); two eachby the Department of Labor and NASA; and one each by the Departments of Agriculture,Commerce, Health and Human Services, Justice, and NARA.
10
Energy Savings Performance Contracts and Delivery Orders Awarded by Federal Agencies in FY 2003
Total 62 $446,113 $877,007 $815,537 $61,640 4,838,778
Through a decentralized approach, DOD awarded the largest number of contracts/delivery orderswith 34 ESPC projects in FY 2003. These contracts include many infrastructure upgrades andnew equipment to help DOD installations reduce energy and water consumption. Examplesinclude new thermal storage systems, chillers, boilers, lights, motors, energy managementcontrol systems (EMCS), and water reducing devices. Normally, cost savings are used to firstpay the contractor, and then are used to offset other base operating support expenses. In somecases, however, installations decided to seek a shorter contract term and defer all Governmentcost savings until contract completion. In these cases, the savings generated by ESPCs help toreduce the energy consumption, but do not reduce the total cost of operation until the contractsexpire. After contract expiration and the retrofits are paid for, DOD will be able to obtain fullcost savings.
Thirty-nine DOE/FEMP Super ESPC delivery orders were awarded during FY 2003. SuperESPCs are broad area indefinite delivery, indefinite quantity (IDIQ) contracts that allowagencies to negotiate site-specific delivery orders with an energy service company (ESCO)under the umbrella contracts. Contractor investment totaled $251.8 million, providing annualsavings of more than 2.6 trillion Btu to the Government. These delivery orders include 13 byDOD, nine by the GSA, seven by the Department of Veterans Affairs, three by DOT, two by theDepartment of Labor, and one each by the Departments of Agriculture, Commerce, Health andHuman Services, Justice, and NARA.
3. Utility Energy Service Contracts
In FY 2003, a total of 40 UESCs were implemented by Federal agencies. Private sectorinvestment in the projects totaled approximately $121.9 million. The estimated annual energysavings from the 40 projects is 763.4 billion Btu.
11
Projects were undertaken by agencies to accomplish a wide variety of energy efficiencyimprovements. Of the 40 UESCs awarded in FY 2003, 30 were implemented by the DOD.Contracts were put in place to perform infrastructure upgrades and purchase new equipment tohelp installations reduce energy and water consumption. Examples of equipment purchased withthe UESC financing tool include: new thermal storage systems, chillers, boilers, lights, motors,EMCS systems and water reducing devices.
4. Life-Cycle Costing (LCC)
FEMP publishes updated fuel energy price indices and discount factors for life-cycle costanalyses on April 1 of each year. The most recent Energy Price Indices and Discount Factors forLife-Cycle Cost Analysis, Annual Supplement to Handbook 135 was published and distributed toFederal energy managers in April 2003.
A set of Building Life-Cycle Cost (BLCC) computer programs have been developed andsupported by the National Institute of Standards and Technology (NIST) under FEMPsponsorship. The latest update of the BLCC5 version of the software, which incorporates the2003 DOE/FEMP discount rate and the latest energy price projections from the EnergyInformation Administration, was released April 1, 2003. Version BLCC 5.1-02 includes two newmodules for evaluating Military Construction (MILCON) projects. BLCC 5.1-02 now containsthe following four modules for analyzing energy and water conservation and renewable energyprojects:
# Analyses for Federal agency-funded projects;
# Analyses for Federal agency projects financed through energy savings performancecontracts or utility energy savings contracts;
# MILCON analyses for DOD-funded projects; and
# MILCON analyses for projects under DOD’s Energy Conservation Investment Program.
12
III. INTERAGENCY EXCHANGE OF INFORMATION
A. Federal Coordination
Federal Interagency Energy Policy CommitteeThe Federal Interagency Energy Policy Committee (656 Committee) did not meet in 2003. However, a meeting hosted by the Office of the Federal Environmental Executive broughttogether the Executive Order 13123 Senior Energy Officials in June 2003. For most agencies,the Senior Energy Official is also their 656 Committee member.
Federal Interagency Energy Management Task ForceIn FY 2003, meetings of the Federal Interagency Energy Management Task Force were held onJanuary 15, 2003; March 19, 2003; and July 30, 2003. The memoranda of record from thesemeetings are posted at www.eere.energy.gov/femp/about/fiemtf.cfm. Issues highlighted in thethese meetings included the following:
# The importance and ranking of FEMP’s various programs by constituent agencies,conducted as a multi-year planning exercise during a Task Force meeting.
# The status of proposed comprehensive energy legislation, including the reauthorization ofESPC authority.
# Agency energy management programs, opportunities, and needs.
# Assessment of Energy and Load Reduction Techniques (ALERT) assessments formanaging natural gas resources.
# The Federal Energy and Water Management Awards and the Presidential Awards forFederal Energy Management Success.
# Guidance for completing annual reports and scorecards and goal crediting forsource-measured energy savings (particularly in cases where site-measured energyincreases).
# FEMP’s technical assistance programs, workshops, and conferences related to Federalenergy management.
13
2. Training
Many agencies have their own internal training and recognition programs. Overall, Federalagencies reported spending $2.3 million to train 6,391 Federal personnel in energy efficiency,renewable energy, and water conservation subjects, including energy efficient productprocurement and alterative financing techniques for energy and water projects.
During FY 2003, FEMP conducted 58 training workshops and symposia for more than 3,600attendees in the efficient use and conservation of energy, water, and renewable energy in Federalfacilities. FEMP workshop participation is documented in the table below.
COURSE, DATE, AND LOCA TION (IF APPLICABLE) PARTICIPANTS
Advanced Facility Energy Decision System (FEDS)
May 22-23, 2003 (Anchorage, AK) 7
Advanced Metering for the Federal Sector
Sept 25, 2003 (Golden, CO) 61
Building Operator Certification Courses (BOC)
March 25 , 2003; October 21, 2003 (Tacoma, Washington) 33
May 3, 2003 (Ft. Lewis) 23
June 25, 2003; Decem ber 17, 2003 (Everett, Washington) 25
Design Strategies for Low-Energy, Sustainable, Secure Buildings
Jan 16 - Jan 17, 2003 (Washington, DC) 141
Mar 26 - M ar 27, 2003 (San Diego, CA) 29
Jun 18 - Jun 19, 2003 (Ch icago, IL) 31
Distributed Generation and Combined Heat and Power for Federal Facilities
Oct 23-24, 2002 (Boston MA) 218
March 3, 2003 (Albuquerque, NM) 13
May 13 - May 15 , 2003 (Newport Beach, CA) 85
Sept 4, 2003 (Albuquerque, NM ) 13
Energy Management Telecourse: Part 1a , Life-Cycle Costing - Basic
March 4, 2003 (Teleconference) 98
Energy Managem ent Telecourse: Part 1b, Buying Energy Efficient Products
March 4, 2003 (This is a telecourse) 97
Energy Management Telecourse: Part 2a, Operations and Maintenance Management
March 11 , 2003 (Telecon ference) 77
Energy Management Telecourse: Part 2b, Water Resource Management
March 11 , 2003 (Telecon ference) 73
Energy Management Telecourse: Part 3a, Utility Energy Services Contracting
March 18 , 2003 (Telecon ference) 78
Energy Management Telecourse: Part 3b, Energy Savings Performance Contracting
March 18 , 2003 (Telecon ference) 75
FEMP Lights Advanced Workshop
Oct. 21-23, 2002 (O rlando FL) 7
FEMP Lights Lighting and Health Workshop
Oct 21-22, 2002 (Orlando, FL) 7
April 30, 2003 (Wash ington, DC) 32
FEMP Lights Online Course
Fall, 2003 (http://www.femplights.com/) 71
Spring, 2003 (http://www.femp lights.com) 85
Implem enting Renewable Energy Projects
Jan 28 - Jan 29, 2003 (Cocoa, FL) 15
May 20 - May 21 , 2003 (Boston, MA) 11
Introduction to Facility Energy Decision System (FEDS)
May 21, 2003 (Anchorage, AK) 7
COURSE, DATE, AND LOCA TION (IF APPLICABLE) PARTICIPANTS
14
Labs21 High Performance, Low Energy Laboratory Design Course
Measurement & Verification for Super ESPC Projects
Feb 26, 2003 (San Francisco, CA) 13
May 21, 2003 (Indianapo lis, IN) 6
Jul 23, 2003 (Washington, DC) 13
Operations and Maintenance Management
May 19-20, 2003 (Anchorage, AK) 30
Jun 10-11, 2003 (San D iego, CA) 49
Resource Efficiency Manager (REM)
October, 2002 (San Diego, California) 51
Super ESPC
Nov 15-16, 2002 (New Orleans, LA) 14
Feb 25 - Feb 26, 2003 (San Francisco, CA) 16
May 20 - May 21 , 2003 (Indianapo lis, IN) 27
Jul 22 - Jul 23, 2003 (Washington, DC) 32
Utility Energy Service Contracting
Oct 22-23, 2002 (San Diego, CA) 17
May 28 - May 29 , 2003 (Philadelphia, PA) 28
Sep 16 - Sep 17, 2003 (Chicago, IL) 15
Water Conservation Strategies for Facility Managers
May 1, 2003 (Boise, Idaho) 22
Water Resource Management
Apr 15-16, 2003 (Denver, CO ) 25
“Energy 2003,” the energy efficiency workshop and exposition sponsored by FEMP, and co-sponsored by DOD and GSA, was held August 17-20, 2003 in Orlando, FL. The conferenceprovided participants with opportunities to explore such topics as strategies for energy projects,selling energy projects, and alternative financing. The conference had panel discussions, anexhibit hall showcasing energy technologies, and opportunities for relationship building. Morethan 1,300 were in attendance and more than 182 companies exhibited at the event.
FEMP continued to offer its Training Course Locator System to assist Federal agencies intraining energy managers and in meeting the requirements of the EPACT and energy-relatedExecutive Orders. The Locator system connects those seeking particular training courses withthe organizations sponsoring the courses. Locator is a Web-based application which is readilyavailable through the Internet. During FY 2003, 271 unique visitors to Locator logged on to theLocator Web site.
15
3. Awards and Recognition
Outstanding accomplishments in energy efficiency and water conservation in the Federal sectorwere recognized with the presentation of the 2003 Federal Energy and Water ManagementAwards on October 29, 2003, in Washington, DC. The Awards Program is sponsored by the 656Committee and DOE. Awards were selected from outstanding Federal energy managers andcontributors who:
# Implemented proven energy efficiency, energy, and water conservation techniques;
# Developed and implemented energy-related training programs and employee energyawareness programs;
# Succeeded in receiving utility incentives, or awarding ESPC and other Federal-approvedperformance-based energy and water contracts;
# Made successful efforts to fulfill compliance with energy and water reduction mandates;
# Improved energy efficiency or reduction in energy costs for Federal mobile equipmentincluding aircrafts, ships, and vehicles;
# Provided leadership in purchasing or supplying energy-efficient, renewable energy, orwater-conserving products to one or more Federal agencies; and
# Demonstrated cost-beneficial landscape practices which utilize techniques that seek tominimize the adverse effects of landscaping.
Recipients of the 2003 awards were selected from 107 nominees submitted by 13 Federalagencies. There were 37 awardees representing 11 different Federal agencies. Distribution ofawards among the Federal agencies for accomplishments in the previous fiscal year is indicatedin the following table.
2003 Federal Energy and Water Management Awards by Group and TypeAgency Individual Sm all
Group
Organization Total Energy
Efficiency
Alternative
Financing
Renew able
Energy
M obility Water
M gm t.
Innovative
Tech.
Program
Imp.
Exceptional
Service
Army 2 3 5 3 1 1
DOC 1 1 1
DOE 1 2 3 2 1
DOI 3 1 4 4
DOT 1 1 1
GSA 2 2 1 1
HHS 1 1 1
Navy 2 5 7 1 2 1 3
USAF 3 2 1 6 1 1 1 3
USMC 1 3 4 1 2 1
USPS 3 3 1 1 1
TOTAL 9 12 16 37 9 8 6 4 4 2 2 2
16
4. Public Education Programs
DOE’s Energy Efficiency and Renewable Energy Clearinghouse (EREC) provides basic,technical, and financial information on various energy efficiency and renewable energytechnologies and programs. EREC’s telephone number is 800-DOE-EREC (800-363-3732) andits Web site is at www.eree.energy.gov/consumerinfo. During FY 2003, the EREC staffresponded to 30,372 inquiries and disseminated 311,147 publications.
DOE’s Office of Energy Efficiency and Renewable Energy (EERE) hosts a Web site atwww.eere.energy.gov and offers free subscriptions to the EERE Network News e-mailnewsletter.
FEMP provides a Help Desk to Federal energy managers. The telephone number is 800-DOE-3732. FEMP’s Web site is www.eere.energy.gov/femp.
The Energy Information Administration’s National Energy Information Center (NEIC) respondsto public and private sector questions on energy production, consumption, prices, resourceavailability, and projections of supply and demand. NEIC provides information to Federalemployees and the public at www.eia.doe.gov. Electronic inquiries may be sent [email protected]. During FY 2003, NEIC staff responded to 32,700 inquiries. The EIA website recorded 12.2 million user sessions during FY 2003.
The Office of Scientific and Technical Information (OSTI), as part of the Office of Science,provides leadership and coordination for the DOE-wide Scientific and Technical InformationProgram (STIP). In this capacity, OSTI assures access by DOE, the scientific researchcommunity, academia, U.S. industry, and the public to DOE research results in support of theDOE mission. Key collections developed and maintained by OSTI on behalf of DOE includeEnergy Citations Database (ECD), the DOE Information Bridge, the E-print Network, Researchand Development (R&D) Project Summaries, and EnergyFiles. In FY 2003, approximately 11.4million user transactions were accommodated via systems residing on OSTI servers.
The DOE public information mechanisms include several direct service programs designed toprovide technical assistance to specific target groups. Two of these programs are the StateEnergy Program (SEP) and the Industrial Assessment Center.
SEP provides funding to States to design and implement their own energy efficiency andrenewable energy programs. Formula grants are given to states using Congressionally-appropriated funds and are distributed according to a formula that depends on criteria such as thestate’s size and population. Special Projects grants are the second type of SEP grant. Unlikeformula grants, Special Projects are funded entirely by EERE technology programs and areawarded on a competitive basis. Additional information is provided on the program Web site atwww.eere.energy.gov/buildings/state_energy. In FY 2003, FEMP awarded $485,000 in SpecialProject grants to six States:
# North Carolina—Renewable energy implementation and training at Federal and Statepark facilities.
17
# New York—Establish a composite value for distributed generation which would helpState and Federal policy makers establish appropriate standby rates.
# Hawaii—Provide technical assistance to the Navy to conduct a combined heat and powerassessment for the Pacific Missile Range Facilities, Barking Sands, Kauai, Hawaii.
# Colorado—Conduct a retro-commissioning project in three facilities of the ColoradoDepartment of Military and Veterans Affairs.
# Virginia—Determine the technical and economic feasibility and environmental impact ofa large wind turbine or turbine array at NASA’s Wallops Island facility.
# Minnesota—Continuous indoor air quality monitoring in Federal buildings for energyefficiency and homeland security.
The Office of Industrial Technology’s Industrial Assessment Center (IAC) Program provides no-cost energy, waste, and productivity assessments to help small and mid-sized manufacturersidentify measures to maximize energy-efficiency, reduce waste, and improve productivity. Theassessments are conducted by local teams of engineering faculty and students from 26participating universities across the country. Additional information is provided on the programWeb site at www.eere.energy.gov/industry.
A-1
APPENDIX ADATA TABLES
A-2
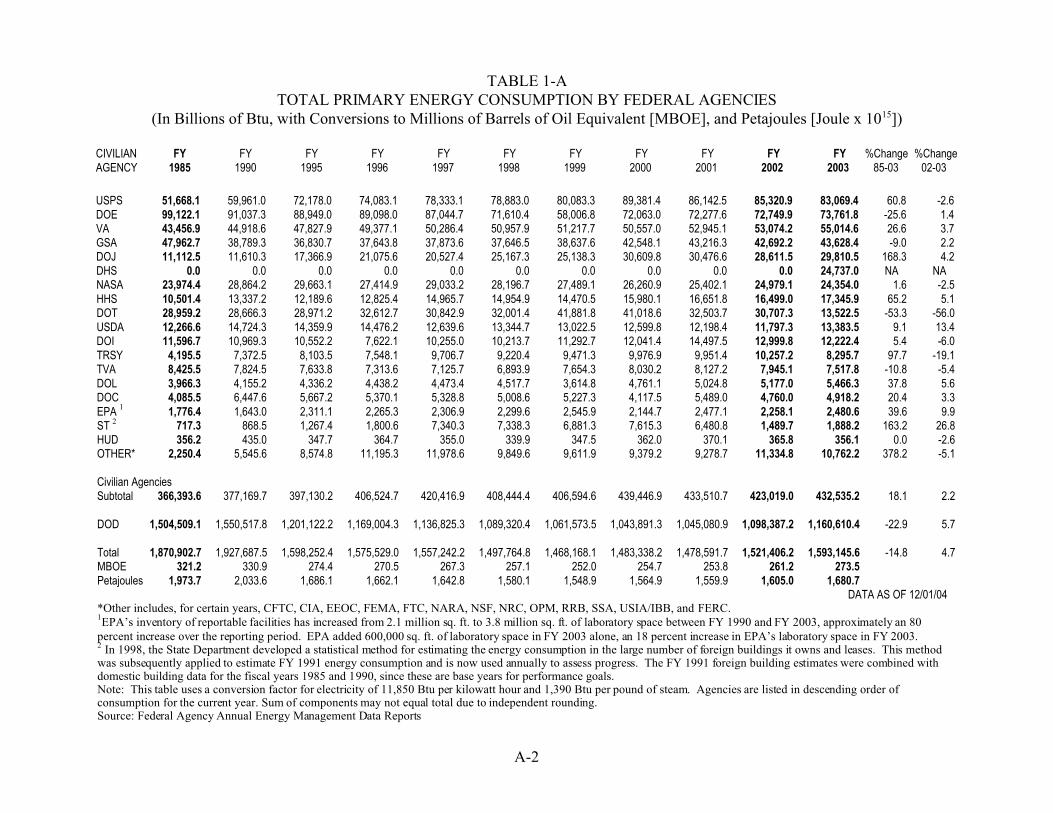
TABLE 1-ATOTAL PRIMARY ENERGY CONSUMPTION BY FEDERAL AGENCIES
(In Billions of Btu, with Conversions to Millions of Barrels of Oil Equivalent [MBOE], and Petajoules [Joule x 1015])
DATA AS OF 12/01/04*Other includes, for certain years, CFTC, CIA, EEOC, FEMA, FTC, NARA, NSF, NRC, OPM, RRB, SSA, USIA/IBB, and FERC.1EPA’s inventory of reportable facilities has increased from 2.1 million sq. ft. to 3.8 million sq. ft. of laboratory space between FY 1990 and FY 2003, approximately an 80
percent increase over the reporting period. EPA added 600,000 sq. ft. of laboratory space in FY 2003 alone, an 18 percent increase in EPA’s laboratory space in FY 2003.2 In 1998, the State Department developed a statistical method for estimating the energy consumption in the large number of foreign buildings it owns and leases. This methodwas subsequently applied to estimate FY 1991 energy consumption and is now used annually to assess progress. The FY 1991 foreign building estimates were combined withdomestic building data for the fiscal years 1985 and 1990, since these are base years for performance goals.Note: This table uses a conversion factor for electricity of 11,850 Btu per kilowatt hour and 1,390 Btu per pound of steam. Agencies are listed in descending order ofconsumption for the current year. Sum of components may not equal total due to independent rounding. Source: Federal Agency Annual Energy Management Data Reports
A-3
TABLE 1-BTOTAL SITE-DELIVERED ENERGY CONSUMPTION BY FEDERAL AGENCIES
(In Billions of Btu, with Conversions to Millions of Barrels of Oil Equivalent [MBOE], and Petajoules [Joule x 1015])
DATA AS OF 12/01/04*Other includes, for certain years, CFTC, CIA, EEOC, FEMA, FTC, NARA, NSF, NRC, OPM, RRB, SSA, USIA/IBB, and FERC.1EPA’s inventory of reportable facilities has increased from 2.1 million sq. ft. to 3.8 million sq. ft. of laboratory space between FY 1990 and FY 2003, approximately an 80
percent increase over the reporting period. EPA added 600,000 sq. ft. of laboratory space in FY 2003 alone, an 18 percent increase in EPA’s laboratory space in FY 2003.2 In 1998, the State Department developed a statistical method for estimating the energy consumption in the large number of foreign buildings it owns and leases. This methodwas subsequently applied to estimate FY 1991 energy consumption and is now used annually to assess progress. The FY 1991 foreign building estimates were combined withdomestic building data for the fiscal years 1985 and 1990, since these are base years for performance goals.Note: This table uses a conversion factor for electricity of 3,412 Btu per kilowatt hour and 1,000 Btu per pound of steam. Agencies are listed in descending order of consumptionfor the current year. Sum of components may not equal total due to independent rounding. Source: Federal Agency Annual Energy Management Data Reports
A-4
TABLE 2FEDERAL PETROLEUM USAGE IN FY 2003
(in Thousands of Gallons, Billions of Btu,and Petajoules [Joule x 1015])
Unit Total BBTU* BBTU* BBTU* Petajoules*
(KG al) DOD Civilian Total Total
Standard Buildings
Fuel O il 254,602.6 29,184.2 6,129.2 35,313.4 37.3
LPG/Propane 25,123.1 1,312.5 1,086.7 2,399.3 2.5
Energy Intensive Operations
Fuel O il 29,577.6 1,816.9 2,285.6 4,102.4 4.3
LPG/Propane 2,880.0 96.7 178.3 275.0 0.3
Exempt Buildings
Fuel O il 14,213.9 1,634.4 337.0 1,971.5 2.1
LPG/Propane 225.5 0.0 21.5 21.5 0.0
Vehicles & Equipment
Motor Gas 366,142.7 16,466.6 29,301.2 45,767.8 48.3
Dist-Diese l & Petro l. 908,920.4 111,778.9 14,288.3 126,067.3 133.0
Notes: Bold indicates top five primary energy users in buildings and facilities (DOD, DOE, VA, USPS, GSA). In past years, DOE also included funds for energy surveys. Does not include energy savings performance contracts and utility demand side management incentives.Sum of components may not equal total due to independent rounding.
Source: Federal Agency Annual Energy Management Data Reports
A-6
TABLE 3-BAGENCY DIRECT APPROPRIATIONS FOR ENERGY CONSERVATION RETROFITS AND CAPITAL EQUIPMENT,
FY 1985 THROUGH FY 2003 (THOUSANDS OF CONSTANT 2003 DOLLARS)
Notes: Bold indicates top five primary energy users in buildings and facilities (DOD, DOE, VA, USPS, GSA). In past years, DOE also included funds for energy surveys. Does not include energy savings performance contracts and utility demand side management incentives.Sum of components may not equal total due to independent rounding.
Source: Federal Agency Annual Energy Management Data Reports
A-7
TABLE 4-APRIMARY ENERGY CONSUMPTION IN FEDERAL STANDARD BUILDINGS
(In Billions of Btu, with Conversions to Millions of Barrels of Oil Equivalent [MBOE], and Petajoules [Joule x 1015])
DATA AS OF 12/01/04*Other includes for certain years the CFTC, CIA, EEOC, FEMA, FTC, NARA, NSF, NRC, OPM, RRB, SSA, USIA/IBB, and FERC.Note: This table uses a conversion factor for electricity of 11,850 Btu per kilowatt hour and 1,390 Btu per pound of steam. Contains estimated data for the following agencies: FEMA (1997, 1998), FCC (1997, 1998, 1999, 2000, 2001, 2002), FTC (1997, 1998, 1999, 2000, 2001, 2002), and OPM. (1997, 1998, 1999, 2000, 2001, 2002). Sum of components may not equal total due to independent rounding.
1In 1998, the State Department developed a statistical method for estimating the energy consumption in the large number of foreign buildings it owns and leases. This method was
subsequently applied to estimate FY 1991 energy consumption and is now used annually to assess progress. The FY 1991 foreign building estimates were combined withdomestic building data for the fiscal years 1985 and 1990, since these are base years for performance goals.
Source: Federal Agency Annual Energy Management Data Reports
A-8
TABLE 4-BSITE-DELIVERED ENERGY CONSUMPTION IN FEDERAL STANDARD BUILDINGS
(In Billions of Btu, with Conversions to Millions of Barrels of Oil Equivalent [MBOE], and Petajoules [Joule x 1015])
DATA AS OF 12/01/04*Other includes for certain years the CFTC, CIA, EEOC, FEMA, FTC, NARA, NSF, NRC, OPM, RRB, SSA, USIA/IBB, and FERC.Note: This table uses a conversion factor for electricity of 3,412 Btu per kilowatt hour. Contains estimated data for the following agencies: FEMA (1997, 1998), FCC (1997,1998, 1999, 2000, 2001, 2002), FTC (1997, 1998, 1999, 2000, 2001, 2002), and OPM. (1997, 1998, 1999, 2000, 2001, 2002). Sum of components may not equal total due to independent rounding.
1In 1998, the State Department developed a statistical method for estimating the energy consumption in the large number of foreign buildings it owns and leases. This method was
subsequently applied to estimate FY 1991 energy consumption and is now used annually to assess progress. The FY 1991 foreign building estimates were combined withdomestic building data for the fiscal years 1985 and 1990, since these are base years for performance goals.
Source: Federal Agency Annual Energy Management Data Reports
A-9
TABLE 5CONSUMPTION AND COSTS OF FEDERAL BUILDINGS ENERGY
BY FUEL TYPE IN FY 2003, FY 2002, AND FY 1985 (Constant 2003 Dollars)
ENERGY TYPE BILLIONS OF COST (IN MILLIONS COST PER COST PERBTU OF DOLLARS) MMBTU FAMILIAR UNIT
Note: This table uses a conversion factor for electricity of 3,412 Btu per kilowatt hour. Sum of components may not equal total due to independent rounding.
1GSA’s large increase in energy reported under this category beginning in FY 2000 is a result of the agency reclassifying buildings from the standard buildings inventory for FY 1990 and FY 2000
forward without adjusting data for the intervening years.2EPA’s inventory of reportable facilities has increased from 2.1 million sq. ft. to 3.8 million sq. ft. of laboratory space between FY 1990 and FY 2003, approximately an 80 percent increase over the
reporting period. EPA added 600,000 sq. ft. of laboratory space in FY 2003 alone, an 18 percent increase in EPA’s laboratory space in FY 2003.
Source: Federal Agency Annual Energy M anagement Data Reports
A-13
TABLE 8CONSUMPTION AND COSTS OF FEDERAL ENERGY INTENSIVE FACILITIES ENERGY
BY FUEL TYPE IN FY 2003
ENERGY TYPE BILLIONS OF COST (IN MILLIONS COST PER COST PERBTU OF DOLLARS) MMBTU FAMILIAR UNIT
1Changes in energy costs from 1985 should not be construed as savings resulting from Federal energy management activities. Many variablescontribute to fluctuations in annual energy costs, including changes in square footage, building stock, weather, energy efficiency investments,service level, fuel mix, fuel prices, and vehicle, naval, and aircraft fleet composition. This table incorporates revisions to previously publishedenergy consumption and cost data submitted to DOE by Federal agencies.
Source: Federal Agency Annual Energy Management Data Reports
A-18
TABLE 13 (Continued)FEDERAL ENERGY EXPENDITURES, FY 1985–FY 2003
(CONSTANT 2003 DOLLARS)
Year Annual Annual Annual Change in EnergyEnergy Use Energy Cost Energy Cost Costs from 1985
1Changes in energy costs from 1985 should not be construed as savings resulting from Federal energy management activities. Many variablescontribute to fluctuations in annual energy costs, including changes in square footage, building stock, weather, energy efficiency investments,service level, fuel mix, fuel prices, and vehicle, naval, and aircraft fleet composition. This table incorporates revisions to previously publishedenergy consumption and cost data submitted to DOE by Federal agencies.
Source: Federal Agency Annual Energy Management Data Reports
A-19
TABLE 13 (Continued)FEDERAL ENERGY EXPENDITURES, FY 1985–FY 2003
(CONSTANT 2003 DOLLARS)
Year Annual Annual Annual Change in EnergyEnergy Use Energy Cost Energy Cost Costs from 1985
1Changes in energy costs from 1985 should not be construed as savings resulting from Federal energy management activities. Many variablescontribute to fluctuations in annual energy costs, including changes in square footage, building stock, weather, energy efficiency investments,service level, fuel mix, fuel prices, and vehicle, naval, and aircraft fleet composition. This table incorporates revisions to previously publishedenergy consumption and cost data submitted to DOE by Federal agencies.
Source: Federal Agency Annual Energy Management Data Reports
B-1
APPENDIX BDATA COLLECTION
Standard Buildings and Facilities, Energy Intensive Facilities, and Exempt Facilities
The Federal agencies that own or control buildings are required to report the energyconsumption in these buildings to FEMP by January 1 after the end of each fiscal year. TheGeneral Services Administration (GSA) reports the energy of buildings it owns and operates,including usage by other Federal agency occupants. For buildings which have been delegated byGSA to other agencies, the individual agencies are responsible for reporting the energyconsumption and square footage figures.
The data shown in this report do not include leased space in buildings where the energy costs area part of the rent and the Federal agency involved has no control over the building’s energymanagement.
The Federal agencies submit their annual reports expressed in the following units: megawatthours of electricity; thousands of gallons of fuel oil; thousands of cubic feet of naturalgas; thousands of gallons of liquefied petroleum gas (LPG) and propane; short tons of coal;billions of Btu of purchased steam; and billions of Btu of “other.” DOE reviews this data foraccuracy and confers with the submitting agency to clarify any apparent anomalies. The data arethen entered into a computer database management program.
The tables shown in this Annual Report are expressed in billions of Btu derived from thefollowing conversion factors:
The above conversion factors for electricity and purchased steam refer to site-delivered energy(or heat content) and do not account for energy consumed in the production and delivery ofenergy products. Table 6 of this report accounts for primary energy use, which is the sum of theenergy directly consumed by end users (site energy) and the source energy consumed in theproduction and delivery of energy products. Using 2002 data from EIA, a blended heat rate of10,191 Btu/kWh was calculated for fossil and nuclear steam-electric plants. In addition toconversion losses, transmission and distribution losses (9 percent) and power plant use (5percent) are also factored into the delivered heat content, resulting in a total source energy inputfor electricity of 11,850 Btu/kWh. DOE uses this conversion factor to calculate primary energyuse for electricity and 1,390 Btu per pound for purchased steam.
In addition, the Federal agencies annually report to FEMP the gross square footage of theirbuildings and the cost of their buildings’ energy.
B-2
Vehicles and Equipment
Federal agencies are required to report the energy consumption of their fleet vehicles throughDOE’s Federal Automotive Statistical Tool (FAST) no later than November 1 after the end ofeach fiscal year. Energy consumption in other types of equipment not reported through FAST isrequired to be reported to FEMP by January 1 after the end of each fiscal year.
The fuels used in vehicles and equipment are automotive gasoline, diesel and petroleum distillatefuels, aviation gasoline, jet fuel, navy special, liquefied petroleum gas/propane, and “other.” Allthe fuels in this category with the exception of “other” are reported in thousands of gallons. “Other” is reported in billions of Btu.
This report excludes those agencies that have been unable to provide complete fiscal yearconsumption data prior to the publication date. All agency omissions, as well as any anomaliesin the data, are indicated by footnotes on the tables or in the text of the report.
C-1
APPENDIX CACRONYMS
Agency Acronyms
Commodity Futures Trading Commission CFTCCentral Intelligence Agency CIADepartment of Agriculture USDADepartment of Commerce DOCDepartment of Defense DODDepartment of Energy DOE Department of Health and Human Services HHSDepartment of Housing and Urban Development HUDDepartment of the Interior DOIDepartment of Justice DOJDepartment of Labor DOLDepartment of State STDepartment of Transportation DOTDepartment of the Treasury TRSYDepartment of Veterans Affairs VAEnvironmental Protection Agency EPAEqual Employment Opportunity Commission EEOCFederal Communications Commission FCCFederal Emergency Management Agency FEMAFederal Energy Regulatory Commission FERCFederal Trade Commission FTCGeneral Services Administration GSAInternational Broadcasting Bureau IBBNational Aeronautics and Space Administration NASANational Archives and Records Administration NARANational Science Foundation NSFNuclear Regulatory Commission NRCOffice of Personnel Management OPMPanama Canal Commission PCCRailroad Retirement Board RRBSocial Security Administration SSATennessee Valley Authority TVAUnited States Information Agency USIAUnited States Postal Service USPS
C-2
Other Acronyms
Assessment of Load and Energy Reduction Techniques ALERTBuilding Life-Cycle Cost BLCCBritish Thermal Unit(s) BtuEnergy Citations Database ECDEnergy Information Administration EIAOffice of Energy Efficiency and Renewable Energy EEREEnergy Management Control Systems EMCSEnergy Policy Act of 1992 EPACTEnergy Efficiency and Renewable Energy Clearinghouse ERECEnergy Service Company ESCOEnergy Savings Performance Contract ESPCFederal Automotive Statistical Tool FASTFederal Energy Management Program FEMPFiscal Year FYGross Square Foot GSFIndustrial Assessment Center IACIndefinite-Delivery, Indefinite Quantity Contract IDIQLife-Cycle Cost LCCLiquefied Petroleum Gas LPGMilitary Construction MILCONNational Energy Conservation Policy Act NECPANational Energy Information Center NEICNational Institute of Standards and Technology NISTOffice of Industrial Technologies OITOffice of Scientific and Technical Information OSTIQuadrillion British Thermal Units QuadResearch and Development R&DState Energy Program SEPUtility Energy Service Contract UESCFederal Interagency Energy Policy Committee 656 Committee