Page 1
ANNUAL SALARY AND BENEFITS REPORT
AND RECOMMENDATIONS, 2008
FACULTY COMPENSATION AND BENEFITS
COMMITTEE OF THE UNIVERSITY SENATE
Membership:
Anthony Mughan, Chairperson Political Science
Carole Anderson Office of Academic Affairs
Thomas Bond Office of Human Resources
Laura Gast Office of Human Resources
Terry Gustafson Chemistry
Rebecca Haidt Spanish & Portuguese
Richard M. Hill OSU Retirees Association
Mike Hogan Food, Agriculture & Environmental Science
Gene Holland Comparative Studies; French & Italian
Laurice Joseph Education, PAES
Bev Kelbaugh Food, Agriculture & Environmental Science
Larry Lewellen Office of Human Resources
Doug MacBeth Educational Policy and Leadership
Brian McEnnis Mathematics – Marion Campus
Marcus Sandver Business
Robert Seghi Dentistry
Sandra Tanenbaum Public Health
Page 2
1
BACKGROUND
According to the University By-Laws (3335-5-4812), it is the responsibility of the Faculty
Compensation and Benefits Committee to “(s)tudy the adequacy and other attributes of the
university’s policies and provisions for : (i) salaries, outside professional services and
supplemental compensation; and (ii) retirement benefits, hospitalization, medical insurance, and
other health benefits, life insurance, other insurance, travel reimbursement, educational benefits,
recreational benefits, and other perquisites, benefits, and conditions of faculty employment.”
Adequacy, of course, is not an objective criterion. Adequate benefits for a university that does
not seek to improve itself may be inadequate for one that is bent on climbing the rankings by
improving, among other things, the quality of its faculty. Ohio State falls clearly into this second
grouping and it has historically measured adequacy, at least with regard to salaries, by three
criteria: (i) average salaries at OSU compared with those of other CIC institutions; (ii) average
salaries at OSU compared with those at a select group of “benchmark institutions”; and (iii)
average salaries at OSU compared to the salary levels it would take to get the university to the
30th
position in the AAU salary rankings. The universities falling in each of these comparison
groups are identified in the tables appended to this report.
Context is another important consideration when evaluating the adequacy of faculty salaries and
benefits at The Ohio State University. Since President Gee has declared the goal of making Ohio
State “the university of the American dream,” it seems appropriate to look at faculty
compensation and benefits in the larger context of the university’s achievements and aspirations.
Last year’s FCBC report summarized the large number of areas in which Ohio State has made
significant advances in the last decade, including moving into the United States and World
Report’s (USNWR) top 20 public universities, jumping from 39th
to 24th
in federally sponsored
research and coming to rank 9th
among public universities in total research expenditures.
President Gee himself has observed that “this is a much different institution than I left in
1997…” (onCampus, 6-4-2008), indicating that he recognizes the significant advances in the
university’s academic standing and reputation that have been made over the last decade.
Moreover, insofar as a “focus on faculty success” is one of the six strategic goals that he hopes
will make “the coming years Ohio State’s time,” he also explicitly recognizes the key role of the
faculty in shaping the university’s past, present and future and the importance of rewarding them
adequately. “We must do everything we can to retain, attract, and reward world-class teachers
and researchers in all academic areas of the university.”
These achievements, expectations and aspirations are the background against which Ohio State’s
salary history must continue to be evaluated, and will be evaluated, in this year’s FCBC report.
We begin with the comparison with the other CIC institutions. By way of qualification, it must
be emphasized at the outset that we present only average salaries broken down for the most part
by rank. There is also considerable variation across the university within and between ranks so
that any conclusions drawn from the data presented in the appendix to this report do not apply
uniformly to faculty overall or to faculty in particular ranks. The picture presented is a
university-wide one and care must be taken to interpret it that way.
Page 3
2
SALARIES
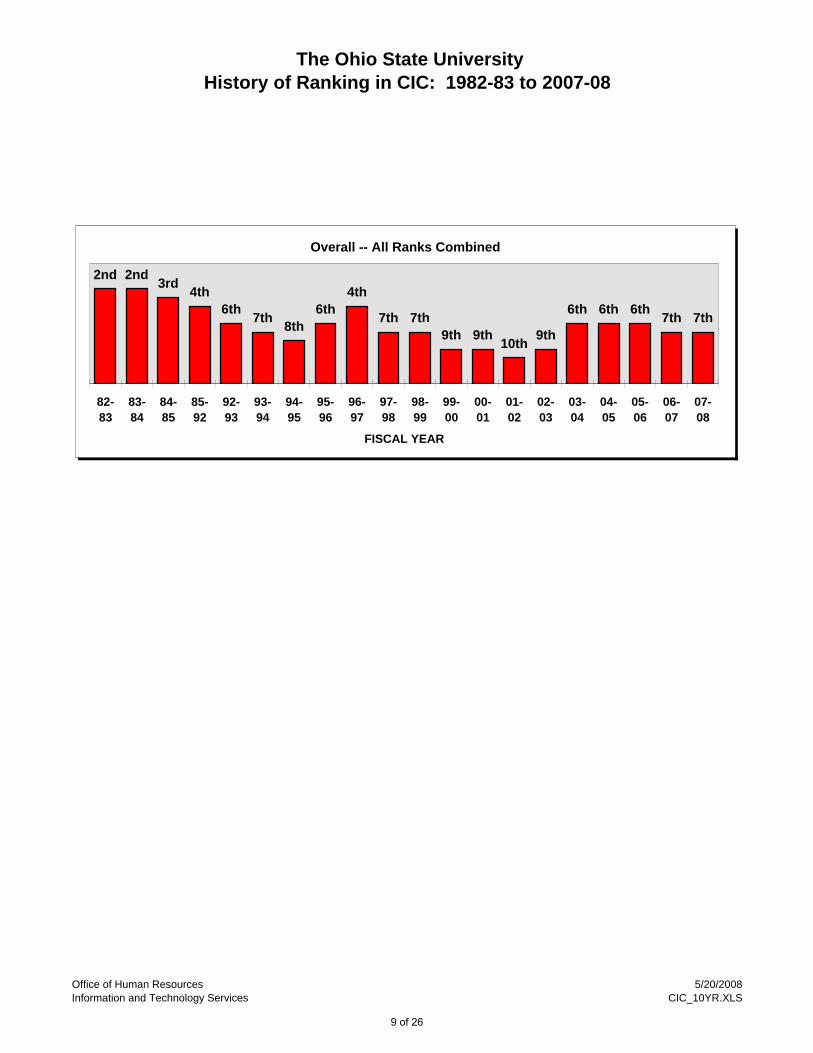
CIC Institutions
There are 12 CIC institutions, and two of them, Chicago and Northwestern, are private
universities. There are tables and histograms in the appendix that present a ten-year salary
history for all 12 individual CIC institutions. Data are presented in the form of overall average
salaries and averages for assistant, associate and full professors separately. There is some
fluctuation in salary rankings, with the years 2000-01 to 2002-03 being particularly bad for all
ranks at OSU. University salaries, and especially those for assistant and full professors, then
rebounded in 2003-04. The improvement stopped there, however, with the result that OSU
faculty salaries are no better within the CIC in 2007-08 than they were ten years ago. Indeed,
associate professor salaries experienced a considerable drop – from 6th
position in 1997-98 to
10th
in 2007-08.
It must be emphasized that these conclusions are based on mean annual increases and changes in
ranking can result from small differences in annual salary increases. Ohio State’s ten-year
average for all ranks combined, for example, is 4.08, which place it 7th
overall. The same
average figure for Indiana in 6th
place is only slightly higher at 4.11. Equally, though, the
average for 8th
-placed Illinois is only slightly lower at 4.02. Given this closeness, the trend is
more important than the annual figures for evaluating the adequacy of salary increases, and it
stands out that Ohio State’s myriad improvements as a university over the last decade are not
reflected in change in its overall salary ranking within the CIC.
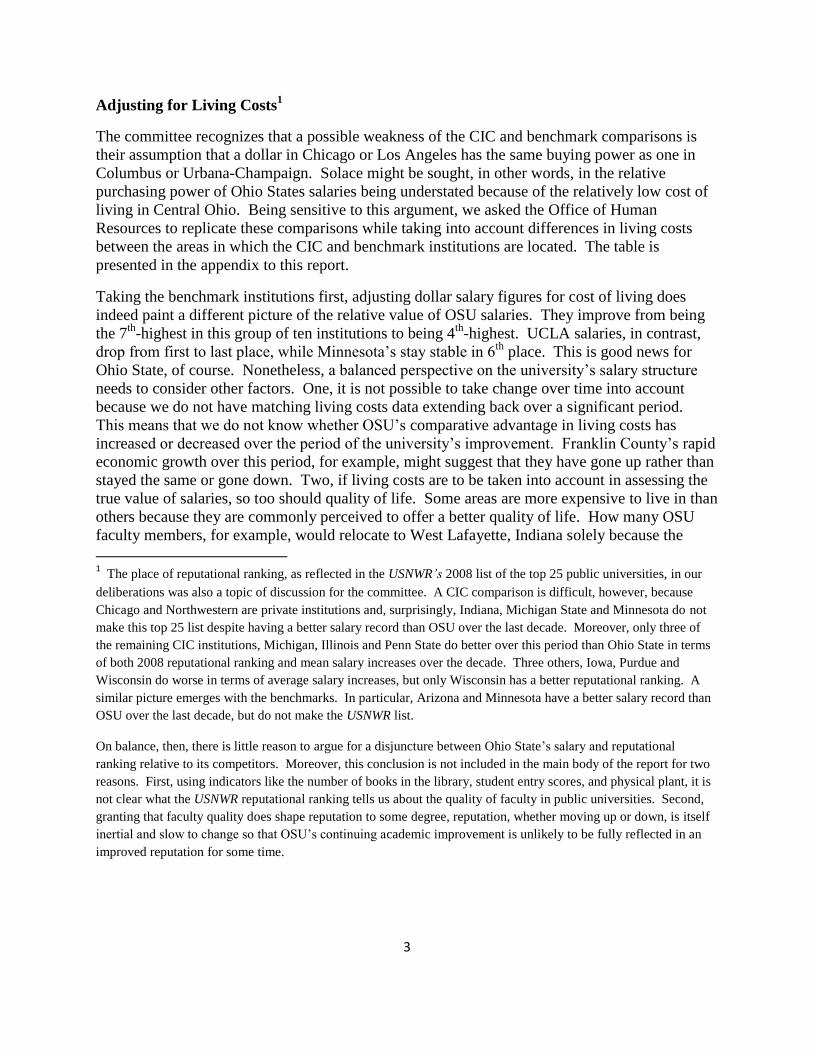
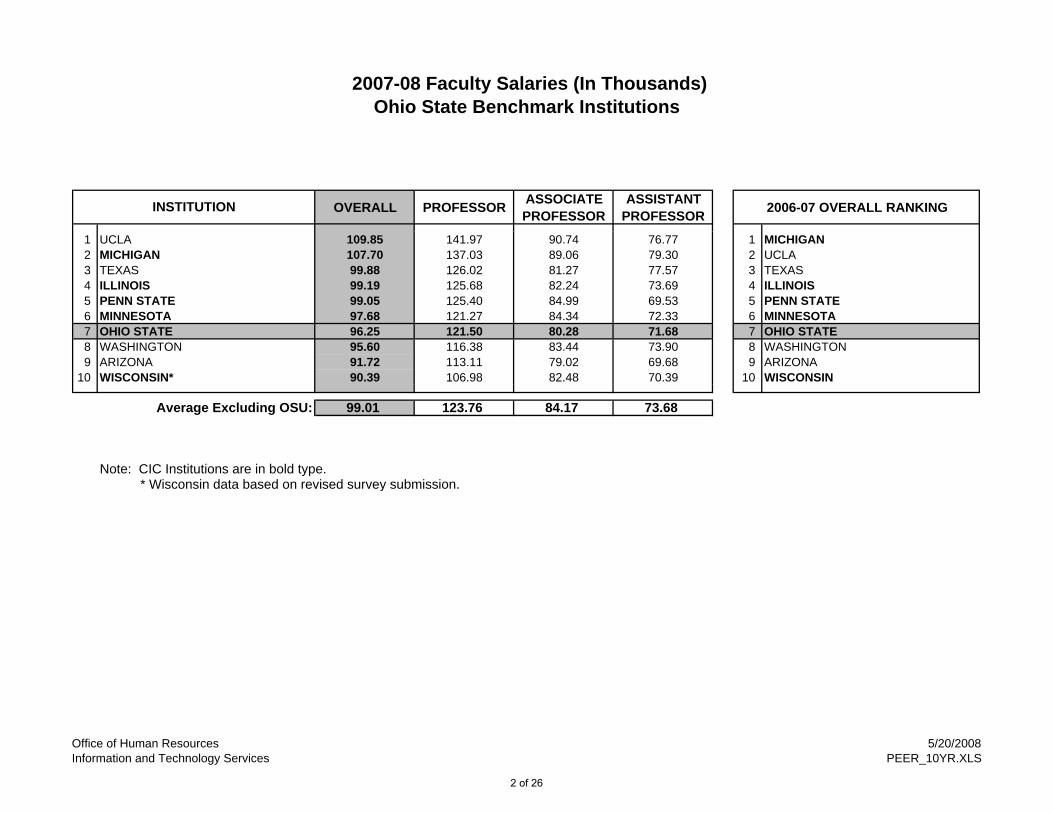
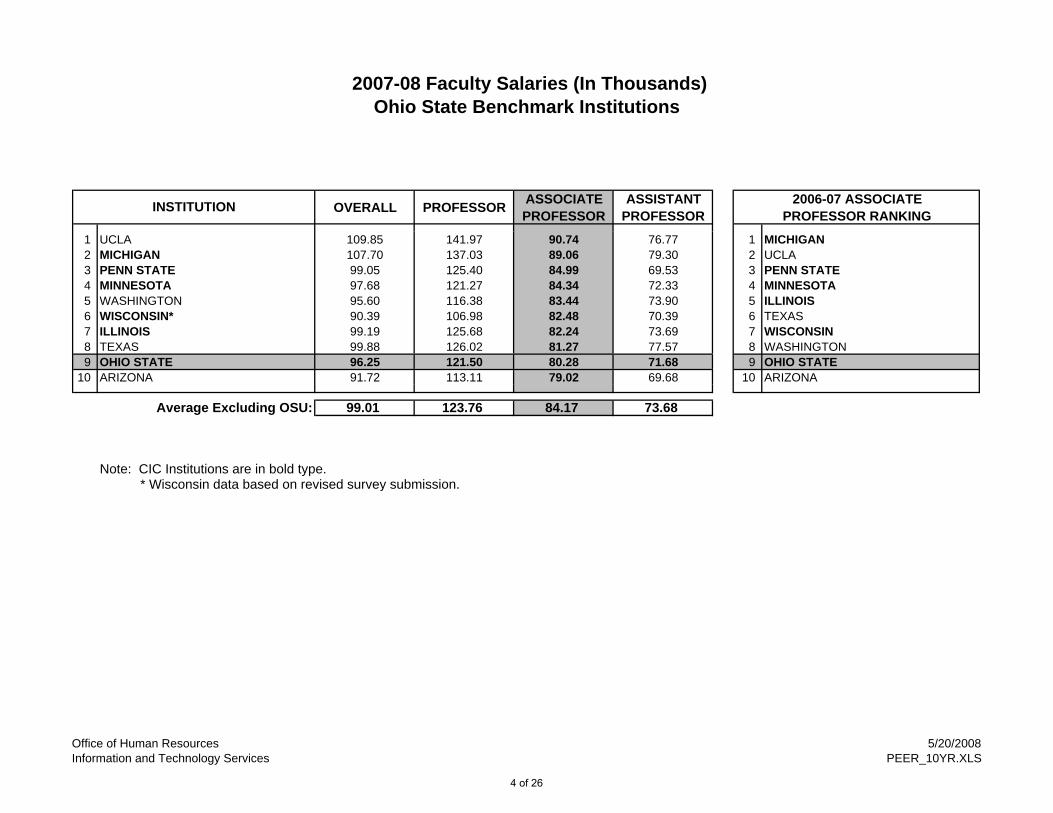
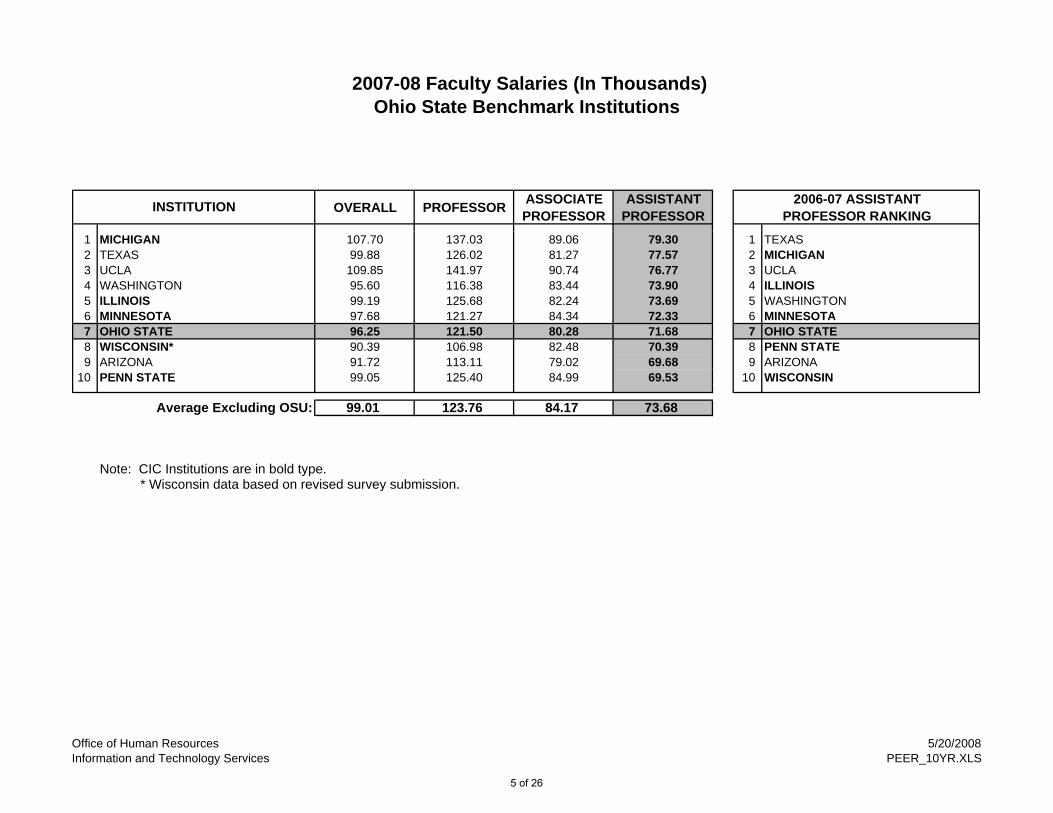
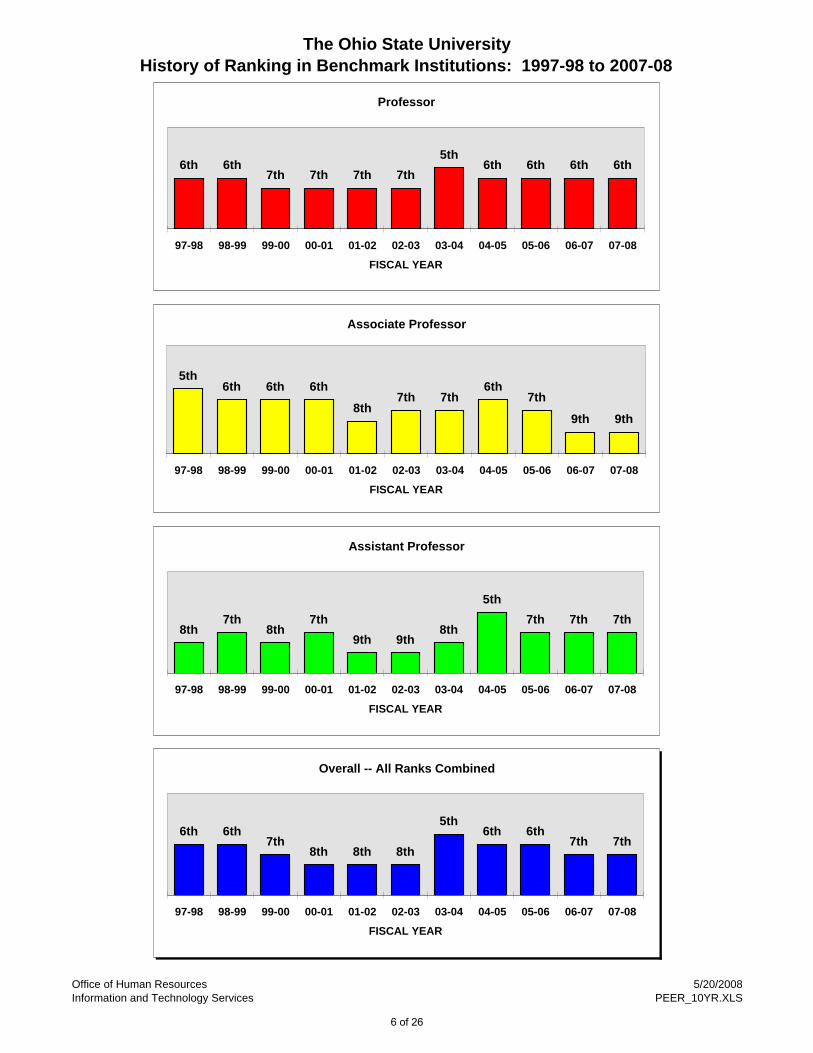
Benchmark Institutions
A second comparison group for OSU salaries is constituted of nine other similarly large public
universities, namely, Arizona, Illinois, Michigan, Minnesota, Penn State, Texas, UCLA,
Washington and Wisconsin. This group is smaller than the 12-member CIC and it is arguably a
more appropriate comparison group since all are public universities with similar profiles to Ohio
State. This salary comparison reveals a similar trend to that for the CIC and that is one of stasis.
Indeed, if anything, it is slightly more negative. Looking at all ranks combined, while OSU’s
7th
-ranked status over 10 years placed it roughly at the mid-point of the 12 CIC universities, the
same combined average places it at the same 7th
place among the 10 peer institutions, which is
firmly in the lower half of the distribution. Average salary increases for assistant professors over
the ten-year period rank fourth, while those for associate and full professors rank 8th
and 9th
respectively. As well, unlike in the CIC where the all ranks combined figure has shown no
change in ranking over the last 10 years, this same figure represents a drop of one place over the
same period in the smaller number of peer institutions. Again, the point has to be emphasized
that this drop has taken place at the same time that Ohio State has improved markedly as an
institution.
Page 4
3
Adjusting for Living Costs1
The committee recognizes that a possible weakness of the CIC and benchmark comparisons is
their assumption that a dollar in Chicago or Los Angeles has the same buying power as one in
Columbus or Urbana-Champaign. Solace might be sought, in other words, in the relative
purchasing power of Ohio States salaries being understated because of the relatively low cost of
living in Central Ohio. Being sensitive to this argument, we asked the Office of Human
Resources to replicate these comparisons while taking into account differences in living costs
between the areas in which the CIC and benchmark institutions are located. The table is
presented in the appendix to this report.
Taking the benchmark institutions first, adjusting dollar salary figures for cost of living does
indeed paint a different picture of the relative value of OSU salaries. They improve from being
the 7th
-highest in this group of ten institutions to being 4th
-highest. UCLA salaries, in contrast,
drop from first to last place, while Minnesota’s stay stable in 6th
place. This is good news for
Ohio State, of course. Nonetheless, a balanced perspective on the university’s salary structure
needs to consider other factors. One, it is not possible to take change over time into account
because we do not have matching living costs data extending back over a significant period.
This means that we do not know whether OSU’s comparative advantage in living costs has
increased or decreased over the period of the university’s improvement. Franklin County’s rapid
economic growth over this period, for example, might suggest that they have gone up rather than
stayed the same or gone down. Two, if living costs are to be taken into account in assessing the
true value of salaries, so too should quality of life. Some areas are more expensive to live in than
others because they are commonly perceived to offer a better quality of life. How many OSU
faculty members, for example, would relocate to West Lafayette, Indiana solely because the
1 The place of reputational ranking, as reflected in the USNWR’s 2008 list of the top 25 public universities, in our
deliberations was also a topic of discussion for the committee. A CIC comparison is difficult, however, because
Chicago and Northwestern are private institutions and, surprisingly, Indiana, Michigan State and Minnesota do not
make this top 25 list despite having a better salary record than OSU over the last decade. Moreover, only three of
the remaining CIC institutions, Michigan, Illinois and Penn State do better over this period than Ohio State in terms
of both 2008 reputational ranking and mean salary increases over the decade. Three others, Iowa, Purdue and
Wisconsin do worse in terms of average salary increases, but only Wisconsin has a better reputational ranking. A
similar picture emerges with the benchmarks. In particular, Arizona and Minnesota have a better salary record than
OSU over the last decade, but do not make the USNWR list.
On balance, then, there is little reason to argue for a disjuncture between Ohio State’s salary and reputational
ranking relative to its competitors. Moreover, this conclusion is not included in the main body of the report for two
reasons. First, using indicators like the number of books in the library, student entry scores, and physical plant, it is
not clear what the USNWR reputational ranking tells us about the quality of faculty in public universities. Second,
granting that faculty quality does shape reputation to some degree, reputation, whether moving up or down, is itself
inertial and slow to change so that OSU’s continuing academic improvement is unlikely to be fully reflected in an
improved reputation for some time.
Page 5
4
lower living costs there would mean a substantial increase in their salary’s purchasing power?
Finally, the CIC comparison paints a less glowing picture of Ohio State’s advantage in living
costs. There, OSU salaries actually fall back one place when these costs are taken into account.
We drop from 7th
in terms of average overall salary to 8th
.
In sum, adjusting for living costs does not always work to Ohio State’s benefit. Instead, it
produces uneven and unreliable results.
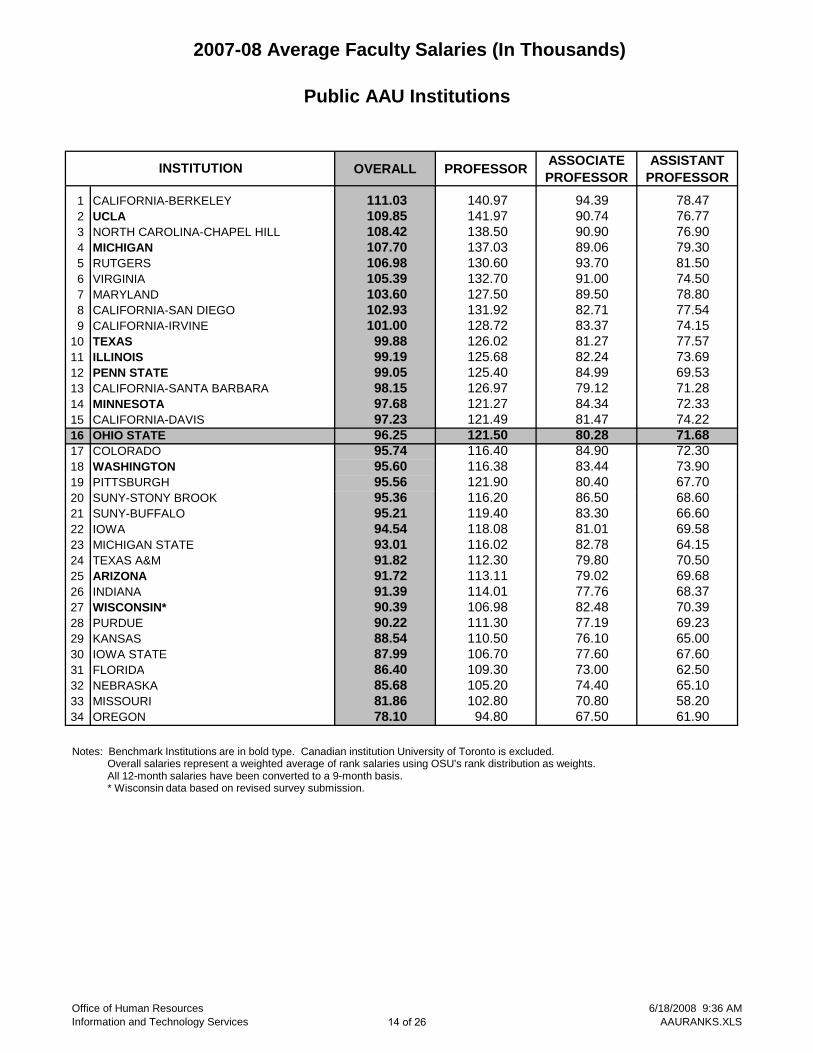
AAU Institutions
The final comparison group is the Association of American Universities (AAU), which describes
itself as “an association of the 62 leading research universities in the United States.” It provides
a target to which OSU aspires rather than a group of institutions with which direct salary
comparisons can fruitfully be made. For some time now, Ohio State has been committed to the
goal of reaching the rank of 30th
best-paying among AAU institutions. Again, data presenting an
historical perspective on OSU’s performance relative to this goal are presented in the appendix.
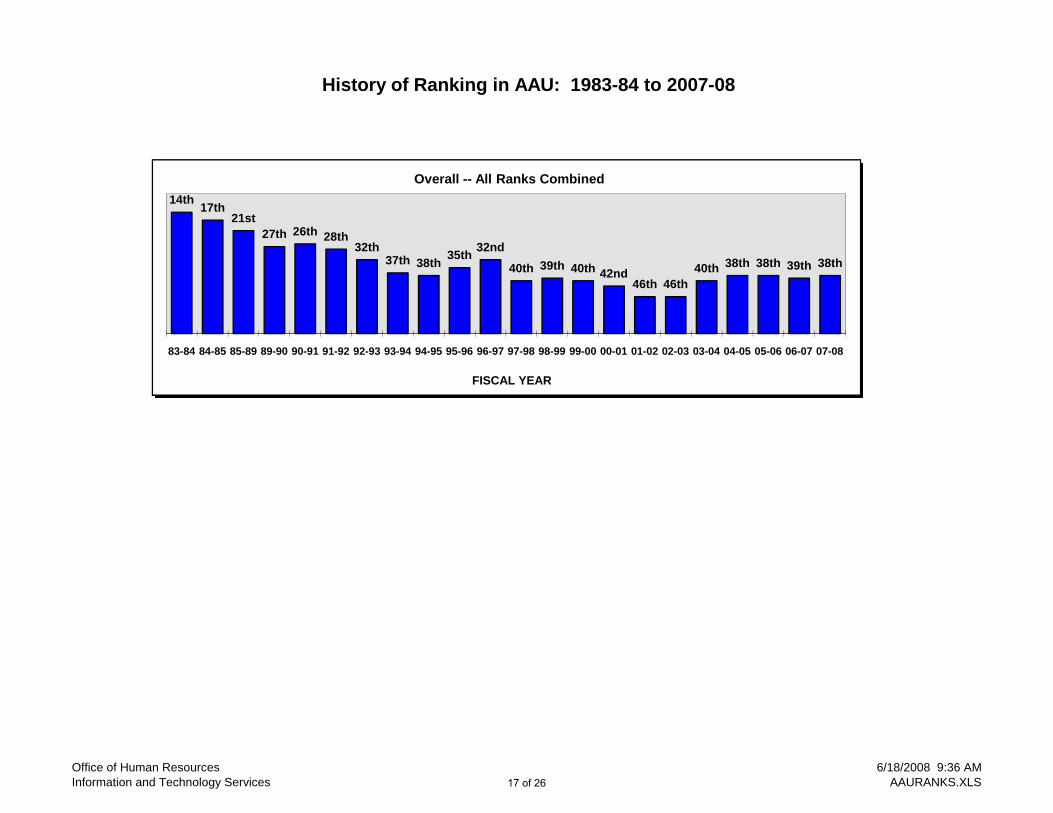
A very similar picture of middling status at best and lack of progress over the period of OSU’s
academic advancement emerges. Take salary levels for all ranks combined first. OSU ranks 38th
out of 6o this year, up from 39th
last year. Five benchmark institutions are above us and three
below. As for the CIC, six are above us and five below us. The trend in OSU salaries in recent
years is more encouraging insofar as we have moved from 46th
position in 2001-03 to 38th
in
2007-08. This improvement, however, still places us below our 32nd
ranking in 1996-97 and
only brings us back to where we were (38th
) in 1994-95. In terms of salary ranking at least, the
impression to emerge once again is that OSU continues at best to hold its ground. It is clearly
not making competitive gains against many of the universities we have to overtake, and are
overtaking in terms of quality and reputation, if we are to place 30th
in the AAU salary rankings.
BENEFITS
It is almost impossible to compare benefits packages across universities, but FCBC feels that
Ohio State’s package is both attractive and competitive. In recent years, for example, significant
efforts have been made to rein in spiraling health care costs and tuition concessions to the
children of OSU employees have been improved. The one benefits issue that we took up this
year from the committee’s 2007 report was the introduction of a phased retirement plan. In line
with this recommendation, an FCBC sub-committee was formed in September 2007 “to look into
the phased retirement issue.” It was also stipulated that such a program “must be governed by
guidelines advantageous to both the individual and the institution.” Discussions with deans and
department chairs, however, soon revealed little support for a formal phased retirement system
since it was felt that it would be difficult to implement as a binding arrangement on both the
faculty member and the institution and that it would not serve the interests of the institution well.
Discussions went no further, not least because Human Resources felt that it was possible for
faculty members to put together a favorable, individually tailored phased retirement plan within
the framework of our existing benefits package. Larry Lewellen has committed to put together a
brochure detailing how such a plan might be constructed and will submit it for FCBC’s
consideration early in the next academic year.
Page 6
5
We also worked on a number of medical benefits. Our deliberations resulted in the university
clarifying its outpatient hospitalization co-payment structure and brought to the Medical Center’s
attention difficulties encountered in navigating the “Your Plan for Health” website. On the
agenda for next year is discussion of the pharmaceutical co-payment structure for brand-name
drugs for which there is no generic equivalent. We shall also review data collected during the
first year of “Your Plan for Health” to discern how the plan is affecting faculty and their benefits.
More generally, FCBC will continue to study desirable benefits reforms and will use its first
meeting in Autumn 2008 to prioritize them. All faculty members are invited and encouraged to
submit both salary and benefits issues of concern to them to the committee chair at
[email protected] before the beginning of the 2008-09 academic year.
PENDING
The other sub-committee that FCBC formed this year was asked to come up with better ways of
benchmarking salaries so that finer distinctions can be drawn with matching entities in other
institutions. The annual FCBC report has to some extent already moved in this direction with its
comparison of salaries by matching college in the group of benchmark institutions. But can finer
distinctions be drawn that will allow OSU to determine where, allowing for merit, it is
competitive in salary levels and where it is uncompetitive? These finer distinctions may allow
for salary raise decisions across units and individuals that are more rational in the sense of
helping move the university forward in its pursuit of the goals of the Academic Plan. As with
the phased retirement issue, the benchmarking sub-committee will provide its report to the full
FCBC committee early in the next academic year.
The outstanding remaining agenda item at this point concerns the salaries of faculty at the
regional campuses of The Ohio State University. These faculty members are tenured in the
university and are expected to meet their units’ expectations for quality research, while faculty
members at the regional campuses of other universities in the state have lower research
expectations. But a 2007 FCBC sub-committee review of regional campus salaries showed that
no OSU regional campus has the highest average salary, at any rank, among the state’s 23
regional campuses for all Ohio universities combined. OSU ranked as low as ninth for full
professors and as low as tenth for associate and assistant professors.
The subcommittee recommended that regional campus salaries at The Ohio State University be
raised so that they are the highest at all ranks among the state’s regional campuses. The full
committee will debate this report next academic year.
RECOMMENDATIONS
The repeatedly confirmed salary goal of the university is to achieve 30th
position in the AAU
salary rankings. Last year’s FCBC report recommended a strategy to realize this goal over seven
years that comprised specific short-term and long-term targets. It recommended an average
4.5% average salary increase for 2007-2008, and the university made a good faith effort to meet
this target, but was able to come up with only an average 3.8% increase. The committee
Page 7
6
determined that last year’s strategy remains a reasonable and viable one and so has decided to
update and reiterate it this year.
We therefore again propose a two-tiered strategy over seven years:
First, we recommend an initiative to achieve annual increases that produce by 2010 an
overall average salary that is no more than 0.5% below those of our benchmarks (OSU’s
2004-05 levels). Assuming a continued average increase of 4.44% for the benchmarks,
we would anticipate the need for two annual increases adding up to 11.5% (just over
5.5% per year) to get OSU back to its 2004-05 position. Virtually any combination of
increases adding up to 11.5% will meet this target.
Second, since AAU average increases have been below those of our benchmarks over the
last three years (an AAU average of 3.65% compared to a benchmark one of 4.44%), the
university’s longer-term compensation target of 30th
in the AAU is less daunting. FCBC
estimates the need to fund salary raises of 4% per year to reach this position by 2015.
Average raises of 5% per year would get us to 30th
by 2010-11.
To repeat, the background to this salary raise strategy is that OSU as a whole has failed to make
any competitive gains at all, never mind gains commensurate with the undoubted increase in its
academic standing and reputation. It is FCBC’s strongly held view that the university
administration has to change focus from annual percentages to the bigger picture of (i) how is
Ohio State to improve the image of being a low-paying institution that must surely come from
currently being in the bottom half of the CIC and benchmark institutions against which the
university chooses to compare itself and pretty much in the bottom third of all AAU
institutions; and (ii) how is it to improve the salary structure so as to be able to offer salaries
that will allow the university, in President Gee’s words, “to retain, attract, and reward world-
class teachers and researchers in all academic areas of the university.”
A holistic strategy is called for and FCBC recommends that the administration read this report
in conjunction with the recently released Budget System Advisory Committee’s Final Report.
We applaud this thoughtful and thorough document and fully align FCBC’s short-term goals
and long-term aspirations with the letter and spirit of its recommendations. In particular, its
Section IV draws attention to the unlikelihood of being able to realize the objectives of the
Academic Plan, including those concerning faculty excellence and salary, without improved
alignment of academic and budgetary policies and/or without generating additional resources.
This is surely the greatest challenge facing this second Gee administration. No amount of
exhortation or wishful thinking will sustain the university’s continued improvement as long as
OSU salaries remain stagnant in relative terms and uncompetitive in absolute terms with those
of the universities we aspire to displace as we move up the rankings.
Page 8
2007-08 Benchmark Comparison Ten Year Faculty Salary History
PROFESSOR
07-08 06-07 05-06 04-05 03-04 02-03 01-02 00-01 99-00 98-99 97-98 % Rnk % Rnk % Rnk
UCLA 141.97 133.21 128.37 123.33 122.40 117.90 115.70 112.70 106.10 101.40 92.60 6.57 2 3.79 7 4.37 2MICHIGAN 137.03 130.44 125.62 120.17 117.80 114.80 108.90 105.20 100.90 96.70 91.90 5.05 4 3.60 9 4.08 8TEXAS 126.02 121.20 115.70 109.94 103.20 102.90 98.80 94.10 89.40 84.40 82.40 3.98 7 4.14 5 4.34 3ILLINOIS 125.68 120.93 116.62 111.82 107.00 101.40 100.90 95.60 91.60 86.80 83.60 3.93 8 4.39 3 4.16 6PENN STATE 125.40 120.21 116.51 112.58 108.00 102.70 98.10 93.80 89.90 86.10 83.10 4.32 5 4.08 6 4.20 4OHIO STATE 121.50 117.17 112.65 108.42 103.53 98.18 93.75 92.20 88.80 84.91 81.85 3.69 9 4.36 4 4.03 9MINNESOTA 121.27 116.60 110.31 105.36 102.00 101.30 97.60 93.60 89.50 85.60 81.00 4.01 6 3.66 8 4.12 7WASHINGTON 116.38 108.92 102.15 98.10 93.20 91.20 90.10 85.50 80.60 75.60 73.00 6.85 1 5.00 1 4.77 1ARIZONA 113.11 107.13 102.27 95.88 92.50 90.60 87.70 84.90 81.90 78.10 75.00 5.58 3 4.54 2 4.19 5WISCONSIN* 106.98 103.54 100.53 97.82 96.20 96.40 92.90 90.40 84.50 77.60 73.90 3.32 10 2.10 10 3.77 10
Average excl OSU 123.76 118.02 113.12 108.33 104.70 102.13 98.97 95.09 90.49 85.81 81.83 4.86 3.92 4.22
ASSOCIATE PROFESSOR
07-08 06-07 05-06 04-05 03-04 02-03 01-02 00-01 99-00 98-99 97-98 % Rnk % Rnk % Rnk
UCLA 90.74 84.22 81.97 78.06 77.00 74.60 73.20 72.40 67.40 65.40 60.70 7.74 2 3.99 4 4.10 5MICHIGAN 89.06 86.55 83.73 81.57 80.90 78.90 76.30 73.30 71.80 68.20 65.90 2.89 10 2.45 9 3.06 10PENN STATE 84.99 81.35 77.75 75.42 72.40 70.30 66.50 63.40 60.40 58.00 56.00 4.47 6 3.87 6 4.26 2MINNESOTA 84.34 80.56 75.63 70.68 69.90 70.90 69.20 66.10 63.90 61.70 57.50 4.70 5 3.53 7 3.91 7WASHINGTON 83.44 77.15 72.91 70.21 66.70 65.80 65.50 62.60 58.40 55.10 52.90 8.15 1 4.86 1 4.66 1WISCONSIN* 82.48 78.11 76.52 73.44 73.30 73.70 70.20 68.00 64.80 58.70 55.50 5.59 3 2.28 10 4.04 6ILLINOIS 82.24 79.55 77.57 75.06 72.00 69.40 69.90 66.30 63.40 60.60 58.40 3.38 9 3.45 8 3.48 9TEXAS 81.27 78.33 72.90 70.27 64.90 66.10 63.50 60.80 58.20 54.60 53.70 3.75 8 4.22 3 4.23 3OHIO STATE 80.28 76.94 74.19 72.13 69.08 66.27 63.53 63.80 61.10 58.12 56.26 4.35 7 3.91 5 3.62 8ARIZONA 79.02 74.91 71.44 67.23 64.90 64.20 61.80 60.00 57.20 54.00 52.50 5.49 4 4.24 2 4.17 4
Average excl OSU 84.17 80.08 76.71 73.55 71.33 70.43 68.46 65.88 62.83 59.59 57.01 5.11 3.63 3.97
ASSISTANT PROFESSOR
07-08 06-07 05-06 04-05 03-04 02-03 01-02 00-01 99-00 98-99 97-98 % Rnk % Rnk % Rnk
MICHIGAN 79.30 74.95 72.78 67.06 66.70 65.30 61.70 59.70 57.70 54.50 53.00 5.80 3 3.96 4 4.11 6TEXAS 77.57 75.15 70.67 66.89 62.30 61.50 60.00 57.30 54.20 50.60 49.70 3.23 8 4.75 1 4.55 1UCLA 76.77 72.06 67.02 65.48 63.70 63.80 63.50 63.00 58.30 54.70 52.00 6.54 2 3.77 7 3.97 8WASHINGTON 73.90 70.90 67.22 64.67 63.20 60.20 58.30 53.60 51.40 48.10 47.60 4.23 4 4.19 3 4.50 2ILLINOIS 73.69 71.69 69.63 68.18 64.50 61.00 60.40 56.80 54.10 52.30 51.20 2.79 9 3.85 6 3.71 9MINNESOTA 72.33 69.43 65.39 62.53 60.60 61.90 58.20 55.40 53.60 51.30 48.60 4.18 6 3.16 8 4.06 7OHIO STATE 71.68 69.38 65.78 64.77 62.25 59.08 55.20 54.40 51.00 48.73 47.37 3.32 7 3.94 5 4.23 4WISCONSIN* 70.39 66.01 64.30 63.57 63.60 62.00 59.80 59.80 55.40 52.10 50.60 6.62 1 2.57 10 3.36 10ARIZONA 69.68 66.87 63.54 59.75 57.60 56.30 54.20 52.00 49.80 48.10 46.50 4.21 5 4.36 2 4.13 5PENN STATE 69.53 68.16 66.28 64.04 62.50 59.50 56.00 52.70 50.20 47.40 45.80 2.01 10 3.16 9 4.26 3
Average excl OSU 73.68 70.58 67.42 64.68 62.74 61.28 59.12 56.70 53.86 51.01 49.44 4.40 3.76 4.07
OVERALL -- ALL RANKS COMBINED
07-08 06-07 05-06 04-05 03-04 02-03 01-02 00-01 99-00 98-99 97-98 % Rnk % Rnk % Rnk
UCLA 109.85 102.65 98.98 95.22 94.15 91.44 89.56 87.66 81.48 77.62 71.51 7.01 1 3.74 7 4.39 3MICHIGAN 107.70 102.90 99.64 95.40 94.12 91.89 87.25 83.99 80.72 76.69 73.40 4.67 5 3.23 9 3.91 9TEXAS 99.88 96.19 91.13 86.92 81.19 81.37 78.10 74.37 70.32 65.81 64.28 3.84 9 4.19 3 4.51 2ILLINOIS 99.19 95.67 92.90 89.70 85.80 81.76 81.29 76.79 73.05 69.38 66.87 3.68 10 3.94 5 4.02 8PENN STATE 99.05 95.15 92.18 89.28 85.96 82.33 77.93 74.10 70.38 67.03 64.55 4.11 7 3.77 6 4.38 4MINNESOTA 97.68 93.61 88.55 84.14 82.05 82.43 79.12 75.55 72.23 69.07 64.90 4.35 6 3.45 8 4.17 6OHIO STATE 96.25 92.64 89.16 86.46 82.78 78.84 74.84 73.93 70.35 66.89 64.50 3.90 8 4.07 4 4.08 7WASHINGTON 95.60 89.48 84.45 81.25 77.61 75.83 74.61 70.45 66.07 61.85 59.75 6.84 2 4.74 1 4.81 1ARIZONA 91.72 87.02 83.19 78.19 75.49 74.19 71.39 68.93 65.82 62.47 60.15 5.40 3 4.33 2 4.31 5WISCONSIN* 90.39 86.33 84.33 82.03 81.32 81.27 77.77 75.81 70.87 64.89 61.76 4.70 4 2.15 10 3.88 10
Average excl OSU 99.01 94.33 90.60 86.90 84.19 82.50 79.67 76.41 72.33 68.31 65.24 4.96 3.71 4.26
1 YEAR 5 YEAR 10 YEAR
1 YEAR 5 YEAR 10 YEAR
1 YEAR 5 YEAR 10 YEAR
1 YEAR 5 YEAR 10 YEAR
Note: The overall salaries are derived using Ohio State's rank distribution for the appropriate year. * Wisconsin data based on revised survey submission.
Office of Human ResourcesInformation and Technology Services
5/20/2008PEER_10YR.XLS1 of 26
Page 9
2007-08 Faculty Salaries (In Thousands)Ohio State Benchmark Institutions
OVERALL PROFESSOR ASSOCIATE PROFESSOR
ASSISTANT PROFESSOR 2006-07 OVERALL RANKING
1 UCLA 109.85 141.97 90.74 76.77 1 MICHIGAN2 MICHIGAN 107.70 137.03 89.06 79.30 2 UCLA3 TEXAS 99.88 126.02 81.27 77.57 3 TEXAS4 ILLINOIS 99.19 125.68 82.24 73.69 4 ILLINOIS5 PENN STATE 99.05 125.40 84.99 69.53 5 PENN STATE6 MINNESOTA 97.68 121.27 84.34 72.33 6 MINNESOTA7 OHIO STATE 96.25 121.50 80.28 71.68 7 OHIO STATE8 WASHINGTON 95.60 116.38 83.44 73.90 8 WASHINGTON9 ARIZONA 91.72 113.11 79.02 69.68 9 ARIZONA
10 WISCONSIN* 90.39 106.98 82.48 70.39 10 WISCONSIN
Average Excluding OSU: 99.01 123.76 84.17 73.68
Note: CIC Institutions are in bold type. * Wisconsin data based on revised survey submission.
INSTITUTION
Office of Human ResourcesInformation and Technology Services
5/20/2008PEER_10YR.XLS
2 of 26
Page 10
2007-08 Faculty Salaries (In Thousands)Ohio State Benchmark Institutions
OVERALL PROFESSOR ASSOCIATE PROFESSOR
ASSISTANT PROFESSOR 2006-07 PROFESSOR RANKING
1 UCLA 109.85 141.97 90.74 76.77 1 UCLA2 MICHIGAN 107.70 137.03 89.06 79.30 2 MICHIGAN3 TEXAS 99.88 126.02 81.27 77.57 3 TEXAS4 ILLINOIS 99.19 125.68 82.24 73.69 4 ILLINOIS5 PENN STATE 99.05 125.40 84.99 69.53 5 PENN STATE6 OHIO STATE 96.25 121.50 80.28 71.68 6 OHIO STATE7 MINNESOTA 97.68 121.27 84.34 72.33 7 MINNESOTA8 WASHINGTON 95.60 116.38 83.44 73.90 8 WASHINGTON9 ARIZONA 91.72 113.11 79.02 69.68 9 ARIZONA
10 WISCONSIN* 90.39 106.98 82.48 70.39 10 WISCONSIN
Average Excluding OSU: 99.01 123.76 84.17 73.68
Note: CIC Institutions are in bold type. * Wisconsin data based on revised survey submission.
INSTITUTION
Office of Human ResourcesInformation and Technology Services
5/20/2008PEER_10YR.XLS
3 of 26
Page 11
2007-08 Faculty Salaries (In Thousands)Ohio State Benchmark Institutions
OVERALL PROFESSOR ASSOCIATE PROFESSOR
ASSISTANT PROFESSOR
2006-07 ASSOCIATEPROFESSOR RANKING
1 UCLA 109.85 141.97 90.74 76.77 1 MICHIGAN2 MICHIGAN 107.70 137.03 89.06 79.30 2 UCLA3 PENN STATE 99.05 125.40 84.99 69.53 3 PENN STATE4 MINNESOTA 97.68 121.27 84.34 72.33 4 MINNESOTA5 WASHINGTON 95.60 116.38 83.44 73.90 5 ILLINOIS6 WISCONSIN* 90.39 106.98 82.48 70.39 6 TEXAS7 ILLINOIS 99.19 125.68 82.24 73.69 7 WISCONSIN8 TEXAS 99.88 126.02 81.27 77.57 8 WASHINGTON9 OHIO STATE 96.25 121.50 80.28 71.68 9 OHIO STATE
10 ARIZONA 91.72 113.11 79.02 69.68 10 ARIZONA
Average Excluding OSU: 99.01 123.76 84.17 73.68
Note: CIC Institutions are in bold type. * Wisconsin data based on revised survey submission.
INSTITUTION
Office of Human ResourcesInformation and Technology Services
5/20/2008PEER_10YR.XLS
4 of 26
Page 12
2007-08 Faculty Salaries (In Thousands)Ohio State Benchmark Institutions
OVERALL PROFESSOR ASSOCIATE PROFESSOR
ASSISTANT PROFESSOR
2006-07 ASSISTANTPROFESSOR RANKING
1 MICHIGAN 107.70 137.03 89.06 79.30 1 TEXAS2 TEXAS 99.88 126.02 81.27 77.57 2 MICHIGAN3 UCLA 109.85 141.97 90.74 76.77 3 UCLA4 WASHINGTON 95.60 116.38 83.44 73.90 4 ILLINOIS5 ILLINOIS 99.19 125.68 82.24 73.69 5 WASHINGTON6 MINNESOTA 97.68 121.27 84.34 72.33 6 MINNESOTA7 OHIO STATE 96.25 121.50 80.28 71.68 7 OHIO STATE8 WISCONSIN* 90.39 106.98 82.48 70.39 8 PENN STATE9 ARIZONA 91.72 113.11 79.02 69.68 9 ARIZONA
10 PENN STATE 99.05 125.40 84.99 69.53 10 WISCONSIN
Average Excluding OSU: 99.01 123.76 84.17 73.68
Note: CIC Institutions are in bold type. * Wisconsin data based on revised survey submission.
INSTITUTION
Office of Human ResourcesInformation and Technology Services
5/20/2008PEER_10YR.XLS
5 of 26
Page 13
The Ohio State University History of Ranking in Benchmark Institutions: 1997-98 to 2007-08
Professor
6th6th6th6th5th
7th7th7th7th6th6th
97-98 98-99 99-00 00-01 01-02 02-03 03-04 04-05 05-06 06-07 07-08
FISCAL YEAR
Associate Professor
9th9th
7th6th
7th7th8th
6th6th6th5th
97-98 98-99 99-00 00-01 01-02 02-03 03-04 04-05 05-06 06-07 07-08
FISCAL YEAR
Assistant Professor
8th7th
8th7th
9th 9th8th
5th7th 7th 7th
97-98 98-99 99-00 00-01 01-02 02-03 03-04 04-05 05-06 06-07 07-08
FISCAL YEAR
Overall -- All Ranks Combined
7th7th6th6th
5th
8th8th8th7th
6th6th
97-98 98-99 99-00 00-01 01-02 02-03 03-04 04-05 05-06 06-07 07-08
FISCAL YEAR
Office of Human ResourcesInformation and Technology Services
5/20/2008PEER_10YR.XLS
6 of 26
Page 14
2007-08 CIC Ten Year Faculty Salary History
PROFESSOR
07-08 06-07 05-06 04-05 03-04 02-03 01-02 00-01 99-00 98-99 97-98 % Rnk % Rnk % Rnk
U OF CHICAGO 170.81 162.52 155.08 148.43 141.30 134.70 129.20 124.80 118.50 112.00 106.00 5.11 3 4.87 1 4.89 1NORTHWESTERN 153.62 147.22 140.80 136.33 131.90 127.70 122.30 116.20 111.20 106.60 101.40 4.35 6 3.76 6 4.24 3MICHIGAN 137.03 130.44 125.62 120.17 117.80 114.80 108.90 105.20 100.90 96.70 91.90 5.05 4 3.60 9 4.08 7ILLINOIS 125.68 120.93 116.62 111.82 107.00 101.40 100.90 95.60 91.60 86.80 83.60 3.93 9 4.39 2 4.16 5PENN STATE 125.40 120.21 116.51 112.58 108.00 102.70 98.10 93.80 89.90 86.10 83.10 4.32 7 4.08 5 4.20 4OHIO STATE 121.50 117.17 112.65 108.42 103.53 98.18 93.75 92.20 88.80 84.91 81.85 3.69 10 4.36 3 4.03 8MINNESOTA 121.27 116.60 110.31 105.36 102.00 101.30 97.60 93.60 89.50 85.60 81.00 4.01 8 3.66 7 4.12 6IOWA 118.08 109.84 105.34 102.81 100.80 99.40 97.10 94.30 89.60 84.50 80.70 7.50 1 3.50 10 3.88 10MICHIGAN STATE 116.02 110.23 105.89 101.85 98.30 95.00 89.70 85.20 81.50 77.50 74.20 5.25 2 4.08 4 4.57 2INDIANA 114.01 109.05 104.92 101.77 99.10 96.80 94.20 88.20 85.00 80.80 77.40 4.55 5 3.33 11 3.95 9PURDUE 111.30 107.56 104.32 100.66 97.20 93.10 90.50 87.40 86.90 84.60 80.80 3.47 11 3.64 8 3.25 12WISCONSIN* 106.98 103.54 100.53 97.82 96.20 96.40 92.90 90.40 84.50 77.60 73.90 3.32 12 2.10 12 3.77 11
Average excl OSU 127.29 121.65 116.90 112.69 109.05 105.75 101.95 97.70 93.55 88.98 84.91 4.64 3.78 4.13
ASSOCIATE PROFESSOR
07-08 06-07 05-06 04-05 03-04 02-03 01-02 00-01 99-00 98-99 97-98 % Rnk % Rnk % Rnk
U OF CHICAGO 103.34 97.80 93.61 92.29 89.30 88.10 81.70 79.50 75.70 72.30 68.00 5.66 2 3.24 10 4.27 1NORTHWESTERN 100.54 97.48 93.73 90.67 86.90 83.90 80.30 78.50 73.40 70.80 67.40 3.14 11 3.69 4 4.08 3MICHIGAN 89.06 86.55 83.73 81.57 80.90 78.90 76.30 73.30 71.80 68.20 65.90 2.89 12 2.45 11 3.06 12PENN STATE 84.99 81.35 77.75 75.42 72.40 70.30 66.50 63.40 60.40 58.00 56.00 4.47 6 3.87 3 4.26 2MINNESOTA 84.34 80.56 75.63 70.68 69.90 70.90 69.20 66.10 63.90 61.70 57.50 4.70 4 3.53 6 3.91 6MICHIGAN STATE 82.78 79.16 76.45 73.72 72.40 69.90 67.60 63.90 60.40 58.00 55.80 4.57 5 3.44 8 4.02 5WISCONSIN* 82.48 78.11 76.52 73.44 73.30 73.70 70.20 68.00 64.80 58.70 55.50 5.59 3 2.28 12 4.04 4ILLINOIS 82.24 79.55 77.57 75.06 72.00 69.40 69.90 66.30 63.40 60.60 58.40 3.38 9 3.45 7 3.48 10IOWA 81.01 75.35 70.88 69.07 67.50 65.80 63.70 62.50 60.80 58.00 55.90 7.51 1 4.25 1 3.78 7OHIO STATE 80.28 76.94 74.19 72.13 69.08 66.27 63.53 63.80 61.10 58.12 56.26 4.35 7 3.91 2 3.62 9INDIANA 77.76 75.06 72.85 70.69 68.50 66.20 64.00 61.10 58.80 56.60 54.20 3.61 8 3.27 9 3.68 8PURDUE 77.19 74.82 72.92 70.58 68.80 64.50 62.70 60.60 60.10 57.70 55.20 3.17 10 3.66 5 3.41 11
Average excl OSU 85.97 82.34 79.24 76.65 74.72 72.87 70.19 67.56 64.86 61.87 59.07 4.41 3.36 3.82
ASSISTANT PROFESSOR
07-08 06-07 05-06 04-05 03-04 02-03 01-02 00-01 99-00 98-99 97-98 % Rnk % Rnk % Rnk
U OF CHICAGO 90.68 85.34 77.75 73.43 72.30 70.30 69.60 67.10 68.50 65.50 61.40 6.25 2 5.22 1 3.98 8NORTHWESTERN 87.88 83.50 81.21 79.26 76.80 73.40 69.10 65.80 62.40 59.80 58.50 5.23 5 3.67 6 4.15 4MICHIGAN 79.30 74.95 72.78 67.06 66.70 65.30 61.70 59.70 57.70 54.50 53.00 5.80 3 3.96 2 4.11 5ILLINOIS 73.69 71.69 69.63 68.18 64.50 61.00 60.40 56.80 54.10 52.30 51.20 2.79 11 3.85 5 3.71 9MINNESOTA 72.33 69.43 65.39 62.53 60.60 61.90 58.20 55.40 53.60 51.30 48.60 4.18 6 3.16 8 4.06 6OHIO STATE 71.68 69.38 65.78 64.77 62.25 59.08 55.20 54.40 51.00 48.73 47.37 3.32 10 3.94 3 4.23 3WISCONSIN* 70.39 66.01 64.30 63.57 63.60 62.00 59.80 59.80 55.40 52.10 50.60 6.62 1 2.57 11 3.36 11IOWA 69.58 65.80 63.93 61.66 59.80 59.30 56.10 54.60 52.70 49.30 48.40 5.74 4 3.25 7 3.70 10PENN STATE 69.53 68.16 66.28 64.04 62.50 59.50 56.00 52.70 50.20 47.40 45.80 2.01 12 3.16 9 4.26 2PURDUE 69.23 66.80 65.26 62.95 60.50 57.10 55.70 53.00 51.40 48.80 46.80 3.64 8 3.93 4 3.99 7INDIANA 68.37 66.01 62.63 61.27 59.60 58.80 55.30 49.80 48.40 45.90 43.60 3.59 9 3.06 10 4.60 1MICHIGAN STATE 64.15 61.83 60.21 59.70 58.90 57.00 53.90 51.20 49.10 47.50 46.50 3.75 7 2.39 12 3.27 12
Average excl OSU 74.10 70.87 68.12 65.79 64.16 62.33 59.62 56.90 54.86 52.22 50.40 4.57 3.52 3.93
OVERALL -- ALL RANKS COMBINED
07-08 06-07 05-06 04-05 03-04 02-03 01-02 00-01 99-00 98-99 97-98 % Rnk % Rnk % Rnk
U OF CHICAGO 129.80 122.98 117.01 112.87 108.57 104.94 99.70 96.24 91.93 86.91 81.72 5.55 2 4.34 1 4.74 1NORTHWESTERN 120.75 115.81 111.56 108.24 104.55 101.02 96.10 91.90 86.67 82.87 79.00 4.26 7 3.63 5 4.33 3MICHIGAN 107.70 102.90 99.64 95.40 94.12 91.89 87.25 83.99 80.72 76.69 73.40 4.67 5 3.23 10 3.91 10ILLINOIS 99.19 95.67 92.90 89.70 85.80 81.76 81.29 76.79 73.05 69.38 66.87 3.68 11 3.94 3 4.02 8PENN STATE 99.05 95.15 92.18 89.28 85.96 82.33 77.93 74.10 70.38 67.03 64.55 4.11 9 3.77 4 4.38 2MINNESOTA 97.68 93.61 88.55 84.14 82.05 82.43 79.12 75.55 72.23 69.07 64.90 4.35 6 3.45 9 4.17 5OHIO STATE 96.25 92.64 89.16 86.46 82.78 78.84 74.84 73.93 70.35 66.89 64.50 3.90 10 4.07 2 4.08 7IOWA 94.54 88.09 84.42 82.27 80.51 79.26 76.56 74.43 70.97 66.81 64.14 7.31 1 3.59 7 3.96 9MICHIGAN STATE 93.01 88.62 85.76 83.06 80.94 78.28 74.17 70.22 66.62 63.55 61.07 4.96 3 3.51 8 4.30 4INDIANA 91.39 87.70 84.63 82.30 80.07 78.15 75.22 70.24 67.36 64.02 61.10 4.21 8 3.18 11 4.11 6WISCONSIN* 90.39 86.33 84.33 82.03 81.32 81.27 77.77 75.81 70.87 64.89 61.76 4.70 4 2.15 12 3.88 11PURDUE 90.22 87.16 84.97 82.13 79.53 75.57 73.25 70.44 69.30 66.63 63.56 3.50 12 3.61 6 3.56 12
Average excl OSU 101.25 96.73 93.27 90.13 87.58 85.17 81.67 78.16 74.56 70.71 67.46 4.67 3.52 4.14
1 YEAR 5 YEAR 10 YEAR
1 YEAR 5 YEAR 10 YEAR
1 YEAR 5 YEAR 10 YEAR
1 YEAR 5 YEAR 10 YEAR
Note: The overall salaries are derived using Ohio State's rank distribution for the appropriate year. * Wisconsin data based on revised survey submission.
Office of Human ResourcesInformation and Technology Services
5/20/2008CIC_10YR.XLS
7 of 26
Page 15
The Ohio State UniversityHistory of Ranking in CIC: 1997-98 to 2007-08
Professor
6th 7th 8th 8th 9th 8th6th 6th 6th 6th 6th
97-98 98-99 99-00 00-01 01-02 02-03 03-04 04-05 05-06 06-07 07-08
FISCAL YEAR
Associate Professor
10th9th9th
8th9th9th
11th
8th7th7th
6th
97-98 98-99 99-00 00-01 01-02 02-03 03-04 04-05 05-06 06-07 07-08
FISCAL YEAR
Assistant Professor
6th6th6th5th
7th9th
11th
8th9th9th
8th
97-98 98-99 99-00 00-01 01-02 02-03 03-04 04-05 05-06 06-07 07-08
FISCAL YEAR
Overall -- All Ranks Combined
7th 7th9th 9th
10th9th
6th 6th 6th7th 7th
97-98 98-99 99-00 00-01 01-02 02-03 03-04 04-05 05-06 06-07 07-08
FISCAL YEAR
Office of Human ResourcesInformation and Technology Services
5/20/2008CIC_10YR.XLS
8 of 26
Page 16
The Ohio State UniversityHistory of Ranking in CIC: 1982-83 to 2007-08
Overall -- All Ranks Combined
7th7th6th6th
9th7th7th
4th6th
8th7th6th4th3rd2nd2nd
9th 9th 10th
6th
82-83
83-84
84-85
85-92
92-93
93-94
94-95
95-96
96-97
97-98
98-99
99-00
00-01
01-02
02-03
03-04
04-05
05-06
06-07
07-08
FISCAL YEAR
Office of Human ResourcesInformation and Technology Services
5/20/2008CIC_10YR.XLS
9 of 26
Page 17
2007-08 Average Faculty Salaries (In Thousands)AAU Institutions
OVERALL PROFESSOR ASSOCIATE PROFESSOR
ASSISTANT PROFESSOR
1 STANFORD 138.27 173.70 122.20 94.30 1 HARVARD2 HARVARD 137.89 184.80 106.10 95.40 2 STANFORD3 CAL TECH 134.18 162.20 120.20 101.30 3 CAL TECH4 U OF CHICAGO 129.80 170.81 103.34 90.68 4 PENNSYLVANIA5 PRINCETON 129.67 172.20 107.50 81.20 5 PRINCETON6 PENNSYLVANIA 129.13 163.30 107.50 95.90 6 U OF CHICAGO7 NEW YORK 125.81 162.40 102.60 90.30 7 COLUMBIA *8 MIT 123.08 151.60 106.40 93.30 8 MIT9 COLUMBIA 122.14 162.50 98.20 80.50 9 NORTHWESTERN
10 YALE 121.18 165.10 91.30 81.60 10 YALE11 DUKE 120.84 152.60 102.50 87.30 11 CORNELL-ENDOWED12 NORTHWESTERN 120.75 153.62 100.54 87.88 12 NEW YORK13 CORNELL-ENDOWED 119.80 148.20 103.40 89.80 13 DUKE14 WASHINGTON UNIVERSITY 116.33 150.80 96.40 80.00 14 WASHINGTON UNIVERSITY15 EMORY 113.50 147.20 93.40 78.90 15 EMORY16 SOUTHERN CALIFORNIA 111.87 140.10 93.60 85.00 16 SOUTHERN CALIFORNIA17 CALIFORNIA-BERKELEY 111.03 140.97 94.39 78.47 17 CARNEGIE-MELLON18 JOHNS HOPKINS 110.93 139.78 95.77 78.24 18 RICE19 RICE 110.10 137.10 94.50 81.60 19 CALIFORNIA-BERKELEY20 UCLA 109.85 141.97 90.74 76.77 20 BROWN21 CARNEGIE-MELLON 109.22 132.20 96.40 84.30 21 VANDERBILT22 NORTH CAROLINA-CHAPEL HILL 108.42 138.50 90.90 76.90 22 MICHIGAN23 MICHIGAN 107.70 137.03 89.06 79.30 23 UCLA24 BROWN 107.59 139.90 88.00 74.90 24 VIRGINIA25 VANDERBILT 107.56 140.30 91.00 69.50 25 NORTH CAROLINA-CHAPEL HILL26 RUTGERS 106.98 130.60 93.70 81.50 26 JOHNS HOPKINS27 VIRGINIA 105.39 132.70 91.00 74.50 27 MARYLAND28 MARYLAND 103.60 127.50 89.50 78.80 28 RUTGERS
2006-07 OVERALL RANKINGINSTITUTION
29 CALIFORNIA-SAN DIEGO 102.93 131.92 82.71 77.54 29 CALIFORNIA-SAN DIEGO30 CALIFORNIA-IRVINE 101.00 128.72 83.37 74.15 30 TEXAS31 TEXAS 99.88 126.02 81.27 77.57 31 ILLINOIS32 ILLINOIS 99.19 125.68 82.24 73.69 32 SUNY-STONY BROOK33 PENN STATE 99.05 125.40 84.99 69.53 33 PENN STATE34 CALIFORNIA-SANTA BARBARA 98.15 126.97 79.12 71.28 34 MINNESOTA35 ROCHESTER 97.94 118.20 85.80 77.20 35 PITTSBURGH36 MINNESOTA 97.68 121.27 84.34 72.33 36 ROCHESTER37 CALIFORNIA-DAVIS 97.23 121.49 81.47 74.22 37 SUNY-BUFFALO38 OHIO STATE 96.25 121.50 80.28 71.68 38 CALIFORNIA-IRVINE39 BRANDEIS 96.04 116.60 84.00 74.60 39 OHIO STATE40 COLORADO 95.74 116.40 84.90 72.30 40 CASE WESTERN RESERVE41 WASHINGTON 95.60 116.38 83.44 73.90 41 CALIFORNIA-SANTA BARBARA42 PITTSBURGH 95.56 121.90 80.40 67.70 42 TULANE43 SUNY-STONY BROOK 95.36 116.20 86.50 68.60 43 CALIFORNIA-DAVIS44 SUNY-BUFFALO 95.21 119.40 83.30 66.60 44 BRANDEIS45 CASE WESTERN RESERVE 95.13 118.90 81.50 69.90 45 WASHINGTON46 TULANE 94.97 119.80 82.40 66.10 46 MICHIGAN STATE47 IOWA 94.54 118.08 81.01 69.58 47 IOWA48 MICHIGAN STATE 93.01 116.02 82.78 64.15 48 COLORADO49 TEXAS A&M 91.82 112.30 79.80 70.50 49 INDIANA50 ARIZONA 91.72 113.11 79.02 69.68 50 TEXAS A&M51 INDIANA 91.39 114.01 77.76 68.37 51 PURDUE52 WISCONSIN* 90.39 106.98 82.48 70.39 52 ARIZONA53 PURDUE 90.22 111.30 77.19 69.23 53 WISCONSIN54 SYRACUSE 88.55 107.00 78.20 68.60 54 FLORIDA55 KANSAS 88.54 110.50 76.10 65.00 55 SYRACUSE56 IOWA STATE 87.99 106.70 77.60 67.60 56 KANSAS57 FLORIDA 86.40 109.30 73.00 62.50 57 IOWA STATE58 NEBRASKA 85.68 105.20 74.40 65.10 58 NEBRASKA59 MISSOURI 81.86 102.80 70.80 58.20 59 MISSOURI60 OREGON 78.10 94.80 67.50 61.90 60 OREGON
Notes: Benchmark Institutions are in bold type. Canadian institutions McGill and University of Toronto are excluded.Overall salaries represent a weighted average of rank salaries using OSU's rank distribution as weights.All 12-month salaries have been converted to a 9-month basis.* Wisconsin data based on revised survey submission.Number of AAU Institutions changed from 61 to 60 in 2002-03. (Catholic University was removed)
Office of Human ResourcesInformation and Technology Services
6/18/2008 9:36 AMAAURANKS.XLS10 of 26
Page 18
2007-08 Average Faculty Salaries (In Thousands)AAU Institutions
OVERALL PROFESSOR ASSOCIATE PROFESSOR
ASSISTANT PROFESSOR
1 HARVARD 137.89 184.80 106.10 95.40 1 HARVARD2 STANFORD 138.27 173.70 122.20 94.30 2 STANFORD3 PRINCETON 129.67 172.20 107.50 81.20 3 PRINCETON4 U OF CHICAGO 129.80 170.81 103.34 90.68 4 U OF CHICAGO5 YALE 121.18 165.10 91.30 81.60 5 YALE6 PENNSYLVANIA 129.13 163.30 107.50 95.90 6 PENNSYLVANIA7 COLUMBIA 122.14 162.50 98.20 80.50 7 CAL TECH8 NEW YORK 125.81 162.40 102.60 90.30 8 COLUMBIA *9 CAL TECH 134.18 162.20 120.20 101.30 9 NEW YORK
10 NORTHWESTERN 120.75 153.62 100.54 87.88 10 NORTHWESTERN11 DUKE 120.84 152.60 102.50 87.30 11 MIT12 MIT 123.08 151.60 106.40 93.30 12 WASHINGTON UNIVERSITY13 WASHINGTON UNIVERSITY 116.33 150.80 96.40 80.00 13 EMORY14 CORNELL-ENDOWED 119.80 148.20 103.40 89.80 14 DUKE15 EMORY 113.50 147.20 93.40 78.90 15 CORNELL-ENDOWED16 UCLA 109.85 141.97 90.74 76.77 16 VANDERBILT17 CALIFORNIA-BERKELEY 111.03 140.97 94.39 78.47 17 BROWN18 VANDERBILT 107.56 140.30 91.00 69.50 18 SOUTHERN CALIFORNIA19 SOUTHERN CALIFORNIA 111.87 140.10 93.60 85.00 19 UCLA20 BROWN 107.59 139.90 88.00 74.90 20 CALIFORNIA-BERKELEY21 JOHNS HOPKINS 110.93 139.78 95.77 78.24 21 MICHIGAN22 NORTH CAROLINA-CHAPEL HILL 108.42 138.50 90.90 76.90 22 RICE23 RICE 110.10 137.10 94.50 81.60 23 VIRGINIA24 MICHIGAN 107.70 137.03 89.06 79.30 24 CARNEGIE-MELLON25 VIRGINIA 105.39 132.70 91.00 74.50 25 NORTH CAROLINA-CHAPEL HILL26 CARNEGIE-MELLON 109.22 132.20 96.40 84.30 26 CALIFORNIA-SAN DIEGO27 CALIFORNIA-SAN DIEGO 102.93 131.92 82.71 77.54 27 JOHNS HOPKINS28 RUTGERS 106.98 130.60 93.70 81.50 28 RUTGERS
2006-07 PROFESSOR RANKINGINSTITUTION
29 CALIFORNIA-IRVINE 101.00 128.72 83.37 74.15 29 TEXAS30 MARYLAND 103.60 127.50 89.50 78.80 30 MARYLAND31 CALIFORNIA-SANTA BARBARA 98.15 126.97 79.12 71.28 31 ILLINOIS32 TEXAS 99.88 126.02 81.27 77.57 32 PENN STATE33 ILLINOIS 99.19 125.68 82.24 73.69 33 PITTSBURGH34 PENN STATE 99.05 125.40 84.99 69.53 34 CALIFORNIA-SANTA BARBARA35 PITTSBURGH 95.56 121.90 80.40 67.70 35 CALIFORNIA-IRVINE36 OHIO STATE 96.25 121.50 80.28 71.68 36 OHIO STATE37 CALIFORNIA-DAVIS 97.23 121.49 81.47 74.22 37 MINNESOTA38 MINNESOTA 97.68 121.27 84.34 72.33 38 SUNY-BUFFALO39 TULANE 94.97 119.80 82.40 66.10 39 SUNY-STONY BROOK40 SUNY-BUFFALO 95.21 119.40 83.30 66.60 40 CASE WESTERN RESERVE41 CASE WESTERN RESERVE 95.13 118.90 81.50 69.90 41 TULANE42 ROCHESTER 97.94 118.20 85.80 77.20 42 CALIFORNIA-DAVIS43 IOWA 94.54 118.08 81.01 69.58 43 ROCHESTER44 BRANDEIS 96.04 116.60 84.00 74.60 44 MICHIGAN STATE45 COLORADO 95.74 116.40 84.90 72.30 45 IOWA46 WASHINGTON 95.60 116.38 83.44 73.90 46 BRANDEIS47 SUNY-STONY BROOK 95.36 116.20 86.50 68.60 47 INDIANA48 MICHIGAN STATE 93.01 116.02 82.78 64.15 48 WASHINGTON49 INDIANA 91.39 114.01 77.76 68.37 49 FLORIDA50 ARIZONA 91.72 113.11 79.02 69.68 50 PURDUE51 TEXAS A&M 91.82 112.30 79.80 70.50 51 TEXAS A&M52 PURDUE 90.22 111.30 77.19 69.23 52 ARIZONA53 KANSAS 88.54 110.50 76.10 65.00 53 COLORADO54 FLORIDA 86.40 109.30 73.00 62.50 54 SYRACUSE55 SYRACUSE 88.55 107.00 78.20 68.60 55 KANSAS56 WISCONSIN* 90.39 106.98 82.48 70.39 56 WISCONSIN57 IOWA STATE 87.99 106.70 77.60 67.60 57 NEBRASKA58 NEBRASKA 85.68 105.20 74.40 65.10 58 MISSOURI59 MISSOURI 81.86 102.80 70.80 58.20 59 IOWA STATE60 OREGON 78.10 94.80 67.50 61.90 60 OREGON
Notes: Benchmark Institutions are in bold type. Canadian institutions McGill and University of Toronto are excluded.Overall salaries represent a weighted average of rank salaries using OSU's rank distribution as weights.All 12-month salaries have been converted to a 9-month basis.* Wisconsin data based on revised survey submission.Number of AAU Institutions changed from 61 to 60 in 2002-03. (Catholic University was removed)
Office of Human ResourcesInformation and Technology Services
6/18/2008 9:36 AMAAURANKS.XLS11 of 26
Page 19
2007-08 Average Faculty Salaries (In Thousands)AAU Institutions
OVERALL PROFESSOR ASSOCIATE PROFESSOR
ASSISTANT PROFESSOR
1 STANFORD 138.27 173.70 122.20 94.30 1 STANFORD2 CAL TECH 134.18 162.20 120.20 101.30 2 CAL TECH3 PENNSYLVANIA 129.13 163.30 107.50 95.90 3 PENNSYLVANIA4 PRINCETON 129.67 172.20 107.50 81.20 4 PRINCETON5 MIT 123.08 151.60 106.40 93.30 5 COLUMBIA *6 HARVARD 137.89 184.80 106.10 95.40 6 HARVARD7 CORNELL-ENDOWED 119.80 148.20 103.40 89.80 7 MIT8 U OF CHICAGO 129.80 170.81 103.34 90.68 8 CORNELL-ENDOWED9 NEW YORK 125.81 162.40 102.60 90.30 9 U OF CHICAGO
10 DUKE 120.84 152.60 102.50 87.30 10 NORTHWESTERN11 NORTHWESTERN 120.75 153.62 100.54 87.88 11 DUKE12 COLUMBIA 122.14 162.50 98.20 80.50 12 WASHINGTON UNIVERSITY13 CARNEGIE-MELLON 109.22 132.20 96.40 84.30 13 CARNEGIE-MELLON14 WASHINGTON UNIVERSITY 116.33 150.80 96.40 80.00 14 SOUTHERN CALIFORNIA15 JOHNS HOPKINS 110.93 139.78 95.77 78.24 15 NEW YORK16 RICE 110.10 137.10 94.50 81.60 16 RICE17 CALIFORNIA-BERKELEY 111.03 140.97 94.39 78.47 17 EMORY18 RUTGERS 106.98 130.60 93.70 81.50 18 VIRGINIA19 SOUTHERN CALIFORNIA 111.87 140.10 93.60 85.00 19 JOHNS HOPKINS20 EMORY 113.50 147.20 93.40 78.90 20 YALE21 YALE 121.18 165.10 91.30 81.60 21 CALIFORNIA-BERKELEY22 VANDERBILT 107.56 140.30 91.00 69.50 22 MICHIGAN23 VIRGINIA 105.39 132.70 91.00 74.50 23 VANDERBILT24 NORTH CAROLINA-CHAPEL HILL 108.42 138.50 90.90 76.90 24 SUNY-STONY BROOK25 UCLA 109.85 141.97 90.74 76.77 25 NORTH CAROLINA-CHAPEL HILL26 MARYLAND 103.60 127.50 89.50 78.80 26 RUTGERS27 MICHIGAN 107.70 137.03 89.06 79.30 27 MARYLAND28 BROWN 107.59 139.90 88.00 74.90 28 UCLA
2006-07 ASSOCIATE PROFESSOR RANKINGINSTITUTION
29 SUNY-STONY BROOK 95.36 116.20 86.50 68.60 29 BROWN30 ROCHESTER 97.94 118.20 85.80 77.20 30 ROCHESTER31 PENN STATE 99.05 125.40 84.99 69.53 31 PENN STATE32 COLORADO 95.74 116.40 84.90 72.30 32 SUNY-BUFFALO33 MINNESOTA 97.68 121.27 84.34 72.33 33 MINNESOTA34 BRANDEIS 96.04 116.60 84.00 74.60 34 ILLINOIS35 WASHINGTON 95.60 116.38 83.44 73.90 35 MICHIGAN STATE36 CALIFORNIA-IRVINE 101.00 128.72 83.37 74.15 36 TULANE37 SUNY-BUFFALO 95.21 119.40 83.30 66.60 37 CASE WESTERN RESERVE38 MICHIGAN STATE 93.01 116.02 82.78 64.15 38 TEXAS39 CALIFORNIA-SAN DIEGO 102.93 131.92 82.71 77.54 39 PITTSBURGH40 WISCONSIN* 90.39 106.98 82.48 70.39 40 WISCONSIN41 TULANE 94.97 119.80 82.40 66.10 41 CALIFORNIA-SAN DIEGO42 ILLINOIS 99.19 125.68 82.24 73.69 42 COLORADO43 CASE WESTERN RESERVE 95.13 118.90 81.50 69.90 43 BRANDEIS44 CALIFORNIA-DAVIS 97.23 121.49 81.47 74.22 44 CALIFORNIA-IRVINE45 TEXAS 99.88 126.02 81.27 77.57 45 WASHINGTON46 IOWA 94.54 118.08 81.01 69.58 46 OHIO STATE47 PITTSBURGH 95.56 121.90 80.40 67.70 47 CALIFORNIA-DAVIS48 OHIO STATE 96.25 121.50 80.28 71.68 48 TEXAS A&M49 TEXAS A&M 91.82 112.30 79.80 70.50 49 IOWA50 CALIFORNIA-SANTA BARBARA 98.15 126.97 79.12 71.28 50 SYRACUSE51 ARIZONA 91.72 113.11 79.02 69.68 51 INDIANA52 SYRACUSE 88.55 107.00 78.20 68.60 52 ARIZONA53 INDIANA 91.39 114.01 77.76 68.37 53 PURDUE54 IOWA STATE 87.99 106.70 77.60 67.60 54 CALIFORNIA-SANTA BARBARA55 PURDUE 90.22 111.30 77.19 69.23 55 IOWA STATE56 KANSAS 88.54 110.50 76.10 65.00 56 FLORIDA57 NEBRASKA 85.68 105.20 74.40 65.10 57 KANSAS58 FLORIDA 86.40 109.30 73.00 62.50 58 NEBRASKA59 MISSOURI 81.86 102.80 70.80 58.20 59 MISSOURI60 OREGON 78.10 94.80 67.50 61.90 60 OREGON
Notes: Benchmark Institutions are in bold type. Canadian institutions McGill and University of Toronto are excluded.Overall salaries represent a weighted average of rank salaries using OSU's rank distribution as weights.All 12-month salaries have been converted to a 9-month basis.* Wisconsin data based on revised survey submission.Number of AAU Institutions changed from 61 to 60 in 2002-03. (Catholic University was removed)
Office of Human ResourcesInformation and Technology Services
6/18/2008 9:36 AMAAURANKS.XLS12 of 26
Page 20
2007-08 Average Faculty Salaries (In Thousands)AAU Institutions
OVERALL PROFESSOR ASSOCIATE PROFESSOR
ASSISTANT PROFESSOR
1 CAL TECH 134.18 162.20 120.20 101.30 1 CAL TECH2 PENNSYLVANIA 129.13 163.30 107.50 95.90 2 PENNSYLVANIA3 HARVARD 137.89 184.80 106.10 95.40 3 HARVARD4 STANFORD 138.27 173.70 122.20 94.30 4 STANFORD5 MIT 123.08 151.60 106.40 93.30 5 MIT6 U OF CHICAGO 129.80 170.81 103.34 90.68 6 CORNELL-ENDOWED7 NEW YORK 125.81 162.40 102.60 90.30 7 U OF CHICAGO8 CORNELL-ENDOWED 119.80 148.20 103.40 89.80 8 NORTHWESTERN9 NORTHWESTERN 120.75 153.62 100.54 87.88 9 CARNEGIE-MELLON
10 DUKE 120.84 152.60 102.50 87.30 10 DUKE11 SOUTHERN CALIFORNIA 111.87 140.10 93.60 85.00 11 SOUTHERN CALIFORNIA12 CARNEGIE-MELLON 109.22 132.20 96.40 84.30 12 NEW YORK13 RICE 110.10 137.10 94.50 81.60 13 COLUMBIA *14 YALE 121.18 165.10 91.30 81.60 14 PRINCETON15 RUTGERS 106.98 130.60 93.70 81.50 15 RICE16 PRINCETON 129.67 172.20 107.50 81.20 16 EMORY17 COLUMBIA 122.14 162.50 98.20 80.50 17 YALE18 WASHINGTON UNIVERSITY 116.33 150.80 96.40 80.00 18 MARYLAND19 MICHIGAN 107.70 137.03 89.06 79.30 19 WASHINGTON UNIVERSITY20 EMORY 113.50 147.20 93.40 78.90 20 CALIFORNIA-BERKELEY21 MARYLAND 103.60 127.50 89.50 78.80 21 TEXAS22 CALIFORNIA-BERKELEY 111.03 140.97 94.39 78.47 22 MICHIGAN23 JOHNS HOPKINS 110.93 139.78 95.77 78.24 23 ROCHESTER24 TEXAS 99.88 126.02 81.27 77.57 24 BROWN25 CALIFORNIA-SAN DIEGO 102.93 131.92 82.71 77.54 25 UCLA26 ROCHESTER 97.94 118.20 85.80 77.20 26 NORTH CAROLINA-CHAPEL HILL27 NORTH CAROLINA-CHAPEL HILL 108.42 138.50 90.90 76.90 27 ILLINOIS28 UCLA 109.85 141.97 90.74 76.77 28 VIRGINIA
2006-07 ASSISTANT PROFESSOR RANKINGINSTITUTION
29 BROWN 107.59 139.90 88.00 74.90 29 WASHINGTON30 BRANDEIS 96.04 116.60 84.00 74.60 30 JOHNS HOPKINS31 VIRGINIA 105.39 132.70 91.00 74.50 31 CALIFORNIA-SAN DIEGO32 CALIFORNIA-DAVIS 97.23 121.49 81.47 74.22 32 BRANDEIS33 CALIFORNIA-IRVINE 101.00 128.72 83.37 74.15 33 MINNESOTA34 WASHINGTON 95.60 116.38 83.44 73.90 34 OHIO STATE35 ILLINOIS 99.19 125.68 82.24 73.69 35 SUNY-STONY BROOK36 MINNESOTA 97.68 121.27 84.34 72.33 36 RUTGERS37 COLORADO 95.74 116.40 84.90 72.30 37 CALIFORNIA-IRVINE38 OHIO STATE 96.25 121.50 80.28 71.68 38 PENN STATE39 CALIFORNIA-SANTA BARBARA 98.15 126.97 79.12 71.28 39 CASE WESTERN RESERVE40 TEXAS A&M 91.82 112.30 79.80 70.50 40 CALIFORNIA-DAVIS41 WISCONSIN* 90.39 106.98 82.48 70.39 41 COLORADO42 CASE WESTERN RESERVE 95.13 118.90 81.50 69.90 42 TEXAS A&M43 ARIZONA 91.72 113.11 79.02 69.68 43 CALIFORNIA-SANTA BARBARA44 IOWA 94.54 118.08 81.01 69.58 44 VANDERBILT45 PENN STATE 99.05 125.40 84.99 69.53 45 ARIZONA46 VANDERBILT 107.56 140.30 91.00 69.50 46 PURDUE47 PURDUE 90.22 111.30 77.19 69.23 47 SUNY-BUFFALO48 SUNY-STONY BROOK 95.36 116.20 86.50 68.60 48 PITTSBURGH49 SYRACUSE 88.55 107.00 78.20 68.60 49 WISCONSIN50 INDIANA 91.39 114.01 77.76 68.37 50 INDIANA51 PITTSBURGH 95.56 121.90 80.40 67.70 51 IOWA52 IOWA STATE 87.99 106.70 77.60 67.60 52 SYRACUSE53 SUNY-BUFFALO 95.21 119.40 83.30 66.60 53 IOWA STATE54 TULANE 94.97 119.80 82.40 66.10 54 TULANE55 NEBRASKA 85.68 105.20 74.40 65.10 55 NEBRASKA56 KANSAS 88.54 110.50 76.10 65.00 56 KANSAS57 MICHIGAN STATE 93.01 116.02 82.78 64.15 57 FLORIDA58 FLORIDA 86.40 109.30 73.00 62.50 58 MICHIGAN STATE59 OREGON 78.10 94.80 67.50 61.90 59 OREGON60 MISSOURI 81.86 102.80 70.80 58.20 60 MISSOURI
Notes: Benchmark Institutions are in bold type. Canadian institutions McGill and University of Toronto are excluded.Overall salaries represent a weighted average of rank salaries using OSU's rank distribution as weights.All 12-month salaries have been converted to a 9-month basis.* Wisconsin data based on revised survey submission.Number of AAU Institutions changed from 61 to 60 in 2002-03. (Catholic University was removed)
Office of Human ResourcesInformation and Technology Services
6/18/2008 9:36 AMAAURANKS.XLS13 of 26
Page 21
2007-08 Average Faculty Salaries (In Thousands)
Public AAU Institutions
OVERALL PROFESSOR ASSOCIATE PROFESSOR
ASSISTANT PROFESSOR
1 CALIFORNIA-BERKELEY 111.03 140.97 94.39 78.47 2 UCLA 109.85 141.97 90.74 76.77 3 NORTH CAROLINA-CHAPEL HILL 108.42 138.50 90.90 76.90 4 MICHIGAN 107.70 137.03 89.06 79.30 5 RUTGERS 106.98 130.60 93.70 81.50 6 VIRGINIA 105.39 132.70 91.00 74.50 7 MARYLAND 103.60 127.50 89.50 78.80 8 CALIFORNIA-SAN DIEGO 102.93 131.92 82.71 77.54 9 CALIFORNIA-IRVINE 101.00 128.72 83.37 74.15
10 TEXAS 99.88 126.02 81.27 77.57 11 ILLINOIS 99.19 125.68 82.24 73.69 12 PENN STATE 99.05 125.40 84.99 69.53 13 CALIFORNIA-SANTA BARBARA 98.15 126.97 79.12 71.28 14 MINNESOTA 97.68 121.27 84.34 72.33 15 CALIFORNIA-DAVIS 97.23 121.49 81.47 74.22 16 OHIO STATE 96.25 121.50 80.28 71.68 17 COLORADO 95.74 116.40 84.90 72.30 18 WASHINGTON 95.60 116.38 83.44 73.90 19 PITTSBURGH 95.56 121.90 80.40 67.70
INSTITUTION
20 SUNY-STONY BROOK 95.36 116.20 86.50 68.60 21 SUNY-BUFFALO 95.21 119.40 83.30 66.60 22 IOWA 94.54 118.08 81.01 69.58 23 MICHIGAN STATE 93.01 116.02 82.78 64.15 24 TEXAS A&M 91.82 112.30 79.80 70.50 25 ARIZONA 91.72 113.11 79.02 69.68 26 INDIANA 91.39 114.01 77.76 68.37 27 WISCONSIN* 90.39 106.98 82.48 70.39 28 PURDUE 90.22 111.30 77.19 69.23 29 KANSAS 88.54 110.50 76.10 65.00 30 IOWA STATE 87.99 106.70 77.60 67.60 31 FLORIDA 86.40 109.30 73.00 62.50 32 NEBRASKA 85.68 105.20 74.40 65.10 33 MISSOURI 81.86 102.80 70.80 58.20 34 OREGON 78.10 94.80 67.50 61.90
Notes: Benchmark Institutions are in bold type. Canadian institution University of Toronto is excluded.Overall salaries represent a weighted average of rank salaries using OSU's rank distribution as weights.All 12-month salaries have been converted to a 9-month basis.* Wisconsin data based on revised survey submission.
Office of Human ResourcesInformation and Technology Services
6/18/2008 9:36 AMAAURANKS.XLS14 of 26
Page 22
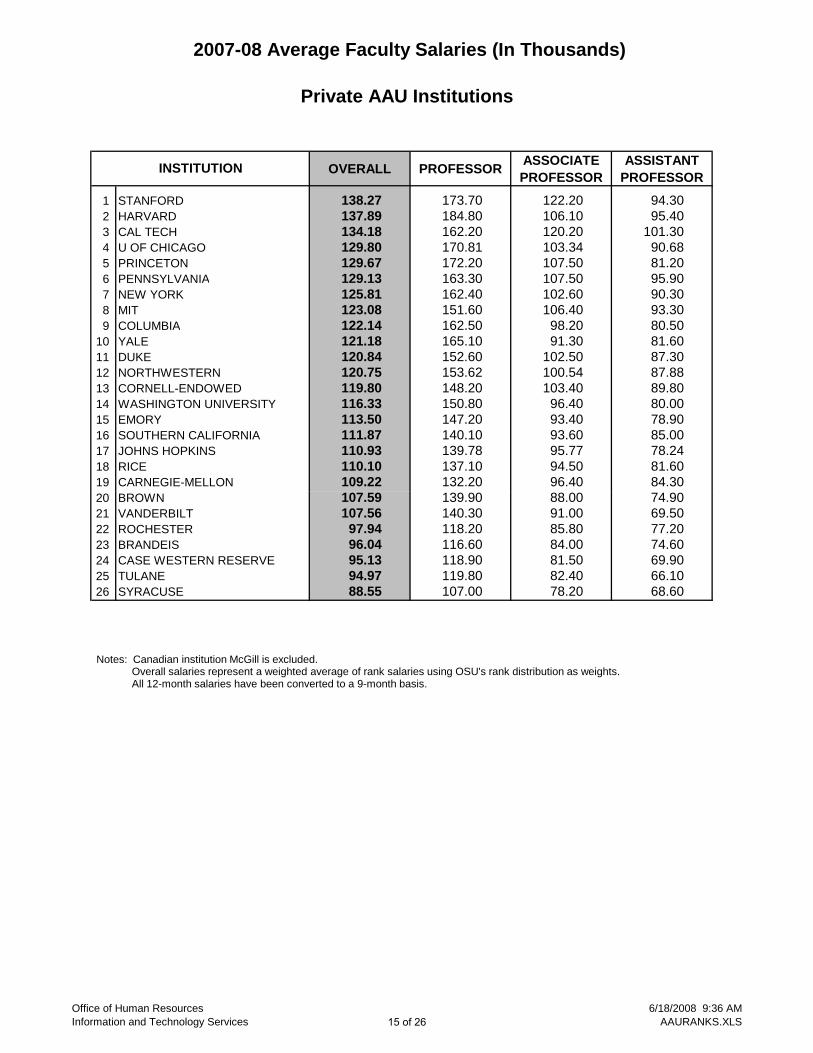
2007-08 Average Faculty Salaries (In Thousands)
Private AAU Institutions
OVERALL PROFESSOR ASSOCIATE PROFESSOR
ASSISTANT PROFESSOR
1 STANFORD 138.27 173.70 122.20 94.30 2 HARVARD 137.89 184.80 106.10 95.40 3 CAL TECH 134.18 162.20 120.20 101.30 4 U OF CHICAGO 129.80 170.81 103.34 90.68 5 PRINCETON 129.67 172.20 107.50 81.20 6 PENNSYLVANIA 129.13 163.30 107.50 95.90 7 NEW YORK 125.81 162.40 102.60 90.30 8 MIT 123.08 151.60 106.40 93.30 9 COLUMBIA 122.14 162.50 98.20 80.50
10 YALE 121.18 165.10 91.30 81.60 11 DUKE 120.84 152.60 102.50 87.30 12 NORTHWESTERN 120.75 153.62 100.54 87.88 13 CORNELL-ENDOWED 119.80 148.20 103.40 89.80 14 WASHINGTON UNIVERSITY 116.33 150.80 96.40 80.00 15 EMORY 113.50 147.20 93.40 78.90 16 SOUTHERN CALIFORNIA 111.87 140.10 93.60 85.00 17 JOHNS HOPKINS 110.93 139.78 95.77 78.24 18 RICE 110.10 137.10 94.50 81.60 19 CARNEGIE-MELLON 109.22 132.20 96.40 84.30
INSTITUTION
20 BROWN 107.59 139.90 88.00 74.90 21 VANDERBILT 107.56 140.30 91.00 69.50 22 ROCHESTER 97.94 118.20 85.80 77.20 23 BRANDEIS 96.04 116.60 84.00 74.60 24 CASE WESTERN RESERVE 95.13 118.90 81.50 69.90 25 TULANE 94.97 119.80 82.40 66.10 26 SYRACUSE 88.55 107.00 78.20 68.60
Notes: Canadian institution McGill is excluded.Overall salaries represent a weighted average of rank salaries using OSU's rank distribution as weights.All 12-month salaries have been converted to a 9-month basis.
Office of Human ResourcesInformation and Technology Services
6/18/2008 9:36 AMAAURANKS.XLS15 of 26
Page 23
History of Ranking in AAU: 1993-94 to 2007-08
36th 37th33rd 33rd
37th 38th 40th 41st 44th 44th39th 37th 36th 36th 36th
93-94 94-95 95-96 96-97 97-98 98-99 99-00 00-01 01-02 02-03 03-04 04-05 05-06 06-07 07-08FISCAL YEAR
Professor
40th 39th 36th31st
40th 42nd 39th 40th
51st 48th 47th41st 43rd 46th 48th
93-94 94-95 95-96 96-97 97-98 98-99 99-00 00-01 01-02 02-03 03-04 04-05 05-06 06-07 07-08FISCAL YEAR
Associate Professor
NOTE: The number of U.S. AAU institutions changed from 56 to 60 in 1996-97; from 60 to 61 in 2001-02; andfrom 61 to 60 in 2002-03.
40th44th
36th 38th42nd 42nd 42nd 41st
51st44th
34th 32nd 35th 34th38th
93-94 94-95 95-96 96-97 97-98 98-99 99-00 00-01 01-02 02-03 03-04 04-05 05-06 06-07 07-08FISCAL YEAR
Assistant Professor
37th 38th35th
32nd
40th 39th 40th 42nd46th 46th
40th 38th 38th 39th 38th
93-94 94-95 95-96 96-97 97-98 98-99 99-00 00-01 01-02 02-03 03-04 04-05 05-06 06-07 07-08FISCAL YEAR
Overall -- All Ranks Combined
Office of Human ResourcesInformation and Technology Services
6/18/2008 9:36 AMAAURANKS.XLS16 of 26
Page 24
History of Ranking in AAU: 1983-84 to 2007-08
14th 17th21st
27th 26th 28th32th
37th 38th 35th 32nd
40th 39th 40th 42nd46th 46th
40th 38th 38th 39th 38th
83-84 84-85 85-89 89-90 90-91 91-92 92-93 93-94 94-95 95-96 96-97 97-98 98-99 99-00 00-01 01-02 02-03 03-04 04-05 05-06 06-07 07-08
FISCAL YEAR
Overall -- All Ranks Combined
FISCAL YEAR
Office of Human ResourcesInformation and Technology Services
6/18/2008 9:36 AMAAURANKS.XLS17 of 26
Page 25
History of Ranking in Public AAU Institutions1995-96 to 2007-08
15th
10th
16th 16th18th 19th
23rd 22nd
17th15th 15th
17th 16th
95-96 96-97 97-98 98-99 99-00 00-01 01-02 02-03 03-04 04-05 05-06 06-07 07-08FISCAL YEAR
Overall -- All Ranks Combined
Note: Number of AAU Publics increased from 32 to 34 in 2001-02.
FISCAL YEAR
Office of Human ResourcesInformation and Technology Services
6/18/2008 9:36 AMAAURANKS.XLS18 of 26
Page 26
The Ohio State UniversityAAU - Living Cost Index on Overall Faculty Salaries - Updated
FY 2007-08
Living Cost DifferenceAAU Institution Index Overall Rank Overall Rank in RankDUKE 96.5 $120.84 11 $125.22 1 10 VANDERBILT 93.2 $107.56 25 $115.41 2 23 CORNELL-ENDOWED 106.4 $119.80 13 $112.59 3 10 NORTH CAROLINA-CHAPEL HILL 96.5 $108.42 22 $112.35 4 18 EMORY 102.2 $113.50 15 $111.06 5 10 PENNSYLVANIA 119.7 $129.13 6 $107.88 6 0 YALE 114.8 $121.18 10 $105.56 7 3 ILLINOIS 94.4 $99.19 32 $105.07 8 24 U OF CHICAGO 124.2 $129.80 4 $104.51 9 -5 WASHINGTON UNIVERSITY 112.2 $116.33 14 $103.68 10 4 JOHNS HOPKINS 108.6 $110.93 18 $102.15 11 7 VIRGINIA 103.4 $105.39 27 $101.93 12 15 HARVARD 137.1 $137.89 2 $100.57 13 -11 PRINCETON 129.1 $129.67 5 $100.44 14 -9 PURDUE 90.9 $90.22 53 $99.25 15 38 MICHIGAN 108.7 $107.70 23 $99.08 16 7 INDIANA 92.9 $91.39 51 $98.38 17 34 PENN STATE 101.1 $99.05 33 $97.98 18 15 CARNEGIE-MELLON 111.8 $109.22 21 $97.69 19 2 RICE 112.9 $110.10 19 $97.52 20 -1 TEXAS A&M 94.3 $91.82 49 $97.37 21 28 NORTHWESTERN 124.2 $120.75 12 $97.22 22 -10 OHIO STATE 100.0 $96.25 38 $96.25 23 15 SUNY-BUFFALO 100.1 $95.21 44 $95.12 24 20 ROCHESTER 103.1 $97.94 35 $94.99 25 10 IOWA 99.7 $94.54 47 $94.82 26 21 BROWN 113.6 $107.59 24 $94.71 27 -3 TEXAS 106.8 $99.88 31 $93.52 28 3 CASE WESTERN RESERVE 102.8 $95.13 45 $92.54 29 16 KANSAS 96.4 $88.54 55 $91.85 30 25
Original Adjusted by Index
MISSOURI 89.2 $81.86 59 $91.77 31 28 MICHIGAN STATE 102.4 $93.01 48 $90.83 32 16 IOWA STATE 96.9 $87.99 56 $90.80 33 23 TULANE 105.3 $94.97 46 $90.19 34 12 MIT 137.1 $123.08 8 $89.78 35 -27 NEBRASKA 97.5 $85.68 58 $87.88 36 22 COLORADO 109.4 $95.74 40 $87.51 37 3 WISCONSIN* 103.5 $90.39 52 $87.34 38 14 MINNESOTA 111.9 $97.68 36 $87.29 39 -3 SYRACUSE 103.1 $88.55 54 $85.88 40 14 PITTSBURGH 111.8 $95.56 42 $85.48 41 1 FLORIDA 102.1 $86.40 57 $84.62 42 15 MARYLAND 123.7 $103.60 28 $83.75 43 -15 RUTGERS 128.8 $106.98 26 $83.06 44 -18 CAL TECH 164.6 $134.18 3 $81.52 45 -42 WASHINGTON 118.6 $95.60 41 $80.61 46 -5 ARIZONA 114.7 $91.72 50 $79.97 47 3 CALIFORNIA-SAN DIEGO 133.1 $102.93 29 $77.33 48 -19 CALIFORNIA-DAVIS 129.3 $97.23 37 $75.19 49 -12 SOUTHERN CALIFORNIA 151.7 $111.87 16 $73.74 50 -34 OREGON 106.3 $78.10 60 $73.47 51 9 UCLA 151.7 $109.85 20 $72.41 52 -32 STANFORD 196.2 $138.27 1 $70.47 53 -52 BRANDEIS 137.1 $96.04 39 $70.05 54 -15 CALIFORNIA-IRVINE 147.5 $101.00 30 $68.47 55 -25 SUNY-STONY BROOK 143.3 $95.36 43 $66.54 56 -13 CALIFORNIA-BERKELEY 174.8 $111.03 17 $63.52 57 -40 NEW YORK 217.3 $125.81 7 $57.90 58 -51 COLUMBIA 217.3 $122.14 9 $56.21 59 -50 CALIFORNIA-SANTA BARBARA 213.8 $98.15 34 $45.91 60 -26
Sources: 2007 Runzhemier Report of Living Cost StandardsAmerican Association of University Professors (AAUP) Faculty Compensation Survey 2007-08
Notes: Benchmark Institutions are in bold type. Canadian institutions McGill and University of Toronto are excluded.Overall salaries represent a weighted average of rank salaries using OSU's rank distribution as weights.All 12-month salaries have been converted to a 9-month basis.Living cost can vary from community to community within a large metropolitan area. When information was available regarding
the specific location of a campus, that index was used. When information regarding the particular location was unavailable orambiguous, the cost-of-living for the metropolitan area as a whole was used.
* Wisconsin data based on revised survey submission.
Office of Human ResourcesInformation and Technology Services
Living Cost Comparisons version 4.XLS6/18/200819 of 26
Page 27
The Ohio State UniversityBenchmark and CIC - Living Cost Index on Overall Faculty Salaries - Updated
FY 2007-08
Benchmark Rank Changes:Living Cost Difference
Institution Index Overall Rank Overall Rank in RankILLINOIS 94.4 $99.19 4 $105.07 1 3 MICHIGAN 108.7 $107.70 2 $99.08 2 0 PENN STATE 101.1 $99.05 5 $97.98 3 2 OHIO STATE 100.0 $96.25 7 $96.25 4 3 TEXAS 106.8 $99.88 3 $93.52 5 -2 WISCONSIN* 103.5 $90.39 10 $87.34 6 4 MINNESOTA 111.9 $97.68 6 $87.29 7 -1 WASHINGTON 118.6 $95.60 8 $80.61 8 0 ARIZONA 114.7 $91.72 9 $79.97 9 0 UCLA 151.7 $109.85 1 $72.41 10 -9
CIC Rank Changes:Living Cost Difference
Institution Index Overall Rank Overall Rank in RankILLINOIS 94.4 $99.19 4 $105.07 1 3 U OF CHICAGO 124.2 $129.80 1 $104.51 2 -1 PURDUE 90 9 $90 22 12 $99 25 3 9
Original Adjusted by Index
Original Adjusted by Index
PURDUE 90.9 $90.22 12 $99.25 3 9 MICHIGAN 108.7 $107.70 3 $99.08 4 -1 INDIANA 92.9 $91.39 10 $98.38 5 5 PENN STATE 101.1 $99.05 5 $97.98 6 -1 NORTHWESTERN 124.2 $120.75 2 $97.22 7 -5 OHIO STATE 100.0 $96.25 7 $96.25 8 -1 IOWA 99.7 $94.54 8 $94.82 9 -1 MICHIGAN STATE 102.4 $93.01 9 $90.83 10 -1 WISCONSIN* 103.5 $90.39 11 $87.34 11 0 MINNESOTA 111.9 $97.68 6 $87.29 12 -6
Sources: 2007 Runzhemier Report of Living Cost StandardsAmerican Association of University Professors (AAUP) Faculty Compensation Survey 2007-08
Notes: Overall salaries represent a weighted average of rank salaries using OSU's rank distribution as weights.All 12-month salaries have been converted to a 9-month basis.Living cost can vary from community to community within a large metropolitan area. When information was available regarding
the specific location of a campus, that index was used. When information regarding the particular location was unavailable orambiguous, the cost-of-living for the metropolitan area as a whole was used.
* Wisconsin data based on revised survey submission.
Office of Human ResourcesInformation and Technology Services
Living Cost Comparisons version 4.XLS6/18/200820 of 26
Page 28
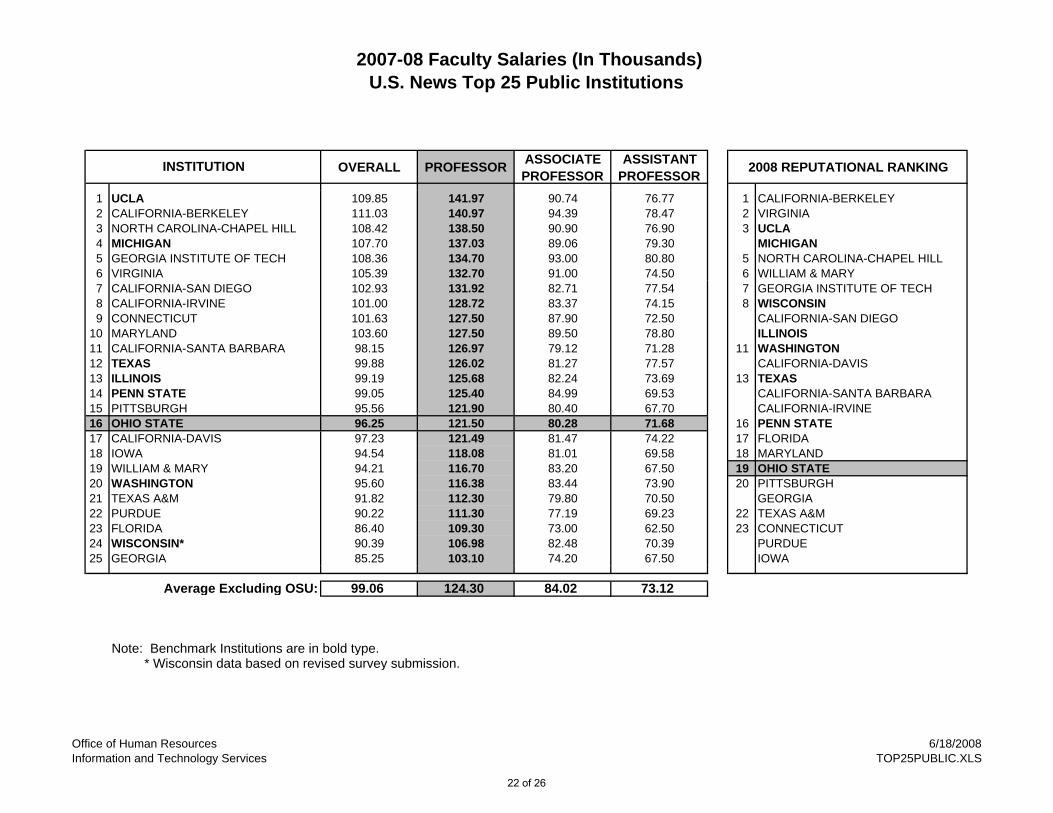
2007-08 Faculty Salaries (In Thousands)U.S. News Top 25 Public Institutions
OVERALL PROFESSOR ASSOCIATE PROFESSOR
ASSISTANT PROFESSOR 2008 REPUTATIONAL RANKING
1 CALIFORNIA-BERKELEY 111.03 140.97 94.39 78.47 1 CALIFORNIA-BERKELEY2 UCLA 109.85 141.97 90.74 76.77 2 VIRGINIA3 NORTH CAROLINA-CHAPEL HILL 108.42 138.50 90.90 76.90 3 UCLA4 GEORGIA INSTITUTE OF TECH 108.36 134.70 93.00 80.80 MICHIGAN5 MICHIGAN 107.70 137.03 89.06 79.30 5 NORTH CAROLINA-CHAPEL HILL6 VIRGINIA 105.39 132.70 91.00 74.50 6 WILLIAM & MARY7 MARYLAND 103.60 127.50 89.50 78.80 7 GEORGIA INSTITUTE OF TECH8 CALIFORNIA-SAN DIEGO 102.93 131.92 82.71 77.54 8 WISCONSIN9 CONNECTICUT 101.63 127.50 87.90 72.50 CALIFORNIA-SAN DIEGO
10 CALIFORNIA-IRVINE 101.00 128.72 83.37 74.15 ILLINOIS11 TEXAS 99.88 126.02 81.27 77.57 11 WASHINGTON12 ILLINOIS 99.19 125.68 82.24 73.69 CALIFORNIA-DAVIS13 PENN STATE 99.05 125.40 84.99 69.53 13 TEXAS14 CALIFORNIA-SANTA BARBARA 98.15 126.97 79.12 71.28 CALIFORNIA-SANTA BARBARA15 CALIFORNIA-DAVIS 97.23 121.49 81.47 74.22 CALIFORNIA-IRVINE16 OHIO STATE 96.25 121.50 80.28 71.68 16 PENN STATE17 WASHINGTON 95.60 116.38 83.44 73.90 17 FLORIDA18 PITTSBURGH 95.56 121.90 80.40 67.70 18 MARYLAND19 IOWA 94.54 118.08 81.01 69.58 19 OHIO STATE20 WILLIAM & MARY 94.21 116.70 83.20 67.50 20 PITTSBURGH21 TEXAS A&M 91.82 112.30 79.80 70.50 GEORGIA22 WISCONSIN* 90.39 106.98 82.48 70.39 22 TEXAS A&M23 PURDUE 90.22 111.30 77.19 69.23 23 CONNECTICUT24 FLORIDA 86.40 109.30 73.00 62.50 PURDUE25 GEORGIA 85.25 103.10 74.20 67.50 IOWA
Average Excluding OSU: 99.06 124.30 84.02 73.12
Note: Benchmark Institutions are in bold type. * Wisconsin data based on revised survey submission.
INSTITUTION
Office of Human ResourcesInformation and Technology Services
6/18/2008TOP25PUBLIC.XLS
21 of 26
Page 29
2007-08 Faculty Salaries (In Thousands)U.S. News Top 25 Public Institutions
OVERALL PROFESSOR ASSOCIATE PROFESSOR
ASSISTANT PROFESSOR 2008 REPUTATIONAL RANKING
1 UCLA 109.85 141.97 90.74 76.77 1 CALIFORNIA-BERKELEY2 CALIFORNIA-BERKELEY 111.03 140.97 94.39 78.47 2 VIRGINIA3 NORTH CAROLINA-CHAPEL HILL 108.42 138.50 90.90 76.90 3 UCLA4 MICHIGAN 107.70 137.03 89.06 79.30 MICHIGAN5 GEORGIA INSTITUTE OF TECH 108.36 134.70 93.00 80.80 5 NORTH CAROLINA-CHAPEL HILL6 VIRGINIA 105.39 132.70 91.00 74.50 6 WILLIAM & MARY7 CALIFORNIA-SAN DIEGO 102.93 131.92 82.71 77.54 7 GEORGIA INSTITUTE OF TECH8 CALIFORNIA-IRVINE 101.00 128.72 83.37 74.15 8 WISCONSIN9 CONNECTICUT 101.63 127.50 87.90 72.50 CALIFORNIA-SAN DIEGO
10 MARYLAND 103.60 127.50 89.50 78.80 ILLINOIS11 CALIFORNIA-SANTA BARBARA 98.15 126.97 79.12 71.28 11 WASHINGTON12 TEXAS 99.88 126.02 81.27 77.57 CALIFORNIA-DAVIS13 ILLINOIS 99.19 125.68 82.24 73.69 13 TEXAS14 PENN STATE 99.05 125.40 84.99 69.53 CALIFORNIA-SANTA BARBARA15 PITTSBURGH 95.56 121.90 80.40 67.70 CALIFORNIA-IRVINE16 OHIO STATE 96.25 121.50 80.28 71.68 16 PENN STATE17 CALIFORNIA-DAVIS 97.23 121.49 81.47 74.22 17 FLORIDA18 IOWA 94.54 118.08 81.01 69.58 18 MARYLAND19 WILLIAM & MARY 94.21 116.70 83.20 67.50 19 OHIO STATE20 WASHINGTON 95.60 116.38 83.44 73.90 20 PITTSBURGH21 TEXAS A&M 91.82 112.30 79.80 70.50 GEORGIA22 PURDUE 90.22 111.30 77.19 69.23 22 TEXAS A&M23 FLORIDA 86.40 109.30 73.00 62.50 23 CONNECTICUT24 WISCONSIN* 90.39 106.98 82.48 70.39 PURDUE25 GEORGIA 85.25 103.10 74.20 67.50 IOWA
Average Excluding OSU: 99.06 124.30 84.02 73.12
Note: Benchmark Institutions are in bold type. * Wisconsin data based on revised survey submission.
INSTITUTION
Office of Human ResourcesInformation and Technology Services
6/18/2008TOP25PUBLIC.XLS
22 of 26
Page 30
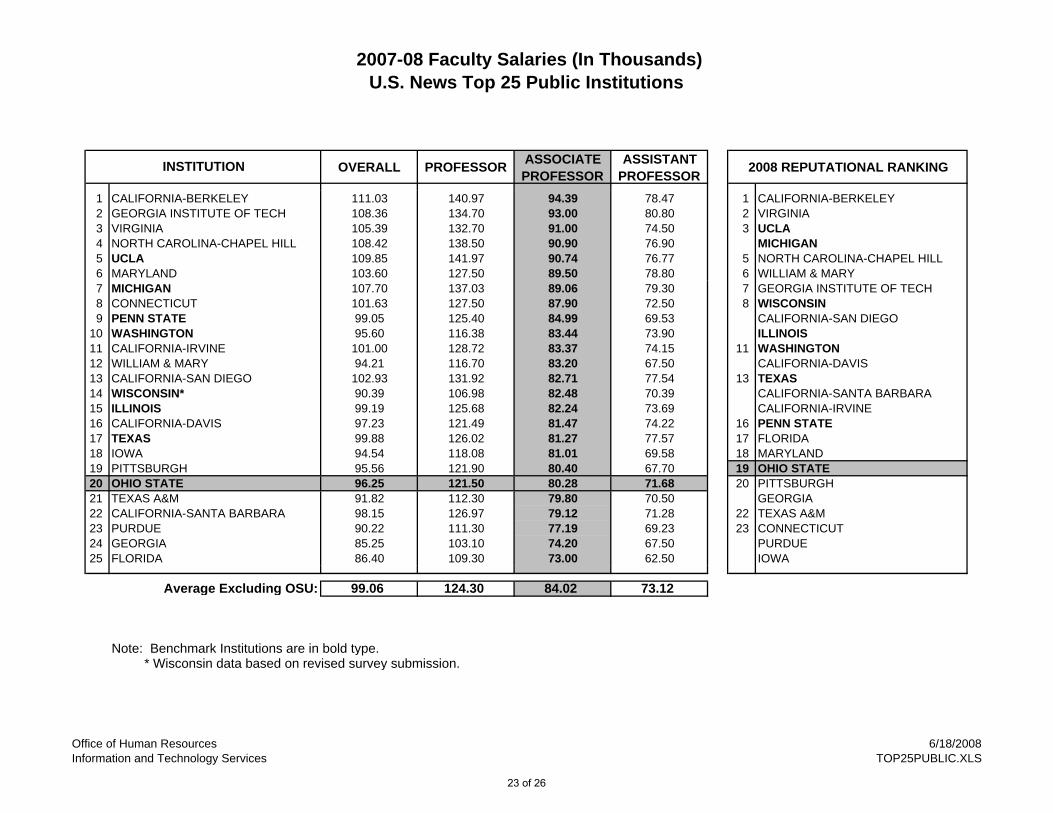
2007-08 Faculty Salaries (In Thousands)U.S. News Top 25 Public Institutions
OVERALL PROFESSOR ASSOCIATE PROFESSOR
ASSISTANT PROFESSOR 2008 REPUTATIONAL RANKING
1 CALIFORNIA-BERKELEY 111.03 140.97 94.39 78.47 1 CALIFORNIA-BERKELEY2 GEORGIA INSTITUTE OF TECH 108.36 134.70 93.00 80.80 2 VIRGINIA3 VIRGINIA 105.39 132.70 91.00 74.50 3 UCLA4 NORTH CAROLINA-CHAPEL HILL 108.42 138.50 90.90 76.90 MICHIGAN5 UCLA 109.85 141.97 90.74 76.77 5 NORTH CAROLINA-CHAPEL HILL6 MARYLAND 103.60 127.50 89.50 78.80 6 WILLIAM & MARY7 MICHIGAN 107.70 137.03 89.06 79.30 7 GEORGIA INSTITUTE OF TECH8 CONNECTICUT 101.63 127.50 87.90 72.50 8 WISCONSIN9 PENN STATE 99.05 125.40 84.99 69.53 CALIFORNIA-SAN DIEGO
10 WASHINGTON 95.60 116.38 83.44 73.90 ILLINOIS11 CALIFORNIA-IRVINE 101.00 128.72 83.37 74.15 11 WASHINGTON12 WILLIAM & MARY 94.21 116.70 83.20 67.50 CALIFORNIA-DAVIS13 CALIFORNIA-SAN DIEGO 102.93 131.92 82.71 77.54 13 TEXAS14 WISCONSIN* 90.39 106.98 82.48 70.39 CALIFORNIA-SANTA BARBARA15 ILLINOIS 99.19 125.68 82.24 73.69 CALIFORNIA-IRVINE16 CALIFORNIA-DAVIS 97.23 121.49 81.47 74.22 16 PENN STATE17 TEXAS 99.88 126.02 81.27 77.57 17 FLORIDA18 IOWA 94.54 118.08 81.01 69.58 18 MARYLAND19 PITTSBURGH 95.56 121.90 80.40 67.70 19 OHIO STATE20 OHIO STATE 96.25 121.50 80.28 71.68 20 PITTSBURGH21 TEXAS A&M 91.82 112.30 79.80 70.50 GEORGIA22 CALIFORNIA-SANTA BARBARA 98.15 126.97 79.12 71.28 22 TEXAS A&M23 PURDUE 90.22 111.30 77.19 69.23 23 CONNECTICUT24 GEORGIA 85.25 103.10 74.20 67.50 PURDUE25 FLORIDA 86.40 109.30 73.00 62.50 IOWA
Average Excluding OSU: 99.06 124.30 84.02 73.12
Note: Benchmark Institutions are in bold type. * Wisconsin data based on revised survey submission.
INSTITUTION
Office of Human ResourcesInformation and Technology Services
6/18/2008TOP25PUBLIC.XLS
23 of 26
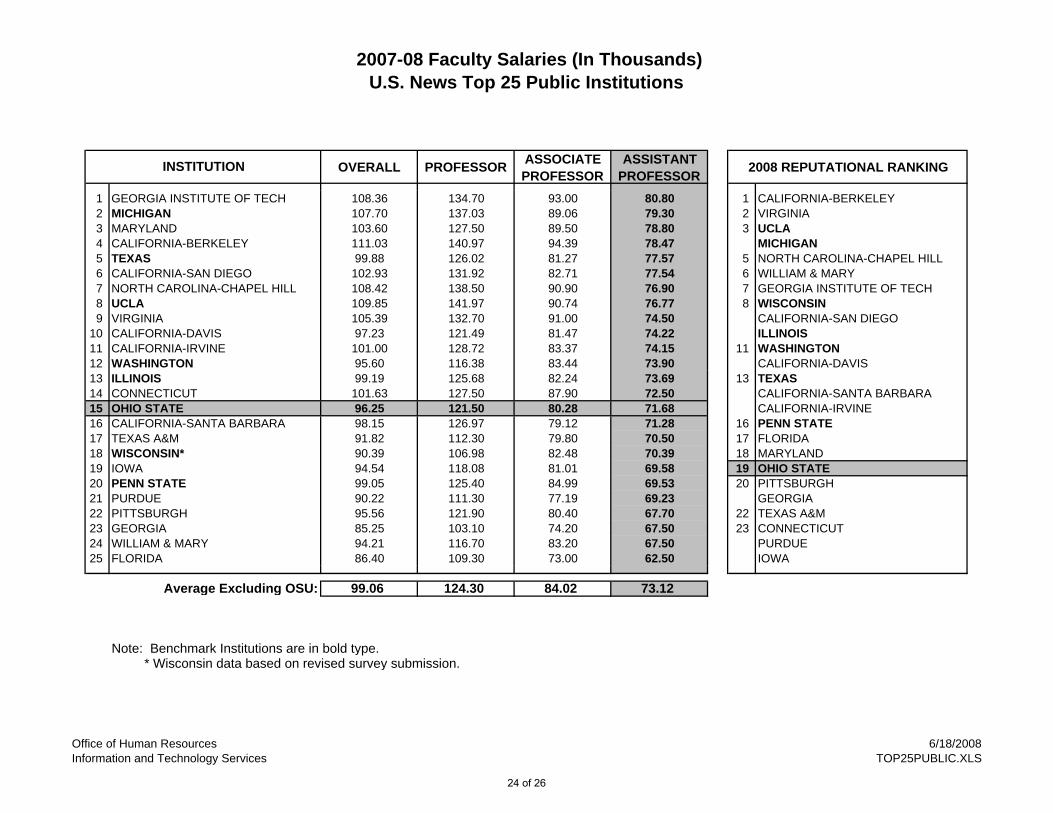
Page 31
2007-08 Faculty Salaries (In Thousands)U.S. News Top 25 Public Institutions
OVERALL PROFESSOR ASSOCIATE PROFESSOR
ASSISTANT PROFESSOR 2008 REPUTATIONAL RANKING
1 GEORGIA INSTITUTE OF TECH 108.36 134.70 93.00 80.80 1 CALIFORNIA-BERKELEY2 MICHIGAN 107.70 137.03 89.06 79.30 2 VIRGINIA3 MARYLAND 103.60 127.50 89.50 78.80 3 UCLA4 CALIFORNIA-BERKELEY 111.03 140.97 94.39 78.47 MICHIGAN5 TEXAS 99.88 126.02 81.27 77.57 5 NORTH CAROLINA-CHAPEL HILL6 CALIFORNIA-SAN DIEGO 102.93 131.92 82.71 77.54 6 WILLIAM & MARY7 NORTH CAROLINA-CHAPEL HILL 108.42 138.50 90.90 76.90 7 GEORGIA INSTITUTE OF TECH8 UCLA 109.85 141.97 90.74 76.77 8 WISCONSIN9 VIRGINIA 105.39 132.70 91.00 74.50 CALIFORNIA-SAN DIEGO
10 CALIFORNIA-DAVIS 97.23 121.49 81.47 74.22 ILLINOIS11 CALIFORNIA-IRVINE 101.00 128.72 83.37 74.15 11 WASHINGTON12 WASHINGTON 95.60 116.38 83.44 73.90 CALIFORNIA-DAVIS13 ILLINOIS 99.19 125.68 82.24 73.69 13 TEXAS14 CONNECTICUT 101.63 127.50 87.90 72.50 CALIFORNIA-SANTA BARBARA15 OHIO STATE 96.25 121.50 80.28 71.68 CALIFORNIA-IRVINE16 CALIFORNIA-SANTA BARBARA 98.15 126.97 79.12 71.28 16 PENN STATE17 TEXAS A&M 91.82 112.30 79.80 70.50 17 FLORIDA18 WISCONSIN* 90.39 106.98 82.48 70.39 18 MARYLAND19 IOWA 94.54 118.08 81.01 69.58 19 OHIO STATE20 PENN STATE 99.05 125.40 84.99 69.53 20 PITTSBURGH21 PURDUE 90.22 111.30 77.19 69.23 GEORGIA22 PITTSBURGH 95.56 121.90 80.40 67.70 22 TEXAS A&M23 GEORGIA 85.25 103.10 74.20 67.50 23 CONNECTICUT24 WILLIAM & MARY 94.21 116.70 83.20 67.50 PURDUE25 FLORIDA 86.40 109.30 73.00 62.50 IOWA
Average Excluding OSU: 99.06 124.30 84.02 73.12
Note: Benchmark Institutions are in bold type. * Wisconsin data based on revised survey submission.
INSTITUTION
Office of Human ResourcesInformation and Technology Services
6/18/2008TOP25PUBLIC.XLS
24 of 26
Page 32
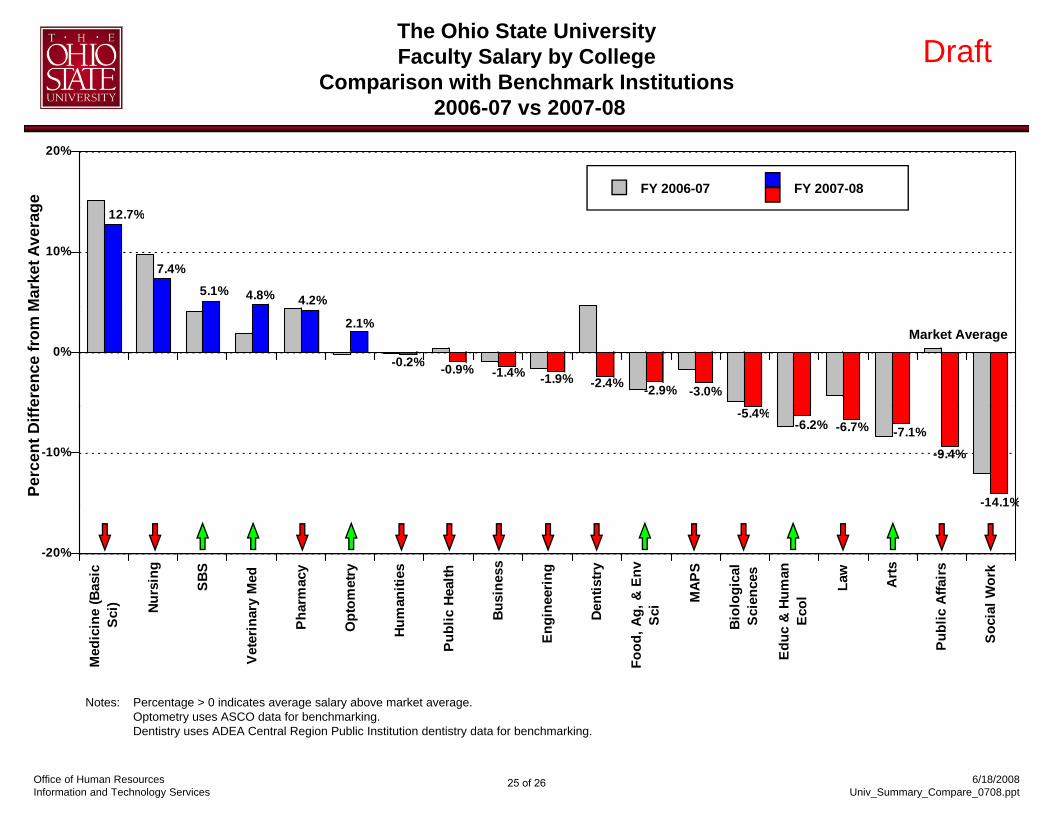
The Ohio State UniversityFaculty Salary by College
Comparison with Benchmark Institutions2006-07 vs 2007-08
Draft
20%
2006-07 vs 2007-08
ge
FY 2006-07 FY 2007-08
12.7%
7.4%
5.1% 4.8% 4.2%
10%
Mar
ket A
vera
g
2.1%
-0.2% -0.9% -1.4% -1.9% -2.4% -2.9% -3.0%
0%Market Average
fere
nce
from
M
-5.4%-6.2% -6.7% -7.1%
-9.4%
-14.1%
-10%
Perc
ent D
iff
14.1%
-20%
(Bas
ic) Nu
rsin
g
SBS
ry M
ed
arm
acy
omet
ry
aniti
es
Hea
lth
usin
ess
eerin
g
entis
try
& E
nv
MAP
S
logi
cal
ence
s
Hum
anol
Law
Arts
Affa
irs
l Wor
k
Med
icin
e Sc
i ) N
Vete
rinar
Pha
Opt
o
Hum
a
Publ
ic
Bu
Engi
n De
Food
, Ag, Sc
i
Bio l Sci
Educ
& H
Eco
Publ
ic
Soci
al
Notes: Percentage > 0 indicates average salary above market average
Office of Human ResourcesInformation and Technology Services
6/18/2008Univ_Summary_Compare_0708.ppt
Notes: Percentage > 0 indicates average salary above market average.Optometry uses ASCO data for benchmarking.Dentistry uses ADEA Central Region Public Institution dentistry data for benchmarking.
25 of 26
Page 33
The Ohio State UniversityFaculty Salary by College
Comparison with Benchmark Institutions2007-08
Draft
20%
2007-08
ge 12.7%
7.4%
5.1% 4.8% 4.2%
10%
Mar
ket A
vera
g
2.1%
-0.2% -0.9% -1.4% -1.9% -2.4% -2.9% -3.0%
0%Market Average
fere
nce
from
M
-5.4%-6.2% -6.7% -7.1%
-9.4%
-14.1%
-10%
Perc
ent D
iff
14.1%
-20%
(Bas
ic) Nu
rsin
g
SBS
ry M
ed
arm
acy
omet
ry
aniti
es
Hea
lth
usin
ess
eerin
g
entis
try
& E
nv
MAP
S
logi
cal
ence
s
Hum
anol
Law
Arts
Affa
irs
l Wor
k
Med
icin
e Sc
i ) N
Vete
rinar
Pha
Opt
o
Hum
a
Publ
ic
Bu
Engi
n De
Food
, Ag, Sc
i
Bio l Sci
Educ
& H
Eco
Publ
ic
Soci
al
Notes: Percentage > 0 indicates average salary above market average
Office of Human ResourcesInformation and Technology Services
6/18/2008Univ_Summary_Compare_0708.ppt
Notes: Percentage > 0 indicates average salary above market average.Optometry uses ASCO data for benchmarking.Dentistry uses ADEA Central Region Public Institution dentistry data for benchmarking.
26 of 26