17
App Annie Forecast – 2017–2022 –
| Date post: | 08-Oct-2018 |
| Category: |
Documents |
| Upload: | doankhuong |
| View: | 219 times |
| Download: | 0 times |

App Annie Forecast– 2017–2022 –

By 2022
+45%GROWTH FROM 2017
ANNUAL MOBILE APP DOWNLOADS
258BILLION
+92%GROWTH FROM 2017
ANNUAL CONSUMERSPEND IN APP STORES
$157BILLION
+23%GROWTH FROM 2017
AVERAGE ANNUAL CONSUMER SPEND
$26PER DEVICE
+56%GROWTH FROM 2017
MOBILE DEVICE INSTALL BASE
6BILLION
COPYRIGHT 2018
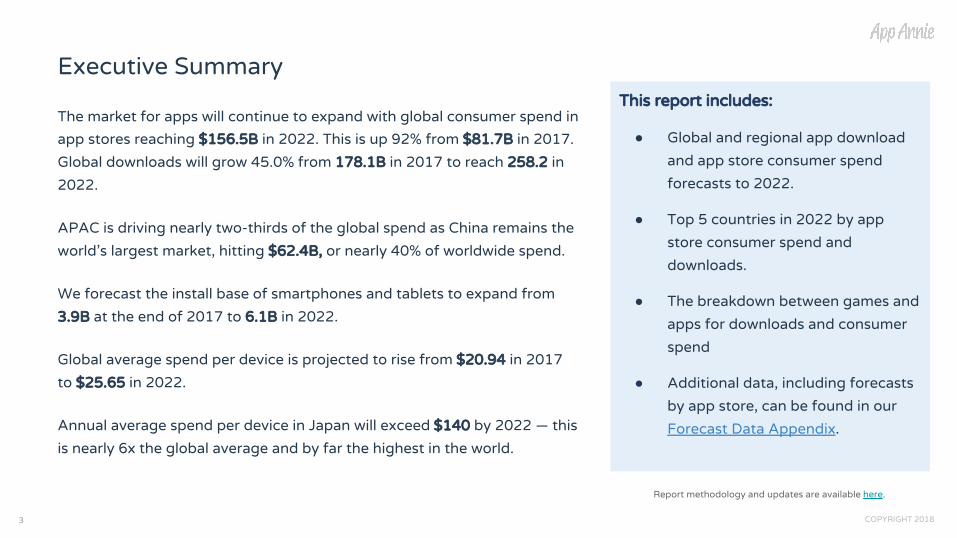
The market for apps will continue to expand with global consumer spend in app stores reaching $156.5B in 2022. This is up 92% from $81.7B in 2017. Global downloads will grow 45.0% from 178.1B in 2017 to reach 258.2 in 2022.
APAC is driving nearly two-thirds of the global spend as China remains the world’s largest market, hitting $62.4B, or nearly 40% of worldwide spend.
We forecast the install base of smartphones and tablets to expand from 3.9B at the end of 2017 to 6.1B in 2022.
Global average spend per device is projected to rise from $20.94 in 2017 to $25.65 in 2022.
Annual average spend per device in Japan will exceed $140 by 2022 — this is nearly 6x the global average and by far the highest in the world.
This report includes:
● Global and regional app download and app store consumer spend forecasts to 2022.
● Top 5 countries in 2022 by app store consumer spend and downloads.
● The breakdown between games and apps for downloads and consumer spend
● Additional data, including forecasts by app store, can be found in our Forecast Data Appendix.
3 COPYRIGHT 2018
Executive Summary
3
Report methodology and updates are available here.
App Annie Is the Most Trusted Partner in the App Economy
COPYRIGHT 20184
Our data is the most cited by app industry leaders and media
Our enterprise customers span industries and the globe
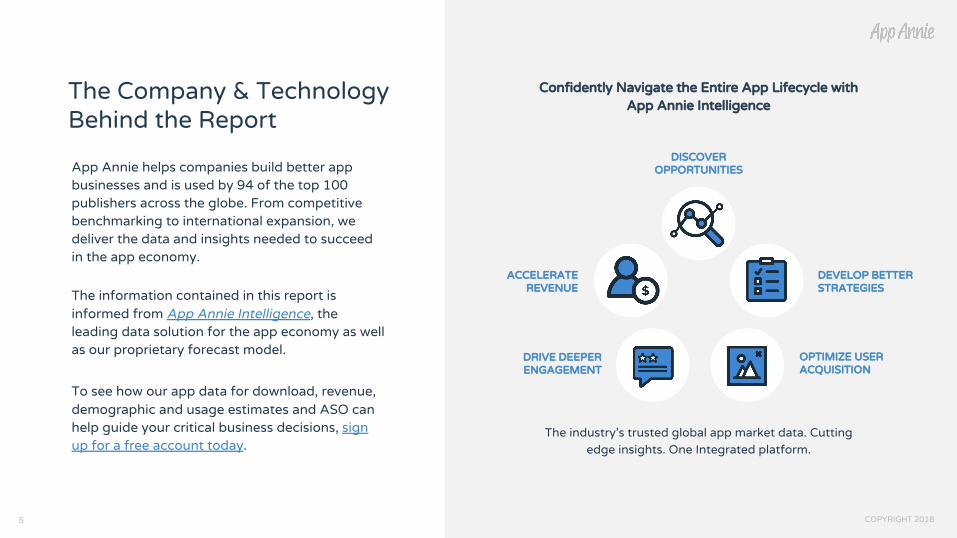
The Company & Technology Behind the Report
App Annie helps companies build better app businesses and is used by 94 of the top 100 publishers across the globe. From competitive benchmarking to international expansion, we deliver the data and insights needed to succeed in the app economy.
The information contained in this report is informed from App Annie Intelligence, the leading data solution for the app economy as well as our proprietary forecast model.
To see how our app data for download, revenue, demographic and usage estimates and ASO can help guide your critical business decisions, sign up for a free account today.
DISCOVER OPPORTUNITIES
DEVELOP BETTERSTRATEGIES
OPTIMIZE USERACQUISITION
DRIVE DEEPERENGAGEMENT
ACCELERATEREVENUE
Confidently Navigate the Entire App Lifecycle with App Annie Intelligence
The industry’s trusted global app market data. Cutting edge insights. One Integrated platform.
COPYRIGHT 20185

The Forecast
COPYRIGHT 2018

As the global app economy grows, individual markets will find themselves within different phases of market maturity:
● Phase 1: ExperimentationFirst time smartphone ownership prompts an initial surge of downloads. New users enter the market and start to experiment, discovering and trialing apps.
● Phase 2: ExpansionOver time, usage patterns are established. Users understand the types of apps that are most useful to them and search for new apps less often. Downloads remain high, but growth rates slow. In parallel, engagement and spend climb as people increasingly use their preferred apps.
● Phase 3: MaturationFinally, users begin to spend via apps, and app developers simultaneously get better at monetization. This leads to rapid growth in app store spend, as well as in-app ad spend and m-commerce (the latter two are excluded from this report).
Markets Will Continue on the Path to App Maturity
7 COPYRIGHT 2018
An App Market’s Path to Maturity
7

COPYRIGHT 20188
● Download growth will be driven by a dramatic increase in smartphone install base from 3.9B in 2017 to 6.1B in 2022. First time smartphone buyers in emerging markets will lead this device growth.
● Consumer spend growth comes as a result of a rapidly growing installed base and from increasing spend per device in more mature markets.
Global App Downloads to Reach 258.2B by 2022Consumer Spend in the App Stores to Hit $156.5B
Note: iOS App Store, Google Play and third-party Android stores combined. Downloads are first time downloads only; re-installs and updates are excluded. Spend is gross, app store fees are included
Worldwide App Downloads Worldwide Consumer Spend
Dow
nloa
ds (B
illio
ns)
USD
(Bill
ions
)
For a full breakdown of our Forecast data, click here for our Forecast Data Appendix
COPYRIGHT 2018
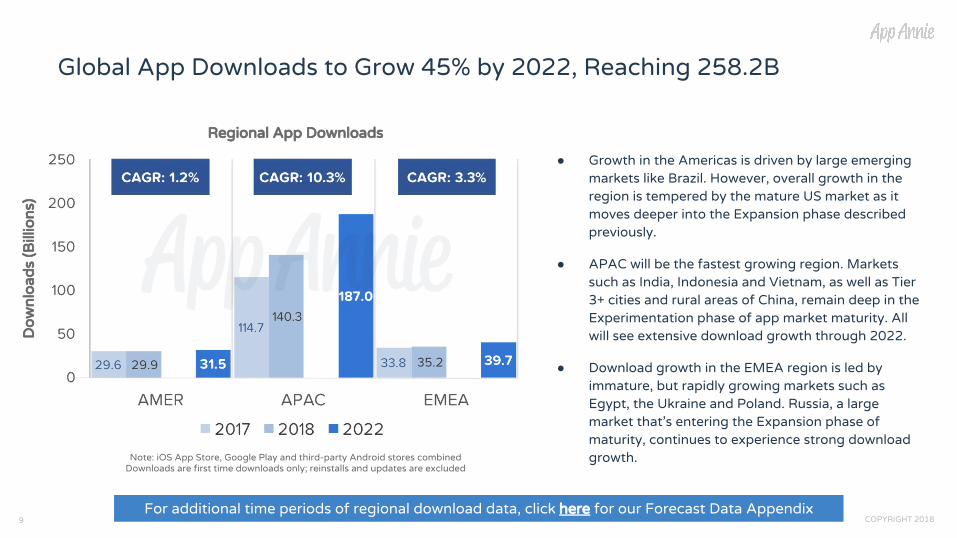
● Growth in the Americas is driven by large emerging markets like Brazil. However, overall growth in the region is tempered by the mature US market as it moves deeper into the Expansion phase described previously.
● APAC will be the fastest growing region. Markets such as India, Indonesia and Vietnam, as well as Tier 3+ cities and rural areas of China, remain deep in the Experimentation phase of app market maturity. All will see extensive download growth through 2022.
● Download growth in the EMEA region is led by immature, but rapidly growing markets such as Egypt, the Ukraine and Poland. Russia, a large market that’s entering the Expansion phase of maturity, continues to experience strong download growth.
9
Global App Downloads to Grow 45% by 2022, Reaching 258.2B
Note: iOS App Store, Google Play and third-party Android stores combinedDownloads are first time downloads only; reinstalls and updates are excluded
Regional App Downloads
Dow
nloa
ds (B
illio
ns)
For additional time periods of regional download data, click here for our Forecast Data Appendix
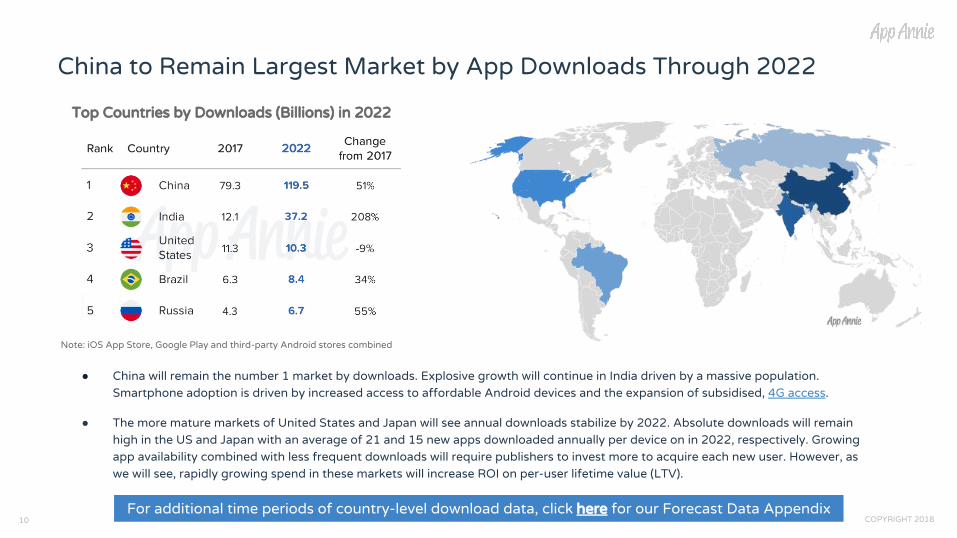
● China will remain the number 1 market by downloads. Explosive growth will continue in India driven by a massive population. Smartphone adoption is driven by increased access to affordable Android devices and the expansion of subsidised, 4G access.
● The more mature markets of United States and Japan will see annual downloads stabilize by 2022. Absolute downloads will remain high in the US and Japan with an average of 21 and 15 new apps downloaded annually per device on in 2022, respectively. Growing app availability combined with less frequent downloads will require publishers to invest more to acquire each new user. However, as we will see, rapidly growing spend in these markets will increase ROI on per-user lifetime value (LTV).
COPYRIGHT 201810
China to Remain Largest Market by App Downloads Through 2022
Note: iOS App Store, Google Play and third-party Android stores combined
Top Countries by Downloads (Billions) in 2022
For additional time periods of country-level download data, click here for our Forecast Data Appendix

COPYRIGHT 201811
Growing spend per device in mature markets is the predominate driver for global increases in app store spend. As users increasingly rely on, and get value from, apps, their willingness to spend increases.
● Spend per device growth in the Americas is led by the US, which will see app store consumer spend nearly double by 2022. US annual spend per device will exceed $60 in 2022, up nearly 50% vs. 2017.
● Rapid growth in APAC is driven by highly mature markets, namely South Korea, Japan and Tier 1 & 2 Chinese cities entering the Maturation phase characterised by rapid spend increases.
● EMEA has a number of very mature markets, including the UK, France and Germany. All are expected to see strong spend growth over the next 5 years.
Global Consumer Spend in Apps to Grow by 92% by 2022, Reaching $156.5B
Note: iOS App Store, Google Play and third-party Android stores combined. Spend is gross, app stores’ fees are included. Consumer spend is from app stores only. It does not include
spend from m-commerce or in-app advertising
Regional Consumer Spend
USD
(Bill
ions
)
For additional time periods of regional spend data, click here for our Forecast Data Appendix

COPYRIGHT 201812
● More mature markets such as the United States, Japan and South Korea will see rapid growth in consumer spend as they move into the Maturation phase of app maturity. Cash-focused German consumers will become increasingly comfortable making digital purchases, and Germany will climb from ranking 7 in 2017 to become the 5th largest market by consumer spend in 2022.
● In vast emerging markets like India, willingness to spend on digital products is expected to grow. However, mature markets with a high disposable income, such as United States, Japan and tier 1–2 cities in China, will remain the top contributors to app store spend.
Consumer Spend in China, the World’s Largest App Market, Will Double by 2022
Note: iOS App Store, Google Play and third-party Android stores combined
Top Countries by Spend (Billions USD) in 2022
For additional time periods of country-level spend data, click here for our Forecast Data Appendix

COPYRIGHT 201813
● Mobile will increasingly capture share of wallet, and by 2022, average spend per device for apps will reach $25.65. Alongside this, the global smartphone and tablet install base will increase by 56.4% from 3.9B in 2017 to 6.1B in 2022. In combination, this will fuel overall growth in consumer spend in apps.
● Annual per device spend in Japan will exceed $140 by 2022. This will be nearly 6x the global average, by far the highest in the world.
● Smartphone penetration will increase in emerging markets over the coming years thanks to more affordable handsets and initiatives such as Android Go and Facebook Connectivity.
● New users are expected to have a lower average app store spend, while presenting valuable opportunities to publishers, through in-app advertising, m-commerce, as well as loyalty and brand building.
Average App Spend per Device Will Increase by 23% by 2022
Note: iOS App Store, Google Play and third-party Android stores combined
Spen
d P
er D
evic
e (U
SD)
Worldwide Average Annual App Spend Per Device
For a full breakdown of our Forecast data, click here for our Forecast Data Appendix
COPYRIGHT 201814
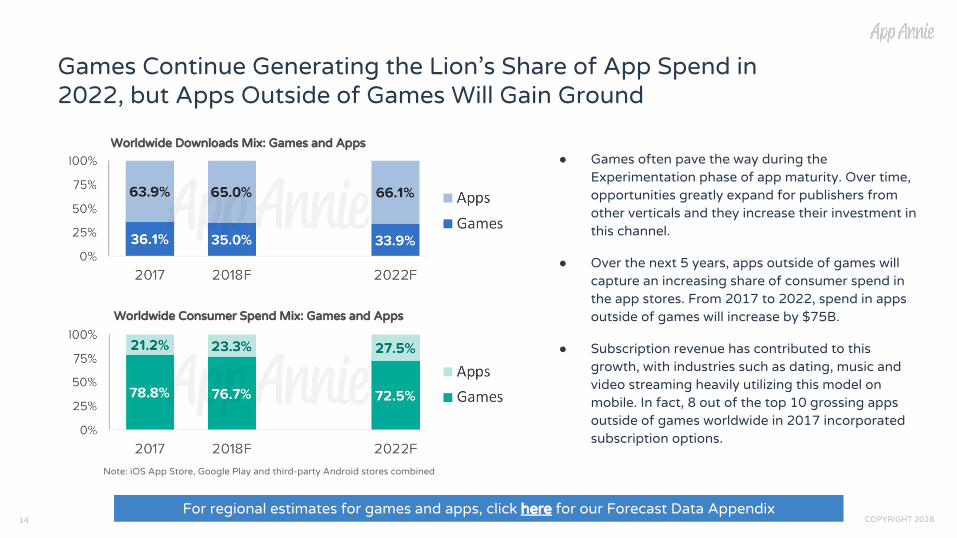
● Games often pave the way during the Experimentation phase of app maturity. Over time, opportunities greatly expand for publishers from other verticals and they increase their investment in this channel.
● Over the next 5 years, apps outside of games will capture an increasing share of consumer spend in the app stores. From 2017 to 2022, spend in apps outside of games will increase by $75B.
● Subscription revenue has contributed to this growth, with industries such as dating, music and video streaming heavily utilizing this model on mobile. In fact, 8 out of the top 10 grossing apps outside of games worldwide in 2017 incorporated subscription options.
Games Continue Generating the Lion’s Share of App Spend in 2022, but Apps Outside of Games Will Gain Ground
Note: iOS App Store, Google Play and third-party Android stores combined
Worldwide Downloads Mix: Games and Apps
Worldwide Consumer Spend Mix: Games and Apps
For regional estimates for games and apps, click here for our Forecast Data Appendix

By 2022, app markets across the world will still be at varying stages of maturity. To maximize success, publishers need to account for these differences and optimize their strategy for each market accordingly.
● In maturing and increasingly competitive markets, publishers need to encourage new app downloads through product innovation and investment in organic and paid installs. This will likely require new approaches to UA. Growing spend per user should boost ROI and LTV of customers.
● In emerging markets, high downloads and limited direct spend will make alternate strategies that rely on large user bases more effective. In-app advertising is an obvious model, but having a widely used app in these markets could also be a boon for brand awareness and loyalty.
● By 2022, APAC will account for 64.8% of app store spend, and 72.4% of global downloads. Over half of this will come from China alone. Domestic publishers are strong in APAC and given the huge opportunity, effective localization and careful local partnerships can help international publishers break through.
App Store Consumer Spend in 2022
Note: Spend is gross; app stores’ fees are included
Building an App Strategy for 2022
15 COPYRIGHT 2018For a full breakdown of our Forecast data, click here for our Forecast Data Appendix

● 2017 Retrospective: A Monumental Year for the App Economy
● Top Predictions for the App Economy in 2018
● Why Your Mobile Strategy Needs an App
● Mobile Gaming Extends Its Lead: Gaming Spotlight 2017 Review
● New App Usage Report: How Many Apps Do Users Install a Month?
APP ANNIE
Grow your business with the leader in app market data and analytics
● App Annie IntelligenceApp Annie Intelligence provides accurate app market data and insights for millions of apps across the globe.Sign up for free now
●● App Annie Connect
App Annie Connect gives you a full view of your app performance. Consolidate all your app store, usage and advertising data in one unified dashboard.Sign up for free now
COPYRIGHT 201816
Download Further Analysis on the App Economy
About App AnnieApp Annie delivers the most trusted app market data and insights for your business
to succeed in the global app economy. Over 1 million registered users rely on App
Annie to better understand the app market, their businesses and the opportunities
around them. The company is headquartered in San Francisco with 450 employees
across 15 global offices. App Annie has received $157 million in financing, including
from investors such as Sequoia Capital, Institutional Venture Partners, IDG Capital
Partners, e.ventures, Greenspring Associates, and Greycroft Partners.
For more information, please visit appannie.com, check out our Blog and follow us
on Twitter (@AppAnnie). To find out more about our offerings, visit our overview of
the App Annie Platform. For the most current monthly rankings of apps and
publishers, check out the App Annie Index. Report methodology and updates are
available here.
COPYRIGHT 201817


