FRANCE FRANCE 1 Application and verification of ECMWF products 2013 METEO-FRANCE J. Stein, N. Girardot, S. Guidotti, O. Mestre, D. Paradis, F. Pouponneau and I. Sanchez 1. Summary of major highlights • Strong increase of the number of satellite data assimilated and change of the data bases used for the orography and physiographic data in the 3 limited area models ALADIN over tropical areas coupled to IFS • Use of the ECMWF products for air quality analysis and forecasts 2. Use and application of products 2.1 Post-processing of model output 2.1.1 Statistical adaptation Millions of local forecasts of weather parameters are produced daily through statistical adaptation of NWP output. Main methods are multiple linear regression (MLR) and linear discriminant analysis (DA). MOS (model output statistics) is generally preferred to PP (perfect prognosis). Kalman filter (KF) is applied when relevant. The production is described in Table 1. Note the new production of grid point total cloud cover forecast based on a statistical adaptation using satellite data as predictand. Deterministic model T1279 Parameter Method Domain Nbr of Sites Steps Tri-hourly 2m Temperature MLR (MOS) +KF France 2781 +3h to +180h by 3h Daily extremes 2m temperature MLR (MOS) +KF France 2781 D to D+6 10m Wind Speed MLR (MOS) France 861 +6h to +180h by 3h 10m Wind Direction MLR (MOS) France 822 +6h to +180h by 3h Total Cloud Cover MLR (MOS)/LDA France 164/152 +12h to +180h by 3h Total Cloud Cover LDA France GRID 0.5x0.5 0h to +156h by 3h Tri-hourly 2m relative Humidty MLR (MOS) +KF France 1269 +6h to +180h by 3h Daily extremes 2m rel. Humidity MLR (MOS) +KF France 1269 D to D+6 Tri-hourly 2m Temperature MLR (MOS) +KF World 7128 +1h to +180h by 1h Daily extremes 2m temperature MLR (MOS) +KF World 7128 D to D+6 Mixed ARPEGE+IFS MLR (MOS) +KF France 2781 +3h to +102h by 3h Mixed ARPEGE+IFS MLR (MOS) +KF World 4367 +1h to +102h by 1h Table 1 : Statistical adaptations for the deterministic high resolution model
Transcript
FRANCE FRANCE
1
Application and verification of ECMWF products 2013
METEO-FRANCE J. Stein, N. Girardot, S. Guidotti, O. Mestre, D. Paradis, F. Pouponneau and I. Sanchez
1. Summary of major highlights • Strong increase of the number of satellite data assimilated and change of the data bases used for
the orography and physiographic data in the 3 limited area models ALADIN over tropical areas coupled to IFS
• Use of the ECMWF products for air quality analysis and forecasts
2. Use and application of products 2.1 Post-processing of model output 2.1.1 Statistical adaptation
Millions of local forecasts of weather parameters are produced daily through statistical adaptation of NWP output. Main methods are multiple linear regression (MLR) and linear discriminant analysis (DA). MOS (model output statistics) is generally preferred to PP (perfect prognosis). Kalman filter (KF) is applied when relevant. The production is described in Table 1.
Note the new production of grid point total cloud cover forecast based on a statistical adaptation using satellite data as predictand.
Deterministic model T1279
Parameter Method Domain Nbr of Sites
Steps
Tri-hourly 2m Temperature MLR (MOS) +KF
France 2781 +3h to +180h by 3h
Daily extremes 2m temperature MLR (MOS) +KF
France 2781 D to D+6
10m Wind Speed MLR (MOS) France 861 +6h to +180h by 3h 10m Wind Direction MLR (MOS) France 822 +6h to +180h by 3h Total Cloud Cover MLR
(MOS)/LDA France 164/152 +12h to +180h by 3h
Total Cloud Cover LDA France GRID
0.5x0.5 0h to +156h by 3h
Tri-hourly 2m relative Humidty
MLR (MOS) +KF
France 1269 +6h to +180h by 3h
Daily extremes 2m rel. Humidity
MLR (MOS) +KF France 1269 D to D+6
Tri-hourly 2m Temperature MLR (MOS) +KF
World 7128 +1h to +180h by 1h
Daily extremes 2m temperature MLR (MOS) +KF
World 7128 D to D+6
Mixed ARPEGE+IFS MLR (MOS) +KF
France 2781 +3h to +102h by 3h
Mixed ARPEGE+IFS MLR (MOS) +KF
World 4367 +1h to +102h by 1h
Table 1 : Statistical adaptations for the deterministic high resolution model
FRANCE FRANCE
2
EPS Statistical adaptation is applied to individual ensemble runs (Table 2). Methods are the same as for the deterministic model output but pseudo-PP (statistical equations computed during the first 24 hours then applied to the other corresponding steps) is preferred to MOS. VAREPS is used and Météo-France provides local forecast (temperatures) up to 14 days.
EPS Ensemble mean and individual members
Parameter Method Domain Nbr of Sites
Steps
Tri-hourly 2m Temperature MLR (pPP) +KF France 2761 +3h to +360h by 3h Daily extremes 2m temperature MLR (pPP) +KF France 2761 D to D+14 10m Wind Speed MLR France 792 +6h to +240h by 3h
+246 to +360 by 6h Tri-hourly 2m relative Humidty
MLR (pPP) +KF France 1146 0h to +240h by 3h
Daily extremes 2m rel. Humidity
MLR (pPP) +KF France 1146 D to D+10
Tri-hourly 2m Temperature MLR (pPP) +KF World 3338 +0h to +360h by 3h (by 1h for ensemble mean)
Daily extremes 2m temperature MLR (pPP) +KF World 3338 D to D+14
Table 2 : Statistical adaptations for the EPS
EPS Distribution Calibration is applied to the EPS distribution in order to optimize reliability. Operationally, a calibration based on rank diagrams is used for 10m wind speed and total precipitations. Monthly forecast
Statistical models are also applied to the monthly forecasts up to 32 days (Table 3). These locally corrected forecasts allow to couple electricity consumption models.
Parameter Method Domain Nbr of Sites
Steps
Tri-hourly 2m Temperature MLR (pPP) France 1056 +0h to +768h by 3h Daily extremes 2m temperature MLR (pPP) France 1056 D to D+31 Tri-hourly 2m Temperature MLR (pPP) World 7128 +0h to +768h by 3h Daily extremes 2m temperature MLR (pPP) World 7128 D to D+31
Table 3 : Statistical adaptations for the monthly forecasts
2.1.2 Physical adaptation
The first physical adaptation is performed by the limited area model (LAM) ALADIN which operates over western Europe (Figure 1). This model performs a dynamical adaptation of the IFS forecasts using a higher horizontal resolution of 7.5 km. The orography and the physiographic data of this ALADIN version are taken from a new database since 02/07/2013 like all the LAM operational at Météo-France. Objective scores have been computed for the surface parameters against the measurements of French surface stations and compared to the IFS forecasts.
FRANCE FRANCE
3
Figure 1: Geographical extension of the ALADIN models coupled to IFS
Figure 2: Miss ratio (left) and false alarm ratio (right) for three thresholds 0.2mm/6h (pink) 2mm/6h (green) and
10mm/6h (blue) 6 hours precipitation forecasts performed by the ALADIN-ECMWF (full lines) and IFS (dotted lines). The scores are computed against the French rain gauge network for the year 2013 and are displayed for each six hours forecast lead time.
Major differences between IFS and the LAM model occur during the first 12 hours ; the local adaptation of the IFS analysis and the difference between the physical packages bring ALADIN-ECMWF to reduce the number of forecasted rains and false alarms but also to increase misses. After 18 hours, the forecasts become closer. For the rain/no rain threshold 0.2mm of accumulated rain, better detections are provided by IFS but its false alarm ratio can be 10% worse than the ALADIN- ECMWF ratio during the first hours. Light rains are generally over forecasted by both models ; the maximum overcast occurs during the afternoon when convective events are more frequent : at 18 and 42 hours lead times, detections are almost perfect while false alarms are numerous. For the second threshold 2mm/6h, IFS detections decrease with slight false alarms changes compared to the rain/no rain threshold. Finally, heavy rains are underestimated and misses rise to more than 60% for both models. IFS false alarms for 10mm/6h rains are high but better than the LAM model.
Among the surface parameter verified but not shown, temperature at 2m AGL shows a different behaviour between IFS and the French LAM for daytime ranges and a common overestimation for summertime night temperatures. For all French operational models and IFS, the night cooling of the surface temperature was slower than for observation during the warm months of july and august 2013 and night temperatures were significantly overestimated.
The best RMSE of the wind at 10 m AGL is provided by IFS for all lead times and the improvement is around 3 %. For the relative humidity at 2m AGL in 2013, IFS was too wet with more than 10% of RMSE (not shown) but this signal changed during the first months of 2014.
FRANCE FRANCE
4
Three LAM ALADIN are operated by Météo-France to provide high-resolution forecasts for tropical area including French overseas territories (Figure 1). Their horizontal resolution is equal to 8 km. A 3DVAR assimilation scheme has been implemented for these three LAM with 6 hours temporal windows. Two daily runs are performed at 0 and 12 UTC taking their boundary conditions in the IFS runs starting 6 hours before. The maximum lead time is 54 hours. The surface conditions are computed by a specific surface analysis similar to the one used by the French global model ARPEGE since September 2011. A major increase of the number of satellite data became operational the 02/07/2013 with the assimilation of IASI B, CRIS, OCEANSAT and ATMS. The LAM forecasts are compared with the IFS forecasts for surface parameters.
According to the diurnal variation of convection, better rain forecast scores are reached by IFS and ALADIN-ECMWF in the afternoon (local time) for both areas NOUVELLE-CALEDONIE and ANTILLES-GUYANE, but misses and false alarms are more numerous in these tropical regions than in Europe; differences between the two models are also larger than in Europe and present during the whole simulation. For the rain/no rain threshold, IFS gets better scores than the LAM but for the heavy rain threshold, both models show difficulties to simulate strong convective events (not shown). 2m AGL temperature is underestimated and relative humidity overestimated with better RMSE during the night when temperature decreases and humidity grows.
The temporal series of the RMSE for the wind at 10 m AGL (Figure 3) present a stronger improvement over the NOUVELLE CALEDONIE area than over the ANTILLES-GUYANE area. This difference is likely related to the mountainous characteristics of the domains which increase the advantage due to the higher resolution of ALADIN. The improvement oscillates between 10 and 25 % for the NOUVELLE CALEDONIE area and -5 to 5 % for the ANTILLES-GUYANE area depending on the lead time. For the temperature and relative humidity at 2m AGL (not shown), no improvement is brought by the ALADIN model to the IFS forecasts for both areas.
Figure 3 Temporal series of the RMSE (full lines) and bias (dotted lines) for the wind at 10m AGL in m/s
forecasted at 36 hours by ALADIN ANTILLES-GUYANE (blue lines) and IFS (red lines) on the left panel. The reference is provided by the surface stations included in the LAM domain and the errors are monthly averages. The same comparison is presented for the ALADIN CALEDONIE on the right panel at 36 hours.
The wind fields of the deterministic ECMWF model provide the forcing of the third generation wave model MFWAM, which is derived from the wave model WAM of ECMWF but uses a different physical package. A global version and a regional version centred on Europe use horizontal meshes of 0.5° and 0.1°, respectively.
FRANCE FRANCE
5
Figure 4: Positions of the 90 buoys used for the verification of the global models (first panel). RMSE of different
global wave model forecasts for the significant wave height (second panel) and the peak period (third panel). WAM (ECM) is plotted in red and MFWAM (MTF) in purple.
The global model MFWAM is compared to others wave models using the buoys data as a reference. In Figure 4, we can see that this model is one of the three best models used by the international community, for all lead times, both for the peak period and the significant wave height.
The MOCAGE chemistry transport model of Météo-France is operated daily, to provide air quality forecasts and analysis, in contribution to the MACC-II regional ensemble AQ1 service. The two chains (analysis and forecasts) are operated independently: due to the timing constraints of ensemble forecasts delivery (before 7 UTC for the first 48h of forecasts), on one hand, and to the late availability of surface observations on the other hand, the AQ analysis results cannot provide initial values for the AQ forecasts. Since July 2014, the forecast system is running on the new Météo-France operational supercomputer BULL system which is 24hours/day monitored. Figure 5 summarizes the forecast operational production chains. Details are given in the next paragraphs. 1 AQ : Air Quality
FRANCE FRANCE
6
Figure 5: Schematic data-flow of the MOCAGE forecast chain. The parts in orange have a fully operational status.
Others are pre-operational and underway of full operationalization The following data are used by the forecast system:
• Meteorological initial forcings As soon as the 12 UTC IFS meteorological forecasts are produced, a time critical task is triggered at ECMWF to pre-process 3D fields data (interpolation on the MACC domain, on MOCAGE vertical levels and conversion to suitable format for the MOCAGE model). The result files are transferred, by ECPDS, directly to Météo France’s operational transmission system, and then automatically stored in an operational products database (BDPE). Meanwhile, surface data from IFS forecasts are disseminated directly to the operational GRIB database at Météo France (BDAP).
• Chemical boundary conditions At the moment, chemical boundary conditions from IFS-MOZART (to be replaced soon by C-IFS) are pre-processed at ECMWF into NETCDF files, then transferred to the storage and archiving system at Météo-France. The operationalization of this chain is planned in the last semester 2014 and will be based on a process similar to that in place for the 3D meteorological fields.
• Aerosol boundary conditions At the moment, the aerosol boundary conditions are taken from MOCAGE global model outputs which provide more detailed aerosols than the current version of the aerosol module in IFS.
• GFAS fires emission daily products These data are retrieved from MARS, at ECMWF, and pre-processed into small NETCDF files, then transferred to the storage and archiving system at Météo-France. The operationalization of this chain is planned in the last semester 2014 and will be based on a process similar to that in place for the 3D meteorological fields.
• Finally, initialisation fields from the forecast of the previous day are used, directly from the HPC disk system, where they are produced.
FRANCE FRANCE
7
Figure 6: Schematic data-flow of the Mocage-Valentina analysis chain. The parts in orange have an operational status, and the parts in grey are daily routine operations in a R&D environment (pre-operational).
The MOCAGE-VALENTINA analysis chain is still pre-operational, although some parts of it have an operational status (Figure 6). Full operationalization is scheduled for the end of 2014. Observations are from the csv file distributed from the operational system. Meteorological forcing files are extracted from ECMWF, using the same procedure as for the Mocage forecast. GFAS products and chemical boundary conditions are also extracted from ECMWF. Note that the MOCAGE forecast can be run even if the GFAS and/or chemical boundary conditions are not available in time. All these data are stored in the R&D archiving system of Météo-France, and the analysis runs on the R&D HPC at Météo-France. Storage and simulations on these systems are mostly secured and reliable, except that they are not monitored 7/7 24/24. The grib2 files that are produced by the analysis run (resolution 0.1°x0.1°, surface only) are stored in the Météo-France operational database, thus feeding in the operational chain for ensemble processing. 2.1.3 Derived fields
Derived fields from Ensemble Prediction System are used by the forecasters from metropolitan and overseas centres. Ensemble mean and pre-calculated probabilities are available on the Synergie workstation. More elaborated products like strike-probabilities, percentiles, EFI are used via the ECMWF web sites (institutional web site and eccharts) or internal web sites.
Probabilities for specific thresholds are also calculated and available for the forecasters for marine models, for example significant wave height of at least 3 m or 9 m.
2.2 Use of products
3. Verification of products 3.1 Objective verification 3.1.1 Direct ECMWF model output (both deterministic and EPS)
3.1.2 ECMWF model output compared to other NWP models
3.1.3 Post-processed products
3.1.4 End products delivered to users
3.2 Subjective verification 3.2.1 Subjective scores (including evaluation of confidence indices when available)
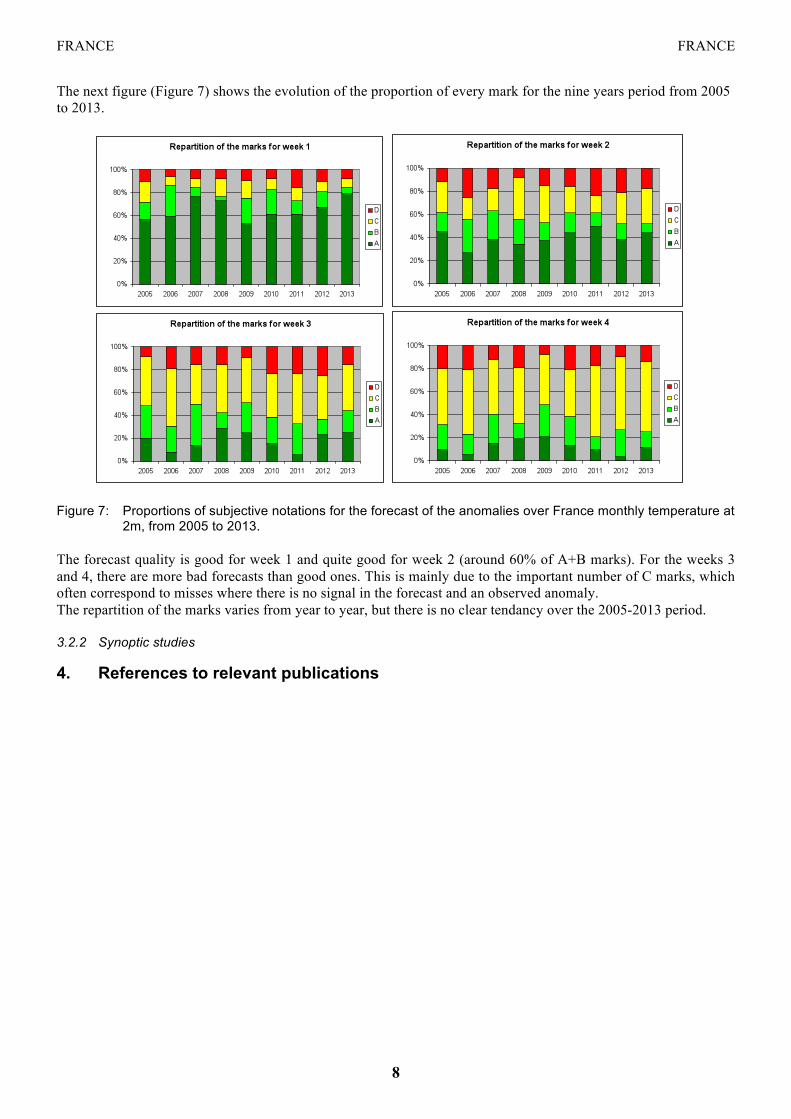
Monthly forecast verification The monthly forecasts of 2m-temperature anomalies have been assessed by the forecasters since November 2004. For every week, the marks vary from A to D with the following meaning : A : good localisation and intensity of the anomaly, B : slight differences (localisation and/or intensity) between observed and forecast anomaly, C : anomaly forecasted but not observed (false alarm) or (more frequently) anomaly observed but not forecasted (miss), D : observed anomaly opposite to the forecasted anomaly.
FRANCE FRANCE
8
The next figure (Figure 7) shows the evolution of the proportion of every mark for the nine years period from 2005 to 2013.
Figure 7: Proportions of subjective notations for the forecast of the anomalies over France monthly temperature at 2m, from 2005 to 2013.
The forecast quality is good for week 1 and quite good for week 2 (around 60% of A+B marks). For the weeks 3 and 4, there are more bad forecasts than good ones. This is mainly due to the important number of C marks, which often correspond to misses where there is no signal in the forecast and an observed anomaly. The repartition of the marks varies from year to year, but there is no clear tendancy over the 2005-2013 period. 3.2.2 Synoptic studies