APPLICATION for FORM – I & EIA /EMP for ENHANCEMENT OF CAPACITY OF AMADAND OPENCAST PROJECT 1.15 MTPA to 2.15 MTPA (Jamuna & Kotma Area) Village: NIMHA, AMADAND, KUKHA AND MANJHOLI Tehsil: Kotma; District: Anuppur; State: Madhya Pradesh; Capacity: (1.15 MTPA to 2.15 MTPA) Total project area: 884.71 Ha. {Consideration under Clause 7(ii) of EIA 2006} South Eastern Coalfields Limited (A Mini Ratna Company) September, 2014 Central Mine Planning & Design Institute Limited Regional Institute – V SECL Complex, Post Box No. 22 BILASPUR (C.G.) COPYRIGHT WITH CMPDI ISO 9001 company
Transcript
APPLICATION for FORM – I & EIA /EMP
for ENHANCEMENT OF CAPACITY OF AMADAND OPENCAST PROJECT
Capacity: (1.15 MTPA to 2.15 MTPA) Total project area: 884.71 Ha.
{Consideration under Clause 7(ii) of EIA 2006}
South Eastern Coalfields Limited (A Mini Ratna Company)
September, 2014 Central Mine Planning & Design Institute Limited
Regional Institute – V SECL Complex, Post Box No. 22
BILASPUR (C.G.)
COPYRIGHT WITH
CMPDI ISO 9001 COMPANY
EIA/EMP of AMADAND OCP ( From 1.15 MTPA to 2.15 MTPA)
CMPDI, RI-V Page 1 of 50
EIA & EMP for Enhancement of Capacity of Amadand OCP
(from 1.15 MTPA to 2.15 MTPA)
Application under clause 7(ii) of EIA Notification, 2006
1.0 INTRODUCTION
Amadand OCP is an operating mine under Jamuna and Kotma Area, South Eastern Coalfields Limited. The mine was given environment clearance for a capacity of 1.15 MTPA in October, 2004.
The Environment Clearance for 1.15 MTPA was issued vide letter No. J-11015/46/2002- IA. II (M) dt. 05.10.2004 from MOEF, Govt. of India. Refer half yearly compliance report of conditions of Environmental Clearance attached with accompanying Form-I. Amadand OCP has got the capability of producing coal higher than 1.15 MTPA. The enhanced production is to meet the increased demand of power grade coal for the nation. In the year 2012-13 & 2013-14 the coal production from Amadand OCP has been nearly 1.15 MTPA.
1.1 Purpose of the report This application is being made under clause 7(ii) of EIA Notification, 2006 for grant of prior Environmental Clearance (EC) for enhancement of capacity of Amadand OCP from 1.15 MTPA to 2.15 MTPA considering the following points.
i. Liberation of power sector by Govt. of India has generated wide spread interests private & public sector investments in power generation and other industrial development. As such, there is an appreciable increase in the number of upcoming new projects as well as expansion of existing projects. The demand projection from SECL for the year 2016 – 17 is 270.37 Mte. The projected availability in the year 2016 – 17 is 150.00 Mte. So, there will be a shortage of 120.37 Mte. For this purpose, Emergency Coal Production Plan of CIL has been formulated. Amadand Opencast has been identified as one of the project in the Emergency Coal Production Plan of CIL.
ii. The annual production of 1.15 Mt has been achieved in the last year. Refer last four years production figure shown in table -1.1.
Amadand OCP has got the capability of producing coal by 1.8-2.0 times higher than 1.15 MTPA.
iii. The mineable coal reserves are estimated to be 36.04 MT and the corresponding overburden for Amadand OCP is estimated at 165 Mcum (as on 1.4.2014). The average stripping ratio is 4.58 cum/tonne. If and when favorable geo-mining conditions exist, the project has an ability to
EIA/EMP of AMADAND OCP ( From 1.15 MTPA to 2.15 MTPA)
CMPDI, RI-V Page 2 of 50
produce an additional coal, making the production of the project 2.15 MTPA.
iv. As the project will be a capacity enhancement of the existing Amadand
OCP, the basic infrastructure is available and additional production can be planned with less gestation period.
v. All the additional 1.0 MTPA production of Amadand OCP is proposed to be linked to TPS (Thermal Power Stations), and industries. As such, there will be no problem in marketing the coal from this project.
vi. The total leasehold area as per earlier approved EMP is 884.71 Ha.
vii. No change in technology is proposed.
viii. Due to the increasing demand of coal for the nation, it is requested to consider the proposal for grant of environmental clearance from MOEF for enhancement of capacity from 1.15 MTPA to 2.15 MTPA.
Therefore this project qualifies for EC under clause 7(ii) of EIA notification no. 1533, Sep 2006, for approval of enhanced capacity production from 1.15 MTPA to 2.15 MTPA. The filled up Form-I & this EIA of the Project are put up for due diligence of EAC for inclusion of 2.15 MTPA enhanced capacity of existing & approved Amadand OCP.
1.2 Previous Coal Production
The mine has started coal production in Feb’2010 and the production of this project for the preceding years is given below.
The balance mineable coal left in Amadand OCP as on 01.04.2014 is 32.503 MT. Corresponding to this, the balance life of Amadand opencast is around 29 years. Considering the proposed enhancement of capacity to 2.15 MTPA, the balance life of mine comes around 16 years.
EIA/EMP of AMADAND OCP ( From 1.15 MTPA to 2.15 MTPA)
CMPDI, RI-V Page 3 of 50
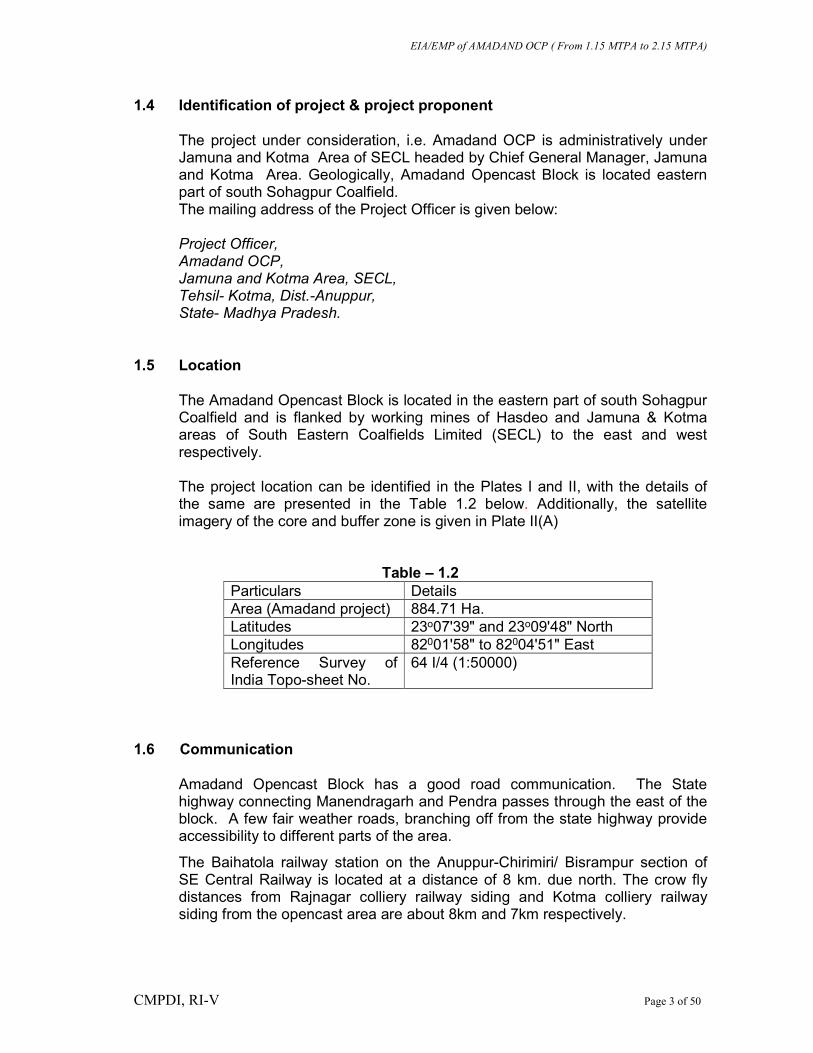
1.4 Identification of project & project proponent
The project under consideration, i.e. Amadand OCP is administratively under Jamuna and Kotma Area of SECL headed by Chief General Manager, Jamuna and Kotma Area. Geologically, Amadand Opencast Block is located eastern part of south Sohagpur Coalfield. The mailing address of the Project Officer is given below: Project Officer, Amadand OCP, Jamuna and Kotma Area, SECL, Tehsil- Kotma, Dist.-Anuppur, State- Madhya Pradesh.
1.5 Location
The Amadand Opencast Block is located in the eastern part of south Sohagpur Coalfield and is flanked by working mines of Hasdeo and Jamuna & Kotma areas of South Eastern Coalfields Limited (SECL) to the east and west respectively. The project location can be identified in the Plates I and II, with the details of the same are presented in the Table 1.2 below. Additionally, the satellite imagery of the core and buffer zone is given in Plate II(A)
Table – 1.2 Particulars Details Area (Amadand project) 884.71 Ha. Latitudes 23o07'39" and 23o09'48" North Longitudes 82001'58" to 82004'51" East Reference Survey of India Topo-sheet No.
64 I/4 (1:50000)
1.6 Communication
Amadand Opencast Block has a good road communication. The State highway connecting Manendragarh and Pendra passes through the east of the block. A few fair weather roads, branching off from the state highway provide accessibility to different parts of the area.
The Baihatola railway station on the Anuppur-Chirimiri/ Bisrampur section of SE Central Railway is located at a distance of 8 km. due north. The crow fly distances from Rajnagar colliery railway siding and Kotma colliery railway siding from the opencast area are about 8km and 7km respectively.
EIA/EMP of AMADAND OCP ( From 1.15 MTPA to 2.15 MTPA)
CMPDI, RI-V Page 4 of 50
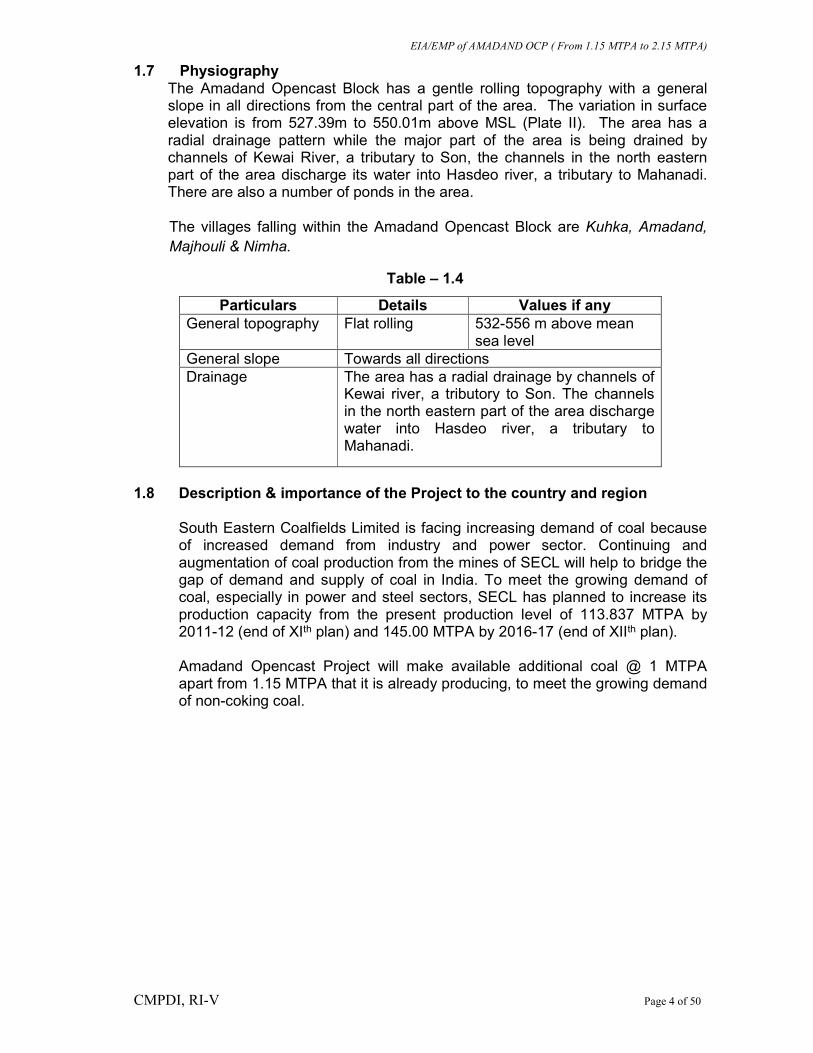
1.7 Physiography The Amadand Opencast Block has a gentle rolling topography with a general slope in all directions from the central part of the area. The variation in surface elevation is from 527.39m to 550.01m above MSL (Plate II). The area has a radial drainage pattern while the major part of the area is being drained by channels of Kewai River, a tributary to Son, the channels in the north eastern part of the area discharge its water into Hasdeo river, a tributary to Mahanadi. There are also a number of ponds in the area.
The villages falling within the Amadand Opencast Block are Kuhka, Amadand,
Majhouli & Nimha.
Table – 1.4
Particulars Details Values if any General topography Flat rolling 532-556 m above mean
sea level General slope Towards all directions Drainage The area has a radial drainage by channels of
Kewai river, a tributory to Son. The channels in the north eastern part of the area discharge water into Hasdeo river, a tributary to Mahanadi.
1.8 Description & importance of the Project to the country and region
South Eastern Coalfields Limited is facing increasing demand of coal because of increased demand from industry and power sector. Continuing and augmentation of coal production from the mines of SECL will help to bridge the gap of demand and supply of coal in India. To meet the growing demand of coal, especially in power and steel sectors, SECL has planned to increase its production capacity from the present production level of 113.837 MTPA by 2011-12 (end of XIth plan) and 145.00 MTPA by 2016-17 (end of XIIth plan). Amadand Opencast Project will make available additional coal @ 1 MTPA apart from 1.15 MTPA that it is already producing, to meet the growing demand of non-coking coal.
EIA/EMP of AMADAND OCP ( From 1.15 MTPA to 2.15 MTPA)
CMPDI, RI-V Page 5 of 50
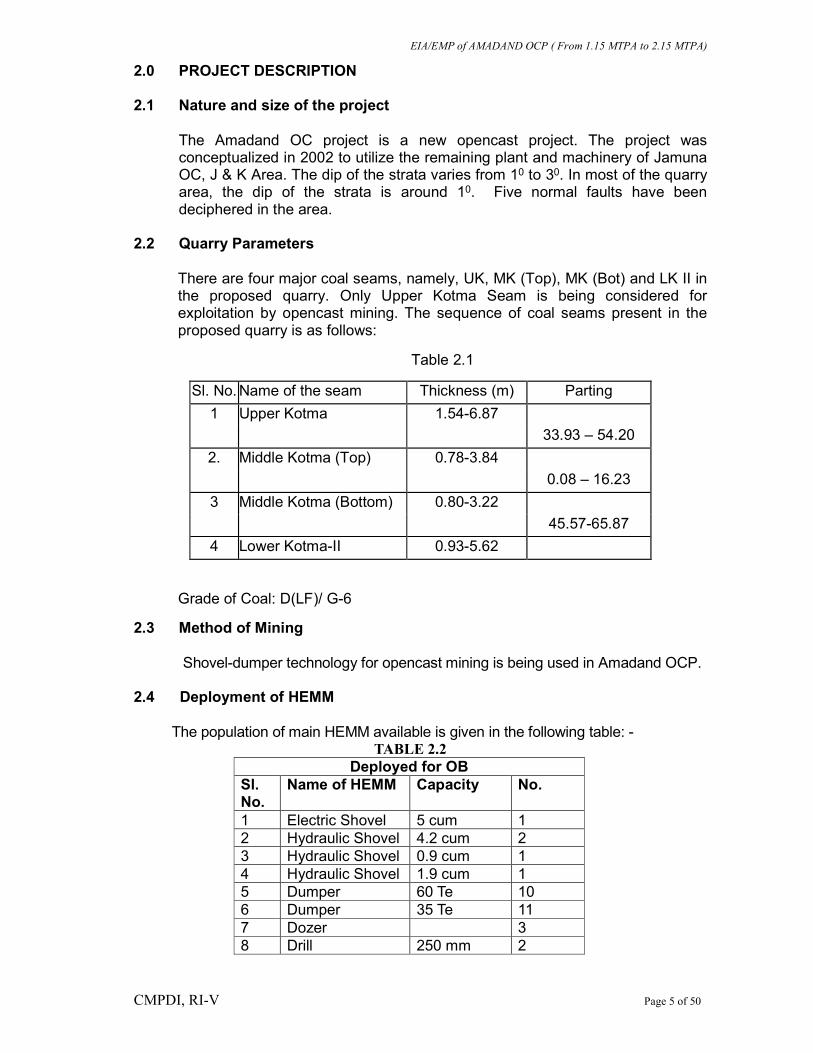
2.0 PROJECT DESCRIPTION 2.1 Nature and size of the project
The Amadand OC project is a new opencast project. The project was conceptualized in 2002 to utilize the remaining plant and machinery of Jamuna OC, J & K Area. The dip of the strata varies from 10 to 30. In most of the quarry area, the dip of the strata is around 10. Five normal faults have been deciphered in the area.
2.2 Quarry Parameters
There are four major coal seams, namely, UK, MK (Top), MK (Bot) and LK II in the proposed quarry. Only Upper Kotma Seam is being considered for exploitation by opencast mining. The sequence of coal seams present in the proposed quarry is as follows:
Table 2.1
Sl. No. Name of the seam Thickness (m) Parting
1 Upper Kotma 1.54-6.87
33.93 – 54.20
2. Middle Kotma (Top) 0.78-3.84
0.08 – 16.23
3 Middle Kotma (Bottom) 0.80-3.22
45.57-65.87
4 Lower Kotma-II 0.93-5.62
Grade of Coal: D(LF)/ G-6
2.3 Method of Mining
Shovel-dumper technology for opencast mining is being used in Amadand OCP.
2.4 Deployment of HEMM The population of main HEMM available is given in the following table: -
TABLE 2.2 Deployed for OB
Sl. No.
Name of HEMM Capacity No.
1 Electric Shovel 5 cum 1 2 Hydraulic Shovel 4.2 cum 2 3 Hydraulic Shovel 0.9 cum 1 4 Hydraulic Shovel 1.9 cum 1 5 Dumper 60 Te 10 6 Dumper 35 Te 11 7 Dozer 3 8 Drill 250 mm 2
EIA/EMP of AMADAND OCP ( From 1.15 MTPA to 2.15 MTPA)
CMPDI, RI-V Page 6 of 50
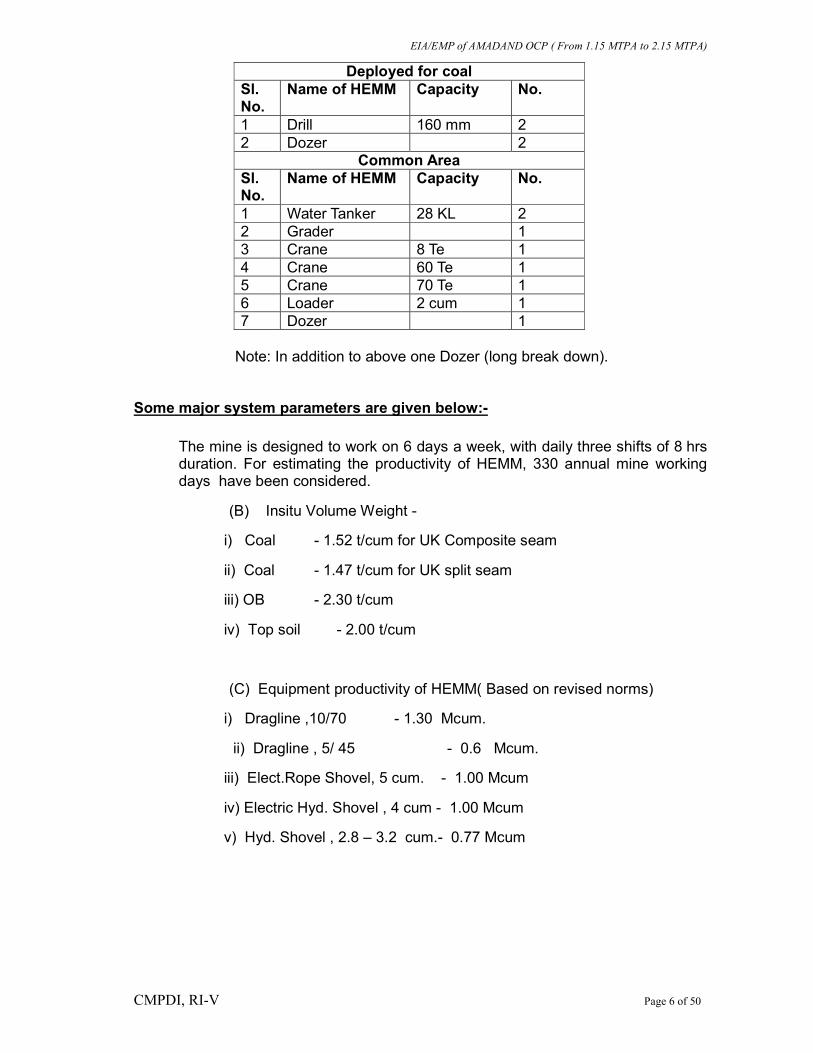
Deployed for coal Sl. No.
Name of HEMM Capacity No.
1 Drill 160 mm 2 2 Dozer 2
Common Area Sl. No.
Name of HEMM Capacity No.
1 Water Tanker 28 KL 2 2 Grader 1 3 Crane 8 Te 1 4 Crane 60 Te 1 5 Crane 70 Te 1 6 Loader 2 cum 1 7 Dozer 1
Note: In addition to above one Dozer (long break down).
Some major system parameters are given below:-
The mine is designed to work on 6 days a week, with daily three shifts of 8 hrs duration. For estimating the productivity of HEMM, 330 annual mine working days have been considered.
(B) Insitu Volume Weight -
i) Coal - 1.52 t/cum for UK Composite seam
ii) Coal - 1.47 t/cum for UK split seam
iii) OB - 2.30 t/cum
iv) Top soil - 2.00 t/cum
(C) Equipment productivity of HEMM( Based on revised norms)
i) Dragline ,10/70 - 1.30 Mcum.
ii) Dragline , 5/ 45 - 0.6 Mcum.
iii) Elect.Rope Shovel, 5 cum. - 1.00 Mcum
iv) Electric Hyd. Shovel , 4 cum - 1.00 Mcum
v) Hyd. Shovel , 2.8 – 3.2 cum.- 0.77 Mcum
EIA/EMP of AMADAND OCP ( From 1.15 MTPA to 2.15 MTPA)
CMPDI, RI-V Page 7 of 50
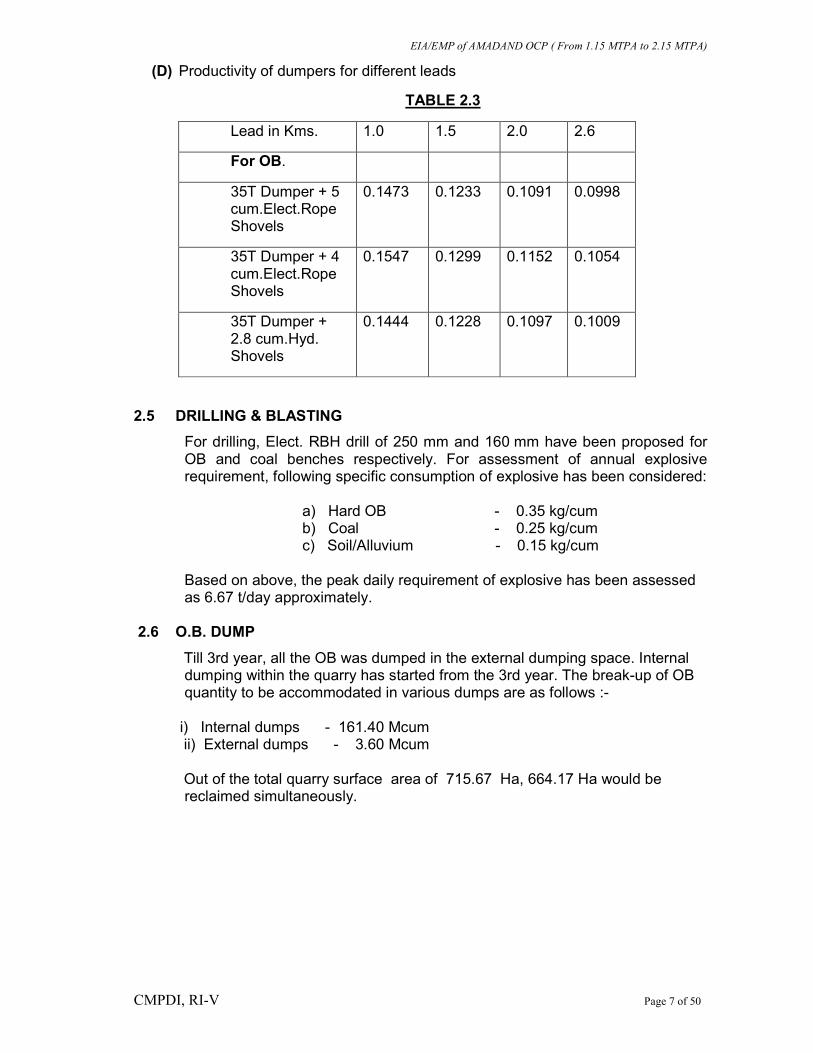
(D) Productivity of dumpers for different leads
TABLE 2.3
Lead in Kms. 1.0 1.5 2.0 2.6
For OB.
35T Dumper + 5 cum.Elect.Rope Shovels
0.1473 0.1233 0.1091 0.0998
35T Dumper + 4 cum.Elect.Rope Shovels
0.1547 0.1299 0.1152 0.1054
35T Dumper + 2.8 cum.Hyd. Shovels
0.1444 0.1228 0.1097 0.1009
2.5 DRILLING & BLASTING
For drilling, Elect. RBH drill of 250 mm and 160 mm have been proposed for OB and coal benches respectively. For assessment of annual explosive requirement, following specific consumption of explosive has been considered:
a) Hard OB - 0.35 kg/cum b) Coal - 0.25 kg/cum c) Soil/Alluvium - 0.15 kg/cum
Based on above, the peak daily requirement of explosive has been assessed as 6.67 t/day approximately.
2.6 O.B. DUMP
Till 3rd year, all the OB was dumped in the external dumping space. Internal dumping within the quarry has started from the 3rd year. The break-up of OB quantity to be accommodated in various dumps are as follows :-
i) Internal dumps - 161.40 Mcum ii) External dumps - 3.60 Mcum Out of the total quarry surface area of 715.67 Ha, 664.17 Ha would be
reclaimed simultaneously.
EIA/EMP of AMADAND OCP ( From 1.15 MTPA to 2.15 MTPA)
CMPDI, RI-V Page 8 of 50
3.0 DESCRIPTION OF THE ENVIRONMENT
The present status of the environment was studied through environmental monitoring presently being done by CMPDIL on behalf of SECL in post monsoon season, from October 2013 to December 2013. The location of sampling stations is shown on Plate-VII and Plate VII A.
3.1 Ambient Air Quality Ambient air quality study was done in core & buffer zone of Amadand OCP at the following stations.
Table-3.1
Sl. No.
Location Distance (km)
Direction
Reasons for selection
(W.r.t. centre of core zone)
1.0
Kuhka village(AN1)
2.0 Northwest To assess pollution levels in the mining area.
2.0
Nimha village (AN2)
1.0 southwest To assess pollution levels in the village area
3.0
Amadand village(AN3)
1.5 southeast To assess the pollution levels in the village area.
4.0
MTK (AN4)
0.5 northeast To assess the pollution levels in the village area in the down-wind direction.
5.0 Project Office Amadand
(Core Zone) (AN5)
2.0 Within mine area
To assess pollution levels in the village within mining area.
6.0
Amadand incline (AN6)
2.0 South East
To assess the pollution levels in the village area in the up-wind direction as control station.
EIA/EMP of AMADAND OCP ( From 1.15 MTPA to 2.15 MTPA)
CMPDI, RI-V Page 9 of 50
Summary of the observations made during the study period are as follows:
Table – 3.2 Ambient Air Quality Status (Values are in μg/m3) AIR QUALITY DATA (October 2013)
STATIONS SPM RPM SOx NOx CPCB Limit as per
GSR 742 (E), dt 25.09.2000
600 300 120 120
Kuhka village 124.5 61.0 11.5 18.0 Nimha village 129.5 64.5 13.0 21.5
It is evident from the above that general air quality in and around Amadand OCP is under the prescribed limits. The values are higher at sampling locations which are inside mine boundary due to ongoing mining activities.
EIA/EMP of AMADAND OCP ( From 1.15 MTPA to 2.15 MTPA)
CMPDI, RI-V Page 10 of 50
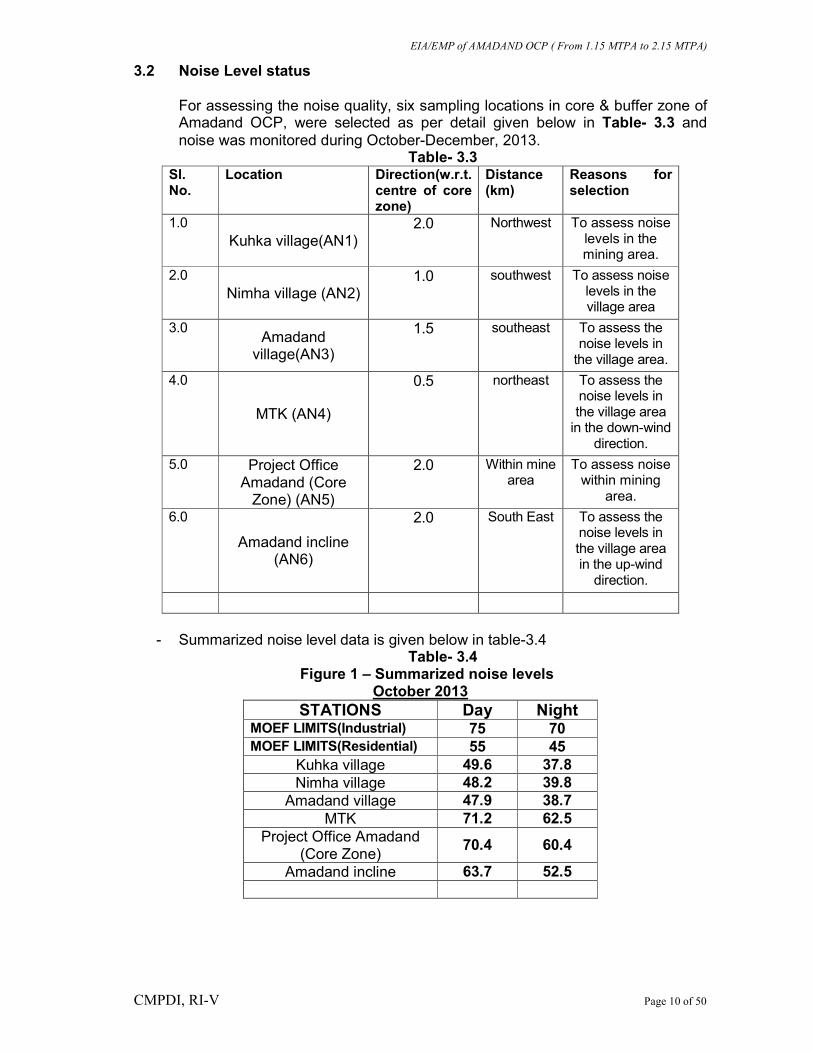
3.2 Noise Level status For assessing the noise quality, six sampling locations in core & buffer zone of Amadand OCP, were selected as per detail given below in Table- 3.3 and noise was monitored during October-December, 2013.
Table- 3.3 Sl. No.
Location Direction(w.r.t. centre of core zone)
Distance (km)
Reasons for selection
1.0
Kuhka village(AN1) 2.0 Northwest To assess noise
levels in the mining area.
2.0
Nimha village (AN2) 1.0 southwest To assess noise
levels in the village area
3.0 Amadand
village(AN3)
1.5 southeast To assess the noise levels in
the village area.
4.0
MTK (AN4)
0.5 northeast To assess the noise levels in the village area
in the down-wind direction.
5.0 Project Office Amadand (Core
Zone) (AN5)
2.0 Within mine area
To assess noise within mining
area.
6.0
Amadand incline (AN6)
2.0 South East To assess the noise levels in the village area in the up-wind
direction.
- Summarized noise level data is given below in table-3.4
Table- 3.4 Figure 1 – Summarized noise levels
October 2013
STATIONS Day Night MOEF LIMITS(Industrial) 75 70 MOEF LIMITS(Residential) 55 45
Kuhka village 49.6 37.8 Nimha village 48.2 39.8
Amadand village 47.9 38.7 MTK 71.2 62.5
Project Office Amadand (Core Zone)
70.4 60.4
Amadand incline 63.7 52.5
EIA/EMP of AMADAND OCP ( From 1.15 MTPA to 2.15 MTPA)
CMPDI, RI-V Page 11 of 50
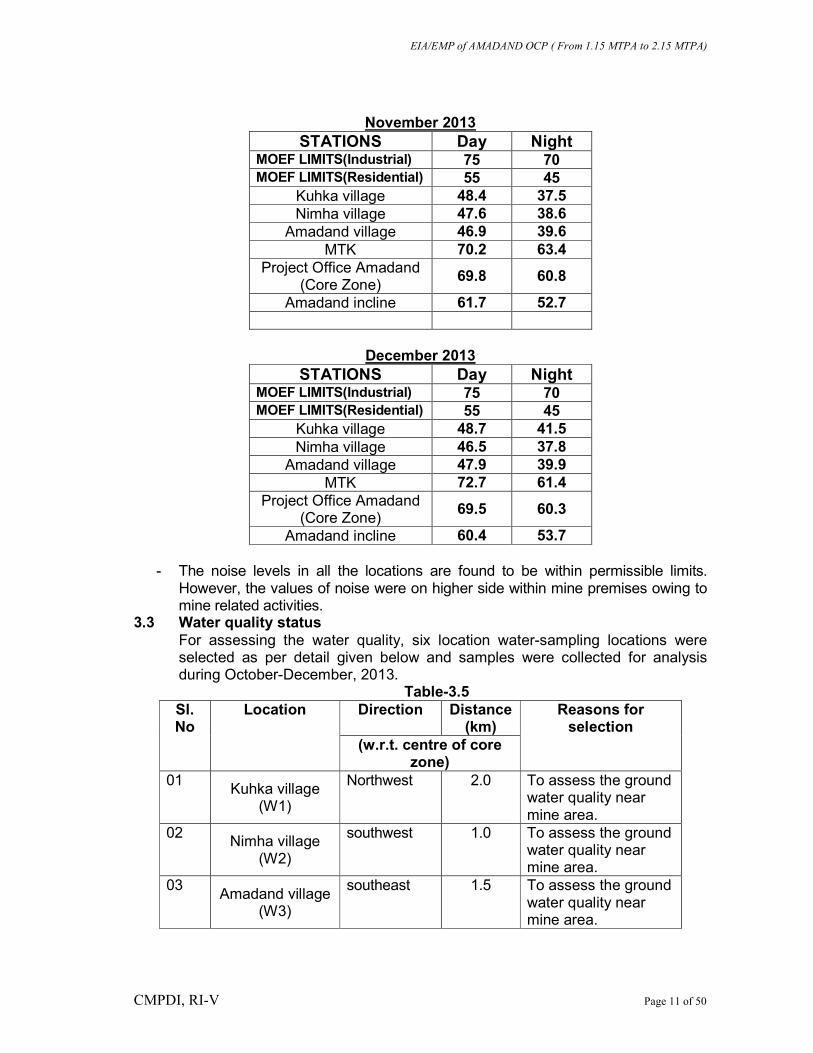
November 2013
STATIONS Day Night MOEF LIMITS(Industrial) 75 70 MOEF LIMITS(Residential) 55 45
Kuhka village 48.4 37.5 Nimha village 47.6 38.6
Amadand village 46.9 39.6 MTK 70.2 63.4
Project Office Amadand (Core Zone)
69.8 60.8
Amadand incline 61.7 52.7
December 2013
STATIONS Day Night MOEF LIMITS(Industrial) 75 70 MOEF LIMITS(Residential) 55 45
Kuhka village 48.7 41.5 Nimha village 46.5 37.8
Amadand village 47.9 39.9 MTK 72.7 61.4
Project Office Amadand (Core Zone)
69.5 60.3
Amadand incline 60.4 53.7
- The noise levels in all the locations are found to be within permissible limits. However, the values of noise were on higher side within mine premises owing to mine related activities.
3.3 Water quality status For assessing the water quality, six location water-sampling locations were selected as per detail given below and samples were collected for analysis during October-December, 2013.
Table-3.5 Sl. No
Location Direction Distance (km)
Reasons for selection
(w.r.t. centre of core zone)
01 Kuhka village
(W1)
Northwest 2.0 To assess the ground water quality near mine area.
02 Nimha village
(W2)
southwest 1.0 To assess the ground water quality near mine area.
03 Amadand village
(W3)
southeast 1.5 To assess the ground water quality near mine area.
EIA/EMP of AMADAND OCP ( From 1.15 MTPA to 2.15 MTPA)
CMPDI, RI-V Page 12 of 50
04 Amadand Project Office(W4)
Within mine area
2.0 To assess mine water quality
05 Bartarai Village Well Water (W5)
South 1.5 To assess the village water quality
06 Hand Pump Water in front of SAM Office (W6)
South East 2.0 To assess the mine office water quality
The above locations/stations have been chosen in such a way so as to cover the Core and Buffer zone area of the mine. This will enable to obtain a comprehensive idea of water quality in and around the mining area. Salient observations of drinking water, ground water & Mine effluent water quality are given below in tables- 3.6, 3.7 & 3.8 respectively:
EIA/EMP of AMADAND OCP ( From 1.15 MTPA to 2.15 MTPA)
CMPDI, RI-V Page 13 of 50
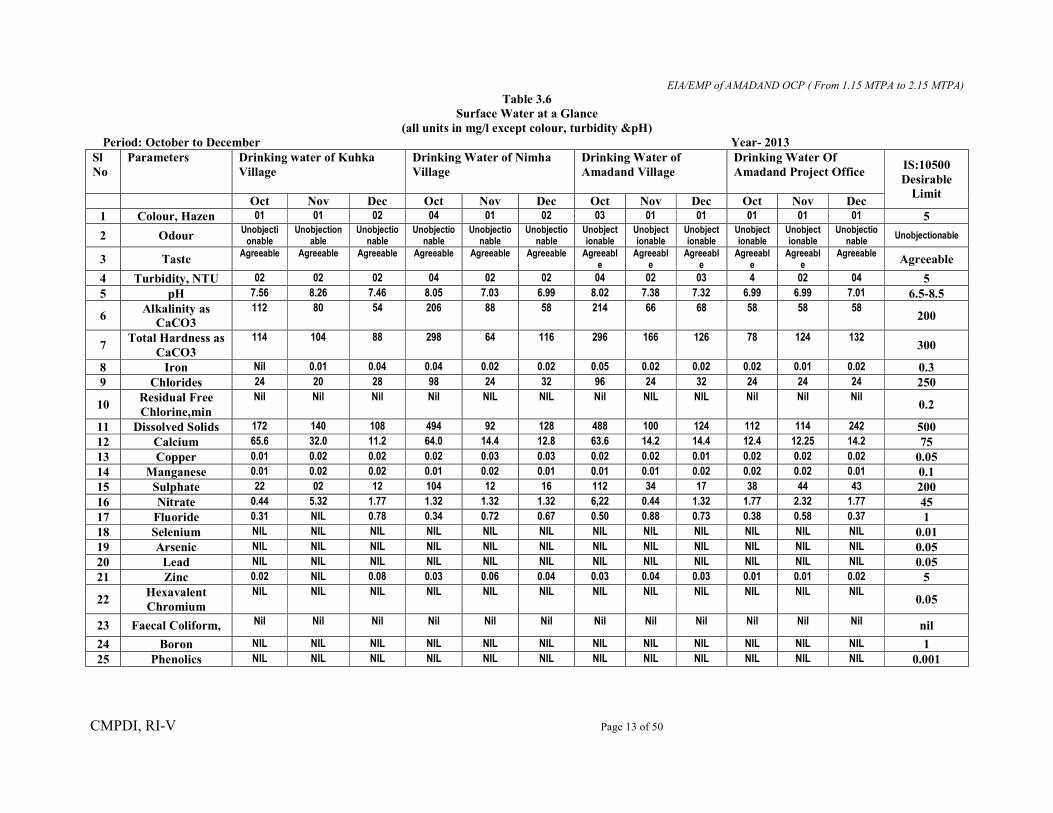
Table 3.6 Surface Water at a Glance
(all units in mg/l except colour, turbidity &pH) Period: October to December Year- 2013 Sl No
Parameters Drinking water of Kuhka Village
Drinking Water of Nimha Village
Drinking Water of Amadand Village
Drinking Water Of Amadand Project Office
IS:10500 Desirable
Limit Oct Nov Dec Oct Nov Dec Oct Nov Dec Oct Nov Dec
EIA/EMP of AMADAND OCP ( From 1.15 MTPA to 2.15 MTPA)
Page 15 of 50
Effluent Water Quality {Oct-Dec 2013} Table 3.8
Location Parameters As per GSR 742(E)
dated 25.9.2000
Result (Range) Permissible limit As per GSR 742(E) dated 25.9.2000
Mine discharge water Amadand OCP
pH 7.65-7.71 5.5-9.0 Total suspended solids (mg/l)
80-85 100
COD(mg/l) 110-125 250 Oil & Grease (mg/l) <1.0 10
At all locations, oil and grease, phenolic compounds, cyanides, sulphides and insecticides are found to be absent and all heavy metal values are found to be well within the prescribed norms of IS: 2296 and IS: 10500.
The water quality data as obtained for October-December 2013 at Amadand OC sampling points in respect of different parameters is within the desirable limit.
The effluent water quality data at the mine in respect of different parameters is
also within the permissible limit.
3.3.1 Ground Water Status:
3.3.1.1 Ground water levels:
a) Village groundwater levels:
To assess the water table configuration, a network consisting of 39 dug wells,
covering most of the villages falling within the core and buffer zones were
established in the study area. The wells are mostly used for domestic water
needs.
The water levels within the core zone of Amadand OC during pre-monsoon
(May 2012) observed to vary from 4.06m (Malga) to more than 9.80 m
(Baratrai). Whereas, the water levels in the study area during pre-monsoon
(May 2012) observed to vary from 1.50 m (Barka Bhauta) to maximum 15.45m
(Gulatola). Deep water levels may be attributed to location of observation wells
falling within recharge zone as well as at topographic highs.
Water table in the study area seems to very deep because as many as 22
observation wells (i.e. 60% of total wells) are recorded having water levels >
7.00m. Only 4 observation wells recorded water levels <5.00m. In many
villages, close to active mine areas mine water is discharged in to the existing
wells by project authorities. This has become a common practice during
summer.
EIA/EMP of AMADAND OCP ( From 1.15 MTPA to 2.15 MTPA)
Page 16 of 50
The water table in the area conforms to the topography. As the mine is located on
a topographical high, the hydraulic gradient slopes towards south, south-west and
south-eastern directions from the proposed mine. However, the water table
measured in near the project gradient differs from 5.66x10⁻³ to 3.84x10⁻³.
To understand the impact of mining on local water levels, the water levels
monitored during peak dry period (i.e. May 2012), in 29 wells located close to
the Amadand OCP, were compared with the water levels of the corresponding
period monitored two years ago i.e. May 2010. This reveals the extent of
impact of mining on local water levels in time and space.
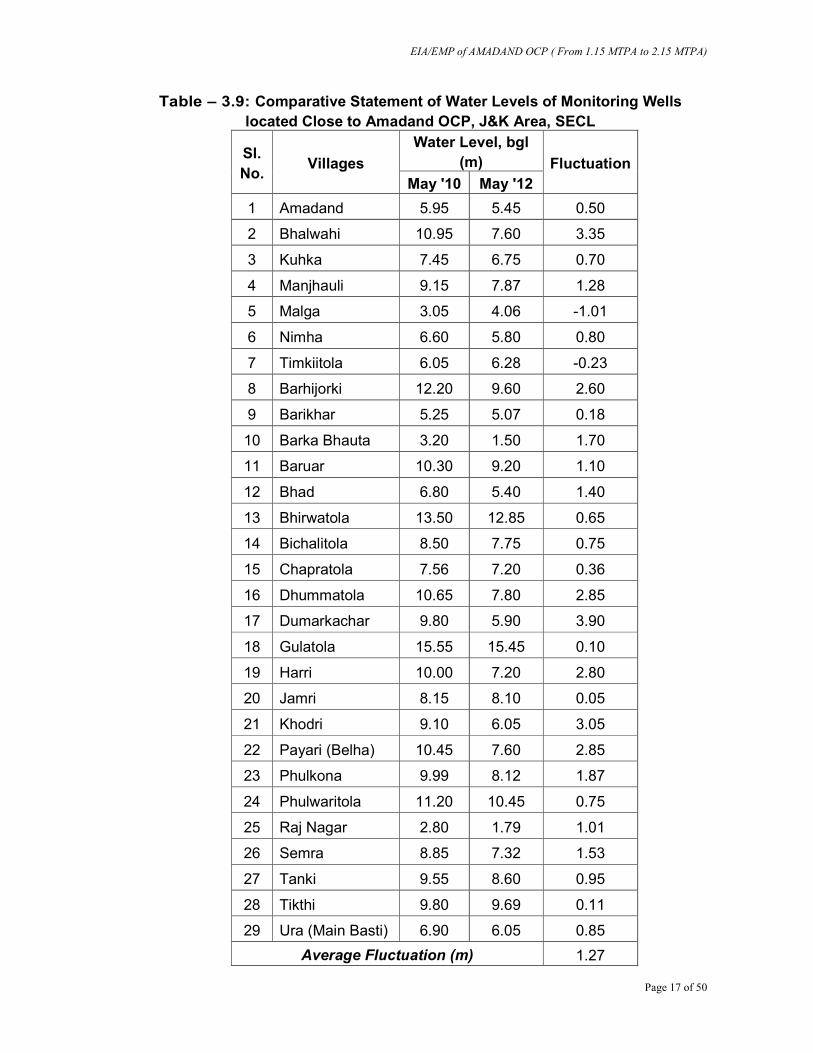
There is a rise in water levels in 27 villages and were observed to vary from
+0.05m (Jamri) to +3.90m (Dumarkachar). Whereas in only 2 villages, the
water levels were lowered further and fluctuation varies from -0.23m (Timkitola)
to -1.01m (Malga).
Hence, the fluctuation in water levels during two years period was observed to
vary from -1.01m to +3.90m and which is very close to the natural fluctuation
observed in villages located far away from mine areas. These variations may
be attributed to the local utilisation and recharge conditions only. Thus, the
influence of mining on these water levels may be considered as marginal. The
variation of water levels in observed wells are given in Table -3.9 and Fig.-2.
EIA/EMP of AMADAND OCP ( From 1.15 MTPA to 2.15 MTPA)
Page 17 of 50
Table – 3.9: Comparative Statement of Water Levels of Monitoring Wells
located Close to Amadand OCP, J&K Area, SECL
Sl.
No. Villages
Water Level, bgl
(m) Fluctuation
May '10 May '12
1 Amadand 5.95 5.45 0.50
2 Bhalwahi 10.95 7.60 3.35
3 Kuhka 7.45 6.75 0.70
4 Manjhauli 9.15 7.87 1.28
5 Malga 3.05 4.06 -1.01
6 Nimha 6.60 5.80 0.80
7 Timkiitola 6.05 6.28 -0.23
8 Barhijorki 12.20 9.60 2.60
9 Barikhar 5.25 5.07 0.18
10 Barka Bhauta 3.20 1.50 1.70
11 Baruar 10.30 9.20 1.10
12 Bhad 6.80 5.40 1.40
13 Bhirwatola 13.50 12.85 0.65
14 Bichalitola 8.50 7.75 0.75
15 Chapratola 7.56 7.20 0.36
16 Dhummatola 10.65 7.80 2.85
17 Dumarkachar 9.80 5.90 3.90
18 Gulatola 15.55 15.45 0.10
19 Harri 10.00 7.20 2.80
20 Jamri 8.15 8.10 0.05
21 Khodri 9.10 6.05 3.05
22 Payari (Belha) 10.45 7.60 2.85
23 Phulkona 9.99 8.12 1.87
24 Phulwaritola 11.20 10.45 0.75
25 Raj Nagar 2.80 1.79 1.01
26 Semra 8.85 7.32 1.53
27 Tanki 9.55 8.60 0.95
28 Tikthi 9.80 9.69 0.11
29 Ura (Main Basti) 6.90 6.05 0.85
Average Fluctuation (m) 1.27
EIA/EMP of AMADAND OCP ( From 1.15 MTPA to 2.15 MTPA)
Page 18 of 50
Fig.: 2
EIA/EMP of AMADAND OCP ( From 1.15 MTPA to 2.15 MTPA)
Page 19 of 50
b) Historic Groundwater Levels:
The District Groundwater Survey Unit, Shadol district, Madhya Pradesh, has
been monitoring the ground water levels in the region. The pre-monsoon and
post-monsoon historical groundwater levels for the last 23 years (1990 - 2012)
recorded at the nearest permanent observation wells Khodri (POW-08) and
Payari (POW-89) located within the buffer zone were collected and are given
below:
Table 3.10: Historic groundwater levels
(in meters) b.g.l
Hydrogra
ph Stn /
Year
Khodri (POW -08) Payari (POW-89)
Pre -
Monso
on
Post -
Monso
on
Fluctuati
on
Pre -
Monso
on
Post -
Monso
on
Fluctuati
on
1990 6.13 2.98 3.15 9.15 2.90 6.25
1991 6.05 3.80 2.25 9.30 4.10 5.20
1992 7.05 3.08 3.97 7.60 4.00 3.60
1993 8.27 3.75 4.52 8.05 4.41 3.64
1994 8.10 2.05 6.05 8.60 2.55 6.05
1995 7.95 3.40 4.55 8.51 2.61 5.90
1996 8.55 3.73 4.82 9.64 5.42 4.22
1997 9.06 2.77 6.29 12.53 3.05 9.48
1998 8.27 3.88 4.39 12.48 3.68 8.80
1999 9.08 3.95 5.13 12.50 4.00 8.50
2000 9.20 4.45 4.75 12.36 5.40 6.96
2001 9.28 4.50 4.78 12.30 5.50 6.80
2002 9.80 5.10 4.70 8.35 6.60 1.75
2003 11.00 3.00 8.00 8.20 3.00 5.20
2004 7.25 4.00 3.25 7.10 3.60 3.50
2005 7.65 3.75 3.90 9.00 3.55 5.45
2006 7.55 3.98 3.57 8.40 3.70 4.70
2007 7.70 4.40 3.30 7.40 4.00 3.40
2008 7.72 5.10 2.62 8.00 3.90 4.10
2009 7.92 6.35 1.57 6.90 4.65 2.25
2010 8.00 6.35 1.65 9.00 5.89 3.11
2011 8.11 4.85 3.26 9.05 3.22 5.83
2012 7.87 5.62 2.25 5.50 3.50 2.00
Average 8.15 4.12 4.03 9.12 4.05 5.07
The above mentioned data shows that the pre-monsoon water levels vary
from 6.05 m (1991, Khodri) to 12.53 m (1997, Payari) with an average of 8.64
EIA/EMP of AMADAND OCP ( From 1.15 MTPA to 2.15 MTPA)
Page 20 of 50
m and Post monsoon water level data vary from 2.05 m ( 1994, Khodri) to
6.60 m (2002, Payari) with an average of 4.09 m. The average water level
fluctuation varies from 1.57 m (2009, Khodri) to 9.48 m (1997, Payari) with an
average of 4.55 m in the Buffer zone.
c) Water level trends:
The Pre-monsoon and Post-monsoon water level trends of the above
hydrograph stations are given in Fig. 3 & 4
Figure –3
Figure-4
The pre and post-monsoon water levels of Khodri station show decreasing
trends whereas the pre monsoon water level trend at Payari shows increasing
0
500
1000
1500
2000
25000
4
8
12
Ra
infa
ll (
mm
)
Wate
r le
ve
l (m
)
Year
Pre and Post-monsoon Water Level Trends, Station: KHODRI (POW-08)
Rainfall Pre - Monsoon Post - Monsoon
0
500
1000
1500
2000
25000
4
8
12
16
Ra
infa
ll (
mm
)
Wate
r le
vel
(m)
Year
Pre and Post-monsoon Water Level Trends, Station: PAYARI (POW-89)
Rainfall Pre - Monsoon Post-Monsoon
EIA/EMP of AMADAND OCP ( From 1.15 MTPA to 2.15 MTPA)
Page 21 of 50
trend and post-monsoon water level trends at Payari station show marginal
decline. This upward trend may be attributed to the water conservation and
utilization of surface water for irrigation use in the area. The decline in pre and
post-monsoon water level at Khodri village may be attributed to increase in
ground water utilization due to increase in the local population and the
irrigation draft and .decrease in rainfall.
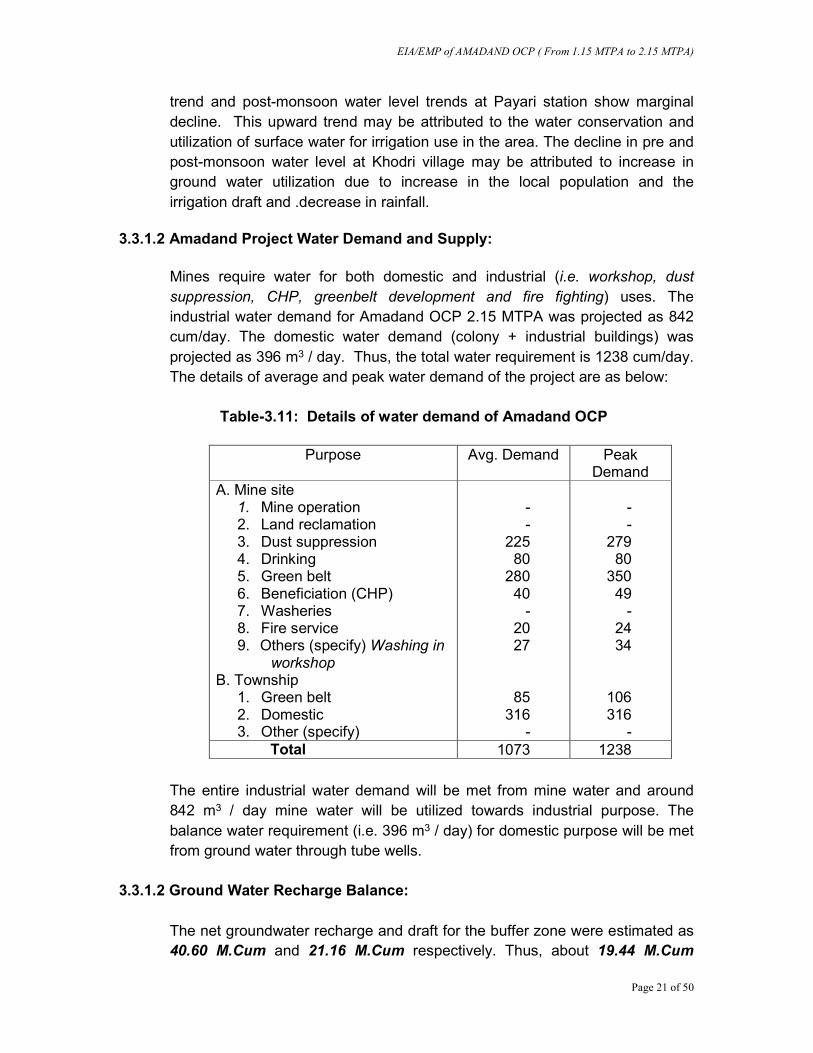
3.3.1.2 Amadand Project Water Demand and Supply:
Mines require water for both domestic and industrial (i.e. workshop, dust
suppression, CHP, greenbelt development and fire fighting) uses. The
industrial water demand for Amadand OCP 2.15 MTPA was projected as 842
cum/day. The domestic water demand (colony + industrial buildings) was
projected as 396 m3 / day. Thus, the total water requirement is 1238 cum/day.
The details of average and peak water demand of the project are as below:
Table-3.11: Details of water demand of Amadand OCP
Purpose Avg. Demand Peak
Demand A. Mine site
1. Mine operation 2. Land reclamation 3. Dust suppression 4. Drinking 5. Green belt 6. Beneficiation (CHP) 7. Washeries 8. Fire service 9. Others (specify) Washing in workshop
B. Township 1. Green belt 2. Domestic 3. Other (specify)
- -
225 80
280 40
- 20 27
85 316
-
- -
279 80
350 49
- 24 34
106 316
- Total 1073 1238
The entire industrial water demand will be met from mine water and around
842 m3 / day mine water will be utilized towards industrial purpose. The
balance water requirement (i.e. 396 m3 / day) for domestic purpose will be met
from ground water through tube wells.
3.3.1.2 Ground Water Recharge Balance:
The net groundwater recharge and draft for the buffer zone were estimated as
40.60 M.Cum and 21.16 M.Cum respectively. Thus, about 19.44 M.Cum
EIA/EMP of AMADAND OCP ( From 1.15 MTPA to 2.15 MTPA)
Page 22 of 50
groundwater recharge would be available annually in the area to meet any
future demand. The flow chart of groundwater balance calculations are shown
in Fig. 6 and summary of the groundwater balance is provided the following pie
diagram Fig-5.
Fig. 5
3.3.1.3 Groundwater Stage of Development:
Except for coal mining, no major industrial development activity is located in the
area. Due to dominant forest area and backwardness the groundwater
development in the area is very insignificant. As per CGWB, Bhopal, the total
annual replenishable ground water resource in the Anuppur Development Block,
Shahdol district (where Amadand UG proposed mine exists), was assessed as
68.20 M.cum.. It was also reported that the ground water development in the
block is as 1.99 % and falls within category "Safe". As such, the entire Madhya
Pradesh & Chhattisgarh States are covered under the category “Safe”.
3.3.1.4 Radius of Influence:
To estimate a probable zone of influence, dewatering of the entire unconfined
aquifer was considered. As the permeability varies largely in the mine area,
the radius of influence was estimated both with the existing (avg. 0.40 m/day)
and the probable increase in permeability (2 m/day) due to the mining activities
in the reclaimed area. The radius of influence (R) for the proposed mine,
based on the Sichardt’s formula (R = C*(H-Hw)*K), were estimated as below:
Natural Losses 7.1615%
Net Irrigation use2.736%
Community use4.319%
Net Mine Discharge
14.1229%
Net Annual Groundwater
Availability 19.4441%
Net Annual Groundwater Recharge Balance, Study Area of Amadand OC, Jamuna-Kotma Area, SECL
(M.Cum, %)
EIA/EMP of AMADAND OCP ( From 1.15 MTPA to 2.15 MTPA)
Page 23 of 50
Table – 3.12: Radius of Influence of Amadand OCP
Project Area Probable
drawdown (m)
Radius of influence (m)
K=0.40 m/d
K=2 m/d
Amadand OC
Jamuna Kotma 27 174 390
Thus, the propagation of drawdown cone will be limited to a smaller distance
from the mine face and mostly confine to the safety zone.
EIA/EMP of AMADAND OCP ( From 1.15 MTPA to 2.15 MTPA)
Page 24 of 50
Precipitation (A)
Evaporation
1323 mm
Surface Runoff
0.82 M.Cum
Infiltration rate (11.5% sedimentary )
!5% Net Draft
of Rg (21.16 M.Cum)
Ground water 0.22 M.Cum
Fig. 6: GROUNDWATER BALANCE FLOW DIAGRAM, AMADAND OC, JAMUNA-KOTMA AREA
Evapotranspiration
Land System (313.89 sq.km)
Annual Groundwater
Recharge (Rg) (47.76 M.Cum.)
Stream / Local drainage/ Others
Net Mine Discharge
(14.12 M.Cum)
Sedimentation Tank
Industrial use (1.24 M.Cum)
Community use (4.31 M.Cum)
Net Irrigation use
(2.73 M.Cum)
Oil & Grease Trap
Soak Pit
Domestic use (1.68 M.Cum)
Balance Annual Available Groundwater Resource
(19.44 M.Cum)
Natural Discharges & other losses
(7.16 M.Cu.m)
EIA/EMP of AMADAND OCP ( From 1.15 MTPA to 2.15 MTPA)
Page 25 of 50
4.0 DETAIL OF ANTICIPATED ENVIRONMENTAL IMPACTS & MITIGATION MEASURES
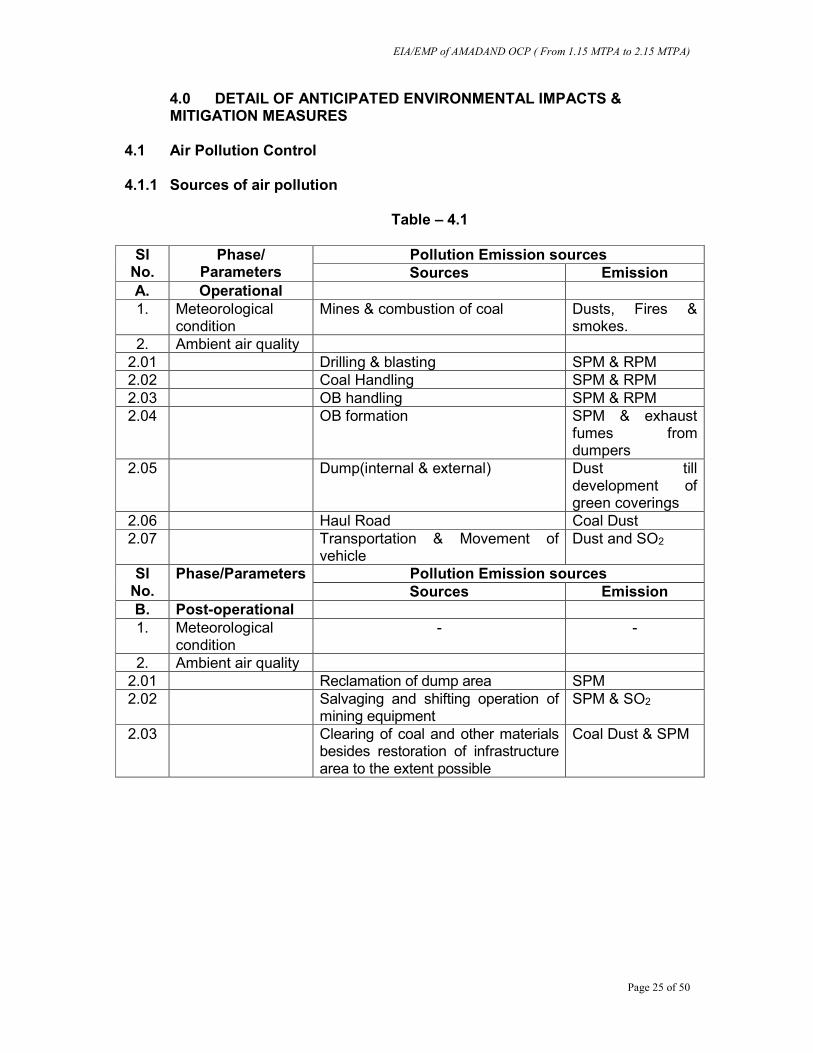
4.1 Air Pollution Control 4.1.1 Sources of air pollution
Table – 4.1
Sl No.
Phase/ Parameters
Pollution Emission sources Sources Emission
A. Operational 1. Meteorological
condition Mines & combustion of coal
Dusts, Fires & smokes.
2. Ambient air quality 2.01 Drilling & blasting SPM & RPM 2.02 Coal Handling SPM & RPM 2.03 OB handling SPM & RPM 2.04 OB formation SPM & exhaust
fumes from dumpers
2.05 Dump(internal & external) Dust till development of green coverings
2.06 Haul Road Coal Dust 2.07 Transportation & Movement of
2. Ambient air quality 2.01 Reclamation of dump area SPM 2.02 Salvaging and shifting operation of
mining equipment SPM & SO2
2.03 Clearing of coal and other materials besides restoration of infrastructure area to the extent possible
Coal Dust & SPM
EIA/EMP of AMADAND OCP ( From 1.15 MTPA to 2.15 MTPA)
Page 26 of 50
4.1.2 Impact Assessment Table-4.2
Sl
No. Parameters Impact Assessment
1. Meteorological condition
Coal dumps are susceptible to fire, and combustion may occur therein; hence there may be a likely change in ambient temperature, wind speed and direction to somewhat extent.
2. Ambient air quality
Type Impact
2.01 Direct Minimal increase in dust & noxious emission to the air owing to transport vehicles, Blasting, coal & dump handling causing to slight increase in the ambient SPM and CO levels.
2.02 Indirect Coal & dump handling & Workshop will generate indirect impact in the long run
2.03 Short term Drilling and Blasting may be attributed to slight increase in the ambient SPM and CO levels
2.04 Long term Coal handling, dump handling & Workshop will produce long term impact upon the air quality
4.1.3 Ambient Air Quality Impact Prediction Modeling by ISCST-3, USEPA
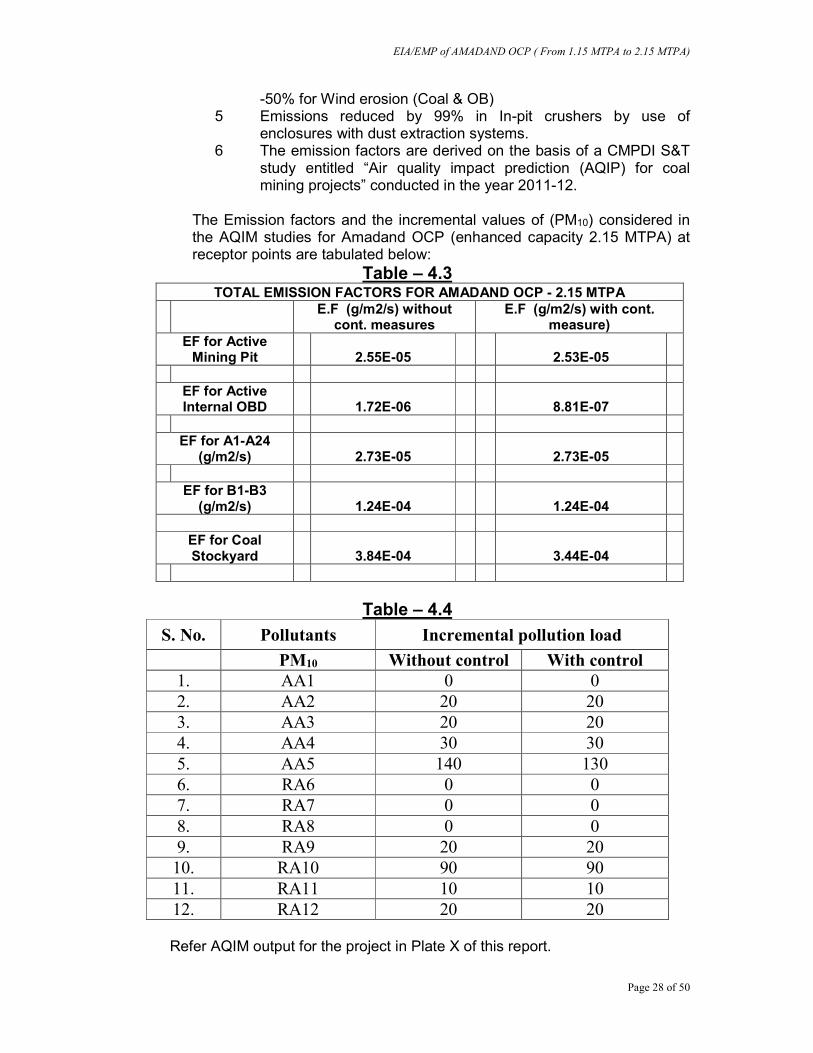
AAQ modeling based on ISCST-3 (AERMOD VIEW version 8.2.1), USEPA has been used for assessment of impact on ambient air quality at 5 monitoring stations termed as receptors, namely, AA1, AA2, AA3, AA4 & AA5 and 7 additional receptor locations, namely RA6 – RA12 (refer Plate VI) due to enhanced production of 2.15 MTPA for Amadand OCP, Jamuna & Kotma area, SECL. Refer AQIM Output report in Section C of this report. This model basically determines the incremental PM10 concentrations in μg/m3 at the receptor locations due to various mining activities such as transportation of coal & OB, Wind erosion, OB dumping, loading & unloading of coal at coal stock yard etc. The input parameters used for this modelling exercise and the subsequent emission factor calculations are tabulated vide page AQIM – 1 to 10. The Emission factors calculated based on different mining activities are tabulated at page AQIM- 11. The entire quarry activities have been divided into two major parts: Active mining pit & internal OB dump. Coal transportation is done through permanent haul road sections marked as A1 – A24. OB transportation is through road sections marked as B1 – B3. The locations of all the sources and receptors considered for this modelling exercise are shown in Plate VI of this report.
EIA/EMP of AMADAND OCP ( From 1.15 MTPA to 2.15 MTPA)
Page 27 of 50
Volume for blasting of OB has been considered as (8m) x (7m) x (15m) Depth = 840 cum per blast. Blasting volume for coal has been considered as (6m) x (5m) x (7m) Depth = 210 cum. No. of blasting holes and blasted area per day have also been calculated (Page AQM-2). The Emission factors (EF) were calculated for PM10 generation per day considering following activities:
For OB 1. Drilling - 0.56 Kg/hole blasted 2. Blasting - 0.00022 x (Area blasted) 1.5 kg 3. Loading of OB - 1.4 x 10⁻⁴ kg/te 4. OB Unloading - 5.0 x 10⁻⁴ kg/te 5. OB Bulldozing - 0.754 x (S) 1.2 / (M) 1.3 kg/hour 6. OB transportation - 0.53 kg/vehicle km travelled 7. Wind erosion - 0.09 kg/Ha/hour (taking the number of calm hours into account)
For Coal 1. Drilling - 0.22 kg/hole blasted 2. Blasting - 0.00022 x (Area blasted)1.5 kg 3. Loading of coal - 1.5 x 10⁻³ 4. Coal unloading - 1.23 x 10⁻³ kg/te 5. Coal Bulldozing - 10.324 x (S) 1.2 / (M) 1.4 kg/hour 6. Coal transportation - 0.53 Kg./ vehicle km travelled 7. In-pit crushing - 0.056 kg/te (primary) - 0.13 kg/te (secondary) 8. Wind erosion - 0.09 Kg/ Ha./ Hr. (taking the number of calm hours into account)
Other aspects
1. There is no emission factor specified for Surface Miner as per USEPA hence no emission considered and water sprinkling is an integral part of the operation of surface miner.
2. 100% mining is being done through drilling and blasting due to non-availability of surface miner system of mining at Amadand OCP.
3 Only 24 Hourly Micro meteorological data in terms of Wind speed (m/s), direction (Angular, considering North as zero degree and for other directions moving clockwise from North), ambient temperature (in Kelvin), stability class and mixing height have been considered.
4 Emission reduction with the application of water -No control in transportation activities (Coal & OB) as emission factors were developed under wet haul road conditions
-70% for Drilling (Coal & OB) & OB Unloading
EIA/EMP of AMADAND OCP ( From 1.15 MTPA to 2.15 MTPA)
Page 28 of 50
-50% for Wind erosion (Coal & OB) 5 Emissions reduced by 99% in In-pit crushers by use of
enclosures with dust extraction systems. 6 The emission factors are derived on the basis of a CMPDI S&T
study entitled “Air quality impact prediction (AQIP) for coal mining projects” conducted in the year 2011-12.
The Emission factors and the incremental values of (PM10) considered in the AQIM studies for Amadand OCP (enhanced capacity 2.15 MTPA) at receptor points are tabulated below:
Table – 4.3 TOTAL EMISSION FACTORS FOR AMADAND OCP - 2.15 MTPA
Refer AQIM output for the project in Plate X of this report.
EIA/EMP of AMADAND OCP ( From 1.15 MTPA to 2.15 MTPA)
Page 29 of 50
4.1.4 Ambient Air Quality Control Measures Following air pollution control measures are and will be practiced within the
mining area and at coal handling plants and railway siding site.
1. Water sprinkling is being done on haul road by mobile water tanker of 28 KL capacity on haul road and 28 KL capacity mobile water sprinkler on coal transportation road.
2. Fixed/ Post type road side water sprinklers have been proposed for dust suppression on haul roads and coal tipper roads.
3. Along the sides of the conveyor belts and at all transfer points, water sprinkling arrangement is working effectively to suppress dust at source.
4. Dumpers and tippers are optimally loaded in order to prevent spillage on haul roads. Coal loaded vehicles are covered before leaving the mine premises.
5. Whenever the coal dust/slurry accumulates on haul roads and other roads in the mine premises, the same is cleared by the use of graders and loaders.
6. Dust extractors are working effectively in drills, thus reducing dust emissions at source.
7. Extensive plantation has been done and will be continuously expanded in the future, thus acting as a dust and noise barrier between the mine and the residential areas.
8. Additionally, thick green belts are being developed around residential areas. Also, plantation is being done along the colony roads and around other mine infrastructures.
9. Employees are provided with LP gas connections, restricting combustion of coal for domestic purposes.
10. All approach roads to the mine and all other roads which are in regular use are topped. Internal roads & other permanent haul roads in side mine are WBM roads.
11. Coal transportation is being done by tippers which are properly covered.
12. About 5000 samplings already planted in coal handling plant/siding area i.e at Govinda CHP/Siding area. In future plantation on OB dump area will be done. At present there is no area available for plantation. .However, during 2013-14 plantation will be done over infrastructure area for about 2000 saplings.
4.2 Water Pollution Control 4.2.1 Sources of Water pollution
Table-4.5
Sl No.
Parameters Pollution sources
1. Hydro-geological
Seepage or leachate of coal dump and OB dump affecting surface water as well as ground water
EIA/EMP of AMADAND OCP ( From 1.15 MTPA to 2.15 MTPA)
Page 30 of 50
4.2.2 Impact Assessment Table-4.6
Sl. No.
Parameters Impacts Assessment
1. Hydro-geological-Ground water 1.01 Topography
& Drainage Topography and drainage by developing micro basins
1.02 Aquifer geometry Changes in aquifer geometry, water level in the vicinity of the mine and disturb ground water flow direction. This can also create secondary fractures and higher permeability zones within the aquifer. After the mining activity, the aquifer restores its original water level and mined out area acts as a good reservoir. The project is deeper underground mine, the impact of mining activity on unconfined aquifer will be marginal to negligible extent in the deep dip.
1.03 Water levels . 2.00 Water Quality- Physico-Chemical and Bacteriological ones 2.01 Ground Water
Quality Ground water quality indicates that the groundwater in the area is potable and does not contain any toxic elements.
2.02 Surface Water Quality
Surface water test result indicates quality parameters are within permissible limits of prescribed standards.
4.2.3 Control Measures for Water Pollution A) Management of surface water drainage:- Garland drains have been made around the periphery of the quarry. These
garland drains are connected to the local nalla which is not likely to be disturbed by mining operation. In the workings, heavy duty pumps are deployed in rainy season which throws the accumulated water from the working face after treatment into these garland drains. As the extraction of the quarry advances, the position of garland drain will also advance. Thus these garland drains will drain off the rain water away from the workings.
2. Water quality 2.01 Ground water Seepage or leachate of coal dump and OB
dump rendering ground water contaminated with seepage or leachate of mine effluent with Total Suspended Solids (TSS).
2.02 Surface Water Mine water discharge, Workshop & coal handling discharge and Waste water discharged into surface water course without treatment and mine impoundments.
EIA/EMP of AMADAND OCP ( From 1.15 MTPA to 2.15 MTPA)
Page 31 of 50
About 2.50 Km kuchha drain of size 2.0 x 3.0 Metre has been excavated for channeling of surface run off water during rainy period costing about Rs 15.00 lakhs..The surface run off water is collected in settling pond and after settlement overflow water discharged to nearby nallah. The execution of work for catchments drain of about 1.50 Km length of average size of 2.30 x 3.50 metre amounting to Rs 40.00 lakhs is progress.
B) Mine Water Discharge & Industrial Effluent
1) Mine sump of 3600 Cum and 7200 Cum capacities has been established. 2) Settled mine effluent is being used for domestic & industrial consumption. 3) Settling tank to treat mine water has been commissioned. 4) Oil and grease trap is in operation for treating effluent water from HEMM
washing. After treatment, water is re-used for HEMM washing. 5) Mine sump will act as water recharge structure. 6) Settling ponds are provided for treating the mine water discharge as well
as OB dump run-off. C) Domestic Effluent Treatment:- There is no domestic effluent treatment plant. D) Water Conservation: - The waste water recycling after due treatment for the purpose mentioned
above will enable conservation of water. Storage of conserved water in mine pits will be given due emphasis to provide water round the year and quality of water will be maintained before and after storage. Also, properly constructed storm water drains have been maintained in the colony.
E) Water Quality Monitoring:- For complying with the statutory provision of MOEF and Pollution Control
Board, monthly water quality is being monitored and evaluated. Corrective measures whenever needed are taken on the basis of monitoring results.
F) Construction and maintenance of Catch drains (1.5 Km. length) around the active mine is being done. Check dams have been provided additionally in the catch drains.
4.3 Noise pollution Control 4.3.1 Sources of Noise pollution
Table-4.7 Sl
No. Parameters Pollution sources
1.00 Noise pollution Drilling and blasting in coal and overburden
2.00 Noise pollution Operation of HEMMs like shovel, dumper, dozer, excavator etc.
3.00 Noise pollution Operation of equipment in CHP, workshop etc
4.00 Noise pollution Coal transport and movement of vehicles
EIA/EMP of AMADAND OCP ( From 1.15 MTPA to 2.15 MTPA)
Page 32 of 50
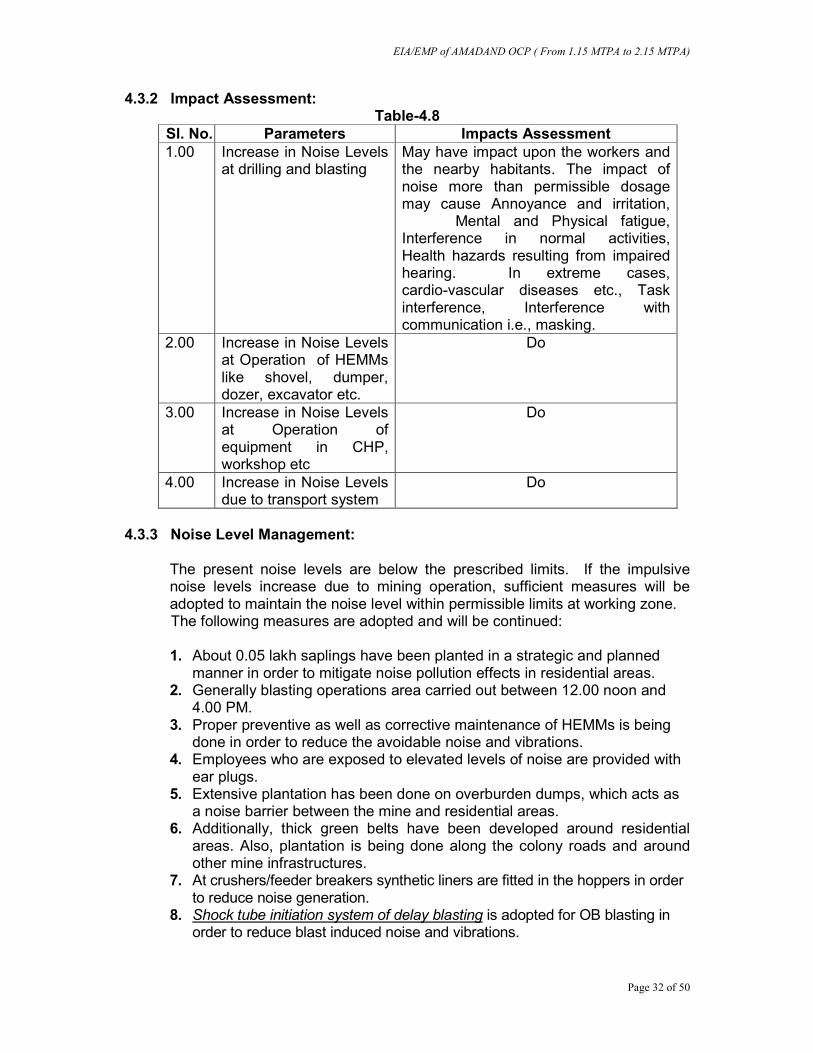
4.3.2 Impact Assessment: Table-4.8
Sl. No. Parameters Impacts Assessment 1.00 Increase in Noise Levels
at drilling and blasting May have impact upon the workers and the nearby habitants. The impact of noise more than permissible dosage may cause Annoyance and irritation, Mental and Physical fatigue, Interference in normal activities, Health hazards resulting from impaired hearing. In extreme cases, cardio-vascular diseases etc., Task interference, Interference with communication i.e., masking.
2.00 Increase in Noise Levels at Operation of HEMMs like shovel, dumper, dozer, excavator etc.
Do
3.00 Increase in Noise Levels at Operation of equipment in CHP, workshop etc
Do
4.00 Increase in Noise Levels due to transport system
Do
4.3.3 Noise Level Management: The present noise levels are below the prescribed limits. If the impulsive
noise levels increase due to mining operation, sufficient measures will be adopted to maintain the noise level within permissible limits at working zone.
The following measures are adopted and will be continued:
1. About 0.05 lakh saplings have been planted in a strategic and planned manner in order to mitigate noise pollution effects in residential areas.
2. Generally blasting operations area carried out between 12.00 noon and 4.00 PM.
3. Proper preventive as well as corrective maintenance of HEMMs is being done in order to reduce the avoidable noise and vibrations.
4. Employees who are exposed to elevated levels of noise are provided with ear plugs.
5. Extensive plantation has been done on overburden dumps, which acts as a noise barrier between the mine and residential areas.
6. Additionally, thick green belts have been developed around residential areas. Also, plantation is being done along the colony roads and around other mine infrastructures.
7. At crushers/feeder breakers synthetic liners are fitted in the hoppers in order to reduce noise generation.
8. Shock tube initiation system of delay blasting is adopted for OB blasting in order to reduce blast induced noise and vibrations.
EIA/EMP of AMADAND OCP ( From 1.15 MTPA to 2.15 MTPA)
Page 33 of 50
9. Introduction of surface miners has reduced the requirement for drilling and blasting operations and further crushing at in-pit and surface crushers, thus reducing the noise and vibration levels.
10. High capacity machines are to be deployed in the mining & transportation operations. These will ensure reduced number of vehicular trips, thereby reducing noise levels.
11. Lined chutes in Silo to reduce noise. 12. Regular monitoring of noise level of project area.
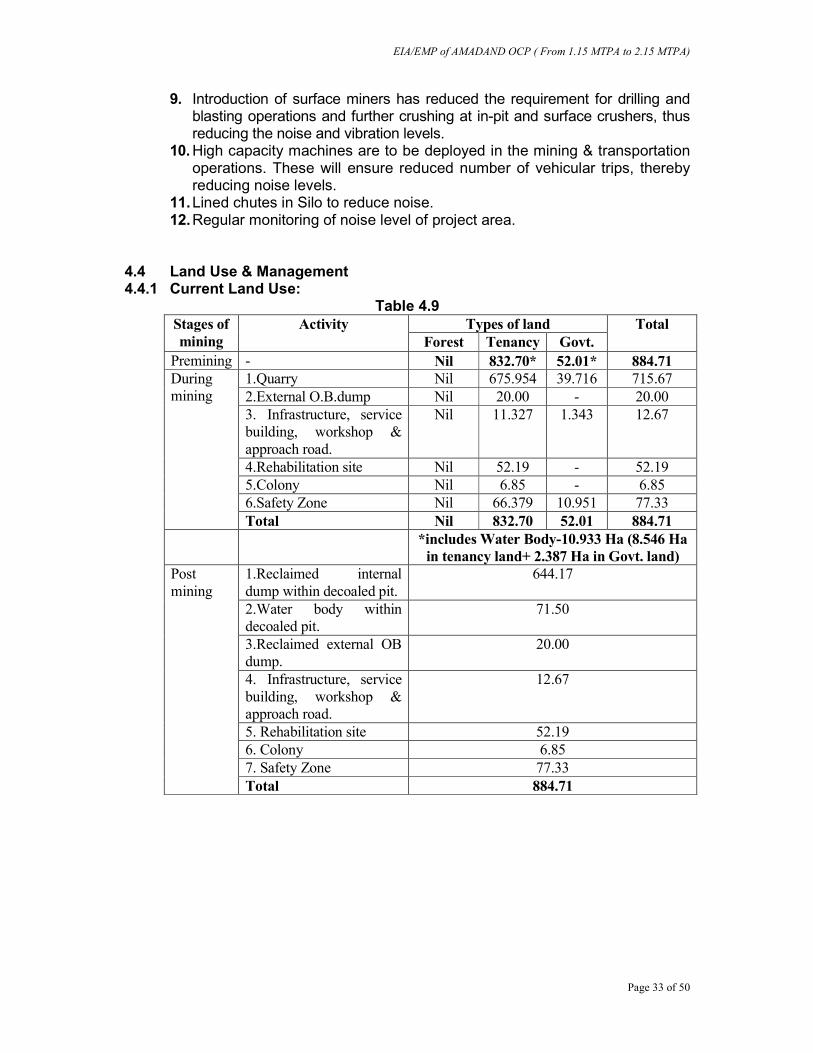
4.4 Land Use & Management 4.4.1 Current Land Use:
Table 4.9 Stages of mining
Activity Types of land Total Forest Tenancy Govt.
Premining - Nil 832.70* 52.01* 884.71 During mining
4.Rehabilitation site Nil 52.19 - 52.19 5.Colony Nil 6.85 - 6.85 6.Safety Zone Nil 66.379 10.951 77.33 Total Nil 832.70 52.01 884.71
*includes Water Body-10.933 Ha (8.546 Ha in tenancy land+ 2.387 Ha in Govt. land)
Post mining
1.Reclaimed internal dump within decoaled pit.
644.17
2.Water body within decoaled pit.
71.50
3.Reclaimed external OB dump.
20.00
4. Infrastructure, service building, workshop & approach road.
12.67
5. Rehabilitation site 52.19 6. Colony 6.85 7. Safety Zone 77.33 Total 884.71
EIA/EMP of AMADAND OCP ( From 1.15 MTPA to 2.15 MTPA)
Page 34 of 50
4.4.2 Details of additional land requirement:
Table – 4.10
Activity For existing
Addl. Land required for incremental production
Total land required for enhanced production
1.15 MTPA.
1 MTPA. 2.15 MTPA.
1.Quarry 715.67 Nil 715.67
2.External O.B.dump 20.00 Nil 20.00
3. Infrastructure, service building, workshop & approach road.
12.67 Nil 12.67
4.Rehabilitation site 52.19 Nil 52.19
5.Colony 6.85 Nil 6.85
6.Safety Zone 77.33 Nil 77.33
Total 884.71 Nil 884.71 4.4.3 Land acquisition details:
Total requirement 833 Ha. Total acquired till date: 699.942 Ha. Total land exists under CBA Act. 699.942 Ha Tenancy land has been acquired (Surface rights) under LA Act on
01/07/2006. 60 Ha Govt. Land Application was submitted on 31st August, 2003 to State
Govt.
4.4.4 Socio-Economic Issues:
The project is located in a highly industrialized area of Anuppur district. A number of mines opencast and several underground mines of SECL and their colonies are situated in the study area. This has led to creation of social infrastructures like schools, hospitals, roads, etc which have helped in the economic development of the region. The project has already given a boost to the economy of the area by providing primary and secondary employment to local people. The infra-structural facilities provided by the project are benefitting local villagers also. The enhancement of capacity of the project will further help in development of region through CSR activities and creation of direct and indirect employment. A summarized data of civic facilities available in the area is as follows (as per Census data 2001):
EIA/EMP of AMADAND OCP ( From 1.15 MTPA to 2.15 MTPA)
2 MEDICAL FACILITIES Allopathic Hospital(ALL HOSP) Maternity & Child Welfare Centre Public Health Centre Primary Health Sub-Centre Community Health Workers
1 29 6 - -
14 5 21 05 11
10 3 28 - -
3 POWER SUPPLY Elect. for Domestic Use(ED) Elect. of Agri.Use(EAGR) Elect. of other purpose(EO)
Elect. For All purpose
29 5 4 32
- - -
- - -
4 DRINKING WATER Tap Water(T) Well Water(W) Tank Water(TK) Tube Well Water (TW) Hand Pump(HP) River Water(R) Canal (C)
Lake(L)
10 62 7 3 58 5 - -
- - - - - - - -
5 COMMUNICATION Bus Services(BS) Railway Services(RS)
7 POST AND TELEGRAPHS Post Office(PO) Telephone Connection(PHONE)
30 07
26 28
02 23
8 RECREATIONAL & CULTURAL FECILITIES Cinema/Video Hall(CV)
07
21
30
EIA/EMP of AMADAND OCP ( From 1.15 MTPA to 2.15 MTPA)
Page 36 of 50
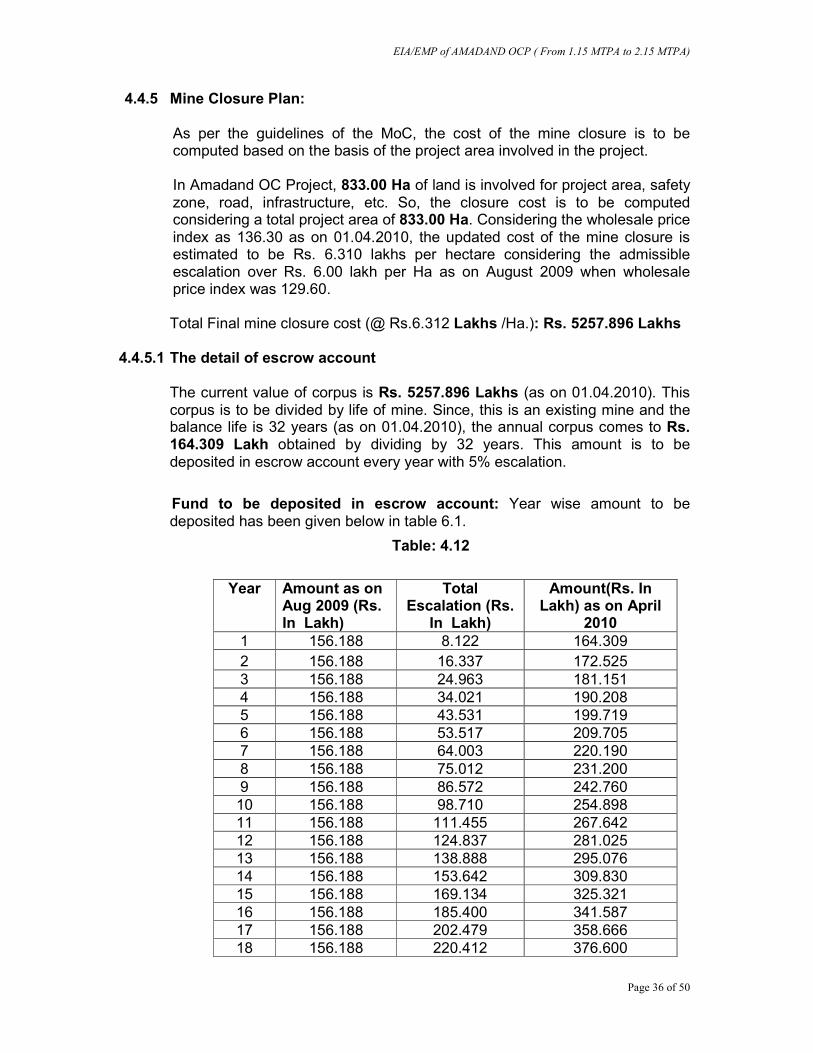
4.4.5 Mine Closure Plan: As per the guidelines of the MoC, the cost of the mine closure is to be computed based on the basis of the project area involved in the project. In Amadand OC Project, 833.00 Ha of land is involved for project area, safety zone, road, infrastructure, etc. So, the closure cost is to be computed considering a total project area of 833.00 Ha. Considering the wholesale price index as 136.30 as on 01.04.2010, the updated cost of the mine closure is estimated to be Rs. 6.310 lakhs per hectare considering the admissible escalation over Rs. 6.00 lakh per Ha as on August 2009 when wholesale price index was 129.60.
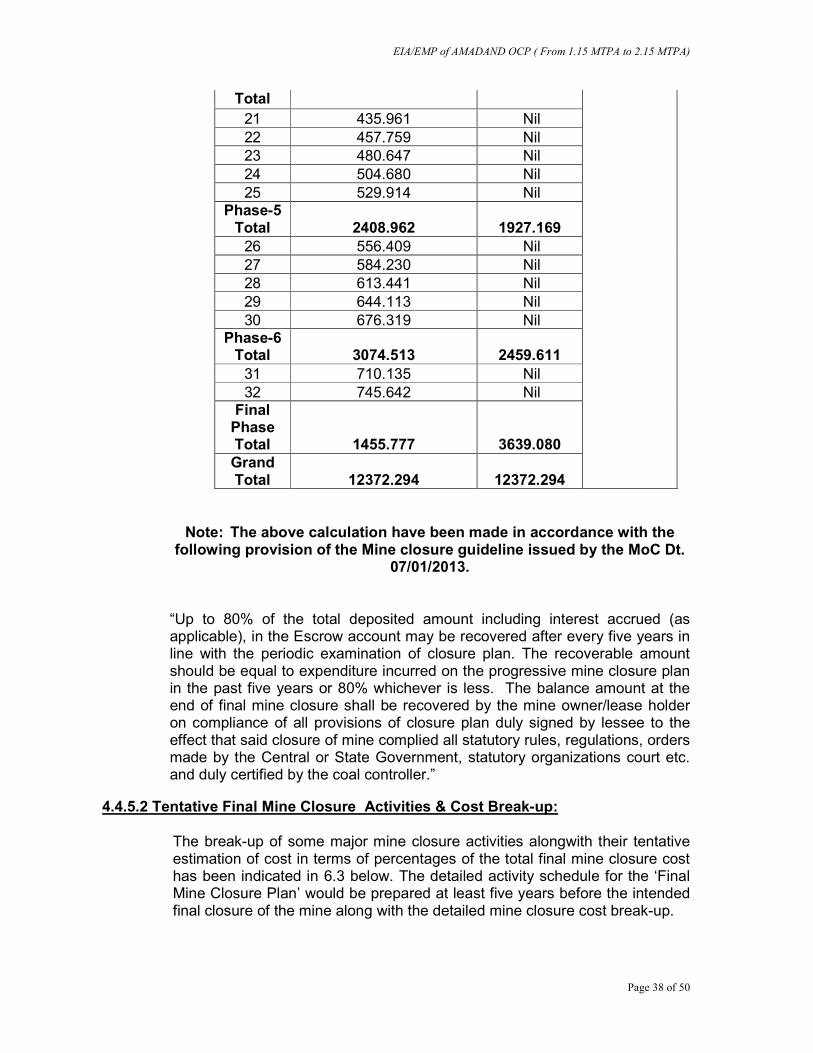
Total Final mine closure cost (@ Rs.6.312 Lakhs /Ha.): Rs. 5257.896 Lakhs
4.4.5.1 The detail of escrow account
The current value of corpus is Rs. 5257.896 Lakhs (as on 01.04.2010). This corpus is to be divided by life of mine. Since, this is an existing mine and the balance life is 32 years (as on 01.04.2010), the annual corpus comes to Rs. 164.309 Lakh obtained by dividing by 32 years. This amount is to be deposited in escrow account every year with 5% escalation.
Fund to be deposited in escrow account: Year wise amount to be deposited has been given below in table 6.1.
Final Phase Total 1455.777 3639.080 Grand Total 12372.294 12372.294
Note: The above calculation have been made in accordance with the following provision of the Mine closure guideline issued by the MoC Dt.
07/01/2013.
“Up to 80% of the total deposited amount including interest accrued (as applicable), in the Escrow account may be recovered after every five years in line with the periodic examination of closure plan. The recoverable amount should be equal to expenditure incurred on the progressive mine closure plan in the past five years or 80% whichever is less. The balance amount at the end of final mine closure shall be recovered by the mine owner/lease holder on compliance of all provisions of closure plan duly signed by lessee to the effect that said closure of mine complied all statutory rules, regulations, orders made by the Central or State Government, statutory organizations court etc. and duly certified by the coal controller.”
4.4.5.2 Tentative Final Mine Closure Activities & Cost Break-up:
The break-up of some major mine closure activities alongwith their tentative estimation of cost in terms of percentages of the total final mine closure cost has been indicated in 6.3 below. The detailed activity schedule for the ‘Final Mine Closure Plan’ would be prepared at least five years before the intended final closure of the mine along with the detailed mine closure cost break-up.
EIA/EMP of AMADAND OCP ( From 1.15 MTPA to 2.15 MTPA)
Page 39 of 50
Table 4.14
TENTATIVE MINE CLOSURE ACTIVITIES & COST BREAK-UP Type of mine: Open cast Production Capacity: 1.15 MTPA Mining Lease Area: 833.00. Depth of the mine: 33.65 m
Sl. No.
Major Closure Activities Quantity % of Total Closure Cost
A Dismantling of Structures
Service Buildings 0.20 Residential Buildings, 2.67 Industrial Structures i.e. workshop complex, 33kv/3.3kv Sub-Station, Unit Stores, Security Barrack
0.30
B
Permanent fencing of mine void & other dangerous areas
Random rubble masonry of height 1.2m including levelling up in cement concrete 1:6:12 in mud mortar.
1.50
C Grading of highwall slopes Levelling & grading of highwall slopes 1.77
D OB Dump Reclamation
Handling/Dozing of external OB dump into mine void.
86.66
Bio-reclamation including soil spreading, plantation & maintenance.
0.00
E Landscaping
Landscaping of the cleared land for improving its esthetic
1.60
F Plantation
Plantation over area obtained after dismantling.
0.50
Plantation around fencing 0.20 Plantation over the cleared off external OB dump.
0.00
G
Monitoring / testing of environmental parameters for three years.
Air quality 0.22 Water quality 0.20
H
Entrepreneurship development (vocational and skill development training for sustainable income of affected people)
0.26
I Miscellaneous & other mitigative measures
3.12
J Manpower Cost for supervision 0.80 Total (%) 100.00
NOTE: The above cost expenditure will be met from the corpus escrow account
deposited by the mine operator. In case of mines having acid mine
EIA/EMP of AMADAND OCP ( From 1.15 MTPA to 2.15 MTPA)
Page 40 of 50
drainage, post closure acid mine drainage management cost shall also be included in the total closure cost.
However, the additional amount beyond the escrow account will be provided by the mine operator after estimating the final mine closure cost five years prior to mine closure (as per the mine closure guideline).
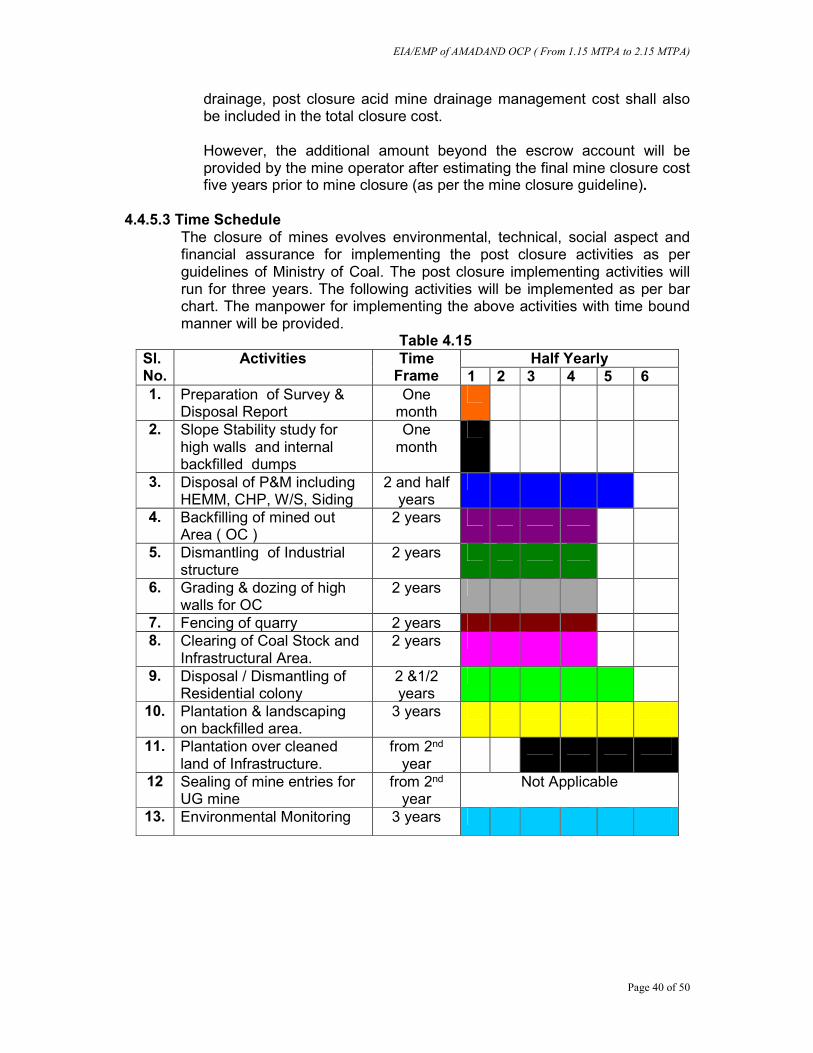
4.4.5.3 Time Schedule
The closure of mines evolves environmental, technical, social aspect and financial assurance for implementing the post closure activities as per guidelines of Ministry of Coal. The post closure implementing activities will run for three years. The following activities will be implemented as per bar chart. The manpower for implementing the above activities with time bound manner will be provided.
Table 4.15 Sl. No.
Activities Time Frame
Half Yearly 1 2 3 4 5 6
1. Preparation of Survey & Disposal Report
One month
2. Slope Stability study for high walls and internal backfilled dumps
One month
3. Disposal of P&M including HEMM, CHP, W/S, Siding
2 and half years
4. Backfilling of mined out Area ( OC )
2 years
5. Dismantling of Industrial structure
2 years
6. Grading & dozing of high walls for OC
2 years
7. Fencing of quarry 2 years 8. Clearing of Coal Stock and
Infrastructural Area. 2 years
9. Disposal / Dismantling of Residential colony
2 &1/2 years
10. Plantation & landscaping on backfilled area.
3 years
11. Plantation over cleaned land of Infrastructure.
from 2nd year
12 Sealing of mine entries for UG mine
from 2nd year
Not Applicable
13. Environmental Monitoring 3 years
EIA/EMP of AMADAND OCP ( From 1.15 MTPA to 2.15 MTPA)
Page 41 of 50
4.4.5.4 IMPLEMENTATION PROTOCOL
For implementing the mine closure activities, the following organizational structure has been proposed:
Table 4.16 Director (Tech.)
Environmental monitoring for three years after closure of mine will be carried out to evaluate the environmental quality of the area. If required, proper mitigation measures will be taken up after evaluating the environmental quality. The funds for this have been provided in the cost estimate. Before closure of the mine, Area GM will prepare survey and disposal report and the same will be submitted to DGMS for acceptance.
The mine closure activity is likely to significantly reduce the impact of industrial activity on the land apart from increasing the green cover and surface water availability. Moreover, before final mine closure, provision of vocational and skill development training to the affected persons due to mine closure, would be made for continuance / sustenance of income level. Civic amenities will also be available as the infrastructure for same will be handed over after mine closure to State Government for future use of society.
CGM (P&P) CGM /GM (Area)
Land reclamation & Employee Redistribution
Disposal of plant & machinery, CHP, Workshop etc.
Project Manager/Sub Area Manager
Plantation & dismantling of civil structures, environmental monitoring
Area Engineer (E&M)
Area Civil Engineer
Monitoring & Overall co- coordination
EIA/EMP of AMADAND OCP ( From 1.15 MTPA to 2.15 MTPA)
Page 42 of 50
5.0 Resettlement & Rehabilitation of PAPs The coal bearing area of Amadand OCP involves displacement of total number
of families as 575.These families would be shifted / resettled in the rehabilitation site located south of village Payari and Darsagar where 52.19 Ha. Of Tenancy land has to be acquired. The total no. of land losers are likely to be 1100. The land losers will be given economic compensation and jobs in the project or in new coming projects as per the rehabilitation norms of M.P.State Government which is given below.
b.Adult in the family shall be treated as separate family
2. Date of application Date of notification of sec4(1); of LA Act for proposal
3. Eligibility Families whose a. Total land is acquired b. 1/3rd Agri. Land + household land c. Only homestead land d. PAPs living without Home
4. Employment benefits On Acq. Of land benefits of EMPLOYMENT – As below a. Homestead L+1/3rd Agr. Land 1/fam 1st Priority b. 3 Ac(NEL) or 2Ac(EL) 1/fam 2nd priority c. total land or & Homestead Land. 1/fam 3rd priority d. 2/3 Agr. Land
1. 1 Family as/ AVAILABILITY
2. Voc Trg. Shall be given by SECL to regenerate their income by Self EMPLOYMENT SCHEMES.
5 .Resettlement facilities to
Homestead families
10 Dec./Family
6. Other facilities
7. Monetary Assistance
CIVIC AMENITIES PROVIDED BY SECL
1. Road 6. Monoranjan 2.Street light 7.Ponds/Well 3. School 8. Playground/park 4. Health Centre 9. Shopping centre 5. Drinking Water Facts
A) Rs. 2500/- per family
EIA/EMP of AMADAND OCP ( From 1.15 MTPA to 2.15 MTPA)
Page 43 of 50
8. Special Condition
B) Landless, homeless persons losing earning because of acquisition of land will be accessed by the Jt. Committee (SECL & MP GOVT ) for alternative source of income under self Dev. Employment scheme through vocational training
Scheme can be revised with mutual discussion with
SECL
Rehabilitation of the families from the core zone shall be carried out as per State Govt.norms & Coal India policy. Process of allotment of land for R&R site is under process. 575 families will be shifted to R&R site. Programme for rehabilitation of families will be started from 2015-16 onwards. Availability of Land for R&R site has not been materialized till date.
Conditions/Suggestions received from District Collector regarding amenities and facilities to be provided in R & R site while providing sanction of R & R plan as per M.P. govt R & R Package: 1. Drinking water:1 hand pump per 150 population , total provision : 20
hand pump 2. School building: 2 school building to be built 3. Aaaganwadi:Provision of 3 Aaaganwadi bhawan 4. Panchayat Bhawan/Community Bhawan: As per plan 5. Hospital: Health centre with proper facilities 6. Crematory ghat: provision of Crematory ghat and shed near Kewai
river and nearby nallah. 7. Jobs/Compensation: as per M .P. Govt. R & R package rules.
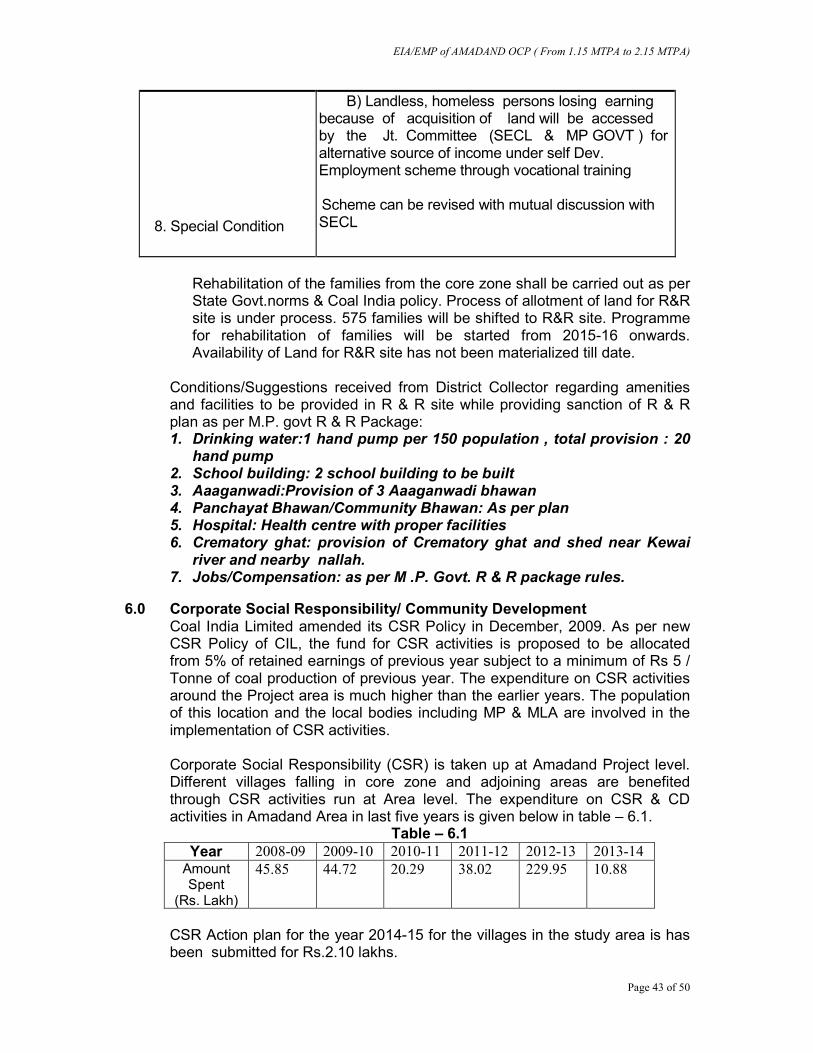
6.0 Corporate Social Responsibility/ Community Development Coal India Limited amended its CSR Policy in December, 2009. As per new CSR Policy of CIL, the fund for CSR activities is proposed to be allocated from 5% of retained earnings of previous year subject to a minimum of Rs 5 / Tonne of coal production of previous year. The expenditure on CSR activities around the Project area is much higher than the earlier years. The population of this location and the local bodies including MP & MLA are involved in the implementation of CSR activities.
Corporate Social Responsibility (CSR) is taken up at Amadand Project level. Different villages falling in core zone and adjoining areas are benefited through CSR activities run at Area level. The expenditure on CSR & CD activities in Amadand Area in last five years is given below in table – 6.1.
Table – 6.1 Year 2008-09 2009-10 2010-11 2011-12 2012-13 2013-14
Amount Spent
(Rs. Lakh)
45.85 44.72 20.29 38.02 229.95 10.88
CSR Action plan for the year 2014-15 for the villages in the study area is has been submitted for Rs.2.10 lakhs.
EIA/EMP of AMADAND OCP ( From 1.15 MTPA to 2.15 MTPA)
Page 44 of 50
7.0 Details of Last Public Hearing
The last public hearing for approval of 1.15 MTPA project was held on 23/08/1999 at the project site. The meeting was chaired by SDM Anuppur and was attended by other local populations. Public hearing Panel chaired by & members present: Chairman & Members: (i) Shri M.R. Upadhyay, SDM Anuppur (ii) Shri R.S Parihar, RO, MPPCB, Rewa (iii) Shri S.B. Tiwari, SRO, MPPCB, Amlai (iv) Shri J.P. Singh, Dy.Director(T&C), Shahdol Public Representatives: (v) Shri Jagdish Prasad Gupta, Parshad, Nagar Palika, Anuppur (vi) Shri Ramvilas Mishra, Advo., Gram Jamui, Dist. Shahdol
Issues raised by the Public
Response / Commitment of Project Proponents
Suggestions made by the Public Hearing Panel
Drinking water availability in case of decrease in water table
Supply of drinking water is being done in nearby villages
Provision to be made along with opening of the mine
Plantation around mine to reduce dust
The proposal will be consideredFruit bearing trees should be planted which will provide benefits to the people of the area
Development of civic Amenities.
The proposal will be considered
Provision of civic amenities should also be provided to those villages which may be indirectly affected
Cutting on local nala for Irrigation.
The proposal will be considered
Water sprinkling to control dust.
The proposal will be implemented
Economic compensation To land losers & rehabilitation of project affected families.
The proposal will be implemented
EIA/EMP of AMADAND OCP ( From 1.15 MTPA to 2.15 MTPA)
Page 45 of 50
8.0 Analysis of Alternatives Not applicable, as this is an enhancement of capacity of project of existing opencast mine.
9.0 Environmental Monitoring Program
For effective implementation, a time bound action plan for environmental management including all aspects isl being followed by the project. Samples for study of air quality, water quality, ground water level and noise level are collected and tested quarterly at strategic places representing all the categories of location.
10.0 Project Benefits
Development of Amadand OCP has considerably improved the socio-economic status of the adjoining areas. This has resulted in following benefits: Improvements in Physical Infrastructure Improvements in Social Infrastructure Increase in Employment Potential Contribution to the Exchequer Meet energy requirement Post-mining Enhancement of Green Cover
11.0 Environmental Management Plan South Eastern Coalfields Limited, the owner of this project has already set-up
an Environmental Cell headed by a Chief General Manager at its HQs. The cell provides necessary support that is required for Environmental Management of various projects and mines under the jurisdiction of the company.
EIA/EMP of AMADAND OCP ( From 1.15 MTPA to 2.15 MTPA)
Page 46 of 50
ORGANISATION CHART FOR ENVIRONMENT MANAGEMENT
(Amadand OC PROJECT)
DIRECTOR TECHNICAL (P&P)
GENERAL MANAGER CHIEF GENERAL MANAGER
(WBP/ENVT./FORESTS) (Jamuna and Kotma AREA) AREA MANAGER(P&P) NODAL OFFICER(ENV.) PROJECT OFFICER (AMADAND OC MINE)
ENVIRONMENT WATER TANKER GENERAL MAZDOOR SUPERVISOR OPERATOR GARDENER
EIA/EMP of AMADAND OCP ( From 1.15 MTPA to 2.15 MTPA)
Page 47 of 50
11.1 Cost of Environmental Control Measures
The environmental budget (Capital) is given in table – 11.1 and the details of estimated annual expenditure on environment protection are given in table – 11.2.
STATEMENT SHOWING ESTIMATED CAPITAL REQUIREMENT TOWARDS ENVIRONMENTAL MANAGEMENT & MITIGATIVE MEASURES Total no of families to be rehabilitated - 575
Total no. of land oustees - 1100 ( As per Project Report , August, 2003)
Table – 11.1: CAPITAL ESTIMATE (Amount in Rs. Lakhs)
Sl.No.
Particulars Amount according to PR for
1.15 MTPA.
(in Rs in lakhs)
Additional Amount (1.15 to
2.15 MTPA)
(in Rs in lakhs)
Total
(in Rs in
lakhs)
1. REHABILITATION
A. For sanctioned PR (1.15 MTPA ) quarry area
a) Compensation to the families for rehabilitation @ Rs 50,000/- per family
287.50 nil 287.50
b) House building grant @ 30000 per family for 575 families.
172.50 nil 172.50
c) Shifting charges @ Rs 20,000/- per family for 575 families.
11.50 nil 11.50
d) School, hospital, roads, etc. in rehabilitation colony
10.00 nil 10.00
e) Subsistence allowance to 220 land oustees (Rs 400/- per person for 20 years.
211.20 nil 211.20
Sub total of (1) 692.70 nil 692.70 2. CAPITAL FOR RESTORATION A. For sanctioned PR(1.15 MTPA)
quarry area
a) Housing for Reclamation personnel(for 41 persons)
18.28 nil 18.28
Sub total of (2) 18.28 nil 18.28 3. CAPITAL FOR
ANTI-POLLUTION MEASURE IN MINE & INDUSTRIAL AREA
a) Water sprinklers (28KL) 6.42 475.68 (4 no. of 28
482.10
EIA/EMP of AMADAND OCP ( From 1.15 MTPA to 2.15 MTPA)
Page 48 of 50
Sl.No.
Particulars Amount according to PR for
1.15 MTPA.
(in Rs in lakhs)
Additional Amount (1.15 to
2.15 MTPA)
(in Rs in lakhs)
Total
(in Rs in
lakhs)
KL ) Cost as
of Feb, 2014 b) Settling tank for mine water
disposal 6.00 nil 6.00
c) Sewage disposal arrangement in workshop effluent
34.53 nil 34.53
d) Other development measures in industrial site viz. drains, tree guards etc.
0.00 nil 0.00
e) Water treatment plant for drinking water
0.00 nil 0.00
f) Garland drains 3.00 nil 3.00 g) Arboriculture/plantation in industrial
area 5.00 nil 5.00
h) Dust Suppression arrangement at CHP
4.80 nil 4.80
i) Fixed Water Sprinkler ------ 30.00 30.00 Sub total of (3) 59.75 505.68 565.43 4. ENVIRONMENTAL CONTROL
MEASURE IN TOWNSHIP
a) Sewerage disposal in colony 29.66 nil 29.66 b) Storm water drains 7.56 nil 7.56 c) Aboriculture/plantation 5.00 nil 5.00 d) Other development measures in
township to improve cleanliness &aesthetics parks-playground & tree guards
2.83 nil 2.83
e) Green Belt in & around mine ------ 20.00 20.00 Sub total of (4) 45.05 20.00 65.05 5. COMMUNITY DEVELOPMENT a) Community Development 10.00 nil 10.00 6. ENVIRONMENTAL
MONITORING
a) EMP preparation 10.00 50.00 60.00 b) Steps for prevention of possible
mine inundation if any 10.00 nil 10.00
GRAND TOTAL ( 1 to 6) 845.78 575.68 1421.46
EIA/EMP of AMADAND OCP ( From 1.15 MTPA to 2.15 MTPA)
Page 49 of 50
Table – 11.2- Revenue cost for Environmental Protection
Sl. No.
Particulars of costs Amount
according to PR for
1.15 MTPA. (in
Rs in lakhs)
Additional Amount (1.15 to
2.15 MTPA)
(in Rs in
lakhs)
Total
(in Rs in
lakhs)
1 Land Reclamation/restoration @ 1.25 lakhs/Ha for technical and biological reclamation (21.5 Ha/annum)
26.87 it is covered in Mine Closure cost- Rs 164.3 lakh (for 1st year i.e. 2010)
26.87
2 Statutory costs a. Environmental Audit @ 0.20 Lakh
per annum 0.20 0.40 0.60
b. Environmental monitoring @ 2.50 Lakh per annum
2.50 7.5 10.00
3 CSR Expenditure *@ Rs 5/tonne
50.00* @ Rs
5/tonne for addl. 1 MT
50.00
4 Monitoring of Land Use through Satellite surveillance
--- 8.00 8.00
5 Regular Monitoring of CSR , R&R plan and Mine Closure Plan
--- 2.00 2.00
6 Consent fee --- 3.00 3.00 Total 29.57 70.9 100.47
* CSR provision is subject to CIL norms i.e. 5% of net profit or at least Rs 5.00
per tonne of coal production. 12.0 Disclosure of Consultants
Environmental baseline data was taken from Routine Environmental Monitoring done by CMPDI on behalf of SECL from October to December, 2013 for air, water and noise quality. The detail of consultants employed for different studies is given below.
Table – 12.1
Sl. No.
Nature of Study Name of the Agency
1 Geological Report
CMPDI, a subsidiary of Coal India Ltd., is a premier consultancy organization engaged in mineral exploration, land resource management through remote sensing survey, coal
2 Project report
EIA/EMP of AMADAND OCP ( From 1.15 MTPA to 2.15 MTPA)
Page 50 of 50
3 Land-use study petrography, mine planning, coal preparation & utilization, design of coal handling plants, environmental management of coal projects etc. The environmental laboratory of CMPDI is recognized by SECL, Pollution Control Board, Ministry of Environment & Forests, Govt. of India and accredited with ISO-9001 certification. It undertakes baseline environmental data generation, EIA, EMP and monitoring various factors related environment. It has obtained NABL Accreditation {Certificate No.-T-2968}