70
KACTS Long Range Transportation Plan - 2010-2035 - Page i -
| Date post: | 27-Jul-2015 |
| Category: |
Government & Nonprofit |
| Upload: | smpdc |
| View: | 47 times |
| Download: | 0 times |
KACTS Long Range Transportation Plan - 2010-2035 - Page i -
________________________________________________________________
KACTS Long Range Transportation Plan - 2010-2035 - Page i -
I. INTRODUCTION .................................................................................................................... 1
INTRODUCTION ............................................................................................................. 1
THE KACTS REGION...................................................................................................... 2
MEMBERSHIP .................................................................................................................. 7
THE PLANNINGPROCESS ............................................................................................ 8
FEDERAL REQUIREMENTS ........................................................................................ 10
AIR QUALITY CONFORMITY .................................................................................... 11
STATE REQUIREMENTS .............................................................................................. 12
THE PUBLIC PROCESS ................................................................................................. 13
II. LONG RANGE TRANSPORTATION PLAN ..................................................................... 13
POLICIES ......................................................................................................................... 13
IMPLEMENTATION STRATEGIES ............................................................................ 14
III. APPENDICES
A. TRANSPORTATION CHARICTERISTICS AND TRENDS ....................................... 17
EXISTING ROADWAY NETWORK ............................................................................ 17
- NETWORK DEFICIENCIES ........................................................................... 20
- BRIDGES ............................................................................................................ 21
- BICYCLE AND PEDESTRIAN INFRASTRUCTURE ................................. 22
- NETWORK SAFETY AND SECURITY ......................................................... 23
- SAFETY .............................................................................................................. 24
- SECURITY ......................................................................................................... 26
- INTELLIGENT TRANSPORTATION SYSTEMS (ITS) ............................... 27
TRAVEL DEMAND MANAGEMENT (TDM) .......................................................... 28
- RIDESHARING SYSTEMS .............................................................................. 28
- PUBLIC TRANSPORTATION SYSTEMS ..................................................... 28
-INTERSTATE BUS AND VAN TRANSPORTATION SYSTEMS .............. 30
FREIGHT .......................................................................................................................... 34
- PASSENGER RAIL ........................................................................................... 34
- FREIGHT RAIL ................................................................................................. 34
- AIR SERVICES .................................................................................................. 39
- MARINE FACILITIES ..................................................................................... 39
B. SOCIO-ECONOMIC TRENDS ...................................................................................... 42
POPULATION GROWTH TRENDS ........................................................................... 42
DISADVANTAGED POPULATIONS ......................................................................... 45
TABLE OF CONTENTS
________________________________________________________________
KACTS Long Range Transportation Plan - 2010-2035 - Page ii -
HOUSING TRENDS ....................................................................................................... 47
TRANSPORTATION AND COMMUTING TRENDS .............................................. 49
TRAFFIC PATTERNS .................................................................................................... 53
MAJOR EMPLOYERS .................................................................................................... 57
C. FUNDING SUMMARY AND FISCAL CONSTRAINT .............................................. 61
MPO CAPITAL IMPROVEMENT FUNDING FORMULA ..................................... 62
-DISTRIBUTION FORMULA FOR NHS FUNDS .......................................... 62
- DISTRIBUTION FORMULA FOR STP FUNDS ........................................... 63
D. FOR MORE INFORMATION ........................................................................................ 66
E. FIGURES
1. KACTS MEMBERSHIP .......................................................................................................... 8
2. PLANNING FACTORS MANDATED BY SAFETEA-LU .............................................. 10
3. POLICY OBJECTIVES MANDATED BY STPA ............................................................... 12
4. KACTS PUBLIC PARTICIPATION ACTIVITIES ............................................................ 13
5A.KACTS POLICIES - GOALS AND OBJECTIVES ............................................................ 15
5B.KACTS POLICIES – GOALS AND OBJECTIVES (continued) ....................................... 16
6. YCCAC SOUTH COUNTY URBAN TRIPS, FY 1998-2004 ............................................ 32
7. TONS OF MATERIAL LOADED BY COMMODITY, 2002 ............................................ 39
8. TONS OF MATERIAL DISCHARGED BY COMMODITY, 2002 .................................. 40
9. POPULATION OF KACTS TOWNS, 1970-2000 .............................................................. 43
10. PERCENT OF TOTAL KACTS POPULATION BY TOWN, 1970 & 2000 .................... 44
11. NUMBER OF HOUSING UNITS IN KACTS AREA, 1980-2000 ................................... 48
12. BUILDING PERMITS ISSUES IN KACTS TOWNS, 1990-2002 ..................................... 49
13. MEANS OF TRANSPORTATION TO WORK, 1990 & 2000 .......................................... 50
14. CARPOOLING IN THE KACTS AREA, 2000 .................................................................. 51
15. PERCENT OF TOTAL HOUSING UNITS IN KACTS TOWNS
BY VEHICLES AVAILABLE, 1960-2000...................................................................... 52
16. TRAVEL TIME TO WORK IN KACTS AREA (ONE WAY), 1990 & 2000 ................... 53
17. AVERAGE ANNUAL DAILY TRAFFIC NORTH AND SOUTH
ON INTERSTATE 95 AT NH BORDER. 1973-2001 ................................................... 54
18. AVERAGE DAILY TRAFFIC NORTH AND SOUTH BY MONTH ON
INTERSTATE 95 AT NH BORDER .............................................................................. 55
19. NAVAL SHIPYARD AVERAGE ANNUAL EMPLOYMENT, 1989-2002 ................... 59
________________________________________________________________
KACTS Long Range Transportation Plan - 2010-2035 - Page iii -
F. TABLES
1. FUNCTIONAL HIGHWAY CLASSIFICATION IN KACTS AREA ............................. 18
2. MAJOR HIGHWAYS IN KACTS AREA ........................................................................... 18
3. ROUTE 236 LEVEL OF DATA SERVICE .......................................................................... 25
4. HIGH CRASH LOCATIONS IN KACTS AREA, 2006-2008 .......................................... 25
5. HISTORICAL CRASH TRENDS IN KACTS AREA, 1996-2008 .................................... 25
6. RECENT FUNDING FOR KACTS PUBLIC TRANSIT ................................................... 31
7. COAST BOARDINGS IN BERWICK, FY 2007-2010 ........................................................ 33
8. SHIPMENTS BY WEIGTH, 2002 AND 20035 ................................................................... 35
9. TOP COMMODITIES BY WEIGHT, 2002 ......................................................................... 35
10. TOP TRADING PARTNERS FOR MAINE, 2002 ............................................................. 36
11. POPULATION GROWTH IN KACTS TOWNS, 1970-2000 ........................................... 42
12. KACTS POPULATION PROJECTIONS TO 2020 ............................................................ 44
13. POPULATION LIVING IN POVERTY, 1989 & 1999 ...................................................... 46
14. HOUSING AFFORDABILITY INDEX FOR KACTS TOWNS ....................................... 47
15. MEANS OF TRANSPORTATION TO WORK IN KACTS AREA, 1990 & 2000 ......... 50
16. AVERAGE ANNUAL NUMBER OF VEHICLES BY CLASSIFICATION
ON INTERSTATE 95 AT NH BORDER, 2000-2003 ................................................... 55
17. HIGHWAY COUNT LOCATIONS IN KACTS AREA WITH AVERAGE
ANNUAL DAILY TRAFFIC (AADT) GREATER THAN 10,000 ............................. 56
18. RECENT AADT INCREASES GREATER THAN 500 IN KACTS AREA .................... 57
19. TOP 5 WORK COMMUTING DESTINATIONS BY KACTS RESIDENTS, 2000 ........ 58
20. MAJOR EMPLOYERS IN KACTS TOWNS (>50 EMPLOYEES) ................................... 60
21. HIGHWAY AND TRANSIT REVENUE V. COST, 2003-2025 ....................................... 65
G. MAPS
1. KACTS CAPITAL IMPROVEMENT AREA & PLANNING AREA ................................ 4
2. KACTS CAPITAL IMPROVEMENT AREA (NORTHERN PORTION) ......................... 5
3. KACTS CAPITAL IMPROVEMENT AREA (SOUTHERN PORTION) .......................... 6
4. MAINE OZONE MAINTENANCE AREAS ..................................................................... 11
5. MAINE FREIGHT SYSTEM ................................................................................................ 37
6. PERCENTAGE OF MINORITIES BY CENSUS BLOCK, 2000 ........................................ 45
7. PERCENTAGE OF POPULATION LIVING IN POVERTY
BY CENSUS BLOCK, 1999 ............................................................................................ 46
________________________________________________________________
KACTS Long Range Transportation Plan - 2010-2035 - Page 1 -
As a condition for receiving and spending Surface Transportation Program funds from
the Federal Highway Administration (FHWA), Federal law requires that urbanized
regions with 50,000 or more people establish a metropolitan planning organization
(MPO). MPOs authorized by the Federal-aid Highway Act of 1962 are responsible for
developing continuing, comprehensive, and cooperative transportation plans,
sometimes known as Long-Range Transportation Plans (LRTP), that meet Federal
planning requirements. Each MPO is designated by agreement between Maine’s
governor and the municipalities in a metropolitan region. KACTS is one of nearly 400
MPOs in the United States and Puerto Rico, and one of four MPOs in the State of Maine.
Although various forms of metropolitan transportation planning have existed in many
areas of the United States since the construction of the interstate system, the federal
government did not officially designate the MPO as a transportation planning forum
until 1975 when the Urban Mass Transportation Administration (predecessor to the
Federal Transit Administration (FTA)) and the Federal Highway Administration
(FHWA) revised their transportation planning regulations. Although federal
regulations have changed transportation policy a great deal since that time, the MPO
continues to serve as an important conduit for looking at metro-regional transportation
issues and coordinating intergovernmental decision making with public input.
PURPOSE
The purpose of the KACTS 2035 Long Range Transportation Plan (LRP) is to address
transportation planning, policy, and funding issues as they relate to: highways, transit
services, bicycle and pedestrian facilities, freight services, and rail. The Plan evolves
around two major components: a needs component which identifies what projects are
needed to meet the travel demands of the future, and a fiscally responsible financial
component which identifies what projects can be accomplished based on projected
financial resources. It has been developed to reflect and complement various
community, regional, and state plans and is built on goals, objectives and strategies that
reflect the need for a balanced transportation system that provides a range of choices for
all its users.
Due to KACTS unique location bordering the states of New Hampshire and Maine, the
region serves as a gateway to the state and plays an important role in the transportation
system of Maine and the northeast. The MPO area contains six of the most heavily
I. INTRODUCTION
________________________________________________________________
KACTS Long Range Transportation Plan - 2010-2035 - Page 2 -
traveled roadways entering Maine: Interstate 95, U.S. Route 1, the Route 1 Bypass, State
Route 4, State Route 9, and U.S. Route 202.
THE KACTS REGION
The KACTS area is located in southwestern Maine and borders New Hampshire. The
metropolitan area that KACTS represents is actually only the Maine portion of a much
larger metropolitan region that extends across the border into New Hampshire. On the
New Hampshire side, Strafford Metropolitan Planning Organization and Rockingham
Metropolitan Planning Organization, formally the Seacoast Metropolitan Planning
Organization, are responsible for administering transportation planning activities. The
three MPOs are somewhat unique to MPO bodies in the United States because each
state has separate and distinct transportation planning authority for a contiguous
interstate urbanized area. However, the three MPOs have a working interstate
relationship on regional planning issues and projects.
The MPO area is composed of two
areas: (1) an area that defines where
capital improvements can be made,
(2) an area that defines where
planning funds can be utilized. The
capital improvement area is
essentially the urbanized area
identified by the last decennial
Census plus any small additional
territory to account for
transportation assets that function as
part of the urbanized area
transportation system. U.S. Census
population density figures define an
urbanized area as being a
contiguous area of 50,000 persons
with a density of 1,000 persons per
square mile. In 2005, the KACTS
Committee voted to extend the area
where planning funds can be
utilized to include all core KACTS
member towns as well as Acton, North Berwick, Ogunquit, Sanford, Wells and York.
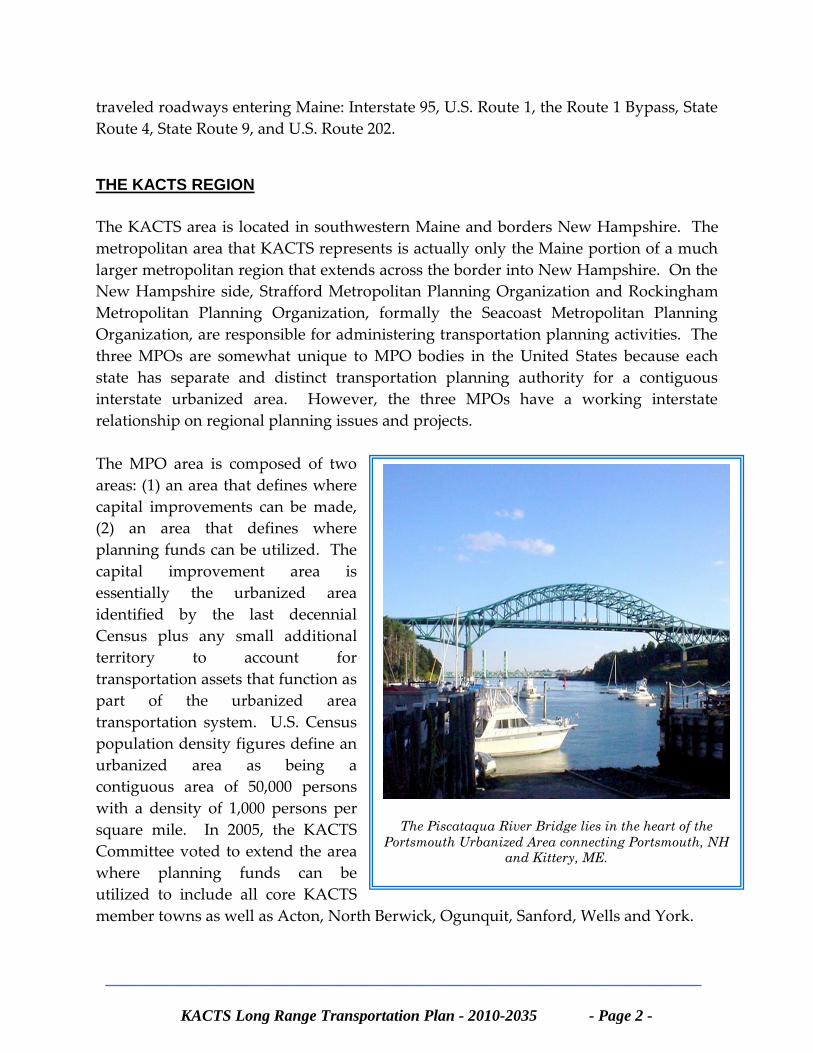
The Piscataqua River Bridge lies in the heart of the
Portsmouth Urbanized Area connecting Portsmouth, NH
and Kittery, ME.
________________________________________________________________
KACTS Long Range Transportation Plan - 2010-2035 - Page 3 -
2000 population data from the U.S. Bureau of the Census divided the former Dover-
Rochester-Portsmouth, NH urbanized area into two individual urbanized areas: the
Dover-Rochester urbanized area and the Portsmouth urbanized area. The KACTS area
continues to plan for areas within both the Dover-Rochester and Portsmouth urbanized
areas. However, this area consists of only the Maine portion of the two urbanized areas,
and constitutes approximately 12% of the total two-state urban area population.
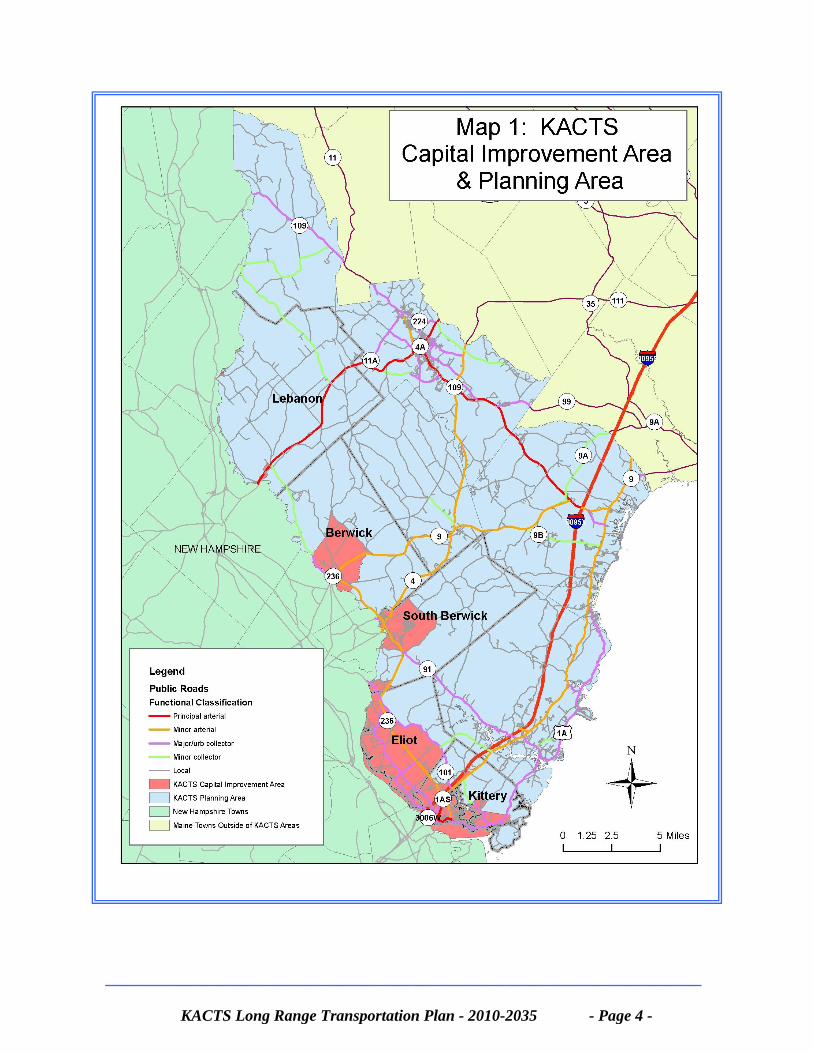
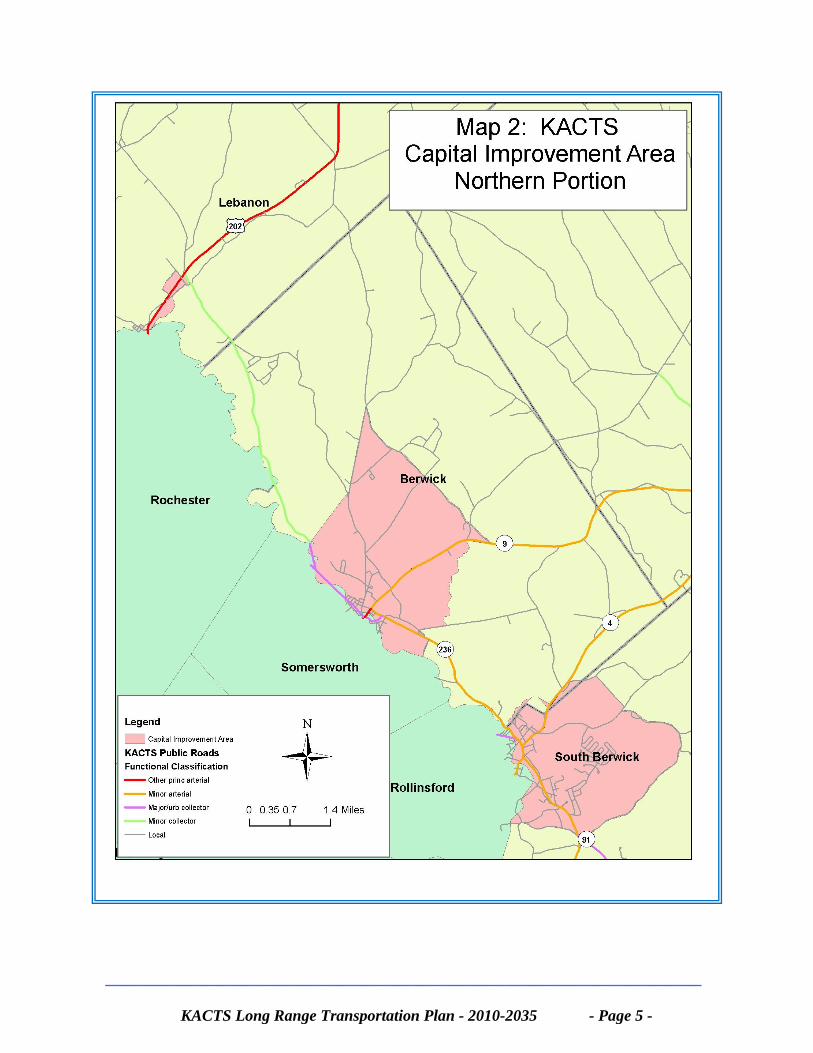
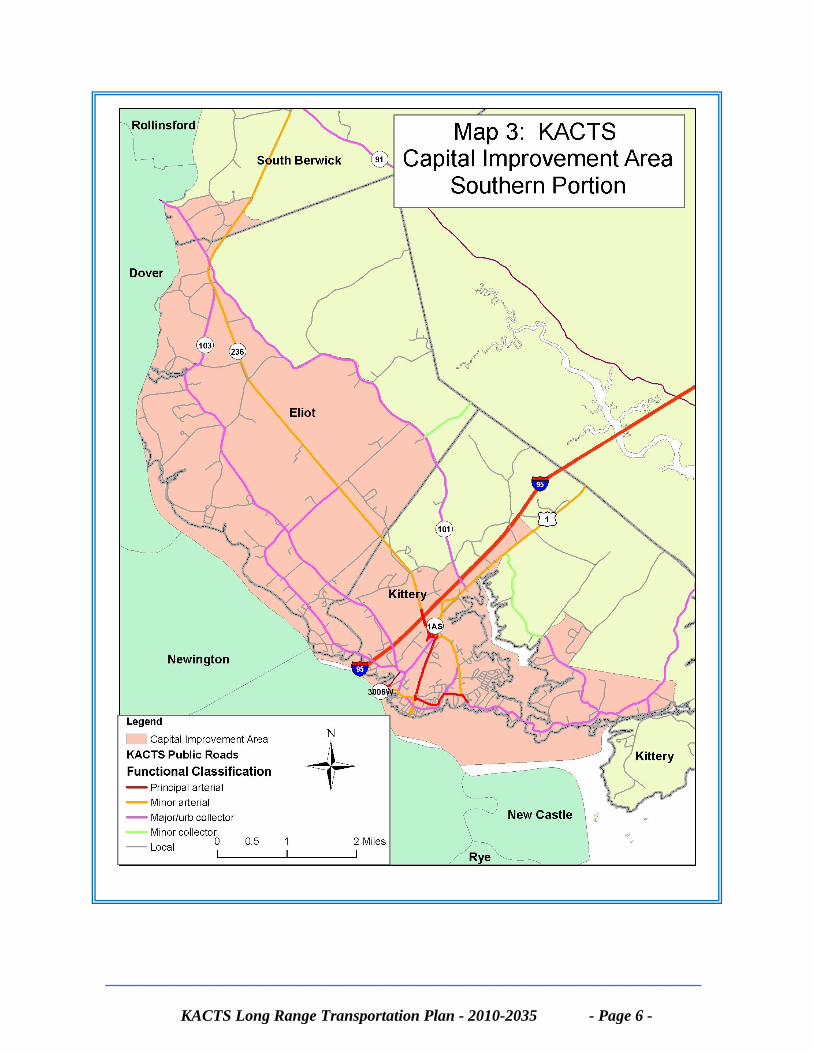
On the following page, Map 1 shows the entire KACTS MPO Area including the Capital
Improvement and Planning Areas. Map 2 on page 5 shows the northern portion of the
KACTS Capital Improvements Area. Map 3 on page 6 shows the southern portion of
the KACTS Capital Improvement Area.
________________________________________________________________
KACTS Long Range Transportation Plan - 2010-2035 - Page 4 -
________________________________________________________________
KACTS Long Range Transportation Plan - 2010-2035 - Page 5 -
________________________________________________________________
KACTS Long Range Transportation Plan - 2010-2035 - Page 6 -
________________________________________________________________
KACTS Long Range Transportation Plan - 2010-2035 - Page 7 -
As maps 1 through 3 indicate, the KACTS area is a contiguous area that links Kittery,
Eliot, South Berwick and Berwick, with a very small area located in Lebanon. The entire
area lies adjacent to a much larger urbanized area in New Hampshire across the
Piscataqua River.
The urban part of Kittery is the most populous of the KACTS area, accounting for over
40% of the KACTS urban population. Although it represents the largest portion of the
KACTS population, the town experienced very little growth in the past twenty years.
During the period between 1990-2000, population growth was offset to some extent by
the work force reduction of the area’s largest employer, the Portsmouth Naval
Shipyard. The total employment level at the Shipyard declined from a high of 8,400 to
about 4,000. Since 2000, the employment level at the Shipyard has increased slightly to
just over 5,000. The commercial and retail business growth that did occur in the past
twenty years was primarily along the Route 1 corridor.
The urban section of Eliot, which lies adjacent to Kittery, is primarily residential. These
residences generate high levels of traffic at commuter hours. The number of shopping
and other service facilities has grown along Route 236 in Eliot, adding access points
along an arterial designed for high speed traffic.
The urban sections of Berwick and South Berwick are composed primarily of the village
areas with surrounding residential areas in each town. Both of these municipalities
have a major State highway traveling through the village areas.
Lebanon, located in between Sanford, Maine and Rochester, New Hampshire, has a
small “urbanized” area along Route 202/11. This area lies adjacent to East Rochester,
and consists primarily of commercial land uses with a small concentration of residential
development northwest of Route 202/11.
MEMBERSHIP
The KACTS MPO is administered by a Committee that is representative of the entire
MPO area and knowledgeable about the area’s transportation needs and deficiencies.
The Committee is composed of government officials representing member
municipalities including, Kittery, Eliot, South Berwick, Berwick, and Lebanon, as well
as local transit providers serving the KACTS area, the Maine Turnpike Authority
(MTA), the Maine Department of Transportation (MaineDOT), and the Southern Maine
Regional Planning Commission (SMRPC). The public transit agency currently
represented on the Committee is the York County Community Action Corporation. The
________________________________________________________________
KACTS Long Range Transportation Plan - 2010-2035 - Page 8 -
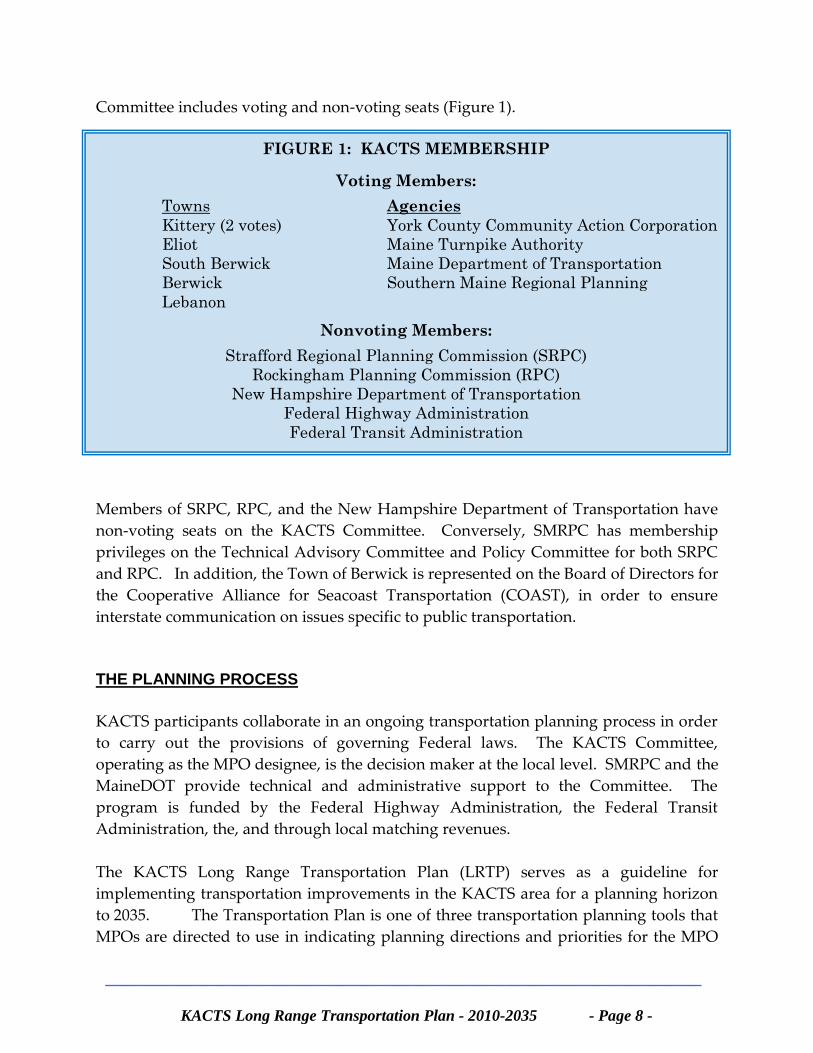
Committee includes voting and non-voting seats (Figure 1).
Members of SRPC, RPC, and the New Hampshire Department of Transportation have
non-voting seats on the KACTS Committee. Conversely, SMRPC has membership
privileges on the Technical Advisory Committee and Policy Committee for both SRPC
and RPC. In addition, the Town of Berwick is represented on the Board of Directors for
the Cooperative Alliance for Seacoast Transportation (COAST), in order to ensure
interstate communication on issues specific to public transportation.
THE PLANNING PROCESS
KACTS participants collaborate in an ongoing transportation planning process in order
to carry out the provisions of governing Federal laws. The KACTS Committee,
operating as the MPO designee, is the decision maker at the local level. SMRPC and the
MaineDOT provide technical and administrative support to the Committee. The
program is funded by the Federal Highway Administration, the Federal Transit
Administration, the, and through local matching revenues.
The KACTS Long Range Transportation Plan (LRTP) serves as a guideline for
implementing transportation improvements in the KACTS area for a planning horizon
to 2035. The Transportation Plan is one of three transportation planning tools that
MPOs are directed to use in indicating planning directions and priorities for the MPO
FIGURE 1: KACTS MEMBERSHIP
Voting Members:
Towns Agencies
Kittery (2 votes) York County Community Action Corporation
Eliot Maine Turnpike Authority
South Berwick Maine Department of Transportation
Berwick Southern Maine Regional Planning
Lebanon
Nonvoting Members:
Strafford Regional Planning Commission (SRPC)
Rockingham Planning Commission (RPC)
New Hampshire Department of Transportation
Federal Highway Administration
Federal Transit Administration
________________________________________________________________
KACTS Long Range Transportation Plan - 2010-2035 - Page 9 -
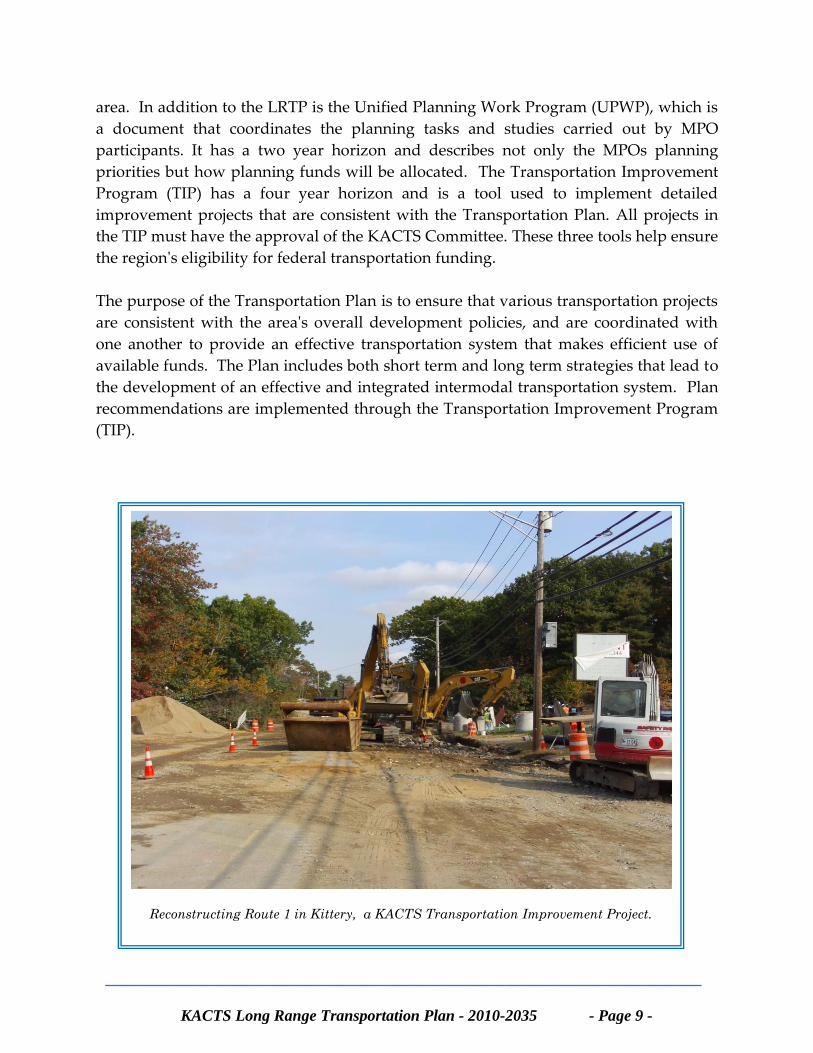
Reconstructing Route 1 in Kittery, a KACTS Transportation Improvement Project.
area. In addition to the LRTP is the Unified Planning Work Program (UPWP), which is
a document that coordinates the planning tasks and studies carried out by MPO
participants. It has a two year horizon and describes not only the MPOs planning
priorities but how planning funds will be allocated. The Transportation Improvement
Program (TIP) has a four year horizon and is a tool used to implement detailed
improvement projects that are consistent with the Transportation Plan. All projects in
the TIP must have the approval of the KACTS Committee. These three tools help ensure
the region's eligibility for federal transportation funding.
The purpose of the Transportation Plan is to ensure that various transportation projects
are consistent with the area's overall development policies, and are coordinated with
one another to provide an effective transportation system that makes efficient use of
available funds. The Plan includes both short term and long term strategies that lead to
the development of an effective and integrated intermodal transportation system. Plan
recommendations are implemented through the Transportation Improvement Program
(TIP).
________________________________________________________________
KACTS Long Range Transportation Plan - 2010-2035 - Page 10 -
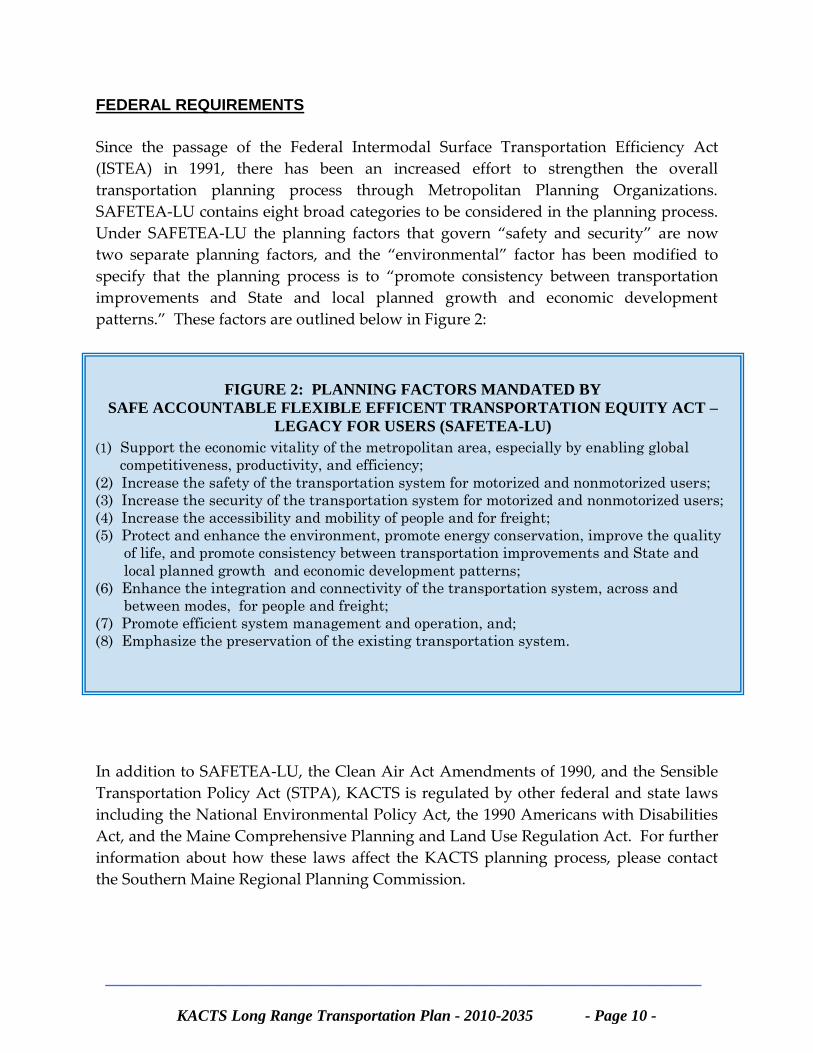
FIGURE 2: PLANNING FACTORS MANDATED BY
SAFE ACCOUNTABLE FLEXIBLE EFFICENT TRANSPORTATION EQUITY ACT –
LEGACY FOR USERS (SAFETEA-LU)
(1) Support the economic vitality of the metropolitan area, especially by enabling global
competitiveness, productivity, and efficiency;
(2) Increase the safety of the transportation system for motorized and nonmotorized users;
(3) Increase the security of the transportation system for motorized and nonmotorized users;
(4) Increase the accessibility and mobility of people and for freight;
(5) Protect and enhance the environment, promote energy conservation, improve the quality
of life, and promote consistency between transportation improvements and State and
local planned growth and economic development patterns;
(6) Enhance the integration and connectivity of the transportation system, across and
between modes, for people and freight;
(7) Promote efficient system management and operation, and;
(8) Emphasize the preservation of the existing transportation system.
FEDERAL REQUIREMENTS
Since the passage of the Federal Intermodal Surface Transportation Efficiency Act
(ISTEA) in 1991, there has been an increased effort to strengthen the overall
transportation planning process through Metropolitan Planning Organizations.
SAFETEA-LU contains eight broad categories to be considered in the planning process.
Under SAFETEA-LU the planning factors that govern “safety and security” are now
two separate planning factors, and the “environmental” factor has been modified to
specify that the planning process is to “promote consistency between transportation
improvements and State and local planned growth and economic development
patterns.” These factors are outlined below in Figure 2:
In addition to SAFETEA-LU, the Clean Air Act Amendments of 1990, and the Sensible
Transportation Policy Act (STPA), KACTS is regulated by other federal and state laws
including the National Environmental Policy Act, the 1990 Americans with Disabilities
Act, and the Maine Comprehensive Planning and Land Use Regulation Act. For further
information about how these laws affect the KACTS planning process, please contact
the Southern Maine Regional Planning Commission.
________________________________________________________________
KACTS Long Range Transportation Plan - 2010-2035 - Page 11 -
AIR QUALITY CONFORMITY
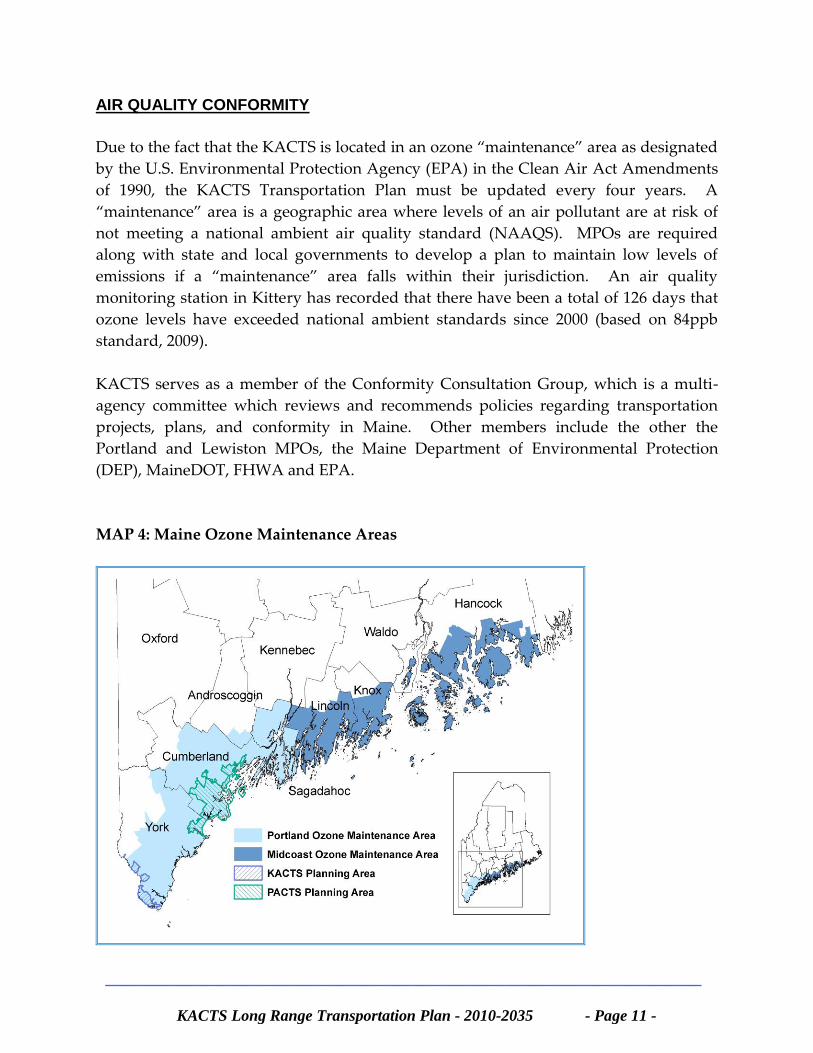
Due to the fact that the KACTS is located in an ozone “maintenance” area as designated
by the U.S. Environmental Protection Agency (EPA) in the Clean Air Act Amendments
of 1990, the KACTS Transportation Plan must be updated every four years. A
“maintenance” area is a geographic area where levels of an air pollutant are at risk of
not meeting a national ambient air quality standard (NAAQS). MPOs are required
along with state and local governments to develop a plan to maintain low levels of
emissions if a “maintenance” area falls within their jurisdiction. An air quality
monitoring station in Kittery has recorded that there have been a total of 126 days that
ozone levels have exceeded national ambient standards since 2000 (based on 84ppb
standard, 2009).
KACTS serves as a member of the Conformity Consultation Group, which is a multi-
agency committee which reviews and recommends policies regarding transportation
projects, plans, and conformity in Maine. Other members include the other the
Portland and Lewiston MPOs, the Maine Department of Environmental Protection
(DEP), MaineDOT, FHWA and EPA.
MAP 4: Maine Ozone Maintenance Areas
________________________________________________________________
KACTS Long Range Transportation Plan - 2010-2035 - Page 12 -
STATE REQUIREMENTS
In addition to the requirements of SAFETEA-LU, KACTS is required to address
planning goals, policies, processes and other requirements from Maine’s 1991 Sensible
Transportation Policy Act (STPA). In 2007, a significant amended was made to the
STPA which included guidelines to evaluate transportation alternatives as part of the
decision making process. This new language requires MPOs to evaluate and document
existing land use policies when anticipating any significant capital improvement or
expansion of the transportation system. KACTS planning activities are also
incorporated into the Maine Department of Transportation’s own statewide Long
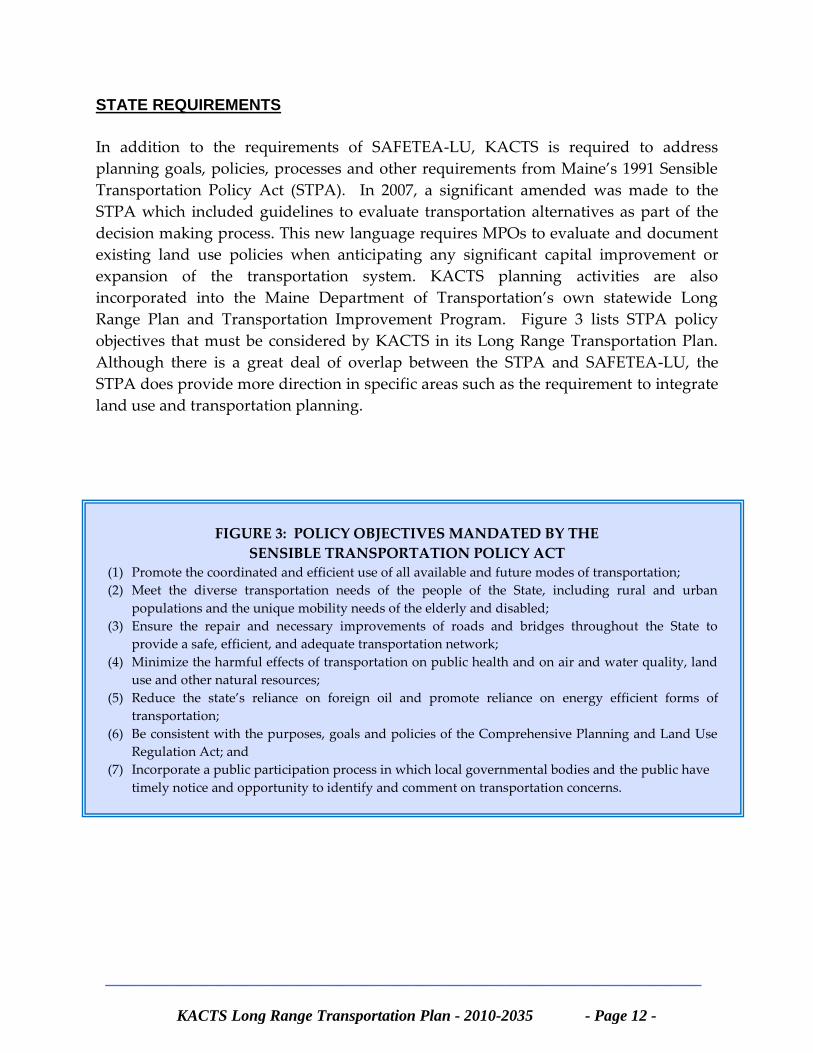
Range Plan and Transportation Improvement Program. Figure 3 lists STPA policy
objectives that must be considered by KACTS in its Long Range Transportation Plan.
Although there is a great deal of overlap between the STPA and SAFETEA-LU, the
STPA does provide more direction in specific areas such as the requirement to integrate
land use and transportation planning.
FIGURE 3: POLICY OBJECTIVES MANDATED BY THE
SENSIBLE TRANSPORTATION POLICY ACT (1) Promote the coordinated and efficient use of all available and future modes of transportation;
(2) Meet the diverse transportation needs of the people of the State, including rural and urban
populations and the unique mobility needs of the elderly and disabled;
(3) Ensure the repair and necessary improvements of roads and bridges throughout the State to
provide a safe, efficient, and adequate transportation network;
(4) Minimize the harmful effects of transportation on public health and on air and water quality, land
use and other natural resources;
(5) Reduce the state’s reliance on foreign oil and promote reliance on energy efficient forms of
transportation;
(6) Be consistent with the purposes, goals and policies of the Comprehensive Planning and Land Use
Regulation Act; and
(7) Incorporate a public participation process in which local governmental bodies and the public have
timely notice and opportunity to identify and comment on transportation concerns.
________________________________________________________________
KACTS Long Range Transportation Plan - 2010-2035 - Page 13 -
THE PUBLIC PROCESS
Proactive public participation is a vital component of the MPO planning process.
SAFETEA-LU legislation stresses the early inclusion of all interested parties in the
development of the Transportation Plan, and sustained participation throughout the
process. It also requires MPOs to provide “a reasonable opportunity” for interested
parties to review and comment on draft long range transportation plans. KACTS has
applied these concepts in the development of its Long Range Transportation Plan as
well as in the development of its Public Involvement Plan.
The KACTS Public Involvement Plan updated annually, lays out procedures the MPO
will follow during the development of all its planning documents, including the Long
Range Transportation Plan. A copy of the document can be found on the KACTS
website or obtained by contacting SMRPC. What follows is a list of public participation
actions taken for the Plan.
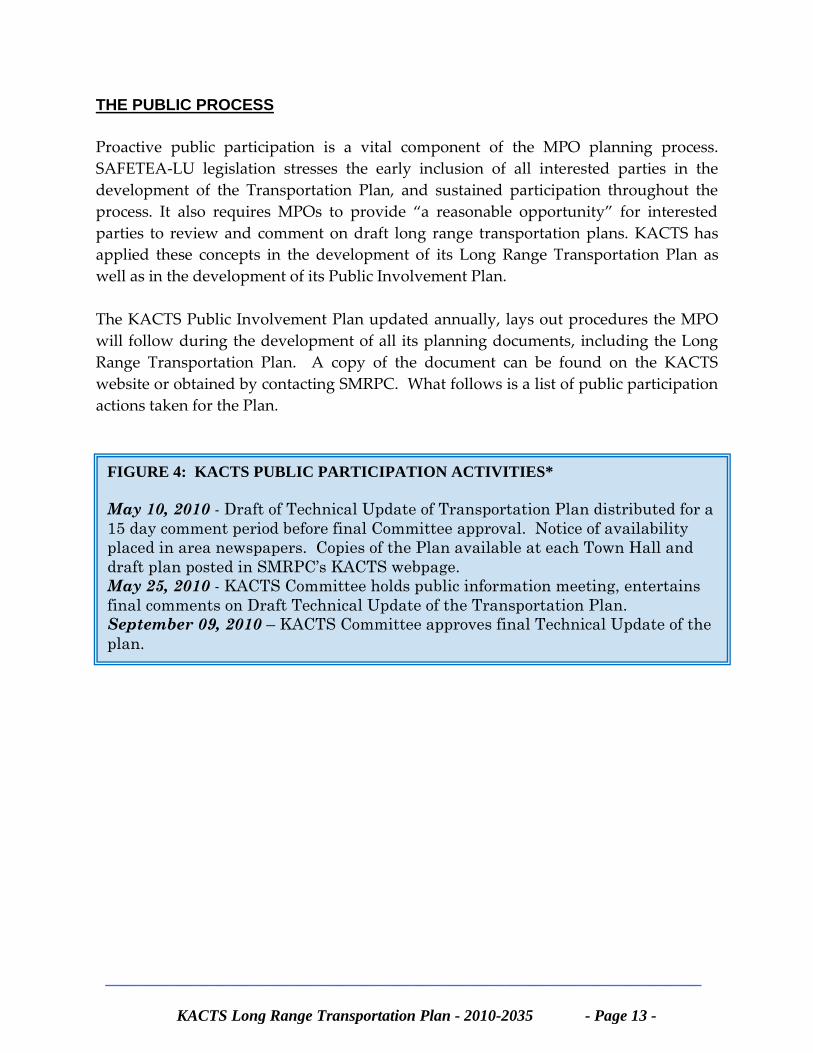
FIGURE 4: KACTS PUBLIC PARTICIPATION ACTIVITIES*
May 10, 2010 - Draft of Technical Update of Transportation Plan distributed for a
15 day comment period before final Committee approval. Notice of availability
placed in area newspapers. Copies of the Plan available at each Town Hall and
draft plan posted in SMRPC’s KACTS webpage.
May 25, 2010 - KACTS Committee holds public information meeting, entertains
final comments on Draft Technical Update of the Transportation Plan.
September 09, 2010 – KACTS Committee approves final Technical Update of the
plan. * KACTS Committee members were also encouraged to seek input from their respective towns
throughout the development of the Transportation Plan.
________________________________________________________________
KACTS Long Range Transportation Plan - 2010-2035 - Page 14 -
A. Policies
The KACTS transportation plan is founded on a set of policies organized as a hierarchy
of policy goals and objectives i.e. “what we want to achieve.” These policies provide a
benchmark for KACTS to monitor and evaluate the transportation system and socio-
economic conditions, and measure its progress toward achieving its policy guidelines.
The policies of this plan depict the member communities’ commitment to provide a safe
and accessible transportation system that efficiently meets the mobility needs of its
residents, visitors and businesses while supporting economic growth, minimizing
environmental impacts, and capitalizing on the unique character of the region. In short:
“Maximizing the opportunities to enhance the movement of goods and people
through the Gateway to Maine”
The seven major policies that are the foundation to the KACTS Transportation Plan are:
1. Improved Public Safety;
2. An Integrated Multimodal Transportation System;
3. Maximized System Management;
4. A Strengthened connection between Lane Use, Economic Development and
Transportation;
5. Enhanced Environment Prosperity;
6. A Fiscally Responsible Transportation System; and
7. Improved Freight Management;
B. Implementation Strategies
The implementation strategies reflect the member communities’ commitment as to how
to achieve the desired transportation policies. The Committee uses several items for
implementation, including the Transportation Improvement Program (TIP) and Unified
Planning Work Program (UPWP). Please refer to each of these documents for further
information.
II. LONG RANGE TRANSPORTATION PLAN
________________________________________________________________
KACTS Long Range Transportation Plan - 2010-2035 - Page 15 -
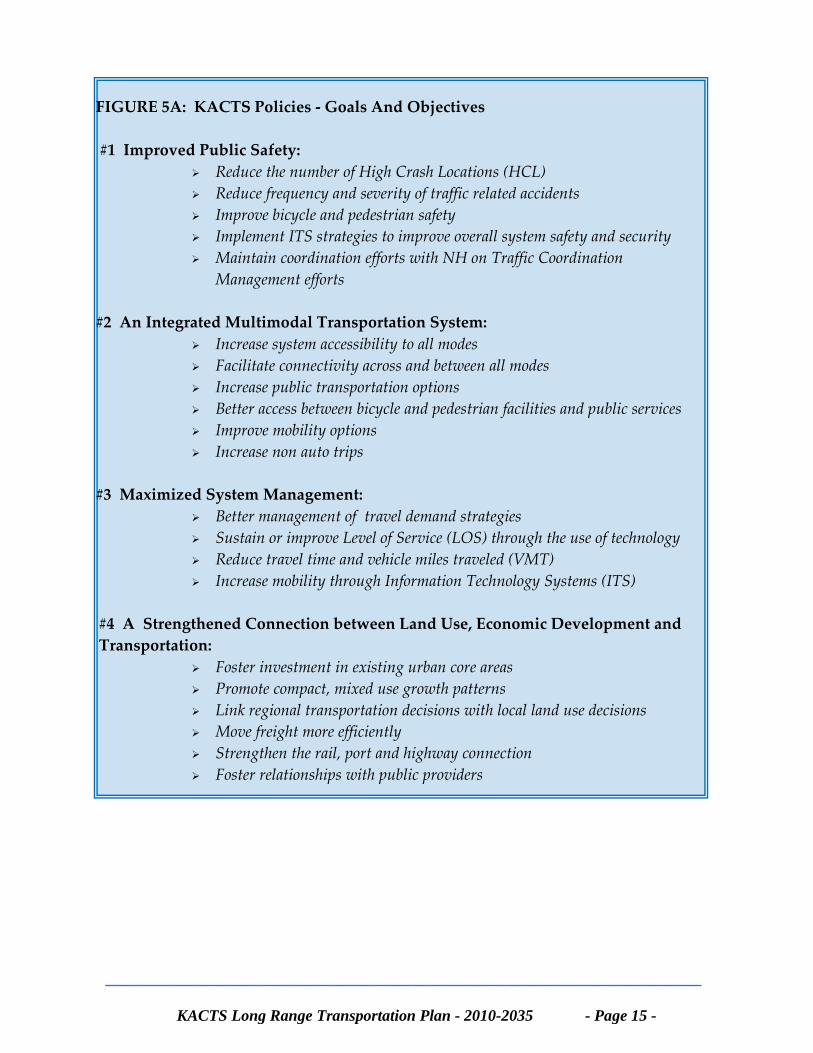
FIGURE 5A: KACTS Policies - Goals And Objectives
#1 Improved Public Safety:
Reduce the number of High Crash Locations (HCL)
Reduce frequency and severity of traffic related accidents
Improve bicycle and pedestrian safety
Implement ITS strategies to improve overall system safety and security
Maintain coordination efforts with NH on Traffic Coordination
Management efforts
#2 An Integrated Multimodal Transportation System:
Increase system accessibility to all modes
Facilitate connectivity across and between all modes
Increase public transportation options
Better access between bicycle and pedestrian facilities and public services
Improve mobility options
Increase non auto trips
#3 Maximized System Management:
Better management of travel demand strategies
Sustain or improve Level of Service (LOS) through the use of technology
Reduce travel time and vehicle miles traveled (VMT)
Increase mobility through Information Technology Systems (ITS)
#4 A Strengthened Connection between Land Use, Economic Development and
Transportation:
Foster investment in existing urban core areas
Promote compact, mixed use growth patterns
Link regional transportation decisions with local land use decisions
Move freight more efficiently
Strengthen the rail, port and highway connection
Foster relationships with public providers
________________________________________________________________
KACTS Long Range Transportation Plan - 2010-2035 - Page 16 -
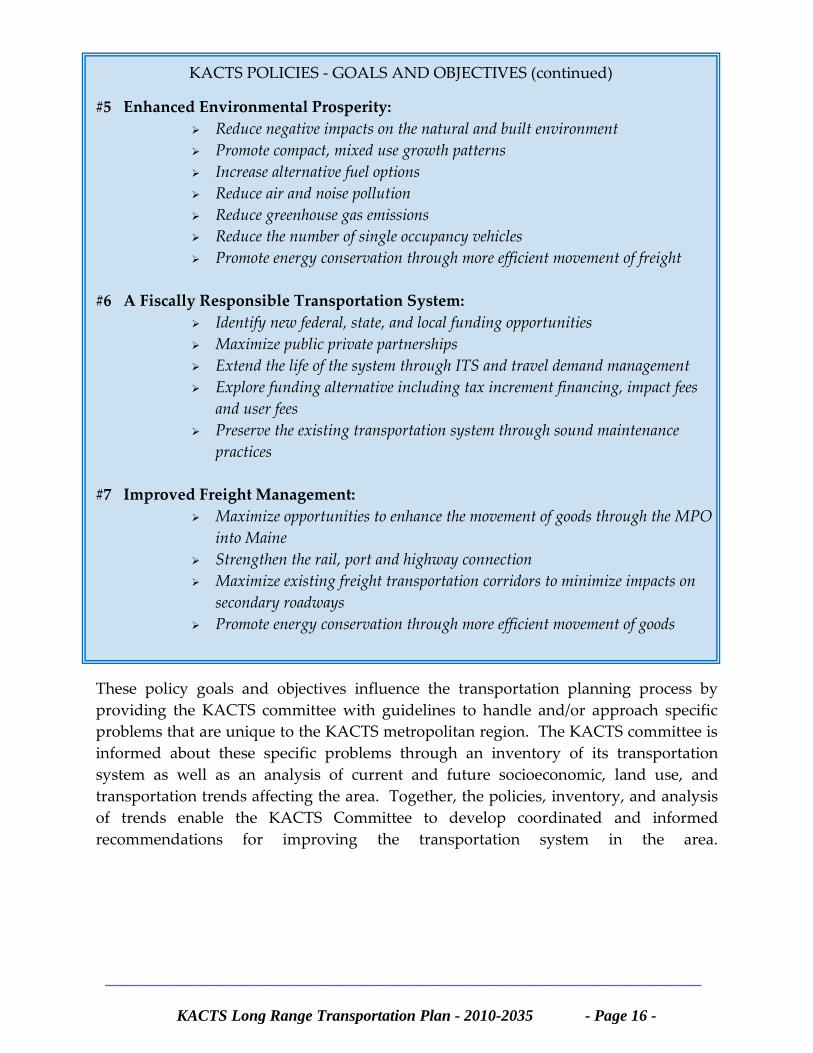
KACTS POLICIES - GOALS AND OBJECTIVES (continued) #5 Enhanced Environmental Prosperity:
Reduce negative impacts on the natural and built environment
Promote compact, mixed use growth patterns
Increase alternative fuel options
Reduce air and noise pollution
Reduce greenhouse gas emissions
Reduce the number of single occupancy vehicles
Promote energy conservation through more efficient movement of freight
#6 A Fiscally Responsible Transportation System:
Identify new federal, state, and local funding opportunities
Maximize public private partnerships
Extend the life of the system through ITS and travel demand management
Explore funding alternative including tax increment financing, impact fees
and user fees
Preserve the existing transportation system through sound maintenance
practices
#7 Improved Freight Management:
Maximize opportunities to enhance the movement of goods through the MPO
into Maine
Strengthen the rail, port and highway connection
Maximize existing freight transportation corridors to minimize impacts on
secondary roadways
Promote energy conservation through more efficient movement of goods
These policy goals and objectives influence the transportation planning process by
providing the KACTS committee with guidelines to handle and/or approach specific
problems that are unique to the KACTS metropolitan region. The KACTS committee is
informed about these specific problems through an inventory of its transportation
system as well as an analysis of current and future socioeconomic, land use, and
transportation trends affecting the area. Together, the policies, inventory, and analysis
of trends enable the KACTS Committee to develop coordinated and informed
recommendations for improving the transportation system in the area.
KACTS Long Range Transportation Plan - 2010-2035 - Page 17 -
The following section of the plan presents a multi-modal picture of the existing KACTS
transportation system.
A. TRANSPORTATION CHARACTERISTICS
Transportation serves as a means to connect a diverse range of users groups with
goods, services and other resources. As such, the condition, safety, and efficiency of the
regions transportation system are all important factors that need to be monitored
regularly. A well balanced system should take into consideration all modes, including
motor vehicles, bicycles, pedestrians, trains, and transit services. Equally, good
governance of the system - ensuring safety, efficiency and longevity are not
compromised - is becoming more crucial as we enter into a period where funding
sources are diminishing. This section of the Plan will discuss the various aspects of the
existing transportation system within the KACTS region.
EXISTING ROADWAY NETWORK
A key part of the transportation infrastructure is the roadway network. Within the
roadway network there is a hierarchy known as functional classification. Functional
classification is the process by which public streets and highways are grouped into
classes according to the character of service they are intended to provide. Generally,
highways fall into one of four broad categories: principal arterial, minor arterials, collector
roads, and local roads.
Principal Arterials (Interstate & Other) are the highest classification. They serve
through trips and provide limited access to adjacent land use, provide longer through
travel between major trip generators (larger cities, recreational areas, etc.). Minor
Arterials are designed to provide for relatively high overall speeds with minimum
interference. MaineDOT further classifies arterials as either “mobility” or “retrograde”.
A mobility arterial is a rural arterial with posted speed limit of 40 mph or more that
carries 5,000 or more vehicles per day for at least 50% of its length. A retrograde arterial
is a type of mobility arterial on which crash rates due to vehicles entering and exiting
driveways exceed the 2001 state average crash for similar roadways. Collectors have
the function to link local roads and streets with arterials; they collect traffic from the
local roads and also connect smaller cities and towns with each other and to the
arterials. Local roads provide access to private property or low volume public facilities.
These divisions may be used as a basis for determining jurisdiction, design standards,
and allocation of funds.
III. APPENDICES
________________________________________________________________
KACTS Long Range Transportation Plan - 2010-2035 - Page 18 -
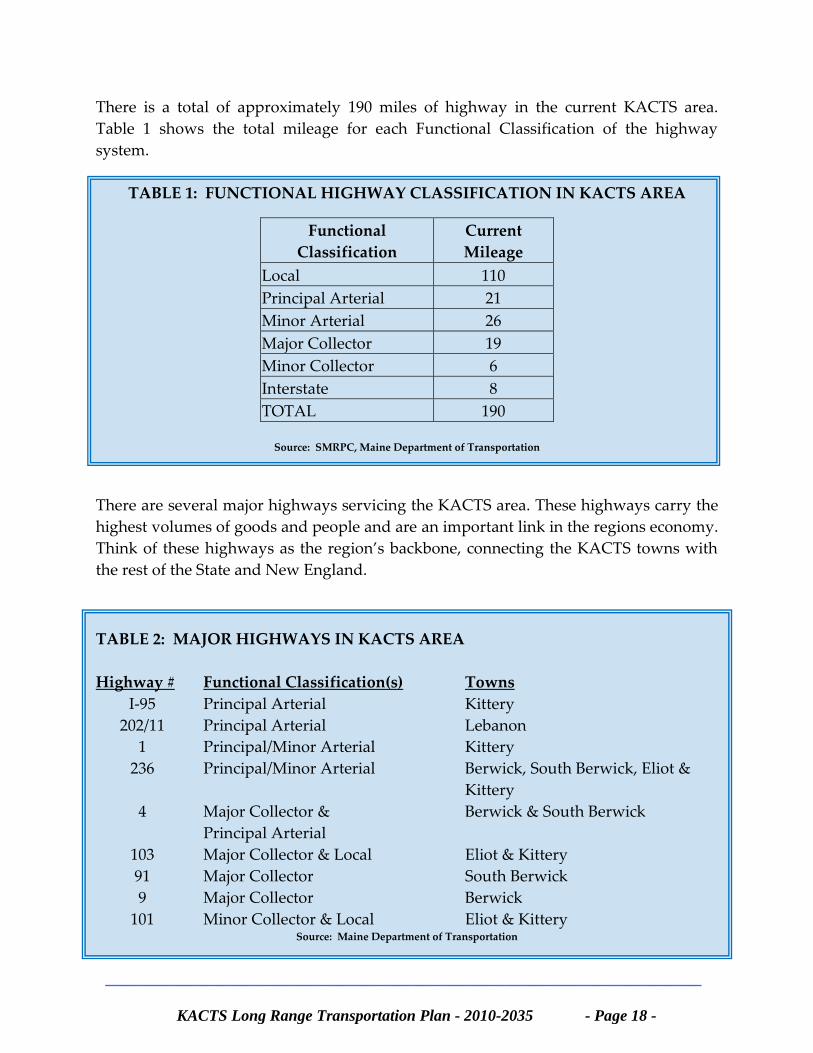
There is a total of approximately 190 miles of highway in the current KACTS area.
Table 1 shows the total mileage for each Functional Classification of the highway
system.
TABLE 1: FUNCTIONAL HIGHWAY CLASSIFICATION IN KACTS AREA
Functional
Classification
Current
Mileage
Local 110
Principal Arterial 21
Minor Arterial 26
Major Collector 19
Minor Collector 6
Interstate 8
TOTAL 190
Source: SMRPC, Maine Department of Transportation
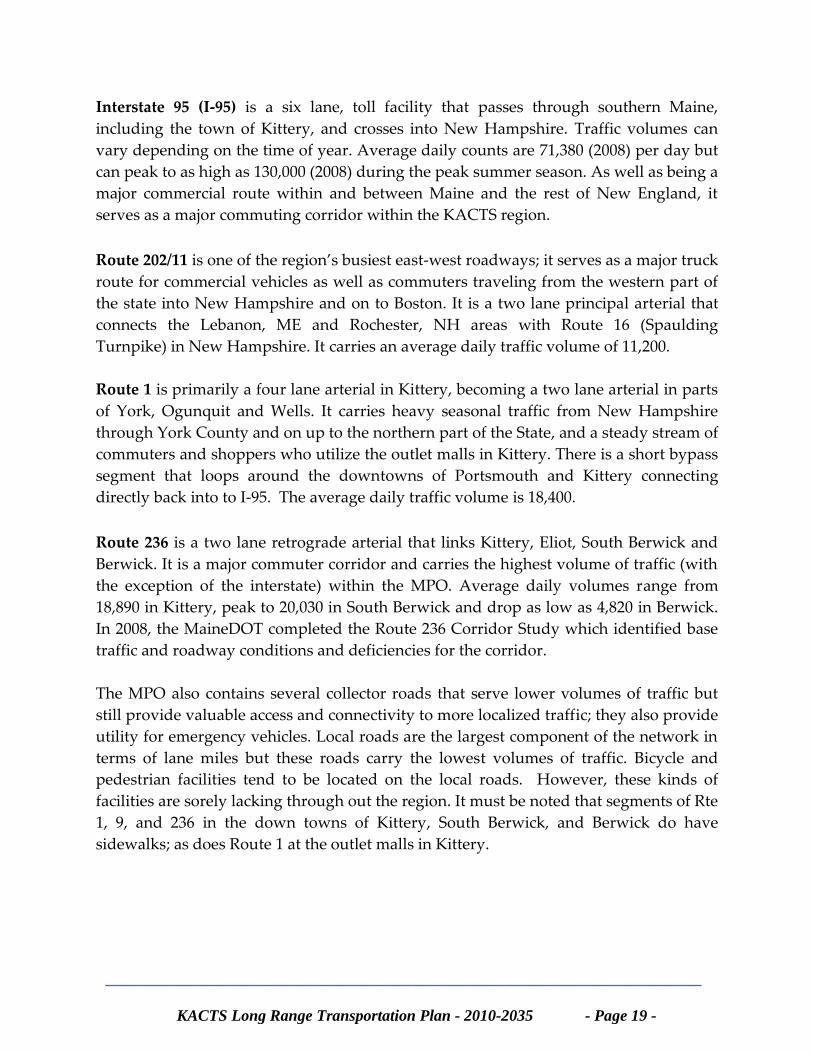
There are several major highways servicing the KACTS area. These highways carry the
highest volumes of goods and people and are an important link in the regions economy.
Think of these highways as the region’s backbone, connecting the KACTS towns with
the rest of the State and New England.
TABLE 2: MAJOR HIGHWAYS IN KACTS AREA
Highway # Functional Classification(s) Towns
I-95 Principal Arterial Kittery
202/11 Principal Arterial Lebanon
1 Principal/Minor Arterial Kittery
236 Principal/Minor Arterial Berwick, South Berwick, Eliot &
Kittery
4 Major Collector &
Principal Arterial
Berwick & South Berwick
103 Major Collector & Local Eliot & Kittery
91 Major Collector South Berwick
9 Major Collector Berwick
101 Minor Collector & Local Eliot & Kittery Source: Maine Department of Transportation
________________________________________________________________
KACTS Long Range Transportation Plan - 2010-2035 - Page 19 -
Interstate 95 (I-95) is a six lane, toll facility that passes through southern Maine,
including the town of Kittery, and crosses into New Hampshire. Traffic volumes can
vary depending on the time of year. Average daily counts are 71,380 (2008) per day but
can peak to as high as 130,000 (2008) during the peak summer season. As well as being a
major commercial route within and between Maine and the rest of New England, it
serves as a major commuting corridor within the KACTS region.
Route 202/11 is one of the region’s busiest east-west roadways; it serves as a major truck
route for commercial vehicles as well as commuters traveling from the western part of
the state into New Hampshire and on to Boston. It is a two lane principal arterial that
connects the Lebanon, ME and Rochester, NH areas with Route 16 (Spaulding
Turnpike) in New Hampshire. It carries an average daily traffic volume of 11,200.
Route 1 is primarily a four lane arterial in Kittery, becoming a two lane arterial in parts
of York, Ogunquit and Wells. It carries heavy seasonal traffic from New Hampshire
through York County and on up to the northern part of the State, and a steady stream of
commuters and shoppers who utilize the outlet malls in Kittery. There is a short bypass
segment that loops around the downtowns of Portsmouth and Kittery connecting
directly back into to I-95. The average daily traffic volume is 18,400.
Route 236 is a two lane retrograde arterial that links Kittery, Eliot, South Berwick and
Berwick. It is a major commuter corridor and carries the highest volume of traffic (with
the exception of the interstate) within the MPO. Average daily volumes range from
18,890 in Kittery, peak to 20,030 in South Berwick and drop as low as 4,820 in Berwick.
In 2008, the MaineDOT completed the Route 236 Corridor Study which identified base
traffic and roadway conditions and deficiencies for the corridor.
The MPO also contains several collector roads that serve lower volumes of traffic but
still provide valuable access and connectivity to more localized traffic; they also provide
utility for emergency vehicles. Local roads are the largest component of the network in
terms of lane miles but these roads carry the lowest volumes of traffic. Bicycle and
pedestrian facilities tend to be located on the local roads. However, these kinds of
facilities are sorely lacking through out the region. It must be noted that segments of Rte
1, 9, and 236 in the down towns of Kittery, South Berwick, and Berwick do have
sidewalks; as does Route 1 at the outlet malls in Kittery.
________________________________________________________________
KACTS Long Range Transportation Plan - 2010-2035 - Page 20 -
NETWORK DEFICIENCIES
As mentioned before, the roadways listed above are the region’s backbone; they are
critical to the region and benefit the communities in a number of ways as they haul
freight, move people, and drive economic development and tourism. However, these
roadways all experience problems related to high traffic volumes, levels of congestion
and safety. Furthermore, they are often the roadways that cost the most to maintain.
Deficiencies can be measured in many ways; however it is usually associated with the
level of service (LOS) of a roadway. LOS is a qualitative measure describing operational
conditions within a traffic stream taking into account a number of variables including
speed and travel time. There are six levels of service ranging from “A” being the very
best, to “F” being the worst. Level “F” represents heavily congested flow with traffic
demand exceeding capacity. Currently there are a number of intersections and roadway
segments in the KACTS region that already operate at LOS of “D” and below. Traffic
modeling projected out to 2026 has determined these locations will be operating at a
LOS of “F” if control measures are not put in place.
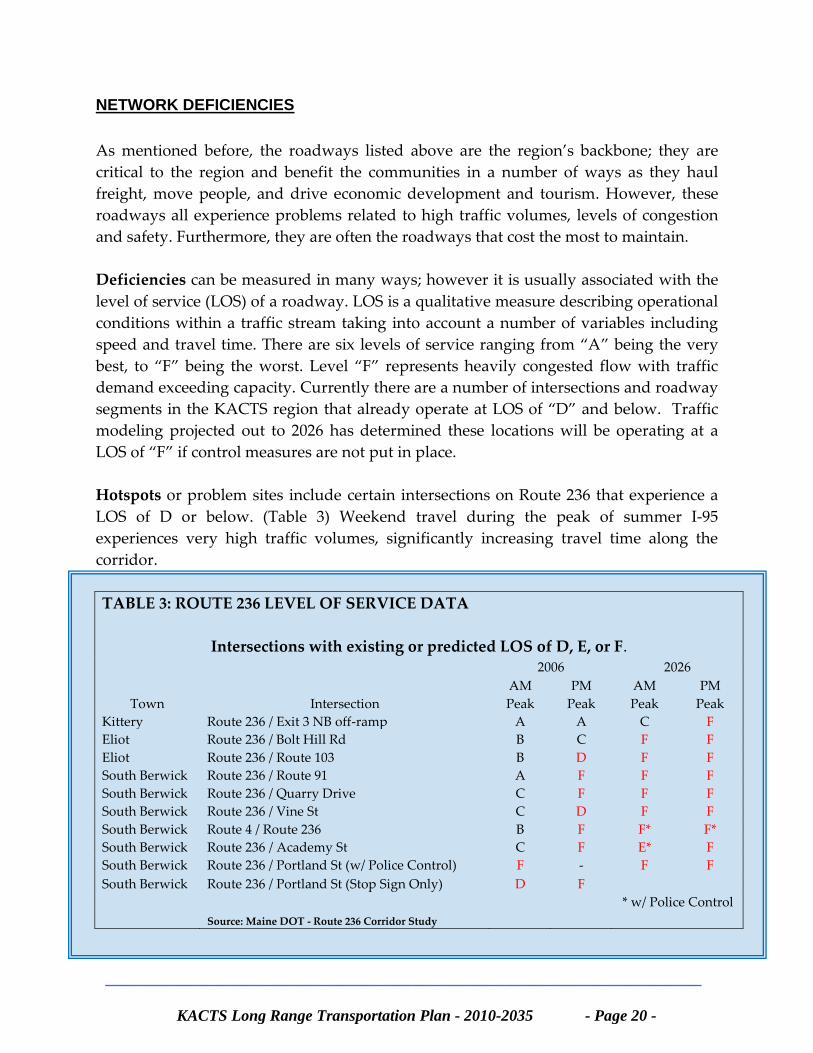
Hotspots or problem sites include certain intersections on Route 236 that experience a
LOS of D or below. (Table 3) Weekend travel during the peak of summer I-95
experiences very high traffic volumes, significantly increasing travel time along the
corridor.
TABLE 3: ROUTE 236 LEVEL OF SERVICE DATA
Intersections with existing or predicted LOS of D, E, or F. 2006 2026
Town Intersection
AM
Peak
PM
Peak
AM
Peak
PM
Peak
Kittery Route 236 / Exit 3 NB off-ramp A A C F
Eliot Route 236 / Bolt Hill Rd B C F F
Eliot Route 236 / Route 103 B D F F
South Berwick Route 236 / Route 91 A F F F
South Berwick Route 236 / Quarry Drive C F F F
South Berwick Route 236 / Vine St C D F F
South Berwick Route 4 / Route 236 B F F* F*
South Berwick Route 236 / Academy St C F E* F
South Berwick Route 236 / Portland St (w/ Police Control) F - F F
South Berwick Route 236 / Portland St (Stop Sign Only) D F
* w/ Police Control
Source: Maine DOT - Route 236 Corridor Study
________________________________________________________________
KACTS Long Range Transportation Plan - 2010-2035 - Page 21 -
BRIDGES
As mentioned earlier, the KACTS region is unique in so far as it only represents the
Maine portion of a much larger metropolitan region that borders New Hampshire. The
Piscataqua River acts as a boarder separating the land of Maine and New Hampshire,
and severely restricting transportation access between the two States. Although there
are currently three bridges between Kittery and Portsmouth, the next access point
connecting Maine and New Hampshire is approximately 14 miles away in South
Berwick. These three bridges, the Memorial bridge (Route 1), Sara Mildred Long bridge
(Route 1 Bypass), and I-95 High Level Bridge are important connections and play an
integral part in the safe and efficient movement of people and goods into and out of
Maine.
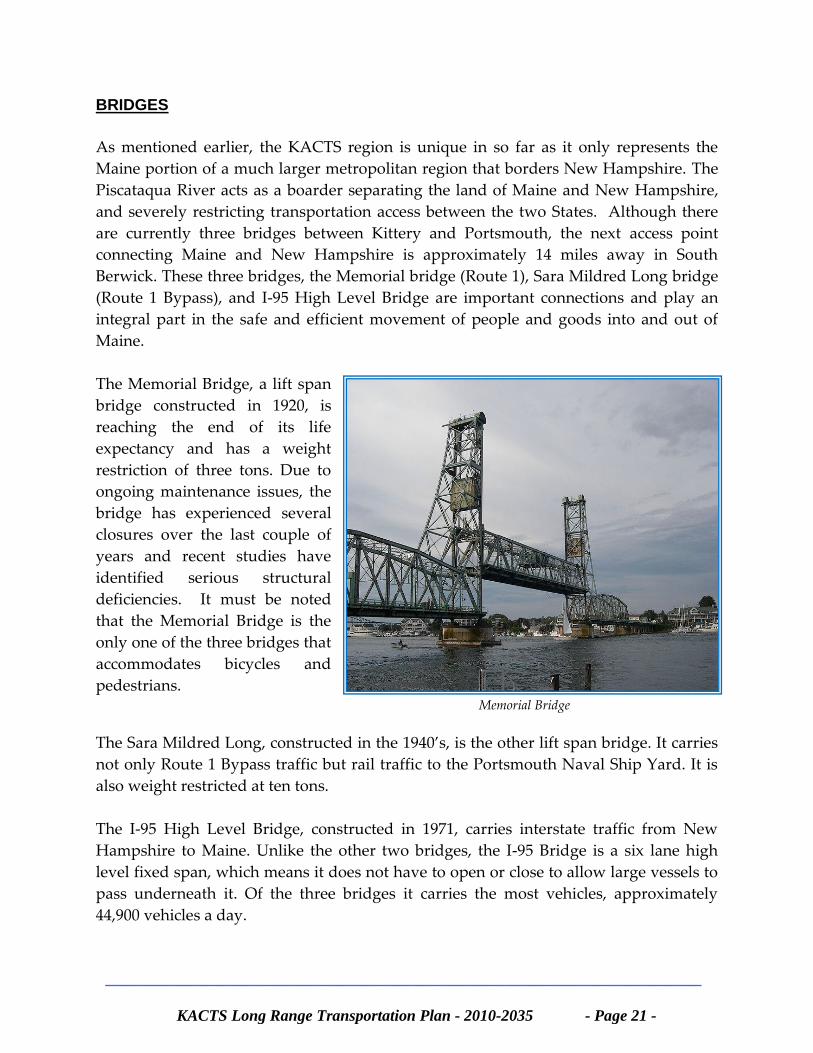
The Memorial Bridge, a lift span
bridge constructed in 1920, is
reaching the end of its life
expectancy and has a weight
restriction of three tons. Due to
ongoing maintenance issues, the
bridge has experienced several
closures over the last couple of
years and recent studies have
identified serious structural
deficiencies. It must be noted
that the Memorial Bridge is the
only one of the three bridges that
accommodates bicycles and
pedestrians. Memorial Bridge
The Sara Mildred Long, constructed in the 1940’s, is the other lift span bridge. It carries
not only Route 1 Bypass traffic but rail traffic to the Portsmouth Naval Ship Yard. It is
also weight restricted at ten tons.
The I-95 High Level Bridge, constructed in 1971, carries interstate traffic from New
Hampshire to Maine. Unlike the other two bridges, the I-95 Bridge is a six lane high
level fixed span, which means it does not have to open or close to allow large vessels to
pass underneath it. Of the three bridges it carries the most vehicles, approximately
44,900 vehicles a day.
________________________________________________________________
KACTS Long Range Transportation Plan - 2010-2035 - Page 22 -
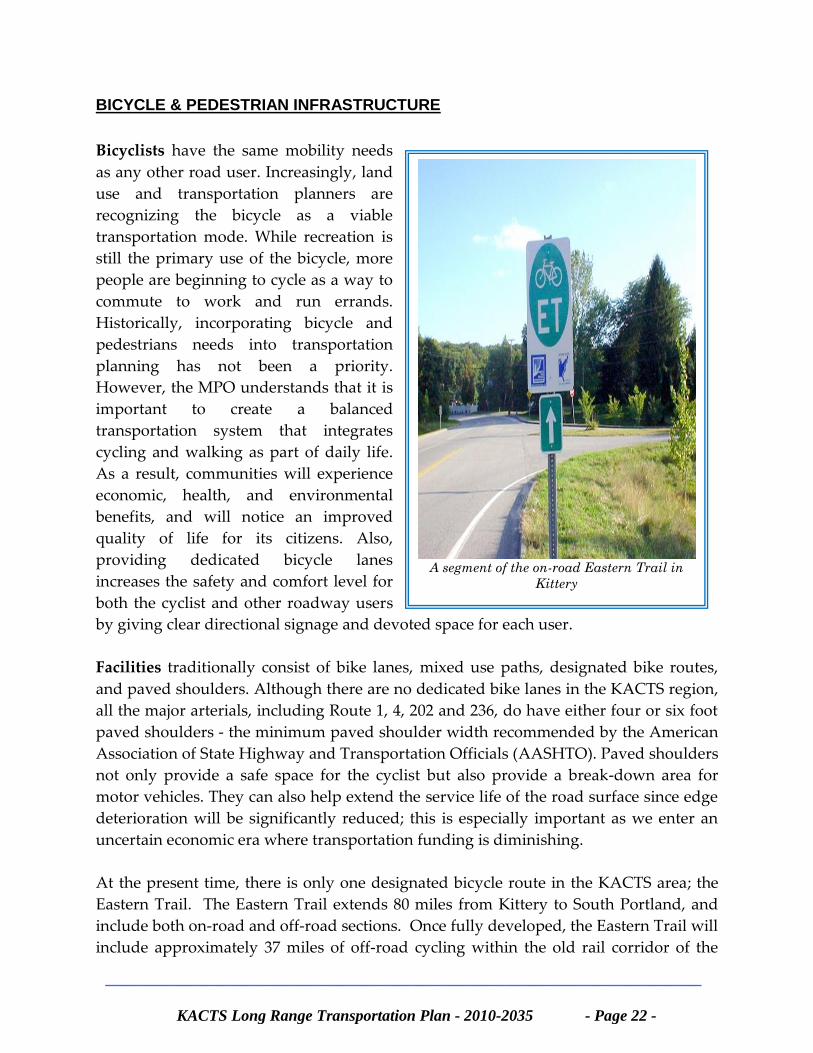
A segment of the on-road Eastern Trail in
Kittery
BICYCLE & PEDESTRIAN INFRASTRUCTURE
Bicyclists have the same mobility needs
as any other road user. Increasingly, land
use and transportation planners are
recognizing the bicycle as a viable
transportation mode. While recreation is
still the primary use of the bicycle, more
people are beginning to cycle as a way to
commute to work and run errands.
Historically, incorporating bicycle and
pedestrians needs into transportation
planning has not been a priority.
However, the MPO understands that it is
important to create a balanced
transportation system that integrates
cycling and walking as part of daily life.
As a result, communities will experience
economic, health, and environmental
benefits, and will notice an improved
quality of life for its citizens. Also,
providing dedicated bicycle lanes
increases the safety and comfort level for
both the cyclist and other roadway users
by giving clear directional signage and devoted space for each user.
Facilities traditionally consist of bike lanes, mixed use paths, designated bike routes,
and paved shoulders. Although there are no dedicated bike lanes in the KACTS region,
all the major arterials, including Route 1, 4, 202 and 236, do have either four or six foot
paved shoulders - the minimum paved shoulder width recommended by the American
Association of State Highway and Transportation Officials (AASHTO). Paved shoulders
not only provide a safe space for the cyclist but also provide a break-down area for
motor vehicles. They can also help extend the service life of the road surface since edge
deterioration will be significantly reduced; this is especially important as we enter an
uncertain economic era where transportation funding is diminishing.
At the present time, there is only one designated bicycle route in the KACTS area; the
Eastern Trail. The Eastern Trail extends 80 miles from Kittery to South Portland, and
include both on-road and off-road sections. Once fully developed, the Eastern Trail will
include approximately 37 miles of off-road cycling within the old rail corridor of the
________________________________________________________________
KACTS Long Range Transportation Plan - 2010-2035 - Page 23 -
Eastern Railroad. Today, the Eastern Trail riders can meander on-road through the rural
countryside and villages of southern Maine as well as historic mill towns and ocean
side beaches. This stretch of trail is also part of the larger East Cost Greenway system; a
trail that will run approximately 3,000 miles along the east coast from Canada to Florida
when it is complete. The Eastern Trail Management District (ETMD) and the Eastern
Trail Alliance are the two organizations with the responsibility for developing and
maintaining trail segments - www.easterntrailmanagement.org or
www.easterntrail.org. MaineDOT also has more information at www.exploremaine.org.
Pedestrians are a part of every roadway environment and attention should be paid to
their presence. Sidewalks are the primary facility provided to meet their needs, and
care must be taken when designing a pedestrian network to account for all users.
Sidewalks provide access, improve safety and increase the social livability of a
community.
Sidewalks and recreational walking trails are sorely absent from the area, due in part to
the rural nature of the MPO. However the downtown areas of Kittery, Eliot, South
Berwick and Berwick do have sidewalks and crosswalks to accommodate pedestrians,
and as new subdivisions are being built sidewalks are being included. Much of the
existing sidewalk infrastructure is old and does not meet current ADA standards. As
towns replace or extend their sidewalk network they will be required to meet ADA
standards. Kittery and Eliot will shortly be undertaking studies to address and enhance
bicycle and pedestrian needs, while South Berwick recently completed (2009) a
downtown transportation feasibility study that focused heavily on the safety and needs
of pedestrians.
NETWORK SAFETY AND SECURITY
Metropolitan Planning Organizations are being encouraged to effectively address safety
and security issues in accordance with policies outlined in SAFETEA-LU. Federal
requirements also require MPO long-rang plans to comply with State Strategic
Highway Safety Plans.
SAFETEA-LU established the Highway Safety Improvement Program; which is
structured and funded to make significant progress in reducing fatalities on the nation’s
highways. The Highway Safety Improvement Program creates a positive agenda for
increased safety by increasing the funds for infrastructure safety and requiring strategic
highway safety planning, focusing on results.
SAFETY
________________________________________________________________
KACTS Long Range Transportation Plan - 2010-2035 - Page 24 -
Safety is of the utmost importance when thinking about transportation planning; this
includes being proactive to address current and future safety issues, whether they relate
to vehicle crashes at intersections, pedestrian incidents, or even vehicle/animal
collisions. While human suffering is the primary effect of crashes, the financial burden
is also noteworthy. According to the Federal Highway Administration, estimated
societal costs are $230.6 billion per year or $829 per person (2009). Understanding crash
types and identifying crash trends can better prepare planners to consider appropriate
projects and strategies that increase the safety of the motorized and nonmotorized user,
and avoid unnecessary associated costs.
MaineDOT uses crash data obtained from the State and local police to determine high
crash locations (HCL). Every intersection (node) and section of roadway (link) is
analyzed to come up with a Critical Rate Factor (CRF). The CRF is a comparison of
actual accident rate on a link or at a node to the expected accident rate based on road
type, vehicle miles of travel, and a statewide average of accident rates. A CRF greater
than 1 on a link or at a node indicates an accident rate higher than should be expected at
that location when based on statewide data.
In addition to determining the CRF, MaineDOT maintains data on all the accidents on
the links and at the nodes. Reports are produced at locations with CRF greater than 1
that have more than 8 accidents during a 3 year period. These locations are then called
high crash locations. MPOs, MaineDOT and municipalities often use HCL data to make
informed decisions about highway safety improvements.
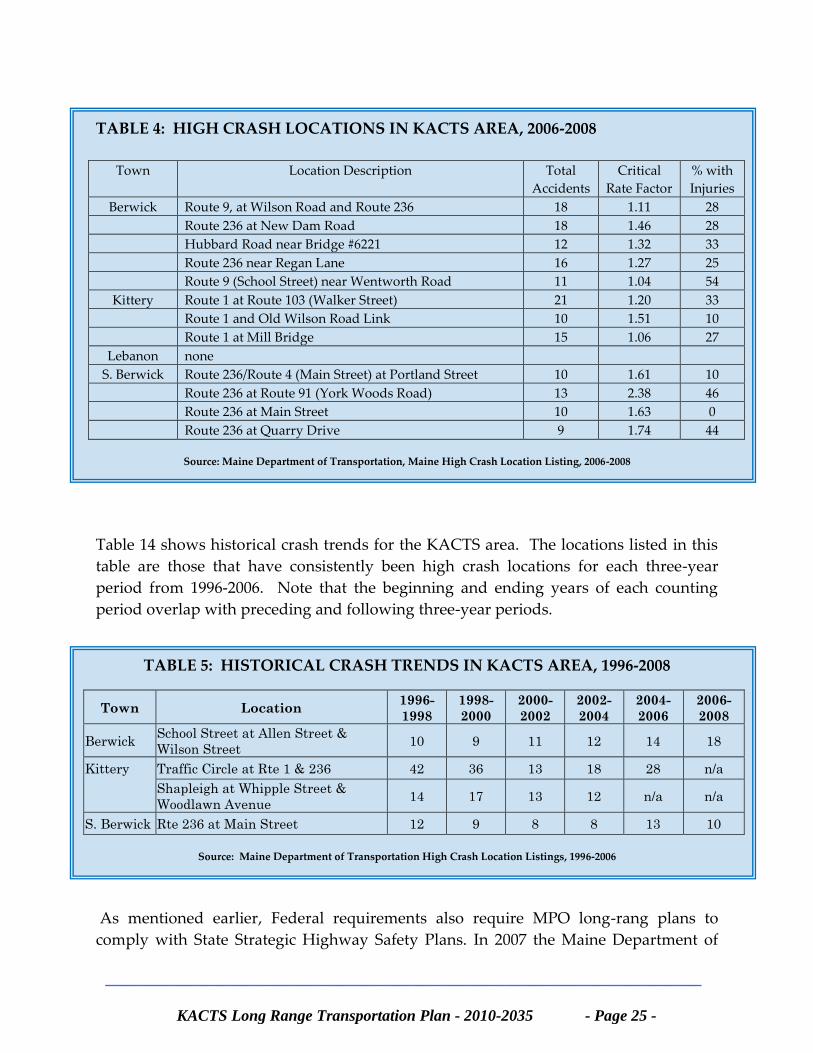
Based on MaineDOT analysis of crashes in the KACTS area between 2006 and 2008,
there were 16 high crash locations; Table 13 below lists all the high crash locations from
2006-2008. Also included in Table 13 is the percent of crashes occurring at these
locations that resulted in an injury. This can be an indicator of the severity of accidents
that are occurring. For example, the intersection at Route 236 and Route 91 experienced
13 accidents, with 46% resulting in a personal injury. This is a fairly high injury rate for
such an intersection with a large amount of accidents.
________________________________________________________________
KACTS Long Range Transportation Plan - 2010-2035 - Page 25 -
TABLE 4: HIGH CRASH LOCATIONS IN KACTS AREA, 2006-2008
Town Location Description Total
Accidents
Critical
Rate Factor
% with
Injuries
Berwick Route 9, at Wilson Road and Route 236 18 1.11 28
Route 236 at New Dam Road 18 1.46 28
Hubbard Road near Bridge #6221 12 1.32 33
Route 236 near Regan Lane 16 1.27 25
Route 9 (School Street) near Wentworth Road 11 1.04 54
Kittery Route 1 at Route 103 (Walker Street) 21 1.20 33
Route 1 and Old Wilson Road Link 10 1.51 10
Route 1 at Mill Bridge 15 1.06 27
Lebanon none
S. Berwick Route 236/Route 4 (Main Street) at Portland Street 10 1.61 10
Route 236 at Route 91 (York Woods Road) 13 2.38 46
Route 236 at Main Street 10 1.63 0
Route 236 at Quarry Drive 9 1.74 44
Source: Maine Department of Transportation, Maine High Crash Location Listing, 2006-2008
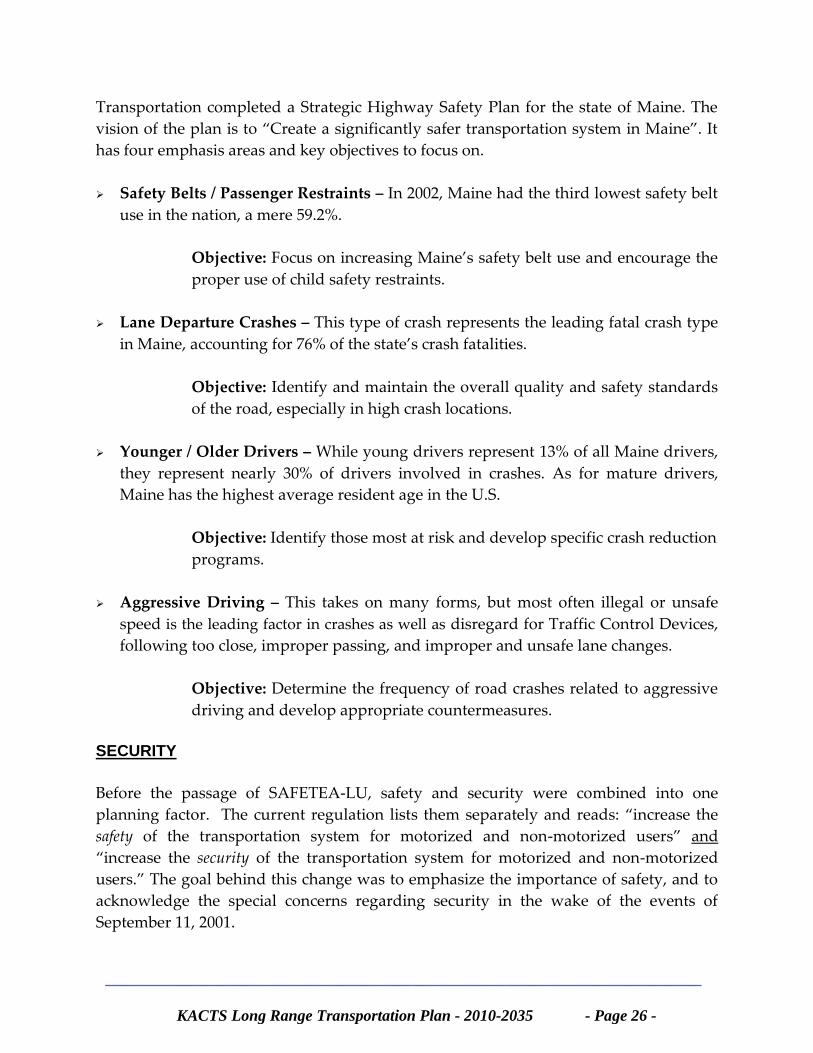
Table 14 shows historical crash trends for the KACTS area. The locations listed in this
table are those that have consistently been high crash locations for each three-year
period from 1996-2006. Note that the beginning and ending years of each counting
period overlap with preceding and following three-year periods.
TABLE 5: HISTORICAL CRASH TRENDS IN KACTS AREA, 1996-2008
Town Location 1996-
1998
1998-
2000
2000-
2002
2002-
2004
2004-
2006
2006-
2008
Berwick School Street at Allen Street &
Wilson Street 10 9 11 12 14 18
Kittery Traffic Circle at Rte 1 & 236 42 36 13 18 28 n/a
Shapleigh at Whipple Street &
Woodlawn Avenue 14 17 13 12 n/a n/a
S. Berwick Rte 236 at Main Street 12 9 8 8 13 10
Source: Maine Department of Transportation High Crash Location Listings, 1996-2006
As mentioned earlier, Federal requirements also require MPO long-rang plans to
comply with State Strategic Highway Safety Plans. In 2007 the Maine Department of
________________________________________________________________
KACTS Long Range Transportation Plan - 2010-2035 - Page 26 -
Transportation completed a Strategic Highway Safety Plan for the state of Maine. The
vision of the plan is to “Create a significantly safer transportation system in Maine”. It
has four emphasis areas and key objectives to focus on.
Safety Belts / Passenger Restraints – In 2002, Maine had the third lowest safety belt
use in the nation, a mere 59.2%.
Objective: Focus on increasing Maine’s safety belt use and encourage the
proper use of child safety restraints.
Lane Departure Crashes – This type of crash represents the leading fatal crash type
in Maine, accounting for 76% of the state’s crash fatalities.
Objective: Identify and maintain the overall quality and safety standards
of the road, especially in high crash locations.
Younger / Older Drivers – While young drivers represent 13% of all Maine drivers,
they represent nearly 30% of drivers involved in crashes. As for mature drivers,
Maine has the highest average resident age in the U.S.
Objective: Identify those most at risk and develop specific crash reduction
programs.
Aggressive Driving – This takes on many forms, but most often illegal or unsafe
speed is the leading factor in crashes as well as disregard for Traffic Control Devices,
following too close, improper passing, and improper and unsafe lane changes.
Objective: Determine the frequency of road crashes related to aggressive
driving and develop appropriate countermeasures.
SECURITY
Before the passage of SAFETEA-LU, safety and security were combined into one
planning factor. The current regulation lists them separately and reads: “increase the
safety of the transportation system for motorized and non-motorized users” and
“increase the security of the transportation system for motorized and non-motorized
users.” The goal behind this change was to emphasize the importance of safety, and to
acknowledge the special concerns regarding security in the wake of the events of
September 11, 2001.
________________________________________________________________
KACTS Long Range Transportation Plan - 2010-2035 - Page 27 -
The MPO has been actively involved with a bi-state (Maine and New Hampshire)
Traffic Incident Management Committee whose primary focus is on improving traffic
incident management on the region’s major roadways. Focus areas include,
interoperability, incident detection and verification, incident response and
preparedness, incident clearance, and the use of Intelligent Transportation Systems
(ITS) technology along the I-95 corridor and other major highways.
MPO member towns also have their own Hazard Mitigation Plans, which are
developed in coordination with transportation, law enforcement and operational
agencies. These plans address issues such as evacuation, mitigation and first-responder
actions.
The Portsmouth Naval Ship Yard, located within the MPO boundary, deserves the
highest level of security, not only for the base its self but for the transportation
infrastructure that supports it.
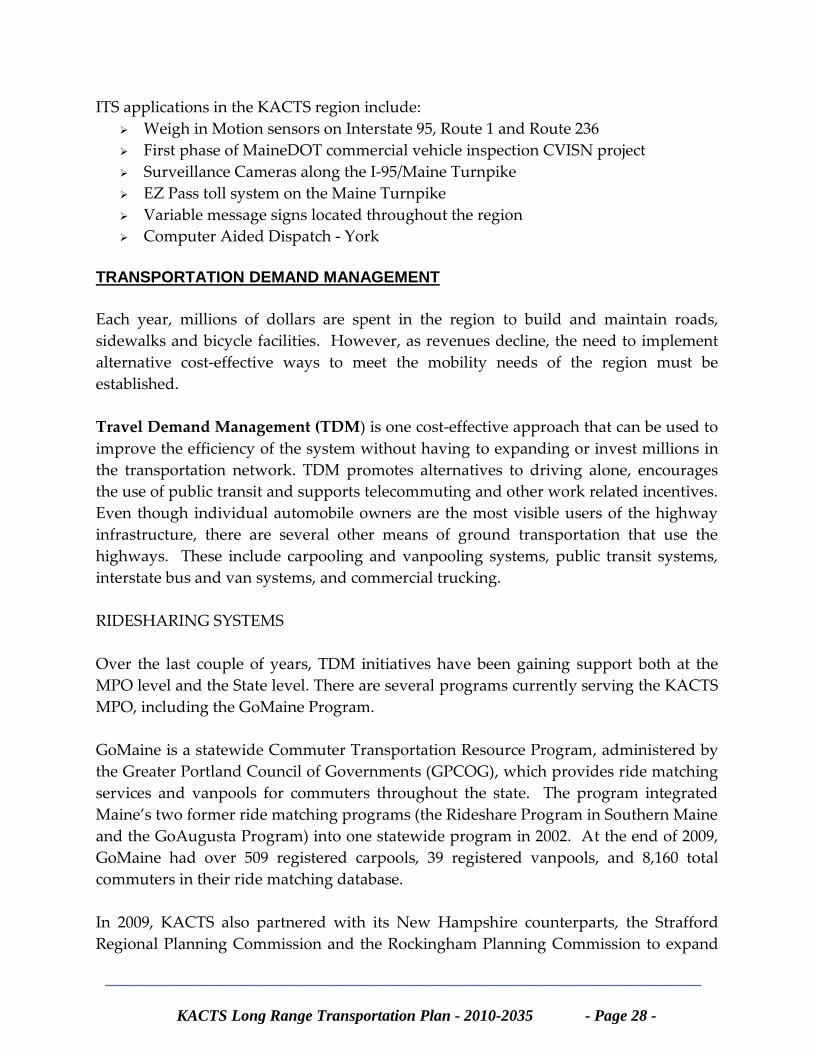
INTELIGENT TRANSPORTATION SYSTEMS (ITS)
Intelligent Transportation Systems are a broad range of technologies that can make the
existing transportation network safer and more efficient. Safety and efficiency are
among the principal goals of the KACTS LRTP, and ITS technology can be cheaper than
rebuilding the existing infrastructure. The MPO recognizes the need to continue to
develop sound ITS strategies moving forward. Various uses can include:
Congestion Management Dynamic message signs
Surveillance cameras and traffic monitoring
High-speed tolling
Traffic signal coordination
Transponders (EZ Pass)
Incident Management Surveillance cameras
Cell phone and radios
Variable message signs
Computer aided dispatch
Public Transit Automated vehicle tracking
Electronic fare payment
Real time information
________________________________________________________________
KACTS Long Range Transportation Plan - 2010-2035 - Page 28 -
ITS applications in the KACTS region include:
Weigh in Motion sensors on Interstate 95, Route 1 and Route 236
First phase of MaineDOT commercial vehicle inspection CVISN project
Surveillance Cameras along the I-95/Maine Turnpike
EZ Pass toll system on the Maine Turnpike
Variable message signs located throughout the region
Computer Aided Dispatch - York
TRANSPORTATION DEMAND MANAGEMENT
Each year, millions of dollars are spent in the region to build and maintain roads,
sidewalks and bicycle facilities. However, as revenues decline, the need to implement
alternative cost-effective ways to meet the mobility needs of the region must be
established.
Travel Demand Management (TDM) is one cost-effective approach that can be used to
improve the efficiency of the system without having to expanding or invest millions in
the transportation network. TDM promotes alternatives to driving alone, encourages
the use of public transit and supports telecommuting and other work related incentives.
Even though individual automobile owners are the most visible users of the highway
infrastructure, there are several other means of ground transportation that use the
highways. These include carpooling and vanpooling systems, public transit systems,
interstate bus and van systems, and commercial trucking.
RIDESHARING SYSTEMS
Over the last couple of years, TDM initiatives have been gaining support both at the
MPO level and the State level. There are several programs currently serving the KACTS
MPO, including the GoMaine Program.
GoMaine is a statewide Commuter Transportation Resource Program, administered by
the Greater Portland Council of Governments (GPCOG), which provides ride matching
services and vanpools for commuters throughout the state. The program integrated
Maine’s two former ride matching programs (the Rideshare Program in Southern Maine
and the GoAugusta Program) into one statewide program in 2002. At the end of 2009,
GoMaine had over 509 registered carpools, 39 registered vanpools, and 8,160 total
commuters in their ride matching database.
In 2009, KACTS also partnered with its New Hampshire counterparts, the Strafford
Regional Planning Commission and the Rockingham Planning Commission to expand
________________________________________________________________
KACTS Long Range Transportation Plan - 2010-2035 - Page 29 -
and strengthen the existing Seacoast Commuter Options Program.
KACTS has also reached out to the Naval Shipyard to explore the idea of broadening its
current vanpool fleet of 35. C & C Carriers also provides round trip transportation
services for Naval Shipyard workers living in the Sanford area.
Essential to the GoMaine program are the state’s Park and Ride lots. Currently, there
are three Park and Ride lots in the KACTS communities with others planned. A lot
exists in East Lebanon at the intersection of Route 202 and Depot Road. Although
GoMaine has not taken routine surveys of cars using lots, random windshield surveys
conducted in October 2009 revealed that on average only four vehicles used the 50
vehicle capacity lot on a daily basis. The town of South Berwick also operates a lot,
with approximately 20 spaces, behind the municipal building located along Main Street.
The lot was constructed in 1996 as a combination municipal / Park & Ride lot. The Town
of Berwick has shown some interest is utilizing a town owned facility as a potential lot,
and there are also plans to develop a lot on Route 4 in Berwick as development occurs.
The Wells Transportation Center, located off of Maine Turnpike Exit 19, also has 100
paved spaces available.
Findings from the South Berwick Feasibility Study concluded that more lots are needed
to serve the MPO communities and improve commuting traffic along the Route 236
Corridor. The study also recommended tying these lots into TDM measures to service
the commuter shed for the Naval Shipyard in Kittery, and the Pease International
Tradeport in Portsmouth. MaineDOT is currently revisiting this problem in conjunction
with the Maine Turnpike Authority (MTA) to study other areas where Park and Ride
lots should be considered.
________________________________________________________________
KACTS Long Range Transportation Plan - 2010-2035 - Page 30 -
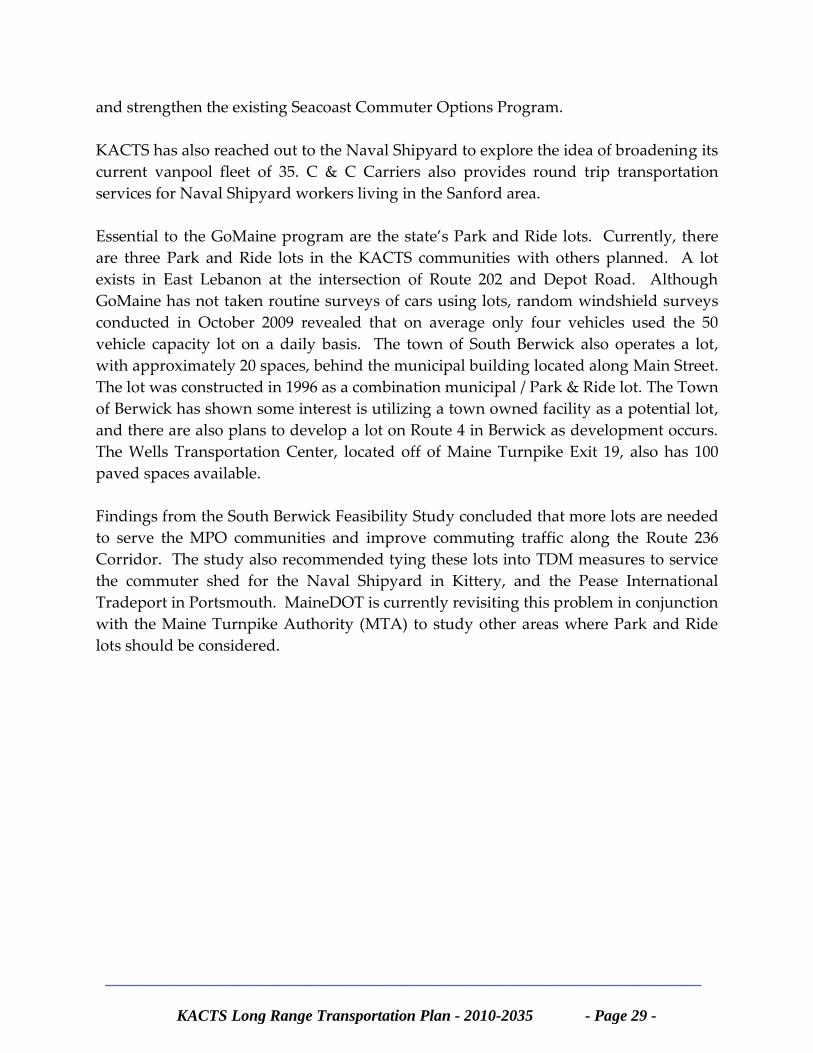
PUBLIC TRANSPORTATION SYSTEMS
There are two established public
transit organizations that serve the
KACTS area directly. York
County Community Action
Corporation (YCCAC) has made
public, demand-responsive transit
service available to every
municipality in the area since
before KACTS was formed in
1983. YCCAC remains the only
public transit provider in the
towns of Kittery, Eliot, South
Berwick, and Lebanon. The
Cooperative Alliance for Seacoast
Transportation (COAST) provides
fixed route service to the town of
Berwick.
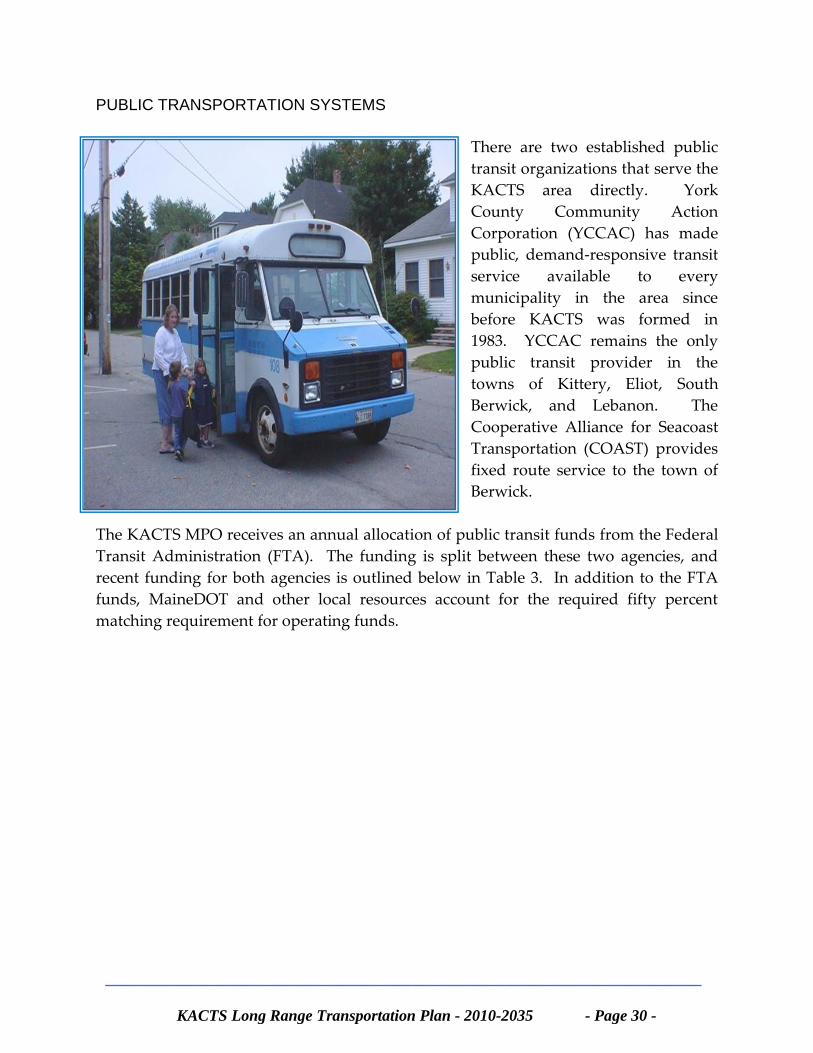
The KACTS MPO receives an annual allocation of public transit funds from the Federal
Transit Administration (FTA). The funding is split between these two agencies, and
recent funding for both agencies is outlined below in Table 3. In addition to the FTA
funds, MaineDOT and other local resources account for the required fifty percent
matching requirement for operating funds.
________________________________________________________________
KACTS Long Range Transportation Plan - 2010-2035 - Page 31 -
TABLE 6: RECENT FUNDING FOR KACTS PUBLIC TRANSIT
York County Community Action Corporation
Fiscal
Years
Federal Transit
Administration (FTA)
Matching Funds
(MaineDOT and Local)
Total
2006 $126,553 $126,553 $253,106
2007 $129,453 $129,453 $258,906
2008 $138,609 $138,609 $277,218
2009 $132,596 $132,596 $265,192
Cooperative Alliance for Seacoast Transportation (COAST)
Fiscal
Years
Federal Transit
Administration (FTA)
Matching Funds
(MaineDOT and Local)
Total
2006 $62,216 $62,216 $124,432
2007 $64,150 $64,150 $128,300
2008 $68,272 $68,272 $136,544
2009 $65,309 $65,309 $130,618
*Funding numbers are based on approximate figures. Source: SMRPC
YCCAC currently operates regularly scheduled demand responsive service to all towns
in the KACTS area for the general public. Riders are required to make a reservation 24
hours in advance. People are picked up at their homes and transported to medical
facilities and shopping, and are then returned to their homes. For residents in the
KACTS area, YCCAC transports riders to the Dover/Somersworth area, the
Portsmouth/Newington area, and Kittery. There is also a service that transports seniors
in Kittery and Eliot for medical appointments, shopping, miscellaneous errands, or
meal sites. Fares for both services are variable dependent upon income status of the
rider, age and other considerations. Some trips are paid for under contract. Although
not funded through the Federal Transit Administration, YCCAC also provides other
services in the KACTS communities including trips to Waban, a non-profit organization
that provides assistance to children and adults with developmental disabilities, as well
as trips for MaineCare eligible persons through a volunteer driver program.
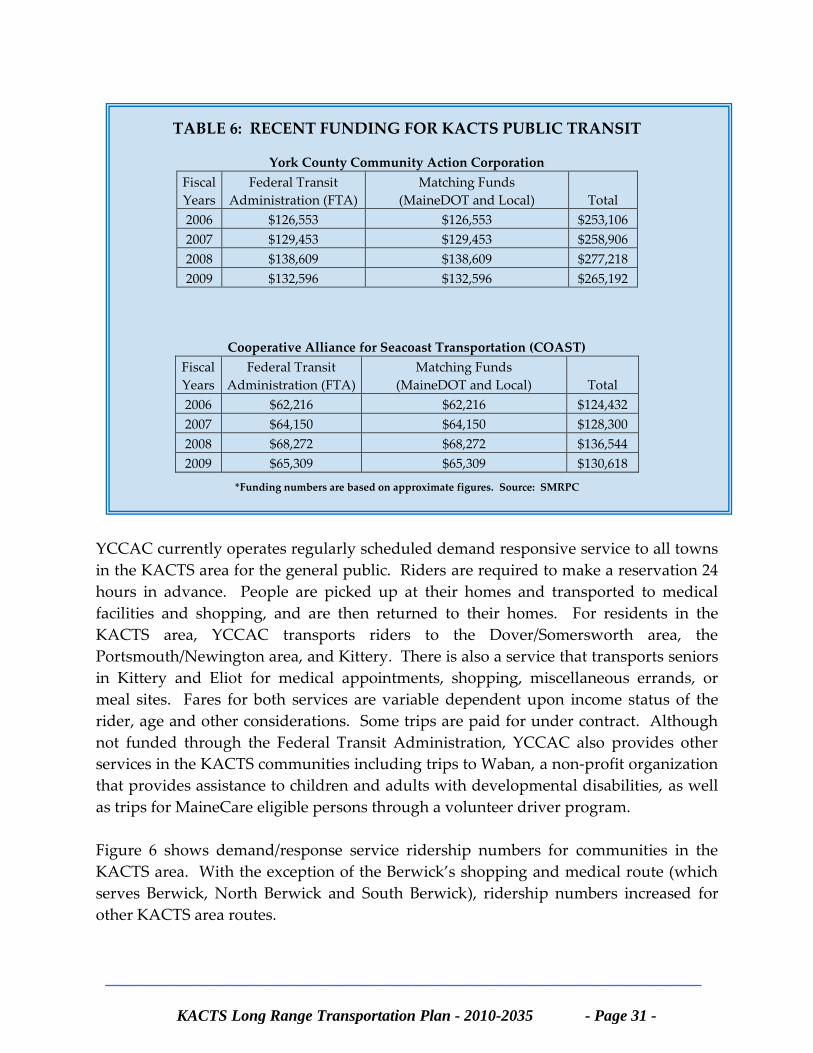
Figure 6 shows demand/response service ridership numbers for communities in the
KACTS area. With the exception of the Berwick’s shopping and medical route (which
serves Berwick, North Berwick and South Berwick), ridership numbers increased for
other KACTS area routes.
________________________________________________________________
KACTS Long Range Transportation Plan - 2010-2035 - Page 32 -
Source: YCCAC. Note: Data from York Trips is not available for FY 2006 and FY 2007.
The Cooperative Alliance for Seacoast Transportation (COAST) operates the only fixed
schedule bus route in the KACTS area. COAST Route 1 provides service between
Dover & Somersworth, New Hampshire, and Berwick, primarily along High Street in
Somersworth and Central Avenue in Dover. The service has 12 round trips a day, five
days a week, between 5:30am and 7:30pm. There is no service on the weekends. The
route has been in existence since 1990, although it has undergone a number of minor
changes from time to time.
The COAST fare is $1.50 for each trip, with half fare for the elderly, handicapped, and
Medicare recipients. Monthly passes for all COAST routes are available for $52 per
month and children under five don not have to pay a fare. Recent ridership for Route 1
is shown below.
________________________________________________________________
KACTS Long Range Transportation Plan - 2010-2035 - Page 33 -
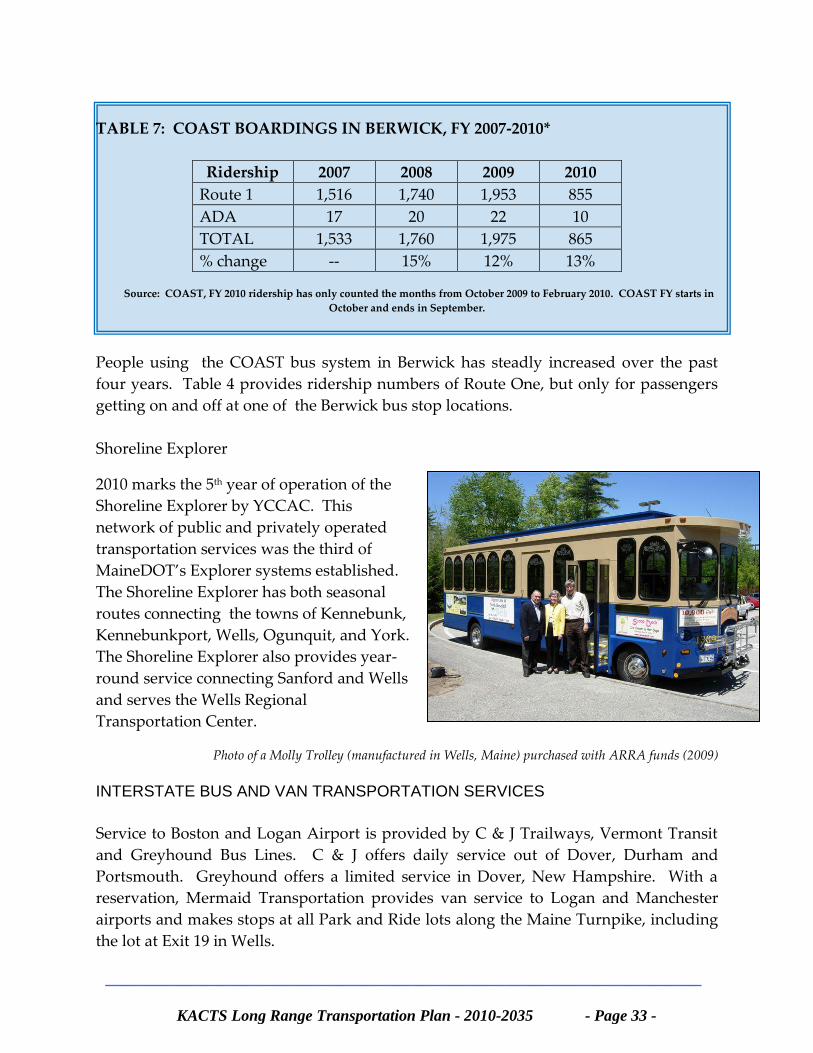
TABLE 7: COAST BOARDINGS IN BERWICK, FY 2007-2010*
Ridership 2007 2008 2009 2010
Route 1 1,516 1,740 1,953 855
ADA 17 20 22 10
TOTAL 1,533 1,760 1,975 865
% change -- 15% 12% 13%
Source: COAST, FY 2010 ridership has only counted the months from October 2009 to February 2010. COAST FY starts in
October and ends in September.
People using the COAST bus system in Berwick has steadly increased over the past
four years. Table 4 provides ridership numbers of Route One, but only for passengers
getting on and off at one of the Berwick bus stop locations.
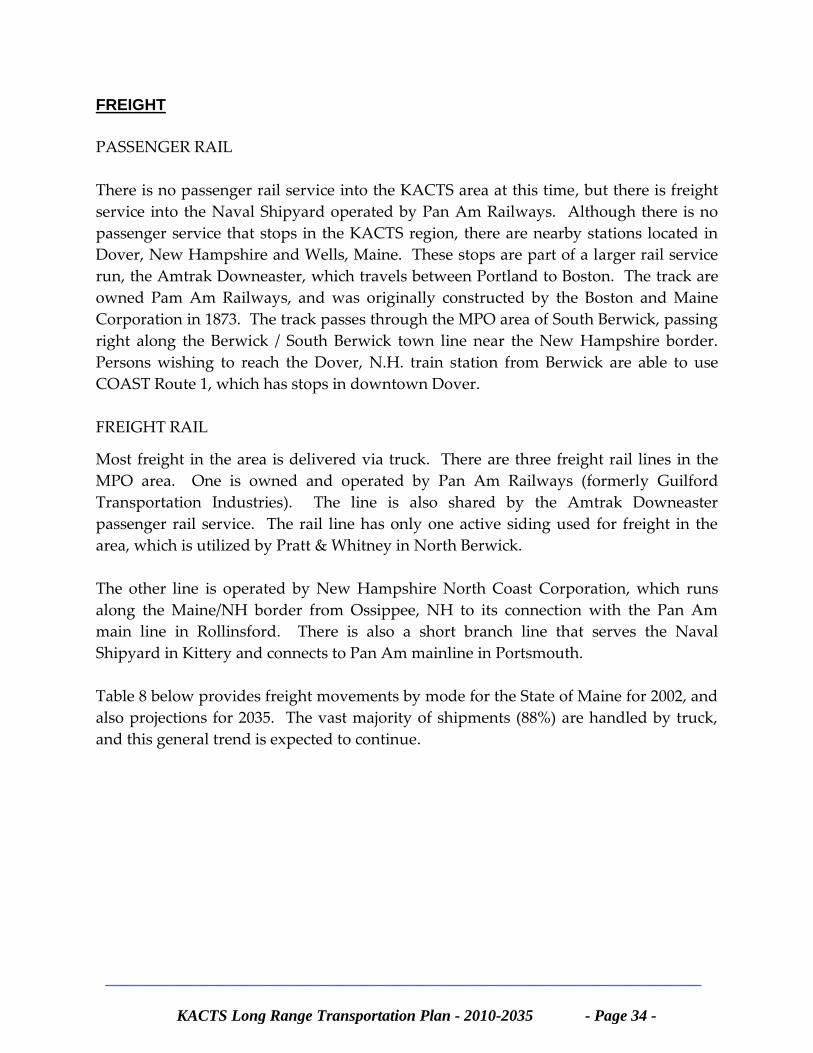
Shoreline Explorer
2010 marks the 5th year of operation of the
Shoreline Explorer by YCCAC. This
network of public and privately operated
transportation services was the third of
MaineDOT’s Explorer systems established.
The Shoreline Explorer has both seasonal
routes connecting the towns of Kennebunk,
Kennebunkport, Wells, Ogunquit, and York.
The Shoreline Explorer also provides year-
round service connecting Sanford and Wells
and serves the Wells Regional
Transportation Center.
Photo of a Molly Trolley (manufactured in Wells, Maine) purchased with ARRA funds (2009)
INTERSTATE BUS AND VAN TRANSPORTATION SERVICES
Service to Boston and Logan Airport is provided by C & J Trailways, Vermont Transit
and Greyhound Bus Lines. C & J offers daily service out of Dover, Durham and
Portsmouth. Greyhound offers a limited service in Dover, New Hampshire. With a
reservation, Mermaid Transportation provides van service to Logan and Manchester
airports and makes stops at all Park and Ride lots along the Maine Turnpike, including
the lot at Exit 19 in Wells.
________________________________________________________________
KACTS Long Range Transportation Plan - 2010-2035 - Page 34 -
FREIGHT
PASSENGER RAIL
There is no passenger rail service into the KACTS area at this time, but there is freight
service into the Naval Shipyard operated by Pan Am Railways. Although there is no
passenger service that stops in the KACTS region, there are nearby stations located in
Dover, New Hampshire and Wells, Maine. These stops are part of a larger rail service
run, the Amtrak Downeaster, which travels between Portland to Boston. The track are
owned Pam Am Railways, and was originally constructed by the Boston and Maine
Corporation in 1873. The track passes through the MPO area of South Berwick, passing
right along the Berwick / South Berwick town line near the New Hampshire border.
Persons wishing to reach the Dover, N.H. train station from Berwick are able to use
COAST Route 1, which has stops in downtown Dover.
FREIGHT RAIL
Most freight in the area is delivered via truck. There are three freight rail lines in the
MPO area. One is owned and operated by Pan Am Railways (formerly Guilford
Transportation Industries). The line is also shared by the Amtrak Downeaster
passenger rail service. The rail line has only one active siding used for freight in the
area, which is utilized by Pratt & Whitney in North Berwick.
The other line is operated by New Hampshire North Coast Corporation, which runs
along the Maine/NH border from Ossippee, NH to its connection with the Pan Am
main line in Rollinsford. There is also a short branch line that serves the Naval
Shipyard in Kittery and connects to Pan Am mainline in Portsmouth.
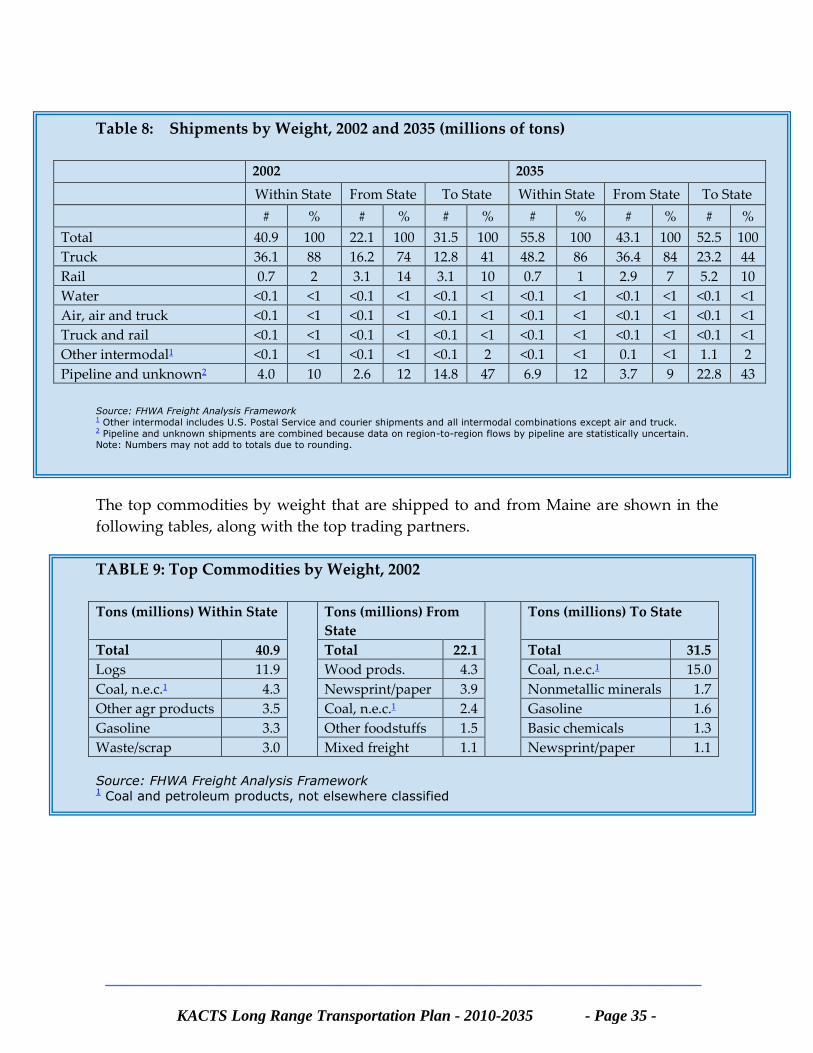
Table 8 below provides freight movements by mode for the State of Maine for 2002, and
also projections for 2035. The vast majority of shipments (88%) are handled by truck,
and this general trend is expected to continue.
________________________________________________________________
KACTS Long Range Transportation Plan - 2010-2035 - Page 35 -
Table 8: Shipments by Weight, 2002 and 2035 (millions of tons)
2002 2035
Within State From State To State Within State From State To State
# % # % # % # % # % # %
Total 40.9 100 22.1 100 31.5 100 55.8 100 43.1 100 52.5 100
Truck 36.1 88 16.2 74 12.8 41 48.2 86 36.4 84 23.2 44
Rail 0.7 2 3.1 14 3.1 10 0.7 1 2.9 7 5.2 10
Water <0.1 <1 <0.1 <1 <0.1 <1 <0.1 <1 <0.1 <1 <0.1 <1
Air, air and truck <0.1 <1 <0.1 <1 <0.1 <1 <0.1 <1 <0.1 <1 <0.1 <1
Truck and rail <0.1 <1 <0.1 <1 <0.1 <1 <0.1 <1 <0.1 <1 <0.1 <1
Other intermodal1 <0.1 <1 <0.1 <1 <0.1 2 <0.1 <1 0.1 <1 1.1 2
Pipeline and unknown2 4.0 10 2.6 12 14.8 47 6.9 12 3.7 9 22.8 43
Source: FHWA Freight Analysis Framework
1 Other intermodal includes U.S. Postal Service and courier shipments and all intermodal combinations except air and truck. 2 Pipeline and unknown shipments are combined because data on region-to-region flows by pipeline are statistically uncertain. Note: Numbers may not add to totals due to rounding.
The top commodities by weight that are shipped to and from Maine are shown in the
following tables, along with the top trading partners.
TABLE 9: Top Commodities by Weight, 2002
Tons (millions) Within State Tons (millions) From
State Tons (millions) To State
Total 40.9 Total 22.1 Total 31.5
Logs 11.9 Wood prods. 4.3 Coal, n.e.c.1 15.0
Coal, n.e.c.1 4.3 Newsprint/paper 3.9 Nonmetallic minerals 1.7
Other agr products 3.5 Coal, n.e.c.1 2.4 Gasoline 1.6
Gasoline 3.3 Other foodstuffs 1.5 Basic chemicals 1.3
Waste/scrap 3.0 Mixed freight 1.1 Newsprint/paper 1.1
Source: FHWA Freight Analysis Framework
1 Coal and petroleum products, not elsewhere classified
________________________________________________________________
KACTS Long Range Transportation Plan - 2010-2035 - Page 36 -
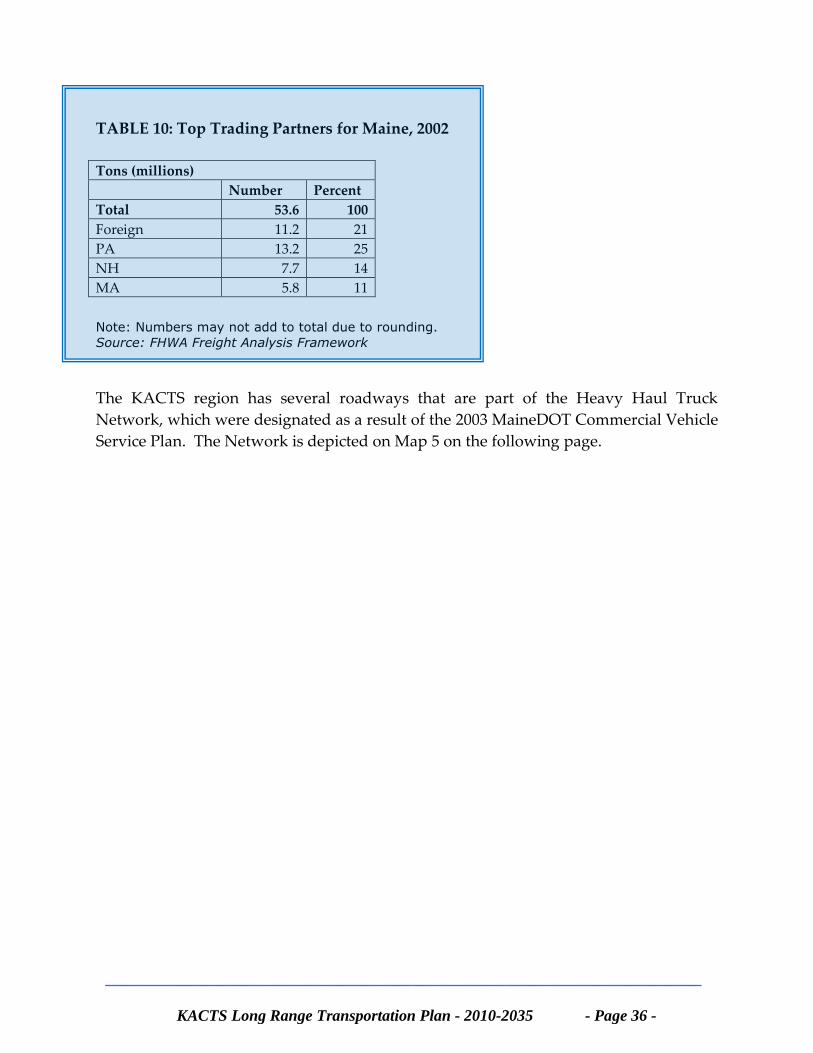
TABLE 10: Top Trading Partners for Maine, 2002
Tons (millions)
Number Percent
Total 53.6 100
Foreign 11.2 21
PA 13.2 25
NH 7.7 14
MA 5.8 11
Note: Numbers may not add to total due to rounding.
Source: FHWA Freight Analysis Framework
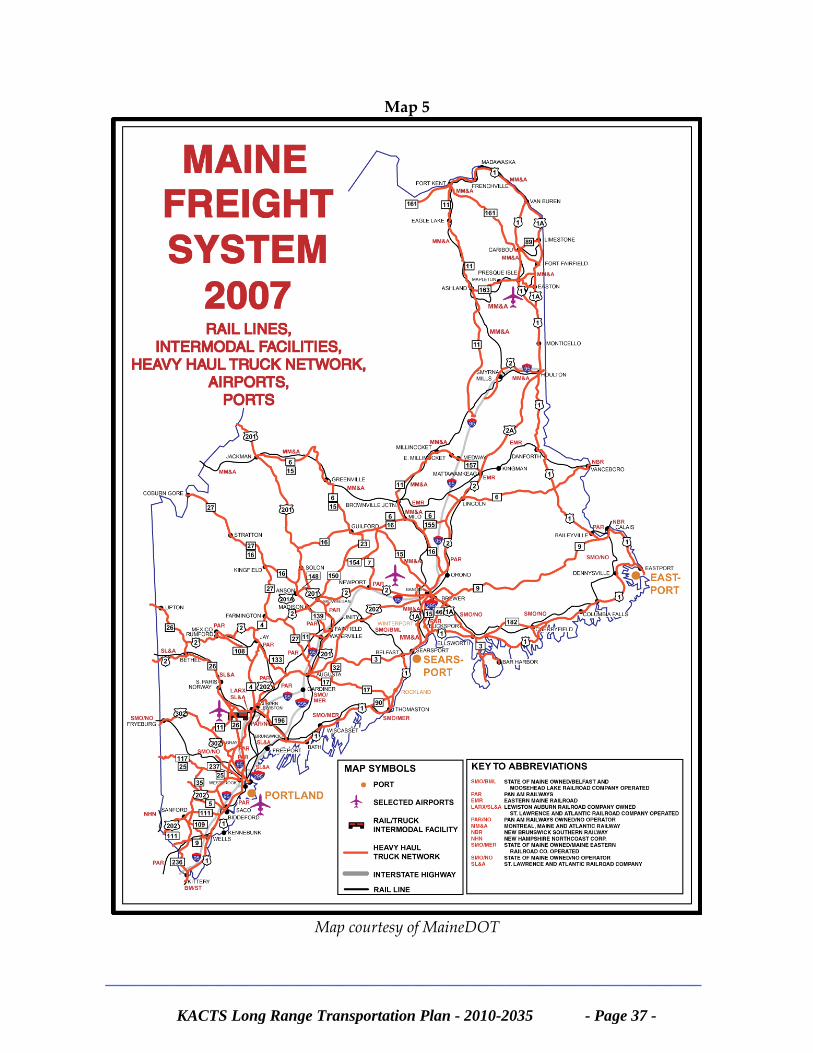
The KACTS region has several roadways that are part of the Heavy Haul Truck
Network, which were designated as a result of the 2003 MaineDOT Commercial Vehicle
Service Plan. The Network is depicted on Map 5 on the following page.
________________________________________________________________
KACTS Long Range Transportation Plan - 2010-2035 - Page 37 -
Map 5
Map courtesy of MaineDOT
________________________________________________________________
KACTS Long Range Transportation Plan - 2010-2035 - Page 38 -
The KACTS Committee has been involved in several aspects of the region’s freight
network. KACTS assisted MaineDOT in locating options for an additional truck rest
area in the southern part of York County. MaineDOT conducted a Commercial Vehicle
Service Plan in 2003, which found that the biggest need for an overnight rest area
locations was south of Portland along Interstate 95. The site in Kittery that was selected
is owned by Irving Corporation and has become a good example of a public/private
partnership – expanding the previous Howell’s Truck Stop and installing additional
amenities for drivers.
MaineDOT has also invested in ITS technology in the KACTS area and more modern,
efficient motor carrier enforcement with the completion of the Advanced Commercial
Vehicle Screening System (ACVSS) at the Kittery I-95 truck weigh area. The project
used federal funding to modernize and automate how the State Police handles truck
size and weight enforcement. As the traffic proceeds up the ramp, a Weigh in Motion
(WIM) strip is utilized to determine weight compliance. Also in the same location of the
WIM, there is an Optical Character Reader, (OCR). This checks the USDOT number on
the side of the truck for potential “flags” related to safety ratings, suspensions, or other
items of interest. Compliant trucks will benefit by being released more quickly while
State Police officials will be able to better focus their enforcement efforts.
With the completion of this project, focus will now turn towards identifying funding for
I-95 York truck enforcement facility. Taken together, these upgrades will both ensure
that the Maine’s road and bridge infrastructure is protected and that compliant carriers
are able to move their products to and from market in a quicker manner
KACTS has also been involved in the policies and permit procedures that affect truck
Overlimit Permitting in the southern York County region. A series of meetings was
organized in 2006, which focused on how the permits are issued and which routes are
recommended for transport. The meetings included:
Municipal representatives
Maine Turnpike Authority
MaineDOT
Bureau of Motor Vehicles (responsible for issuing permits)
State Police – Commercial Vehicle Enforcement Division
Manufactured Housing Association of Maine
The meetings increased communication between the agencies and the municipalities in
the KACTS area regarding the permits, and also allowed the agencies to hear concerns
from the municipalities and concerned citizens. KACTS produces a yearly summary of
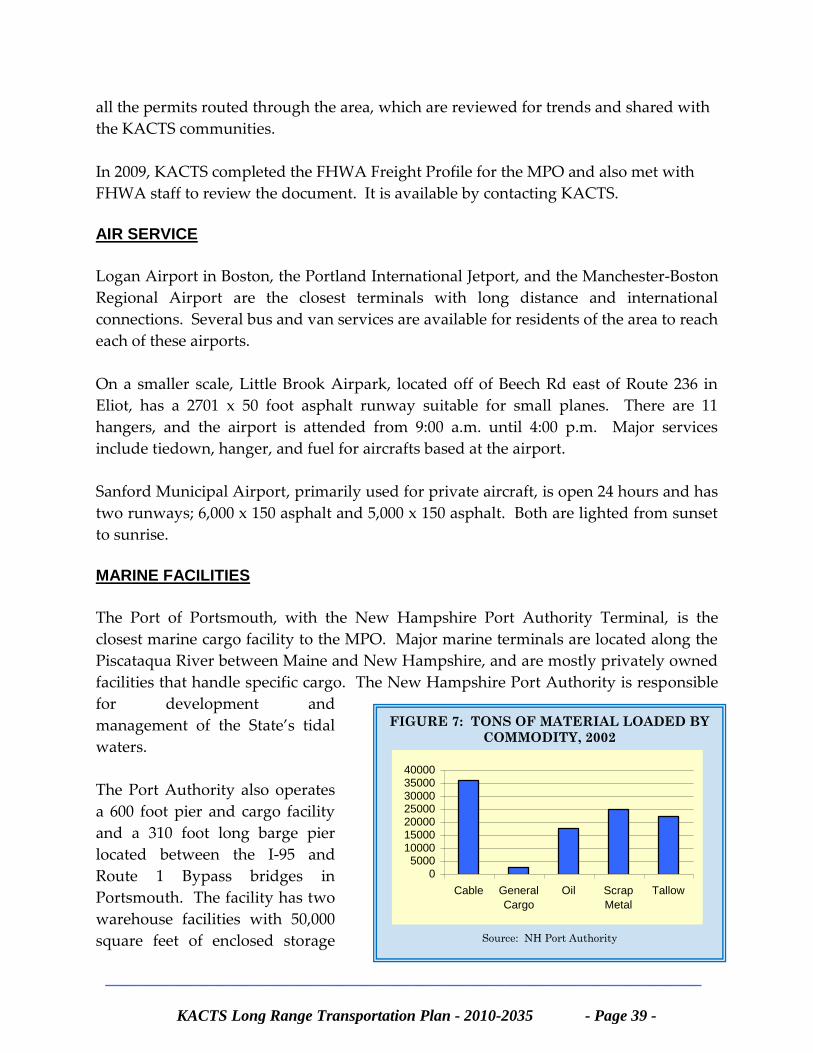
________________________________________________________________
KACTS Long Range Transportation Plan - 2010-2035 - Page 39 -
all the permits routed through the area, which are reviewed for trends and shared with
the KACTS communities.
In 2009, KACTS completed the FHWA Freight Profile for the MPO and also met with
FHWA staff to review the document. It is available by contacting KACTS.
AIR SERVICE
Logan Airport in Boston, the Portland International Jetport, and the Manchester-Boston
Regional Airport are the closest terminals with long distance and international
connections. Several bus and van services are available for residents of the area to reach
each of these airports.
On a smaller scale, Little Brook Airpark, located off of Beech Rd east of Route 236 in
Eliot, has a 2701 x 50 foot asphalt runway suitable for small planes. There are 11
hangers, and the airport is attended from 9:00 a.m. until 4:00 p.m. Major services
include tiedown, hanger, and fuel for aircrafts based at the airport.
Sanford Municipal Airport, primarily used for private aircraft, is open 24 hours and has
two runways; 6,000 x 150 asphalt and 5,000 x 150 asphalt. Both are lighted from sunset
to sunrise.
MARINE FACILITIES
The Port of Portsmouth, with the New Hampshire Port Authority Terminal, is the
closest marine cargo facility to the MPO. Major marine terminals are located along the
Piscataqua River between Maine and New Hampshire, and are mostly privately owned
facilities that handle specific cargo. The New Hampshire Port Authority is responsible
for development and
management of the State’s tidal
waters.
The Port Authority also operates
a 600 foot pier and cargo facility
and a 310 foot long barge pier
located between the I-95 and
Route 1 Bypass bridges in
Portsmouth. The facility has two
warehouse facilities with 50,000
square feet of enclosed storage
FIGURE 7: TONS OF MATERIAL LOADED BY
COMMODITY, 2002
05000
10000150002000025000300003500040000
Cable General
Cargo
Oil Scrap
Metal
Tallow
Source: NH Port Authority
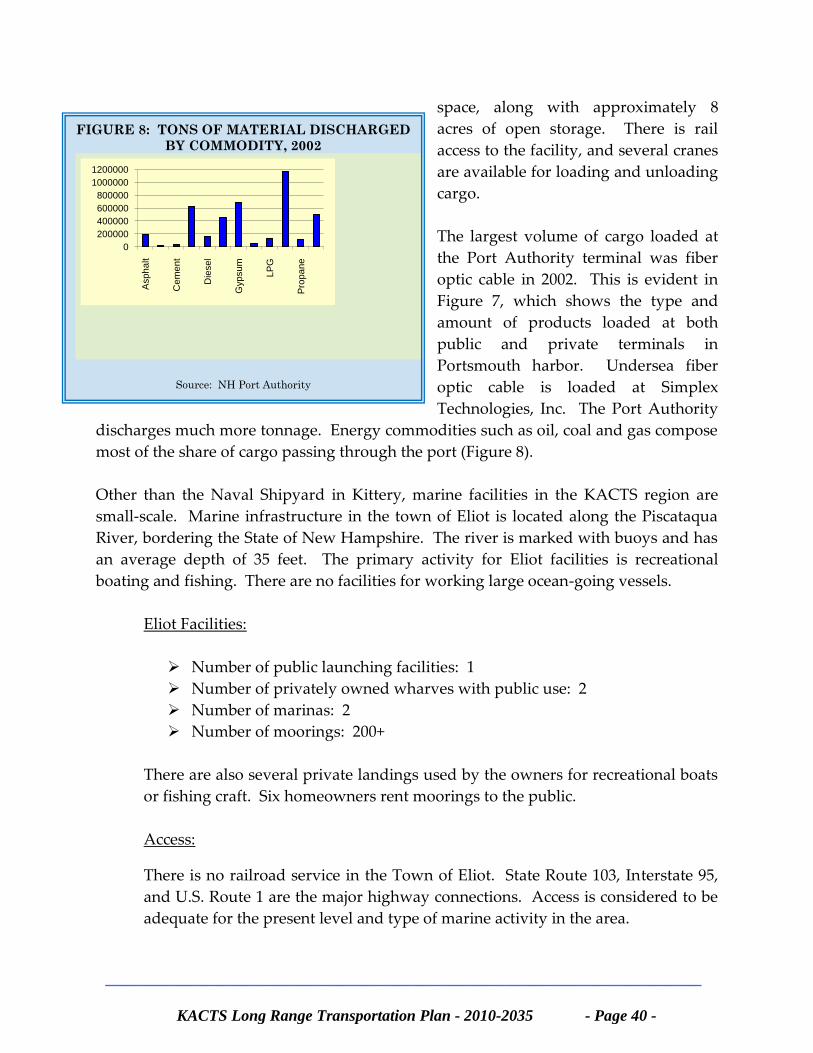
________________________________________________________________
KACTS Long Range Transportation Plan - 2010-2035 - Page 40 -
FIGURE 8: TONS OF MATERIAL DISCHARGED
BY COMMODITY, 2002
0
200000
400000
600000
800000
1000000
1200000
Asp
ha
lt
Ce
men
t
Die
se
l
Gyp
su
m
LP
G
Pro
pa
ne
Source: NH Port Authority
space, along with approximately 8
acres of open storage. There is rail
access to the facility, and several cranes
are available for loading and unloading
cargo.
The largest volume of cargo loaded at
the Port Authority terminal was fiber
optic cable in 2002. This is evident in
Figure 7, which shows the type and
amount of products loaded at both
public and private terminals in
Portsmouth harbor. Undersea fiber
optic cable is loaded at Simplex
Technologies, Inc. The Port Authority
discharges much more tonnage. Energy commodities such as oil, coal and gas compose
most of the share of cargo passing through the port (Figure 8).
Other than the Naval Shipyard in Kittery, marine facilities in the KACTS region are
small-scale. Marine infrastructure in the town of Eliot is located along the Piscataqua
River, bordering the State of New Hampshire. The river is marked with buoys and has
an average depth of 35 feet. The primary activity for Eliot facilities is recreational
boating and fishing. There are no facilities for working large ocean-going vessels.
Eliot Facilities:
Number of public launching facilities: 1
Number of privately owned wharves with public use: 2
Number of marinas: 2
Number of moorings: 200+
There are also several private landings used by the owners for recreational boats
or fishing craft. Six homeowners rent moorings to the public.
Access:
There is no railroad service in the Town of Eliot. State Route 103, Interstate 95,
and U.S. Route 1 are the major highway connections. Access is considered to be
adequate for the present level and type of marine activity in the area.
________________________________________________________________
KACTS Long Range Transportation Plan - 2010-2035 - Page 41 -
Aside for the Naval Shipyard, Kittery has some smaller harbor facilities. They are
located on the north side of the Piscataqua River basin and Portsmouth Harbor. A
lighted whistle buoy, Whaleback Light, and the Portsmouth Harbor Light at New Castle
mark the entrance to the harbor, and the channel is marked with buoys, lighted buoys,
and day beacons. The primary activities on the Kittery side of the harbor, with the
exception of the Naval Shipyard, are fishing and recreational boating. There are no
docking facilities outside of the Naval Yard for working large ocean-going vessels.
Facilities:
Number of publicly owned wharves: 2
Number of publicly owned launching facilities: 2
Number of privately owned wharves with public use: 5
Number of privately owned launches with public use: 1
Number of marinas: 3
Number of moorings: 300 with berthing spaces 2,889 linear feet
Access:
Kittery has limited access to the Boston and Maine Railroad, which operates a
spur serving the Shipyard. The major highway connections are Interstate 95, U.S.
Route 1, State Routes 103 and 236. Rail and highway services are considered
adequate for the level and type of port activity.
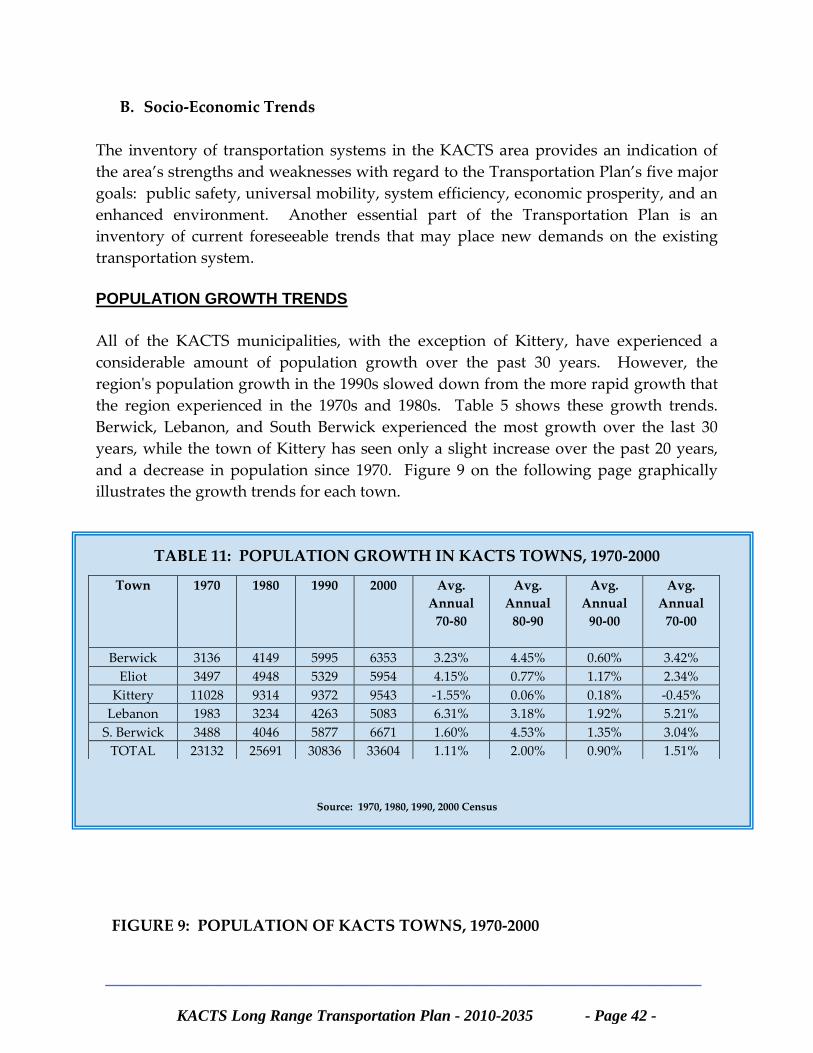
________________________________________________________________
KACTS Long Range Transportation Plan - 2010-2035 - Page 42 -
B. Socio-Economic Trends
The inventory of transportation systems in the KACTS area provides an indication of
the area’s strengths and weaknesses with regard to the Transportation Plan’s five major
goals: public safety, universal mobility, system efficiency, economic prosperity, and an
enhanced environment. Another essential part of the Transportation Plan is an
inventory of current foreseeable trends that may place new demands on the existing
transportation system.
POPULATION GROWTH TRENDS
All of the KACTS municipalities, with the exception of Kittery, have experienced a
considerable amount of population growth over the past 30 years. However, the
region's population growth in the 1990s slowed down from the more rapid growth that
the region experienced in the 1970s and 1980s. Table 5 shows these growth trends.
Berwick, Lebanon, and South Berwick experienced the most growth over the last 30
years, while the town of Kittery has seen only a slight increase over the past 20 years,
and a decrease in population since 1970. Figure 9 on the following page graphically
illustrates the growth trends for each town.
TABLE 11: POPULATION GROWTH IN KACTS TOWNS, 1970-2000
Source: 1970, 1980, 1990, 2000 Census
FIGURE 9: POPULATION OF KACTS TOWNS, 1970-2000
Town 1970 1980 1990 2000 Avg.
Annual
70-80
Avg.
Annual
80-90
Avg.
Annual
90-00
Avg.
Annual
70-00
Berwick 3136 4149 5995 6353 3.23% 4.45% 0.60% 3.42%
Eliot 3497 4948 5329 5954 4.15% 0.77% 1.17% 2.34%
Kittery 11028 9314 9372 9543 -1.55% 0.06% 0.18% -0.45%
Lebanon 1983 3234 4263 5083 6.31% 3.18% 1.92% 5.21%
S. Berwick 3488 4046 5877 6671 1.60% 4.53% 1.35% 3.04%
TOTAL 23132 25691 30836 33604 1.11% 2.00% 0.90% 1.51%
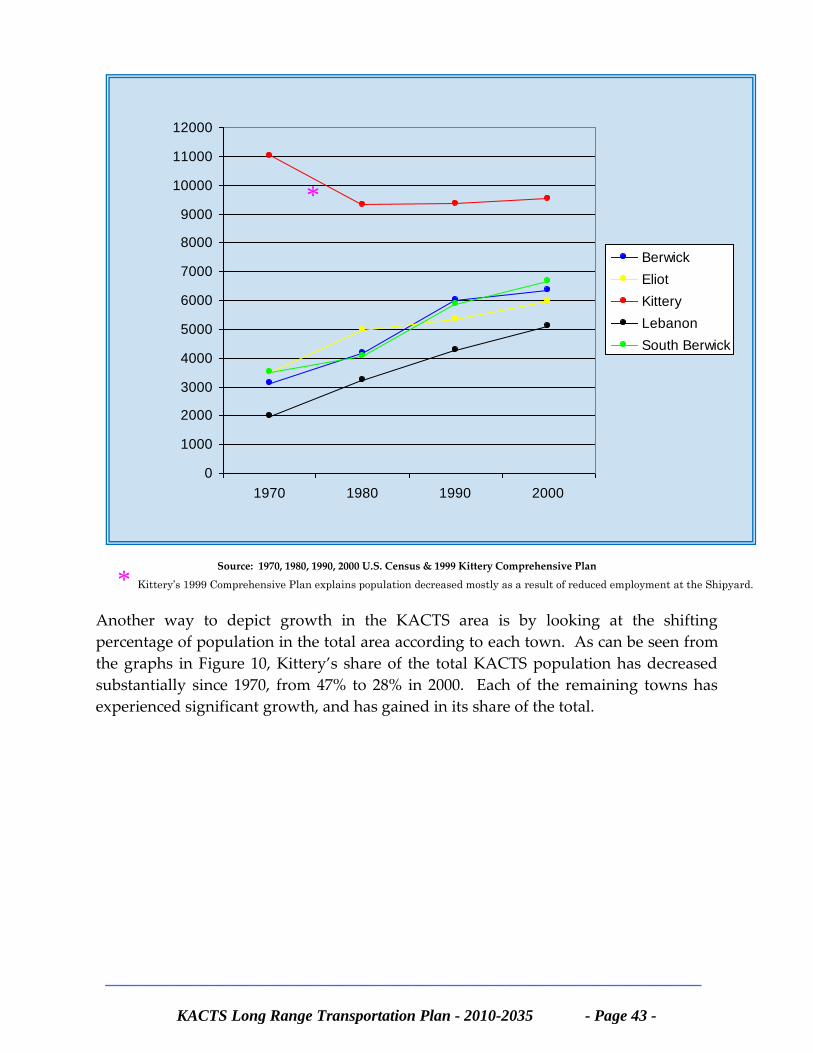
________________________________________________________________
KACTS Long Range Transportation Plan - 2010-2035 - Page 43 -
*
Source: 1970, 1980, 1990, 2000 U.S. Census & 1999 Kittery Comprehensive Plan
Another way to depict growth in the KACTS area is by looking at the shifting
percentage of population in the total area according to each town. As can be seen from
the graphs in Figure 10, Kittery’s share of the total KACTS population has decreased
substantially since 1970, from 47% to 28% in 2000. Each of the remaining towns has
experienced significant growth, and has gained in its share of the total.
0
1000
2000
3000
4000
5000
6000
7000
8000
9000
10000
11000
12000
1970 1980 1990 2000
Berwick
Eliot
Kittery
Lebanon
South Berwick
* Kittery’s 1999 Comprehensive Plan explains population decreased mostly as a result of reduced employment at the Shipyard.
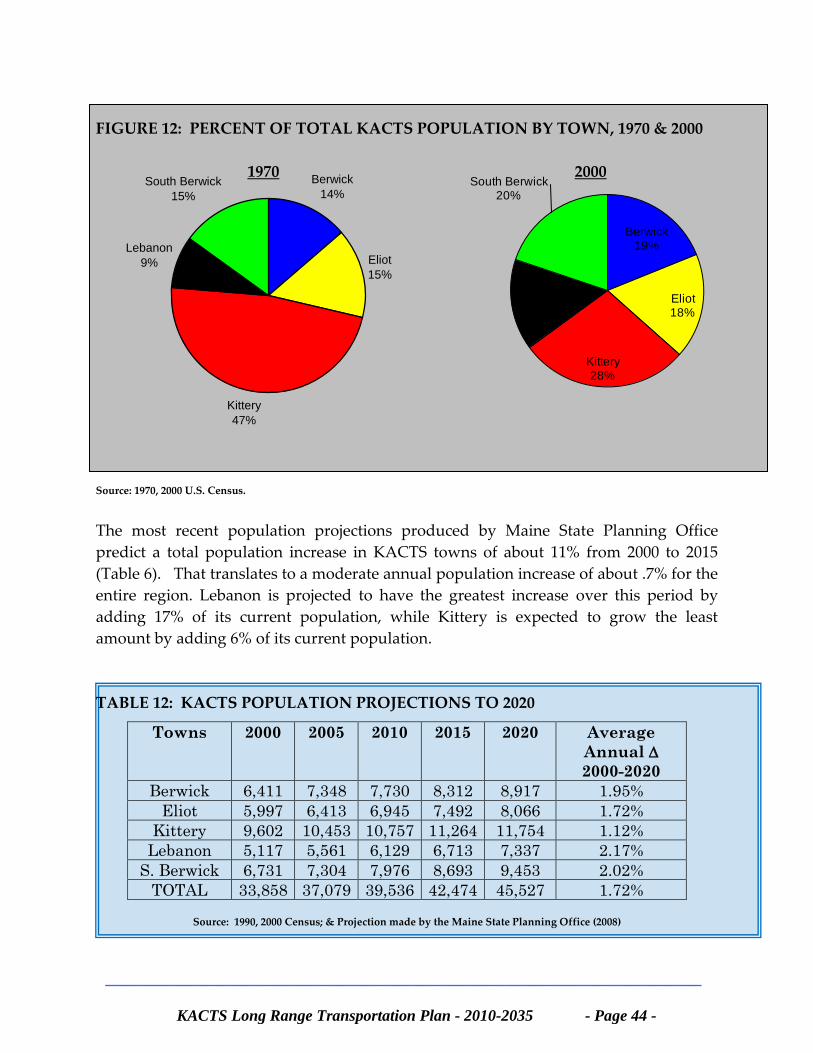
________________________________________________________________
KACTS Long Range Transportation Plan - 2010-2035 - Page 44 -
Berwick
14%
Eliot
15%
Kittery
47%
Lebanon
9%
South Berwick
15%
FIGURE 12: PERCENT OF TOTAL KACTS POPULATION BY TOWN, 1970 & 2000
1970 2000
Source: 1970, 2000 U.S. Census.
The most recent population projections produced by Maine State Planning Office
predict a total population increase in KACTS towns of about 11% from 2000 to 2015
(Table 6). That translates to a moderate annual population increase of about .7% for the
entire region. Lebanon is projected to have the greatest increase over this period by
adding 17% of its current population, while Kittery is expected to grow the least
amount by adding 6% of its current population.
TABLE 12: KACTS POPULATION PROJECTIONS TO 2020
Source: 1990, 2000 Census; & Projection made by the Maine State Planning Office (2008)
Towns 2000 2005 2010 2015 2020 Average
Annual
2000-2020
Berwick 6,411 7,348 7,730 8,312 8,917 1.95%
Eliot 5,997 6,413 6,945 7,492 8,066 1.72%
Kittery 9,602 10,453 10,757 11,264 11,754 1.12%
Lebanon 5,117 5,561 6,129 6,713 7,337 2.17%
S. Berwick 6,731 7,304 7,976 8,693 9,453 2.02%
TOTAL 33,858 37,079 39,536 42,474 45,527 1.72%
Berwick19%
Eliot18%
Kittery28%
Lebanon15%
South Berwick20%
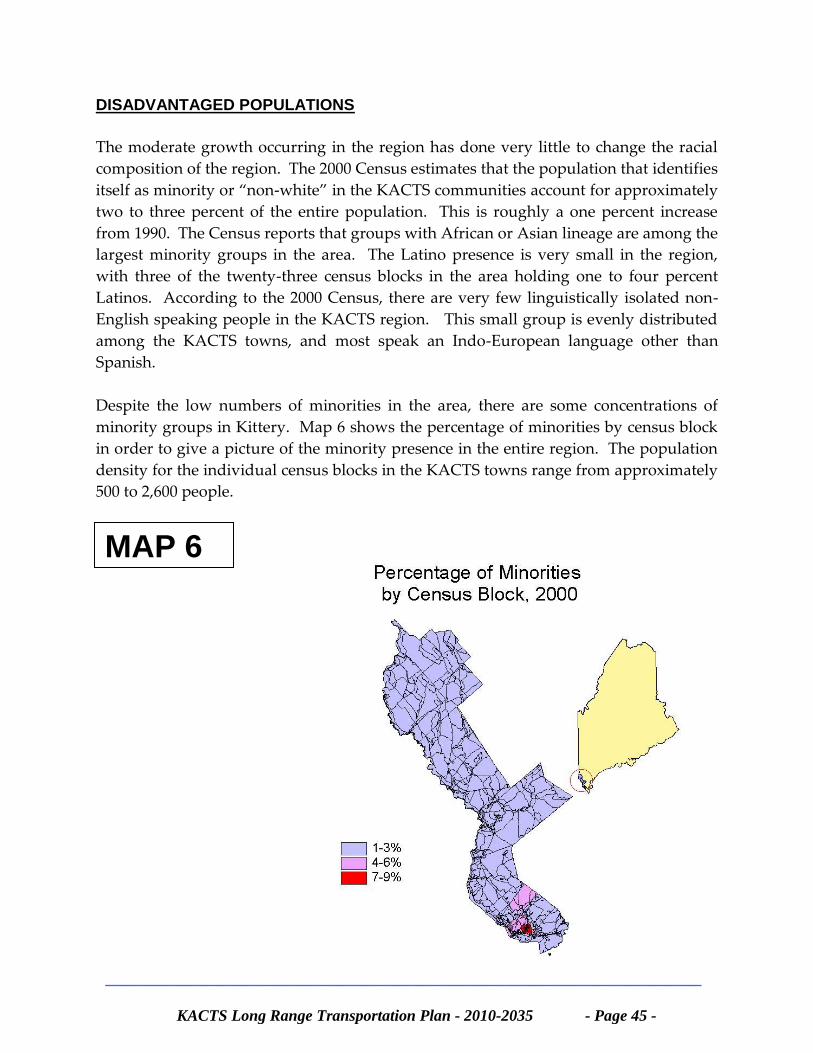
________________________________________________________________
KACTS Long Range Transportation Plan - 2010-2035 - Page 45 -
DISADVANTAGED POPULATIONS
The moderate growth occurring in the region has done very little to change the racial
composition of the region. The 2000 Census estimates that the population that identifies
itself as minority or “non-white” in the KACTS communities account for approximately
two to three percent of the entire population. This is roughly a one percent increase
from 1990. The Census reports that groups with African or Asian lineage are among the
largest minority groups in the area. The Latino presence is very small in the region,
with three of the twenty-three census blocks in the area holding one to four percent
Latinos. According to the 2000 Census, there are very few linguistically isolated non-
English speaking people in the KACTS region. This small group is evenly distributed
among the KACTS towns, and most speak an Indo-European language other than
Spanish.
Despite the low numbers of minorities in the area, there are some concentrations of
minority groups in Kittery. Map 6 shows the percentage of minorities by census block
in order to give a picture of the minority presence in the entire region. The population
density for the individual census blocks in the KACTS towns range from approximately
500 to 2,600 people.
MAP 6
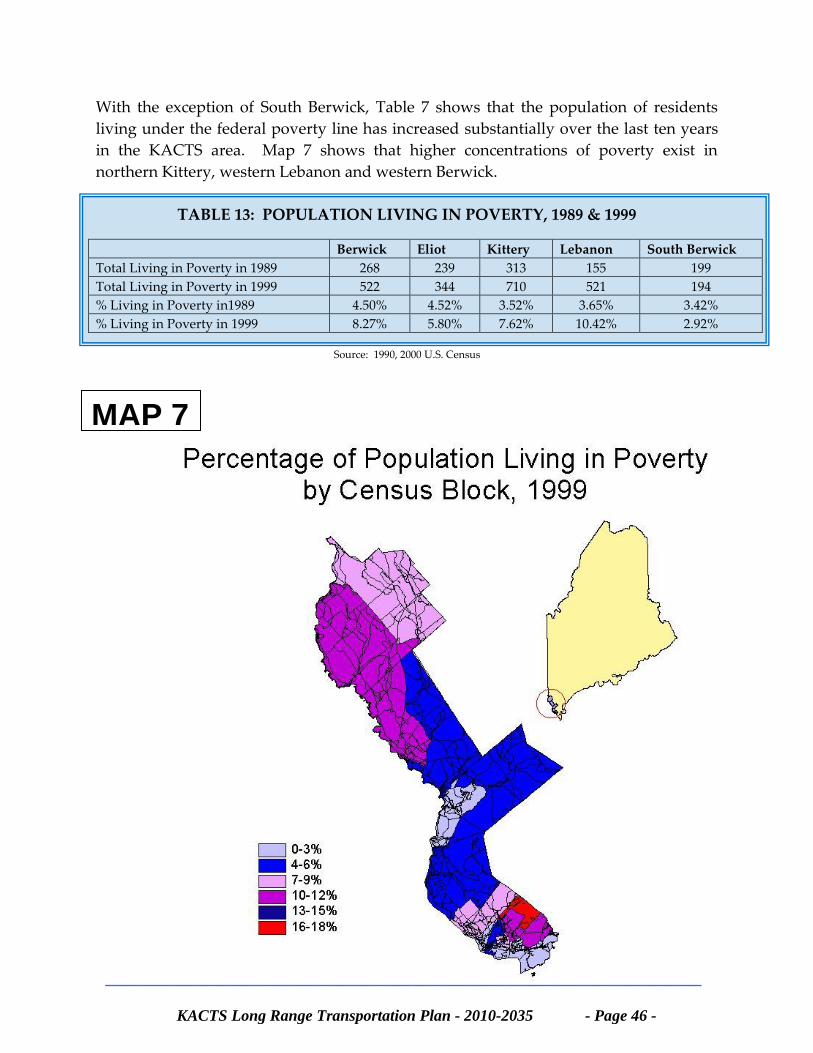
________________________________________________________________
KACTS Long Range Transportation Plan - 2010-2035 - Page 46 -
With the exception of South Berwick, Table 7 shows that the population of residents
living under the federal poverty line has increased substantially over the last ten years
in the KACTS area. Map 7 shows that higher concentrations of poverty exist in
northern Kittery, western Lebanon and western Berwick.
TABLE 13: POPULATION LIVING IN POVERTY, 1989 & 1999
Berwick Eliot Kittery Lebanon South Berwick
Total Living in Poverty in 1989 268 239 313 155 199
Total Living in Poverty in 1999 522 344 710 521 194
% Living in Poverty in1989 4.50% 4.52% 3.52% 3.65% 3.42%
% Living in Poverty in 1999 8.27% 5.80% 7.62% 10.42% 2.92%
Source: 1990, 2000 U.S. Census
MAP 7
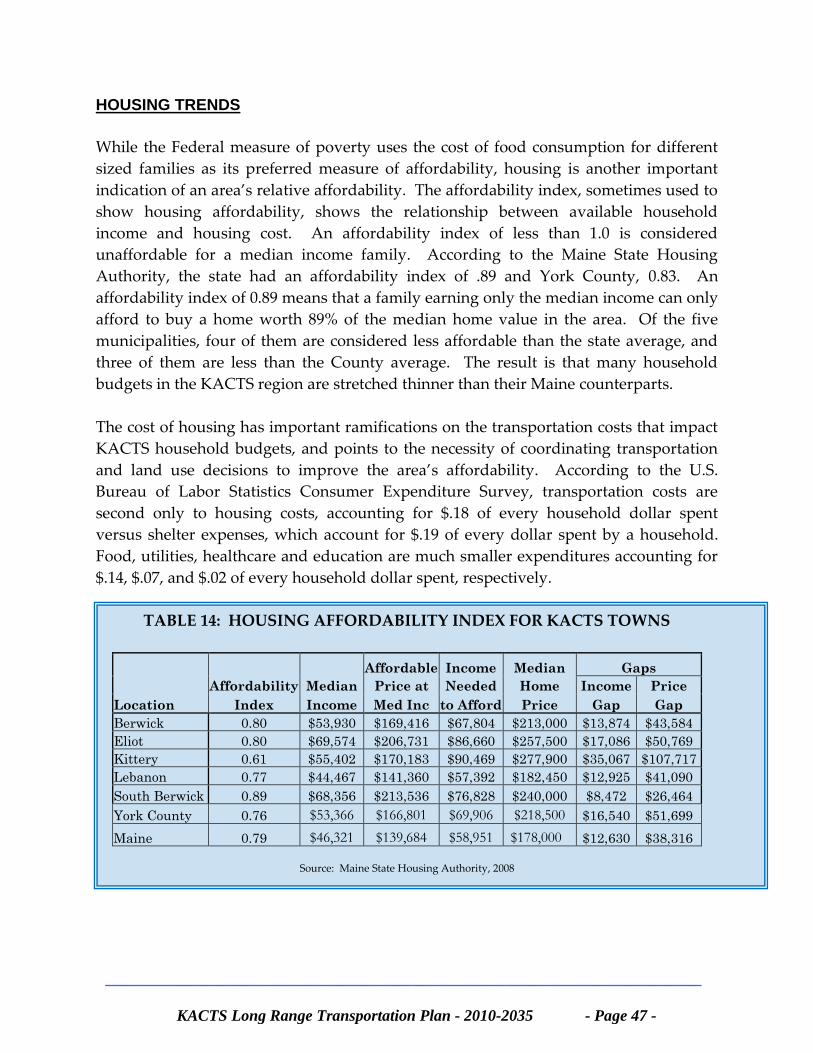
________________________________________________________________
KACTS Long Range Transportation Plan - 2010-2035 - Page 47 -
HOUSING TRENDS
While the Federal measure of poverty uses the cost of food consumption for different
sized families as its preferred measure of affordability, housing is another important
indication of an area’s relative affordability. The affordability index, sometimes used to
show housing affordability, shows the relationship between available household
income and housing cost. An affordability index of less than 1.0 is considered
unaffordable for a median income family. According to the Maine State Housing
Authority, the state had an affordability index of .89 and York County, 0.83. An
affordability index of 0.89 means that a family earning only the median income can only
afford to buy a home worth 89% of the median home value in the area. Of the five
municipalities, four of them are considered less affordable than the state average, and
three of them are less than the County average. The result is that many household
budgets in the KACTS region are stretched thinner than their Maine counterparts.
The cost of housing has important ramifications on the transportation costs that impact
KACTS household budgets, and points to the necessity of coordinating transportation
and land use decisions to improve the area’s affordability. According to the U.S.
Bureau of Labor Statistics Consumer Expenditure Survey, transportation costs are
second only to housing costs, accounting for $.18 of every household dollar spent
versus shelter expenses, which account for $.19 of every dollar spent by a household.
Food, utilities, healthcare and education are much smaller expenditures accounting for
$.14, $.07, and $.02 of every household dollar spent, respectively.
TABLE 14: HOUSING AFFORDABILITY INDEX FOR KACTS TOWNS
Affordable Income Median Gaps
Affordability Median Price at Needed Home Income Price
Location Index Income Med Inc to Afford Price Gap Gap
Berwick 0.80 $53,930 $169,416 $67,804 $213,000 $13,874 $43,584
Eliot 0.80 $69,574 $206,731 $86,660 $257,500 $17,086 $50,769
Kittery 0.61 $55,402 $170,183 $90,469 $277,900 $35,067 $107,717
Lebanon 0.77 $44,467 $141,360 $57,392 $182,450 $12,925 $41,090
South Berwick 0.89 $68,356 $213,536 $76,828 $240,000 $8,472 $26,464
York County 0.76 $53,366 $166,801 $69,906 $218,500 $16,540 $51,699
Maine 0.79 $46,321 $139,684 $58,951 $178,000
$12,630 $38,316
Source: Maine State Housing Authority, 2008
________________________________________________________________
KACTS Long Range Transportation Plan - 2010-2035 - Page 48 -
Of the 5 towns that participate with KACTS, three of the five currently have growth
caps, which are a growth tool allowed in the state to regulate housing growth. The
three towns include Berwick (70), Eliot (48) and Lebanon (57). While these growth caps
are useful tools for moderating growth, their restriction on housing supply can affect
housing affordability, and therefore household budgets.
The growth caps instituted in the towns are partially responses to the unprecedented
growth in housing that has occurred in the region. Figure 11 below shows the number
of new housing units in each community between 1980 and 2000 in ten-year intervals.
The most housing growth during this twenty-year period occurred in South Berwick
(1005) and Berwick (887), which experienced an annual growth rate of 4% and 3.7%
respectively. These two towns are followed by Kittery (824), Lebanon (639), and Eliot
(583). However, most of the growth in the Berwicks occurred during the 1980s. From
1990 to 2000, housing unit growth was stronger in Kittery, Eliot and Lebanon. In the
1990s, those three towns increased their housing stock by 448, 399 and 340 units
respectively, while South Berwick and Berwick grew by 226 and 192 units.
FIGURE 11: NUMBER OF HOUSING UNITS IN KACTS AREA, 1980-2000
Source: 1980, 1990, 2000 U.S. Census
0
500
1000
1500
2000
2500
3000
3500
4000
4500
5000
Berwick Eliot Kittery Lebanon South Berwick
1980
1990
2000
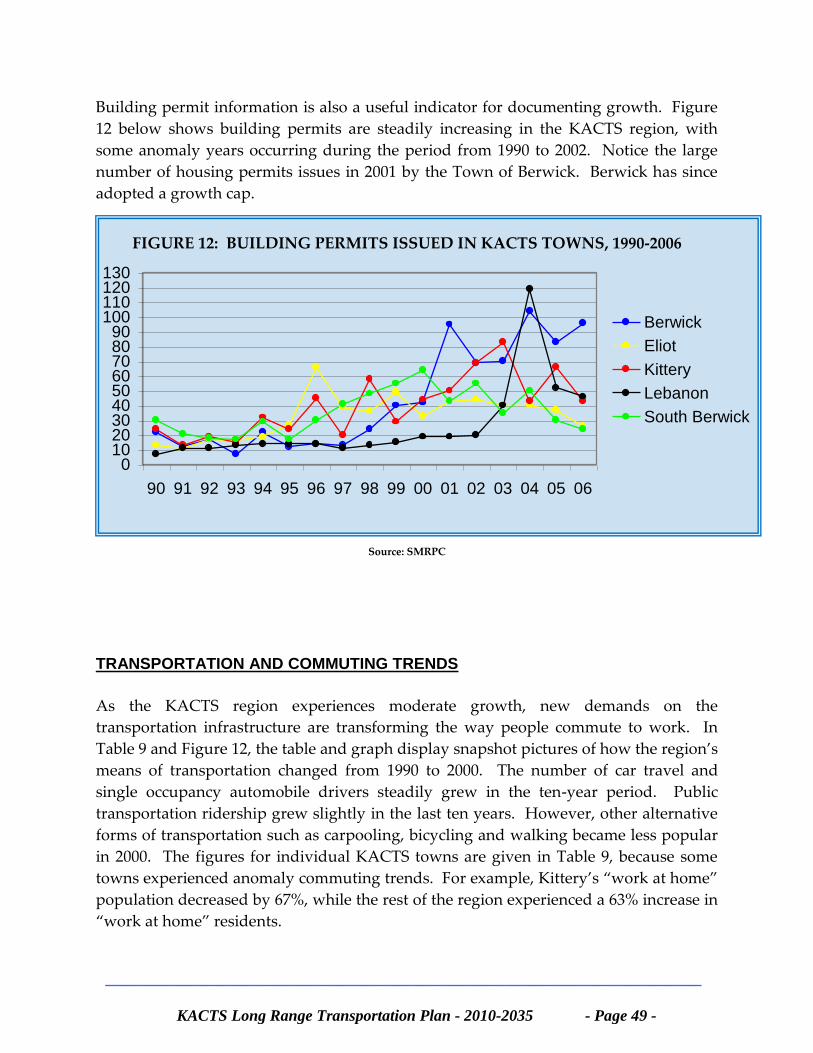
________________________________________________________________
KACTS Long Range Transportation Plan - 2010-2035 - Page 49 -
Building permit information is also a useful indicator for documenting growth. Figure
12 below shows building permits are steadily increasing in the KACTS region, with
some anomaly years occurring during the period from 1990 to 2002. Notice the large
number of housing permits issues in 2001 by the Town of Berwick. Berwick has since
adopted a growth cap.
FIGURE 12: BUILDING PERMITS ISSUED IN KACTS TOWNS, 1990-2006
Source: SMRPC
TRANSPORTATION AND COMMUTING TRENDS
As the KACTS region experiences moderate growth, new demands on the
transportation infrastructure are transforming the way people commute to work. In
Table 9 and Figure 12, the table and graph display snapshot pictures of how the region’s
means of transportation changed from 1990 to 2000. The number of car travel and
single occupancy automobile drivers steadily grew in the ten-year period. Public
transportation ridership grew slightly in the last ten years. However, other alternative
forms of transportation such as carpooling, bicycling and walking became less popular
in 2000. The figures for individual KACTS towns are given in Table 9, because some
towns experienced anomaly commuting trends. For example, Kittery’s “work at home”
population decreased by 67%, while the rest of the region experienced a 63% increase in
“work at home” residents.
0102030405060708090
100110120130
90 91 92 93 94 95 96 97 98 99 00 01 02 03 04 05 06
Berwick
Eliot
Kittery
Lebanon
South Berwick
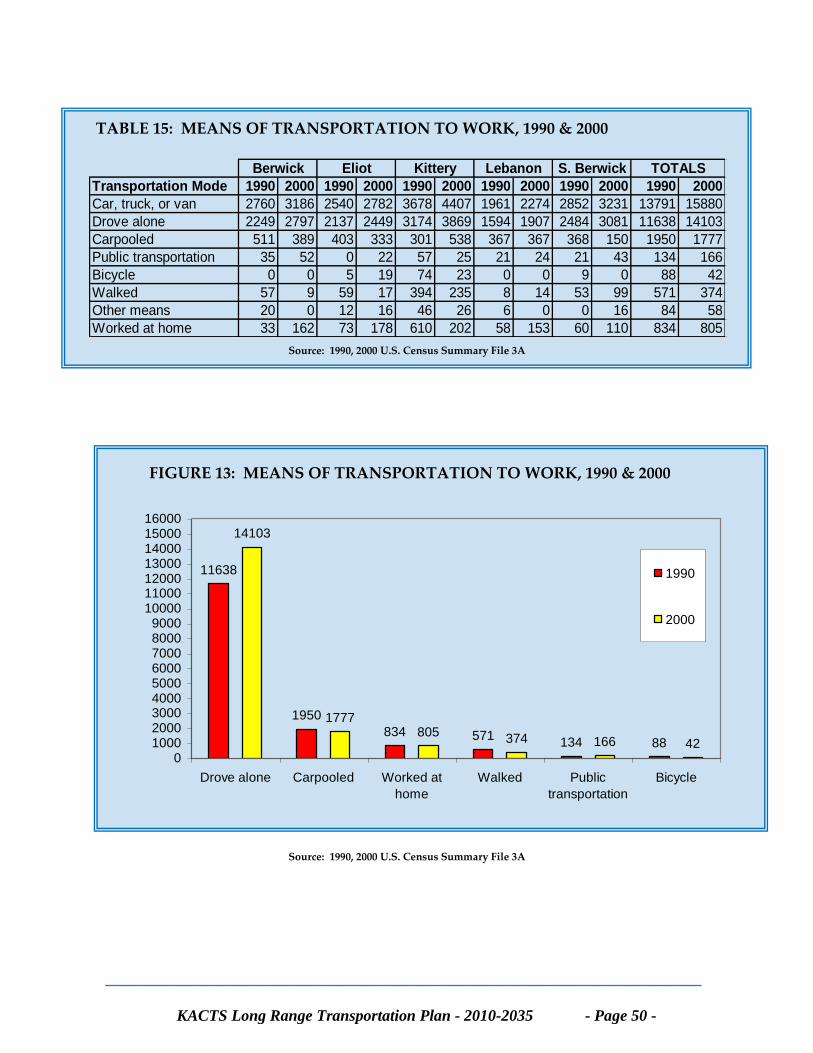
________________________________________________________________
KACTS Long Range Transportation Plan - 2010-2035 - Page 50 -
Transportation Mode 1990 2000 1990 2000 1990 2000 1990 2000 1990 2000 1990 2000
Car, truck, or van 2760 3186 2540 2782 3678 4407 1961 2274 2852 3231 13791 15880
Drove alone 2249 2797 2137 2449 3174 3869 1594 1907 2484 3081 11638 14103
Carpooled 511 389 403 333 301 538 367 367 368 150 1950 1777
Public transportation 35 52 0 22 57 25 21 24 21 43 134 166
Bicycle 0 0 5 19 74 23 0 0 9 0 88 42
Walked 57 9 59 17 394 235 8 14 53 99 571 374
Other means 20 0 12 16 46 26 6 0 0 16 84 58
Worked at home 33 162 73 178 610 202 58 153 60 110 834 805
S. Berwick TOTALSBerwick Eliot Kittery Lebanon
TABLE 15: MEANS OF TRANSPORTATION TO WORK, 1990 & 2000
Source: 1990, 2000 U.S. Census Summary File 3A
FIGURE 13: MEANS OF TRANSPORTATION TO WORK, 1990 & 2000
Source: 1990, 2000 U.S. Census Summary File 3A
11638
1950
834 571134 88
14103
1777805
374 166 420
100020003000400050006000700080009000
10000110001200013000140001500016000
Drove alone Carpooled Worked at
home
Walked Public
transportation
Bicycle
1990
2000
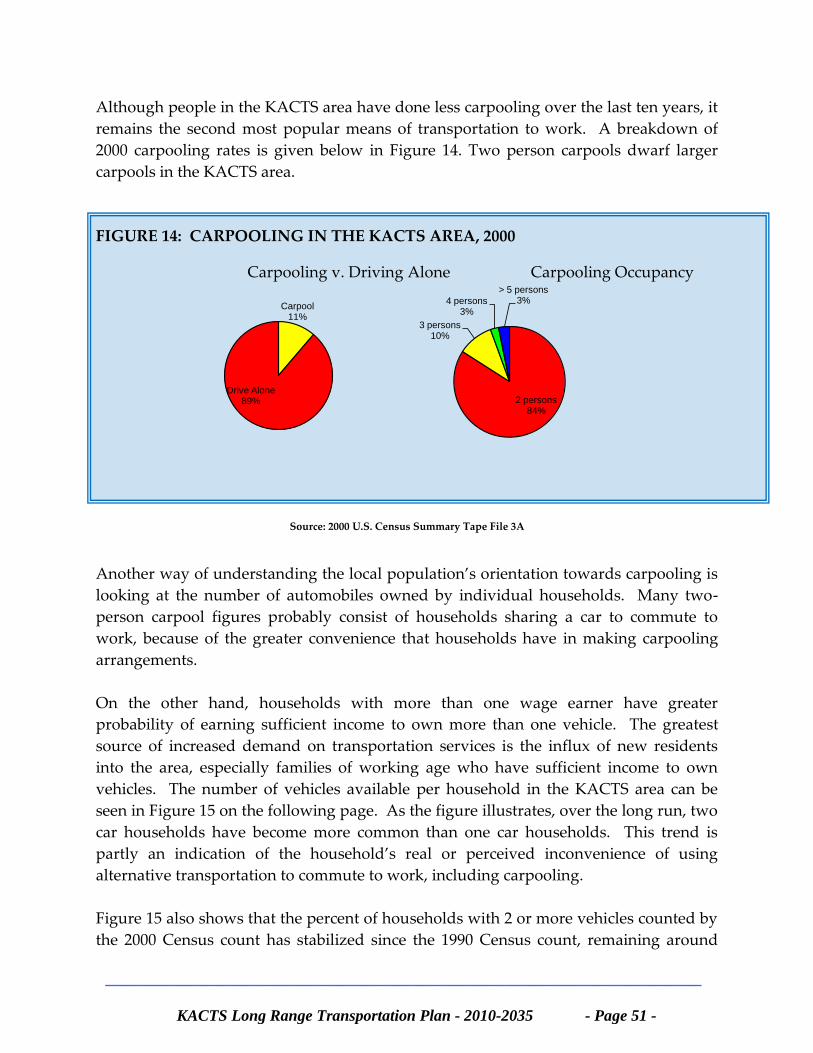
________________________________________________________________
KACTS Long Range Transportation Plan - 2010-2035 - Page 51 -
Although people in the KACTS area have done less carpooling over the last ten years, it
remains the second most popular means of transportation to work. A breakdown of
2000 carpooling rates is given below in Figure 14. Two person carpools dwarf larger
carpools in the KACTS area.
FIGURE 14: CARPOOLING IN THE KACTS AREA, 2000
Carpooling v. Driving Alone Carpooling Occupancy
Source: 2000 U.S. Census Summary Tape File 3A
Another way of understanding the local population’s orientation towards carpooling is
looking at the number of automobiles owned by individual households. Many two-
person carpool figures probably consist of households sharing a car to commute to
work, because of the greater convenience that households have in making carpooling
arrangements.
On the other hand, households with more than one wage earner have greater
probability of earning sufficient income to own more than one vehicle. The greatest
source of increased demand on transportation services is the influx of new residents
into the area, especially families of working age who have sufficient income to own
vehicles. The number of vehicles available per household in the KACTS area can be
seen in Figure 15 on the following page. As the figure illustrates, over the long run, two
car households have become more common than one car households. This trend is
partly an indication of the household’s real or perceived inconvenience of using
alternative transportation to commute to work, including carpooling.
Figure 15 also shows that the percent of households with 2 or more vehicles counted by
the 2000 Census count has stabilized since the 1990 Census count, remaining around
2 persons84%
3 persons10%
4 persons3%
> 5 persons3%
Carpool11%
Drive Alone89%
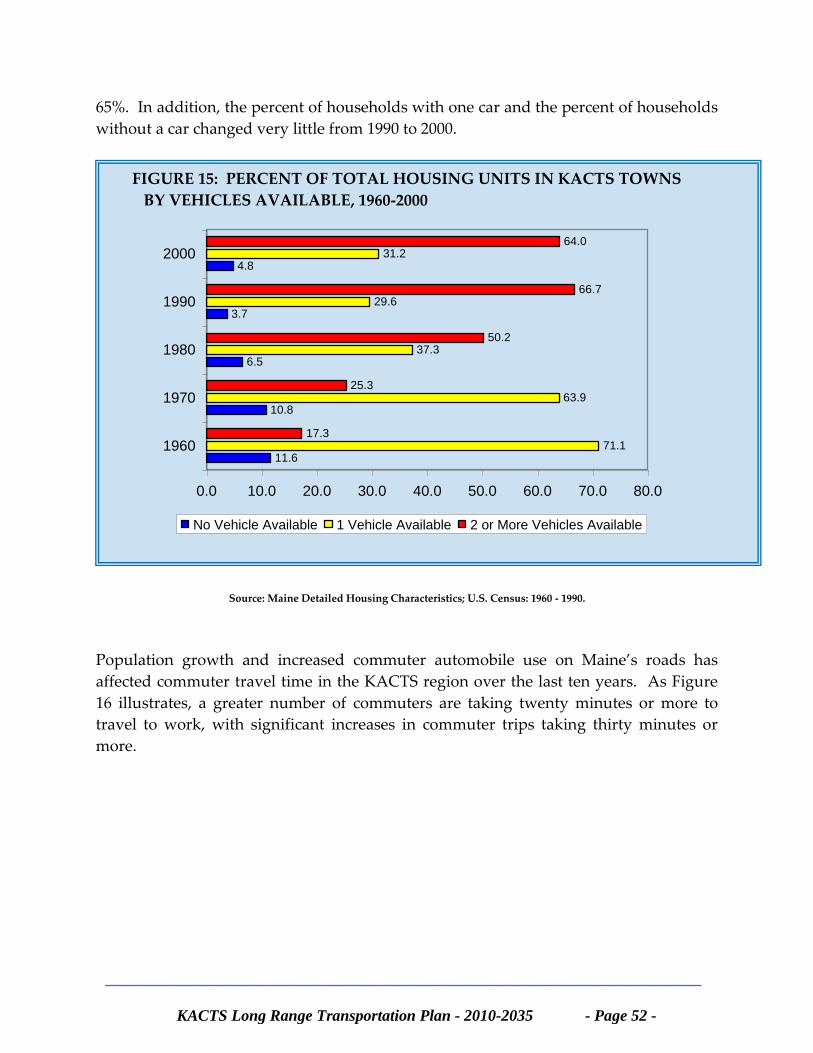
________________________________________________________________
KACTS Long Range Transportation Plan - 2010-2035 - Page 52 -
65%. In addition, the percent of households with one car and the percent of households
without a car changed very little from 1990 to 2000.
FIGURE 15: PERCENT OF TOTAL HOUSING UNITS IN KACTS TOWNS
BY VEHICLES AVAILABLE, 1960-2000
Source: Maine Detailed Housing Characteristics; U.S. Census: 1960 - 1990.
Population growth and increased commuter automobile use on Maine’s roads has
affected commuter travel time in the KACTS region over the last ten years. As Figure
16 illustrates, a greater number of commuters are taking twenty minutes or more to
travel to work, with significant increases in commuter trips taking thirty minutes or
more.
11.6
10.8
6.5
3.7
71.1
63.9
37.3
29.6
31.2
17.3
25.3
50.2
66.7
64.0
4.8
0.0 10.0 20.0 30.0 40.0 50.0 60.0 70.0 80.0
1960
1970
1980
1990
2000
No Vehicle Available 1 Vehicle Available 2 or More Vehicles Available
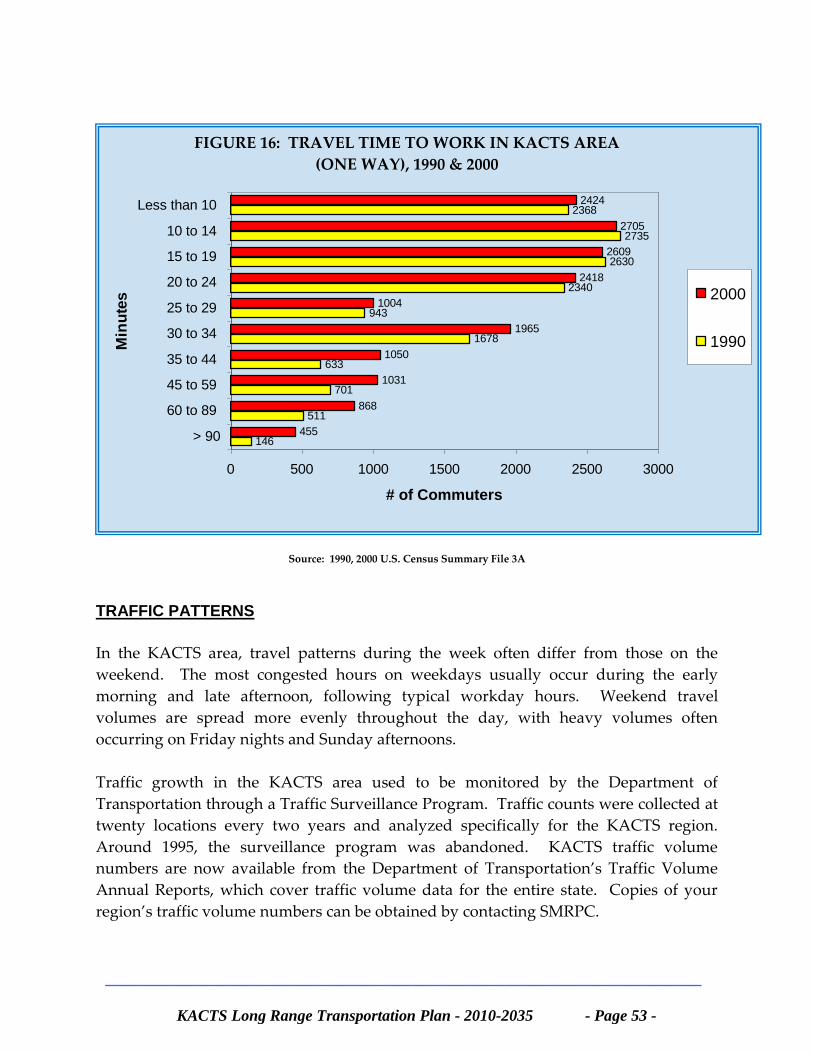
________________________________________________________________
KACTS Long Range Transportation Plan - 2010-2035 - Page 53 -
FIGURE 16: TRAVEL TIME TO WORK IN KACTS AREA
(ONE WAY), 1990 & 2000
Source: 1990, 2000 U.S. Census Summary File 3A
TRAFFIC PATTERNS
In the KACTS area, travel patterns during the week often differ from those on the
weekend. The most congested hours on weekdays usually occur during the early
morning and late afternoon, following typical workday hours. Weekend travel
volumes are spread more evenly throughout the day, with heavy volumes often
occurring on Friday nights and Sunday afternoons.
Traffic growth in the KACTS area used to be monitored by the Department of
Transportation through a Traffic Surveillance Program. Traffic counts were collected at
twenty locations every two years and analyzed specifically for the KACTS region.
Around 1995, the surveillance program was abandoned. KACTS traffic volume
numbers are now available from the Department of Transportation’s Traffic Volume
Annual Reports, which cover traffic volume data for the entire state. Copies of your
region’s traffic volume numbers can be obtained by contacting SMRPC.
146
511
701
633
1678
943
2340
2630
2735
2368
455
868
1031
1050
1965
1004
2418
2609
2705
2424
0 500 1000 1500 2000 2500 3000
> 90
60 to 89
45 to 59
35 to 44
30 to 34
25 to 29
20 to 24
15 to 19
10 to 14
Less than 10
Min
ute
s
# of Commuters
2000
1990
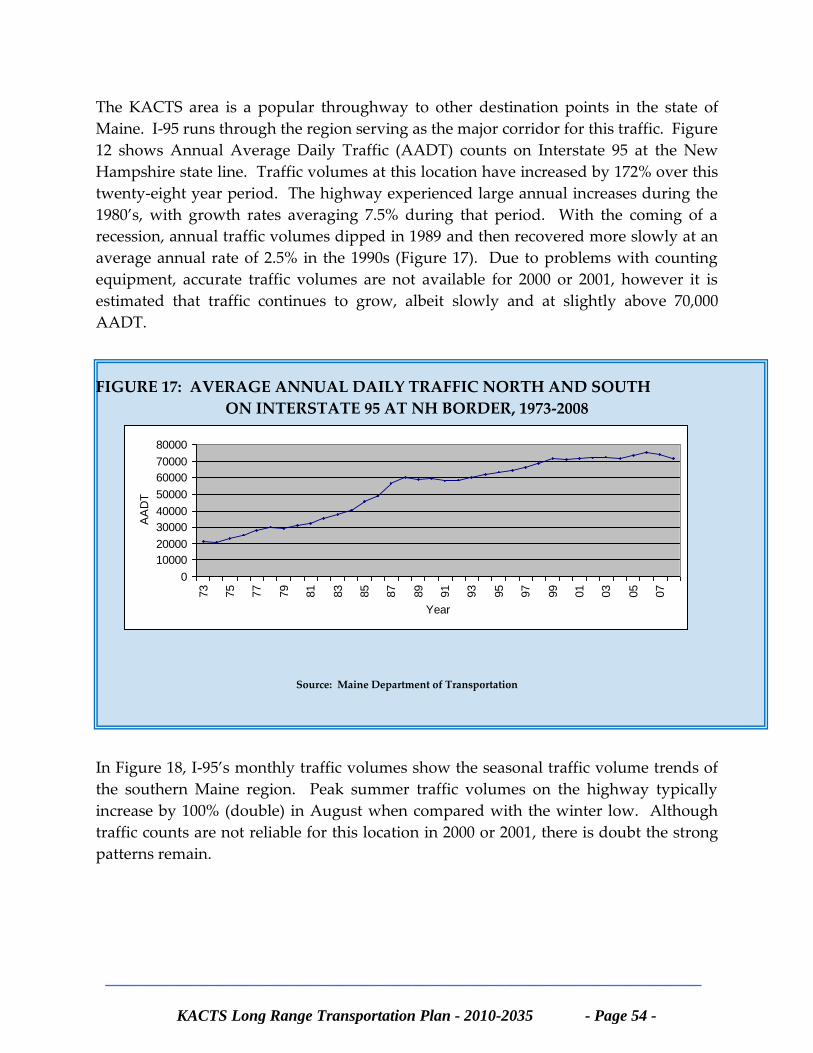
________________________________________________________________
KACTS Long Range Transportation Plan - 2010-2035 - Page 54 -
The KACTS area is a popular throughway to other destination points in the state of
Maine. I-95 runs through the region serving as the major corridor for this traffic. Figure
12 shows Annual Average Daily Traffic (AADT) counts on Interstate 95 at the New
Hampshire state line. Traffic volumes at this location have increased by 172% over this
twenty-eight year period. The highway experienced large annual increases during the
1980’s, with growth rates averaging 7.5% during that period. With the coming of a
recession, annual traffic volumes dipped in 1989 and then recovered more slowly at an
average annual rate of 2.5% in the 1990s (Figure 17). Due to problems with counting
equipment, accurate traffic volumes are not available for 2000 or 2001, however it is
estimated that traffic continues to grow, albeit slowly and at slightly above 70,000
AADT.
FIGURE 17: AVERAGE ANNUAL DAILY TRAFFIC NORTH AND SOUTH
ON INTERSTATE 95 AT NH BORDER, 1973-2008
Source: Maine Department of Transportation
In Figure 18, I-95’s monthly traffic volumes show the seasonal traffic volume trends of
the southern Maine region. Peak summer traffic volumes on the highway typically
increase by 100% (double) in August when compared with the winter low. Although
traffic counts are not reliable for this location in 2000 or 2001, there is doubt the strong
patterns remain.
0
10000
20000
30000
40000
50000
60000
70000
80000
73
75
77
79
81
83
85
87
89
91
93
95
97
99
01
03
05
07
Year
AA
DT
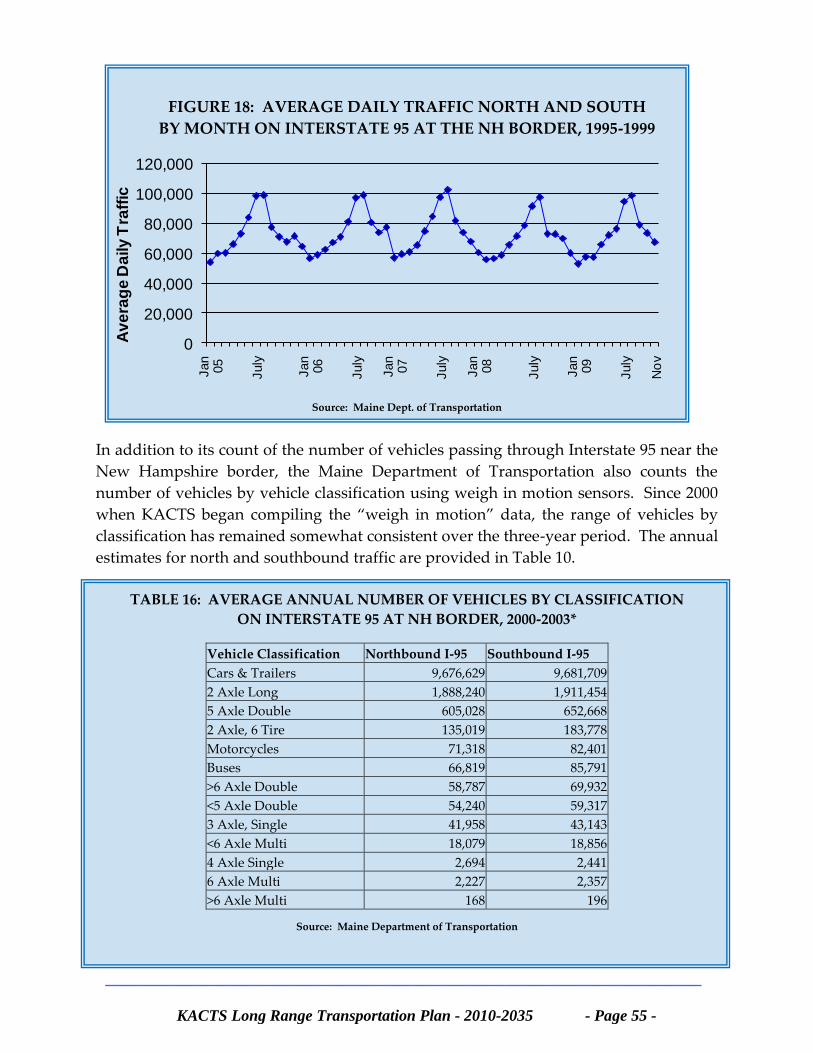
________________________________________________________________
KACTS Long Range Transportation Plan - 2010-2035 - Page 55 -
FIGURE 18: AVERAGE DAILY TRAFFIC NORTH AND SOUTH
BY MONTH ON INTERSTATE 95 AT THE NH BORDER, 1995-1999
0
20,000
40,000
60,000
80,000
100,000
120,000
Jan
05
July
Jan
06
July
Jan
07
July
Jan
08
July
Jan
09
July
No
v
Av
era
ge
Da
ily
Tra
ffic
Source: Maine Dept. of Transportation
In addition to its count of the number of vehicles passing through Interstate 95 near the
New Hampshire border, the Maine Department of Transportation also counts the
number of vehicles by vehicle classification using weigh in motion sensors. Since 2000
when KACTS began compiling the “weigh in motion” data, the range of vehicles by
classification has remained somewhat consistent over the three-year period. The annual
estimates for north and southbound traffic are provided in Table 10.
TABLE 16: AVERAGE ANNUAL NUMBER OF VEHICLES BY CLASSIFICATION
ON INTERSTATE 95 AT NH BORDER, 2000-2003*
Vehicle Classification Northbound I-95 Southbound I-95
Cars & Trailers 9,676,629 9,681,709
2 Axle Long 1,888,240 1,911,454
5 Axle Double 605,028 652,668
2 Axle, 6 Tire 135,019 183,778
Motorcycles 71,318 82,401
Buses 66,819 85,791
>6 Axle Double 58,787 69,932
<5 Axle Double 54,240 59,317
3 Axle, Single 41,958 43,143
<6 Axle Multi 18,079 18,856
4 Axle Single 2,694 2,441
6 Axle Multi 2,227 2,357
>6 Axle Multi 168 196
Source: Maine Department of Transportation
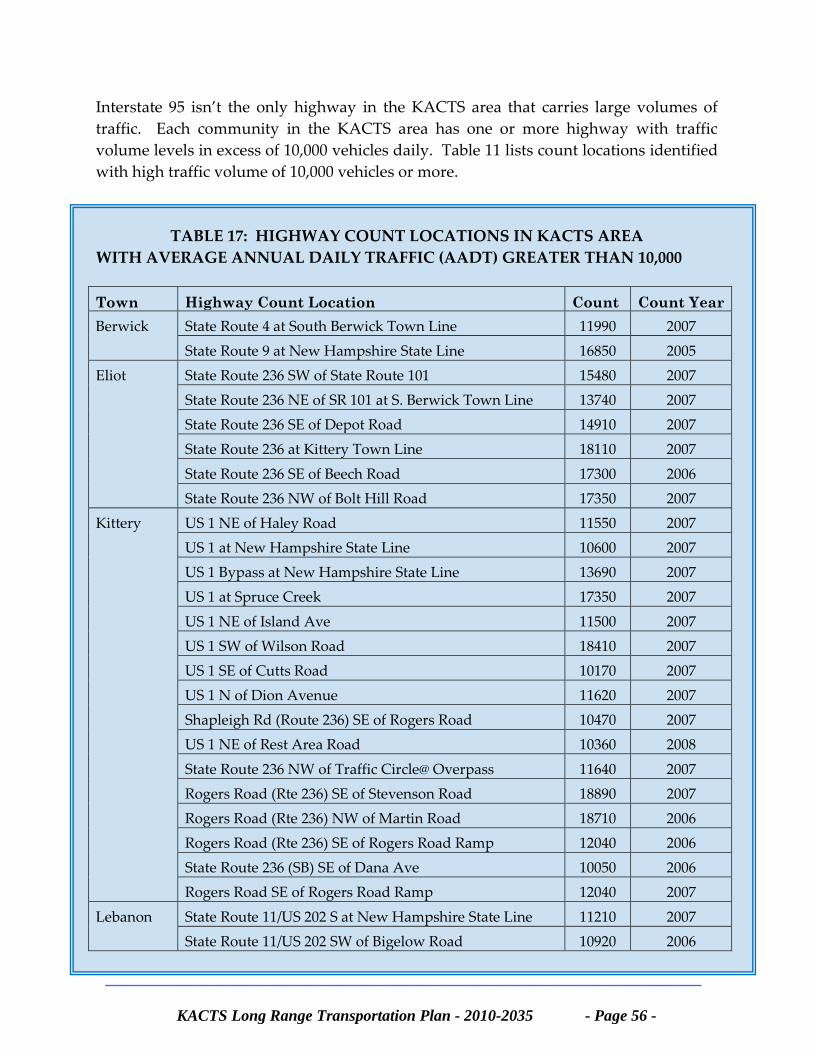
________________________________________________________________
KACTS Long Range Transportation Plan - 2010-2035 - Page 56 -
Interstate 95 isn’t the only highway in the KACTS area that carries large volumes of
traffic. Each community in the KACTS area has one or more highway with traffic
volume levels in excess of 10,000 vehicles daily. Table 11 lists count locations identified
with high traffic volume of 10,000 vehicles or more.
TABLE 17: HIGHWAY COUNT LOCATIONS IN KACTS AREA
WITH AVERAGE ANNUAL DAILY TRAFFIC (AADT) GREATER THAN 10,000
Town Highway Count Location Count Count Year
Berwick State Route 4 at South Berwick Town Line 11990 2007
State Route 9 at New Hampshire State Line 16850 2005
Eliot State Route 236 SW of State Route 101 15480 2007
State Route 236 NE of SR 101 at S. Berwick Town Line 13740 2007
State Route 236 SE of Depot Road 14910 2007
State Route 236 at Kittery Town Line 18110 2007
State Route 236 SE of Beech Road 17300 2006
State Route 236 NW of Bolt Hill Road 17350 2007
Kittery US 1 NE of Haley Road 11550 2007
US 1 at New Hampshire State Line 10600 2007
US 1 Bypass at New Hampshire State Line 13690 2007
US 1 at Spruce Creek 17350 2007
US 1 NE of Island Ave 11500 2007
US 1 SW of Wilson Road 18410 2007
US 1 SE of Cutts Road 10170 2007
US 1 N of Dion Avenue 11620 2007
Shapleigh Rd (Route 236) SE of Rogers Road 10470 2007
US 1 NE of Rest Area Road 10360 2008
State Route 236 NW of Traffic Circle@ Overpass 11640 2007
Rogers Road (Rte 236) SE of Stevenson Road 18890 2007
Rogers Road (Rte 236) NW of Martin Road 18710 2006
Rogers Road (Rte 236) SE of Rogers Road Ramp 12040 2006
State Route 236 (SB) SE of Dana Ave 10050 2006
Rogers Road SE of Rogers Road Ramp 12040 2007
Lebanon State Route 11/US 202 S at New Hampshire State Line 11210 2007
State Route 11/US 202 SW of Bigelow Road 10920 2006
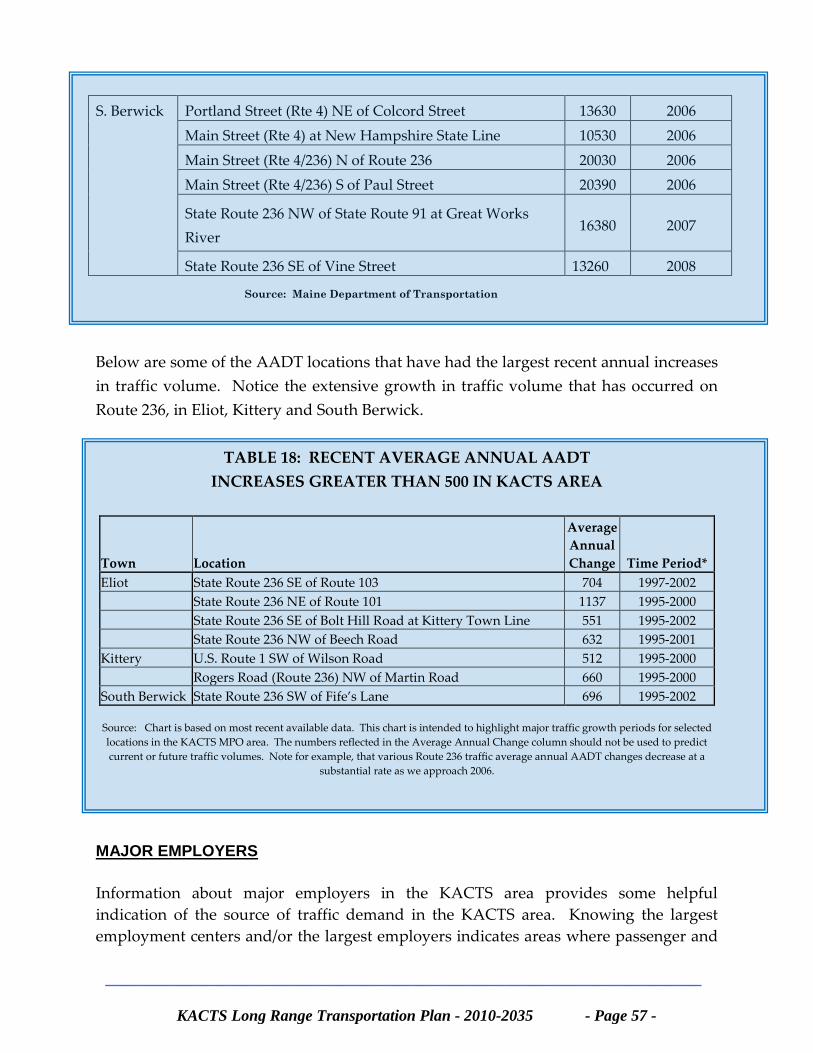
________________________________________________________________
KACTS Long Range Transportation Plan - 2010-2035 - Page 57 -
S. Berwick Portland Street (Rte 4) NE of Colcord Street 13630 2006
Main Street (Rte 4) at New Hampshire State Line 10530 2006
Main Street (Rte 4/236) N of Route 236 20030 2006
Main Street (Rte 4/236) S of Paul Street 20390 2006
State Route 236 NW of State Route 91 at Great Works
River 16380 2007
State Route 236 SE of Vine Street 13260 2008
Source: Maine Department of Transportation
Below are some of the AADT locations that have had the largest recent annual increases
in traffic volume. Notice the extensive growth in traffic volume that has occurred on
Route 236, in Eliot, Kittery and South Berwick.
TABLE 18: RECENT AVERAGE ANNUAL AADT
INCREASES GREATER THAN 500 IN KACTS AREA
Town Location
Average
Annual
Change Time Period*
Eliot State Route 236 SE of Route 103 704 1997-2002
State Route 236 NE of Route 101 1137 1995-2000
State Route 236 SE of Bolt Hill Road at Kittery Town Line 551 1995-2002
State Route 236 NW of Beech Road 632 1995-2001
Kittery U.S. Route 1 SW of Wilson Road 512 1995-2000
Rogers Road (Route 236) NW of Martin Road 660 1995-2000
South Berwick State Route 236 SW of Fife’s Lane 696 1995-2002
Source: Chart is based on most recent available data. This chart is intended to highlight major traffic growth periods for selected
locations in the KACTS MPO area. The numbers reflected in the Average Annual Change column should not be used to predict
current or future traffic volumes. Note for example, that various Route 236 traffic average annual AADT changes decrease at a
substantial rate as we approach 2006.
MAJOR EMPLOYERS
Information about major employers in the KACTS area provides some helpful
indication of the source of traffic demand in the KACTS area. Knowing the largest
employment centers and/or the largest employers indicates areas where passenger and
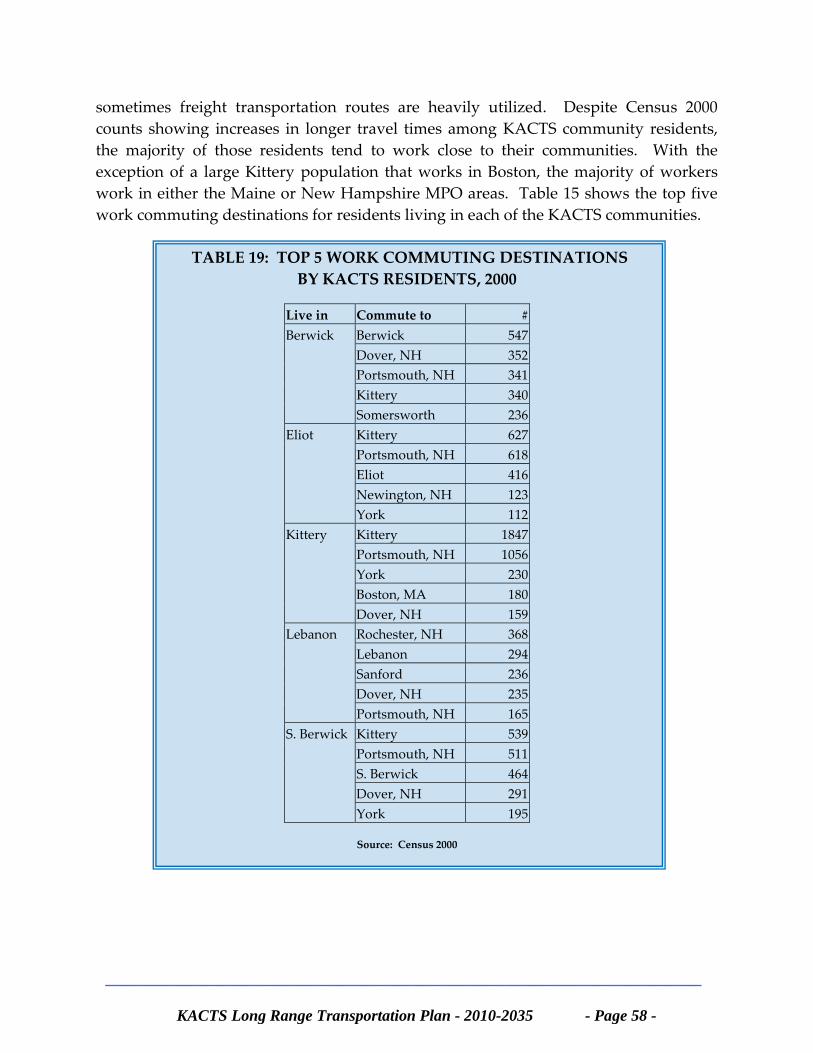
________________________________________________________________
KACTS Long Range Transportation Plan - 2010-2035 - Page 58 -
sometimes freight transportation routes are heavily utilized. Despite Census 2000
counts showing increases in longer travel times among KACTS community residents,
the majority of those residents tend to work close to their communities. With the
exception of a large Kittery population that works in Boston, the majority of workers
work in either the Maine or New Hampshire MPO areas. Table 15 shows the top five
work commuting destinations for residents living in each of the KACTS communities.
TABLE 19: TOP 5 WORK COMMUTING DESTINATIONS
BY KACTS RESIDENTS, 2000
Live in Commute to #
Berwick Berwick 547
Dover, NH 352
Portsmouth, NH 341
Kittery 340
Somersworth 236
Eliot Kittery 627
Portsmouth, NH 618
Eliot 416
Newington, NH 123
York 112
Kittery Kittery 1847
Portsmouth, NH 1056
York 230
Boston, MA 180
Dover, NH 159
Lebanon Rochester, NH 368
Lebanon 294
Sanford 236
Dover, NH 235
Portsmouth, NH 165
S. Berwick Kittery 539
Portsmouth, NH 511
S. Berwick 464
Dover, NH 291
York 195
Source: Census 2000
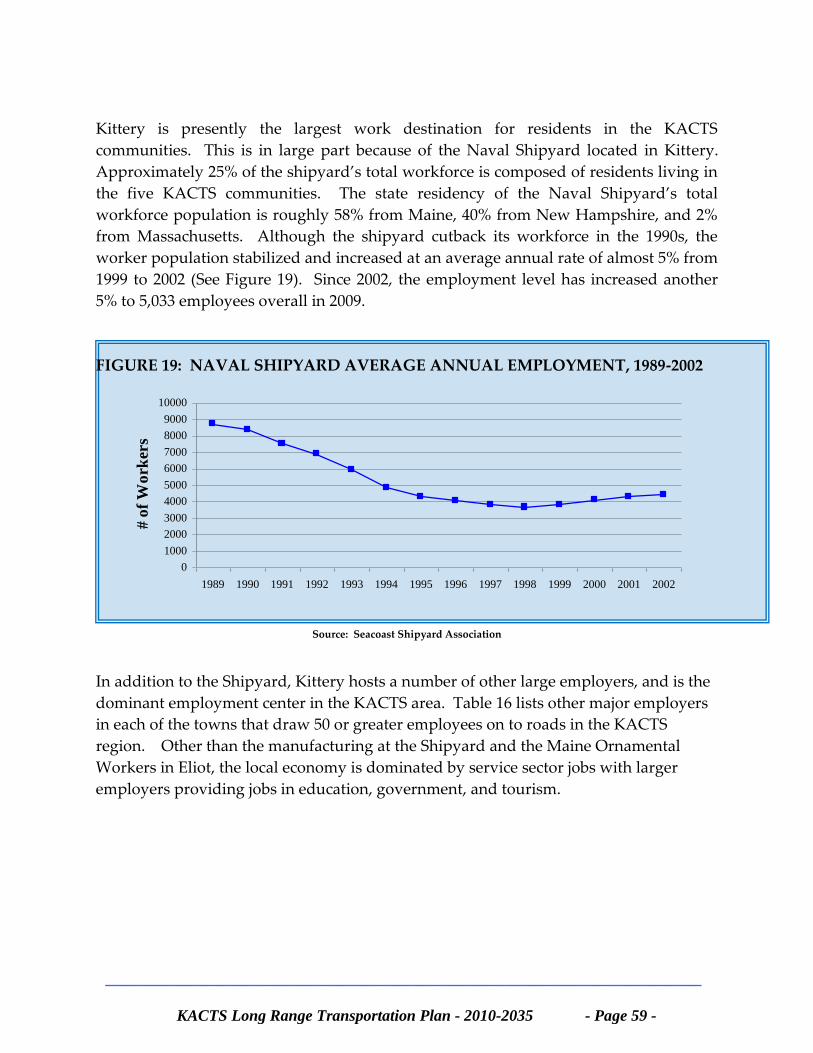
________________________________________________________________
KACTS Long Range Transportation Plan - 2010-2035 - Page 59 -
Kittery is presently the largest work destination for residents in the KACTS
communities. This is in large part because of the Naval Shipyard located in Kittery.
Approximately 25% of the shipyard’s total workforce is composed of residents living in
the five KACTS communities. The state residency of the Naval Shipyard’s total
workforce population is roughly 58% from Maine, 40% from New Hampshire, and 2%
from Massachusetts. Although the shipyard cutback its workforce in the 1990s, the
worker population stabilized and increased at an average annual rate of almost 5% from
1999 to 2002 (See Figure 19). Since 2002, the employment level has increased another
5% to 5,033 employees overall in 2009.
FIGURE 19: NAVAL SHIPYARD AVERAGE ANNUAL EMPLOYMENT, 1989-2002
Source: Seacoast Shipyard Association
In addition to the Shipyard, Kittery hosts a number of other large employers, and is the
dominant employment center in the KACTS area. Table 16 lists other major employers
in each of the towns that draw 50 or greater employees on to roads in the KACTS
region. Other than the manufacturing at the Shipyard and the Maine Ornamental
Workers in Eliot, the local economy is dominated by service sector jobs with larger
employers providing jobs in education, government, and tourism.
0
1000
2000
3000
4000
5000
6000
7000
8000
9000
10000
1989 1990 1991 1992 1993 1994 1995 1996 1997 1998 1999 2000 2001 2002
# o
f W
ork
ers

________________________________________________________________
KACTS Long Range Transportation Plan - 2010-2035 - Page 60 -
TABLE 20: MAJOR EMPLOYERS IN KACTS TOWNS (>50 EMPLOYEES)
Town Employer Type of Business
Berwick Berwick Elementary/Estabrook School Education
Vivian Hussey Elementary Education
Town of Berwick Government
Eliot Maine Ornamental Woodworkers Wood Products
Marshwood Junior High School Education
Visiontel Communications Communications Technologies
Town of Eliot Government
Kittery Greenpages, Inc. IT Consulting Services
Homestead, Inc. Nursing Home Service
Naval Shipyard Ship Building
Shapleigh Middle School Education
Weathervane Seafood Food
Warren’s Lobster House Food
Ships Quarterdeck Restaurant Food
Kittery Trading Post Outdoor Recreational Clothing & Gear
Wilson 5 Janitorial Cleaning Services
Seaward Corporation Electric Utility & Transmission Services
Town of Kittery Government
Lebanon Hanson School Education
Lebanon Elementary School Education
S. Berwick Berwick Academy Education
Marshwood High School Education
Marshwood Middle School Education
South Berwick Central School Education
Town of South Berwick Government
Source: infoUSA, Seacoast Shipyard Association, SMRPC
________________________________________________________________
KACTS Long Range Transportation Plan - 2010-2035 - Page 61 -
C. Funding Summary and Fiscal Constraint
SAFETEA-LU requires all Transportation Plans and TIPs to be financially constrained to
only those projects or programs for which funding is reasonably anticipated. In other
words, the idea of having “wish lists” of all the desired projects is not acceptable in the
context of a long range plan.
For highway projects, KACTS receives funds through several programs, usually on a
two year cycle coinciding with the TIP. Surface Transportation Program (STP) and
National Highway System (NHS) funds are apportioned to the MPO for every two year
period. Projects that qualify for this program are submitted to the Committee for
review and selection using the KACTS TIP Project Selection Procedure.
NHS funds are available for roadways that are designated as being on the NHS. In the
KACTS Area these include Route 202/11 in Lebanon, Route 9 in Berwick, Route 4 in
South Berwick, Interstate 95 & Route 1 Bypass in Kittery, and part of the Strategic
Highway Network (STRAHNET) connecting I-95 with the Naval Shipyard in Kittery.
Other STP funds, such as Hazard Elimination and Highway Safety are utilized in the
MPO and are approved by the Committee. These projects are usually selected through
a Statewide process involving management systems utilized by MaineDOT. Bridge
repair and maintenance funds are also distributed Statewide based on bridge condition,
and are utilized in the MPO area. In addition, Interstate Maintenance funds are used
for restoration, resurfacing, and rehabilitation of Interstate 95, which travels through the
KACTS area in Kittery.
A Transportation Enhancement Program was initiated as part of the STP, and
established funding for pedestrian and bicycle projects, scenic easements, landscaping,
and historic preservation. Ten percent of Maine’s STP must be spent on Enhancement
activities. An example of a Transportation Enhancement project in the KACTS area is
the addition of bike lanes on a portion of Dennett Road. This project was submitted by
the Eastern Trail Management District (ETMD) and supported by the KACTS
Committee.
Federal funding through SAFETEA-LU is allocated to state DOTs. Maine DOT and the
four MPOs in Maine have developed a formula for distributing Federal funding, which
takes into account population, lane miles, and vehicle miles traveled (VMT). There is
no federal requirement to provide small MPOs (populations of less than 200,000) with
capital improvement money, but MaineDOT believes that its MPO allocation policy
promotes effective, regional planning. Roads classified as “urban collector” and
“arterial” qualify for federal funding.
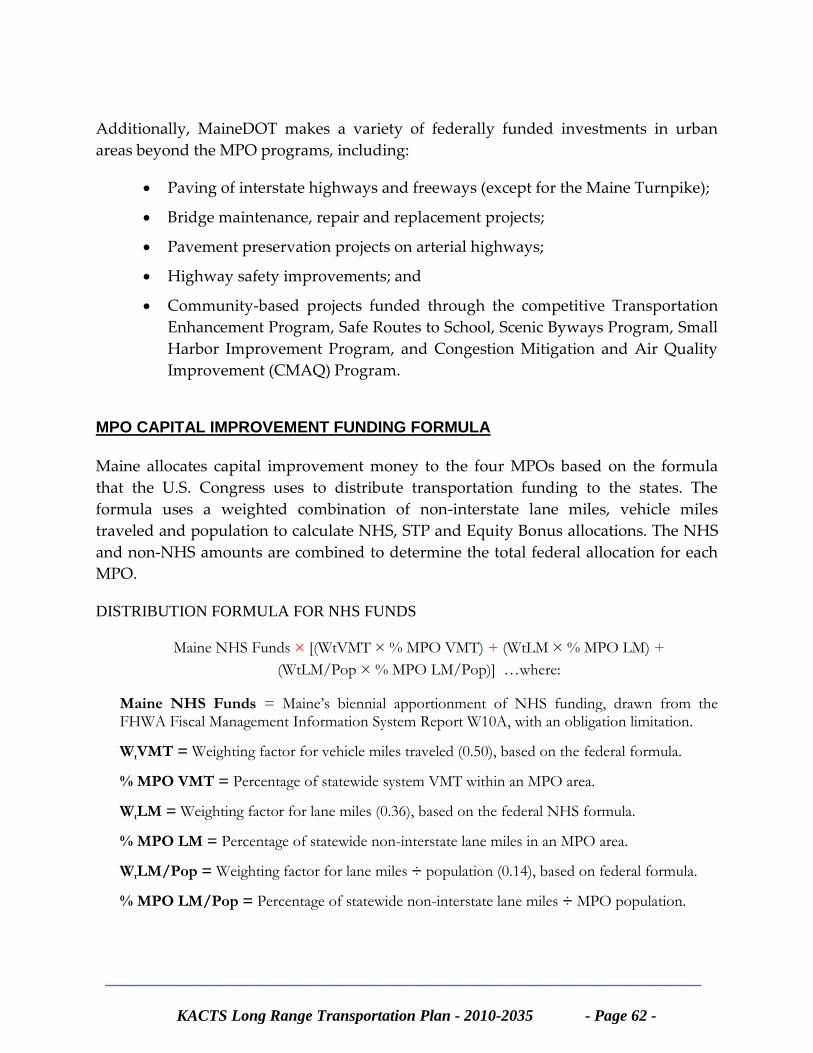
________________________________________________________________
KACTS Long Range Transportation Plan - 2010-2035 - Page 62 -
Additionally, MaineDOT makes a variety of federally funded investments in urban
areas beyond the MPO programs, including:
Paving of interstate highways and freeways (except for the Maine Turnpike);
Bridge maintenance, repair and replacement projects;
Pavement preservation projects on arterial highways;
Highway safety improvements; and
Community-based projects funded through the competitive Transportation
Enhancement Program, Safe Routes to School, Scenic Byways Program, Small
Harbor Improvement Program, and Congestion Mitigation and Air Quality
Improvement (CMAQ) Program.
MPO CAPITAL IMPROVEMENT FUNDING FORMULA
Maine allocates capital improvement money to the four MPOs based on the formula
that the U.S. Congress uses to distribute transportation funding to the states. The
formula uses a weighted combination of non-interstate lane miles, vehicle miles
traveled and population to calculate NHS, STP and Equity Bonus allocations. The NHS
and non-NHS amounts are combined to determine the total federal allocation for each
MPO.
DISTRIBUTION FORMULA FOR NHS FUNDS
Maine NHS Funds × [(WtVMT × % MPO VMT) + (WtLM × % MPO LM) +
(WtLM/Pop × % MPO LM/Pop)] …where:
Maine NHS Funds = Maine’s biennial apportionment of NHS funding, drawn from the FHWA Fiscal Management Information System Report W10A, with an obligation limitation.
WtVMT = Weighting factor for vehicle miles traveled (0.50), based on the federal formula.
% MPO VMT = Percentage of statewide system VMT within an MPO area.
WtLM = Weighting factor for lane miles (0.36), based on the federal NHS formula.
% MPO LM = Percentage of statewide non-interstate lane miles in an MPO area.
WtLM/Pop = Weighting factor for lane miles ÷ population (0.14), based on federal formula.
% MPO LM/Pop = Percentage of statewide non-interstate lane miles ÷ MPO population.
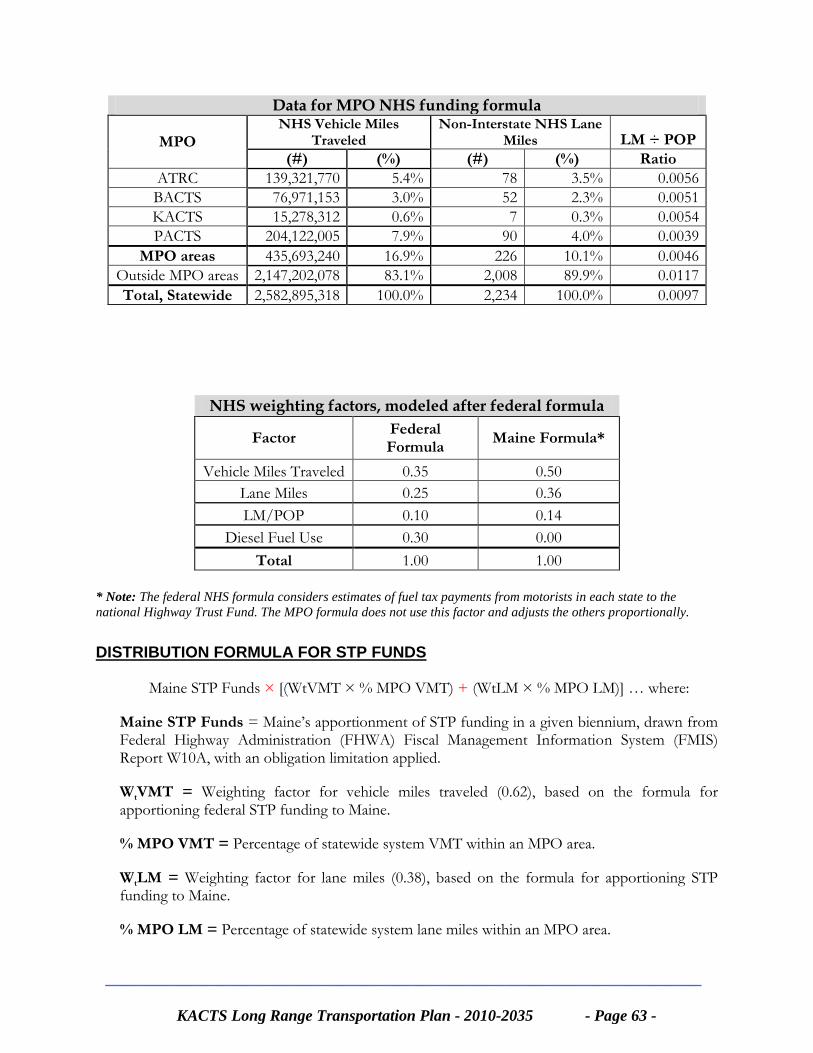
________________________________________________________________
KACTS Long Range Transportation Plan - 2010-2035 - Page 63 -
Data for MPO NHS funding formula
MPO NHS Vehicle Miles
Traveled Non-Interstate NHS Lane
Miles LM ÷ POP
(#) (%) (#) (%) Ratio
ATRC 139,321,770 5.4% 78 3.5% 0.0056
BACTS 76,971,153 3.0% 52 2.3% 0.0051
KACTS 15,278,312 0.6% 7 0.3% 0.0054
PACTS 204,122,005 7.9% 90 4.0% 0.0039
MPO areas 435,693,240 16.9% 226 10.1% 0.0046
Outside MPO areas 2,147,202,078 83.1% 2,008 89.9% 0.0117
Total, Statewide 2,582,895,318 100.0% 2,234 100.0% 0.0097
NHS weighting factors, modeled after federal formula
Factor Federal Formula
Maine Formula*
Vehicle Miles Traveled 0.35 0.50
Lane Miles 0.25 0.36
LM/POP 0.10 0.14
Diesel Fuel Use 0.30 0.00
Total 1.00 1.00
* Note: The federal NHS formula considers estimates of fuel tax payments from motorists in each state to the
national Highway Trust Fund. The MPO formula does not use this factor and adjusts the others proportionally.
DISTRIBUTION FORMULA FOR STP FUNDS
Maine STP Funds × [(WtVMT × % MPO VMT) + (WtLM × % MPO LM)] … where:
Maine STP Funds = Maine’s apportionment of STP funding in a given biennium, drawn from Federal Highway Administration (FHWA) Fiscal Management Information System (FMIS) Report W10A, with an obligation limitation applied.
WtVMT = Weighting factor for vehicle miles traveled (0.62), based on the formula for apportioning federal STP funding to Maine.
% MPO VMT = Percentage of statewide system VMT within an MPO area.
WtLM = Weighting factor for lane miles (0.38), based on the formula for apportioning STP funding to Maine.
% MPO LM = Percentage of statewide system lane miles within an MPO area.
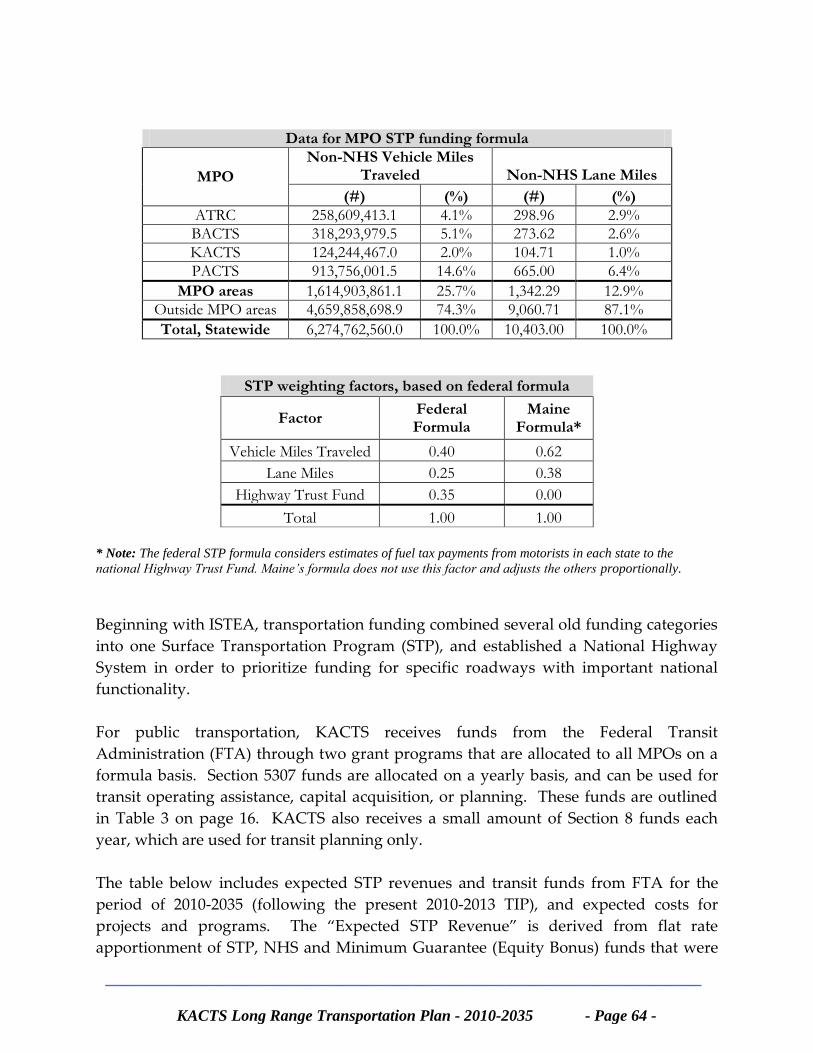
________________________________________________________________
KACTS Long Range Transportation Plan - 2010-2035 - Page 64 -
Data for MPO STP funding formula
MPO
Non-NHS Vehicle Miles Traveled Non-NHS Lane Miles
(#) (%) (#) (%)
ATRC 258,609,413.1 4.1% 298.96 2.9%
BACTS 318,293,979.5 5.1% 273.62 2.6%
KACTS 124,244,467.0 2.0% 104.71 1.0%
PACTS 913,756,001.5 14.6% 665.00 6.4%
MPO areas 1,614,903,861.1 25.7% 1,342.29 12.9%
Outside MPO areas 4,659,858,698.9 74.3% 9,060.71 87.1%
Total, Statewide 6,274,762,560.0 100.0% 10,403.00 100.0%
STP weighting factors, based on federal formula
Factor Federal Formula
Maine Formula*
Vehicle Miles Traveled 0.40 0.62
Lane Miles 0.25 0.38
Highway Trust Fund 0.35 0.00
Total 1.00 1.00
* Note: The federal STP formula considers estimates of fuel tax payments from motorists in each state to the
national Highway Trust Fund. Maine’s formula does not use this factor and adjusts the others proportionally.
Beginning with ISTEA, transportation funding combined several old funding categories
into one Surface Transportation Program (STP), and established a National Highway
System in order to prioritize funding for specific roadways with important national
functionality.
For public transportation, KACTS receives funds from the Federal Transit
Administration (FTA) through two grant programs that are allocated to all MPOs on a
formula basis. Section 5307 funds are allocated on a yearly basis, and can be used for
transit operating assistance, capital acquisition, or planning. These funds are outlined
in Table 3 on page 16. KACTS also receives a small amount of Section 8 funds each
year, which are used for transit planning only.
The table below includes expected STP revenues and transit funds from FTA for the
period of 2010-2035 (following the present 2010-2013 TIP), and expected costs for
projects and programs. The “Expected STP Revenue” is derived from flat rate
apportionment of STP, NHS and Minimum Guarantee (Equity Bonus) funds that were
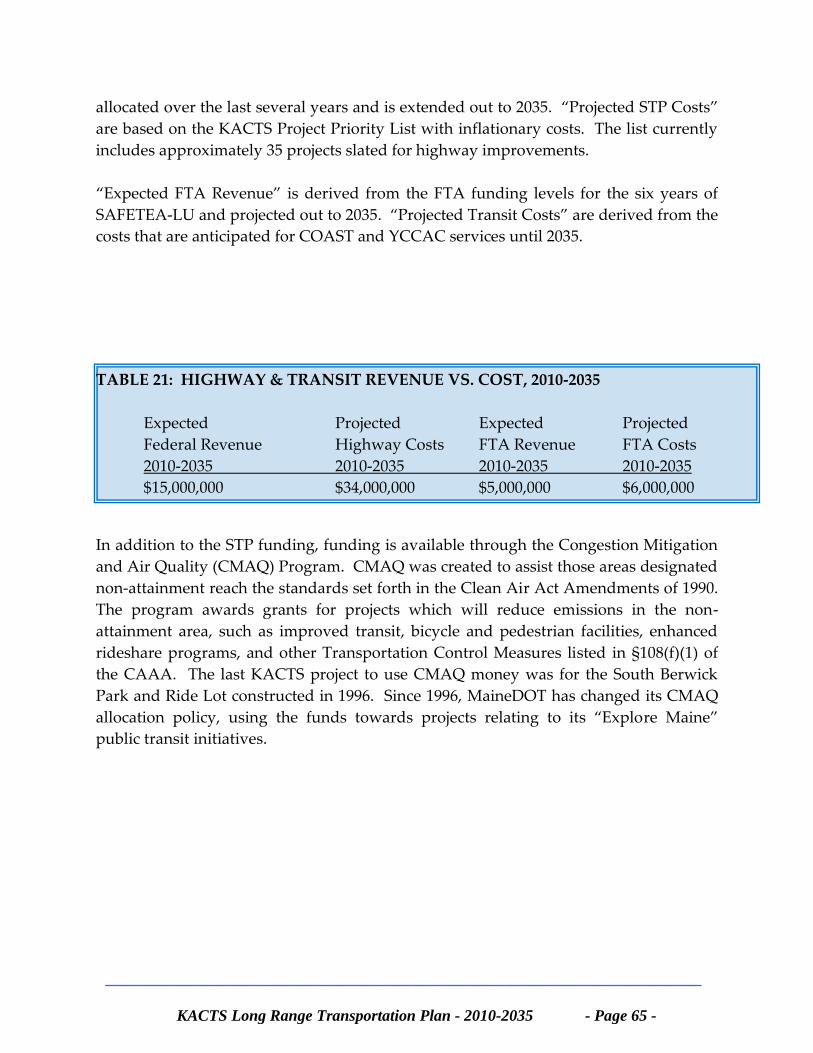
________________________________________________________________
KACTS Long Range Transportation Plan - 2010-2035 - Page 65 -
allocated over the last several years and is extended out to 2035. “Projected STP Costs”
are based on the KACTS Project Priority List with inflationary costs. The list currently
includes approximately 35 projects slated for highway improvements.
“Expected FTA Revenue” is derived from the FTA funding levels for the six years of
SAFETEA-LU and projected out to 2035. “Projected Transit Costs” are derived from the
costs that are anticipated for COAST and YCCAC services until 2035.
TABLE 21: HIGHWAY & TRANSIT REVENUE VS. COST, 2010-2035
Expected Projected Expected Projected
Federal Revenue Highway Costs FTA Revenue FTA Costs
2010-2035 2010-2035 2010-2035 2010-2035
$15,000,000 $34,000,000 $5,000,000 $6,000,000
In addition to the STP funding, funding is available through the Congestion Mitigation
and Air Quality (CMAQ) Program. CMAQ was created to assist those areas designated
non-attainment reach the standards set forth in the Clean Air Act Amendments of 1990.
The program awards grants for projects which will reduce emissions in the non-
attainment area, such as improved transit, bicycle and pedestrian facilities, enhanced
rideshare programs, and other Transportation Control Measures listed in §108(f)(1) of
the CAAA. The last KACTS project to use CMAQ money was for the South Berwick
Park and Ride Lot constructed in 1996. Since 1996, MaineDOT has changed its CMAQ
allocation policy, using the funds towards projects relating to its “Explore Maine”
public transit initiatives.
________________________________________________________________
KACTS Long Range Transportation Plan - 2010-2035 - Page 66 -
D. For More Information
Since the Transportation Plan and Transportation Improvement Program are
inextricably linked, it is vitally important for the general public to follow the
transportation planning and implementation process to provide the KACTS Committee
with local knowledge, input and advice. For members of the general public who are
interested in following this process, KACTS invites you to contact the MPO for future
KACTS Committee meeting times and KACTS events, or contact us with any questions
or comments about KACTS planning documents. A free copy of the Transportation
Plan, Transportation Improvement Program and the Unified Work Program documents
are all available at the offices at the Southern Maine Regional Planning Commission.
The public is also encouraged to follow the meeting minutes and latest news from
KACTS on the KACTS website. Contact information for these resources are provided
below.
Kittery Area Comprehensive Transportation Study
c/o Southern Maine Regional Planning Commission
21 Bradeen Street, Suite 304
Springvale, ME 04083
(207) 324-2952
http://www.smrpc.org/transportation/kacts/TransportationKACTSframeset.htm


