1 THE IMPACT OF THE BORDER ADJUSTMENT TAX ON THE STATES F or the first time in more than 30 years, federal lawmakers have an opportunity to replace our nation’s broken tax code with a simple, efficient, equitable, and predictable system that promotes long-term economic growth and opportunity for all Americans. There are plenty of excellent tax reform proposals on the table that would lower rates, eliminate loop- holes and deductions, and simplify tax filing. But one proposal currently being debated would undo many of the benefits that would come from these laudable reforms. It is called a border adjustment tax (BAT), and it includes a provision that would impose a new 20 percent tax on everything that is imported into the United States, increasing the price of all types of consumer goods—from tennis shoes and t-shirts, to crude oil and auto parts. Supporters argue that a BAT will increase the value of the U.S. dollar, which would offset any increase in consumer prices. But this is unproven economic theory and fails to take into account a number of important factors that could limit the impact of currency adjustment. These factors include, for example, the different tax rates between corporations and pass-through businesses, the fact that some of our trad- ing partners don’t float their currencies, and whether or not a proposed export credit will be refundable. With the border adjustment provision, supporters make a big bet that this will be a textbook transition. In reality, consumers will likely take a big hit when the dollar appreciation doesn’t perfectly offset their price increases. It is impossible to predict the real world impact of the BAT because something like this has never been done before. This proposed system is unlike anything in existence (though proponents will misleadingly compare it to the treatment of value-added taxes (VATs) in other countries) and there is a tremendous amount of risk surrounding its implementation. ALAN NGUYEN, SENIOR POLICY ADVISER, FREEDOM PARTNERS MARY KATE HOPKINS, SENIOR POLICY ANALYST, AMERICANS FOR PROSPERITY April 2017
Transcript
1
THE IMPACT OF THE BORDER ADJUSTMENT TAX ON THE STATES
For the first time in more than 30 years, federal lawmakers have an opportunity to replace our nation’s broken tax code with a simple, efficient, equitable, and predictable system that promotes long-term economic growth and opportunity for all Americans.
There are plenty of excellent tax reform proposals on the table that would lower rates, eliminate loop-holes and deductions, and simplify tax filing. But one proposal currently being debated would undo many of the benefits that would come from these laudable reforms. It is called a border adjustment tax (BAT), and it includes a provision that would impose a new 20 percent tax on everything that is imported into the United States, increasing the price of all types of consumer goods—from tennis shoes and t-shirts, to crude oil and auto parts.
Supporters argue that a BAT will increase the value of the U.S. dollar, which would offset any increase in consumer prices. But this is unproven economic theory and fails to take into account a number of important factors that could limit the impact of currency adjustment. These factors include, for example, the different tax rates between corporations and pass-through businesses, the fact that some of our trad-ing partners don’t float their currencies, and whether or not a proposed export credit will be refundable. With the border adjustment provision, supporters make a big bet that this will be a textbook transition. In reality, consumers will likely take a big hit when the dollar appreciation doesn’t perfectly offset their price increases.
It is impossible to predict the real world impact of the BAT because something like this has never been done before. This proposed system is unlike anything in existence (though proponents will misleadingly compare it to the treatment of value-added taxes (VATs) in other countries) and there is a tremendous amount of risk surrounding its implementation.
ALAN NGUYEN, SENIOR POLICY ADVISER, FREEDOM PARTNERSMARY KATE HOPKINS, SENIOR POLICY ANALYST, AMERICANS FOR PROSPERITY
April 2017
2
Further, it is important to note the imbalanced, targeted nature of this provision. It falls on a very specific sector of American business: importers. It singles out businesses that import and prevents them from deducting the cost of imports as a business expense.
The question when evaluating the border adjustment tax’s impact on the states is not which states stand to lose under the proposal, but how much will each state lose. This report examines the state-level impact potential of implementing a border adjustment tax, and the results should raise alarms for lawmakers as they work to draft a tax reform package that works for the benefit of all Americans.
THE BORDER ADJUSTMENT TAX: NOT ONE-SIZE-FITS-ALL
Though much of the discussion surrounding the proposed BAT centers around its impact on the nation as a whole, the level of potential risk from a more than $1 trillion consumer tax1 actually varies from state to state. In Texas, for instance, lawmakers, economists, and business leaders—recognizing the impor-tance of trade between Texas and Mexico—have warned about the impact of levying a 20 percent tax on imports. Tom Fullerton, an economist at the University of Texas at El Paso, notes that such a tax would threaten supply chains between the two trading partners, hurt industrial performance, and drive up unemployment.2
These impacts could spell disaster for U.S. businesses. Business owners have been very vocal about how the BAT poses an existential threat to their livelihood. Take Learning Resources, a Chicago-based edu-cational toy company. The company imports 98 percent of the products it sells in the United States, and there is no U.S. supplier that can make the same products at the cost it needs. Under the border adjust-ment, the company’s tax bill would balloon to 165 percent of its earnings according to its president, Rick Woldenberg.3 “This plan is not good for me if it kills me,” says Woldenberg. “You know John Maynard Keynes said in the long run we’re all dead. I just don’t want to be dead now.” 4
The story is the same for small businesses across the country. Katherine Gold, CEO of an Aurora, Colorado-based children’s shoe store, said her company does not have the cash cushion to absorb the impact of the BAT and that it “would put us out of business if we can’t pass [the cost of the tax] on immediately.”5 Shuttering the company would put more than 100 people out of work.
This would be the outcome in many other cases, driving up costs for consumers and threatening the liveli-hood of businesses that rely on imports. Businesses like these are major drivers of our economy, providing opportunities and creating well-paying jobs all across the country. With many businesses dependent on both finished products and raw materials that they import from abroad, the BAT is a major threat to economic development and employment in every state.
Though every state stands to lose under a BAT, the extent to which individual states are integrated into the global economy helps illustrate the magnitude of the potential impact that a BAT could have on a state’s businesses and residents.
3
STATE SENSITIVITY TO BAT
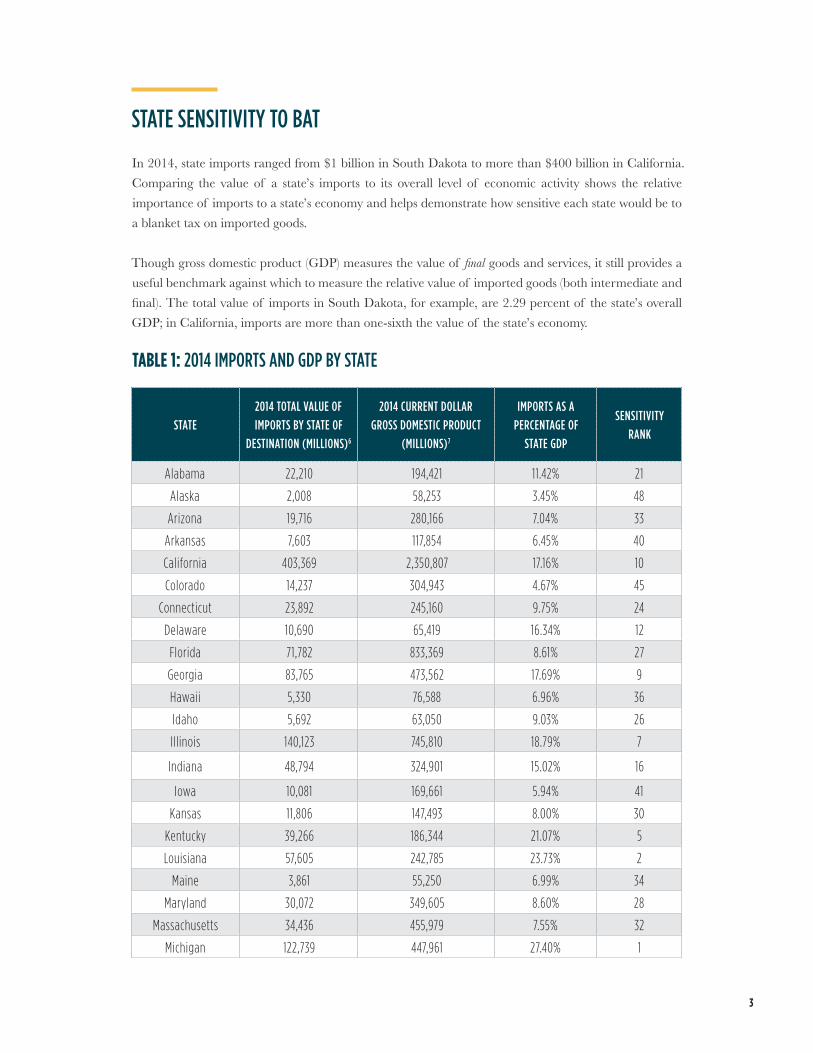
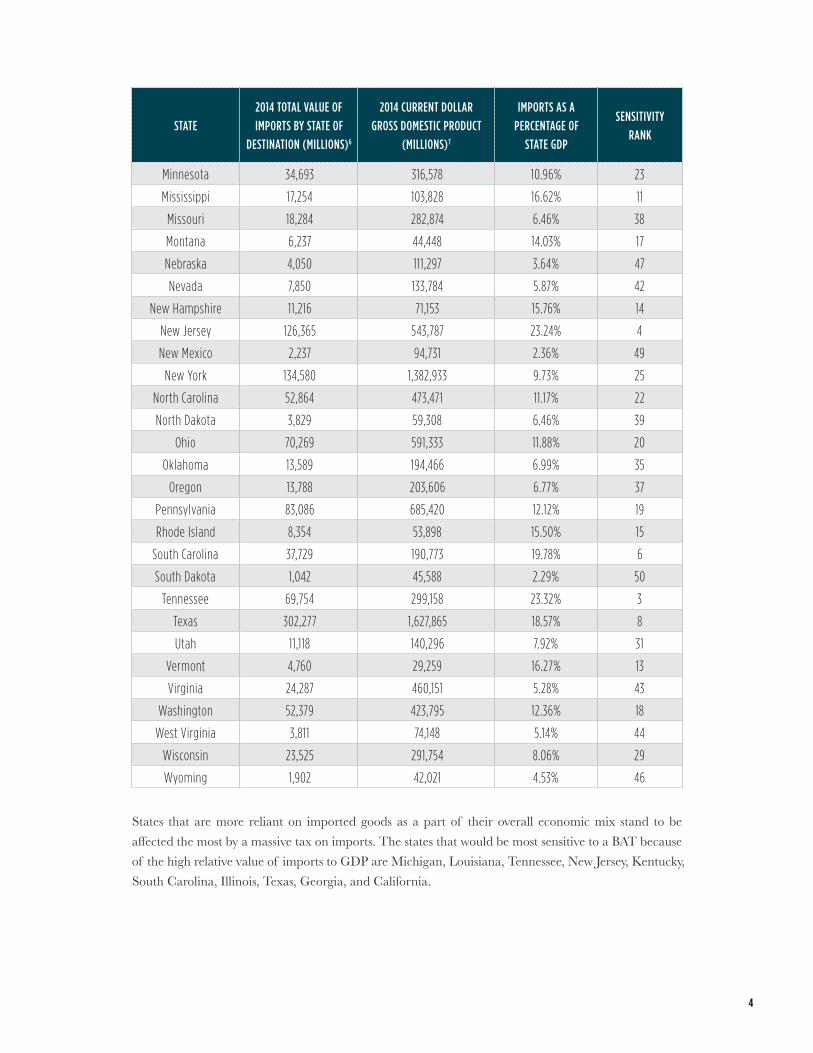
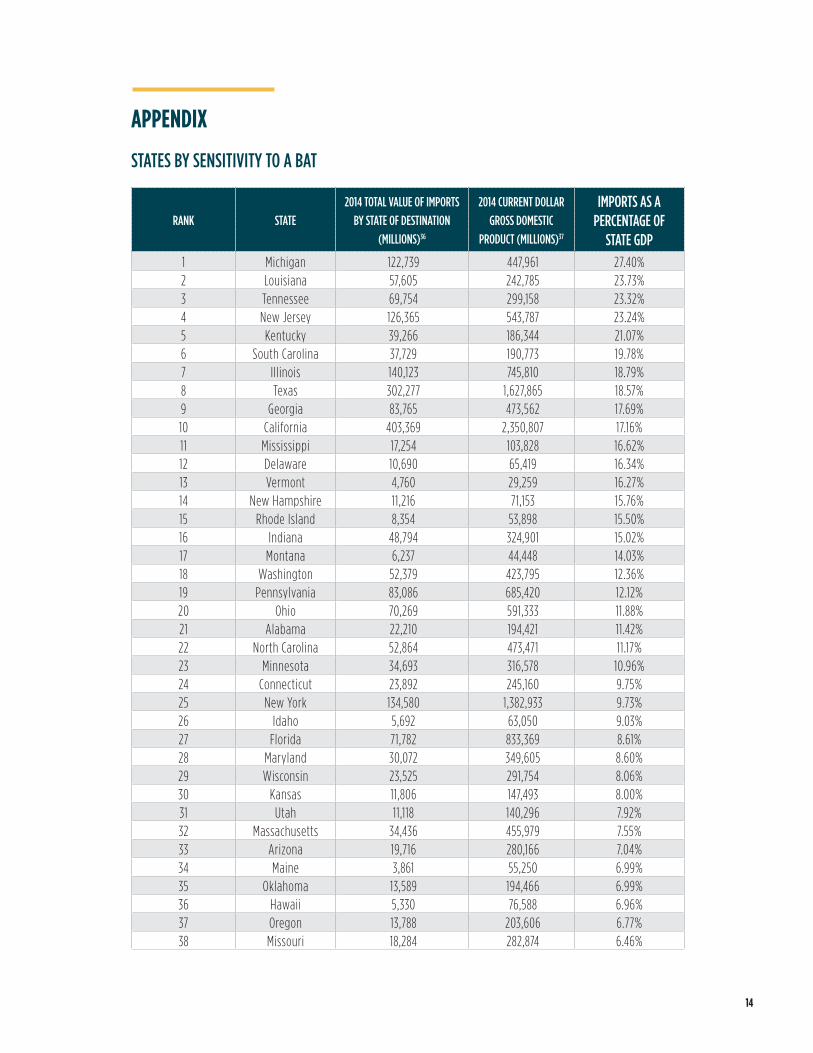
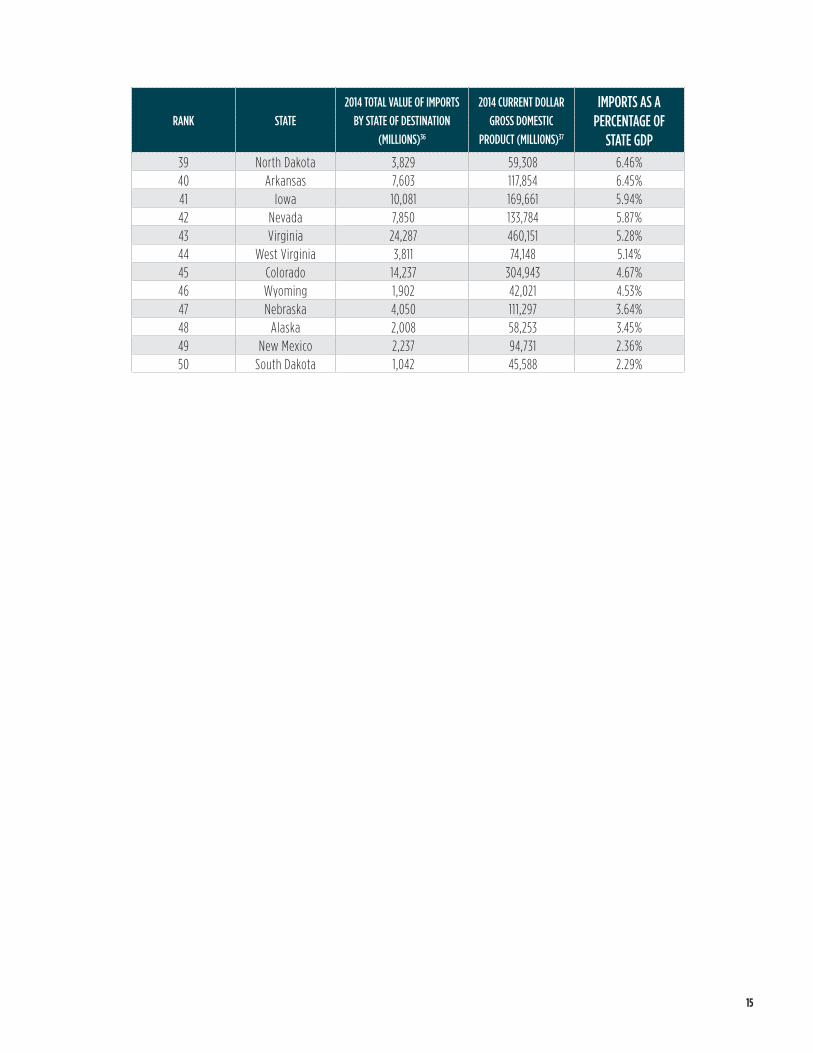
In 2014, state imports ranged from $1 billion in South Dakota to more than $400 billion in California. Comparing the value of a state’s imports to its overall level of economic activity shows the relative importance of imports to a state’s economy and helps demonstrate how sensitive each state would be to a blanket tax on imported goods.
Though gross domestic product (GDP) measures the value of final goods and services, it still provides a useful benchmark against which to measure the relative value of imported goods (both intermediate and final). The total value of imports in South Dakota, for example, are 2.29 percent of the state’s overall GDP; in California, imports are more than one-sixth the value of the state’s economy.
TABLE 1: 2014 IMPORTS AND GDP BY STATE
STATE2014 TOTAL VALUE OF IMPORTS BY STATE OF
DESTINATION (MILLIONS)6
2014 CURRENT DOLLAR GROSS DOMESTIC PRODUCT
(MILLIONS)7
IMPORTS AS A PERCENTAGE OF
STATE GDP
SENSITIVITY RANK
Alabama 22,210 194,421 11.42% 21
Alaska 2,008 58,253 3.45% 48
Arizona 19,716 280,166 7.04% 33
Arkansas 7,603 117,854 6.45% 40
California 403,369 2,350,807 17.16% 10
Colorado 14,237 304,943 4.67% 45
Connecticut 23,892 245,160 9.75% 24
Delaware 10,690 65,419 16.34% 12
Florida 71,782 833,369 8.61% 27
Georgia 83,765 473,562 17.69% 9
Hawaii 5,330 76,588 6.96% 36
Idaho 5,692 63,050 9.03% 26
Illinois 140,123 745,810 18.79% 7
Indiana 48,794 324,901 15.02% 16
Iowa 10,081 169,661 5.94% 41
Kansas 11,806 147,493 8.00% 30
Kentucky 39,266 186,344 21.07% 5
Louisiana 57,605 242,785 23.73% 2
Maine 3,861 55,250 6.99% 34
Maryland 30,072 349,605 8.60% 28
Massachusetts 34,436 455,979 7.55% 32
Michigan 122,739 447,961 27.40% 1
4
STATE2014 TOTAL VALUE OF IMPORTS BY STATE OF
DESTINATION (MILLIONS)6
2014 CURRENT DOLLAR GROSS DOMESTIC PRODUCT
(MILLIONS)7
IMPORTS AS A PERCENTAGE OF
STATE GDP
SENSITIVITY RANK
Minnesota 34,693 316,578 10.96% 23
Mississippi 17,254 103,828 16.62% 11
Missouri 18,284 282,874 6.46% 38
Montana 6,237 44,448 14.03% 17
Nebraska 4,050 111,297 3.64% 47
Nevada 7,850 133,784 5.87% 42
New Hampshire 11,216 71,153 15.76% 14
New Jersey 126,365 543,787 23.24% 4
New Mexico 2,237 94,731 2.36% 49
New York 134,580 1,382,933 9.73% 25
North Carolina 52,864 473,471 11.17% 22
North Dakota 3,829 59,308 6.46% 39
Ohio 70,269 591,333 11.88% 20
Oklahoma 13,589 194,466 6.99% 35
Oregon 13,788 203,606 6.77% 37
Pennsylvania 83,086 685,420 12.12% 19
Rhode Island 8,354 53,898 15.50% 15
South Carolina 37,729 190,773 19.78% 6
South Dakota 1,042 45,588 2.29% 50
Tennessee 69,754 299,158 23.32% 3
Texas 302,277 1,627,865 18.57% 8
Utah 11,118 140,296 7.92% 31
Vermont 4,760 29,259 16.27% 13
Virginia 24,287 460,151 5.28% 43
Washington 52,379 423,795 12.36% 18
West Virginia 3,811 74,148 5.14% 44
Wisconsin 23,525 291,754 8.06% 29
Wyoming 1,902 42,021 4.53% 46
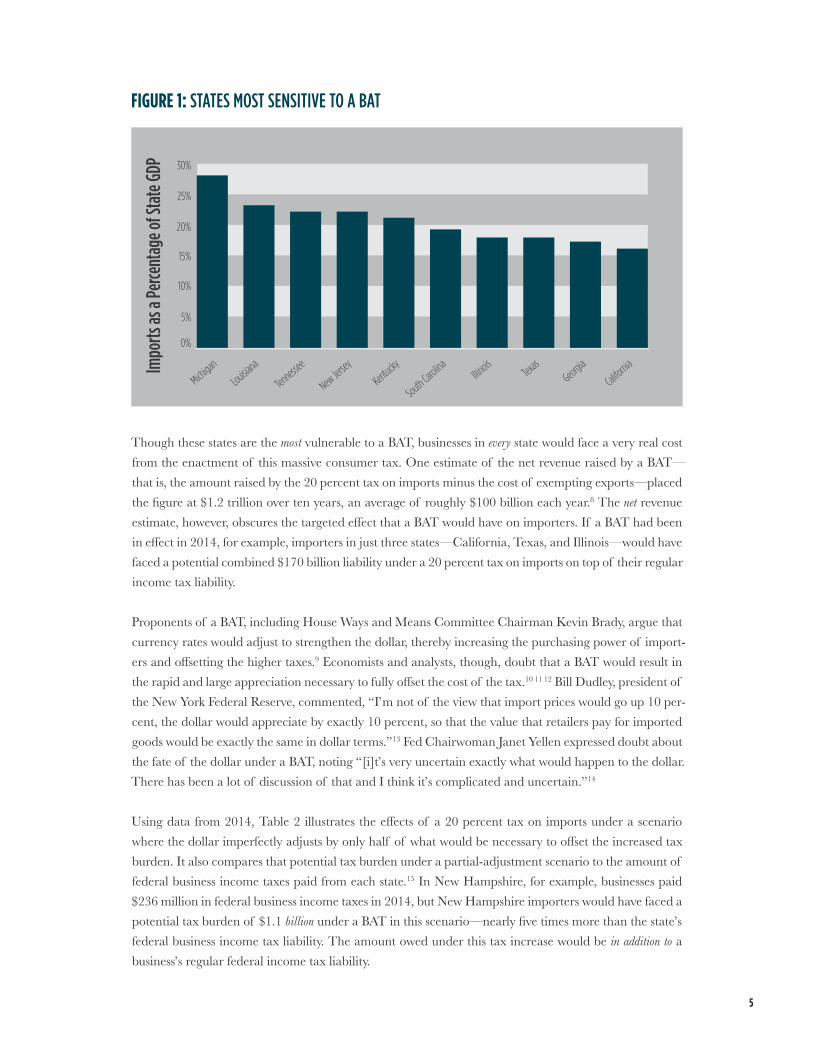
States that are more reliant on imported goods as a part of their overall economic mix stand to be affected the most by a massive tax on imports. The states that would be most sensitive to a BAT because of the high relative value of imports to GDP are Michigan, Louisiana, Tennessee, New Jersey, Kentucky, South Carolina, Illinois, Texas, Georgia, and California.
5
Impo
rts as
a Pe
rcent
age o
f Sta
te GD
P
0%
25%
20%
15%
10%
5%
30%
Michigan
Louisiana
Tennessee
New Jersey
Kentucky
South Carolina
Illinois
Texas
Georgia
California
FIGURE 1: STATES MOST SENSITIVE TO A BAT
Though these states are the most vulnerable to a BAT, businesses in every state would face a very real cost from the enactment of this massive consumer tax. One estimate of the net revenue raised by a BAT—that is, the amount raised by the 20 percent tax on imports minus the cost of exempting exports—placed the figure at $1.2 trillion over ten years, an average of roughly $100 billion each year.8 The net revenue estimate, however, obscures the targeted effect that a BAT would have on importers. If a BAT had been in effect in 2014, for example, importers in just three states—California, Texas, and Illinois—would have faced a potential combined $170 billion liability under a 20 percent tax on imports on top of their regular income tax liability.
Proponents of a BAT, including House Ways and Means Committee Chairman Kevin Brady, argue that currency rates would adjust to strengthen the dollar, thereby increasing the purchasing power of import-ers and offsetting the higher taxes.9 Economists and analysts, though, doubt that a BAT would result in the rapid and large appreciation necessary to fully offset the cost of the tax.10 11 12 Bill Dudley, president of the New York Federal Reserve, commented, “I’m not of the view that import prices would go up 10 per-cent, the dollar would appreciate by exactly 10 percent, so that the value that retailers pay for imported goods would be exactly the same in dollar terms.”13 Fed Chairwoman Janet Yellen expressed doubt about the fate of the dollar under a BAT, noting “[i]t’s very uncertain exactly what would happen to the dollar. There has been a lot of discussion of that and I think it’s complicated and uncertain.”14
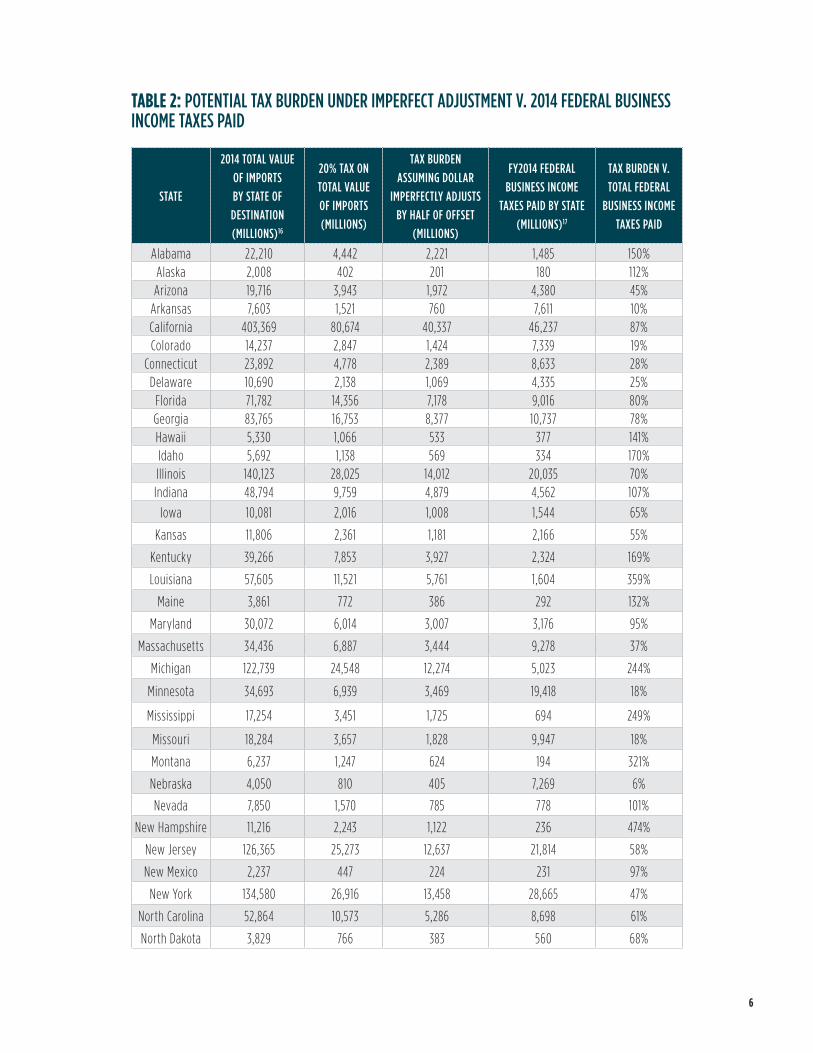
Using data from 2014, Table 2 illustrates the effects of a 20 percent tax on imports under a scenario where the dollar imperfectly adjusts by only half of what would be necessary to offset the increased tax burden. It also compares that potential tax burden under a partial-adjustment scenario to the amount of federal business income taxes paid from each state.15 In New Hampshire, for example, businesses paid $236 million in federal business income taxes in 2014, but New Hampshire importers would have faced a potential tax burden of $1.1 billion under a BAT in this scenario—nearly five times more than the state’s federal business income tax liability. The amount owed under this tax increase would be in addition to a business’s regular federal income tax liability.
6
TABLE 2: POTENTIAL TAX BURDEN UNDER IMPERFECT ADJUSTMENT V. 2014 FEDERAL BUSINESS INCOME TAXES PAID
STATE
2014 TOTAL VALUE OF IMPORTS BY STATE OF DESTINATION (MILLIONS)16
2014 TOTAL VALUE OF IMPORTS BY STATE OF DESTINATION (MILLIONS)16
20% TAX ON TOTAL VALUE OF IMPORTS (MILLIONS)
TAX BURDEN ASSUMING DOLLAR
IMPERFECTLY ADJUSTS BY HALF OF OFFSET
(MILLIONS)
FY2014 FEDERAL BUSINESS INCOME
TAXES PAID BY STATE (MILLIONS)17
TAX BURDEN V. TOTAL FEDERAL
BUSINESS INCOME TAXES PAID
Ohio 70,269 14,054 7,027 12,286 57%
Oklahoma 13,589 2,718 1,359 4,049 34%
Oregon 13,788 2,758 1,379 1,920 72%
Pennsylvania 83,086 16,617 8,309 12,619 66%
Rhode Island 8,354 1,671 835 3,684 23%
South Carolina 37,729 7,546 3,773 1,568 241%
South Dakota 1,042 208 104 405 26%
Tennessee 69,754 13,951 6,975 5,905 118%
Texas 302,277 60,455 30,228 32,586 93%
Utah 11,118 2,224 1,112 1,558 71%
Vermont 4,760 952 476 352 135%
Virginia 24,287 4,857 2,429 11,378 21%
Washington 52,379 10,476 5,238 5,613 93%
West Virginia 3,811 762 381 375 102%
Wisconsin 23,525 4,705 2,353 6,021 39%
Wyoming 1,902 380 190 186 102%
New Hampshire, Louisiana, Montana, Mississippi, and Michigan round out the top five states with the greatest disparity between their tax burden under a 20 percent import tax and the amount paid under the federal business income tax in 2014. What’s clear, though, is that the border adjustment tax stands to extract a significant amount of revenue from importers in every state.
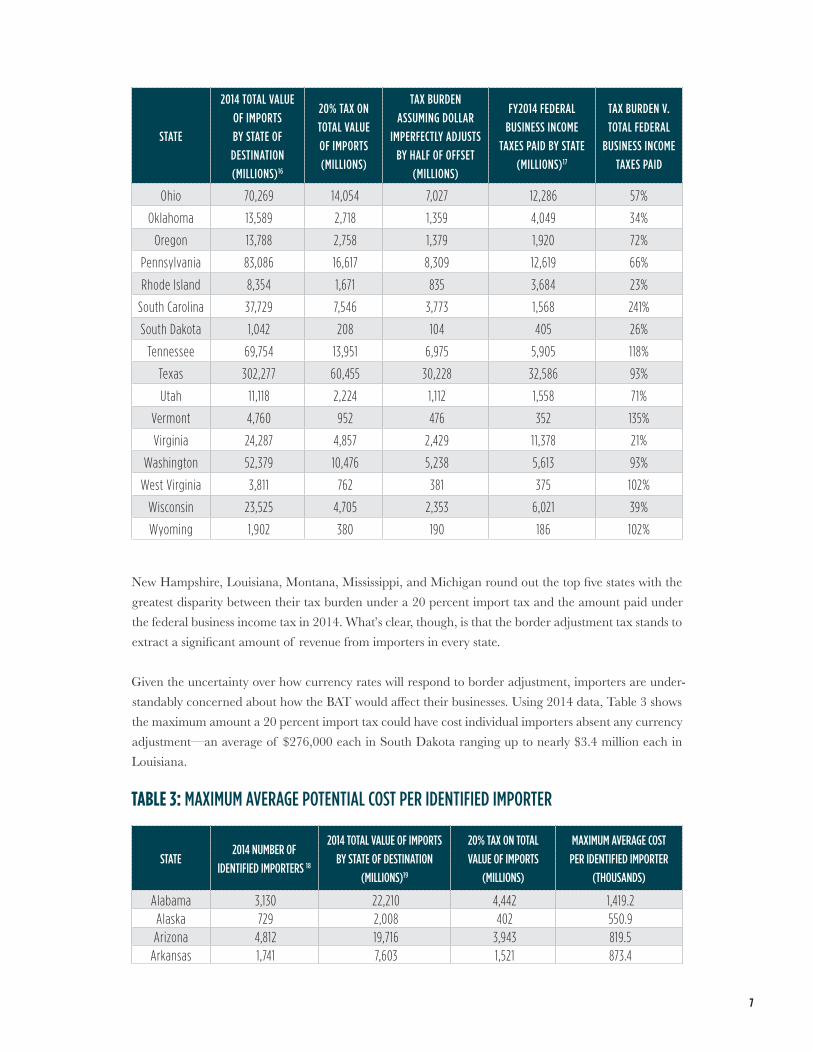
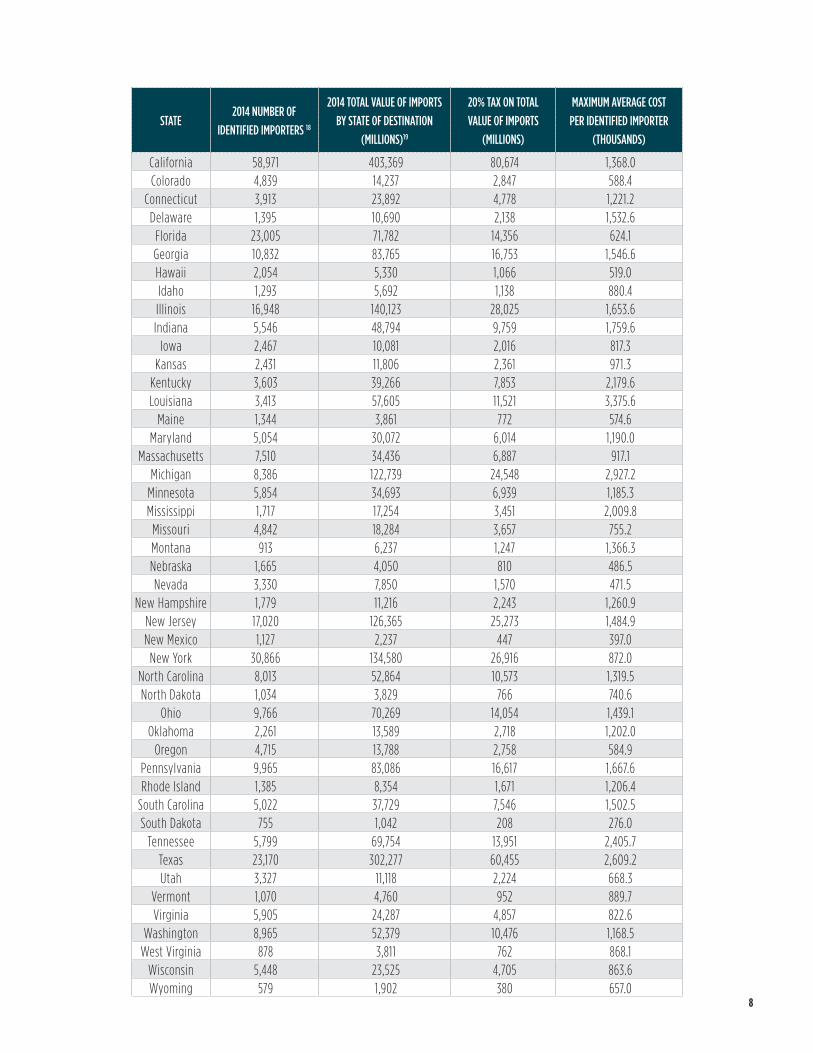
Given the uncertainty over how currency rates will respond to border adjustment, importers are under-standably concerned about how the BAT would affect their businesses. Using 2014 data, Table 3 shows the maximum amount a 20 percent import tax could have cost individual importers absent any currency adjustment—an average of $276,000 each in South Dakota ranging up to nearly $3.4 million each in Louisiana.
STATE2014 NUMBER OF
IDENTIFIED IMPORTERS 18
2014 TOTAL VALUE OF IMPORTS BY STATE OF DESTINATION
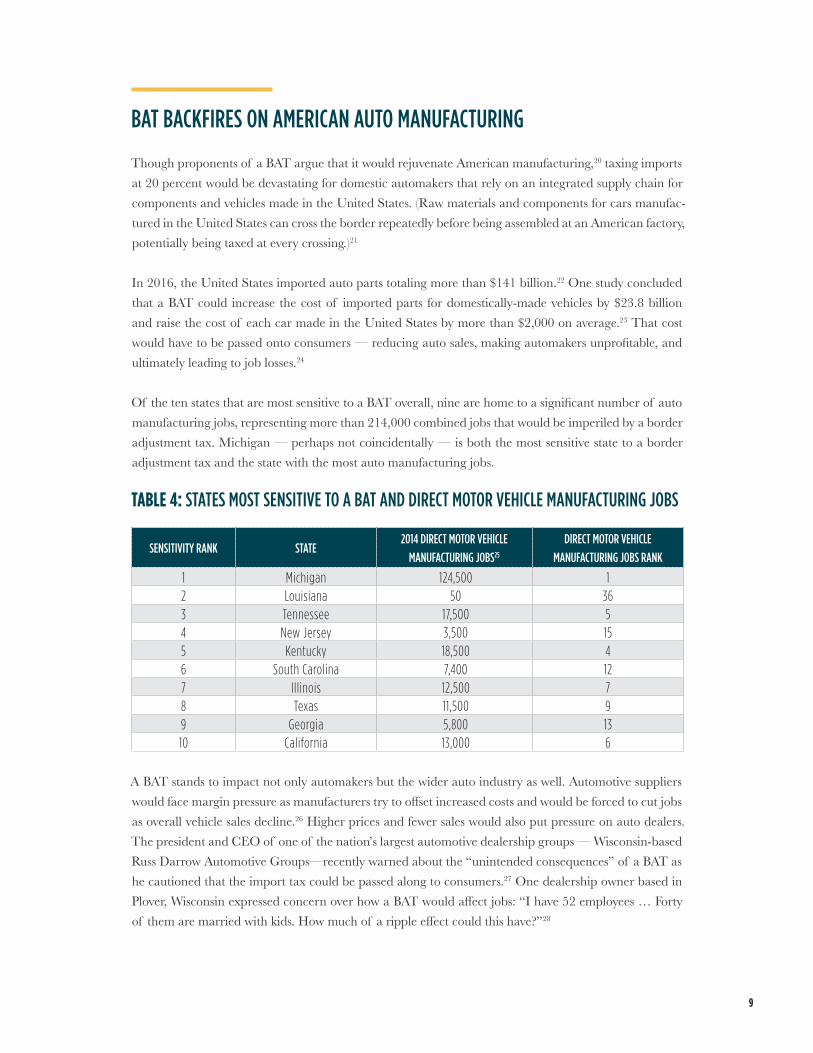
Though proponents of a BAT argue that it would rejuvenate American manufacturing,20 taxing imports at 20 percent would be devastating for domestic automakers that rely on an integrated supply chain for components and vehicles made in the United States. (Raw materials and components for cars manufac-tured in the United States can cross the border repeatedly before being assembled at an American factory, potentially being taxed at every crossing.)21
In 2016, the United States imported auto parts totaling more than $141 billion.22 One study concluded that a BAT could increase the cost of imported parts for domestically-made vehicles by $23.8 billion and raise the cost of each car made in the United States by more than $2,000 on average.23 That cost would have to be passed onto consumers — reducing auto sales, making automakers unprofitable, and ultimately leading to job losses.24
Of the ten states that are most sensitive to a BAT overall, nine are home to a significant number of auto manufacturing jobs, representing more than 214,000 combined jobs that would be imperiled by a border adjustment tax. Michigan — perhaps not coincidentally — is both the most sensitive state to a border adjustment tax and the state with the most auto manufacturing jobs.
TABLE 4: STATES MOST SENSITIVE TO A BAT AND DIRECT MOTOR VEHICLE MANUFACTURING JOBS
SENSITIVITY RANK STATE2014 DIRECT MOTOR VEHICLE
MANUFACTURING JOBS25
DIRECT MOTOR VEHICLE MANUFACTURING JOBS RANK
1 Michigan 124,500 12 Louisiana 50 363 Tennessee 17,500 54 New Jersey 3,500 155 Kentucky 18,500 46 South Carolina 7,400 127 Illinois 12,500 78 Texas 11,500 99 Georgia 5,800 1310 California 13,000 6
A BAT stands to impact not only automakers but the wider auto industry as well. Automotive suppliers would face margin pressure as manufacturers try to offset increased costs and would be forced to cut jobs as overall vehicle sales decline.26 Higher prices and fewer sales would also put pressure on auto dealers. The president and CEO of one of the nation’s largest automotive dealership groups — Wisconsin-based Russ Darrow Automotive Groups—recently warned about the “unintended consequences” of a BAT as he cautioned that the import tax could be passed along to consumers.27 One dealership owner based in Plover, Wisconsin expressed concern over how a BAT would affect jobs: “I have 52 employees … Forty of them are married with kids. How much of a ripple effect could this have?”28
10
BAT WOULD SPELL DISASTER FOR RETAIL INDUSTRY
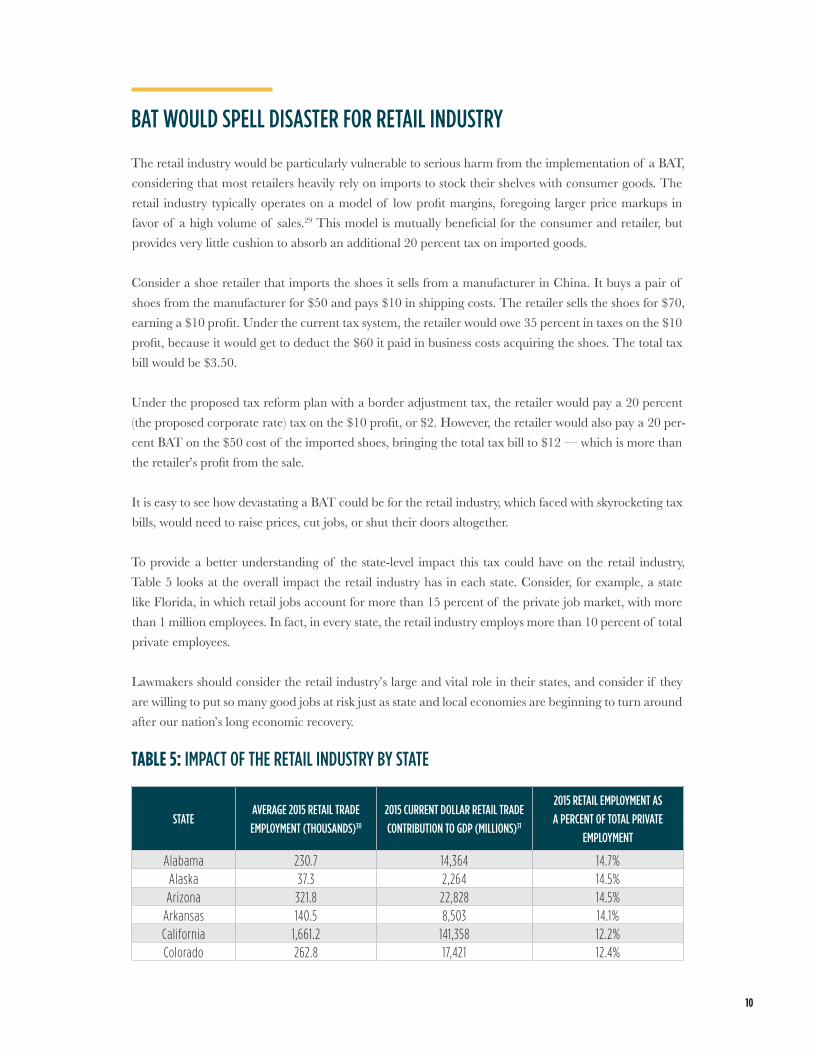
The retail industry would be particularly vulnerable to serious harm from the implementation of a BAT, considering that most retailers heavily rely on imports to stock their shelves with consumer goods. The retail industry typically operates on a model of low profit margins, foregoing larger price markups in favor of a high volume of sales.29 This model is mutually beneficial for the consumer and retailer, but provides very little cushion to absorb an additional 20 percent tax on imported goods.
Consider a shoe retailer that imports the shoes it sells from a manufacturer in China. It buys a pair of shoes from the manufacturer for $50 and pays $10 in shipping costs. The retailer sells the shoes for $70, earning a $10 profit. Under the current tax system, the retailer would owe 35 percent in taxes on the $10 profit, because it would get to deduct the $60 it paid in business costs acquiring the shoes. The total tax bill would be $3.50.
Under the proposed tax reform plan with a border adjustment tax, the retailer would pay a 20 percent (the proposed corporate rate) tax on the $10 profit, or $2. However, the retailer would also pay a 20 per-cent BAT on the $50 cost of the imported shoes, bringing the total tax bill to $12 — which is more than the retailer’s profit from the sale.
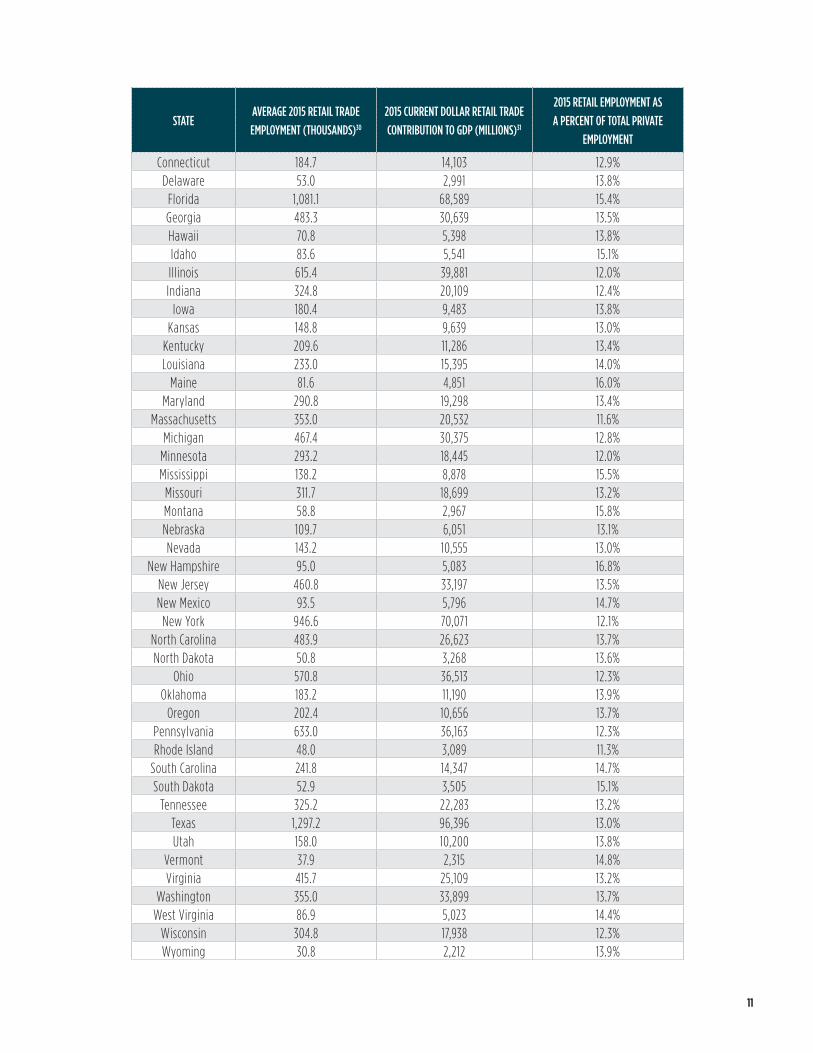
It is easy to see how devastating a BAT could be for the retail industry, which faced with skyrocketing tax bills, would need to raise prices, cut jobs, or shut their doors altogether. To provide a better understanding of the state-level impact this tax could have on the retail industry, Table 5 looks at the overall impact the retail industry has in each state. Consider, for example, a state like Florida, in which retail jobs account for more than 15 percent of the private job market, with more than 1 million employees. In fact, in every state, the retail industry employs more than 10 percent of total private employees.
Lawmakers should consider the retail industry’s large and vital role in their states, and consider if they are willing to put so many good jobs at risk just as state and local economies are beginning to turn around after our nation’s long economic recovery.
Every state will be impacted by a border adjustment tax, and those states that rely more on imports face a graver threat from the tax hike. At a cost of more than $1 trillion, this tax on businesses and consumers is on par with the Affordable Care Act32 or former presidential candidate Hillary Clinton’s plans to reshape the American tax system.33
American importers—95 percent of whom are small businesses employing fewer than 250 workers34— could see their tax bills skyrocket to unsustainable levels. In today’s highly-integrated global economy, every consumer in every corner of the country would feel the effects of the BAT, in the form of higher costs at the department store, grocery store, gas pump, and online. Lawmakers who think that the BAT can’t impact their states are mistaken; the risks and costs that would come along with border adjustment are too much for American consumers and businesses to bear.
13
METHODOLOGY
Sensitivity Rank: The U.S. Census Bureau tracks the value of imports by state of destination, which accounts for where the merchandise is destined as known at the time of entry summary filing. This value is then divided by a state’s gross domestic product (GDP) and compared to all other states to derive a sensitivity rank.
Potential Tax Burdena Under Imperfect Adjustment v. Federal Business Income Taxes: The 2014 value of imports for each state is multiplied by 20 percent to determine the potential amount owed from each state under a BAT and then halved to reflect a possible scenario of imperfect currency adjustment. That value is then divided by 2014 IRS data on federal business income taxes paid by each state as a point of comparison.
Maximum Average Potential Cost Per Identified Importer: The potential amount owed from each state under a BAT is divided by the number of identified importers per state to determine the max-imum potential average cost of a BAT per identified importer. According to the U.S. Census Bureau, the total import value that could not be linked to specific companies was 12.4 percent in 2014, and therefore the number of importers could be understated. Please see full report for limitations on data.35
Average 2015 Retail Trade Employment: A simple average of monthly retail trade employment by state for 2015 using payroll data from the Bureau of Labor Statistics.
2015 Retail Employment v. Total Private Employment: The 2015 annual average of monthly retail trade employment by state is divided by the annual average of total private employment by state.