60
Assessing Opportunities, Risks, and Challenges for Minnesota Agriculture Carbon Markets foodsystems.asu.edu

Assessing Opportunities, Risks, and Challenges for Minnesota Agriculture
Carbon Markets
foodsystems.asu.edu

Swette Center for Sustainable Food Systems, Arizona State University August 2020 This publication is a Capstone Report by the Graduate Certificate in Food Policy and Sustainability Leadership class of 2019-2020. Suggested Citation: Swette Center for Sustainable Food Systems. Carbon Markets: Assessing Opportunities, Risks, and Challenges for Minnesota Agriculture. October, 2020. (Swette Center, 2020)

Dr. Angel Cruz Academic and Extension Initiatives Manager Center for Environmental Farming Systems North Carolina State University Devin Foote Food Systems Program Officer W.K. Kellogg Foundation Alaine Janosy Sustainability Consultant Katie Poirier Executive Director Mollen Foundation Annalise VanVranken Strategy & Partnerships Project Manager FoodCorps
Minnesota Department of Agriculture
Ariel Kagan Strategy & Innovation Specialist Minnesota Department of Agriculture Dr. Kathleen A. Merrigan Executive Director Swette Center for Sustainable Food Systems Arizona State University Dr. Mukunth Natarajan Postdoctoral Research Associate Swette Center for Sustainable Agriculture
Authors
Client Partner
Acknowledgements


Introduction ..................................................................................................................... 2
Carbon Market Frameworks ............................................................................................ 3
Complexity of Measuring Soil Carbon ........................................................................... 15
Pricing Carbon .............................................................................................................. 17
Key Findings from Interviews with Producers and MN Experts ..................................... 24
Carbon Policy ................................................................................................................ 27
Risks & Opportunities .................................................................................................... 33
Key Findings and Recommendations ............................................................................ 35
Methodology .............................................................................................................. 41
References ................................................................................................................. 43
Appendices ................................................................................................................ 47
Table of Contents

P a g e | 1
Executive Summary With increasing climate impacts predicted across the globe, many see soil carbon storage and sequestration as an opportunity to reduce atmospheric carbon and mitigate climate change. One complexity within carbon markets is the role that many firms play as both verifiers of carbon sequestration and marketers of those credits. There are currently no universal standards for verification of soil carbon, and many firms are developing their own proprietary approaches to measurement and verification. Private companies and public programs are already working to incentivize and compensate producers pursuing conservation focused land management. In general, these programs focus on driving comprehensive ecologically focused land management with soil carbon sequestration as a co-benefit. By measuring multiple benefits and including carbon as a co-benefit area, these programs offer a way for producers and brands to differentiate themselves in the marketplace and get credit for improved practices through raw material price credits, as opposed to entering a carbon marketplace. This report primarily focuses on the business and policy requirement for soil carbon markets and briefly discusses the agricultural management practices that accompany soil carbon sequestration. This report assesses the current opportunities for Minnesota agriculture and proposes solutions, policies, and management practices for these markets to benefit farmers and Minnesota’s agricultural sector. The scope of this report does not include mandatory carbon markets, such as a cap-and-trade system or regulatory carbon reduction. The assumption is that any carbon market in Minnesota would be voluntary, and market based.

P a g e | 2
Introduction There are a number of emerging carbon market frameworks that promise increased revenues for farmers, essentially paying farmers to put carbon in the ground. However, questions remain: Will these carbon market frameworks work well for farmers of different scales? In the short and long term? And without significant increased risk and management burden? This report assesses the current landscape of carbon sequestration market tools and identifies the opportunities, risks, and challenges of establishing and scaling emerging markets available to Minnesota producers. Soil carbon sequestration has become a popular topic within the agriculture sector, as many businesses, farmers, and service providers look to enhance soil carbon storage and, ideally, create new revenue streams associated with those carbon stocks. With increasing climate impacts predicted, particularly in Minnesota (Ciborowski, 2019), many see soil carbon storage and sequestration as an opportunity to reduce atmospheric carbon and mitigate climate change. Soil organic carbon (SOC) has approximately three times the stock of carbon that is in all vegetation and approximately twice the stock of carbon as in the atmosphere (Smith, 2012). Thus, a small change in soil carbon can have significant impacts on the atmosphere and climate change. Many businesses, ranging from Danone to Levi to Microsoft, that signed the United Nation Global Compact Business Ambition for 1.5 C are particularly motivated to harness soil carbon sequestration as part of their roadmap to achieve zero net greenhouse gas (GHG) emissions by 2050. This report primarily focuses on the business and policy requirements for soil carbon markets and briefly discusses the agricultural management practices that accompany soil carbon sequestration. The report assesses the current opportunities for Minnesota agriculture and proposes solutions, policies, and management practices for these markets to benefit farmers and Minnesota’s agricultural sector. The scope of this report does not include mandatory carbon markets, such as a cap-and-trade system or regulatory carbon reduction. The assumption is that any carbon market in Minnesota will be voluntary, and market based. This report includes discussions about carbon and carbon emissions policies at the global, national and state level, carbon capacity in Minnesota based on land use, current market players in the voluntary carbon market, farmer and rancher voluntary carbon market perspectives based on interviews, soil testing, carbon price sensitivity, carbon market risks and opportunities, and recommendations for next steps. There are many co-benefits of increasing soil carbon sequestration beyond GHG reductions, including improved water quality and water retention, increased biodiversity,

P a g e | 3
reduced input costs, and enhanced resilience to extreme weather. These co-benefits will be briefly discussed in this report. A deeper analysis of these topics is outside the scope of this report. Other research exists and is being conducted to fully quantify these co-benefits.1
Carbon Market Frameworks Voluntary carbon markets exist when individual firms or consumers choose to offset their carbon emissions by paying for a carbon credit that a separate party has sequestered. Voluntary carbon markets have been established around the world and fulfill the needs of those entities that voluntarily decide to reduce their carbon footprint using offsets. Extensive work has been done in the forestry sector through the Reducing Emissions from Deforestation and Forest Degradation (REDD) which was established by the United Nations (UN) in 2005 and is actively being used in developing countries. Companies may want to offset their emissions for several reasons including to market themselves as “green businesses” to their customers. They seek to reduce their emissions as much as possible and to offset their remaining emissions to become carbon neutral by purchasing an equivalent number of carbon credits from voluntary markets. Other important buyers of the carbon credits of voluntary markets are nongovernmental organizations (NGOs), such as the World Bank, that seek global reduction of greenhouse gas emissions and seek to contribute to the sustainable development of a country. To date, voluntary offset markets have often lacked large-scale agricultural participation due to constraints imposed by offset program criteria; monitoring, reporting and verification (MRV) costs, and marginal income from verified credits. However, there are several evolving market structures that pose potential solutions to these and other challenges. Voluntary carbon markets emerged to reduce or offset carbon emissions of companies, nonprofit organizations, or similar institutions on a voluntary basis. In these markets, operations are carried out on a voluntary basis, regardless of the policies and objectives, applied mandatorily under the flexible mechanisms of the Kyoto Protocol. Organizations thus develop and implement projects voluntarily to reduce carbon emissions. These emission reductions are certified by authorities and exchanged
1 This area of research is typically referred to as “True Cost Accounting”. Research and reporting on this topic can be found in a variety of places including reports published by the Sustainable Food Trust and the Global Alliance for the Future of Food (Sandhu et al., 2019)

P a g e | 4
through voluntary carbon markets. Carbon credits in the voluntary market are called voluntary emission reductions (VERs). Credits from projects in voluntary markets cannot be used by a country which is a party to the Kyoto Protocol to meet emission reduction targets. Voluntary carbon credits can be exchanged in one of two ways: in a marketplace where all credits are equivalent and exchangeable at the same rates, or by contract where additional qualities and terms of exchange can be included. The difference between a marketplace and a contracted sale of credits affects the management and the balance of risk between the buyer and seller. For example, businesses that directly contract with farmers to create carbon credits can negotiate the terms, reporting, and scale of the management that matches their expectations. Buying carbon credits through a marketplace requires each credit to be equal to another, and for all the terms to be equivalent regardless of the source of the credit. Table 1 compares some of the key differences between a marketplace framework and a direct contract framework in relation to agricultural carbon credits. Of note is the similarity of this marketing landscape to that of the more familiar marketing landscape for farmgate products; traditional commodity markets offer farmers certain efficiencies and risk management, while direct marketing of products requires additional marketing, contracting, and relationship development. Farmers may find that participating in both marketing channels is an additional way to diversify their operations. Table 1: Relation between marketplace frameworks and direct contract frameworks
Marketplace Direct Contracts
Credits Credits are financialized and so can be bought and traded, leveraged, and invested.
Contracts between buyer and seller are unique and cannot be further developed in a financial market system without adjustments to each individual contract.
Trading Each credit is equal to another, allowing credits to be traded as commodities.
Farmers may add value to their carbon credit through narratives around farming practices or measuring co-benefits such as biodiversity or water quality. These are sometimes called “premium carbon credits.”

P a g e | 5
Entry and Exit Marketplaces may have lower barriers for entry, with clear guidelines about how to supply the market, technical assistance from marketplace actors, and clear exit options.
Contracted arrangements take time to build relationships, maintain or grow markets, and there may be transaction costs for developing contracts. These arrangements may be more difficult for farmers to find and participate in because of the one-to-one approach many buyers are taking. Exiting these contracts, particularly if a different market opportunity arises, may or may not be more difficult.
Market growth With clearer guidelines about what qualifies as a credit in the market, it may be easier to scale the marketplace quickly.
Direct contracts offer stability and trust between the buyer and seller.
There are critics of carbon markets for agriculture. The Institute for Agriculture and Trade Policy (IATP) and the National Family Farm Coalition have spoken out against agricultural carbon markets, stating that the approach is not appropriate for the agricultural sector. The joint publication criticizes the approach of mandatory carbon markets based on government enforced cap and trade systems (Ritter, 2020). It is unclear whether voluntary markets would lead to similar concerns. The criticism is rooted in the view that companies buying carbon credits are essentially buying the right to continue to pollute. Additional concerns include the price point and volatility of carbon credits, environmental justice impacts, inadequate measurement tools, and the impermanence of soil carbon. Tradable Carbon Credit Markets With many agricultural carbon markets taking the marketplace approach, it is worth thinking through marketplace development more broadly. Marketplaces require robust supply and demand to fulfill the needs of price finding, efficiency, and innovation. In the Guide to Marketplaces, investor Boris Wertz outlines the key factors that make a new online marketplace successful. Briefly, these include unique inventory, a sense of trust, and taking time to develop an ecosystem of value-added seller and customer services (Wertz & Kingyens, 2015).

P a g e | 6
There are many lessons from online marketplaces that can be applied to soil carbon markets. The carbon market landscape could provide farmers with a variety of options for the level of risk, cost, and management they prefer in selling their carbon assets. One way to think about this is in the example of property rentals. Homeowners have the ability to list their property for rent in many different ways to maximize their returns and their preference for risk. Table 2 compares three possible methods for homeowners to rent their property. One key similarity across these platforms is that the homeowner can remove their home from the marketplace at any time while still retaining the value of the asset. The marketplace for carbon credits may benefit from a similar structure. For example, a farmer’s carbon stocks can be verified independently from the market mechanism that is responsible for finding buyers. Table 2: Potential opportunities for homeowners to rent.
Platform Fee to Homeowner
Payments Insurance (seller service)
Ratings (customer service)
Management/ Risk
Craigslist Free Off-platform None None High/High
AirBnB 3% On-platform Provided Yes High/Medium
Property Management
15-20% Handled by management company
Provided Maybe Low/Low
One complexity within carbon markets is the role that many firms play as both verifiers of carbon sequestration and marketers of those credits. There are currently no universal standards for verification of soil carbon, and many firms are developing their own proprietary approaches to measurement and verification. Carbon verification is the process in which carbon storage is assessed. There are currently no regulatory standards for carbon accounting, and so each entity differs in how data is collected, value is assigned and, if applicable, and how credit values are calculated. There are many organizations and businesses working to develop the carbon credit sector in the U.S. One example of a business that verifies carbon credits, but is not responsible for selling those credits, is Native Energy. This verifying agency provides project development and management, then uses one of three verification standards to confirm carbon sequestration amounts. Additional verification schemes such as Gold Standard issue carbon credits from projects based in more than 60 different countries around the world. In the agricultural carbon credit market, there are three marketplaces gaining traction: Nori, Indigo Ag’s Terraton Initiative, and Ecosystem Services

P a g e | 7
Marketplace Consortium. Below is an overview of each of these three key players and their similarities and differences, which is summarized in Figure 1.
Figure 1: Comparison across three carbon markets and their complexity. Data as of September, 2020. Ecosystem Services Marketplace Consortium Ecosystems Services Marketplace Consortium’s (ESMC) mission is “to advance ecosystem service markets that incentivize farmers and ranchers to improve soil health systems that benefit society.” They are aiming to launch their fully functioning national ecosystem services market to sell carbon, water quality, and water quantity credits within the agriculture sector by 2022. ESMC is working to develop accurate, cost-effective, and scalable quantification of agricultural management system impacts on soil carbon, net GHG, water quality, and water quantity. ESMC is creating working groups to collaborate with member organizations and science advisors to examine existing soil sampling and develop their own sampling protocol that will be designed to refine and validate predicted outcomes and meet requirements of market demands. ESMC is

P a g e | 8
developing Monitoring, Reporting, Verification (MRV) technology using analytical tools to quantify, assess, monitor, and verify systems-based impacts of operations that farmers and ranchers will utilize. This includes a secure platform to collect, store, and manage data as well as utilizing and supporting development of remote sensing tools for quantification and verification. ESMC is operating pilots in all major geographic regions of the U.S., including various types of agricultural production systems leading up to the 2022 full market launch. They are also collaborating with The Fertilizer Institute to test improved nutrient use efficiency and data intake protocols in Illinois, Indiana, Iowa, Minnesota, Missouri, Ohio, and South Dakota. ESMC recently announced a confirmed pilot in Minnesota enrolling 50,000 acres. ESMC is currently in the process of developing protocols for other regions and production systems for high value specialty crops. They are also planning additions for biodiversity and habitat conservation expansions. Some of their other technical contractors include IHS Markit, Kieser & Associates, SustainCERT, Tetra Tech, and WestWater. According to research conducted on behalf of ESMC, the value of ecosystem services bought and sold in this marketplace could be up to $13.9 billion (IHS Markit). The price paid to producers is currently $20 per ton of carbon. ESMC’s website offers few details about data management or security, or any specifics around costs, or acreage requirements associated with enrollment (Ecosystem Services Market Consortium, n.d.). Indigo Ag’s Terraton Initiative Indigo Ag’s Terraton Initiative (Indigo) has an ambitious goal to remove 1 trillion tons of carbon to bring atmospheric concentration back to pre-industrial revolution levels. Indigo is focused on reducing and eliminating emissions and increasing carbon sequestration. They are very clear on their website about which regenerative agriculture practices they support including cover cropping, no/reduced till, crop rotation, reducing synthetic inputs, and animal integration. To develop their MRV process, Indigo is partnering in different capacities with Verra and the Climate Action Reserve, two leading GHG crediting programs, and the scientific community. Indigo is also supporting the development of the Soil Enrichment Project Protocol with the Climate Action Reserve, expected to be finalized mid-2020 and accessible by any carbon credit project developer. Indigo has over 19 million submitted acres participating in the Terraton Initiative. For enrollment in 2020, participating farms must at least 300 acres of cropland. For data and tracking, Indigo uses Atlas Insights for crop reports, satellite imagery and expert commentary. Indigo’s current producer price is $15 per verified credit, which amounts to a potential gross income of $30-45 per acre per year. Indigo markets credits at a consumer price of $20 per verified credit. To enroll, participants begin by completing a form available on the Indigo website. Producers then gather data

P a g e | 9
and quantify their current soil health and build a plan for which practices they will employ. Next, participants carry out that plan, along with Indigo’s support. Finally, producers are able to verify the amount of carbon sequestered, or emissions reduced and receive payment (Indigo Ag, n.d.). Nori Nori’s mission is to reverse climate change and create a new way for anyone in the world to pay to remove excess carbon dioxide from the atmosphere. Unlike Indigo and ESMC, Nori works with approved independent third-party verifiers who utilize their established standards to verify carbon removal data. Nori is based on an open and transparent methodology that uses USDA-backed platform, COMET-Farm, that grants farmers full control of generating and selling the asset. Nori sees this as a revenue model focused on the farmer as much of the financial benefit as is possible while still maintaining a viable business. COMET-Farm generates a 10-year estimate of the changes in soil organic carbon from adopting regenerative practices. Nori then uses a web-based modeling platform called Granular, which allows Nori to not require upfront samples for baseline measurement. After 10 years, an audit with on-site sampling will be required, which also implies that carbon storage must last a minimum of 10 years. Nori does not own data and only shares data with third parties for quantification (i.e. through COMET-Farm) and verification (for practices to verify carbon removal claims). An example of one of their approved verifiers is, Aster Global, INC. Nori is currently accepting applications for participating in their program. They are now enrolling farmers in pilot programs to earn up to $15 a ton, plus one NORI token (cryptocurrency that fluctuates in value). Nori’s current market price is $17.25 a ton, or the $15 a ton plus a 15% fee. Producers are responsible for sales taxes, which vary by state. Select growers can sell up to five years of carbon removal from prior years through the end of 2020. Nori is prioritizing projects of 1000 acres and up but will make exceptions if smaller projects join forces to create a representative sample greater than 1000 acres. The two main costs for enrollment are, 1) registration and third-party verification which is estimated to be between $3,000-$5,000 and 2) costs for the time it will take the producer to go through the verification process. Farmers can still enroll if they lease or co-own land, but they must be assigned title to the ownership of the future NRTs (Nori carbon removal ton) to sell them. Nori allows farmers to be enrolled in multiple programs at once, but producers cannot double-sell the same carbon in more than one registry. This ability to double sell credits is further prevented because when the carbon credit is purchased from Nori, the credits are ‘retired’ immediately and the retirement, along with the location of retirement, is recorded with blockchain technology (an immutable public ledger). This ensures that removals cannot be sold again and that no one other than the owner can take credit for removing the carbon represented in the

P a g e | 10
owner’s certificate. After Nori launches their cropping methodology, they intend to add managed grazing and agroforestry projects. Nori highlights that their pilot producers will have direct impact on marketplace design for future growers. Of note is that during the research phase of this report, Nori was sold out of carbon removals, but at the end of the report process Nori had 94 tons available for purchase (Nori, n.d.). Indigo Ag’s Terraton Initiative and Ecosystem Services Marketplace Consortium both serve as verifiers and marketers of carbon market credits. The business model of both verifying carbon credits and selling carbon credits raises concerns of credibility and transparency of data collection techniques. Similarly, there are questions regarding ownership of credits, longevity of credits, and ability to trade or remove the credits from the market. Overall, farmers interviewed for this report generally note some distrust in the Indigo and ESMC, as these tools are not scale neutral and lean toward large row crop specifics. More information about the perspectives and experiences of MN farmers with carbon market tools can be found in the Key Findings from Interviews section of the report. Non-tradable Carbon Credit Markets A number of private companies are developing initiatives to connect directly with farmers in their value chain and advance carbon sequestration. These collaborations can be developed with carbon sequestration as the main focus, or with carbon sequestration as a beneficial outcome of other agricultural practice changes. These projects developed between farmers and entities upstream in the value chain do not always pay for carbon sequestration specifically but instead offer financial support and technical training to improve practices, soil health, and ultimately drive farming behaviors that capture carbon and keep it in the ground. These collaborations also speak to a desire heard from some of the farmers interviewed that, “the relationship should be direct and short between the farmer and the purchaser.” Carbon credit trading opacity seemed to elicit a wariness from some of the farmers interviewed. Certification schemes with carbon as a co-benefit have also started to emerge that would enable farmers to charge a premium for their raw materials, similar to consumer facing programs such as USDA Certified Organic. Producers with an interest in these programs can generally reach out directly to program sponsors as most are actively recruiting participants. In some cases, dedicated email addresses and websites have been established to support this recruitment and answer preliminary questions from producers. With regard to direct collaboration between private companies and producers in their value chain, the General Mills 1 Million Acre Commitment is an example of how producers and end users are partnering directly to implement initiatives that promote
P a g e | 11
soil carbon sequestration. The company’s ambition is to “advance regenerative agriculture practices on one million acres of farmland by 2030” (General Mills, 2019). General Mills has defined regenerative agriculture as “agriculture that protects and intentionally enhances natural resources and farming communities” (General Mills, n.d.). Using this lens, General Mills is partnering with producers to drive the adoption of regenerative agriculture principles. The effectiveness of this work will be measured across five key goals, soil health among them. Recognizing the need for knowledge and education in order to effectively change farming practices, the General Mills pilot programs include multi-day workshops, one-on-one technical support and coaching, and farmer-focused field days. In addition, as part of the wheat pilot in Kansas, General Mills is leveraging their membership in ESMC to quantify the benefits of the practice changes. Based on this information, ESMC will generate certified credits, carbon as well as other ecosystem services, based on impacts attained. In this way, General Mills is creating their own pipeline of carbon credits that can be leveraged in their sustainability reporting. They are also building more connected relationships with their producers which ultimately may be a more meaningful approach to driving transformational change in the agricultural system than open market carbon credit buying and selling. Other examples of private entities providing project funding directly to producers to improve farming practices include Land o Lakes SUSTAIN, Unilever’s Climate & Nature Fund, and One Planet Business for Biodiversity (OP2B). Verification schemes have also started to emerge that enable raw material and finished good premiumization. Among these, one of the programs that has been gaining traction is the Savory Institute’s Land to Market Ecological Outcome Verification. Recently, the Institute introduced the Land to Market program as a way for producers and brands to differentiate in the marketplace. Using Holistic Management as a starting point and adding scientific rigor to measuring expected outcomes, referred to as Ecological Outcome Verification (EOV) by the program, the program emphasizes its use of bottom-up outcome-based benchmarks as opposed to the top-down practice-based benchmarks typically used in certification schemes. While not strictly focusing on carbon sequestration, EOV measures soil health, biodiversity, and ecosystem functions such as the water cycle, all of which can influence soil carbon sequestration. By measuring multiple benefits and including carbon as a co-benefit area, the verification program offers a way for producers and brands to differentiate themselves in the marketplace and get credit for improved practices through raw material price credits without having to enter a carbon market. Many businesses are motivated to engage with their value chain directly to drive carbon sequestration projects as a result of their commitment to the United Nation Global Compact Business Ambition for 1.5 C and the goals of the Paris Agreement. To support, encourage, and track business progress on science-based targets CDP, an

P a g e | 12
international non-profit that runs the global environmental disclosure system, has collaborated with the World Resources Institute, the World Wide Fund for Nature, and the United Nations Global Compact to launch the Science Based Targets initiative. In addition to promoting corporate climate action, SBTi sets criteria for company emission reduction targets and validates company targets to ensure compliance. One influential element of these criteria is the exclusion of offsets. SBTi requires that all emission reduction targets be met by direct action within a company’s boundaries or their value chains. As such, simply purchasing offsets through carbon markets will not meet the needs of companies setting science-based emission reduction targets. Value chain emissions reductions will require engagement with raw material producers, but engagement through a transactional carbon market will not suffice. Thus, many companies are engaging directly with raw material producers in their value chain through bespoke insetting projects (PUR Project, n.d.). Further harnessing the desire of consumers to engage directly in making positive climate impacts, Zero Foodprint, in a public, private collaboration with the California Department of Food and Agriculture, California Air Resources Board, CalEPA and California Association of Resource Conservation Districts, has developed a program called Restore California that enables action through the restaurant industry and restaurant patrons (Restore California, n.d.). Funding for the program is raised by participating restaurants adding a one percent voluntary charge to all patron checks. The accumulated funds are then donated by the restaurants to a 501(c)(3) nonprofit entity which deposits 100 percent of the money in the Restore California Fund. Acting as a private sector complement to California’s Healthy Soils Program, Restore California deploys the funds to enable farmers and ranchers to implement soil health practices. Funds for proposed projects are accessed through a project application and grant making process overseen by Restore California. Technical assistance for project development and implementation is provided by California Resource Conservation Districts, University of California Cooperative Extension, and other organizations. Projects can consist of annual or perennial practices that align with the ultimate program goal of sequestering atmospheric carbon as soil carbon. Beyond California’s Healthy Soils Program, there are other examples of state and Federally funded programs that encourage producers to implement conservation practices. In fact, Minnesota has demonstrated leadership in this area and could continue to do so in the evolving area of soil carbon sequestration. Water and soil conservation programs overseen thus far by the Board of Water and Soil Resources have reduced cropland agriculture emissions by 600,000 tons per year (Minnesota Pollution Control Agency, 2019). Minnesota also specifically targets working lands through the Minnesota Agricultural Water Quality Certification Program (MAWQCP).

P a g e | 13
This voluntary certification program encourages producers to implement practices that specifically protect waterways but can have additional co-benefits. Farmers that become certified are able to use the certification in business marketing, get priority access to related technical and financial assistance, and maintain regulatory certainty for ten years regarding any new water quality rules or laws that may come into force while they are certified since they will be deemed already in compliance. Several of the farmers interviewed in this study mentioned MAWQCP and its alignment with the protocols of the Nori carbon market. This overlap in requirements may make Nori an attractive carbon market for Minnesota farmers already certified under MAWQCP.
A Note on Conservation Payments A common question that came up throughout this research was: If financial assistance is being provided to implement conservation practices through programs like MAWQCP, EQIP, and CSP, and ultimately those conservation programs decrease costs for farmers including decreased inputs, is an additional payment for carbon sequestration through a carbon market truly valuable to producers? According to work done recently by American Farmland Trust (AFT), the economic benefits of improving soil health are quantifiable. The report focused on quantifying the net economic benefits eight producers have experienced though their improvement in soil health practices. These producers were located in New York, California, Illinois, and Ohio. The majority of these producers experienced benefits including yield increases, annual net income increases, and annual fertilizer costs decreases. Overall, the average return on investment for these producers was 207%, which means that for every dollar invested in improving soil health, these producers earned three dollars back (American Farmland Trust, 2020). It is important to keep these benefits in mind if carbon markets are being explored as a means of financial incentivization for producers. While it would seem that the return on investment of soil health practices would entice many producers, historically, that has not been the case and adoption has been limited. Regardless of the existence of a carbon market, ensuring producers are aware of these quantifiable benefits is essential since without this information producers
P a g e | 14
Non-market payments for carbon sequestration In addition to the programs available to Minnesota producers at the state level, established federally funded programs such as NRCS CSP offer voluntary opportunities for producers to be compensated based on conservation activities. Through five-year contracts, producers are compensated for maintaining existing conservation practices and implementing new conservation activities. There are also supplemental payments available for producers that adopt specific crop-rotation practices. While not specifically focused on carbon sequestration, the program aims to incentivize producers to proactively address resource concerns including soil quality, soil erosion, and water quality, among others, which ultimately would benefit soil organic carbon (Natural Resources Conservation Service, n.d.). Agricultural lands supply many ecosystem services desired by society, beyond merely providing food and fiber. There is increasing interest in developing Payment for Environmental Services (PES) programs to encourage the provision of multiple ecosystem services from agricultural lands (Bohlen et al., 2009). There are now over 550 PES programs around the world, with combined annual payments over $36 billion (Salzman et al., 2018). There are many definitions of PES but it is understood to seek to internalize the positive externalities generated by natural systems, creating incentives to the entity that ensures service provision. The Office of Environmental Markets (OEM) within the USDA Forest Service was created to catalyze the development of markets for ecosystem services. OEM has a unique role in the federal government's efforts to develop uniform standards and market infrastructure that will facilitate market-based approaches to agriculture, forest, and rangeland conservation. The Food, Conservation, and Energy Act of 2008 (also known as the Farm Bill) took a first step towards facilitating landowner participation in emerging markets for ecosystem services. Section 2709 of the conservation title requires the Secretary of Agriculture, in consultation with other agencies and interests, to "establish technical guidelines that measure the environmental services benefits from conservation and land management activities." The programs discussed in this section and others, private and public, are already working to incentivize and compensate producers pursuing conservation focused land management. In general, these programs focus on driving comprehensive ecologically focused land management with soil carbon sequestration as a co-benefit. An effective voluntary carbon market may integrate with these existing programs and act as additional incentive rather than a stand-alone solution.

P a g e | 15
Complexity of Measuring Soil Carbon Carbon Capacity for Agriculture in Minnesota This section of the report calculates the total available capacity of carbon that could be for agricultural land use in Minnesota. An in-depth summary on the tool used to calculate the market’s potential, InVEST, can be found in the Appendix of this report. Of note is that this model does not include any carbon stored in soil, it only addresses biomass above the soil. This reflects the complexity of measuring and accounting for soil sequestered carbon stocks with current modelling and tracking tools. Still, it is a worthwhile metric to understand the range and scale of carbon sequestration, and to think about land use from a climate change mitigation lens.
Figure 2: The different land cover classes across the state of Minnesota in 2016 from the National Land Cover Database. According to data from the Minnesota Board of Water and Soil Resources, 51% (26 million acres) of the state’s land area is agricultural land that is used for row crop production, livestock production and non-row crop production as seen in Figure 2. The InVEST model was used to generate the total carbon storing potential for three land cover classes - Grassland/Herbaceous, Pasture/Hay, Cultivated Crops. These three land classes were chosen because this is a study to explore the carbon potential across all agricultural land. According to Ruesh & Gibbs (2008), the carbon storage values for grasslands and croplands are 4.5 and 5 Megagrams per hectare (Mg/ha) respectively for the year 2000. Pastures and Grasslands are assumed to have the same carbon

P a g e | 16
value. These carbon values largely account for above ground biomass carbon sequestration only and is currently the best available estimate for carbon densities. InVEST results show a total carbon capacity of 110.1 million tons that is already, or could be, stored in the above-ground biomass across the three different land classes in Minnesota (Table 3). This does not include any soil carbon. If all of this carbon were to be converted to carbon dioxide (CO2) it would create 404.1 million tons of CO2 emissions. In contrast, the total emissions from the State of Minnesota in 2016 were only 154 million tons of CO2-eq2 (Claflin & Steinwand, 2019). This finding assumes all land within these three land use types store the same amount of carbon. Table 3: Minnesota’s carbon storage capacity of these various land uses
Land Cover/ Land Use Carbon Storage (million tons)
Cropland 93.4
Pastures 12.6
Grassland 4
The 110.1 million tons does not include the carbon stored in the soil because it is difficult to model this without site specific information. To obtain more accurate results it is necessary to conduct field studies that specifically study the carbon stored in above ground biomass, belowground biomass, soil, and dead matter. The rate of carbon sequestration is not constant and varies on a yearly basis. The amount of carbon sequestered depends on the area under different land uses as well as the rate of sequestration. Forests are known to be the largest sequesters of carbon while urban land uses sequester the least carbon. There are multiple factors that influence the carbon sequestration rate. For cropland, the storage capacity would depend on the crop management practices such as soil type, type of crop, crop cycling, tillage, etc. Research has shown that legumes enhance the carbon storage capacity of soils. Similarly, for pastures and grasslands, the management of livestock on a pasture is a critical factor that determines compaction of soil and soil organic matter that contribute to the carbon storage potential. One of the common concerns for establishing carbon markets is the complexity of accurately monitoring, reporting and verifying soil carbon sequestration. Soil carbon cannot be measured directly. Due to variability and complexity, existing methods for the
2 Carbon Dioxide emissions are abbreviated as CO2. CO2-eq refers to one-ton equivalents of CO₂ emissions provided by other greenhouse gases such as methane.

P a g e | 17
accurate measurement of soil carbon can be laborious and expensive, particularly when conducted to scientific standards, in part because soil carbon changes are influenced by climate, as well as land use and management. A variety of protocols are available for measuring soil organic carbon changes over time, but many are too costly or not rigorous enough to be reliable. The interest in soil carbon from the perspective of carbon sequestration and climate change is relatively recent; thus many labs are only equipped to test for soil organic matter. In recent years researchers have worked to classify various types or fractions of soil organic carbon such as active, labile, particulate, occluded, light, or heavy. The different types of soil carbon differ in size and are composed of different materials with different chemical and physical properties and different decomposition times - thus making accurate measurement even more complex. Current research in the private and public sector is working to improve capacity to measure soil carbon change using satellite data or other forms of aerial data collection such as unmanned aerial vehicles (UAVs) i.e. drones. Global carbon trading is one of the principle drivers for new methods to accurately measure soil carbon change. The current scientific consensus is that accurate estimates depend on baseline soil organic carbon tests, which require physical soil sampling to at least 60 cm, and some studies recommend deeper measures. The costs associated with collecting and processing physical soil samples at the scale needed to accurately verify carbon sequestration on many farms at scale can be prohibitively expensive. A combination of physical soil sampling and modeling increase the efficiency of estimating soil C changes. New spectral methods, that measure soil organic carbon concentration based on reflectance of light on soil in the infrared region, are rapidly improving and becoming increasingly available (Smith et al. 2019).
Pricing Carbon Carbon pricing, through a carbon tax or through a regulated cap and trade system has been studied in depth by economists and policy experts. At a high level -- with a carbon tax the price of carbon is the dependent variable (it is determined by the policy) while the quantity of emissions at that price is the independent variable (it is determined by individual firms deciding their optimum emissions at that price). In a cap and trade approach, the outcome is the opposite, with the volume of emissions positioned as the dependent variable (determined by the policy) and the price of carbon as the independent variable, determined in a marketplace by individual firms making decisions about their willingness to pay. Voluntary carbon market fundamentals have been studied less rigorously in terms of expected price mechanisms and market volume. The three marketplace frameworks discussed in this study, Indigo, ESMC, and Nori, all use set prices for buyers and sellers, removing much of the efficiencies of a market system in finding equilibrium at an optimal supply and demand point. How these marketplaces
P a g e | 18
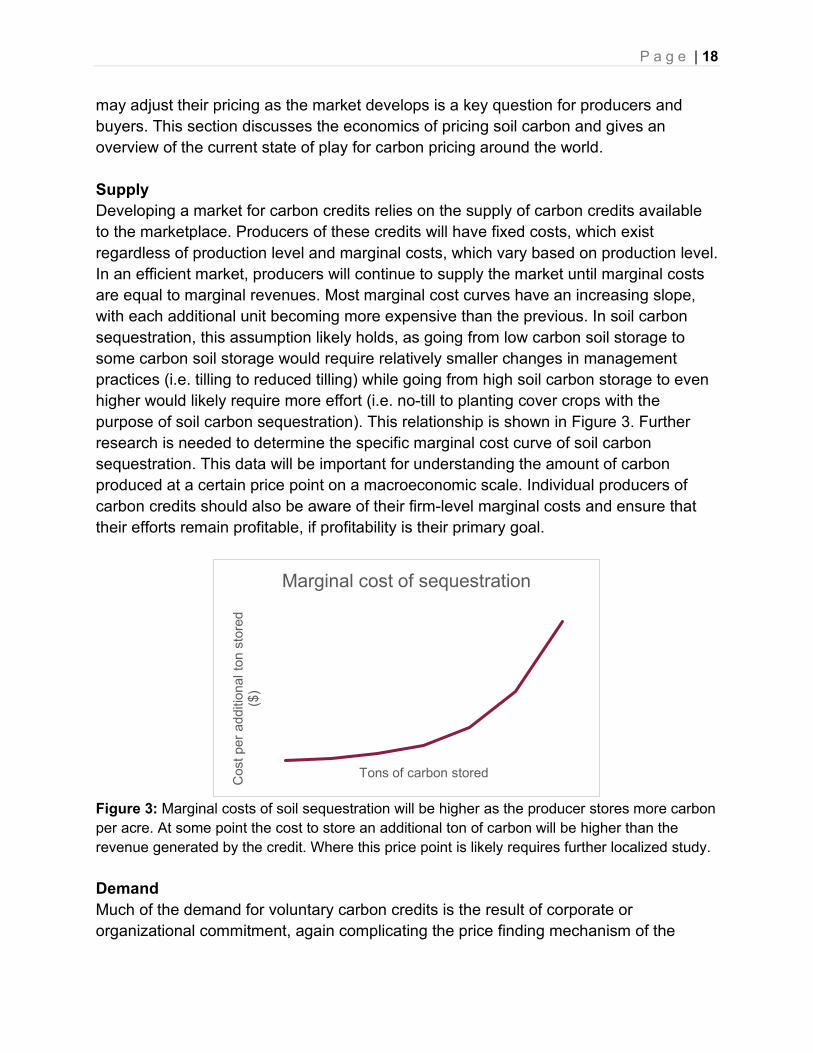
may adjust their pricing as the market develops is a key question for producers and buyers. This section discusses the economics of pricing soil carbon and gives an overview of the current state of play for carbon pricing around the world. Supply Developing a market for carbon credits relies on the supply of carbon credits available to the marketplace. Producers of these credits will have fixed costs, which exist regardless of production level and marginal costs, which vary based on production level. In an efficient market, producers will continue to supply the market until marginal costs are equal to marginal revenues. Most marginal cost curves have an increasing slope, with each additional unit becoming more expensive than the previous. In soil carbon sequestration, this assumption likely holds, as going from low carbon soil storage to some carbon soil storage would require relatively smaller changes in management practices (i.e. tilling to reduced tilling) while going from high soil carbon storage to even higher would likely require more effort (i.e. no-till to planting cover crops with the purpose of soil carbon sequestration). This relationship is shown in Figure 3. Further research is needed to determine the specific marginal cost curve of soil carbon sequestration. This data will be important for understanding the amount of carbon produced at a certain price point on a macroeconomic scale. Individual producers of carbon credits should also be aware of their firm-level marginal costs and ensure that their efforts remain profitable, if profitability is their primary goal.
Figure 3: Marginal costs of soil sequestration will be higher as the producer stores more carbon per acre. At some point the cost to store an additional ton of carbon will be higher than the revenue generated by the credit. Where this price point is likely requires further localized study. Demand Much of the demand for voluntary carbon credits is the result of corporate or organizational commitment, again complicating the price finding mechanism of the
Cos
t per
add
ition
al to
n st
ored
($
)
Tons of carbon stored
Marginal cost of sequestration
P a g e | 19
marketplace. If the quantity demanded is determined based on external variables, such as historic emissions data, rather than price, then the price of the credits become less important for determining demand.
Some companies and organizations have assigned an internal carbon price for their operations which is separate from the market price for offsets. Internal carbon pricing is an internal business mechanism rather than a marketplace. It is used as a risk management tool. Half of the ten Organization for Economic Co-operation and
Social Cost of Carbon The social cost of carbon (SCC) is a measure of the economic harm from the impacts of climate change, expressed as a dollar value, of the total damages from emitting one ton of carbon dioxide into the atmosphere. The U.S. Environmental Protection Agency (EPA) estimates the social cost of carbon to range between $16-$152 by 2020 and $26-$212 by 2050. Under Executive Order 12866, the EPA reports the cost of social carbon is “intended to include (but is not limited to) changes in net agricultural productivity, human health, property damages from increased flood risk, and the value of ecosystem services due to climate change.” The social cost of carbon was brought up by Minnesota producers interviewed in this study, as a way of thinking about what the market price for carbon could or should be. The Minnesota Public Utilities Commission issued an order (MPUC E-999/CI-14-643) that finalized carbon cost estimates that utilities are required to use when planning for new projects. The commission will use these values in evaluating and selecting resource options in all commission proceedings, including resource planning and other resource acquisition or diversification proceedings. Similarly, in California the Public Utilities Commission has issued a directive to use SCC while valuing distributed energy resources. In addition, the California Air Resources Board has used SCC in updating its Climate Action Plan. These examples show the different ways in which states can include SCC into the decision-making process. The SCC can be used as a tool in decision making, but it is unclear how or if the market price of carbon credits will ever equal the social cost. Further study on how the SCC intersects with the market prices of carbon would be beneficial in climate change mitigation efforts.

P a g e | 20
Development (OECD) countries with the highest GHG emissions reported the use of internal carbon prices. Internal carbon prices ranged from $5/tCO2e to over $400/tCO2e depending on the country, year and sector for which a decision is to be made (The World Bank, n.d.). As reported by the World Bank, in 2017 almost 1,400 companies with a total annual revenue of about $7 trillion reported to CDP that they use an internal price on carbon or plan to do so within the next two years. One significant issue is that of price elasticity, or how much demand will change due to a change in price. There are concerns that the demand for carbon credits, based on business commitments rather than regulatory requirements, could be upended during a recession, a period of economic volatility, or changes in company or organizational leadership. Further research on the price elasticity of demand and price elasticity of supply within a voluntary carbon market would be useful for understanding the permanence and expected variation of the market. The lack of market fundamentals in the voluntary carbon credit market, such as basic understanding of the supply and demand functions, make it difficult for businesses, farmers, policy makers, and others to predict the future trends within the market. How would an increase in the price of a carbon credit impact the production and buying of the credits? Would a large increase in demand have any impact on the price paid per credit, and how? These are key questions to answer in the coming years, or as long as the lack of a national carbon pricing mechanism remains. Understanding how the voluntary market interacts with the mandated market is also important for long term market development and planning. For example, demands for the Kyoto credits from Certified Emission Reductions (CER) and Emission Reduction Units (ERU) began to saturate the market within seven years of its enforcement (Conte, 2010). No other substantial source of demand for Kyoto credits existed, leading to sustained low prices for CERs and ERU. In 2015, the volume of credits traded on the voluntary markets totaled 84 MtCO2e. In 2016, 63 MtCO2e of credits were traded with a value of $191 million. This was a 24 percent fall compared to the previous year. The World Bank analysis of “the decline in traded volume is partially attributed to the conversion of certain types of voluntary credits into compliance offsets in mandatory carbon pricing initiatives such as the California Cap-and-Trade program” (The World Bank, n.d.). As mandates for the Cap-and Trade program began to be implemented, voluntary credits were converted to mandatory credits, causing the availability of credits to decline significantly. Another example is the Carbon Offsetting and Reduction Scheme for International Aviation (CORSIA) which has the potential to generate demand for carbon assets

P a g e | 21
between 2021 and 2035 that will be comparable to the cumulative volume of the Kyoto credits to date. Demand for carbon credits will be shaped by rules on the type of credits that will be eligible for airlines to purchase to comply with the CORSIA. If and when CORSIA goes into effect, it could present a significant market opportunity for Minnesota farmers producing carbon credits.
Crop Premiumization A different approach to paying farmers for ecosystem services is to internalize a price premium for their crop. This has been the approach of organic agriculture, where the price premium reflects to additional value that organic food has to a consumer, and pays farmers for the additional management costs of organic agriculture. As discussed in the non-tradeable credit section, this premiumization of commodities could negate the need for an additional carbon credit (Figure 4). Commitments from buyers to establish and maintain price premiums could present challenges, particularly in the consumer food market where margins are thin and consumer demand is highly price sensitive. Still, further investigations of the benefits and impacts of price premiumization versus direct payment for ecosystem services may be useful.
Figure 4. shows the relationship between crop premiumization against non-premiumization with a
carbon credit. Producers can receive the same level of payment through either approach, depending on how the program is designed.
Commodity crop Non-premiumization Crop premiumization
Scenarios for additional revenue generation through carbon credits and/or crop
premiumization
Commodity payment Carbon credit

P a g e | 22
Price finding in the market for non-tradeable carbon credits also requires further research. Individual contracts with producers limit the transparency of the price per carbon ton, or other ecosystem service. Producers who sign on with one company may learn of a higher
return with another company but are already signed onto an agreement. Transparency in the non-tradeable carbon credit market will be important for ensuring equity and benefits for farmers. Prices are volatile and based on a mixture of regulatory price setting and market-based supply and demand. The range is wide, and trends are hard to identify. The price finding mechanism is underdeveloped and prices will likely be volatile until there is more consistent regulation and predictability in the market. COVID-19 has further complicated this nascent market by decreasing consumer demand and putting increased pressure on businesses in a time of financial recession. In the future, the price of carbon will likely need to coalesce at a stable and global price point near to the social cost of carbon that will move global emissions toward the Paris Agreement. A stable global price will also allow businesses to plan around that price both externally and internally, and carbon credit producers can have stability in their revenue forecasting. Examples of Carbon Pricing Regulatory based carbon pricing has gained traction around the world, with major implementation in Canada, China, and the EU. Since January 2020, carbon emissions have been priced at a minimum of $14 per ton across Canada. By 2022, that will rise to $50. In 2021, 70 percent of global aviation emissions were scheduled to enter a UN emissions-trading program which aims to cap them at 2020 levels. China was going to launch a nationwide carbon market for its power sector at the end of 2020. The European Commission announced plans for the expansion of its EU ETS, already the largest carbon-pricing system in the world. Its carbon price, stuck in the single digits in the 2010s, rose to around €25 or $27 US. The main driving factors of carbon prices can be divided into two macro categories: (i) policy and regulatory issues, and (ii) market fundamentals that directly concern the production of CO₂ and thus demand and supply of CO₂ allowances (Carraro & Favero, 2009). Carbon pricing can be external or internal. External pricing would involve a tax or
The volatility and lack of cohesion across production sector indicate that the price finding mechanism in this emerging market is underdeveloped.
Transparency in the non-tradeable carbon credit market will be important for ensuring equity and benefits for farmers.

P a g e | 23
emissions trading scheme where the total carbon emissions are capped. Internal carbon price is a voluntarily determined price used by business entities, among others. In a voluntary market, policy and regulatory influence have limited but critical roles. As addressed in this report, global and national policies can motivate the private sector and internal carbon markets to address issues concerning climate change and carbon sequestration. Carbon prices vary significantly across the world. The price of carbon varies between $1 and $120 per ton of carbon, but most price points of different programs across the globe remain below $10 per ton of CO₂ (The World Bank, 2020). To achieve the Paris Agreement goals of keeping warming within 1.5oC, the price of carbon needs to stabilize between $40-80/tCO2-eq. (Stiglitz et al 2017). By achieving a carbon price in this range, the cost would be high enough to reduce emissions to the level needed to meet the Paris Agreement goals. However, in existing schemes, the median ton of carbon emissions globally is priced at only $15. Nowhere is there a carbon price that is both above $40 and applies to more than half a country’s GHG emissions. This will be discussed further in the next section on the social cost of carbon. The market for voluntary carbon credits remains immature, but is experiencing growth in both supply and demand. Weighted average prices of carbon credits dropped dramatically in 2015 compared to 2014 and 2013 (Öker and Adıgüzel, 2017). The average price for carbon is volatile, as seen in Figure 5. Prices vary by sector, which raises questions as to why tradeable credits differ based on origin if the marketplace sees credits and fungible. The relative prices range from $1.90 to $5.00 per credit, far below the market rates being set by ESMC, Nori, or Indigo.
Figure 5: Carbon price change for different sectors (Forest Trends’ Ecosystem Marketplace, 2019).

P a g e | 24
Key Findings from Interviews with Producers and MN Experts As part of the research for this report, thirteen interviews3 were conducted with various producers and agricultural experts across Minnesota. The goals of the interviews were to:
1) Identity if management techniques are being utilized to build soil carbon, and if so, what type;
2) Understand producer’s overall knowledge and perception of carbon markets; 3) Identify if any producers are currently measuring soil carbon; 4) And, recognize any key factors that may influence decision making around
participation in a carbon market. Reviewing the interviews as a whole, some key findings emerge:
Producers want to know more about the details of carbon markets. When asked about their opinion on carbon markets, the overwhelming response from producers, and even many of the experts, was that they didn’t know enough of the details to have a strong opinion. Many were even nervous to talk to the research team because of the perceived complexity of carbon markets. Many producers had never heard of Nori, Indigo, or ESMC, all of which have some presence in MN. For those that had done some research on the potential of participating in a carbon market, many felt the current market landscape was not applicable to them due primarily to scale and/or crop type.
When asked about prices they might expect to receive per acre or per ton of carbon, most producers felt they did not know enough to answer the question. One said: “I have no idea. I think it should be valued, but I don’t know what the going rate is. I would need to research more.” But
farmers do know they want a fair price for their time, labor, and inputs. Overall, farmers are seeking more clarity and understanding on the topic, with one farmer saying, “I guess I just feel that I have a lot of unanswered questions that are not easy to find as a producer.”
3 See Appendix B for the full interview guide used in the interviews
“I guess I just feel that I have a lot of unanswered questions that are not easy to find as a producer.”

P a g e | 25
Many producers are already utilizing at least one management practice that builds soil carbon.
All producers we spoke with were utilizing some management practice(s) known to build soil carbon. However, all framed it broadly; seeing their practices as building soil health or as a part of regenerative agriculture. Some of the management practices that farmers are incorporating include reducing tillage with no-till and strip-till, cover cropping, rotational grazing, mob stocking/grazing, diversifying crop rotations, including crops like buckwheat for pollinators, utilizing organic practices and reducing chemical inputs, perennial row crops (several growers working with Kernza®), alley cropping, erosion buffers and hedgerows. Most farmers view soil health as being linked to overall fertility and thus a key factor when making management decisions on the farm or ranch.
Producers can justify incorporating a new practice if they receive support to manage the initial risk.
When making decisions about their farm or ranch, producers are weighing multiple factors at the same time. Many highlighted the fact that farming is a risk management business. With such thin margins, they have to be mindful of any new practices they incorporate into their management regime and weigh the short- and long-term costs and benefits. According to one producer, “It’s a balancing act.” Producers are often balancing a large capital investment with the fact that economic returns may not be realized for several years. However, several producers noted there are numerous funding sources to help farmers incorporate cover crops into their rotations. These funds made it possible for them to add cover crops and not worry as much about the upfront economic costs. They commented that other practices could be similarly incentivized.
Producers are testing for soil organic matter, but rarely test other carbon metrics.
Most producers interviewed are not specifically collecting soil carbon data. However, several of them are conducting soil testing anywhere from once a year to once every five years. One exception was a small vegetable cooperative that is sending soil samples to Cornell University to measure the active carbon fraction in their soils, which often changes more quickly than the standard soil organic matter percentage. The majority of farmers are tracking inputs, yield, and economics in detail with daily logs, QuickBooks or by hand. If a new carbon market works with producers to develop a tracking system that easily integrates into their current methods, the administrative cost for producers could be low.

P a g e | 26
Producers may have many reasons for participating in a carbon market, but for many the decision will come down to the administrative burden.
During interviews, producers shared that they could add a new practice to sequester carbon to their management practices, but the expensive part may be in all the additional paperwork required to document the process. One producer summed it up well, saying,
“Structural change is often easier than the program administration.”
There is interest in carbon markets, as well as some hesitancy. Overall, producers shared that if they would be getting paid for collecting the data, without a huge amount of administrative burden, or prohibitive costs to implement, that they would definitely participate in a carbon market. Some were especially excited because they felt they would get paid for something they are already doing. As one interviewee stated, “farmers are really struggling right now, so if this is a meaningful financial opportunity that’s great.” Another positive for producers could be in the marketing. An outside source verifying them as sequestering carbon could be an extra marketing opportunity for the socially conscious consumer. However, there were some general hesitancies that should be noted by potential carbon markets. Producers want to ensure that “farmers are getting a fair share of the economic pie.” There is a desire for transparency to know how and where the money is flowing and what the end user is paying compared to what the farmer is getting paid. Additionally, farmers want to ensure they have “autonomy, flexibility and control over their farming practices.” They do not want to be forced to make certain management decisions because of a contract. Other concerns voiced include the size of operation and baseline measurements. Specialty crop farmers might be too small to qualify or too small to make it economically beneficial. In many cases, farmers expressed concern about not getting credit for previous improvements. What if their soil organic matter is already very high and can only increase minimally? One farmer said, “if we were serious about it [participating in a carbon market], we’d probably have to dig up our paddocks and lower the carbon to enter the market to get a carbon credit. I don’t know how much higher our soil organic matter could even go.”
“Structural change is often easier than the program administration.”
An outside source verifying them as sequestering carbon could be an extra marketing opportunity for the socially conscious consumer.

P a g e | 27
Despite significant concerns, producers were interested in the possibilities of joining a carbon market. One farmer said it well, “at the end of the day, if we could have a reliable way to support farmers that are doing climate positive impacts -- if we could pay them for that, it would be great and should be a priority.”
Carbon Policy Global Carbon Policy Interest in carbon markets and development of carbon policy is not new. There have been efforts ongoing in this space for over twenty years. It is important to be aware of this historical context as Minnesota explores what such opportunities might look like in the state. Awareness of ongoing global and national efforts might also offer avenues for Minnesota to pursue in collaboration with other entities, including international trade in carbon credits to countries with mandatory or regulated emission trading schemes (ETS). Kyoto Protocol The Kyoto Protocol was signed in 1997 and came into force in February 2005. Industrialized nations and economies in transition, so-called Annex-1 countries, agreed to cut their GHG emissions from 2008 to 2012 by an average of 5 percent of their emission levels in 1990 (Taiyab, 2006). Six greenhouse gases are included in the scheme: carbon dioxide, methane, nitrous oxide, hydrofluorocarbons, perfluorocarbons, and sulphur hexafluoride. Developing countries (non-Annex-1) are not subject to emissions targets in the first commitment period. Beyond the two classifications above, the Kyoto Protocol provides three “flexibility” mechanisms to reduce the cost of meeting targets. The first is Emissions Trading (ET), also known as Cap and Trade, whereby countries that have satisfied their obligations can sell their excess carbon allowances to other countries. The second is Joint Implementation (JI), the purchasing of emissions credits from GHG offset projects in Annex 1 countries - generally designed for economies in transition. And the third is the Clean Development Mechanism (CDM), the purchasing of emission credits from projects in non-Annex-1 countries. During the first commitment period of the Kyoto Protocol, many developed countries had to restrict carbon emissions. Flexible mechanisms were initiated to reduce carbon emissions and support clean energy projects. Regulated carbon markets were established to trade carbon credits produced by these projects by signatory countries, while carbon credits produced by non-signatory countries were traded in voluntary markets.

P a g e | 28
Paris Climate Accord Following limited participation in the Kyoto Protocol and the lack of agreement in Copenhagen in 2009, the world has been searching for common ground to limit global warming. With leadership from the European Union, countries presented comprehensive ideas during the Paris climate conference in 2015. The Paris Agreement was the first-ever universal, legally binding global climate deal. While the Kyoto Protocol set commitment targets that have legal force, the Paris Agreement utilized a consensus building framework that allows for voluntary and nationally determined targets, called Intended Nationally Determined Contributions (INDCs). The Paris Agreement, adopted in 2015, committed 195 signatories to reducing carbon emissions with the goal of keeping the rise in global temperature, compared to that of the pre-industrial climate below 2°C”4. Before and during the Paris conference, countries submitted comprehensive national climate action plans. A significant achievement of the conference was that two big polluting countries, the United States and China, acted jointly in adopting the agreement. In 2017, President Trump announced that the U.S. would be leaving the Paris Agreement, effective in 2020. However the recent U.S. election of Vice-President Joe Biden will likely lead to the U.S. once again returning to the Paris Climate Agreement. The Paris Agreement is an agreement within the United Nations Framework Convention on Climate Change (UNFCCC) dealing with GHG emissions, mitigation, adaptation, and finance starting in the year 2020. The Paris Agreement differs from the Kyoto Protocol in two key areas. Unlike the Kyoto Protocol, it does not set targets forced by legal authorities. Instead, it encourages voluntarily determined targets by the adopting countries. The only requirement under international law is to report and review the targets achieved. Another key difference introduced by the Paris Agreement is the scope of the agreement. While the Paris Agreement still emphasizes the principle of “Common but Differentiated Responsibility” the acknowledgment that different nations have different capacities and duties to climate action, it does not provide a specific division between developed and developing nations, as the Kyoto Protocol differentiated between Annex-1 and non-Annex-1 countries. The Paris Agreement is different from previous attempts to reach an international deal on climate change as it requires all participating countries, not just the “developed” countries, to submit emission reduction and national climate plans. Furthermore, The Paris Agreement suggests a market-based mechanism that would allow countries to trade internationally transferred mitigation outcomes. Unlike the Clean Development Mechanism, one of the mechanisms used in the Kyoto Protocol, which was created and used by signatory
4 The INDCs targets do not limit warming to the 2 degree limit, raising questions about the impact that the Paris Climate agreement will have on climate change over time.

P a g e | 29
countries to trade carbon credits, a market-based mechanism under the Paris Agreement includes all the countries. European Union Emissions Trading Scheme The European Union Emissions Trading Scheme (EU ETS) is a program among EU member states to help them meet Kyoto targets and provide companies and governments with experience in carbon trading. The scheme operates under a cap-and-trade system. Each member state must assign allowances to the ‘installations’ covered by the scheme through a National Allocation Plan, approved by the European Commission. The scheme started operations in 2005 and is the first international carbon trading system. A large portion of the world's carbon-trading currently takes place in the EU ETS, with 70% of volume-based carbon transactions being carried out by the EU ETS in 2007 (Hamilton et al., 2008). The best-known emission trading mechanisms are “baseline and credit” and “cap and trade,” and these operations are executed by means of regulatory markets. Many other countries have adopted similar ETS policies, seen in figure 5.
Figure 5: Summary map of regional, national, and subnational carbon pricing initiatives (The World Bank Group, 2020)

P a g e | 30
Domestic Carbon Policy The COVID-19 disruption has highlighted the importance of resilience of American agriculture and the processing and distribution of its production. This disruption is not the first and it will not be the last that the food system will experience. Climate change is the foremost long-term disruption facing humankind. Managers of America’s farm, forest and grazing lands could play a crucial role in combating climate change. Members of the United States (U.S.) Congress have started to embark on policy proposals that serve as the first steps for a larger national carbon market for agriculture. Agricultural Resilience Act In February 2020, Rep. Chellie Pingree (D-ME) introduced the Agricultural Resilience Act (ARA) to begin the discussion around agricultural carbon markets in the U.S. (H.R. 5861, 2020). ARA establishes a set of aggressive but realistic goals for farmers to help mitigate climate change and increase agricultural resilience, starting with the overarching goal of reaching net zero greenhouse gas emissions from U.S. agriculture no later than 2040. ARA’s substantive programmatic sections are divided into six additional titles: soil health, farmland preservation and viability, pasture-based livestock, on-farm renewable energy, food waste, and agricultural research. ARA is a first step toward transforming the U.S. domestic food system to make it less susceptible to disturbance whether from a virus, climate change, or a yet unknown and unanticipated disruption. Carbon markets have become a popular recommendation in climate policy proposals, but many questions remain regarding measurements, payment levels, beneficiaries, and permanence. Because of those questions, the ARA does not include a direct proposal to sanction or provide public subsidies for such markets. Instead, it directs the U.S. Department of Agriculture (USDA) to put in place the infrastructure that could serve as the basis for paying farmers for ecosystem services, including carbon storage, via public programs or private initiatives. The Natural Resources Conservation Service (NRCS) has been providing technical and financial assistance to farmers and ranchers to implement conservation practices since the 1930’s when the Dust Bowl threatened farmers across the Great Plains. NRCS continues that work through current Farm Bill programs that pay farmers for conservation activities that result in ecosystem benefits including the Conservation Stewardship Program (CSP) and the Environmental Quality Incentives Program (EQIP). The 2008 Farm Bill established the USDA Office of Environmental Markets and directed the Secretary of Agriculture to establish standards to measure the ecosystem services provided by conservation and land management activities. The ARA would expand this

P a g e | 31
work by establishing a Soil Health and Greenhouse Gas Federal Advisory Committee, directing the Secretary to evaluate and issue guidance on existing outcomes-based measurement systems of farm-level GHG emissions and soil carbon sequestration, creating a nationwide soil health and agricultural GHG emissions inventory, and establishing payment criteria for ecosystem services that promote soil carbon sequestration or that reduce GHG emissions. The Soil Health and Greenhouse Gas Federal Advisory Committee would be tasked with delivering recommendations to the Secretary of Agriculture on the feasibility of establishing reliable outcomes-based measurement systems, identifying consistent measurement technologies, and pinpointing gaps and shortcomings of existing measurement tools. Recommendations would include information gathered from existing measurement models like COMET-Farm, remote sensing data and analysis, on-farm demonstration trials, and existing and emerging public and private environmental market measurement protocols. The advisory committee would also provide recommendations on standards for collection and dissemination of data, and considerations around farmer data management and privacy. The makeup of the advisory committee would consist of a variety of stakeholders, including farmers, ranchers, organizations representing agricultural producers, scientists, environmental nonprofits, private sector carbon and ecosystem services market initiatives, businesses working to reduce GHG emissions in their supply chains, youth engaged in food and agriculture, Tribal communities, and relevant State and Federal agriculture agencies.
Chicago Climate Exchange The Chicago Climate Exchange (CCX) was North America’s only voluntary, legally binding greenhouse gas reduction and trading system for emission sources and offset projects in North America and Brazil. CCX employed independent verification, included six greenhouse gases, and traded greenhouse gas emission allowances from 2003 to 2010. The exchange had more than 400 members ranging from corporations like Ford, DuPont, and Motorola, to state and municipalities such as Oakland and Chicago, to educational institutions such as University of California, San Diego, Tufts University, Michigan State University and University of Minnesota, to farmers and their organizations, such as the National Farmers Union and the Iowa Farm Bureau (Chicago Climate Exchange, 2010). The government run passenger rail corporation, Amtrak, was also a member of the

P a g e | 32
exchange and was trying to reduce its emissions even though the railroad planned to dramatically increase its annual ridership totals (Chicago Climate Exchange, 2008; Chicago Climate Exchange, 2009). The companies joining the exchange committed to reducing their aggregate emissions by 6% by 2010. CCX had an aggregate baseline of 680 million metric tons of CO2 equivalent. The Chicago Climate Exchange itself collapsed at the end of 2010. Its closure came at a great cost to farmers who invested in it in anticipation of offset credits. As mentioned in one of the interviews, it is believed that the Chicago Climate Exchange shut down because large investors were not interested in a voluntary market and had counted on U.S. legislation to enact a mandatory market (Sharma, 2011). When the American Clean Energy and Security Act (2009) failed to pass through the U.S. Congress, there was little incentive for companies to continue to buy and sell credits in the market (Sharma, 2011).
Growing Climate Solutions Act In June 2020, Senators Mike Braun (R-IN), Debbie Stabenow (D-MI), Lindsay Graham (R-SC) and Sheldon Whitehouse (D-RI) introduced the Growing Climate Solutions Act in the U.S. Senate (S. 3894, 2020). The bill builds off the ARA but outlines much broader goals, with the operational directive left to the USDA. The Act creates a certification program at USDA to help solve technical entry barriers that prevent farmer and forest landowner participation in carbon credit markets. These issues, including access to reliable information about markets and to qualified technical assistance providers and credit protocol verifiers, have limited both landowner participation and the adoption of practices that help reduce the costs of developing carbon credits. To
address this, the Act establishes a Greenhouse Gas Technical Assistance Provider and Third-Party Verifier Certification Program through which USDA will be charged to provide transparency, legitimacy, and informal endorsement of third-party verifiers and technical service providers that help private landowners generate carbon credits through a variety of agriculture and forestry related practices. The USDA certification program will ensure that these assistance providers have agriculture and forestry expertise, which is
lacking in the current marketplace. As part of the program, USDA will administer a new
[lack of] Access to reliable information about markets and to qualified technical assistance providers and credit protocol verifiers, have limited both landowner participation and the adoption of practices that help reduce the costs of developing carbon credits.

P a g e | 33
website, which will serve as a “one stop shop” of information and resources for producers and foresters who are interested in participating in carbon markets. Through the program, USDA will help connect landowners to private sector actors who can assist the landowners in implementing the protocols and monetize the climate value of their sustainable practices. Third party entities certified under the program will be able to claim the status of a “USDA Certified” technical assistance provider or verifier. This system is similar to the National Organic Program that USDA operates which was created under the 1990 Organic Food Production Act. In this case, the bill authors cite that a USDA certification lowers barriers to entry in the credit markets by reducing confusion and improving information for farmers looking to implement practices that capture carbon, reduce emissions, improve soil health, and make operations more sustainable. The market landscape is rapidly evolving. As this report discusses, many third-party groups are developing protocols and testing methods to calculate emissions reduction and sequestration in agriculture and forestry. The Growing Climate Solutions Act recognizes this fact and provides the Secretary with a robust advisory council composed of agriculture experts, scientists, producers, and others. The advisory council is charged with advising the Secretary and ensuring that the certification program remains relevant, credible, and responsive to the needs of farmers, forest landowners, and carbon market participants alike. The bill instructs USDA to produce a report to Congress to advise about the further development of this policy area including, barriers to market entry, challenges raised by farmers and forest landowners, market performance, and suggestions on where USDA can make a positive contribution to the further adoption of voluntary carbon sequestration practices in agriculture and forestry.
Risks & Opportunities Carbon markets, whether structured by open marketplaces or by contracted agreements, present a number of risks and opportunities for producers. This section briefly outlines the risks and opportunities identified by this research. In general, farming is a risk management business. Producer interviewees expressed a need to be mindful of any new practices, always balancing the odds of benefitting verses the investment required. However, several producer interviewees shared their motivation to farm is driven by a desire to address environmental challenges and mitigate impacts of climate change. For these producers, principles and ecological benefits can often outweigh pure economic decision making. Mitigating climate change is also often tied to a desire to maintain and improve the health and resiliency of a producer’s land such that the farm can be available for future generations. There is an
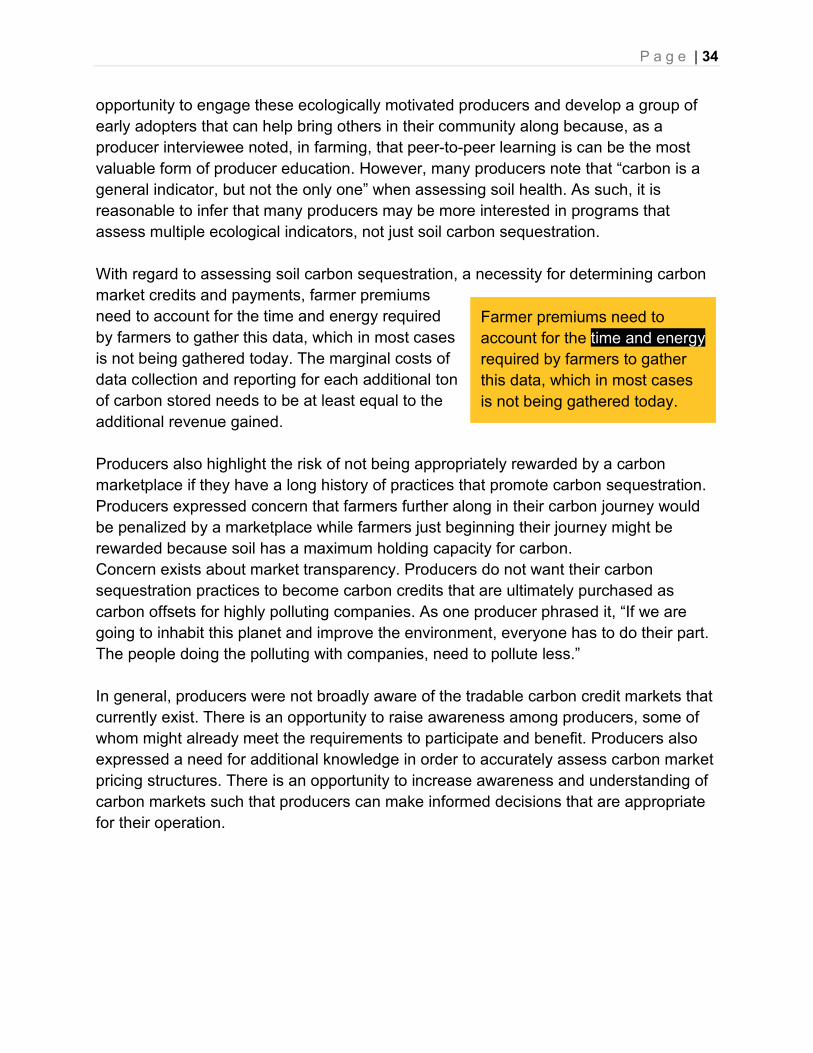
P a g e | 34
opportunity to engage these ecologically motivated producers and develop a group of early adopters that can help bring others in their community along because, as a producer interviewee noted, in farming, that peer-to-peer learning is can be the most valuable form of producer education. However, many producers note that “carbon is a general indicator, but not the only one” when assessing soil health. As such, it is reasonable to infer that many producers may be more interested in programs that assess multiple ecological indicators, not just soil carbon sequestration. With regard to assessing soil carbon sequestration, a necessity for determining carbon market credits and payments, farmer premiums need to account for the time and energy required by farmers to gather this data, which in most cases is not being gathered today. The marginal costs of data collection and reporting for each additional ton of carbon stored needs to be at least equal to the additional revenue gained. Producers also highlight the risk of not being appropriately rewarded by a carbon marketplace if they have a long history of practices that promote carbon sequestration. Producers expressed concern that farmers further along in their carbon journey would be penalized by a marketplace while farmers just beginning their journey might be rewarded because soil has a maximum holding capacity for carbon. Concern exists about market transparency. Producers do not want their carbon sequestration practices to become carbon credits that are ultimately purchased as carbon offsets for highly polluting companies. As one producer phrased it, “If we are going to inhabit this planet and improve the environment, everyone has to do their part. The people doing the polluting with companies, need to pollute less.” In general, producers were not broadly aware of the tradable carbon credit markets that currently exist. There is an opportunity to raise awareness among producers, some of whom might already meet the requirements to participate and benefit. Producers also expressed a need for additional knowledge in order to accurately assess carbon market pricing structures. There is an opportunity to increase awareness and understanding of carbon markets such that producers can make informed decisions that are appropriate for their operation.
Farmer premiums need to account for the time and energy required by farmers to gather this data, which in most cases is not being gathered today.

P a g e | 35
Key Findings and Recommendations The purpose of this report is to provide a landscape assessment of the current market for carbon credits in Minnesota. This market is a new and emerging opportunity for Minnesota’s farmers and ranchers, and because of its rapidly changing nature, many questions remain regarding the structure and risks of these markets. Key Findings Price finding is underdeveloped The purpose of markets is to serve as an efficient price finding mechanism. The current framework for carbon markets does not allow for price finding activities to occur. Prices are currently set by the market, and farmers and buyers can either accept or not accept these prices. The prices set are static, and not reactive to supply, demand, cost of production, or benefit of the product (i.e. social cost of carbon). Questions from producers centered around whether the price was enough to cover the costs of increased data tracking and management, and whether the prices were fair to producers. Understanding the market trends is difficult when prices are unrelated to the market conditions. Further attention should be given to the question of price setting and fluctuation in a voluntary carbon market. Prices may be too low to meet global climate targets Current available prices within the agricultural carbon market range from $15 to $20 per carbon ton sequestered. This is below the estimated cost of carbon that is required to meet global climate targets, which ranges between $50 to $100 per ton sequestered. A higher cost of carbon sequestration would, in theory, encourage businesses to reduce their demand by reducing their overall emissions, rather than relying on offsets. Additionally, prices may be too low to create the incentive for on-farm change at the scale needed to meet global climate targets. Without a deeper understanding of farm-level cost of production, it may be that the prices currently available are too low to drive farmers to produce these offsets. Co-benefits tend to be easier to measure and manage Carbon sequestration measurement and verification is a difficult and expensive process, which is dependent on many external factors including air temperature, moisture, and soil organic matter. Other indicators, including those that may be positively correlated to carbon sequestration (i.e. co-benefits), may be easier and more practical to measure and verify. These other indicators, such as soil organic matter, biodiversity, or water quality and retention, may also be more easily marketed into local and regional markets.

P a g e | 36
Interviews with producers indicated a high interest in these correlated ecological indicators. Need for public research, data, and technical assistance To accelerate price finding and market development, MDA and other public entities should establish a team to track, investigate, and develop these markets. Many questions remain about the efficacy and viability of these markets, particularly for how these markets will affect farmers’ revenues. It is important to conduct regular engagement with producers on emerging market trends, including but not limited to carbon markets. Carbon markets can be part of a diversified revenue plan Similar to agricultural markets more broadly, farmers may want to diversify their participation in carbon markets, with some participation in both the direct marketplace and some participation in the more commodity style tradeable marketplace. Farm business management professionals should investigate product mix and returns for various carbon or ecosystem service markets available to farmers. Further, direct marketing of carbon or ecosystem services requires further development, which will likely require firms like General Mills and others to create clear points of entry for farmers interested in supplying these services. Recommendations Partnerships with University of Minnesota The University of Minnesota’s cooperative extension program is an invaluable resource to leverage both state and federal level resources and could be a partner in the following recommendations:
1. Structure the state’s investment in the University of Minnesota’s Forever Green Initiative at $10 million per biennium. While profitability is a core criterion, having separate categories such as soil health, resource conservation, nutrition so that research progress can be made across all these fronts. This approach will also help monitor progress of soil health levels and carbon sequestration capacities of agricultural lands.
2. Utilize the expertise at the Minnesota Office for Soil Health, the University of
Minnesota’s West Central Research and Outreach Center, and collaborative capacity at USDA’s North Central Research and Outreach Center to provide MDA with scientific expertise and usable data on land and soil health and carbon sequestration to inform decision making.

P a g e | 37
Programs and Collaborations that MDA can Enhance and Lead There are existing programs and collaborations that the Minnesota Department of Agriculture can partner with to better enhance the work done on Minnesota farms and ranches to establish and develop carbon markets. It would be critical for MDA to have a specific team that enables these partnerships. This team would also increase MDA capacity and enable it to be a leader in the agricultural ecosystem services sector. MDA should lead the efforts in agriculture for the Minnesota Environmental Quality Board to reinforce Minnesota’s Carbon Action Plan through the introduction of voluntary carbon markets to help meet the state’s carbon reduction goals (Minnesota Environmental Quality Board, 2016). As part of the partnership to inform the Climate Action Plan, a working group should be established to understand and determine best management practices, provide learning opportunities for soil testing, and develop a platform to track carbon prices. This working group should include researchers, agency staff, non-profit staff working with farmers, and farmers. This working group should also set the agriculture specific MN carbon sequestration targets as well as carbon emission reduction targets. Given the urgency of climate change and the nascent stage of these ecosystem markets, there is an argument for the state to implement a Payment for Ecosystem Services (PES) system in conjunction with a soil health working lands program (Boody, 2020). The intention of this program is to take a non-market approach to payments to ecosystem services in the short term but improve the environmental performance of the land so as to increase revenue through privatization of these markets at a later point. The PES program was first recommended by the Land Stewardship Project (LSP). Payments should be based on outcomes and integrate a true-cost accounting framework for carbon sequestration and ecosystem services from working lands. The LSP recommendations also identify the Clean Water Fund as a monetary source if there is support from farmers to implement such a program. This program can innovate to help meet water quality goals and Next Generation Energy Act goals. The program can be designed to pay more for shifting from row crops to long-term perennial systems on marginal lands, shifting to managed rotational grazing, using multiple species cover crops, and employing longer crop rotations. It should also consider avoided externalities from converting grassland to row crops. Payments and monitoring or modeling to predict outcomes should be modifiable so they can adapt to future scientific advances. The following models are potential mechanisms that could be considered for payments for ecological services on working farmlands.
1. The Working Lands Watershed Restoration and Protection Program developed a system for identifying marginal lands and estimated payments needed to shift

P a g e | 38
marginal lands from corn and soybeans into perennial systems that include, among other things, managed rotational grazing. This program also models water quality benefits from such shifts. Carbon sequestration and GHG modeling could be added.
2. The Minnesota Agricultural Water Quality Certification Program (MAWQC) can
be expanded to include carbon sequestration and emissions reduction along with water conservation. One of the three MAWQCP Endorsements available to water quality certified producers is soil health. The definition of the endorsement can be expanded to include SOC. The MAWQC can then partner with entities such as Nori, Indigo to verify and sell these carbon credits. Apart from the financial incentive, those who achieve an endorsement receive an additional sign for their farm and recognition for their conservation excellence which can provide visibility in the consumer market.
The program should include a penalty or reduction in payment for negative externalities or switching to practices that increase negative externalities such as erosion, nutrient runoff, loss of habitat, or reduction in organic matter for those participating. MDA could evaluate the use of True Cost Accounting (TCA) or the Genuine Progress Indicator (GPI) as one way of analyzing full costs and benefits related to negative externalities, increases and decreases in natural, built, social, human, and financial capitals, as well as social equity and wellbeing. The Genuine Progress Indicator is a multi-dimensional composite indicator that estimates the quantity and distribution of net benefits of the embedded economic system on the larger social and environmental systems (Fox & Erickson, 2020). The concept of GPI is not new to Minnesota as it was proposed in 2019 for the state of Minnesota in H. F. No. 1662. Regulation using GPI to assess net benefits has been enacted in Maryland, Vermont, and Oregon as a way of understanding the impacts of gross domestic product growth, or lack thereof, on wellbeing. Existing carbon markets tend to favor large scale producers. MDA should align ongoing efforts of the Emerging Farmers’ Working Group to ensure that smaller-scale farmers, including immigrant and minority farmers, have access to any carbon market that is developed. One such collaborative effort already underway is between Hmong American Farmers Association, Latino Economic Development Center, Minnesota Farmers Union Coalition, and LSP to study and report techniques for carbon sequestration as well as practices that improve carbon efficiency that are relevant and important to private partners like Nori and Indigo.

P a g e | 39
MDA’s FarmLink program that connects prospective farmers with retiring farmers could be expanded to include carbon sequestration education and carbon efficiency strategies. Based on the national average, 70 percent of the Minnesota agriculture acres could transition ownership in the next 20 years (Jewett et al., 2013). The FarmLink program could be expanded to include prospective owners, including institutional investors, who are increasingly acquiring farmland but are often absentee landowners. According to the Practical Farmers of Iowa (Charles, 2020), absentee landowners use conservation practices (i.e. cover crops) at lower rates than farmer-operator landowners. Public-Private Partnerships It is almost impossible to have a successful functioning carbon management strategy without the involvement of the private sector through public-private partnerships. In addition to work with ESMC and other private entities to build out markets, MDA can incorporate soil organic matter and emission reduction into different funding program programs (both grants and loans) that utilize state matching incentive funds. For example, the MDA can partner with schools to incentivize the procurement of local grown specialty crops or foods from farms/ranches that prioritize soil health and emissions reduction. MDA should work with private and public entities to co-develop innovative funding mechanisms. One such example is the California Department of Food and Agriculture’s “Restore California” program. Funding for the Restore program is raised by participating restaurants adding a one percent voluntary charge to all patron checks. The accumulated funds are then donated by the restaurants to a 501(c)(3) nonprofit entity which deposits 100 percent of the money in the Restore California Fund. Acting as a private sector complement to California’s Healthy Soils Program, Restore California deploys the funds to enable farmers and ranchers to implement soil health practices. Funds for proposed projects are accessed through a project application and grant making process overseen by Restore California. A similar effort could be explored with MDA, University of Minnesota’s Cooperative Extension, and the Forever Green Initiative.
Absentee landowners use conservation practices at lower rates than farmer-operator landowners.

P a g e | 40
Conclusion Many of the climate solutions offered by agriculture provide multiple benefits to farms, communities, and the environment. Among them are increased crop yields, greater resilience to weather extremes, improved air and water quality and enhanced wildlife habitat. Climate solutions that provide these multiple benefits should be advanced, but agriculture cannot become part of the climate solution without significant investment. The risk to producers in shifting to new climate-friendly agricultural practices must be reduced by investing in relevant technical assistance, financial incentives, and research. No climate policy at the national level will be complete or effective without recognizing the role agriculture must play in avoiding the worst impacts of climate change, reducing greenhouse gas emissions, enhancing carbon sinks and resiliency. Food security depends on embracing agricultural solutions to a changing climate. Carbon markets can play a critical part in a broader strategy toward sustainability. This report highlights the importance of regular engagement with farmers and ranchers to assess their capacity and interest in participating in carbon markets. The study demonstrates that voluntary carbon market prices may not create sufficient financial incentives for farmers even though there are long term ecological benefits to carbon friendly management practices. However, steps can be taken to include carbon storage capacity in land use planning, particularly for agricultural land preservation. Approaching the carbon issue through an ecosystem services perspective provides better long-term soil and land health outcomes, factors that farmers and ranchers find critical for their operations. Further attention should be given to how small and mid-sized farms with diversified operations can participate in carbon markets or carbon sequestration contracts. This emerging market landscape will continue to evolve over the coming years and continued attention, research, and engagement will be required to ensure that the market develops in a way that benefits farmers and reaches the climate goals of the State of Minnesota.

P a g e | 41
Methodology By conducting interviews with various producers across Minnesota and professionals working with producers, we gathered more in-depth perspectives on the opportunities and challenges for carbon markets from the viewpoint of a farmer. In addition, the interviews allowed us to identify specific questions that producers might have about the carbon market and key aspects of the market that may sway their decision. We developed the interview guide based on the goals of the report and reviewing literature around carbon markets to determine what is not known about carbon markets from the producer perspective in Minnesota. The 2-page interview guide contained open-ended questions divided into five sections:
1. Background farm information 2. Carbon management practices 3. Carbon data 4. Carbon markets 5. Remaining questions and closing
The background section included overview questions about the interviewee’s farm or work with farmers. The carbon management practices section included questions on the types of management techniques utilized on farms and how decisions were made to support and monitor these management decisions. The carbon data section included questions about what type of soil carbon data was being collected and why. The carbon markets section included questions about what the interviewee knew about carbon markets, the pros and cons of participating in one and prices they would expect to be paid. The final section, remaining questions and closing, included questions about what type of questions the interviewee had about carbon markets and participating in one. The guide was iteratively reviewed to ensure that it would meet our data goals without causing discomfort or inconvenience to interviewees. Student researchers began each interview with a brief personal introduction and a description of the research, and asked permission to record the interview. If the interviewee agreed to participate and to be recorded, we asked the questions according to the interview guide, exceptions were made for relevant improvisations, including any modification of the questions based on the type of farm or work experience with carbon markets, or a need for follow-up questions. Participants were thanked at the end of the interview and were promised to be sent a copy of the final report. A total of 13 interviews were conducted with a diverse set of farmers and agricultural professionals in Minnesota. Interviewees were recruited through connections and

P a g e | 42
recommendations from the Minnesota Department of Agriculture. All interviews were conducted via phone or Zoom and typically lasted from 30 minutes to 60 minutes. All interviews were recorded, and detailed notes were taken during the interview. Study limitations All research methods have specific limitations, both inherent to the method and related to the research objectives. For the interviews conducted, the main limitation was selection bias. Because the interviewees were recommended by the Minnesota Department of Agriculture (MDA), the thoughts and opinions represented may skew to be more similar to MDA. In addition, part of the challenge when conducting any interview is social desirability bias, where a responder answers questions in a manner that he or she perceives to be preferable in the eyes of the researchers. In the context of this research, this would likely involve a respondent being more favorable to carbon markets. To avoid this bias, the researchers made efforts to position themselves as a neutral party. The main limitation to this report overall is that Native American and Tribal communities were not included in the interviews and the report does not include the role of Native land and communities in carbon markets. A separate report needs to be undertaken that specifically focuses on the perspective of the various Native American communities in Minnesota, which may result in different opinions around agriculture and carbon sequestration on tribal land.
P a g e | 43
References American Farmland Trust. (2020). Soil Health Case Studies Findings. Retrieved
August 01, 2020, from https://farmland.org/soil-health-case-studies-findings/ Bohlen, P. J., Lynch, S., Shabman, L., Clark, M., Shukla, S., & Swain, H.
(2009). Paying for environmental services from agricultural lands: An example from the northern Everglades. Frontiers in Ecology and the Environment, 7(1), 46-55. doi:10.1890/080107
Boody, G. (2020). Farming to Capture Carbon & Address Climate Change Through Building Soil Health (Rep.). Retrieved August 2, 2020, from Land Stewardship Project website: https://landstewardshipproject.org/repository/1/3143/grazing_white_paper_1_23_20.pdf
Carraro, Carlo & Favero, Alice. (2009). The Economic and Financial Determinants of Carbon Prices. Czech Journal of Economics and Finance (Finance a uver). 59. 396-409.
Charles, D. (2020). How Absentee Landowners Keep Farmers From Protecting Water And Soil. Retrieved August 02, 2020, from https://www.npr.org/2020/07/14/890449857/how-absentee-landlords-keep-farmers-from-protecting-water-and-soil
Chicago Climate Exchange. (2010). Members of CCX. Retrieved from https://web.archive.org/web/20100202014432/http://www.chicagoclimatex.com/content.jsf?id=64
Chicago Climate Exchange. (2008). Individual Member Compliance Reports (Rep.). Retrieved August 1, 2020, from https://web.archive.org/web/20100919045121/http://chicagoclimatex.com/compliance/pdf/PhaseI_Member_Reporting_Dec_2008.pdf
Chicago Climate Exchange. (2009). Individual Member Compliance Reports (Rep.). Retrieved August 1, 2020, from https://web.archive.org/web/20100919045247/http://chicagoclimatex.com/compliance/pdf/PhaseII_Member_Reporting_Jan_2009.pdf
Ciborowski, P. (2019). Greenhouse gas reduction potential of agricultural best management practices (Rep.). Retrieved August 2, 2020, from Minnesota Pollution Control Agency website: https://www.pca.state.mn.us/sites/default/files/p-gen4-19.pdf
Claflin, A., & Steinwand, F. (2019). Greenhouse gas emissions in Minnesota: 1990-2016 (Rep. No. Lraq-2sy19). Minnesota Pollution Control Agency.
Conte, Marc & Kotchen, Matthew. (2010). Explaining the Price of Voluntary Carbon Offsets. Climate Change Economics (World Scientific Publishing Company). 1. 93–111.
Ecosystem Services Market Consortium. (n.d.). Ecosystem Services Market Consortium. Retrieved August 01, 2020, from https://ecosystemservicesmarket.org/

P a g e | 44
Forest Trends’ Ecosystem Marketplace. (2019). Financing Emissions Reductions for the Future: State of the Voluntary Carbon Markets 2019. Washington DC: Forest Trends.
Fox, M. V., & Erickson, J. D. (2020). Design and meaning of the genuine progress indicator: A statistical analysis of the U.S. fifty-state model. Ecological Economics, 167, 106441. doi:10.1016/j.ecolecon.2019.106441
General Mills. (2019). General Mills to advance regenerative agriculture practices on one million acres of farmland by 2030 [Press release]. Retrieved August 1, 2020, from https://www.generalmills.com/en/News/NewsReleases/Library/2019/March/Regen-Ag
General Mills. (n.d.). Regenerative Agriculture 2020. Retrieved August 01, 2020, from https://www.generalmills.com/en/Responsibility/Sustainability/Regenerative-agriculture
Hamilton, K., Sjardin, M., Marcello, T., Xu, G. (2008). Forging a frontier: State of the voluntary carbon markets 2008. Retrieved from https://www.forest-trends.org/wp-content/uploads/2017/06/2008_StateofVoluntaryCarbonMarket2.pdf.
H.R. 5861, 116th Cong., (2020) Agriculture Resilience Act, Https://www.congress.gov/bill/116th-congress/house-bill/5861/text?r=1&s=2.
Indigo Ag. (n.d.). Terraton Initiative: Join the Global Movement. Retrieved August 01, 2020, from https://terraton.indigoag.com/
Jewett, J. G., Lewis, H., Baumhardt, A., & Farmers’ Legal Action Group. (2013). Farm Transitions Toolkit (Rep.). Retrieved August 2, 2020, from Minnesota Institute for Sustainable Agriculture, Land Stewardship Project, National Center for Appropriate Technology, and Farmers' Legal Action Group; with partial funding from USDA Risk Management Agency. website: http://misadocuments.info/FarmTransitions.pdf
Kumar S. et al. (2018). Role of Legumes in Soil Carbon Sequestration. In: Meena R., Das A., Yadav G., Lal R. (eds) Legumes for Soil Health and Sustainable Management. Springer, Singapore
Minnesota Environmental Quality Board. (2016). Meeting unveils Minnesota ’s Climate Action Plan to reduce GHG emissions (Rep.). Retrieved August 2, 2020, from https://mn.gov/commerce-stat/pdfs/meeting-unveils-Minnesota.pdf
Minnesota Pollution Control Agency. (2019). Agriculture and Climate Change in Minnesota (Rep.). Retrieved August 2, 2020, from Minnesota Pollution Control Agency website: https://www.pca.state.mn.us/sites/default/files/p-gen4-19a.pdf
Natural Resources Conservation Service. (n.d.). Conservation Stewardship Program. Retrieved August 02, 2020, from https://www.nrcs.usda.gov/wps/portal/nrcs/main/national/programs/financial/csp/
Nori. (n.d.). The Nori Carbon Removal Marketplace. Retrieved August 01, 2020, from https://nori.com/

P a g e | 45
Figen Oker Turuduoglu & Humeyra Adiguzel, (2017). "Reporting for Carbon Trading and International Accounting Standards," Chapters, in: Soner Gokten (ed.),Accounting and Corporate Reporting - Today and Tomorrow, IntechOpen.
Pauw, P., Mbeva, K. & van Asselt, H. (2019). Subtle differentiation of countries’ responsibilities under the Paris Agreement. Palgrave Commun 5, 86 . https://doi.org/10.1057/s41599-019-0298-6
PUR Project. (n.d.). Insetting : What is insetting? Retrieved August 01, 2020, from https://www.purprojet.com/presentation-what-is-insetting/
Ritter, T. & International Agriculture and Trade Policy Institute. (2020, January). Why carbon markets won’t work for agriculture. https://www.iatp.org/documents/why-carbon-markets-wont-work-agriculture
Restore California. (n.d.). Restore California Healthy soils for All. Retrieved August 01, 2020, from https://www.restore.global/
Ruesch, Aaron, and Holly K. Gibbs. (2008). New IPCC Tier-1 Global Biomass Carbon Map For the Year 2000. Available online from the Carbon Dioxide Information Analysis Center [http://cdiac.ess-dive.lbl.gov], Oak Ridge National Laboratory, Oak Ridge, Tennessee.
S. 3894, 116th Cong., (2020) Growing Climate Solutions Act of 2020, https://www.congress.gov/bill/116th-congress/house-bill/330.
Salzman, J., Bennett, G., Carroll, N. et al. (2018). The global status and trends of Payments for Ecosystem Services. Nat Sustain 1, 136–144. https://doi.org/10.1038/s41893-018-0033-0
Sandhu H, Scialabba N, Warner C, Behzadnejad F, Keohane K, Houston R, Fujiwara D, Noe R, Hawthorne P, Keeler B, Schmitt J. (2019). Application of TEEBAgriFood Evaluation Framework to Corn Systems in the US. Global Alliance for the Future of Food.
Sharma, S. (2011), The hype versus the reality of carbon markets and land-based offsets: Lessons for the new Africa carbon exchange, Institute for Agriculture and Trade, Retrieved from https://www.iatp.org/sites/default/files/The%20hype%20versus%20the%20reality%20of%20carbon%20markets042011.pdf
Smith, P. (2012). Soils and climate change. Current Opinion in Environmental Sustainability, 4(5), 539-544. doi:10.1016/j.cosust.2012.06.005
Stiglitz, J. E., Stern, N., Duan, M., Edenhofer, O., Giraud, G., Heal, G., . . . Winkler, H. (2017). Report of the High-Level Commission on Carbon Prices (Rep.). Retrieved August 2, 2020, from Carbon Pricing Leadership Coalition website: https://static1.squarespace.com/static/54ff9c5ce4b0a53decccfb4c/t/59244eed17bffc0ac256cf16/1495551740633/CarbonPricing_Final_May29.pdf
Taiyab, N. (2006). Exploring the market for voluntary carbon offsets, International Institute for Environment and Development, London.

P a g e | 46
The World Bank Group. (2020). State and Trends of Carbon Pricing 2020 (Rep.). doi:10.1596/978-1-4648-1586-7
The World Bank. (n.d.). What is Carbon Pricing? Retrieved August 02, 2020, from https://carbonpricingdashboard.worldbank.org/what-carbon-pricing
Wertz, B., & Kingyens, A. T. (2015). A Guide to Marketplaces. World Bank; Ecofys; Vivid Economics. 2017. State and Trends of Carbon Pricing
2017. Washington, DC: World Bank. © World Bank. https://openknowledge.worldbank.org/handle/10986/28510 License: CC BY 3.0 IGO.

P a g e | 47
Appendices Appendix A: InVEST Model Summary The Integrated Valuation of Ecosystem Services and Tradeoffs (InVEST) tool is a suit of open-source software models that map and evaluate goods and services from nature. These goods and services sustain and fulfill human life. InVEST was developed as part of the Natural Capital Project, a partnership between the Chinese Academy of Sciences, the University of Minnesota, the Stockholm Resilience Centre, The Nature Conservancy, and the World Wildlife Fund. The Natural Capital project is housed at Stanford University. InVEST models are spatially-explicit, using maps as information sources and producing maps as outputs. InVEST returns result in either biophysical terms (e.g., tons of carbon sequestered) or economic terms (e.g., net present value of that sequestered carbon). The spatial resolution of analyses is also flexible, allowing users to address questions at local, regional, or global scales. The tool is modular in the sense that you do not have to model all the ecosystem services listed, but rather can select only those of interest. InVEST models are based on production functions that define how changes in an ecosystem’s structure and function are likely to affect the flows and values of ecosystem services across a land- or a seascape. The models account for both service supply (e.g., living habitats as buffers for storm waves) and the location and activities of people who benefit from services (e.g., location of people and infrastructure potentially affected by coastal storms). This study is specifically interested in the Carbon Storage and Sequestration components of the InVEST model. Forests, grasslands, peat swamps, and other terrestrial ecosystems collectively store much more carbon than does the atmosphere (Lal 2004). Carbon storage on a land parcel largely depends on the sizes of four carbon pools: above-ground biomass, below-ground biomass, soil, and dead organic matter. The InVEST Carbon Storage and Sequestration model aggregates the amount of carbon stored in these pools according to land use maps and classifications provided by the user. Aboveground biomass comprises all living plant material above the soil (e.g., bark, trunks, branches, leaves). Below-ground biomass encompasses the living root systems of above-ground biomass. Soil organic matter is the organic component of soil and represents the largest terrestrial carbon pool. Dead organic matter includes litter as well as lying and standing dead wood (Sharp et al 2020).

Page | 48
Using maps of land use and land cover types and the amount of carbon stored in carbon pools, this model estimates the net amount of carbon stored in a land parcel over time and the market value of the carbon sequestered in remaining stock. The model maps carbon storage densities to land use/land cover (LULC) rasters which may include types such as forest, pasture, or agricultural land. The model summarizes results into raster outputs of storage, sequestration and value, as well as aggregate totals. For each LULC type, the model requires an estimate of the amount of carbon in at least one of the four fundamental pools described above. If there is data for more than one pool, the modeled results will be more complete. The model applies these estimates to the LULC map to produce a map of carbon storage in the carbon pools included. Limitations of the model include an oversimplified carbon cycle, an assumed linear change in carbon sequestration over time, and potentially inaccurate discounting rates. Biophysical conditions important for carbon sequestration such as photosynthesis rates and the presence of active soil organisms are also not included in the model (Sharp et al 2020). References
Lal, R. (2004). Soil Carbon Sequestration Impacts on Global Climate Change and Food Security. Science 304:1623-1627.
Sharp, R., Tallis, H.T., Ricketts, T., Guerry, A.D., Wood, S.A., Chaplin-Kramer,
R., Nelson, E., Ennaanay, D., Wolny, S., Olwero, N., Vigerstol, K., Pennington, D., Mendoza, G., Aukema, J., Foster, J., Forrest, J., Cameron, D., Arkema, K., Lonsdorf, E., Kennedy, C., Verutes, G., Kim, C.K., Guannel, G., Papenfus, M., Toft, J., Marsik, M., Bernhardt, J., Griffin, R., Glowinski, K., Chaumont, N., Perelman, A., Lacayo, M. Mandle, L., Hamel, P., Vogl, A.L., Rogers, L., Bierbower, W., Denu, D., and Douglass, J. (2018). InVEST 3.6.0 User’s Guide. The Natural Capital Project, Stanford University, University of Minnesota, The Nature Conservancy, and World Wildlife Fund.

Page | 49
Appendix B: Interview guide BACKGROUND
1. Can you provide a brief overview of your farm? a. What kind of farming do you engage in: Livestock; Crops (which?); Mixed;
Other_________ b. How long have you been farming your current acreage? c. What is your average acreage under production?
2. Are there any time periods when the farm is inactive? (due to weather, etc). 3. Do you own, lease, or both the land that you farm?
a. If both, please detail the acreage split between acreage owned vs. leased CARBON MANAGEMENT
4. Are you currently using any management techniques to build carbon in your soils and/or enhance ecological function?
a. If so, please describe the management practices you employ. 5. How do you make a decision about which management practices to use? (how
much does soil health, economic, environmental benefits, etc. play into the decision or is it 100% economics or listening to the CCC)
6. How are you monitoring the effectiveness of these management practices toward achieving your goal(s) (including soil carbon change)?
7. Are you currently using any farm management tools, such as COMET-planner or COMET-farm?
CARBON DATA 8. Are you currently collecting soil carbon data? If so, what are your motivations for
collecting the data? 9. If yes (to collecting data and getting compensated), is it worthwhile? 10. What do you see as the primary benefits and barriers of gathering soil carbon
data? CARBON MARKETS
11. For you as a producer, what are the pros and cons of joining a carbon market? 12. Do you have a preference for one of the markets, which one and why? 13. What are the key factors that would sway your decision?
a. Data ownership 14. What price would you expect to be paid per acre or per ton of carbon
sequestered in your soil? 15. Do you have any specific questions about carbon markets that you would like for
us to answer in our report? 16. Any final thoughts that you would like to share with us from your perspective as a
producer about carbon markets in Minnesota?

Page | 50
Appendix C: Acronyms AFT: American Farmland Trust ARA: Agricultural Resilience Act CCS: Carbon Capture and Storage CCU: Carbon Capture and Use CCX: Chicago Climate Exchange CDM: Clean Development Mechanism CER: Certified Emission Reduction CO2: Carbon dioxide CORSIA: Carbon Offsetting and Reduction Scheme for International Aviation CSP: Conservation Stewardship Program CSR: Corporate Social Responsibility EOV: Ecological Outcome Verification EPA: Environmental Protection Agency EQIP: Environmental Quality Incentives Program ERU: Emission Reduction Unit ESMC: Ecosystems Services Marketplace Consortium ET: Emissions Trading EU ETS: The European Union Emissions Trading Scheme GHG: Greenhouse Gas IATP: Institute for Agriculture and Trade Policy JI: Joint Implementation LSP: Land Stewardship Project MAWQCP: Minnesota Agricultural Water Quality Certification Program MDA: Minnesota Department of Agriculture MRV: Monitoring, Reporting and Verification NGO: Nongovernmental Organization NRCS: Natural Resources Conservation Service NRT: Nori Carbon Removal Ton OECD: Organization for Economic Co-operation and Development PES: Payment for Ecosystem Services RBCF: Results-based climate finance REDD: Reducing Emissions from Deforestation and Forest Degradation SBTi: Science Based Targets initiative SCC: Social Cost of Carbon SOC: Soil organic carbon TFI: The Fertilizer Institute UAV: Unmanned Aerial Vehicles UN: United Nations

Page | 51
UNFCCC: United Nations Framework Convention on Climate Change UNGC: United Nations Global Compact USDA: United States Department of Agriculture VER: Voluntary Emission Reduction WRI: World Resources Institute WWF: World Wide Fund for Nature

Angel Cruz Angel Cruz is the academic and extension initiatives manager at the Center for Environmental Farming Systems (CEFS), based at NC State University, as well as the coordinator for the North Carolina Local Foods Council. CEFS focuses on research, extension, and education in sustainable agriculture and community-based food systems. Angel’s work at CEFS focuses on sustainable agriculture education and developing a diverse career pathway in agriculture and food systems across the state. Angel’s family history is deeply rooted in agriculture, from the tobacco fields of rural Appalachia where she grew up to the sugarcane fields in Cuba where her father hails. She received a PhD in agroecology from NC State University and received a Fulbright Fellowship and a Borlaug Global Food Security Fellowship to fund her research on soil health and food security in El Salvador. Devin Foote Devin Foote is a food systems program officer at the W.K. Kellogg Foundation in Battle Creek, Michigan. In this role, he supports the foundation’s efforts to promote thriving children, working families and equitable communities. A native of mid-Michigan, he grew up working with family in the vegetable, dairy, and row crop farming sectors. Since 2010 he has lived and worked in Detroit, MI as an educator, farm manager, site developer and aggregator of all things Grown in Detroit; working with residents to develop a more robust, local, and regional food system. He has worked with local, state, regional, and national institutions to strengthen U.S. agricultural policy. Previous experience includes managing direct market farms in New York state, working with U.S. Senator Debbie Stabenow on Agriculture, Health, and Trade policy, and supporting the Food and Society Fellowship program at the Institute for Agriculture and Trade Policy. Most recently he worked with the USDA’s Food and Nutrition Service on Child Nutrition programs. He holds a Master’s degree from Michigan State where he was a graduate affiliate with the Center for Regional Food Systems focusing on small farm viability. Alaine Janosy Alaine Janosy is an independent sustainability consultant specializing in agricultural production systems and procurement. She works with food companies to create, enable, and expand strategies that drive adoption of regenerative farming practices. Alaine has worked extensively in sustainable agriculture and food production systems. Her past experience includes work with many top companies and organizations such as Nestlé, Chipotle Mexican Grill, Fairway Market, Slow Food USA, and Accenture. She is on the board of Global Seed Savers, a nonprofit organization that partners with farmers to promote food sovereignty and climate resilient agriculture. She holds an MA in food systems from New York University and a BA in international affairs from The George
About the Authors
Washington University. In addition to her considerable sustainability experience, Alaine is also a trained pastry chef. Katie Poirier Katie Poirier is the executive director of the Mollen Foundation. Her current work empowers Arizona youth and families to adopt healthy habits through engaging gardening, cooking, mindfulness, and physical activities. Previously, Katie was the project director of PHX Renews, a 15-acre community garden collaborative and health hub. Katie graduated with a BA in urban dynamics from the School of Sustainability at Arizona State University and has experience in project management, content creation, reporting, and evaluation. She lives in Phoenix and credits her initial love of food to her grandparents’ peach tree and homemade pierogis. Annalise VanVranken Annalise VanVranken is the Strategy & Partnerships Project Manager at FoodCorps, a national non-profit and AmeriCorps program working to connect kids to healthy food in school, so they can lead healthier lives and reach their full potential. Annalise’s work is focused on supporting FoodCorps' policy, government and strategic partnerships, along with supply chain and school meals initiatives. Annalise was brought to this role after two years of FoodCorps service and three years as the Massachusetts Program Coordinator, leading a cohort of twenty-two service members, along with their schools and sites, to create direct impact and leverage farm-to-school and food equity initiatives across the state. Annalise hold her BA in Environmental Studies and Sociology with a minor in Sustainability from Wells College. While currently residing in Brooklyn, NY, Annalise is born and raised in southern New Jersey, where the Garden State inspired her love of food and the people that produce it.

Contact for more information: Swette Center for Sustainable Food Systems Email [email protected] | Website foodsystems.asu.edu
Swette Center for Sustainable Food Systems is a unit of ASU School of Sustainability


