Assessment for political accountability or towards educational quality? Sarah Howie (PhD) Centre for Evaluation and Assessment, University of Pretoria Keynote Address to 42 nd IAEA conference, Cape Town, 21 August 2016
Transcript
Assessment for political accountability or towards educational quality?
Sarah Howie (PhD)
Centre for Evaluation and Assessment, University of Pretoria
Keynote Address to 42nd IAEA conference, Cape Town,
21 August 2016
Dedication
This paper is dedicated to a dear late friend and colleague:
Prof Tim Dunne
a passionate and dedicated professional who tried to make South Africa a better place through his humanity and
professional expertise and who taught me and many others that
Structure of education system Structure of SA qualifications Framework
Levels 5-10
Higher Education and Research
Research Higher degrees Initial Degrees National and
Higher Diplomas Professional Employment
Levels 2-4
Higher National Certificate(s)
CORE and APPLIED / GENERIC and OPTIONS
Senior Secondary Schools
(Grades 10-12)
Technical Colleges and Community
Private Providers and NGOs
Industry Training
Labour RTCs
Market Schemes
Colleges
Level 1 (Compulsory)
COMPULSORY Schooling: Level 1 or the General Certificate of Education (GETC)
ABE & TRAINING: Level 1 or the General Certificate of Education (GETC)
Grade 7-9
Grade 4-6
Grade 1-3
ABET 4
ABET 3
ABET 2
ABET 1
EDUCARE
Compulsory schooling:From year children turn 7 yrs to age 15 yrs (Grade 9)
Some facts about education in South Africa
2000 2013/ 2014
Factors % of learners
Net enrolment rate primary
89 99.4
Electricity 54.9 86
Water 71.2 97
Sanitation 90.8 98
• 12 655 436 learners
• 25 741 schools (24 270 public)
• 2016 National Budget for Education on basic education is R205.8 billion.
• 2016 - 87.1% of public schools (“no fee” schools) with 71.8% of learners
DBE, 2014
77% of schools have very basic
facilities and meet basic safety
norms.
Global monitoring report UNESCO
differs
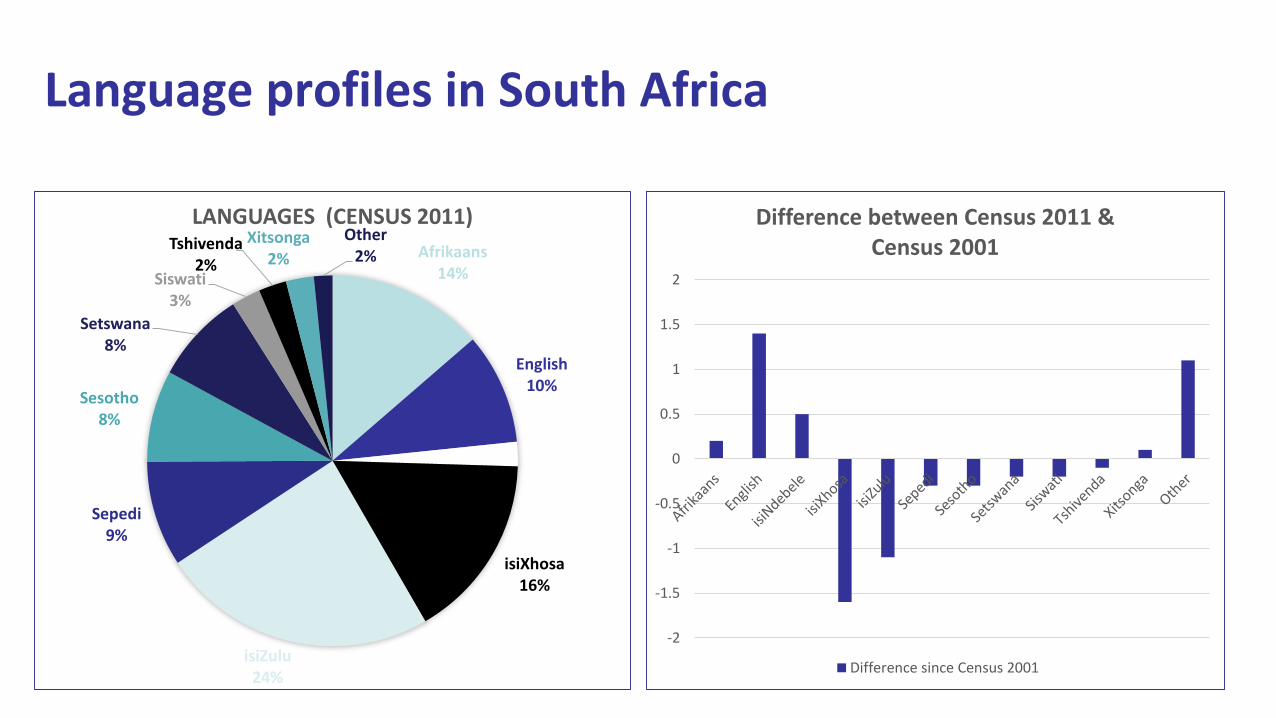
Language of Learning and Teaching
• 11 languages of Learning and Teaching
• Grade 1-3 – All 11 languages in schools
• Grade 4-12 – only Afrikaans and English
• Additive Bilingualism model
Highest level of education 20 years and older
8.6
12.3
4.6
33.9
28.9
11.8
0
5
10
15
20
25
30
35
40
No schooling Some primary Completed primary Some secondary Grade 12 Higher
Perc
enta
ge
Levels of education
1996 2001 2011
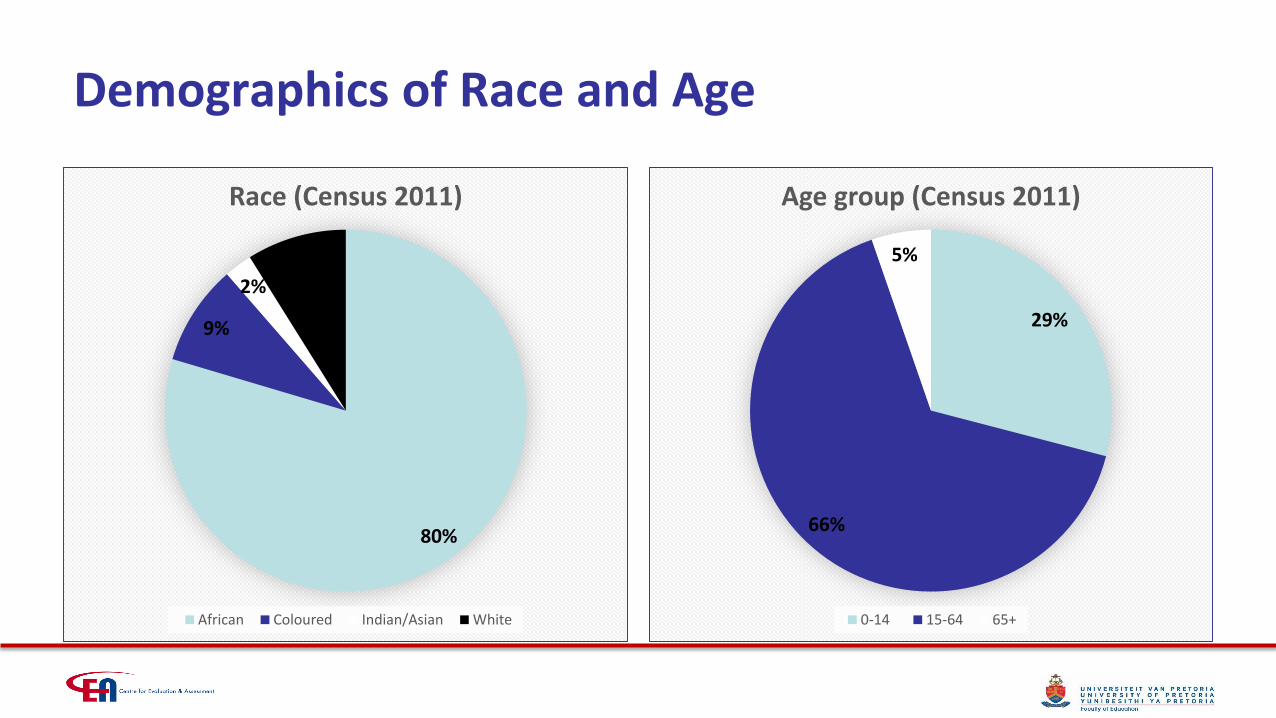
Census 2011
CHALLENGES FOR SA EDUCATION
Global challenges for SA education
Global Monitoring report “Global Challenges South African status
Population growth and urbanisation 51.7 Million in 2016 (65% urban)(Africa urb pop doubled in 20 yrs)
Health – HIV/AIDS, Tuberculosis and malaria 12% with HIV/Aids (6.4million)
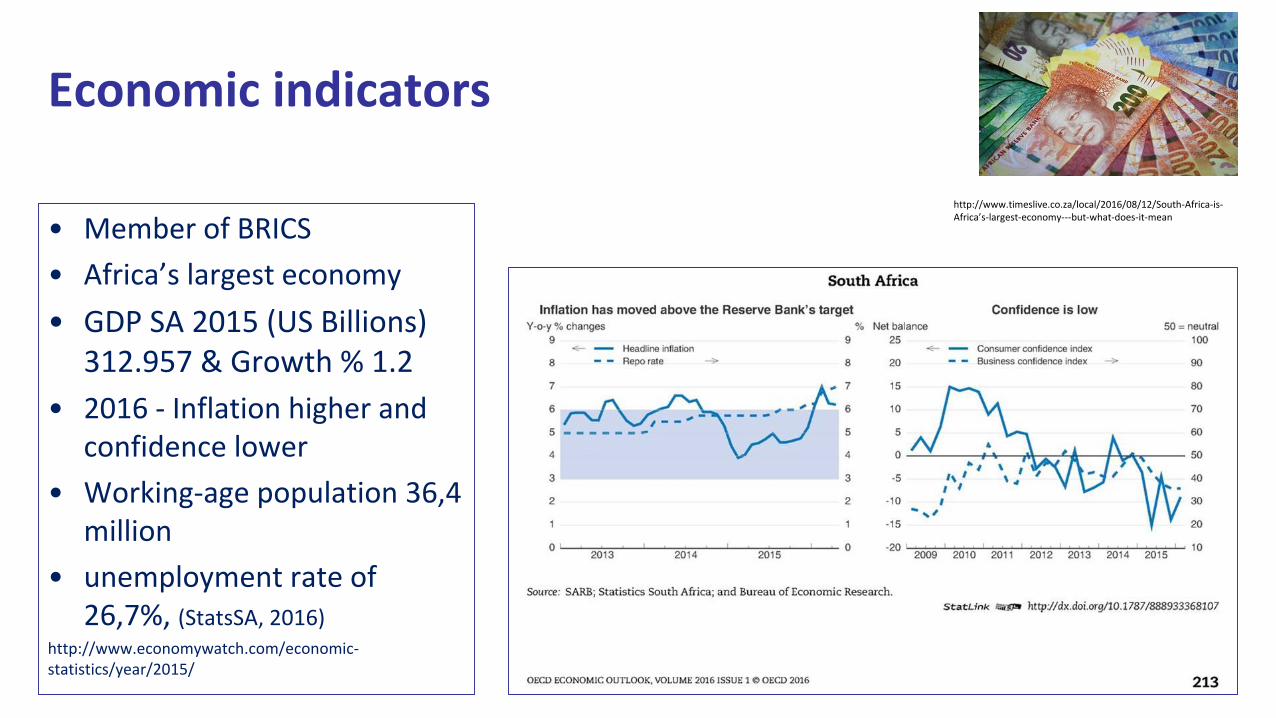
Economic growth and rising inequality SA 2015 (GDP US Billions) 312.957 and GDP Growth % 1.2 Gini coefficient 2016 ranges from 0.660 to 0.696.
Rise of the knowledge economy Increase in connectivity limited by bandwidth problemsShortage of knowledge and skills to meet demands
Conflict and fragile states Growing community unrest, political instability, corruption
Sources: Global Monitoring report, 2015; Economy watch; Census data, 2011
National and local challenges for SA education
• Legacy of fragmented, diverse and unequal systems
• Uneven & poor management of resources
• Differential quality of education provided in schools
• Widespread low learner performance
• Quality of national data (validity and reliability) and database maintenance
• Capacity of research limited locally
• Agenda and funding of educational research problematic
• Slow progress on Education For All indicators
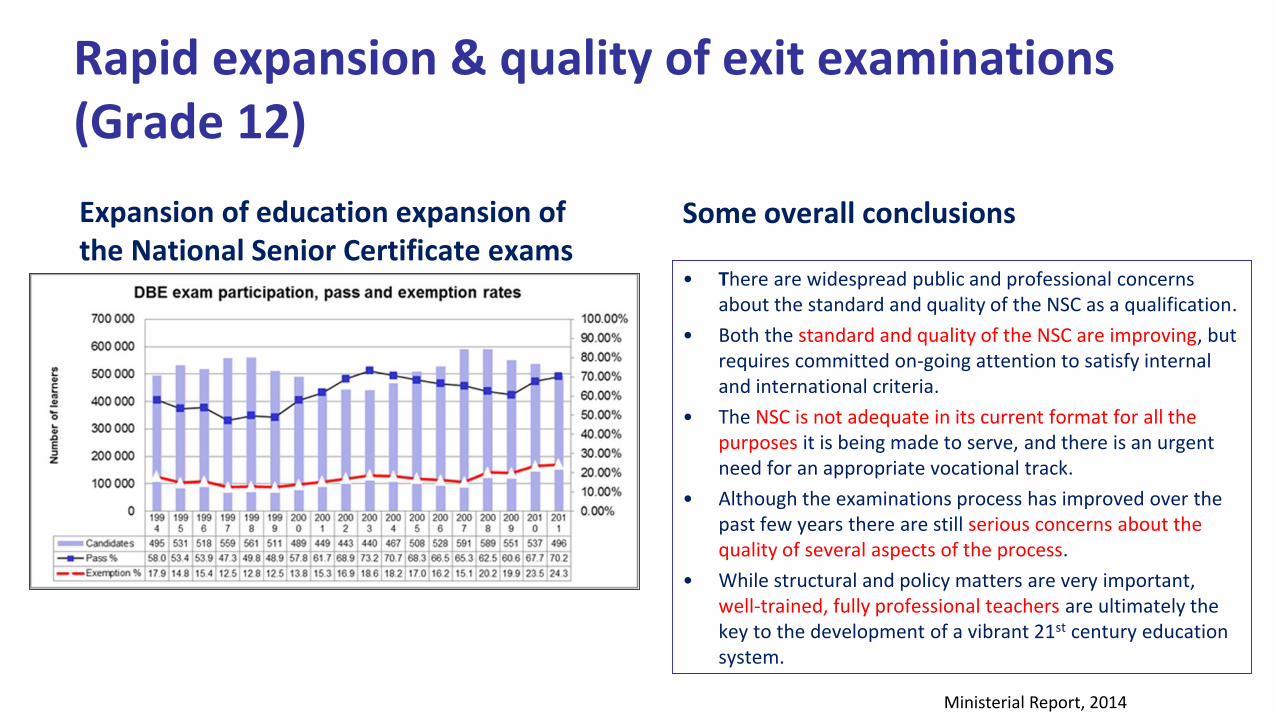
Rapid expansion & quality of exit examinations(Grade 12)
Some overall conclusions
• There are widespread public and professional concerns about the standard and quality of the NSC as a qualification.
• Both the standard and quality of the NSC are improving, but requires committed on-going attention to satisfy internal and international criteria.
• The NSC is not adequate in its current format for all the purposes it is being made to serve, and there is an urgent need for an appropriate vocational track.
• Although the examinations process has improved over the past few years there are still serious concerns about the quality of several aspects of the process.
• While structural and policy matters are very important, well-trained, fully professional teachers are ultimately the key to the development of a vibrant 21st century education system.
Expansion of education expansion of the National Senior Certificate exams
Ministerial Report, 2014
Quality of indicators –e.g. Access to Primary Education
90
91
92
93
94
95
96
97
98
99
100
Pe
rce
nta
ge o
f le
arn
ers
Percentage of learners in educational institutions
2002
2004
2006
2008
2009
By 2015 – All children to have access to free and compulsory education of good quality
❍98% of 7-13 year olds and
❍98% of 7-15 year olds are in school (Stats SA)
Net enrolment figures of 87 & 88% (UNICEF) substantially lower and indicate downward trend
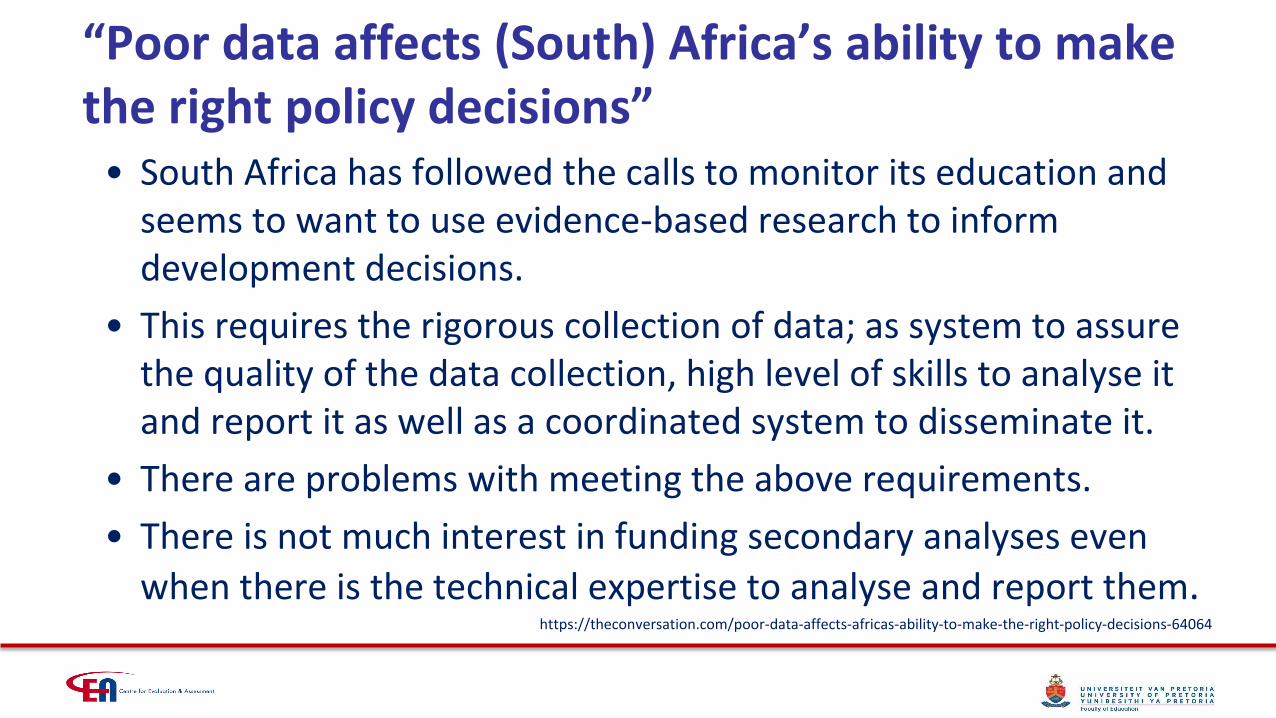
“Poor data affects (South) Africa’s ability to make the right policy decisions”
• South Africa has followed the calls to monitor its education and seems to want to use evidence-based research to inform development decisions.
• This requires the rigorous collection of data; as system to assure the quality of the data collection, high level of skills to analyse it and report it as well as a coordinated system to disseminate it.
• There are problems with meeting the above requirements.
• There is not much interest in funding secondary analyses even
when there is the technical expertise to analyse and report them.https://theconversation.com/poor-data-affects-africas-ability-to-make-the-right-policy-decisions-64064
National and local challenges for SA education – progress towards EFA goals
Goal Status
1. Early childhood care and education
Significant growth in past 10 years.More needed to be done to reach 100% for 5 yr olds by 2015.
2. Universal Primary access
High rates of enrolment and retentionStrong gender equitySignificant proportion of disabled children not attending school
3. Young people and Adults
Problem with young people NSC failure or drop out.FET colleges: insufficient capacity and quality“Fly by night” institutions
4. Adult Literacy rate Improvement in adult literacy rate.
5. Gender parity Gender parity achieved but more females than males.Concern about teenage girls dropping out through pregnancy.
6. Quality Education Poor - Low performance in national examinations, national and international assessments
Increasing frustration of communities – a recent caseEastern Cape Department of Education’s failure to appoint teachers at their school. • …”lack of teachers at their school for years”. He said the department does not
care about schools in rural areas” (Grade 12 learner)
• Students have been demanding that the department appoint teachers to replace three that left two months ago. They need teachers for physical science‚ life science‚ maths and geography.
• Students said that the school principal‚ promised to give answers to their grievances but when he did not arrive at the meeting students went on a rampage destroying the school.
• “violence is the only language government understands.” (Grade 12 learner)
• “When our matric results become low we become the talk of the province but the [department] is failing to fix the problem. … Exams are around the corner. How are we going to pass if we do not have teachers‚” she said.
• Asked if she believes burning the school was a solution she said‚ “Burning the school was not part of the plan but things got out of control.”
• “This is the school that was built by our parents years ago. The condition outside looked promising but inside all the ceilings were broken. You could see the sky while you were sitting inside. Each year we kept on patching broken roofs. Maybe now that students burnt it‚ the department will assist us with a better school‚” he said.
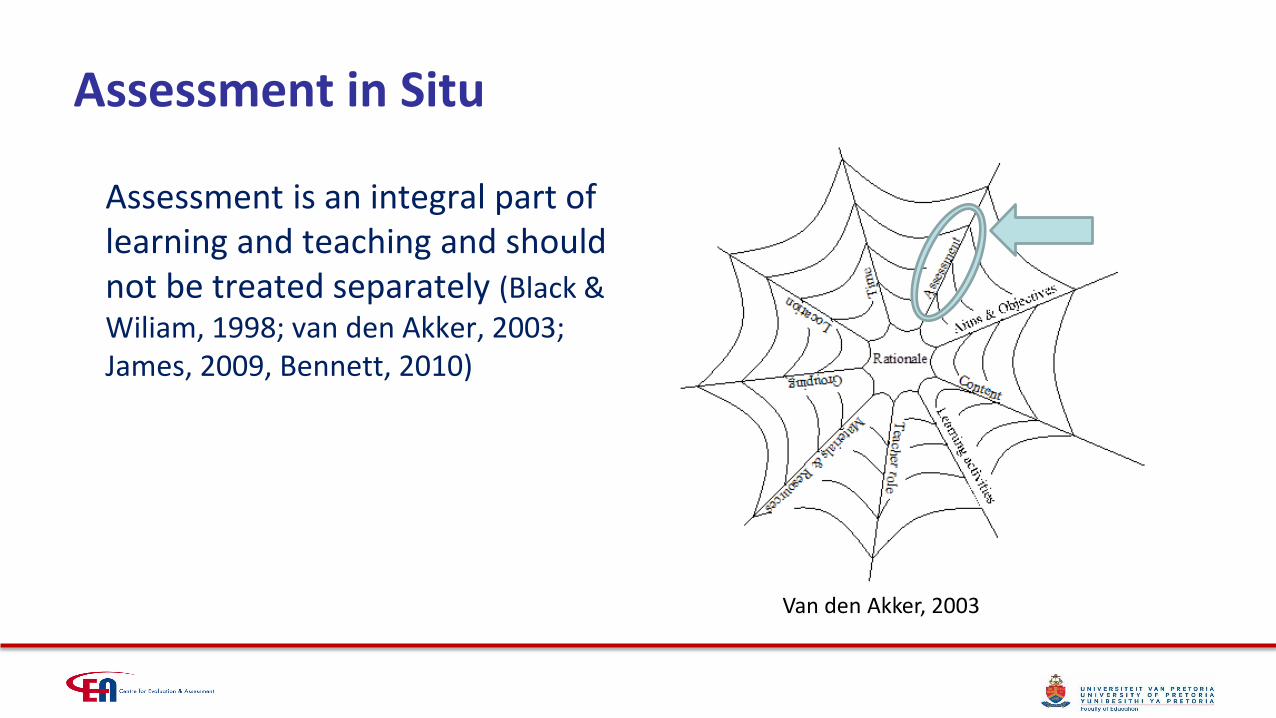
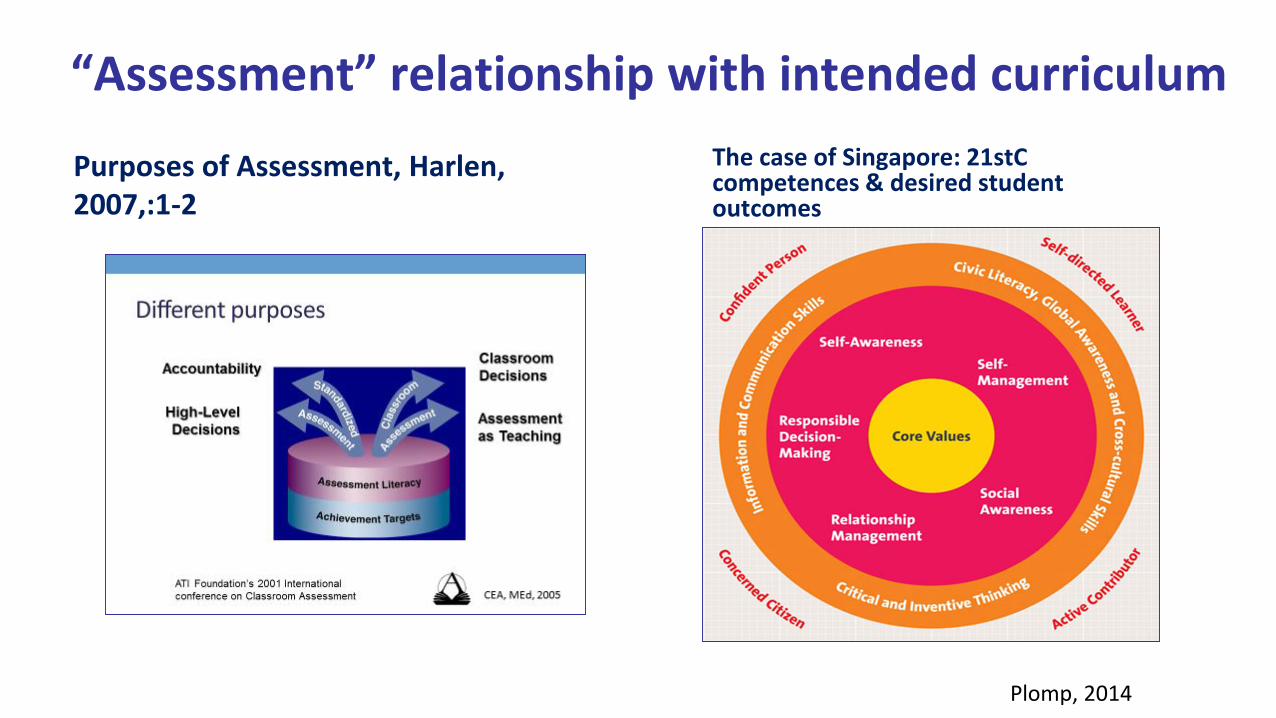
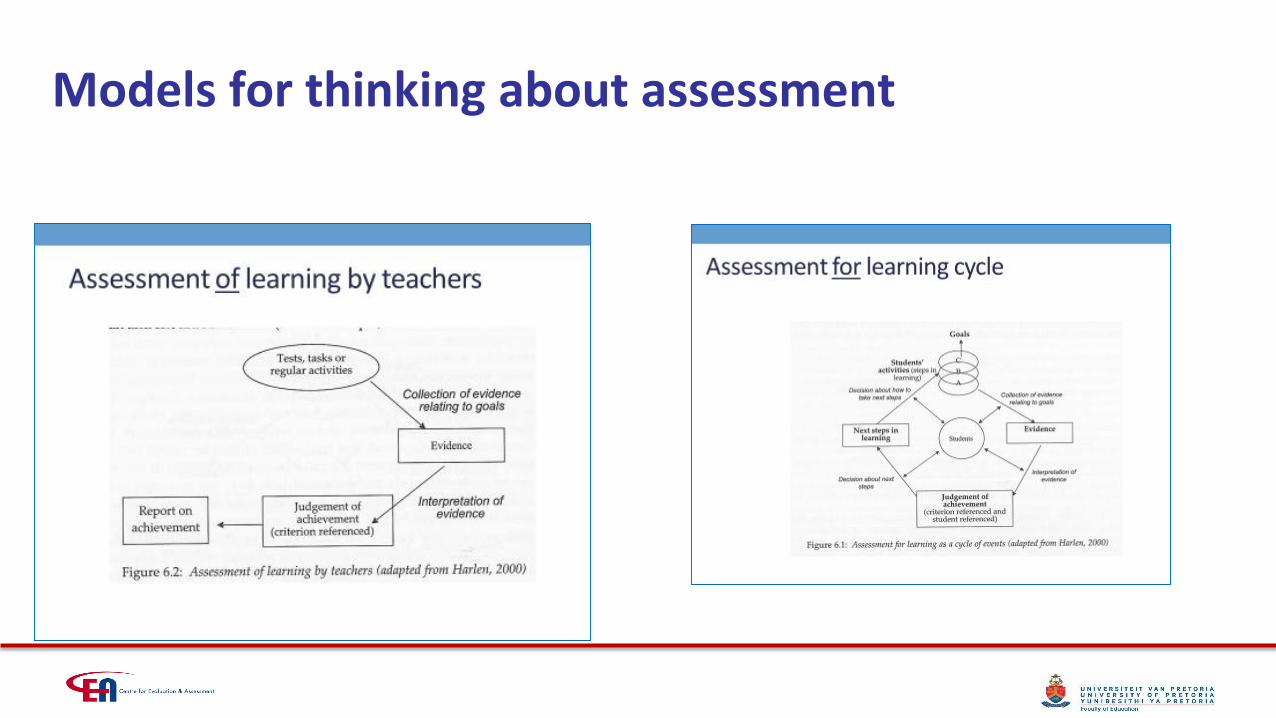
Assessment is an integral part of learning and teaching and should not be treated separately (Black & Wiliam, 1998; van den Akker, 2003; James, 2009, Bennett, 2010)
Van den Akker, 2003
“Assessment” relationship with intended curriculum
Purposes of Assessment, Harlen, 2007,:1-2
The case of Singapore: 21stC competences & desired student outcomes
Plomp, 2014
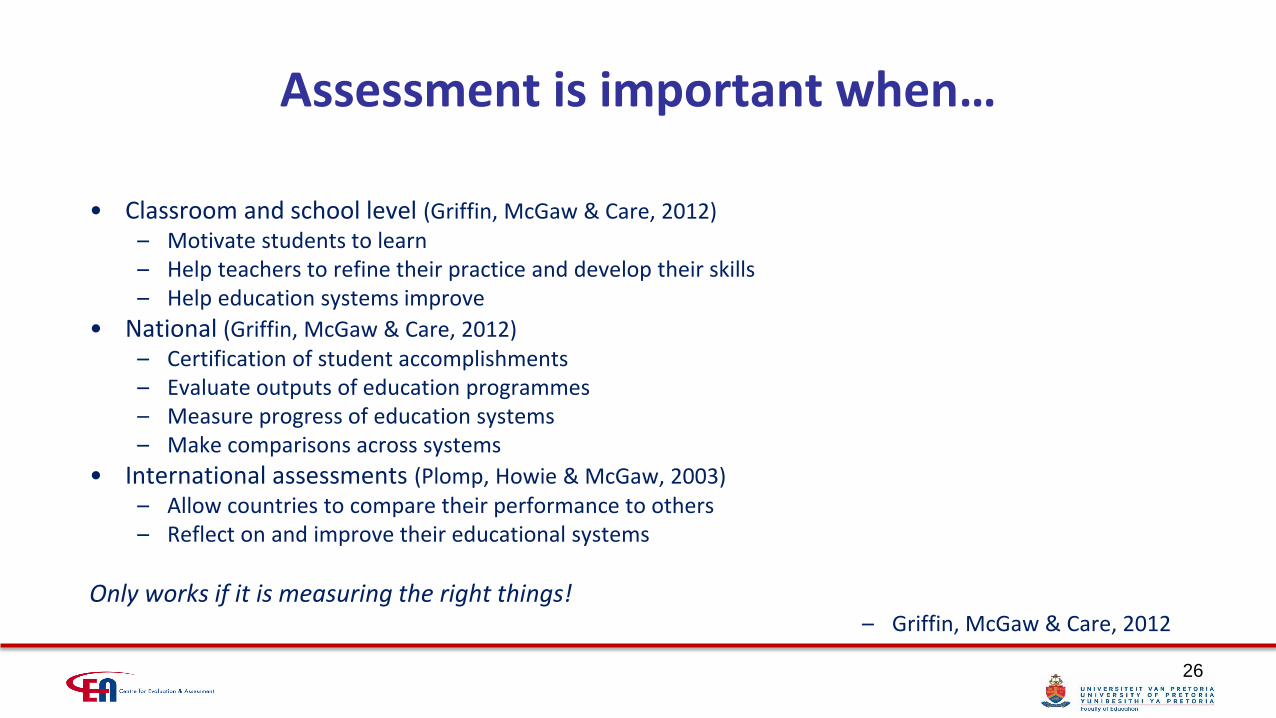
Assessment is important when…
• Classroom and school level (Griffin, McGaw & Care, 2012)– Motivate students to learn– Help teachers to refine their practice and develop their skills– Help education systems improve
• National (Griffin, McGaw & Care, 2012)– Certification of student accomplishments– Evaluate outputs of education programmes– Measure progress of education systems– Make comparisons across systems
• International assessments (Plomp, Howie & McGaw, 2003)– Allow countries to compare their performance to others– Reflect on and improve their educational systems
Only works if it is measuring the right things!– Griffin, McGaw & Care, 2012
26
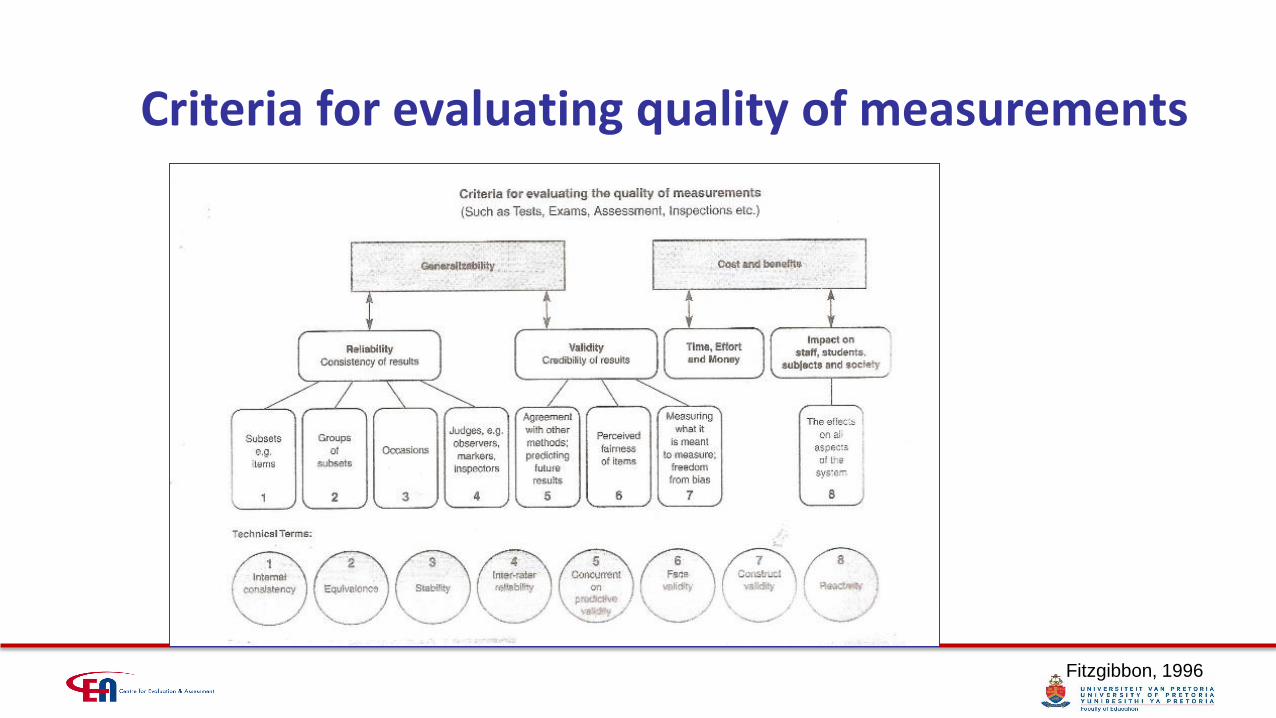
Quality vs Quantity: the assessment debate
Criteria for evaluating quality of measurements
Fitzgibbon, 1996
Problems
• Overkill in quantity – constantly “weighing the pig” (Le Cordeur, 2014 )is killing it
– Too much ill-considered assessment – provincial demand and sheer quantity, time wasting
• Shortage of skills in preparing and disseminating quality classroom-based and standardised assessments (Zimmerman, 2010)
• Shortage of good examples for variety of assessment purposes across all subjects. (Zimmerman, 2010)
• Reducing the demands and quality of examination papers due to demand for increased pass rates having negative washback effects. (Min Report, 2014)
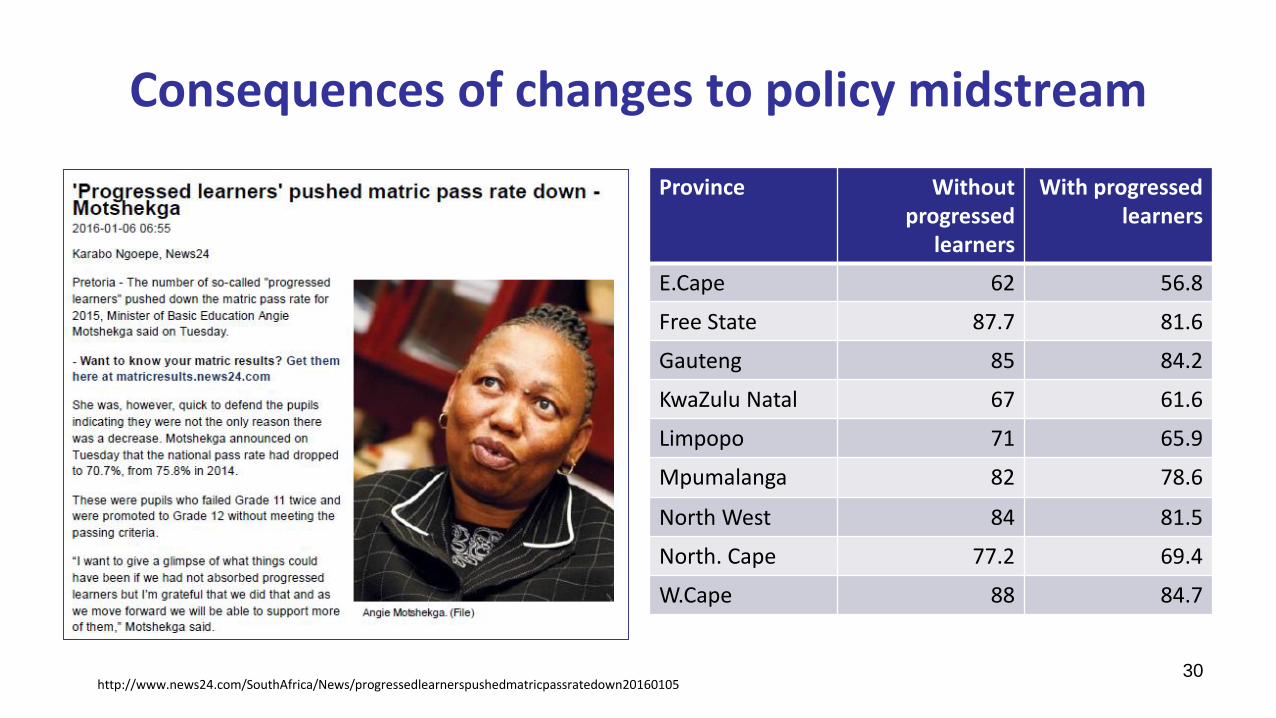
• Controversial and sudden changes to National senior Certificate and Senior Certificate (progressed learners and moving supplementary exams to different time of year)
• Progressed learners are pupils who failed Grade 11 twice and were promoted to Grade 12 without meeting the passing criteria (2014 and 2015).
• Reduce number of externally required assessments in schools for provincial record-keeping and systemic tests
• Upskill subject advisors, teachers and create instructional leaders (preservice and inservice) in assessment theory and practice
• Invest in creation and development of centres of expertise for research and practice to support all forms of assessment
• Invest in creation and dissemination of good quality assessment examples, all grades, all subjects
• Overhaul quality of exit examination system – focus on quality above compliance
• Long-term have to improve quality of primary and secondary school – short term need additional support
Alignment of the Curriculum, Instruction and Assessment
What does alignment mean?
Intended Implemented Attained
INTENDED Ideal Vision (rationale or basic philosophy
underlying a curriculum)
Formal/Written Intentions as specified in curriculum
documents and/or materials
IMPLEMENTED Perceived Curriculum as interpreted by its users
(especially teachers)
Operational Actual process of teaching and learning
(also: curriculum-in-action)
ATTAINED Experiential Learning experiences as perceived by
learners
Learned Resulting in learning outcomes of learners
Curriculum Instruction Assessment
Van den Akker, 2003
IAEA theme, 2016
Van den Akker
Intended Implemented Achieved
IEA, 1989
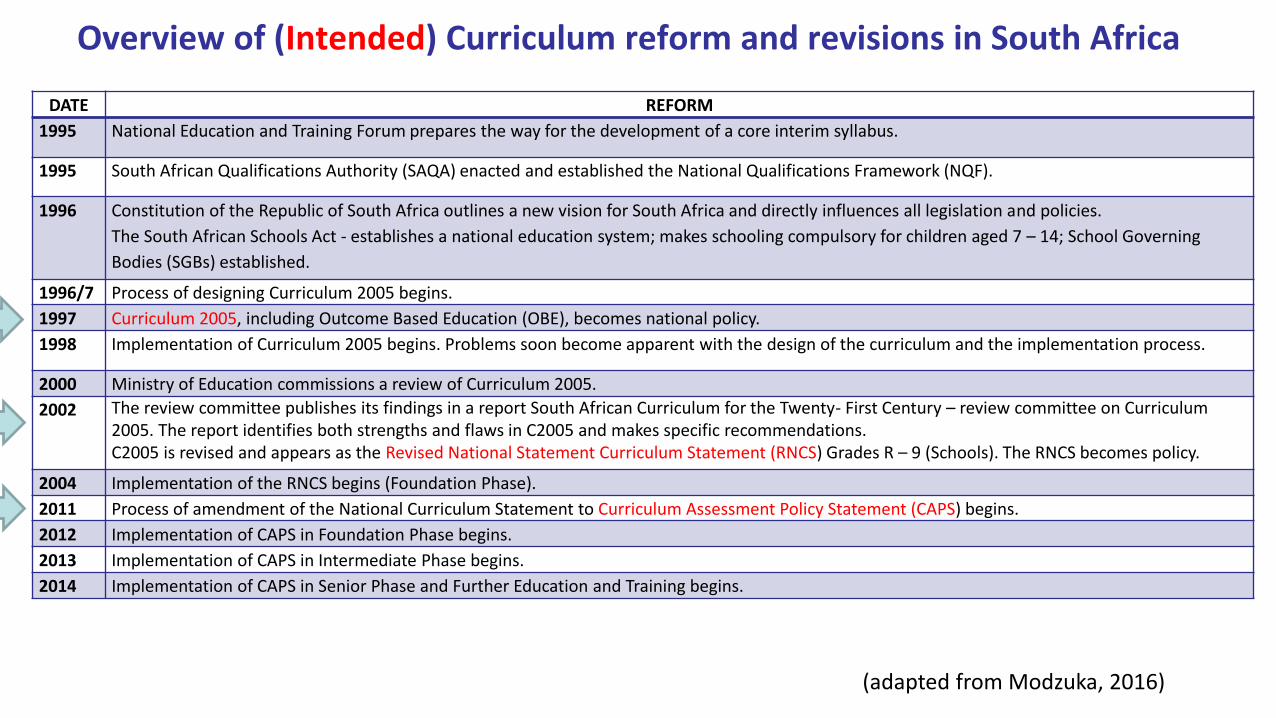
Overview of (Intended) Curriculum reform and revisions in South Africa
DATE REFORM
1995 National Education and Training Forum prepares the way for the development of a core interim syllabus.
1995 South African Qualifications Authority (SAQA) enacted and established the National Qualifications Framework (NQF).
1996 Constitution of the Republic of South Africa outlines a new vision for South Africa and directly influences all legislation and policies.
The South African Schools Act - establishes a national education system; makes schooling compulsory for children aged 7 – 14; School Governing
Bodies (SGBs) established.
1996/7 Process of designing Curriculum 2005 begins.
1997 Curriculum 2005, including Outcome Based Education (OBE), becomes national policy.
1998 Implementation of Curriculum 2005 begins. Problems soon become apparent with the design of the curriculum and the implementation process.
2000 Ministry of Education commissions a review of Curriculum 2005.
2002 The review committee publishes its findings in a report South African Curriculum for the Twenty- First Century – review committee on Curriculum 2005. The report identifies both strengths and flaws in C2005 and makes specific recommendations.C2005 is revised and appears as the Revised National Statement Curriculum Statement (RNCS) Grades R – 9 (Schools). The RNCS becomes policy.
2004 Implementation of the RNCS begins (Foundation Phase).
2011 Process of amendment of the National Curriculum Statement to Curriculum Assessment Policy Statement (CAPS) begins.
2012 Implementation of CAPS in Foundation Phase begins.
2013 Implementation of CAPS in Intermediate Phase begins.
2014 Implementation of CAPS in Senior Phase and Further Education and Training begins.
(adapted from Modzuka, 2016)
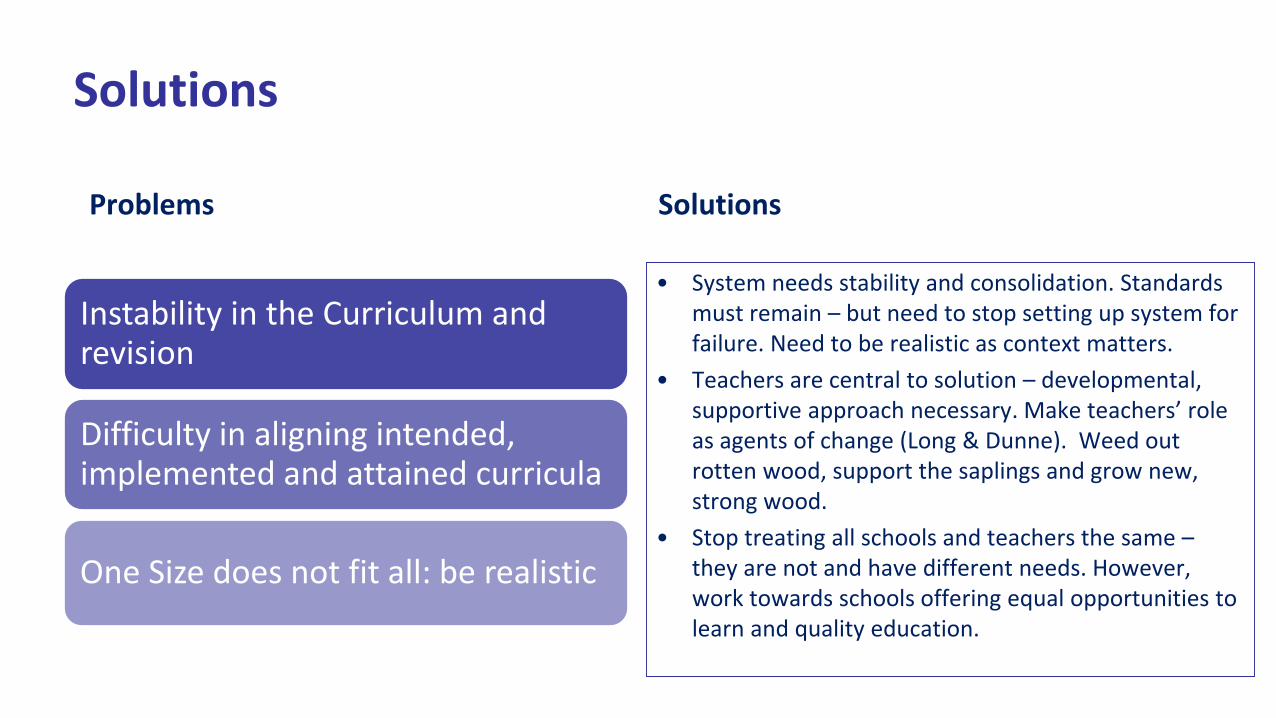
Problems
• Instability in the Curriculum and revision (Jansen, 2007)
– driven by political not necessarily education imperatives
– most expensive way to change an education system – yet South Africa, a middle income country, has done this 3 times.
– every time revision occurs, there is another re-alignment needed of the curricula
• Difficulty in Aligning intended, implemented and attained curricula (Howie, in press)
– Standards (in an intended curriculum) almost always unreachable
• One Size does not fit all: be realistic (Plomp, 2014)
– Insisting on specifying what all teachers must do on weekly basis is nonsensical – creates distrust & resentment, increases feeling of failure.
– Teachers & learners differ, therefore teachers need discretion of setting pacing and interpreting content in line with needs of their learners.
Solutions
Problems
Instability in the Curriculum and revision
Difficulty in aligning intended, implemented and attained curricula
One Size does not fit all: be realistic
Solutions
• System needs stability and consolidation. Standards must remain – but need to stop setting up system for failure. Need to be realistic as context matters.
• Teachers are central to solution – developmental, supportive approach necessary. Make teachers’ role as agents of change (Long & Dunne). Weed out rotten wood, support the saplings and grow new, strong wood.
• Stop treating all schools and teachers the same –they are not and have different needs. However, work towards schools offering equal opportunities to learn and quality education.
Assessment ensuring effective Teaching and Learning
Models for thinking about assessment
Models for assessment
• Emergence of formative assessment in some way reaction to standardised assessment
• Assessment Reform Group (UK – Black & Wiliam, James, Stobart)
• Bennett (USA)
• Gordon Commission (USA)
• 21st Century Assessment (Int – Griffin et al)
Assessment as a continuum
Models for thinking about assessment
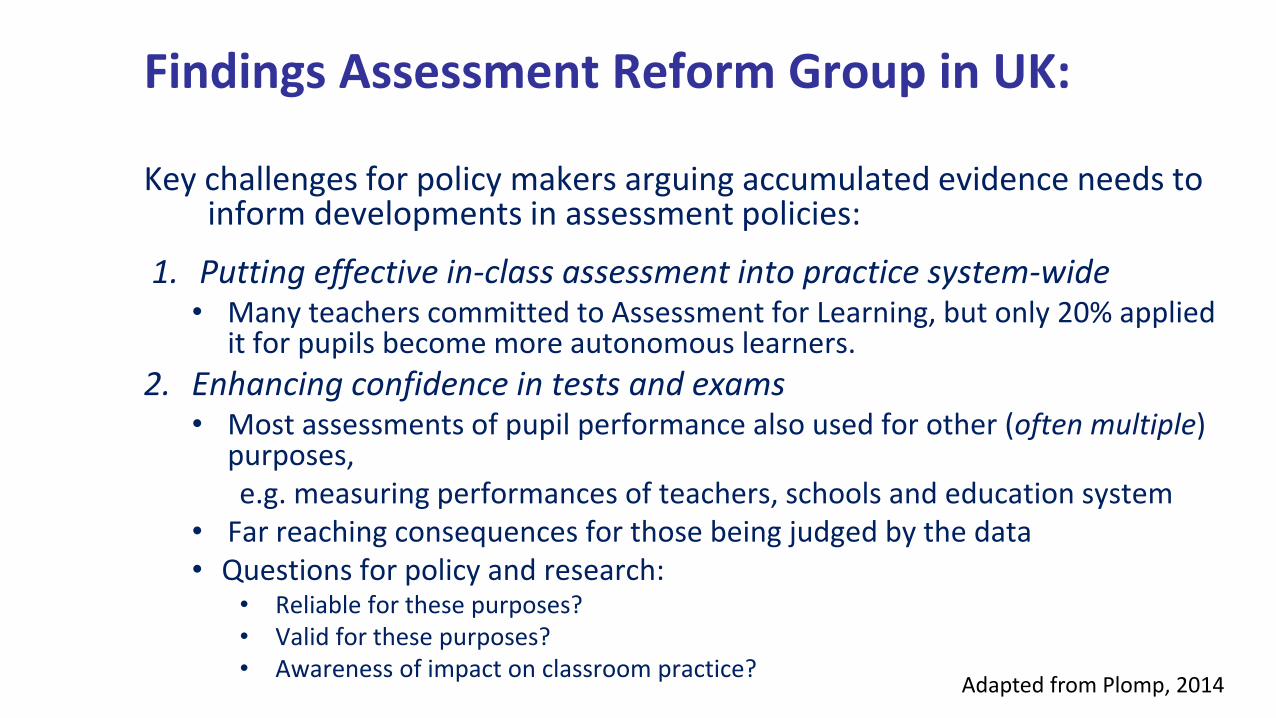
Findings Assessment Reform Group in UK:
Key challenges for policy makers arguing accumulated evidence needs to inform developments in assessment policies:
1. Putting effective in-class assessment into practice system-wide• Many teachers committed to Assessment for Learning, but only 20% applied
it for pupils become more autonomous learners.
2. Enhancing confidence in tests and exams• Most assessments of pupil performance also used for other (often multiple)
purposes, e.g. measuring performances of teachers, schools and education system
• Far reaching consequences for those being judged by the data• Questions for policy and research:
• Reliable for these purposes?• Valid for these purposes?• Awareness of impact on classroom practice?
Adapted from Plomp, 2014
ARG: Teachers’ classroom assessment practices contravene their valuesWhy1. Ideals of Assessment for Learning confront reality of the
need to raise performance on next summative test2. Pressure on time, given national curriculum3. There is evidence of “tick-box culture”, i.e. assessment to
meet bureaucratic needs (SA compliance culture)4. Challenge of ‘scalability’: how to scale up good initiatives
into larger reforms5. Lack of attention in initial teacher education.
Bennett’s Models for thinking about assessmentAssessment for, of and as Learning: CBAL model(Bennett, 2010)
The competency model (Bennett, 2010)
Gordon Commission on the Future of Assessment in Education – USA (2011-2013)
• Created in 2011 (till 2013) to consider
- the nature and content of American education during the 21st century and
- how assessment can be used most effectively to advance that vision by serving the educational and informational needs of students, teachers and society
• “Throughout the long history of educational assessment in the United States, assessment has been seen by policymakers as a means of enforcing accountability for the performance of teachers and schools.”
• “ … other purposes of assessment get lost when the sole goal of states is to use them to obtain an estimate of how much students have learned in the course of a year.”
• ”More specifically, assessments must advance competencies that are matched to the era in which we live …”
Gordon, 2013
Important contributions to thinking about assessment in the 21st Century
International collaboration - Assessment and teaching of 21st Century skills• Final report: August 2011• For information: http://www.atc21s.org/• White papers on:
• Defining 21st Century Skills• Methodological Issues• Technological issues• New Assessments and Environments for Knowledge Building• Policy Frameworks for New Assessments http://www.atc21s.org
USA - National Research Council:Committee on Defining Deeper Learning and 21st Century Skills
Education for Life and Work: Developing Transferable Knowledge and Skills in the 21st Century
www.nap.edu
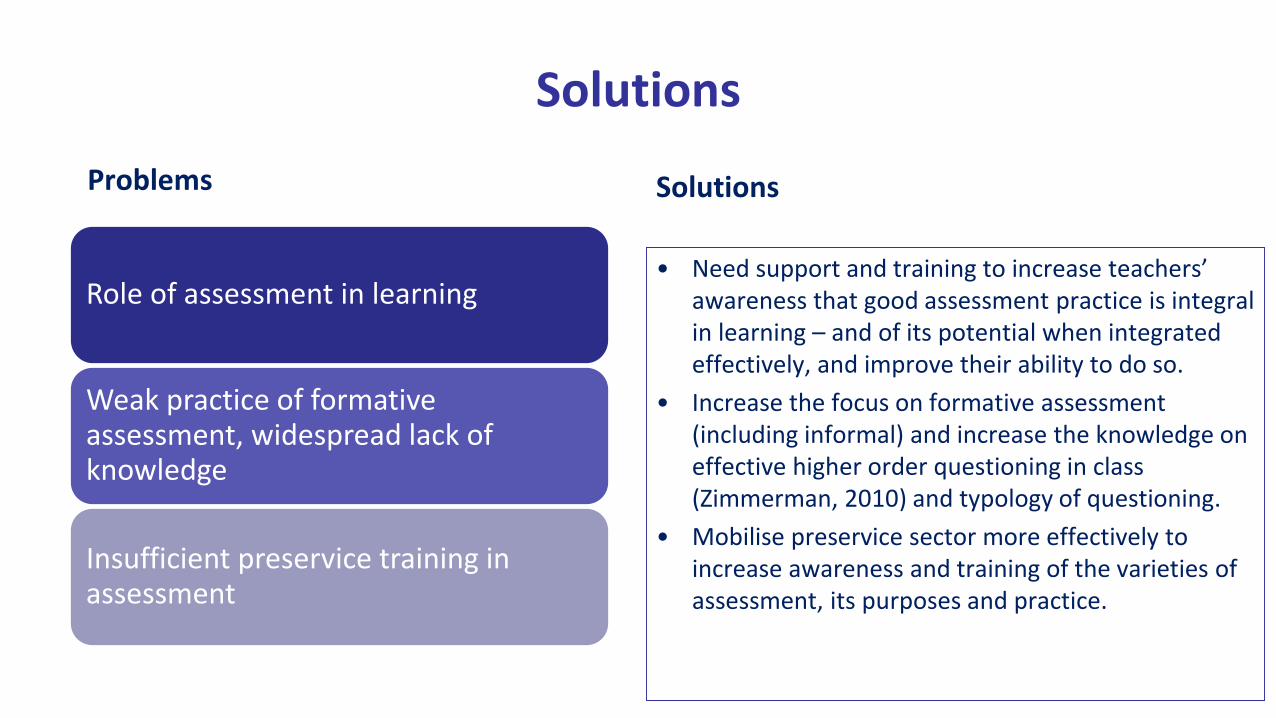
Problems
• Not full appreciation by teachers of the role of assessment in learning common across Africa (Januario, 2007), Du Plooy, 2015; Selemane-Mbewe),
• Weak practice of formative assessment, widespread lack of knowledge, despite some excellent examples (Zimmerman, 2010)
• Assessment has limited curriculum time in preservice training and needs greater emphasis and preservice lecturers need to keep abreast of developments (see Zimmerman & Long - TLEP)
Solutions
Problems
Role of assessment in learning
Weak practice of formative assessment, widespread lack of knowledge
Insufficient preservice training in assessment
Solutions
• Need support and training to increase teachers’ awareness that good assessment practice is integral in learning – and of its potential when integrated effectively, and improve their ability to do so.
• Increase the focus on formative assessment (including informal) and increase the knowledge on effective higher order questioning in class (Zimmerman, 2010) and typology of questioning.
• Mobilise preservice sector more effectively to increase awareness and training of the varieties of assessment, its purposes and practice.
The art of reporting on learner performance
The art of reporting
• Communication
– What is the message?
– Who is the primary audience?
– How should the message be used (Guskey & Bailey, 2001)
• Dissemination (Griffin, McGaw, & Care, 2012)
• Related to data use (Schildkamp, Lai & Earl, 2013)
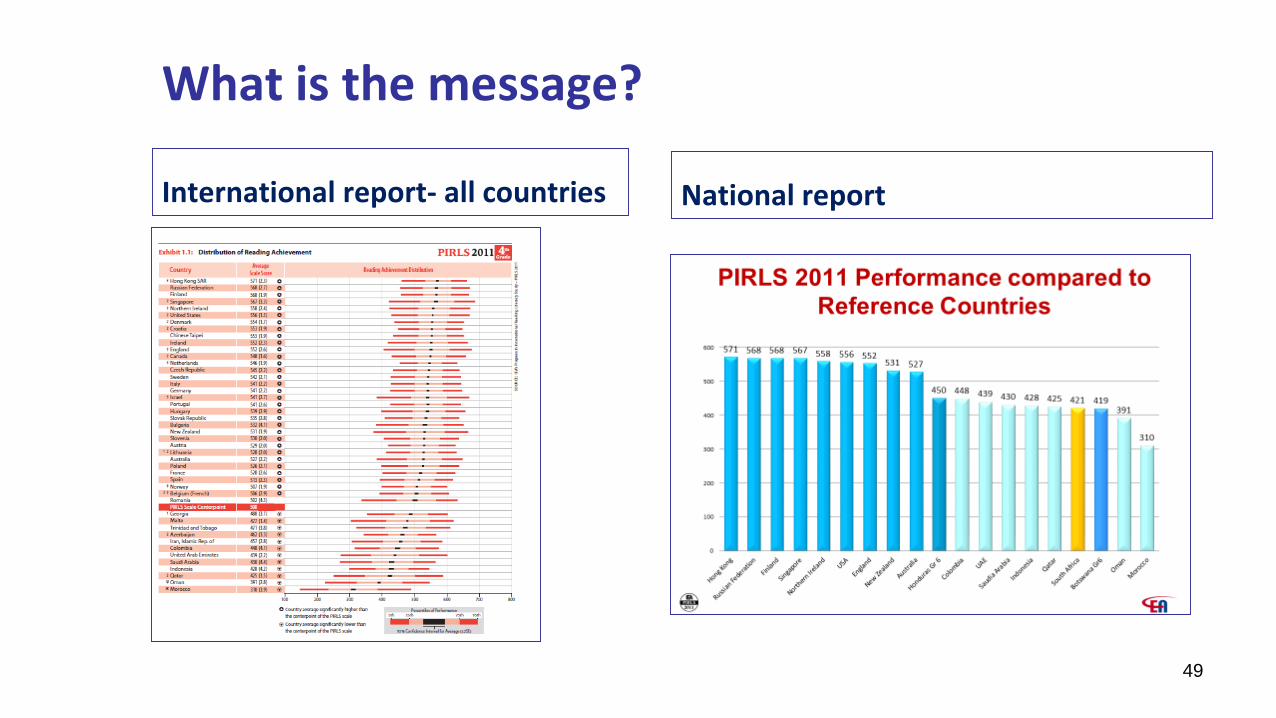
What is the message?
International report- all countries National report
49
What is the primary audience?
Purpose:
– Policy intervention and accountability
– School intervention
– Classroom intervention
– Societal awareness
50
Our School has identified three primary purposes for reporting student progress:1. To communicate student growth to parents and the broader community.2. To provide feedback to students for self evaluation.3. To document student progress and the effectiveness of instructional programs.
A critical element of any student's learning experience is the need for informed and meaningful feedback to those invested in the student's progress. Reporting on student progress must have a well defined purpose for it to be meaningful. It must clearly identify the information needing to be communicated, the audience it is intended for and how that information will be used to improve future or related learning.
South African National Policy Protocol documentPrinciples for recording and reporting:
1. Recording of learner performance is against the assessment task and reporting is against the total mark obtained in all tasks completed in a term. The promotion of a learner is based on the composite marks obtained in all four terms.
2. Teachers should show in their files that they have covered all the formal tasks set.
3. Achievement rating on a report card should be indicated by a combination of national codes, percentages and comments.17
4. The following is applicable to recording and reporting per phase: (a) Foundation Phase (Grades R – 3): Record and report in national codes and their achievement descriptions. (b) Intermediate Phase (Grades 4 – 6): Record and report in national codes and their achievement descriptions and percentages. (c) Senior Phase (Grades 7 – 9): Record and report in national codes and their achievement descriptions and percentages. (d) Grades 10 – 12: Record in marks and report in percentages.
5. The schedule and the report card should indicate the overall level of performance of a learner.
6. In the case of Languages, each language that the learner offers should be recorded and reported on separately according to the different levels on which they are offered. For example, Home Language – English, First Additional Language – IsiXhosa, Second Additional Language – Afrikaans Second Additional Language.
7. The number of formal assessment tasks to be recorded in each phase is provided in Chapter 4 of the Curriculum and Assessment Policy Statements.
8. The recorded pieces of evidence should reflect a variety of forms of assessment. More information on this is provided in Chapter 4 of the Curriculum and Assessment Policy Statements.
9. Teachers must report regularly to learners and parents on the progress of learners. Schools are required to provide feedback to parents on the programme of assessment using a formal reporting tool such as a report card. In addition to the report cards, other reporting mechanisms such as parents’ meetings, school visitation days, parent-teacher conferences, phone calls, letters, class or school newsletters, etc. may be used. The school will determine the format of these reporting strategies.
National Protocol for Assessment Grades R – 12, Government Notices No. 722 and No. 723, Government Gazette No. 34600 of 12 September 2011 and amended as: Government Notice No. 1115 and No. 1116, Government Gazette No. 36042 of 28, December 2012.
51
Dissemination of examination resultse.g. 2015 National Senior Certificate Examination: Diagnostic report
52DBE, 2015, pp.9
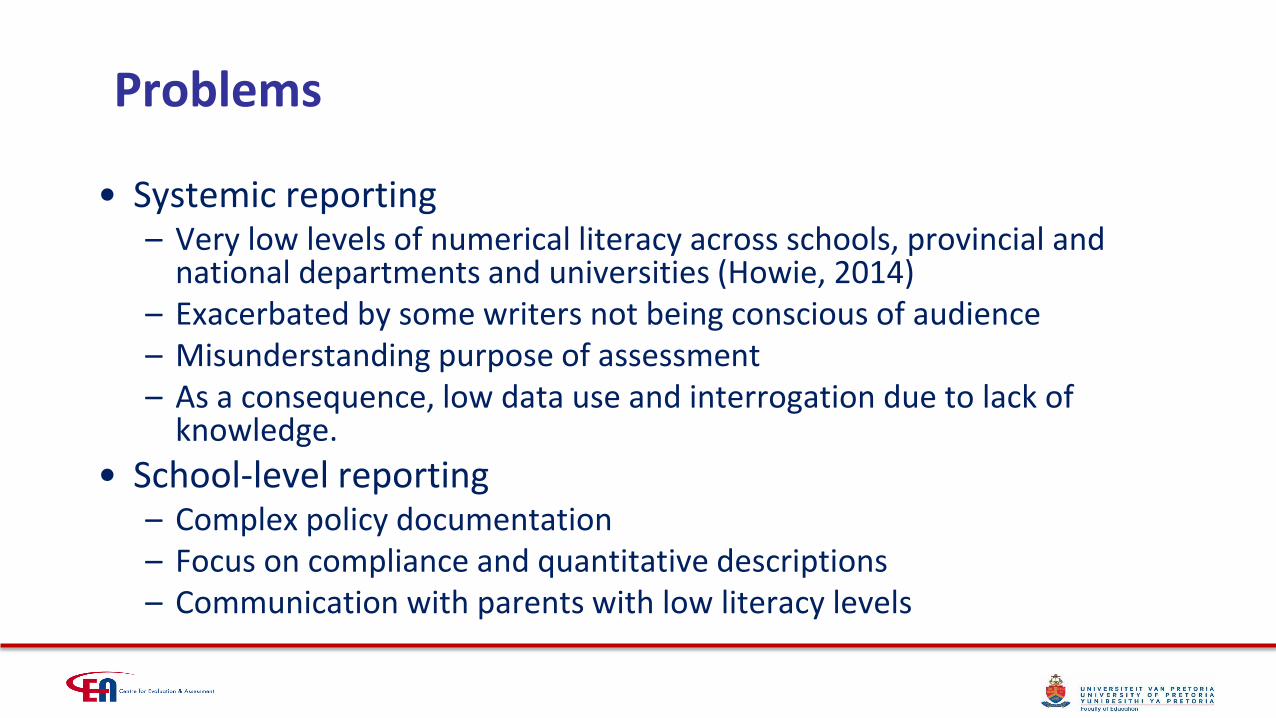
Problems
• Systemic reporting– Very low levels of numerical literacy across schools, provincial and
national departments and universities (Howie, 2014)– Exacerbated by some writers not being conscious of audience– Misunderstanding purpose of assessment– As a consequence, low data use and interrogation due to lack of
knowledge.
• School-level reporting– Complex policy documentation– Focus on compliance and quantitative descriptions– Communication with parents with low literacy levels
Solutions
Problems
Systemic reporting
School-level reporting
Solutions
• Teach teachers and other stakeholders how to interpret test results (Hoadley & Muller, 2016) in general regarding numerical literacy “Number is your friend”
• Emphasise sensitisation of audience and purpose of report
• Adopt principles of enhancing data use (see Schildkamp, Lai & Earl, 2013 )
• Assist schools in interpretation of policy protocols and simplify communication E.g 58 pages compared to 13 pages international examples.
• Emphasise need for enhancing communication to parents (also with limited literacy).
• Use available guidelines for better practice (Guskey & Baily, 2001 amongst others)
Standardised testing: the controversy
Sound familiar?
Educational reform in the United States has had a growing dependence on accountability achieved through large-scale assessment. Despite discussion and advocacy for assessment purposes that would assist learning, provide help to teachers’ instructional plans and execution, and give a broader perspective of the depth and breadth of learning, the general focus still remains on accountability, now elaborated with sanctions for schools and personnel.
(Baker & Gordon, 2014, p.1)
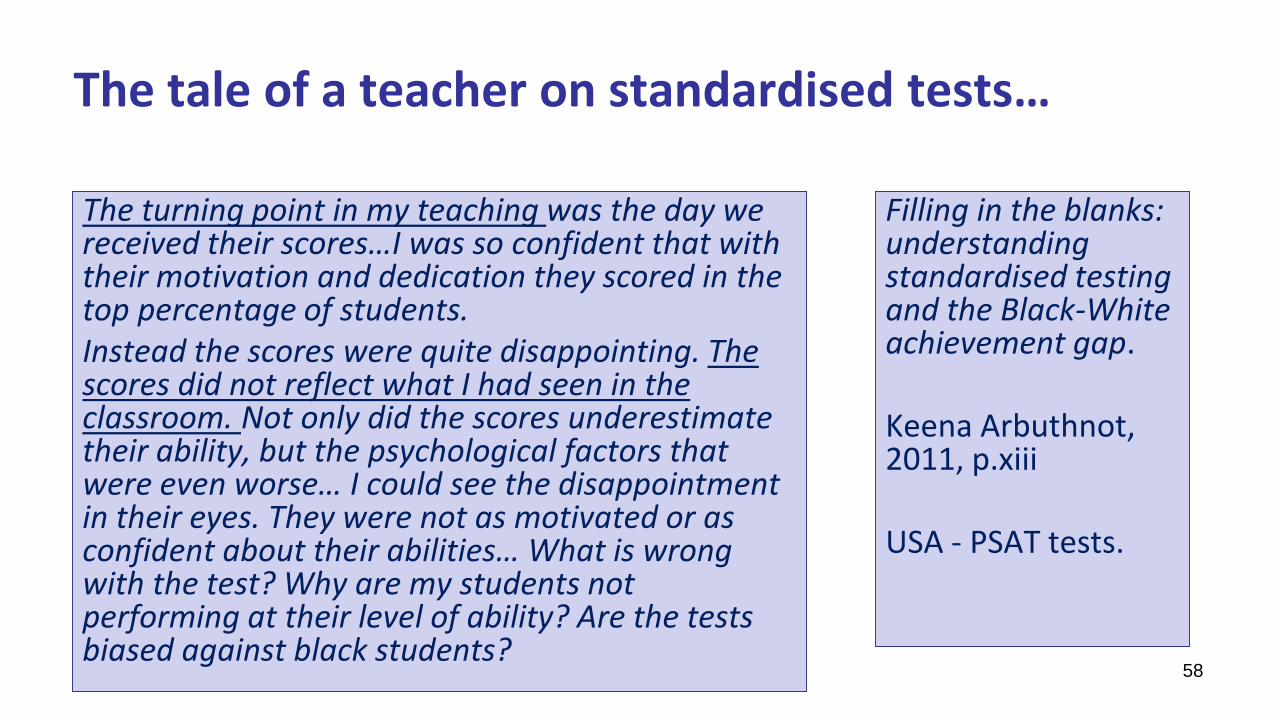
The tale of a teacher on standardised tests…
The turning point in my teaching was the day we received their scores…I was so confident that with their motivation and dedication they scored in the top percentage of students. Instead the scores were quite disappointing. The scores did not reflect what I had seen in the classroom. Not only did the scores underestimate their ability, but the psychological factors that were even worse… I could see the disappointment in their eyes. They were not as motivated or as confident about their abilities… What is wrong with the test? Why are my students not performing at their level of ability? Are the tests biased against black students?
Filling in the blanks: understanding standardised testing and the Black-White achievement gap.
Keena Arbuthnot, 2011, p.xiii
USA - PSAT tests.
58
Unintended consequences
– Standardised tests are often used inappropriately to drive high stakes decisions re pedagogical policies and practices (Howie, 2014, Yates, 2013)
– “Perverse effects” (Hoadley & Muller, 2016
– Potential Pedagogic benefits but competitive anxiety (Yates, 2013)
Positive Negative
More reliable grading Curricula narrowing
Backwash effect about what is important
Omission of other curriculum topics
Provides some indication of quality
Teaching to the test
Curriculum consistency across schools
May have negative psychological impact on teachers and learners
Clear signals to schools what to work on
“Competitive anxiety”
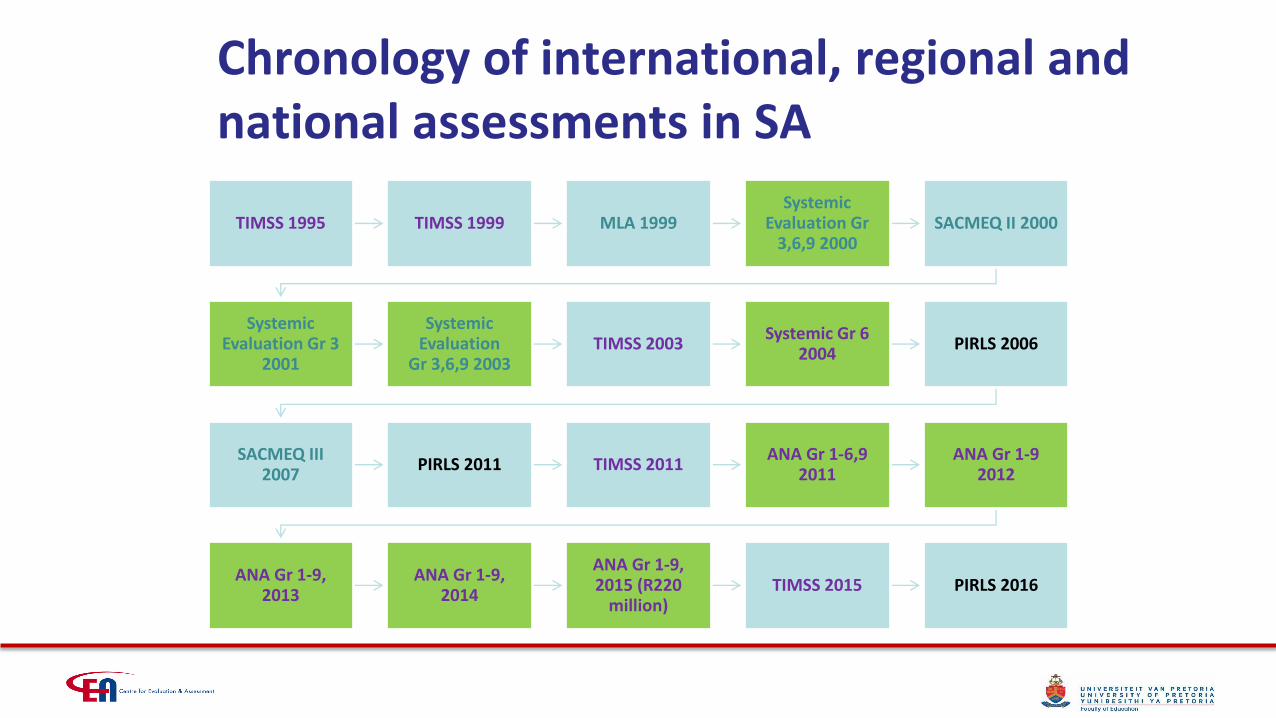
Chronology of international, regional and national assessments in SA
TIMSS 1995 TIMSS 1999 MLA 1999Systemic
Evaluation Gr 3,6,9 2000
SACMEQ II 2000
Systemic Evaluation Gr 3
2001
Systemic Evaluation
Gr 3,6,9 2003TIMSS 2003
Systemic Gr 6 2004
PIRLS 2006
SACMEQ III 2007
PIRLS 2011 TIMSS 2011ANA Gr 1-6,9
2011ANA Gr 1-9
2012
ANA Gr 1-9, 2013
ANA Gr 1-9, 2014
ANA Gr 1-9, 2015 (R220
million)TIMSS 2015 PIRLS 2016
South African Progress in International Reading Literacy (PIRLS) 2011 performance
South African Grade 5 (Eng/Afr) PIRLS benchmarked to selected countries Grade 4 learners
571
448 421419
310
0
100
200
300
400
500
600
mean score
South African Grade 4 learners reaching prePIRLSbenchmarks
29
12
10
31
38
29
57
36
34
24
53
47
6
15
19
0.2
0.8
0.1
0.1
0.25
0% 20% 40% 60% 80% 100%
South Africa
Afrikaans
English
isiNdebele
isiXhosa
isiZulu
Sepedi
Sesotho
Setswana
siSwati
Tshivenda
Xitsonga
AdvancedDid not reach low benchmark
Problems
• Controversy around international studies (Howie, 2015)– Very low performance– Issues of contextualisation
• Annual National Assessment (ANA) programme – too big, too soon, too often. Not yet matured. (Howie, 2013; Hoadley & Muller, 2016)– unintended consequences of the programme effects (Bennett, 2010) apply to ANA– weeks of practising for ANAs – reducing opportunity to learn– ANA has created a strong resistance by teachers and schools to external assessments
impacting other assessment-related research projects.– Immature system created credibility problems for whole system and all large-scale
assessments when used for accountability purposes and prematurely
• Insufficient resources provided for sustainable systems to match politicians ambitions• Lack of clarity of national vision on role of standardised tests and large-scale
assessments resulted in insufficient opportunities for sharing knowledge and expertise across groups conducting large-scale assessments
Solutions
Problems
Controversy around international assessments
ANA – too big, too soon, too often. Not yet matured.
Immature system created credibility problems for whole system and all large-scale assessments when used for accountability purposes
Insufficient resources for sustainable systems to match politicians ambitions
Lack of national vision on role of standardised tests and large-scale assessments
Solutions
• Rethink purpose and structure of national assessment programme and systemic testing. Design quality system before upscaling.
• Government needs to be realistic about its ambitions for national testing given its resources and re-design accordingly.
• De-link systemic testing from severe accountability measures, it is counter-productive
• Design affordable, sustainable, quality assessment system with clear achievable, valid objectives
• Create a national vision. Optimise already existing testing programmes and develop a quality, credible, valid and reliable system that provides meaningful data and information for action.
KEY QUESTIONS GOING FORWARD
Lots to think about……
Theme Key question (s)
Quality vs Quantity: the assessment debate How does South Africa utilise assessment systems and practices optimally without “killing the pig” in the process?
Alignment of the Curriculum, Instruction and Assessment
How does South Africa realise effective, equal opportunities to learn whilst attaining the formal curriculum’s national standards?
Assessment ensuring effective Teaching and Learning What strategy(ies) would be best to make all South African teachers effective/competent “agents of change” regarding assessment practice?
The art of reporting on learner performance How should South Africa report systemic test results so as to provide optimal information about performance-related teaching and learning processes in the schools?
Standardised testing: the controversy What are the characteristics of an effective national assessment programme to monitor learner performance and national progress in South Africa?
Given that “no measurement model is sacrosanct” (van der Kamp, 1992), how should we measure the quality of education?
CONCLUSION
Change is process, not an event!
• Not reasonable to expect schools and teachers to change at ‘a point in time’ (Plomp, 2014) but yet we have required them to do so many times – without necessary stability, support & resources.
• Schools may need to introduce new elements gradually into their curriculum and pedagogical (including assessment) approaches (Plomp, 2014)
• Schools should be able to decide on different emphases and priorities within their schools – they know their needs best.
• Moving from mastery of specific subject content matter to “deeper learning” involves changes in situation or context (Baker & Gordon, 2014) and in South Africa may take significantly more time.
Assessment Challenges
“The assessments that we will need in the future do not yet exist.” Gordon Commission (2013)
• Needs to transform assessment purpose and use, and improve resources and capacity.
• Need to improve weak assessment literacy of teachers, principals, all levels of government departments.
• Like the USA, South Africa needs to commit to a medium-long term (10-year) research and development effort to strengthen the capacity of the assessment field.
• Education has to reflect changes in our society and the context should be taken into account as there is no one approach for all systems, schools, teachers, and subjects.
• In preparing for the future Bennett (2014) suggested 13 issues to address. Currently some are doable whilst others are challenges to implement in South Africa.
Relationship between vision on assessment and data collected
• Data by themselves don’t answer questions
• Interaction between data and people that results in decisions that creates harm or beneficial effects
• Need to consider:
– Data is part of a larger policy and political context – ignoring context can be problematic
– Quality – of data, of decisions and action taken?
– How do we know what data makes a difference – what kind of difference? (Earl & Louis, 2013, 193-194)
69
Coming back to the question…
After 22 years, it is time to use assessment as a means towards
References• Arbuthnot, K. (2011). Filling in the blanks: Understanding standardised testing and the black-white achievement gap. Charlotte: IAP
• Archer, E., Scherman, V & Howie, SJ. (2012). Approaches to Effective Data Use: Does One Size Fit All? In K. Schildkamp,. M. K. Lai, & L. Earl. (Eds). Data-Driven Decision Making Around the World. Challenges and Opportunities. Dordrecht: Springer.
• Bennett, R. (2010). Cognitively Based Assessment of, for, and as Learning (CBAL): A Preliminary Theory of Action for Summative and Formative Assessment. Measurement, 8: 70–91, 2010.
• Binkley, M., Erstad, O., Herman, J., Raizen, S., Ripley, M., Miller-Ricci, M., & Rumble, M. (2012). Defining Twenty-First Century Skills. In Griffin, P., Care, E., & McGaw, B. Assessment and Teaching of 21st Century Skills, Dordrecht, Springer.
• Griffin, P., Care, E., & McGaw, B. Assessment and Teaching of 21st Century Skills, Dordrecht, Springer.
• Guskey, T.R. & Bailey, J.M. (2001). Developing grading and reporting systems for student learning. Thousand Oaks: Corwin Press.
• Howie,S.J. (2014) High-stakes testing in South Africa: Friend or Foe? In Theo Eggen and Gordon Stobart (Eds). High-Stakes Testing in Education: Value, fairness and consequences. London: Routledge.
• Long, C and Dunne, T. ( ). Understanding monitoring systems in different contexts: a focus on curriculum development, teacher agency and monitoring systems: A proposed monitoring system to support teaching and learning in a changing society.
• OECD (2016) South Africa, in OECD Economic Outlook, Volume 2016, Issue 1, OECD Publishing, Paris
• Plomp, T. (2014) 21st Century Skills – curriculum & implementation perspective. Presented in Singapore in 2014.
• Scheerens, J., Glas, C. & Thomas, S. M. (2003). Educational Evaluation, Assessment & Monitoring: A systemic approach. Lisse: Swets & Zeitlinger.
• Schildkamp, K., Lai, M.K. & Earl. (2013) (Eds). Data-based decision making in education: Challenges and Opportunities. Dordrecht: Springer.
• Statistics South Africa. Census 2001 report. Statistics South Africa: Pretoria.
• Statistics South Africa. Facts sheet. Census 2011. Statistics South Africa: Pretoria.
• Taylor Fitz=Gibbon, C. (1992). Monitoring Education. London: Continuum.
• van den, Akker, J., Hameyer, U., & Kuiper, W. (Eds.) (2003). Curriculum landscapes and trends. Dordrecht: Kluwer Academic Publishers.
• Vedder, P. (1992) (Ed). Measuring the quality of education. Lisse: Swets & Zeitlinger.