+ All Categories
Home > Documents > Automation risk in the EU labour market A skill-needs approach · 2 Acknowledgments This paper has...

Automation risk in the EU labour market A skill-needs approach · 2 Acknowledgments This paper has...

Date post: 18-Sep-2019
Category:
Upload: others
View: 4 times
Download: 0 times
Share this document with a friend
37
Automation risk in the EU labour market A skill-needs approach Konstantinos Pouliakas European Centre for the Development of Vocational Training (Cedefop), University of Aberdeen Business School and IZA [Unedited proof copy]
Transcript

Automation risk in the EU labour market

A skill-needs approach

Konstantinos Pouliakas

European Centre for the Development of Vocational Training (Cedefop), University of Aberdeen Business School and IZA

[Unedited proof copy]

2

Acknowledgments

This paper has been authored by Cedefop expert Konstantinos Pouliakas, using data from

Cedefop’s European skills and jobs survey. It has benefitted from valuable comments by

Terence Hogarth, Giovanni Russo, Pascaline Descy and from in-depth discussions on

automation with Seamus McGuinness and Paul Redmond. The author gratefully

acknowledges Daniel Scheuregger and Dafni Georgiou for their assistance with the text

mining approach employed in the paper. The views expressed in the paper are solely the

authors’ and do not necessarily represent those of the European Centre for the Development

of Vocational Training (Cedefop). The usual disclaimer applies.

Contact information: Mr. Konstantinos Pouliakas, Cedefop, Europe 123, Thessaloniki (Pylaia), 57001; Tel: +030 490 292; email: [email protected].

3

Abstract

This paper focuses on identifying determinants of ‘automatability risk’, namely the propensity

of EU employees being in jobs with high risk of substitutability by machines, robots or other

algorithmic processes, and uncovers its impact on labour market outcomes. Using relevant

data on tasks and skill needs in jobs, collected by the European skills and jobs survey

(ESJS), jobs are bundled according to their estimated risk of automation. The paper builds

on the methodology of previous studies that estimate the latent relationship between ‘true’

automatability and job tasks (Frey and Osborne, 2013 and 2017; Arntz et al., 2016;

Nedelkoska and Quintini, 2018) but utilises highly disaggregated job descriptions provided by

a subsample of the ESJS, as well as information on jobs’ skill requirements. About 14% of

EU adult workers are found to face a very high risk of automation. The distribution of high

automatability across industries and occupations is also found to be skewed towards routine

jobs with low demand for transversal and social skills. The risk of job displacement by

machines is higher among males and lower-skilled workers, with little evidence of

polarisation. It is prevalent in private sector jobs that fail to provide remedial training to

employees, accentuating the vulnerability of at-risk-workers and highlighting the need for

stronger lifelong learning policies at EU level.

4

Contents Contents .............................................................................................................. 4

List of Figures ............................................................................................... 5

List of Tables ................................................................................................ 5

1. Introduction ................................................................................................... 6

2. Literature Review .......................................................................................... 8

3. Data and descriptive statistics .....................................................................10

3.1. The European skills and jobs survey ................................................10

3.2. Sample and key variables ................................................................11

4. Empirical methodology ................................................................................12

4.1. The skills/tasks-occupational approach ............................................12

4.2. Estimating the latent automatability-skill needs relation ....................14

5. Multivariate analysis ....................................................................................17

5.1. Risk of automation in EU job markets ...............................................17

5.2. Determinants of jobs at risk of automation ........................................21

5.3. Labour market outcomes and the risk of automation ........................26

6. Conclusions .................................................................................................28

List of abbreviations .....................................................................................30

References ..................................................................................................31

Annexes ......................................................................................................34

5

List of Figures

Figure 1: Share of EU28 adult workers at risk of automation by degree of risk ...20

Figure 2: Mean probability of automation by 2-digit occupation ..........................25

Figure 3: Mean probability of automation by industry ..........................................26

List of Tables

Table 1: ESJS variables corresponding to FO identified engineering bottlenecks13

Table 2: Estimation of latent relationship between ‘true’ automatability and skill

requirements/tasks of jobs, logistic regression estimates, EU28................19

Table 3: Determinants of risk of automation, OLS and logistic estimates, EU28 .22

Table 4: Labour market impact of automation risk, OLS estimates, EU28 ..........27

6

1. Introduction

Recent years have seen an upsurge in the number of new research and policy studies, and

associated media attention, focusing on the impact of technological change on employment,

reskilling needs and overall implications about the future world of work (Bessen, 2015; Ford,

2015; World Economic Forum, 2016). Such increasing attention has been a consequence of

the acceleration in new technological advances linked to the so-called ‘fourth industrial

revolution’ (Schwab, 2016), which is thought to have exerted marked effects on both

advanced and emerging labour markets. Recently collected EU-wide data by the European

Centre for the Development of Vocational Training (Cedefop) have revealed, for instance,

that about 43% of adult employees in the EU labour market experienced changing

technologies, such as new ICT systems or machinery, in their workplace in the past five

years (Cedefop, 2017 and 2018).

Most of the recent literature has alternated between what may be called ‘doom and

gloom’ and ‘boon’ scenarios. On the one hand, some scholars have claimed that close to a

half of jobs in advanced economies are ‘susceptible’ to automation by robots and new

technologies (Frey and Osborne, 2013). Their arguments reflect the fact that economies and

societies are said to be at a critical turning point, a ‘second machine age’, in which rapid

technological advances associated with machine learning, artificial intelligence, 3D printing,

visual-space perception, natural language processing, among others, are likely to cause an

exponential or ‘combinatorial’ social transformation in the near future (Brynjolfsson and

McAfee, 2014; 2017). On the other hand, advocates of the positive consequences of

technical progress tend to highlight that embodied technical change is usually associated

with a net employment and labour market balance (Vivarelli, 2014; Bessen, 2016; Autor,

2015).

The aim of this paper is to engage in an in-depth investigation of the determinants of

‘automatability risk’ in EU jobs, namely the propensity of EU employees to be in jobs with a

high risk of substitutability by computers or other automation processes. Using relevant data

on tasks and skill needs in jobs, collected as part of the European Skills and Jobs Survey - a

survey of approximately 49 000 EU adult workers in the 28 EU Member States (Cedefop,

2015) - jobs are bundled according to their estimated risk of automation. The methodology

builds on previous assessments of Frey and Osborne (2013) and Nedelkoska and Quintini

(2018) and provides further insight by enabling estimation of the relationship between jobs’

task/skill content and automatability risk using individual-level data with highly disaggregated

job title information. Overall, the analysis confirms well-reported estimates of automatability

risk across different industries and occupational categories, with marked consequences for

labour market outcomes. It is also found that the risk of automation is particularly stark

among men and lower-skilled workers and is associated with jobs in which employee training

is not provided, hence accentuating the vulnerability of at-risk workers.

Section 2 engages in a brief review of the enormous literature that examines the

relationship between technological change, innovation and the impact of automation on

7

labour market outcomes, such as employment or wages. Section 3 describes the data and

discusses the key variables used in the analysis. Section 4 subsequently outlines in detail

the methodological process employed in order to estimate the latent relationship between

automation risk and skill requirements/tasks in jobs and, hence, infer the mean automation

probability in EU job markets. Section 5 subsequently investigates the determinants of

automation risk by engaging in multivariate regression analysis, while it also explores its

correlation with various labour market outcomes, including earnings, job satisfaction, job

insecurity and skills obsolescence. Section 6 provides a conclusion.

8

2. Literature Review

Concerns about changing technologies fostering technological unemployment and the

substitution of machines for labour have featured prominently in all industrial revolutions and

ages (Keynes, 1933; Mokyr et al., 2015; Autor, 2015). Empirical studies of the impact of

technological progress on economic and social outcomes therefore abound in the literature,

including those that attribute rising wage inequality and returns to college education since the

early 1980s to skill-biased technological change (SBTC) (Katz and Murphy, 1992; Berman et

al., 1998; Katz and Autor, 1999), as evidenced by a positive association between computer

use and other proxies of technology (e.g. R&D intensity) with skills upgrading (Krueger,

1993; Machin and van Reenen, 1998; Autor et al., 1998).

Such an explanation, however, fails to take into account the non-linearities in growth of

the employment structure observed across some advanced economies, most notably the

widening polarisation of the occupational distribution, which gave rise to theories of routine-

biased technological change (RBTC). Starting with Autor et al. (2003), these theories

emphasised the potentially disruptive effects of technical change on occupations heavily

reliant on routine, non-complex tasks that can be easily codifiable by robotic or algorithmic

processes (Autor et al., 2006; Autor and Dorn, 2013; Goos et al., 2009; Acemoglu and Autor,

2011; Handel, 2012).

Consistent with the RBTC hypothesis, recent studies have sought to estimate the

susceptibility of occupations and jobs to automation. Such estimates are calculated on the

basis that some professions are more frequently characterised by a set of ‘conducive’ task

characteristics (e.g. routine or manual tasks, standardised job content, infrequent social

interactions, precise physical or hand-arm movement) that can render them vulnerable to

robotic processing or algorithmic coding/standardisation. These are in contrast to some

tasks/skills that constitute ‘engineering bottlenecks’ to automation, including problem-solving

or social intelligence, caring, perception and situational adaptability.

Applying this framework, Frey and Osborne (2013) estimated that 47% of occupational

categories in the US labour market are at high risk of automation, mostly middle- and low-

skilled professions (e.g. data entry clerks, telemarketers, transportation, librarians). Recent

studies have also tended to demonstrate that increasing robotic adoption in advanced

economies has exerted non-negligible effects on employment, wages (including a declining

labour income share) and hours of work, though such negative impacts affect workers of

different skill levels differently and are dependent on labour supply and demand elasticities

and product market substitutability (including geographical proximity) (Graetz and Michaels,

2015; Acemoglu and Restrepo, 2016, 2017; Dauth et al. 2017).

Arntz et al. (2016) and more recently Nedelkoska and Quintini (2018) dismiss such high

figures on the grounds that they potentially exaggerate the extent to which occupations as a

whole can be automated. Accounting for the fact that workers who may be classified within

the same occupational group may perform a different portfolio of tasks, about 9-14% of jobs

are found to be at a high risk of being automated, defined as jobs where at least 70% of the

9

tasks are automatable, though a large share (about one third) of all jobs face some smaller

degree of automatability. Similar scepticism and reflection on ‘why so many jobs exist today’

have been expressed by Autor (2015), who notes that most of the pessimistic literature fails

to adequately acknowledge the Polanyi paradox (‘we can know more than we can tell’) and

since human judgement, adaptability and intuition (often beneath our conscious appreciation

as they tend to be transmitted via culture, tradition and evolution) are features of jobs that

cannot be easily automated.

Another strand of related literature, focussing on the relation between innovation and

employment or skills bias (Vivarelli, 2014 and 2015), further tends to argue that claims of

negative consequences of technology are potentially exaggerated. Once one takes into

account various compensatory price, scale or income effects arising from greater product (as

opposed to process) innovation – such as lower prices of high-tech consumer goods and

new product markets that stimulate higher aggregate demand – and other externalities and

spillover effects across industries and occupations, technological innovation has been

historically associated with a positive net employment premium (Van Reenen, 1997; Pantea

et al., 2014; Vivarelli, 2015; Pellegrino et al., 2017; Piva and Vivarelli, 2017).

While historical evidence tends to dismiss widespread fears of robots and machines

replacing human input, concerns about a jobless future of work are nevertheless sustained

and have recently intensified (Hogarth, 2017). Part of the reason is that recent

advancements in digital technology, such as machine and deep learning and mobile robotics,

have raised the prospect of automation affecting a wider range of jobs dependent on

cognitive/non-routine tasks (e.g. accountancy, logistics, legal works, transportation,

translation, financial analysis, medical diagnostics, text writing), previously thought to be out

of reach of computers (Frey and Osborne, 2017).

10

3. Data and descriptive statistics

3.1. The European skills and jobs survey

In this paper we use data from ESJS to identify the risk of automation across a sample of EU

employees as well as how such risk varies across different socioeconomic determinants and

affects labour market outcomes. The ESJS is a state-of-the-art survey of adult employees

(aged 24-65) carried out in the 28 Member States of the European Union, collecting

information on the match of their skills with the skill needs of their jobs (1). It was financed

and developed by the Cedefop, in collaboration with a network of experts, the Organisation

for Economic Co-operation and Development (OECD), and the European Foundation for the

Improvement of Living and Working Conditions Agency (Eurofound) (Cedefop, 2015). The

aim of the survey is to help inform the development of European policies on initial and

continuing education and training and employment policies. To do so, it seeks to understand

how individuals’ qualifications and skills are matched (or not) to the changing skill demands

and task complexities of their jobs. The survey also examines the extent to which employees’

skills are developed and used in their workplaces over time.

A mixed online-telephone methodology ensured that the data collected provided a

representative sample of the adult working age population in each of the EU28 Member

States (2). The survey was carried out using quota sampling by the survey company Ipsos

MORI and its network partners in each country between 7 March and 26 June 2014. In total,

48 676 respondents from different demographic groups took part either by telephone (9 154

employees) or online interviewing (39 522 employees). In most EU countries about 1 000-

1 500 employees were effectively interviewed, although the sample varies between

countries. The sample was augmented to 4 000 observations in the case of five large EU

labour markets (Germany, France, Poland, Spain and the UK), 3 000 cases for Italy, and

2,000 cases in Greece and Finland, while 500 individuals were surveyed by telephone in

each of the three smallest countries (Cyprus, Luxembourg and Malta) (3).

1 For full details of the survey and to download the microdata the reader is referred to:

http://www.cedefop.europa.eu/en/events-and-projects/projects/european-skills-and-jobs-esj-survey 2 According to Forth, J. (2016), minimisation of design effects can be achieved in the ESJS by treating its

sample design as akin to that of stratified cluster sampling. Furthermore, Cedefop (2015) demonstrates that

the ESJS sample produces comparable survey estimates with those originating from other random

probability surveys (ESWC, PIAAC) on similarly-defined survey items. 3 The questionnaire was translated into the national languages of the EU countries using a strict translation

protocol, managed by Ipsos MORI. Prior to administering the survey, extensive cognitive and pilot tests took

place to validate the content and validity of the survey instrument. For details, see Cedefop (2015).

11

3.2. Sample and key variables

To estimate the risk of automation affecting European workers’ jobs, the analysis adopts a

similar methodology to that of previous approaches that have moved beyond the

occupational level of analysis used by Frey and Osborne (2013 and 2017). In particular,

Arntz et al. (2016) and Nedelkoska and Quintini (2018) exploit the unique data on tasks

available in the OECD’s Survey of Adult Skills (PIAAC), to estimate the micro relationship

between workers’ job tasks and the risk of automatability. As discussed above, such an

approach accounts for the marked variation in tasks that exists within occupations.

The use of the ESJS data in this paper enables the replication of the aforementioned

approach, albeit it exploits a key value-added of the new survey, namely it contains

information on a series of different skill sets needed in EU employees’ jobs. Specifically, the

survey asked respondents to assess the importance of a set of eleven different skills needed

for their jobs (4). It also collected information on the frequency of engaging in routine,

autonomous or learning tasks at work. The ESJS also contains important contextual

information, such as a standard set of control variables capturing demographic,

socioeconomic and job characteristics of the EU employee workforce (age, gender, level of

education, native status, firm size, type of contract, economic sector, occupation, etc.).

Of specific relevance for the paper’s analysis is the fact that information at the one- and

two-digit international standard classification of occupations was collected for all ESJS

respondents. Individuals in the online part of the survey were asked to identify their broad

one- and two-digit occupation based on pre-existing drop-down lists, which contained

detailed examples of four-digit occupations. For those who had difficulty identifying their

broad occupational group, a follow-up question asked them to identify the name and title of

their jobs. In the telephone interviews, all individuals were also asked to describe ‘what kind

of work they do most of the time’ and this detailed job description was subsequently coded

back to the broader one- and two-digit ISCO groupings by the survey company Ipsos MORI.

Together, about 14 097 respondents (circa 29% of the total ESJS sample) provided detailed

information about their job title/work description. In section 5 below we exploit this uniquely

detailed level of occupational information to engage in estimation of the risk of automation in

EU job markets.

4 The set of skills assessed in the ESJS included the level and importance of literacy, numeracy and ICT skills,

as well as the degree of importance of technical, communication, team-working, foreign-language, customer-

handling, problem-solving, learning and planning/organisational skills. Respondents were asked to assess

‘On a scale from 0 to 10, where 0 means not at all important, 5 means moderately important and 10 means

essential, how important are the following for doing your job?’.

12

4. Empirical methodology

4.1. The skills/tasks-occupational approach

In order to calculate the share of EU jobs susceptible to automation, namely those whose

majority of tasks may be codified using state-of-the-art computer equipment and machine

learning (ML) and artificial intelligence (AI) methods (conditional on the availability of big

data), this paper adopts the standard methodology used in previous literature. In particular,

information on the ‘true’ likelihood of automation from a selected set of 70 detailed (4-digit)

occupations is used (the so-called ‘training dataset’), as collected by Frey and Osborne

(hereby FO) on the basis of expert opinions. FO subsequently relied on the views of ML

specialists to identify three so-called ‘engineering bottlenecks’ (corresponding to nine O*NET

variables), namely tasks which, given the current state of art of technology, are difficult to

automate. By modelling the underlying latent probability of ‘true’ automation as a function of

the feature vector of nine bottleneck variables, FO extend their out-of-sample prediction of

automation risk to about 702 occupations.

In this study, corresponding information on tasks and skill needs in the ESJS dataset is

used that can be mapped or proxy for the engineering bottlenecks of FO, albeit in some

cases imperfectly. The aim is to unearth the underlying latent empirical relationship between

the variance in skill needs within occupations and the probability of automation, the latter

inferred by the FO training dataset, in a similar manner to the task-based methodology

employed by Arntz et al. (2016) and Nedelkoska and Quintini (2018).

Table 1 below illustrates the correspondence between ESJS-related variables and FO’s

‘engineering bottlenecks’ (5). It is clear that while on most occasions there is reasonable

connection between the two, for some, most notably those descriptive of work posture and

the provision of care for others, there is a poor or absent link. Nevertheless, it can be

confirmed that the ESJS variables can be broadly mapped to the main matrix of descriptors

identified in the task-based literature, namely routine-cognitive-interactive-manual tasks

(Acemoglu and Autor, 2011; Autor, 2013).

5 The ESJS data also enables exploration of additional features conducive to job automation, not explicitly

accounted for in the FO approach, namely the degree of ‘standardisation’ and ‘digitisation’ of job content. In

particular, ESJS respondents were asked to assess the level of numeracy and ICT skills needed in their

jobs. A priori, it is expected that jobs dependent on advanced numerical skills (defined in the ESJS as

‘calculations using advanced mathematical or statistical procedures’) or advanced digital skills (defined as

‘developing software, applications or programming; use computer syntax or statistical analysis packages’)

will be more susceptible to automation, given that tasks in such jobs should be more easily specified to be

performed by advanced machine learning techniques.

13

Table 1: ESJS variables corresponding to FO identified engineering bottlenecks

Bottleneck FO O*NET

Variable

O*NET definition ESJS variable ESJS definition

Perception manipulation

Finger dexterity The ability to make precisely coordinated movements of the fingers of one or both hands to grasp, manipulate or assemble very small objects

Technical skills Specialist knowledge needed to perform job duties; Knowledge of particular products or services; Ability of operating specialised technical equipment

Manual dexterity The ability to quickly move your hand, your hand together with your arm, or your two hands to grasp, manipulate or assemble objects

Cramped work space, awkward positions

How often does this job require working in cramped work spaces that requires getting into awkward positions?

NA

Creative intelligence

Originality The ability to come up with unusual or clever ideas about a given topic or situation, or to develop creative ways to solve a problem

Problem solving skills

Thinking of solutions to problems; Spotting and working out the cause of problems

Learning skills Learning and applying new methods and techniques in your job; adapting to new technology, equipment or materials; Engaging in own learning

Learning tasks How often, if at all, does your job involve ‘learning new things’?

Non-routine tasks

How often, if at all, does your job involve ‘responding to non-routine situations during the course of your daily work’?

Autonomous tasks

How often, if at all, does your job involve ‘choosing yourself the way in which you do your work’?

Fine arts Knowledge of theory and techniques required to compose, produce and perform works of music, dance, visual arts, drama and sculpture.

NA

Social intelligence

Social perceptiveness

Being aware of others’ reaction and understanding why they react as they do.

Team working skills

Cooperating and interacting with co-workers; dealing and negotiating with people

Negotiation Bringing others together and trying to reconcile differences.

Planning and organisation skills

Setting up plans and managing duties according to plans; Planning the activities of others; Delegating tasks; Organising own or other’s work time

Persuasion Persuading others to change their minds or behaviour.

Foreign language skills

Using a language other than your mother tongue to perform job duties

Communication skills

Sharing information with co-workers/clients; Teaching and instructing people; Making speeches or presentations

Assisting and caring for others

Providing personal assistance, medical attention, emotional support, or other personal care to others such as co-workers, customers or patients.

Customer handling skills

Selling a product/service; Dealing with people; Counselling, advising or caring for customers or clients

Source: Author’s own classification based on Frey and Osborne (2017)

14

4.2. Estimating the latent automatability-skill needs relation

A key challenge of the above exercise is to find a match between the 70 detailed occupations

in the FO training dataset, derived from the United States Bureau of Labor Statistics (US

BLS) Standard Occupational Classification System, with corresponding occupational classes

in the ESJS. Obtaining an exact identification is however difficult given that most micro

datasets, including the ESJS, typically contain information at reasonable levels of sample

accuracy for broader occupational levels. A similar assignment problem has been faced by

Arntz et al. (2016), who use a multiple imputation approach to match the FO automatability

indicator to the US PIAAC sample data based on available 2-digit ISCO codes. Nedelkoska

and Quintini (2018), by contrast, achieve a closer correspondence between the 70 hand

labelled occupations in FO’s training data and a subset of 4-digit occupational classes. To do

so, however, they have had to rely only on the Canadian sample of the PIAAC dataset, which

has a substantially larger sample size than any other country in the international OECD

survey.

This study exploits the uniquely detailed information on workers’ job descriptions

available in the ESJS to estimate automation risk in EU job markets. In particular, the

analysis exploits the fact that the ESJS microdata contains detailed job titles and work

descriptions for about 14 097 respondents (6) from all EU28 countries (7) (circa 29% of the

total ESJS sample) and has engaged in (quasi) text mining analysis, involving information

and concept/entity extraction as well as text clustering. In particular, the detailed job

descriptions have been matched, using a reasonable proximity of keywords, with the

occupations in the FO training dataset. To achieve a good match, appropriate keywords,

clues and recurrent grammatical and syntactical structures have been used that constitute

‘close descriptors’ of the minor FO training occupations, as described in the relevant US

SOC and ISCO-08 taxonomies. As an additional quality control check, it has been ensured

that the identified detailed job descriptions from the ESJS are loosely constrained to the

broader 2-digit ISCO-08 group(s) containing the FO 4-digit training occupations (8).

6 The final number of cases with valid detailed job descriptions has been derived after a number of steps

made to ‘clean’ the respective variable; in particular, all entries were first made upper case, multiple blank

spaces were made visible and amended, while missing values (including anomalous entries such as ‘??’,

“…”) were made visible and dropped. Several redundant answers (such as ‘null’, ‘null.’, ‘no’, ‘none of your

business’, ‘no comment’, ‘I don’t know’, ‘Nothing, ‘I don’t want to disclose’, ‘N/A’, ‘not applicable’ etc.) were

identified and deleted.

7 A notable feature of this detailed data capturing adult workers’ job profiles is that the survey company Ipsos

MORI used national linguists to translate the information from the respective national language of each

respondent into English. 8 For instance, the identified matched job descriptions for ‘Civil engineers’ have been constrained to match

only cases consistent with the group ISCO-08 21 ‘Science and engineering professionals’, whereas the

cluster linked to ‘Civil engineering technicians’ was restricted only to cases within the broader group ISCO-08

31 ‘Science and engineering associate professionals’.

15

As an example of the abovementioned process, to match the ESJS job title string

variable to a detailed FO occupational group, say ‘cashiers’, keywords such as ‘cashier’,

‘checkout assistant’ and ‘checkout attendant’ were used, together with clues (‘cash register’,

‘cash’) and relevant descriptive syntax (‘ticket issuing’). These keywords were derived from

the descriptions of the respective occupation in either the US BLS SOC system or the

International Labour Organisations’ (ILO) ISCO-08 group definitions (9). A similar process

has been employed for the remaining 67 occupations in the training dataset (10).

As an outcome of this analysis, approximately 3 471 matches were achieved with 68 of

the original FO training occupations, corresponding to 7% of the total ESJS sample (and

25% of the subsample with non-missing job descriptions). As can be seen in Annex

Figure A1, a majority of matches were realised for some common occupations (accountants,

maids and housekeeping cleaners, cashiers, chefs/chief cooks, waiters, nurses, industrial

truck and tractor operators), while other narrower or more specific occupations were

characterised by weaker filtering outcomes (e.g. paralegals/legal assistants, physicists,

technical writers, parking lot attendants, zoologists). Nevertheless, the fact that the ESJS

data have allowed for such detailed matching of the FO occupational list with specific job

titles of employees from different EU countries constitutes a value-added in the literature. In

particular, it enables estimation of the underlying function between the ‘true’ automatability

risk and skill needs of jobs based on a pooled sample of all EU countries, as opposed to

relying on only one country (which may be characterised by a specific industrial structure,

global value chain position and labour market institutions) or inputting the match at a broader

(e.g. two-digit) occupational level.

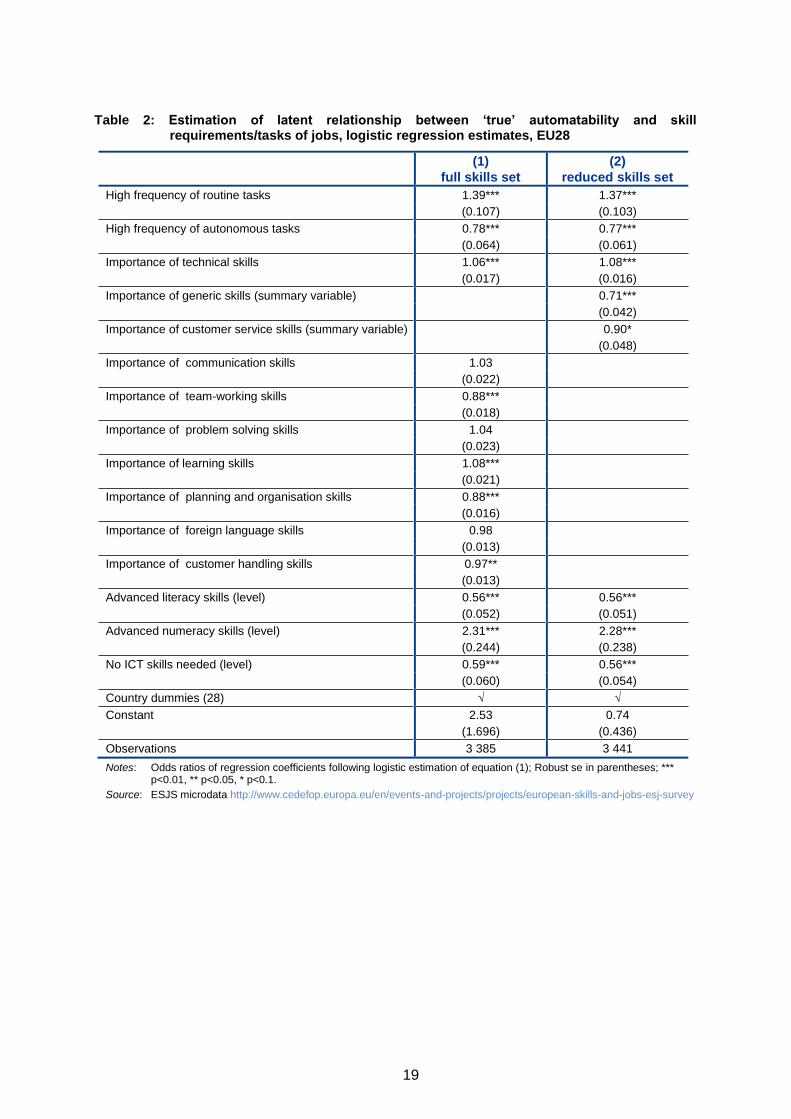
More formally, a logistic regression can be used to estimate the latent function of the

‘true’ automatability of occupations, as extracted from the FO training data, and individual-

level information on skill needs at work, as follows:

𝑃(𝑦∗ = 1|𝑠) =1

1+e−(β0+β1s+β2𝐶𝑓)

[1]

where y ∈ {0,1} is a (68 x 1) vector of the occupational automatability assessment and s is a

matrix of ESJS skill-requirements variables (as shown in Table 1 above). The coefficients β

are estimated on a pooled cross-section of employees from all EU28 countries after taking

into account country fixed effects (Cf).

Having estimated the latent relationship between the risk of automation in the training

occupational subsample and the ESJS skill needs variables, the coefficients of the model are

subsequently applied to all other individuals in the 28 EU countries, to obtain an out-of-

9 https://www.bls.gov/soc/2018/major_groups.htm#13-0000; while the ILO ISCO-08 group definitions are

available at: http://www.ilo.org/public/english/bureau/stat/isco/isco08/index.htm 10

Two occupations in the FO list, namely ‘credit and loan officers’ and ‘credit authorisers, checkers and clerks’,

have been captured under one list, given their marked similarity in job descriptions. It has also not been

possible to match any entries in the ESJS with the FO occupations ‘hunters and trappers’ and ‘farm labour

contractors’. See Annex Table A1 for further examples.

16

sample prediction of the individual risk of automation. The analysis also subsequently seeks

to detect the underlying relationship between automation risk and various individual and job

characteristics, and relates the former to several labour market outcomes (e.g. wages, job

security, job satisfaction, skills obsolescence).

Despite the fact that estimation of automation risk using the detailed ESJS job

descriptions is based on more precisely defined occupational matches with FO’s original

training dataset, the approach has important methodological limitations.

Most notably, while a non-trivial 29% of the total number of respondents provided a

detailed job description, it is reasonable to expect some bias in the distribution of

respondents who provided such information, especially among online respondents. This is

because it was only requested in the survey conditional on individuals being unable to

accurately identify their one- or two-digit occupational group in prior questions (11).

Furthermore, there is an imperfect correspondence between the US occupational

classification used by FO and the ISCO classes and definitions used by the ESJS (12). While

it is also important to acknowledge that even though all efforts were made to exhaust the list

of possible keywords used for matching the detailed ESJS job descriptions to the FO list, it is

likely that several relevant entries may have not been identified. However, in order to ensure

that the ESJS job descriptions mirror as closely as possible the respective FO occupations,

the entity extraction process has been deliberately kept stringent (13).

In addition, the underlying estimated model (1) connecting job tasks/skill needs to

automatability risk is assumed to be fixed across countries in the EU job market, which is a

generous assumption considering that EU economies are characterised by different industrial

structures, development levels and position in global value chains, labour market institutions

and incentives for capital-labour substitution.

11

Indeed, it is confirmed by the descriptive statistics that the subgroup of individuals providing detailed job

descriptions, as well as those with matched cases, is more prone, on average, to be females, older-aged and

less educated. A significantly lower incidence of workers undertaking clerical support and market and sales

duties and more of those carrying out lower-skilled occupations were inclined to disclose their job title and

kind of work. 12

his imperfect correspondence is more severe for some occupations than others; for instance, ‘Compliance

Officers’ in the BLS SOC system are classified under the broad ISCO-08 title ‘Business and Financial

Operations Occupations’, while in the ISCO-08 taxonomy the closest matched occupation is ‘Process control

technicians, other’. See Annex A, Table AA1 in Nedelkoska and Quintini (2018) for a suggested

correspondence table between FO occupations and ISCO-08. 13

For example, including the keyword ‘chief’ to match the ESJS entries to the FO occupation ‘Chief executives’

would augment the number of matched cases, albeit at a cost of greater imprecision. This would be the case

because it is not absolutely clear whether a person describing his/her job duties as ‘chief’ is actually a

company director/executive, while a number of erroneous cases (such as ‘police chief officer’ or ‘political

chief of staff’) would also be selected.

17

5. Multivariate analysis

5.1. Risk of automation in EU job markets

Following implementation of the methodological steps outlined above, a ‘training dataset’

denoted as D = (s, y), comprising of the approximately 3 500 matched cases has been

retained, containing information on whether an individual’s occupation is automatable or not,

along with descriptions of his/her job tasks and required skills intensities for the job. In this

dataset about 55% of employees (1 899 cases), labelled as y=1, belong to occupations

whose tasks/skills, according to FO, can be automated, while the remaining 45% (1 572

cases), taking the value y=0, are employed in jobs that cannot (or can only partially) be

replaced by machines.

For the purposes of estimation of equation (1) four distinct set of variables, descriptive of

the skill needs of employees’ jobs, have been identified, as implied by factor analysis, as

follows:

transversal skills i.e. the degree of importance of learning skills, problem-solving

skills, communication skills, team working skills and planning/organisation skills for

the job – indicative of a job’s reliance on the so-called ‘four C’s’, namely creativity

(learning), critical-thinking, communication and collaboration;

foundation skills i.e. the extent to which a job requires advanced literacy, numeracy

or digital skills;

selling or customer-serving skills i.e. the importance of foreign language skills and

customer-handling skills in the job - descriptive of a job’s need to cater to a domestic

and/or international clientele;

technical skills i.e. the degree to which a job is reliant on specialised or job-specific

skills.

To further facilitate efficiency in the estimation, given the potential collinearity in the

repeated and similarly-measured skill intensity survey items of the ESJS, the variables

included in the transversal and customer-serving skills sets have been reduced to two

summative variables. These have been derived using Cronbach’s α statistic, and their

internal consistency was verified (14).

Estimation of the underlying latent ‘true’ probability of automation as a function of the

aforementioned skill needs constructs and tasks characterising workers’ jobs reveals

estimates in accordance with the task-based literature. The empirical logit coefficients (15)

14

Details of the factor analysis and derivation of the Cronbach alpha scales are available in the Annex

Table A2 and Figure A2. 15

Estimation of equation (1) has also been carried out using a multilevel (mixed-effects) logistic model, which

estimates the two moments of the country intercept and hence saves on degrees of freedom, relative to the

inclusion of 28 country dummies in the logistic regression. The estimation confirms the statistically significant

18

shown in Table 2 indicate that there is a strong positive association between a job’s

routinisation frequency and propensity towards automatability. Jobs that demand advanced

numeracy and at least some digital skills and those that have greater reliance on specialised

skills are also more likely to belong to FO’s list of automatable occupations. By contrast, the

probability of automation is significantly lower for employees whose jobs facilitate their

autonomy and which demand a higher degree of transversal (16) as well as selling skills.

An associated analysis of variance (ANOVA) decomposition further shows that most of

the variance in automatability is accounted for by the variables planning, advanced numeracy

and team working skills, whereas communication, problem-solving and foreign-language

skills explain a small, insignificant, part of the explained sum of squares.

To obtain an out-of-sample prediction of the EU-wide individual risk of automation, the

implied relationship between automatability and job tasks/skill needs as estimated above is

extended to all other individuals in the ESJS sample. This analysis hence reveals that the

median EU employee faces a 51% probability of being in a job that may be automated (17).

Following FO’s approach, it is hence found that about 14% of EU adult employees are in jobs

that face a very high risk of automation (i.e. the median automation probability exceeds

70%). Similarly, 40% have a non-trivial chance of automation (between 50 and 70%), while

for 34% of workers the automation probability ranges between 30-50%. In the ESJS sample

only 12% of adult employees are found to be facing a very low (less than 30%) chance of

automation.

dispersion of automatability across EU countries – 𝑣𝑎�̂�(β0)=0.11 (robust s.e. = 0.054). Importantly, the

estimated size and significance of the main skill needs coefficients are equivalent to those shown in Table 2.

Results are available from the author upon request. 16

Although most skill needs variables are consistent with a priori expectations regarding their association with

the risk of automation, a notable exception is learning skills, found to be positively related to automatable

occupations. Nevertheless, it may be reasonably posited that jobs facing a higher degree of substitutability

by technology may also entail a greater ‘need for learning and applying new methods and techniques’ and

for ‘adapting to new technology’ by ‘engaging in own learning’. 17

As in Nedelkoska and Quintini (2018), there is marked variance in the estimated automation risk across EU

countries (a standard deviation in the mean risk of 0.16), ranging from a high of 68%, 65% and 63% for

Bulgarian, Polish and Slovakian workers, respectively, to a low of 37% and 36% for Irish and German

employees. With an estimated 18% median risk of automation, Finland appears to be an outlier. The paper

does not overstress the country-specific estimates, given the small sample-sizes per country and since the

ESJS did not adopt a random probabilistic design. Nevertheless, the results confirm previous literature

indicating a higher risk of automation among Central and Eastern European countries, as well as the Baltics

and some Southern EU states (notably Greece), and a low risk in Scandinavian and some Northern

countries.

19

Table 2: Estimation of latent relationship between ‘true’ automatability and skill requirements/tasks of jobs, logistic regression estimates, EU28

(1)

full skills set

(2)

reduced skills set

High frequency of routine tasks 1.39*** 1.37***

(0.107) (0.103)

High frequency of autonomous tasks 0.78*** 0.77***

(0.064) (0.061)

Importance of technical skills 1.06*** 1.08***

(0.017) (0.016)

Importance of generic skills (summary variable) 0.71***

(0.042)

Importance of customer service skills (summary variable) 0.90*

(0.048)

Importance of communication skills 1.03

(0.022)

Importance of team-working skills 0.88***

(0.018)

Importance of problem solving skills 1.04

(0.023)

Importance of learning skills 1.08***

(0.021)

Importance of planning and organisation skills 0.88***

(0.016)

Importance of foreign language skills 0.98

(0.013)

Importance of customer handling skills 0.97**

(0.013)

Advanced literacy skills (level) 0.56*** 0.56***

(0.052) (0.051)

Advanced numeracy skills (level) 2.31*** 2.28***

(0.244) (0.238)

No ICT skills needed (level) 0.59*** 0.56***

(0.060) (0.054)

Country dummies (28) √ √

Constant 2.53 0.74

(1.696) (0.436)

Observations 3 385 3 441

Notes: Odds ratios of regression coefficients following logistic estimation of equation (1); Robust se in parentheses; *** p<0.01, ** p<0.05, * p<0.1.

Source: ESJS microdata http://www.cedefop.europa.eu/en/events-and-projects/projects/european-skills-and-jobs-esj-survey

20

Figure 1: Share of EU28 adult workers at risk of automation by degree of risk

Notes: The figure displays the estimated out-of-sample automation risk calculated for the whole ESJS sample of adult

employees using two different specifications of equation (1), as shown in Table 2.

Source: ESJS microdata http://www.cedefop.europa.eu/en/events-and-projects/projects/european-skills-and-jobs-esj-survey

Overall, the inferred automatability distribution based on the ESJS data is more similar

to that implied by Arntz et al. (2016) and Nedelkoska and Quintini (2018) as opposed to Frey

and Osborne (2013, 2017), although it is more heavily skewed to the left (18). This confirms

the value of relying on rich individual-level data capturing the within-occupational variance of

skill requirements/tasks for the purposes of estimating the latent automatability function (1).

18

The estimated percentages of adult EU workers at risk of automation are relatively sensitive to the

specification of equation (1). For instance, using the detailed list of skill needs and tasks variables, without

reducing them to a more limited control set, raises the estimated percentage of workers at very high and very

low risk of automation to about 20% and 14%, respectively, compressing the shares of those in intermediate

risk classes. However, an upper threshold of about 20-21% of very high risk of automation persists even

when several specifications of equation (1) (such as dropping the level of foundation skills variables) are

deployed.

13.9%

40.2%

33.7%

12.2%

19.8%

34.7% 31.8%

13.8%

0.0%

5.0%

10.0%

15.0%

20.0%

25.0%

30.0%

35.0%

40.0%

45.0%

Very high (>70%) High (~50-70%) Low (~30-50%) Very low (<30%)

Reduced skills set specification Full skills set specification

21

5.2. Determinants of jobs at risk of automation

The rich ESJS contextual information on workers’ sociodemographic and job characteristics

permits further exploration of the factors associated with a greater risk of automation. In

particular, Table 3 displays the estimated OLS coefficients of the predicted probability of

automation, 𝑦𝑜�̂� , as well as those of the following logistic regression (19):

𝑃(𝑦ℎ𝑖∗ = 1) = 𝛽0𝑖 + 𝛽1𝑋𝑖 + 𝛽2𝐽𝑖 + 𝛽1𝑂𝑖 + 𝛽1𝐼𝑖 + 𝛽1𝐶𝑖 [2]

where yh is defined as a dummy variable taking the value one if an individual i is employed in

a job with a very high risk of automation and zero otherwise, X is a vector of individual

sociodemographic characteristics (gender, age, education level, prior employment status), J

is a vector of job-specific factors (private sector, training provision, contract type, employer

tenure, multisite workplace, firm size, promotion prospects) and O,I and C are occupation,

industry- and country-specific indicator variables, respectively. The estimation procedure is

performed in steps, first including the set of variables in X and subsequently J and O,I, which

enables careful scrutiny of the impact of individual and job level determinants, whilst avoiding

the ‘bad control’ problem due to the simultaneous inclusion of occupational and industry

variables (Angrist and Pischke, 2009).

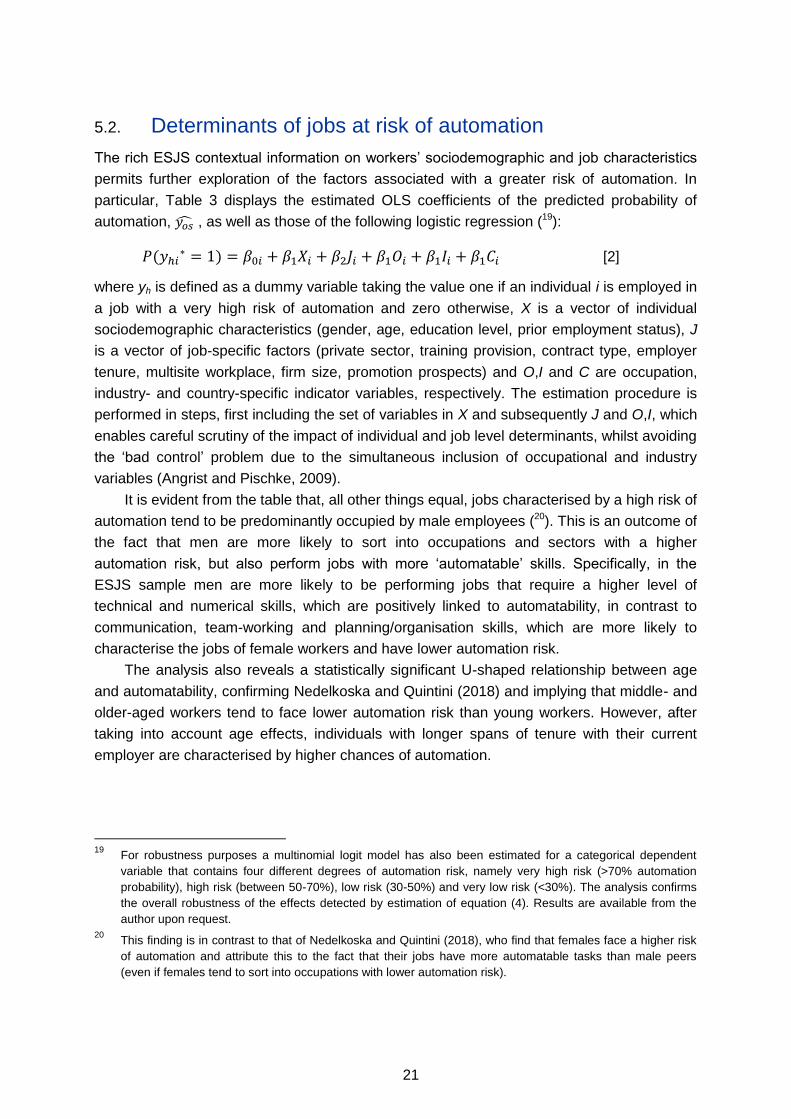
It is evident from the table that, all other things equal, jobs characterised by a high risk of

automation tend to be predominantly occupied by male employees (20). This is an outcome of

the fact that men are more likely to sort into occupations and sectors with a higher

automation risk, but also perform jobs with more ‘automatable’ skills. Specifically, in the

ESJS sample men are more likely to be performing jobs that require a higher level of

technical and numerical skills, which are positively linked to automatability, in contrast to

communication, team-working and planning/organisation skills, which are more likely to

characterise the jobs of female workers and have lower automation risk.

The analysis also reveals a statistically significant U-shaped relationship between age

and automatability, confirming Nedelkoska and Quintini (2018) and implying that middle- and

older-aged workers tend to face lower automation risk than young workers. However, after

taking into account age effects, individuals with longer spans of tenure with their current

employer are characterised by higher chances of automation.

19

For robustness purposes a multinomial logit model has also been estimated for a categorical dependent

variable that contains four different degrees of automation risk, namely very high risk (>70% automation

probability), high risk (between 50-70%), low risk (30-50%) and very low risk (<30%). The analysis confirms

the overall robustness of the effects detected by estimation of equation (4). Results are available from the

author upon request. 20

This finding is in contrast to that of Nedelkoska and Quintini (2018), who find that females face a higher risk

of automation and attribute this to the fact that their jobs have more automatable tasks than male peers

(even if females tend to sort into occupations with lower automation risk).

22

Table 3: Determinants of risk of automation, OLS and logistic estimates, EU28

Specifications (1)

X

(2)

X & J

(3)

X & J &

O&I

(4)

X & J & skill

mismatches

(5)

Odds of very

high risk

(X & J)

Male 0.03*** 0.03*** 0.02*** 0.03*** 1.39***

(0.001) (0.001) (0.001) (0.001) (0.042)

Age band: 30-39 -0.01*** -0.01*** -0.01*** -0.01*** 0.86***

(0.002) (0.002) (0.002) (0.002) (0.041)

Age band: 40-54 -0.01*** -0.01*** -0.01*** -0.01*** 0.84***

(0.002) (0.002) (0.002) (0.002) (0.041)

Age band: 55-65 -0.01*** -0.01*** -0.01*** -0.01*** 0.81***

(0.002) (0.002) (0.002) (0.002) (0.051)

(omitted: Age band: 24-29)

Education: Medium -0.01*** -0.00** -0.00 -0.00** 1.04

(0.002) (0.002) (0.002) (0.002) (0.049)

Education: High -0.02*** -0.02*** -0.01*** -0.02*** 0.92

(0.002) (0.002) (0.002) (0.002) (0.045)

(omitted: Low education)

Previous LM status: Unemployed

0.01*** 0.01*** 0.01*** 0.01*** 1.14***

(0.002) (0.002) (0.002) (0.002) (0.048)

Private sector 0.02*** 0.00*** 0.02*** 1.24***

(0.001) (0.001) (0.001) (0.040)

No training in last 12 months 0.01*** 0.01*** 0.01*** 1.28***

(0.001) (0.001) (0.001) (0.041)

Part time 0.00 0.01*** 0.00 0.99

(0.002) (0.002) (0.002) (0.045)

Permanent contract 0.00 0.00 0.00 0.99

(0.002) (0.002) (0.002) (0.039)

Years in job 0.00*** 0.00*** 0.00*** 1.00**

(0.000) (0.000) (0.000) (0.02)

Organisation with multiple sites -0.00** -0.00*** -0.00 0.97

(0.001) (0.001) (0.001) (0.030)

Small size firm (1-50 employees)

-0.01*** -0.01*** -0.01*** 0.87***

(0.001) (0.001) (0.001) (0.027)

Not promoted since start of job but changed tasks

0.01*** 0.01*** 0.01*** 1.20***

(0.001) (0.001) (0.001) (0.047)

No changes in job role since start of job

0.01*** 0.01*** 0.01*** 1.21***

(0.001) (0.002) (0.001) (0.048)

(omitted: Promoted)

Occupation dummies (ISCO 1-digit)

Industry dummies (NACE 16 categories)

Country dummies (28) √ √ √ √ √

Gap: ICT skills 0.02***

(0.002)

Gap: literacy skills -0.01***

(0.002)

Gap: numeracy skills -0.01***

23

(0.002)

Gap: technical skills -0.03***

(0.002)

Gap: communication skills 0.02***

(0.002)

Gap: team working skills 0.01***

(0.002)

Gap: foreign language skills -0.00***

(0.001)

Gap: customer serving skills 0.01***

(0.002)

Gap: problem-solving skills 0.01***

(0.002)

Gap: learning skills 0.00

(0.002)

Gap: planning skills 0.01***

(0.002)

Constant 0.49*** 0.46*** 0.46*** 0.45*** 0.06***

(0.005) (0.005) (0.006) (0.005) (0.009)

Observations 47,913 47,575 47,575 47,575 48,258

R-squared 0.49 0.50 0.52 0.52

Notes: Columns (1-4): OLS regression coefficients of equation (2) with 𝑦𝑜�̂� as dependent variable; Column (5) logistic regression coefficient of equation 2 with yh as dependent variable. Robust se in parentheses; *** p<0.01, ** p<0.05, * p<0.1.

Source: ESJS microdata http://www.cedefop.europa.eu/en/events-and-projects/projects/european-skills-and-jobs-esj-survey

A number of job-related characteristics are found to be significantly related to the

probability of automation. Jobs facing very high automatability risk tend to be predominantly

in the private sector and in larger, single site, workplaces. Although in terms of raw

descriptive statistics the probability of automation is higher for workers on fixed-term of

temporary agency contracts (15.5% of adult employees on such temporary contracts face a

very high risk of automation, as opposed to 13.5% of those on indefinite contracts), the

effects are not statistically significant once other factors are taken into account. In

automation-prone jobs, employees are also more likely to face limited promotion prospects

and their job role and tasks have remained stagnant over time. They are also significantly

less likely to have undergone any type of training for their job (on- or off-the-job, non-formal

or informal) over the course of the previous year. This is striking, considering that upskilling

and reskilling are argued to be key ingredients for mitigating the difficult transitions required

for workers affected by technological skills obsolescence (Cedefop, 2018; McGuinness et al.,

2018).

The ESJS collected unique information on the degree of skill mismatches affecting EU

workers. In particular, employees were asked to assess the correspondence between their

own skills and those required by their jobs, both in terms of the total stock of skills and also

for a set of eleven specific skills. Although such variables are likely to be endogenously

related to the predicted risk of automation, given that both measures are confounded by the

respondents’ subjective assessment of skills needs in their job, inclusion of such uniquely

detailed skill mismatch variables in the specification of equation (2) reveals some interesting

24

findings. In particular, individuals who are employed in jobs at risk of displacement by

machines are more likely to be affected by skill gaps in their digital skills, as well as in a

variety of generic skills (communication, team working, customer- service, problem solving

and planning). By contrast, they are less likely to experience gaps in their basic skills (literacy

and numeracy) and in their level of required technical expertise (including knowledge of

foreign languages).

Finally, the estimates further highlight a number of well-reported occupation and

industry-specific impacts on the risk of automation (Figure 2 and Figure 3). Individuals in

crafts and elementary posts and those working as plant and machine operators face higher

chances of being in highly automatable jobs, in contrast to those employed in high-skilled

occupations (e.g. managers, professionals) and in services and market sales. Similarly,

individuals employed in sectors providing social and personal services, education and health

services and in the cultural industries face significantly lower automation chances, relative to

those employed in the secondary and primary sector.

25

Figure 2: Mean probability of automation by 2-digit occupation

Notes: Out-of-sample predicted probability of automation based on estimation of equation (1); share of workers at very high automation risk defined as those with probability of automation over 70%.

Source: ESJS microdata http://www.cedefop.europa.eu/en/events-and-projects/projects/european-skills-and-jobs-esj-survey

0.42

0.44

0.45

0.46

0.47

0.47

0.47

0.47

0.47

0.48

0.48

0.48

0.48

0.49

0.49

0.49

0.49

0.5

0.5

0.5

0.5

0.51

0.51

0.51

0.51

0.52

0.52

0.54

0.54

0.54

0.54

0.55

0.55

0.55

0.55

0.55

0.55

0.56

0.56

0.57

4%

2%

3%

5%

4%

5%

3%

5%

5%

3%

7%

6%

5%

6%

6%

8%

18%

6%

8%

5%

4%

8%

7%

8%

10%

9%

10%

18%

11%

13%

12%

13%

16%

15%

13%

12%

13%

18%

17%

17%

0 0.1 0.2 0.3 0.4 0.5 0.6

Personal care workers

Chief executives, senior officials and l

Administrative and commercial managers

Legal, social, cultural and related asso

Hospitality, retail and other services m

Health professionals

Teaching professionals

Legal, social and cultural professionals

Customer services clerks

Production and specialised services mana

Health associate professionals

Information and communications technicia

Other clerical support workers

General and keyboard clerks

Numerical and material recording clerks

Personal service workers

Subsistence farmers, fishers, hunters an

Information and communications technolog

Science and engineering associate profes

Business and administration associate pr

Street and related sales and service wor

Science and engineering professionals

Business and administration professional

Market-oriented skilled forestry, fisher

Food preparation assistants

Sales workers

Protective services workers

Handicraft and printing workers

Electrical and electronic trades workers

Cleaners and helpers

Refuse workers and other elementary work

Market-oriented skilled agricultural wor

Building and related trades workers, exc

Metal, machinery and related trades work

Drivers and mobile plant operators

Agricultural, forestry and fishery labou

Labourers in mining, construction, manuf

Food processing, wood, garment and relat

Stationary plant and machine operators

Assemblers

Share at very high risk Mean automation risk

26

Figure 3: Mean probability of automation by industry

Notes: Out-of-sample predicted probability of automation based on estimation of equation (1); share of workers at very high

automation risk defined as those with probability of automation over 70%.

Source: ESJS microdata http://www.cedefop.europa.eu/en/events-and-projects/projects/european-skills-and-jobs-esj-survey

5.3. Labour market outcomes and the risk of automation

In addition to understanding factors associated with the risk of automation, this section

focuses on testing how a job that is susceptible to being replaced by machines is associated

with a variety of labour market outcomes. Table 4 demonstrates the estimated OLS

relationship between the predicted (out of sample) probability of automation, 𝑦𝑜�̂� , as well as

the likelihood of being in a job that has a very high risk of automation, yh, with individuals’

(log) gross hourly earnings, their job satisfaction, and their anticipated job insecurity and

skills obsolescence (21).

21

In the ESJS adult workers were asked the following related questions:

0.46

0.46

0.48

0.49

0.5

0.5

0.5

0.52

0.52

0.52

0.53

0.53

0.54

0.54

0.55

0.55

8%

10%

12%

11%

13%

13%

14%

14%

15%

15%

18%

15%

18%

20%

19%

22%

0 0.1 0.2 0.3 0.4 0.5 0.6

Education and health services

Social and personal services

Cultural industries (arts, entertainment,…

Accommodation, catering or food services

Public administration and support services

ICT

Professional, scientific or technical services

Transportation or storage

Financial, insurance or real estate services

Other

Manufacturing

Retail and wholesale trade

Agriculture, forestry or fishing

Construction

Supply of gas or electricity, mining

Supply, management or treatment of water

Share at very high risk Mean automation risk

27

As is clear from the table, a higher degree of automatabity tends to be significantly

associated with jobs in which workers have lower mean job satisfaction and a higher

(perceived) likelihood of job insecurity. They are also more likely to believe that several of

their skills will become outdated in the near future. It is also evident, based on estimation of a

standard Mincer earnings function, which accounts for individuals’ gender, a quadratic age

term and years of employer tenure (to proxy for both general and specific human capital),

that there is a strong negative relationship between the risk of automation and earnings.

Employees in (highly) automatable jobs, for instance, receive about 3.5% lower hourly

earnings, ceteris paribus, relative to comparable workers facing lower degrees of automation

risk (22).

Table 4: Labour market impact of automation risk, OLS estimates, EU28

(Log) hourly

earnings

Job satisfaction Job insecurity Skills

obsolescence

Probability of automation

-0.103***

(0.024)

-1.225***

(0.086)

0.627***

(0.117)

0.492***

(0.123)

Very high risk of automation (dummy)

-0.031***

(0.008)

-0.315***

(0.031)

0.099**

(0.043)

0.088**

(0.044)

R2 0.57 0.06 0.11 0.07

N 39,290 47,505 44,935 45,424

Notes: OLS regression coefficients with 𝑦𝑜�̂� as independent variable in row (1) and yh in row (2); Col. 1 is based on

estimation of a Mincer-type earnings function including age (and its quadratic), gender, education attainment level and years of employer tenure as additional control variables; Col. 2-4 include as control variables a standard set of individual and job characteristics as well as occupation and industry dummies as in column (3) of Table 3. Robust se in parentheses; *** p<0.01, ** p<0.05, * p<0.1

Source: ESJS microdata http://www.cedefop.europa.eu/en/events-and-projects/projects/european-skills-and-jobs-esj-survey

- for earnings they were asked to declare ‘On average, how much is your gross monthly earnings from your job

(before deductions or credits of tax and national insurance)?’ and, in case of non-response, to state their

income band. See McGuinness and Pouliakas (2017) for further details on the construction of the continuous

hourly wage variable.

- for job security and skills obsolescence they were asked to state on a Likert scale from from 0 to 10, where 0

means very unlikely and 10 very likely ‘How likely or unlikely do you think it is that each of the following may

happen? (i) I will lose my job in the next year (ii) Several of my skills will become outdated in the next five

years’.

- finally, a standard job satisfaction question was asked ‘On a scale from 0 to 10, where 0 means very

dissatisfied, 5 means neither satisfied nor dissatisfied and 10 means very satisfied, how satisfied are you

with your job?’. 22

Estimation of an extended wage equation with a wider control set that takes into account prior labour market

status, a range of job characteristics (type of contract, sector, training provision etc.) as well as occupation

and industry lowers the negative wage penalty to about 2%,though it remains statistically significant.

28

6. Conclusions

Much has been said and written recently on the threat posed by machines and robots to

humans. Continuous advancements in artificial intelligence and advanced robotics, but also

in a wide array of new technologies (e.g. nanotechnologies, 3D printing, bioengineering etc.)

with potential to radically transform industries and occupations, have heightened concerns of

employees, including this time high-skilled workers, becoming side-lined to machines.

Despite such scaremongering, historical evidence as well as current estimates of the risk of

automation, such as those presented in this paper, dispute claims of a future post-work

society. It is important to always bear in mind that in dynamic economies that have set in

place high quality, responsive and inclusive education and vocational training systems, as

well as adequate social security safety nets that support career transitions, displaced or idle

resources tend to be utilised in other value-creating industries and occupations over time.

Moreover, in a standard Neo-Keynesian framework the translation of cost-saving

technologies into cheaper goods and, hence, greater product demand, is also dependent on

a high degree of demand elasticity as well as on a robust median wage level in an economy

that can support greater consumption expenditure.

The deployment of more capital investment expenditure by firms, following the

introduction of a new technology, is also not an automatic or irreversible process (DeCanio,

2016). While innovation cycles and their commercial application in industry, most notably via

rapid prototyping, have become shorter, the diffusion of new technologies within firms in a

manner that is labour-disruptive can be long and uncertain. In addition to taking into account

the relative cost of human versus capital factor inputs, relative to their marginal productivities,

to decide on the degree of substitutability of capital for labour, many organisations realise

that in a global economic environment their human capital constitutes a source of competitive

advantage. Fast replacement of their workforce by machines may often come at a significant

cost of lost organisation creativity, innovation and employee drive.

Moving from technical feasibility to actual market diffusion of capital investment also

requires accounting for employers’ incentives and commitment to their human resources.

Assuming that jobs at high risk of automation must not only possess a specific skills/task mix

that renders them susceptible to automation, but must also be characterised by employers

disinclined to invest in their staff’s human capital, it is hence possible to reassess the total

stock of highly automatable jobs in the EU. Using the available ESJS data enables one to

purge from the original estimate of very high risk jobs (14%) the share of employees

employed in organisations consciously committed to their personnel’s skills development.

Doing so reduces the figure to 8.3% (accounting for firms that fully reimburse the cost of

training) or to 7.6% (taking also into account employers who partly reimburse training

expenditure).

While pinpointing the exact figure regarding the share of EU jobs at risk of displacement

by machines can be imperfect science, the available evidence does however highlight the

need for policies that can shield specific population groups most vulnerable to technological

29

unemployment or skills obsolescence. The ESJS data identify that it is typically lower-

educated males, suffering from skill gaps in digital and transversal skills, and those employed

for larger-sized firms in the private sector, who are faced with greater automation risk.

Overall, sectors and occupations requiring medium- or lower-level skills are more prone to

automation, while professional and interpersonal services provision (such as health care or

education) are relatively insulated.

A key challenge for policymakers is thus to ensure that individuals who will soon see

their jobs transitioning from a ‘semi-analogue to a digital world’ can do so with as little

disruption as possible (Goolsbee, 2018). This process will require that they acquire relevant

skills, are offered an adequate welfare safety net and exhibit a high degree of adaptability

that will allow them to remain employable in future job markets. Modernising education

systems and lifelong learning so that training programmes focus more heavily on key

competences and soft skills, including the four C’s – communication, collaboration, creativity

and critical thinking – is admittedly a critical parameter of the equation.

Ensuring that we converge to a future we want will also require that EU stakeholders

build high quality skills anticipation systems so as to prepare for emerging jobs and in-

demand skills. Harnessing the power of digitalisation for making better policy decisions, such

as by extraction of real time data on emerging jobs and in-demand skills, is another key input

to the process. However, it is crucial that policymakers put in place safeguards so that there

is adequate trust, transparency and governance in the interpretation and use of AI-generated

intelligence in policy decisions.

With many advanced economies fundamentally struggling with low productivity, the

advancement of digitalisation and AI holds significant promise for expanding efficiencies in a

wide range of occupations and for new economic activities or markets emerging. But the

move towards a new desirable ‘future of work’, such as a post-work or full employment

society, instead of polarised labour markets, cannot rely only on more or better (re)skilling

policies. A whole arsenal of innovation, competition and employment policies will have to be

implemented together with forward-looking skills strategies to ensure equitable access for the

majority of people to the profits and opportunities of digitalisation and automation.

30

List of abbreviations

Cedefop European Centre for the Development of Vocational Training

ESJS European skills and jobs survey

EU European Union

FO Frey and Osborne

ILO International Labour Organization

OECD Organisation for Economic Co-operation and Development

PIAAC Survey of Adult Skills

RBTC routine-biased technological change

SBTC skill-biased technological change

US BLS United States Bureau of Labor Statistics

31

References

Acemoglu, D.; Restrepo, P. (2016). The race between machine and man: implications of

technology for growth, factor shares and employment. NBER Working Paper No. 22252.

Acemoglu, D.; Restrepo.P. (2017). Robots and jobs: evidence From US and the labour

markets. NBER Working Paper No. 23285.

Acemoglu, D.; Autor, D. (2011). Skills, tasks and technologies: implications for employment

and earnings. Handbook of Labor Economics. Vol. 4, pp. 1043-1171.

Angrist, J.; Pischke, JS (2009). Mostly harmless econometrics: an empiricist's companion.

Princeton University Press.

Arntz, M.; Gregory, T.; Zierahn, U. (2016). The risk of automation for jobs in OECD countries.

OECD Social, Employment and Migration Working Papers, No 189. Paris: OECD

Publishing.

Autor, D.H. (2013). The ‘task-based’ approach to labor markets: an overview. Journal for

Labour Market Research, Vol. 46, No 3, pp. 185-199. Heidelberg: Springer. ISSN 2510-

5027, http://dx.doi.org/10.1007/s12651-013-0128-z

Autor, D.H. (2015). Why are there still so many jobs? The history and future of workplace

automation. The Journal of Economic Perspectives, Vol. 29, No 3, pp. 3-30, Summer

2015.

Autor, D.H.; Dorn, D. (2013). The growth of low skill service jobs and the polarization of the

U.S. labor market. American Economic Review, Vol. 103, pp. 1553-1597.

Autor, D.H; Katz L.; Kearney, M. (2006). The polarization of the US Labor Market. American

Economic Review, Vol. 96, No 2, pp. 189-194.

Autor, D.H.; Katz, LF.; Krueger, A.B. (1998). Computing inequality: have computers changed

the labor market? Quarterly Journal of Economics, Vol. 113, No 4, pp. 1169-1213.

Autor, D.H; Levy, F.; Murnane, R.J. (2003). The skill content of recent technological change:

an empirical exploration. Quarterly Journal of Economics, Vol. 118, No 4, pp. 1279-

1334, November 2003.

Berman, E.; Bound, J.; Machin, S. (1998). Implications of skill-biased technological change:

international evidence. Quarterly Journal of Economics, Vol. 113, No 4, pp. 1245-1279.

Bessen, J.E. (2015). Learning by doing: the real connection between innovation, wages, and

wealth. Yale University Press.

Bessen, J.E. (2016). How computer automation affects occupations: technology, jobs, and

skills. Boston University School of Law, Law & Economics Working Paper No. 15-49.

Brynjolfsson, E.; McAfee, A. (2014). The second machine age: work, progress, and

prosperity in a time of brilliant technologies. NY: WW Norton & Company.

Cedefop (2015). Skills, qualifications and jobs in the EU: the making of a perfect match?

Evidence from Cedefop’s European skills and jobs survey. Luxembourg: Publications

Office. Cedefop reference series No 103. http://www.cedefop.europa.eu/en/publications-

and-resources/publications/3072

Cedefop (2017). Machines, robots, people and skills. Cedefop Briefing Note No 9121.

http://www.cedefop.europa.eu/en/publications-and-resources/publications/9121

32

Cedefop (2018). Insights into skill shortages and skill mismatch: learning from Cedefop’s

European skills and jobs survey. Luxembourg: Publications Office. Cedefop reference

series No 106.

http://www.cedefop.europa.eu/en/publications-and-resources/publications/3075

Dauth, W. et al. (2017). German robots-the impact of industrial robots on workers. IAB DP

30/2017.

DeCanio, S.J. (2016). Robots and humans-complements or substitutes. Journal of

Macroeconomics, Vol. 49, pp. 280-291.

Ford, M. (2015). Rise of the robots: technology and the threat of a jobless future. NY: Basic

books.

Forth, J. (2016). Evaluation of design effects in the European skills and jobs survey. UK:

National Institute of Economic and Social Research (NIESR).

Frey, C.; Osborne, M. (2013). The future of employment: how susceptible are jobs to

computerisation. University of Oxford.

Frey, C.; Osborne, M. (2017). The future of employment: how susceptible are jobs to

computerisation. Technological Forecasting & Social Change, Vol. 114 (2017), pp. 254-

280.

Goolsbee, A. (2018). Public policy in an AI economy. NBER WP No. 24653.

Goos, M.; Manning, A.; Salomons, A. (2009). Job polarization in Europe. American Economic

Review, Vol. 99, No 2, pp. 58-63.

Graetz, G.; Michaels, G. (2015). Robots at work. CEPR Discussion Paper, No DP10477.

Handel, M. (2012). Trends in job skill demands in OECD countries. OECD Social,

Employment and Migration Working Papers, No. 143. Paris: OECD Publishing.

http://dx.doi.org/10.1787/5k8zk8pcq6td-en

Hogarth, T. (2017). Automation, artificial intelligence, on-demand labour and other flexible

forms of labour in the new IDB employer survey. Skills at work in LAC. Technical note

no. IDB-TN-1332, http://www.iadb.org.

Katz, L.; Autor, D.H. (1999). Changes in the wage structure and earnings inequality. In:

Ashenfelter, O; Card, D. (eds.). Handbook of Labor Economics, Vol. 3A, pp. 1463-1555.

Katz, L.F.; Murphy, K.M. (1992). Changes in relative wages, 1963-1987: supply and demand

factors. Quarterly Journal of Economics, Vol. 107, No 1, pp. 35-78.

Keynes, J.M. (1933). Economic possibilities for our grandchildren. Essays in persuasion.

pp. 358-373

Krueger, A.B. (1993). How computers have changed the wage structure: evidence from

microdata, 1984-1989. Quarterly Journal of Economics, Vol. 108, pp. 33-60.

Machin, S.; Van Reenen, J. (1998). Technology and changes in skill structure: evidence from

seven OECD countries. Quarterly Journal of Economics, Vol. 113, No 4, pp. 1215-1244.

McAfee, A.; Brynjolfsson, E. (2017). Machines, platform, crowd: harnessing our digital future.

W.W. Norton & Company.

McGuinness, S.; Pouliakas, K. (2017). Deconstructing theories of overeducation in Europe: a

wage decomposition approach. In: Solomon, W., et al. (ed.). Skill mismatch in labor

markets. Research in Labor Economics, Vol. 45, pp. 81-127. Emerald Publishing Ltd.

33

McGuinness, S.; Pouliakas, K.; Redmond, P. (2018). Impact of technological skills

obsolescence on labour market outcomes: evidence from the European skills and jobs

survey. ESRI working paper.

Mokyr, J.; Vickers, C. Ziebarth, N (2015). The history of technological anxiety and the future

of economic growth: is this time different? Journal of Economic Perspectives, Vol. 29,

pp. 31-50.

Nedelkoska, L.; Quintini, G. (2018). Automation, skills use and training. OECD Social,

Employment and Migration Working Papers, No. 202. Paris: OECD Publishing.

http://dx.doi.org/10.1787/2e2f4eea-en

Pantea, S.; Biagi, F.; Sabadash, A. (2014). Are ICT displacing workers? Evidence from

seven European countries. JRC technical reports, Digital economy working paper

2014/07. Spain: European Commission.

Pellegrino, G.; Piva, M.; Vivarelli, M. (2017). Are robots stealing our jobs? IZA DP.

No. 10540.

Piva, M.; Vivarelli, M. (2017). Is R&D good for employment? Microeconometric evidence from

the EU. IZA DP. No 10581.

Schwab, K. (2016). The fourth industrial revolution. World Economic Forum, Geneva.

Van Reenen, J. (1997). Employment and technological innovation: evidence from U.K.

manufacturing firms. Journal of Labor Economics, Vol. 15, pp. 255-284.

Vivarelli, M. (2014). Innovation, employment and skills in advanced and developing

countries: a survey of the literature. Journal of Economic Issues, Vol. 48, No 1, pp. 123-

154.

Vivarelli, M. (2015). Innovation and employment. IZA World of Labor, Vol. 154.

World Economic Forum (2016). The future of jobs: employment, skills and the workforce

strategy for the fourth industrial revolution. Geneva.

34

Annexes

Figure A1: Frequencies of matched ESJS job titles with FO occupations

Source: ESJS microdata http://www.cedefop.europa.eu/en/events-and-projects/projects/european-skills-and-jobs-esj-survey

35

Table A1: Text mining analysis – examples of keywords to match ESJS job titles with

FO occupations

Occupation Keywords ‘True’

automation

risk (FO)

Accountants and auditors

accountant, certified accountant, chartered accountant, financial control, financial controller, management accounting, accounting, accountancy; audit, auditor, auditing

1

Athletes athlete, fitness, sports instructor, fitness trainer, healthcare trainer, personal trainer, football

0

Driver* bus, driver, busdriver, drive, motor vehicle driver, tram driver, tramway, truck driver, lorry, car driver, parking, can driver, delivery man, delivery van, delivery driver, delivery operator, delivery person, van delivery, deliverer

1

Cashiers cashier, cash, cash register, checkout assistant, checkout attendant, ticket issuing

1

Chief executives chief executive, ceo, chief financial officer, chair, company director, managing director, company manager, cfo, company owner, board member, regional manager, vice president, executive director

0

Childcare workers

childcare, child care, child minder, child minding, baby sitter, nanny, day care

0

Dentist Dentist, dental, teeth, stomatology, stomatologist, dental prosthesis 0

Flight attendant Flight attendant, air hostess, airhostess, cabin crew 0

Judicial law clerks

Judicial, judicial clerk, judge’s assistant, court secretary, judge’s clerk, law clerk, legal secretary, court post, court recorder

1

Maids and housekeeping cleaners

Maid, cleaner, chambermaid, maiden, cleaning, housekeeper, housekeeping

0

Motorboat operator

Boat, boat machinist, boatsman, assembling of boats, specialist boatbuilder, boat maintenance, boat builder, captain

1

Source: ESJS microdata http://www.cedefop.europa.eu/en/events-and-projects/projects/european-skills-and-jobs-esj-survey;

Frey and Osborne (2017)

36

Table A2: Factor analysis – reduction of skill requirements variables

Factor Variance Difference Proportion Cumulative

Factor 1 3.26247 2.37738 0.8641 0.8641

Factor 2 0.88509 0.60784 0.2344 1.0985

Factor 3 0.27726 0.12052 0.0734 1.1720

Factor 4 0.15674 . 0.0415 1.2135

N 46 322

Rotated factor loadings Factor 1 Factor 2 Factor 3 Factor 4

Importance of technical skills 0.5544 0.0973 -0.0828 0.2048

Importance of communication skills 0.7336 0.1021 0.1997 -0.1568

Importance of team-working skills 0.6728 0.0187 0.0485 -0.1374

Importance of foreign language skills 0.3214 0.2699 0.2395 0.1173

Importance of customer service skills 0.4532 0.0565 0.3457 -0.0536

Importance of problem-solving skills 0.7462 0.1133 0.0699 0.0946

Importance of learning skills 0.7271 0.1487 -0.0058 0.177

Importance of planning skills 0.6782 0.2189 0.071 0.062

Advanced literacy skills (level) 0.1794 0.5667 0.0665 -0.017

Advanced numeracy skills (level) 0.1155 0.5219 -0.0299 0.0444

No ICT skills (level) -0.2541 -0.3352 -0.1897 -0.0913

Cronbach α Average

inter-item

correlation

alpha

Importance of generic skills 0.53 0.85

Importance of selling-customer service skills 0.29 0.45

Source: ESJS microdata http://www.cedefop.europa.eu/en/events-and-projects/projects/european-skills-and-jobs-esj-survey

37

Figure A2: Factor loadings

Notes: Principal factors method; orthogonal varimax rotation; Rotated factor loadings (pattern matrix) and unique variances

Source: ESJS microdata http://www.cedefop.europa.eu/en/events-and-projects/projects/european-skills-and-jobs-esj-survey


Recommended