Bank Profitability and Taxation ∗ Ugo Albertazzi and Leonardo Gambacorta † Banca d’Italia, Economic Research Department January 20, 2006 Abstract This paper investigates how bank profitability is affected by the corporate income tax (CIT). For this purpose it uses aggregate data of the banking sector of the main industrialized countries, for the period 1980-2003. The main novelties with respect to the existing literature are two. First, it explicitly considers that the CIT is not specific to the banking sector so that changes in CIT rate can affect both banks and borrowing firms. With the help of a simple theoretical model we derive a set of predictions about the impact of the CIT on banks’ income statement. Second, we consider all main components of banks’ profit and loss accounts: net interest income, interest expenses, non-interest income, operating costs, and provisions. In this way, we are able to disentangle the extent to which a bank is able to shift its tax-burden forward to its lenders, depositors, and purchasers of fee-generating services. ––––– JEL Classification: C53, G20, G21. Keywords: Tax-Shifting, Corporate Income Tax, Bank profitability. ∗ We would like to thank Harry Huizinga and Stefania Zotteri for helpful discussions and suggestions. All errors are our own. † The opinions expressed in this paper are those of the authors and do not involve the Bank of Italy. Email addresses: [email protected]; [email protected]. 1
Transcript
Bank Profitability and Taxation∗
Ugo Albertazzi and Leonardo Gambacorta†
Banca d’Italia, Economic Research Department
January 20, 2006
Abstract
This paper investigates how bank profitability is affected by thecorporate income tax (CIT). For this purpose it uses aggregate dataof the banking sector of the main industrialized countries, for theperiod 1980-2003. The main novelties with respect to the existingliterature are two. First, it explicitly considers that the CIT is notspecific to the banking sector so that changes in CIT rate can affectboth banks and borrowing firms. With the help of a simple theoreticalmodel we derive a set of predictions about the impact of the CIT onbanks’ income statement. Second, we consider all main components ofbanks’ profit and loss accounts: net interest income, interest expenses,non-interest income, operating costs, and provisions. In this way, weare able to disentangle the extent to which a bank is able to shiftits tax-burden forward to its lenders, depositors, and purchasers offee-generating services.
–––––JEL Classification: C53, G20, G21.
Keywords: Tax-Shifting, Corporate Income Tax, Bank
profitability.
∗We would like to thank Harry Huizinga and Stefania Zotteri for helpful discussionsand suggestions. All errors are our own.
†The opinions expressed in this paper are those of the authors and donot involve the Bank of Italy. Email addresses: [email protected];[email protected].
1
1 Introduction
The issues related to the taxation of financial intermediaries are of greatinterest because the banking sector plays a crucial role in the allocation ofresources and the growth process. Nevertheless, as noted by Caminal (2004),most of the attention of economic research has been devoted to the effects ofliberalization of the financial industry, privatization of banks, optimal designof the regulatory environment; on the contrary, bank taxation has receivedrelatively little attention, in spite of the fact that it is often a significantsource of tax revenue in many countries. Interest in the taxation of finan-cial firms has been recently increasing in connection with policy issues inthe European Union, where the attempt of creating a common market forbanking services has not yet achieved satisfactory results despite massivederegulation. In this respect, it has been argued that the persistent segmen-tation of national markets can also be connected with differences in the fiscaltreatment of resident banks (Huizinga, 2003).
This paper focuses on the effects of the corporate income tax on bankprofitability.1 We take into account possible interactions between the bankingand the firm sector: an increase in the corporate income tax rate could modifyloan and deposit demand schedules, so that banks’ prices are modified takinginto account this effect. For this reason it is difficult to establish a prioriwhat is the total effect on bank margins, that will depend upon demand andsupply elasticities.2 This effect can be influenced also by institutional andother credit market characteristics. In particular, economic theory suggeststhat the possibility for a bank to shift an increase in the tax burden to itscustomers directly depends on the competitiveness of the market in which itoperates. The analysis should therefore take into account the great changesdue to the effect of deregulation over time.
The literature stresses the fact that corporate income tax distorts thecapital structure and raises the average cost of capital. In the case of banksthe effects of corporate taxes are quite different since banks are subject toregulation that influences their liability structure. For example, in the pres-ence of a minimum capital requirement, substitution effects between equity
1Although the financial sector is subject to general income taxation, with regard toother forms of taxes, in most countries it receives a special treatment. For instance,financial services are often exempted by VAT, mainly in connection with difficulties inmeasuring value added (De Bonis, Monacelli and Pazienza, 2005); banks enjoy below-costdeposit insurance and bailouts in cases of financial collapse. On the other hand, banksbear special taxes such as unremunerated reserve requirements (Fama, 1980) and serve astax collecting subsidiaries of their clients (withholding taxes on the capital income). Fora complete analysis of the taxation of financial firms see Monacelli and Pazienza, 2005.
2For a general reference on the issue of tax shifting, see Atkinson and Stiglitz, 1980.
2
and other forms of financing are very limited for a bank (Gambacorta andMistrulli, 2004). This means that after a reduction of the CIT rate, loansupply may simply reduce as it would happen with any other firm after anincrease of the marginal cost.
The macroeconomic consequences of a tax-shift are analyzed in the the-ories of fiscal repression (Demirgüç-Kunt and Huizinga, 1999); this part ofthe literature stresses the fact that the growth possibilities of an economyare largely affected by the size and efficiency of its financial sector, whichgovern the capital accumulation and allocation processes. Nevertheless, it isreasonable to presume that the importance of the distortions generated bythe taxation of financial services are closely dependent on whether who isactually carrying the tax burden is the bank or its customers.
This paper studies the link between bank profitability and taxation byusing data for ten industrialized countries over the period 1981-2003. Thedataset includes yearly figures from the balance sheet and income statementof aggregated national banking industries reconstructed on a comparable ba-sis using OECD and national central banks data. Data are collected andtreated in an harmonized way that minimizes the effects of differences in ac-counting and statistical definitions and allows meaningful comparison acrosscountries. It’s worth stressing that OECD data area collected on an indi-vidual basis and are not consolidated. As a measure of taxation we use thecorporate income tax rate that can be reasonably considered exogenous fortwo reasons: i) it is not affected by banks’ choices, as the effective tax ratewould be (the ex-post tax rate); ii) it is not industry-specific, so that it cannot be said that its level is somewhat determined by policy makers by takinginto consideration how it will affect the banking sector.
The main novelty of the paper lies in a comprehensive analysis of theeffect of tax-shifts on all income statement components. This helps us toassess the effects among the different customers. For example, we try tounderstand not only if the net interest margin (the difference between theinterests received from borrowers and those paid to depositors) is affected bythe level of the corporate income tax levied on banks’ profits, but also if thepossible tax shifting is against depositors or borrowers.
The remainder of the paper is organized as follows. The next sectiondiscusses how bank profitability and taxation evolved in the period underexamination. Section 3 presents a simple theoretical model on the effectof the corporate income tax on bank profitability. Section 4 presents theeconometric model and the empirical results. The last section summarizesthe main conclusions.
3
2 Some facts on bank profitability and taxa-
tion
Since the mid-eighties, dramatic changes in regulation, demand compositionand technology have modified the structure and the boundaries of creditmarkets.3 All these changes have strengthened competition, especially in thetraditional lending activity, reduced intermediation margins and stimulatedbanks to diversify their sources of revenues and increase efficiency in produc-tion and distribution. The introduction of the euro has eliminated most ofthe residual barriers to competition among the banking system of the coun-tries that have adopted the common currency.4 However, the taxation ofbanking in Europe is far from being integrated: the overall fiscal treatmentof banks remains the purview of national authorities, subject to Europeandirectives and regulations that impose minimum standards on their policies(Huizinga, 1999).
The aim of this section is to investigate if changes in the corporate incometax brackets (CIT rate, from now on) may have influenced some pattern thatwe observe in the banking industry. For example, since the mid-ninetiescross-country variability of both gross income and profit before taxes (as apercentage of total assets) has decreased in the euro area (Fig. 1a). This factmatches with the convergence of corporate income taxation among main Euroarea countries (Fig. 2a). On the other hand, when we include in the analysisAnglo-Saxon banking systems both the dispersion in bank profitability (Fig.1b) and taxation (Fig. 2b) remain ample, even if the CIT rate declinedconsiderably everywhere.
Tables 1 and 2 show the main macroeconomic and bank indicators divid-ing the sample in two sub-periods: 1981-1992 and 1993-2003. Strong differ-ences in the two periods emerge not only in the real and financial indicatorsbut also in the CIT rate.
The inflation rate has been sharply decreasing in every country considered(see Table 1). The sharpest declines are observable in the euro area, whereinflation went down from an average of 6.7 in the years 1981-1992 downto 2.5 per cent in the years 1993-2003. This is largely connected with the
3We can think, for example, of the liberalization of branching in Italy in 1990 (Ciocca,2000), of the abolition of geographical constraints to banking activity in the US after theintroduction of the Riegle-Neal Interstate Banking and Branching Efficiency Act in 1994(Berger, Kashyap and Scalise, 1995). For an analysis of credit market deregulation onbanking activity see, among others, Bhattacharya, Boot and Thakor (1998).
4Berger, DeYoung and Udell (2000) stress the fact that linguistic, cultural, regulationdifferences, and long distance coordination problems may still counterbalance the benefitof cross-country consolidation activity.
4
convergence process towards the adoption of the single currency. Within theeuro area the most visible shrinking has been recorded in those countries,like Italy, where the inflation rate started from the highest levels.
Following the behavior of the inflation rate, interest rates also show amarked decline. It is even more important to point out that the differencebetween the short-term lending rate and the deposit rate (the spread) alsodeclined. The spread is often taken as a proxy for the level of competition inthe national banking industry. Its reduction reflects the process of deregula-tion of the banking sector which came together with the financial stabiliza-tion. This indicator remains still above that registered in the Anglo-Saxoncountries.
Financial stabilization and deregulation had important implications onthe income statements of banks. First, there has been a shift from net interestincome to other income not depending on traditional financial intermediation.Following the reduction in the spread, net interest income, as a percentageof total assets, declined sharply in the euro area while it remained stable inthe United States and in United Kingdom (see Table 2).5
On the contrary, non-interest income has increased its importance in thelast years (Fig. 3a). The decline in interest margins has changed the tradi-tional role of banks and has forced them to search for new sources of revenuessuch as trading, services and other financial operations. Diversification hasbeen sustained by the greater propensity of households to invest in finan-cial assets other than government bonds, and by the higher opportunitiesfor firms to access the capital markets. Moreover, structural changes likeindustry deregulation, new information technologies and financial innovationhave increased the importance of fee income.6 The ratio between non-interestincome and gross income has increased sharply in every country considered.The smallest increase is observed in United Kingdom, which is where thisratio started from the highest level. In the United Kingdom, the main Eu-ropean financial market, banks have been traditionally prone to provide dif-ferent services other than those related to the pure intermediation activity.In this respect, Italian, German and Spanish banks lag behind (net interestincome is still a large part of their gross income); this could reflect the strong
5However, as noted by DeYoung and Rice (2004a) the stability of the net income-to-total assets ratio in the U.S. basically depends on lending securitization activity thatreduced loan assets by 10 percentage points between 1986 and 2003. In the same periodnet interest income as a percentage of gross income decreased by 15 percentage points to55 per cent.
6DeYoung and Rice (2004b) stress the fact that fee-based activities like trust services,mutual fund sales and cash management require little or no regulatory capital. This shouldallow banks to use a greater “degree of financial leverage”.
5
lending relationship which is often said to characterize these countries andthe lower development of their stock markets. Given such sharp differences,it becomes interesting to check whether these changes have been fostered oropposed by taxation (we will see that, because of capital requirements, cor-porate income taxation has an impact on revenue diversification); tax-shiftsare indeed dependent on the demand elasticities of each bank product toprice changes, the market power of a bank with respect to her customers andthe effects of fiscal change on firms and households maximizing choices.
Provisions and operating cost show a sharp reduction comparing the twoperiods. These income statement components are less likely to be stronglyaffected by changes in income taxation. The reduction in the level of pro-visions is not easy to interpret; it can be seen as a signal of a lower levelof risk faced by banks but also as a less prudent strategy followed by theirmanagers. The downward trend in operating expenses (fig. 3b) is mainlydue to advances in information, communications and financial technologiesthat have allowed banks to render many of their traditional services moreefficiently (see Albertazzi and Gambacorta, 2005).
Bank profitability (measured by the return on equity, ROE) has slightlydiminished in the euro area, possibly in connection with the increase in com-petition. In the United Kingdom and the United States, where the bankingsystem liberalization process started earlier,7 the ROE remains well abovethe euro area average. The higher level of profitability of Anglo-Saxon banksin the past is usually explained by structural factors or by different macro-economic performance. In the past higher profits were due to the greatercapacity of Anglo-Saxon banking systems to diversify their revenues on non-traditional markets (Bowen, Hoggarth and Pain, 1999) or to expand theiractivities on off-balance sheet items, such as derivatives (Boyd and Gertler,1993).8 Though the determination of the factors underlying the different
7In the United Kingdom, bank despecialization, the reduction of segmentation in thecredit markets and the developing of a more market oriented economy started in theseventies (Llewelling, 1990). In the United States changes in market regulation, bank or-ganization and market structures has started in the eighties (Berger, Kashyap and Scalise,1995).
8According to microeconomic studies, the differences in the level of profits observed inthe nineties between Anglo-Saxon and European banking systems reflect only to a smallextent differences in the average bank size or efficiency. For example, few studies (Bergerand Mester, 1997, and Hughes and Mester, 1998, for the United States; Altunbas, Molineuxand Thornton, 1997, and Schure and Wagenvoort, 1999, for Europe) show that the costfunction has a very flat U shape (with a minimum at about 10 billion US dollars of totalasset). Also managerial efficiency (the so-called x-efficiency) does not show appreciabledifferences across countries (Berger and Humphrey, 1997, for the United States, Schureand Wagenvoort, 1999, for Europe).
6
level of profitability observed in the two groups of countries is beyond thescope of this study, we want to underline how taxation could have played arole in each profit component.
In summary, the structural changes which took place starting from themid-eighties, had important effect on the composition of the income state-ment of the banking sector: the ratio of non interest income to gross in-come increased, while operating expenses and provisions decreased. In orderto understand whether these facts could have been somehow influenced bychanges in the corporate income tax, we develop a simple theoretical frame-work model, whose main predictions will be tested in the empirical section.
3 A theoretical model
In this section we sketch out a simple model that can show what are themechanisms by which a change in the economy wide CIT rate can affect thedifferent items of the income statement of banks. It is useful to start withtwo preliminary remarks.
The first one is that the CIT is not specific to the banking sector; inother words the tax burden is on the profits of all firms, and not just onbanks. Accordingly, a change of the CIT rate will determine distortions onthe choices not only of banks but also of all other corporations. This impliesthat the tax shifting can go in both directions: on one hand banks will tryto shift the tax burden by asking higher interest rates on loans and fees orby paying lower interest rates on deposits; on the other hand, firms will tryto shift their CIT toward their counterparts, banks included.9
A second remark is that, as it is well known in public economics,10 the CITcan generate two different effects. One is the output substitution effect whichpostulates that an increase of the CIT determines a decrease of productionin the incorporated sector.11 On this basis we assume that the demand ofloans faced by banks is a downward sloping function of the CIT tax rate.The input substitution effect instead is connected with the fact that CITcan be seen as a tax which makes convenient to substitute equity with other“inputs”, like labor or debt.
9In principle, we could expect an analogous effect also for depositors. For the sake ofsimplicity, we neglect this channel since deposits held by corporations are a small portionof total deposits (16.5 per cent in the euro area at the end of 2004).
10The classical theoretical reference about the effects of the corporate income tax isgiven by the model of Harberger (1962). See Atkinsons and Stiglitz (1980) for a criticalsurvey.
11The name output substituion effect refers to the fact that such contraction may bepartially compensated by an expansion of the production of the non incorporated sector.
7
Let’s consider a bank under monopolistic-competition (for example, thelocation of its branches makes its services non-perfect substitutes with thoseof its competitors). Such bank faces a downward sloping demand curve forany service provided which are classified into loans and other services differ-ent from loans. Supposing, for the sake of simplicity, linear schedules, thedemand for loans (L) and the demand for other services (S) can be written:12
L = l − liil − lττ
S = s− sff − sττ (1)
In these definitions, l, li, lb, s, sf , sτ are all positive parameters; il isthe interest rate on loans, f is the fee required on other services; τ is the(economy-wide) CIT rate. These two demand functions are decreasing in therelevant price (il and f , respectively) and they are also negatively affectedby τ .
The latter term is simply meant to capture the idea that a higher levelof corporate income taxation is in equilibrium associated with a lower levelof investment and of economic activity.13 In other words, allowing lτ and sτto be non-null is a short way to capture general equilibrium features of theproblem of tax shifting. As we will show below, this simple change has im-portant and previously neglected consequences on the theroetical predictionsabout the effect of the CIT rate on the income statement of banks.
The parameters li and sf are important since they depends on bank’smarket power in the two segments.
Symmetrically, it can also be assumed that the bank faces the followingschedule of deposit demand by households.14
D = d+ diid (2)
12We assume that parameters are such that all these expressions are always non negative.13This is the ultimate effect of both the input substitution effect and the output substi-
tution effect of the CIT on non financial firms which reduces their propensity to produceand therefore to invest. In principle lτ and sτ may not be necessarily positive. For ex-ample, one can argue that an increase in τ may induce firms to substitute equity withbank loans or with non-bank debt (which may correspond to an increase in the demand offee-generating services). In what follows we consider that these effects are of second orderimportance. We will discuss these hypotheses in Section 4.3.
14The aim of this paper is not to determine whether deposits are input or output ofa bank’s production function (see Freixas and Rochet, 1997). Talking about demand ofdeposits by savers is a mere terminological convention since in the present context thisdistinction is irrelevant.
8
The non negative parameter di represents the semi-elasticity of D withrespect to the interest rate paid on deposit (id).
Total operating costs are equal to:
C = Sc+Dc′ + Lc′′ + F (3)
where F is the level of fixed costs, c, c′, and c′′ are the constant marginal costson other services, deposits, and loans respectively. For the sake of simplicity,we assume that the marginal cost to carry out the traditional intermediationactivity is zero (c′ = c′′ = 0); moreover, also fixed costs can be normalizedto zero (F = 0).15 This hypothesis simplifies the algebra without any effecton the main results of the paper and captures the intuitive idea that oncethe fixed costs connected with the branch network are paid, an additionalloan (deposit) can be granted (taken) at negligible additional administrativecosts. On the contrary, this is not necessarily true for fee generating services.
Provisions for credit losses are obviously commensurate to the amountof loans (L), with the parameter al that represent the riskiness of bank’sportfolio:
A = a+ alL (4)
Profit before taxes are defined as:
P = (ilL− idD) + Sf − C −A (5)
The bank has to satisfy a balance sheet constraint according to whichequity (E) and deposits should be equal to the sum of physical assets andtotal lending:16
L+K = E +D (6)
In order to limit agency problems bringing to excessive risk taking, thebank is also subject to minimum capital requirements which are assumed to
15Equation (3) implies a strict separability of the costs of bank activities: we will removethis simplifying hypothesis in Section 4.3.
16Given their irrelevance with repect to the issues studied, physical assets are neglected(K = 0).
9
be binding:17
E = Lρ (7)
In a spirit similar to Caminal (2003) we introduce a fiscal effect of theCIT on the choice of a bank capital structure by assuming that the bankmaximizes:
maxid,il,f,E
P − V E
subject to (1)-(7) (8)
The maximand is a reduced form representation of the objective functionof a bank licence holder who maximizes profits by setting prices taking intoaccount the gross returns that the bank has to grant to outside equity holders(V E).18 What is important to point out is that, since outside investors caresabout net returns, V is an increasing function of the CIT τ ; for simplicitywe assume that V = φτ where φ ≥ 0 is a direct function of the percentageof E that is in the hand of outside investors.
To understand how this term influences the behavior of the managementof the bank (licence holder) consider, for example, a reduction of the CITrate. The bank, who is facing an expansion of the demand of loans, has todecide by how much to increase deposits and equity (capital requirements arebinding). Raising more deposits requires paying a higher id. Raising moreequity requires paying V , which because of the reduction of τ , is now lower.
This objective function provides, therefore, a concise way to introduce inthe model these considerations by requiring the bank’s managers to maxi-mizes profits while taking into account the fiscal wedge imposed by the CITbetween the two sources of funds: deposits and equity.
From the set of constraints and the first order conditions of the maxi-mization problem 8, we get:19
17Banks often hold excess capital in order to manage marginal and unpredictable fluctu-ations of the requirements which would take their capital below the threshold. However,in a deterministic world like this one, there would be no reason to hold excess capital(Bolton and Freixas, 2001).
18Note that if we assumed that the bank simply maximizes net profits we would notobtain any possible shifting of the bank’s CIT burden. In the expression for net profitsP (1− τ), the CIT enters as a multiplicative factor which leaves first order conditionsunaltered. In that case, the unique effects exerted by τ would be those through L and S.
19Second order conditions are also satisifed. With no effect on the main findings weintroduced the following restrictions on the intercepts: a = d = 0.
10
id = (1− ρ)l − alli − τ (lτ + liφρ)
2[di + li (1− ρ)2
]
il =(1− ρ)2 2li (l − lττ) + di (l + alli − lττ + φρliτ)
2li[di + li (1− ρ)2
]
f =s− sττ + csf
2sf(9)
It is interesting to see how the optimal level of id, il, and f depend on thedifferent parameters. For example, the optimal id is positively affected byl: a higher demand of loans (reflecting, for example, an increase in expectedprofitability) allows the bank to charge higher interest rates on loans but alsoit requires it to hold more deposits by increasing their remuneration. For asymmetric reason, id is negatively affected by τ .
The effect of a higher τ on il is less straightforward since by increasingthe CIT rate, the demand of loans shifts downward (which makes the bankchoose a lower il in order to partially compensate such downward shift); atthe same time, the bank obtains a higher marginal benefit from diminishingloans and therefore equity (and it does so by increasing il). The sign of thenet effect on the interest rate on loans (il) is ambiguous.
For a large al, which represent a situation in which banks have very riskyportfolios, the bank finds convenient to increase the optimal interest rate onloans il. On the other hand, a high il also means lower volumes of loans whichin turn requires less D and a lower id. Accordingly, il and id are positivelyand negatively influenced by al, respectively.
The optimal f increases with c and decreases with sf as intuition wouldsuggest. It also decreases with τ since a change of the CIT rate also deter-mines a shift in the demand for financial services.
It is interesting to point out the main differences with respect to Caminal(2003) who find that the CIT on banks is equivalent to a tax on loans whichleaves unaffected the interest rate on deposits. First, Caminal (2003) does notconsider that τ also has an impact on loan and other bank services demand.Second, Caminal considers perfect competition while here we coonsider amodel of monopolistic competition. If we assume perfect competition (i.e. ifwe suppose li = di = sf →∞) the derivative of id with respect to τ tends tozero, while the derivative od il does not, obtaining results which are coherentwith those of Caminal (2003).
Using these expressions we obtain:
11
NII =di4li
(l − lττ)2− (alli − φρliτ)
2
[di + li (1− ρ)2
]
OI =(s− stτ)
2− (csf)
2
4sf
C =c
2(s− sττ − csf)
A =aldi [l − alli − (lτ + liφρ)τ ]
2[di + li (1− ρ)2](10)
where NII = Lil − Did is the net interest income and OI = Sf is otherincome. A first result is that NII is positively influenced by l, the parameterreflecting the level of the general economic conditions. This is in line withthe fact that better economic conditions increase the number of projectsbecoming profitable and hence increase the demand for credit (Kashyap,Stein and Wilcox, 1993). Similarly, we obtain that OI is positively affectedby s that represents all exogenous factors influencing the demand for financialservices (i.e. stock market capitalization and volatility). On the other hand,OI is negatively affected by sf , the coefficient of elasticity of the demand ofservices S, which also is an inverse measure of the bank’s market power insuch segment. Similarly, NII is positively affected by di which is a directmeasure of bank’s market power enjoyed in the market for deposits.20
The model’s interesting predictions concern the effect of τ . By taking thederivative with respect to τ we obtain:
d
dτNII =
di[(alφρl
2
i − lτ l)−(φ2ρ2l2i − l2τ
)τ]
2li[di + li (1− ρ)2
]
d
dτOI = −
(s− sττ) sτ2sf
d
dτC = −
csτ2
d
dτA = −
aLdi (lτ + liφρ)
2[di + li (1− ρ)2](11)
The main result to be emphasized is that the effect of a change in τon the net interest income can be of either sign. In the case of a cost of
20Because of the combined effect of the CIT and of the capital requirements the signeffect of an increase of li on NII is ambiguous. However, it can be seen that for τφρ nottoo large, such derivative is always negative, as one would expect.
12
equity due to capital regulation sufficiently high (φρ > max[ ltli, lτ lall
2
i
]) the
derivative ddτNII tends to be negative (positive) for high (low) values of the
CIT rate. The intuition of this result can be easily understood noting thatτ influences the banks income statement in two ways. First, because of thecapital requirements, an increase in the CIT rate is equivalent to an increaseof the marginal cost of providing loans which always brings to a drop intheir quantity and a rise in their price (this effect is amplified if the cost ofequity due to regulation (φρ) or the elasticity of loan demand (li) are large).Second, given lτ > 0, an increase in τ determines a downward shift of thedemand of loans which determines a (further) reduction in the quantity ofloan in equilibrium but also a (compensating) reduction in lending rates.When the total impact on the price is positive (the cost effect on the pricedominates the demand shift one), we obtain two contrasting forces on thenet interest income: the amount of loans shrinks while their interest rateincreases. What is important to point out is that the price (positive) effectdominates the quantity (negative) one only for small values of the CIT rate.In other words, a small τ implies a low overall impact of the cost of equity dueto regulation and is compatibile with a large amount of loans in equilibrium:in this case an increase in the lending rate has a large impact on NII.
The mechanism is different for non interest income since bank services arenot subject to capital requirements. In this case an increase of the CIT ratedetermines an immediate reduction of demand for bank services S and thishas a negative effect on OI = Sf . Equation (9) shows that the bank reactslowering fees f in order to counterbalance the demand shift; nevertheless theoverall amount of fee-profits Sf at the optimum is reduced. Therefore in oursimple model the sign of the derivative d
dτOI is always negative. However,
since d2
dτ2OI = s2τ
2sf> 0, the impact of a marginal increase in τ onOI decreases
as τ gets large.Finally, both d
dτA and d
dτC do not depend on τ . Both derivaties are
negative meaning that an increase in taxation reduce, other things beingequal, the overall amount of provisions and operating expenses.
4 The empirical evidence
4.1 The econometric model
Following Albertazzi and Gambacorta (2005) we base the econometric analy-sis on this model:
13
Yi,t =2∑
k=1
αkYj,t−k +2∑
k=0
β′kXj,t−k +(γ1τ j,t + γ2τ
2
j,t
)+ θtTt + ηj + εj,t (12)
Index j denotes the countries in the panel, t represents years. Yj,t isthe income statement component examined, Xj,t is a vector of control vari-ables, Tt is a vector of year-dummies, ηj is an unobservable time-invariantcountry effect, and εj,t is a well behaved error term. In particular, Xj,t =[GDPj,t, DCPIj,t,MMRj,t, LTRj,t, SMCj,t, BLj,t, SMVj,t, TAj,t]whereGDPj,tstands for the real GDP of country j in year t, DCPIj,t is the rate of infla-tion, MMRj,t is the money market rate, LTRj,t is the long-term governmentbond interest rate, SMCj,t is the stock market capitalization divided by GDP,BLj,t is the total amount of bank loans divided by GDP, SMVj,t is the stockmarket volatility, TAj,t is total asset of the entire banking sector. All vari-ables are taken in logs except interest rates and ratios. See the Appendix forother details on the dataset.
The emphasis of the analysis is on the term γ1τ j,t + γ2τ2
j,t which is theimpact on Yj,t of the corporate income tax rate (τ j,t).
21 Such componentincludes a quadratic term in order to capture non linear effects postulatedby the theoretical model in Section 3. For some of the other regressors(GDPj,t, SMCj,t, V SMj,t) the theoretical model is able to produce someprediction which may be tested; the remaining regressors are used as controlvariables, coherently with previous studies which analyze the link betweenbank profitability and the business cycle.22
The model has been estimated using the GMM estimator suggested byArellano and Bond (1991) which ensures efficiency and consistency providedthat the residuals do not show serial correlation of order two and that theinstruments used are valid (which is tested for with the Sargan test). Table3 shows the results for: net interest income, other income, operating costs,provisions, and profit before tax. While lagged values of the dependent vari-able are significant, those of the regressors turned out to be almost alwaysnot significant and were not reported in the table (if not stated differently).
4.2 Net interest income
The first column of Table 4 reports the results for the net interest income. Asalready pointed out in the literature, profits obtained by banks in their tra-
21The data used are statutory tax rates which include both the national corporateincome tax and (an average of) the local ones.
22See Albertazzi and Gambacorta (2005) for details and references.
14
ditional lending activity are correlated to business cycle indicators like GDPand long term interest rates. Moreover, they are higher in those countrieswhere both the financial market and the banking sector are more developed.
As shown in the estimation results, both γ′s turn out to be significant;the coefficient for the linear term with a positive sign, while the one for thequadratic term with a negative sign. In Figure 4, we use the coefficients ofTable 3 to plot the estimated marginal effect of τ on net interest income
(ˆ
γ1+2ˆ
γ2τ). Such expression is decreasing, significantly greater than zero forsmall levels of τ and significantly less than zero for large levels of τ .
Expressions (11) reveals that a necessary condition for this pattern isthat ρφli be sufficiently large. In other words, the effects of the capitalrequirements should be sufficiently strong.
What is interesting to point out is that these results confirm the ideathat, when analyzing the effects of taxation on banks, it is important toadopt a general equilibrium approach: τ influences both banks’ marginalcost, bacause of the capital requirements, and the intercept of the demandof loans.
4.3 Non-interest income
The second column of Table 4 shows the results for the non-interest income.The diagnostic tests are well behaved; one lag only of the dependent variableis significant.
Non interest income is not significantly influenced by real GDP fluctua-tions, coherently with the idea suggested in the literature that these servicesconstitute an effective tool to stabilize banks profits. Non-interest incomeshows a strong negative correlation with long-term interest rates, which maybe connected with the losses of value of fixed rate securities in banks’ portfo-lios. Finally, it is positively affected by the stock market size and volatility.The first effect is in line with the idea that the possibility to provide differenttypes of banking services included is higher when local financial markets aremore developed. The effect of volatility is likely to be connected with the factthat these services are more needed when uncertainty is higher (portfolio aremore often readjusted and firms buy more derivatives for hedging purposes).
With regard to the effect of the CIT, it can be seen that both the coeffi-cients associated with τ and its square are significant. The marginal effect ofτ may be either negative or positive (for small and large levels of τ , respec-tively; see figure 4b). Coherently with the theoretical model, and contraryto what happens with the net interest income, these coefficients imply anincreasing marginal impact of τ on non-interest income. Moreover, as shown
15
in Figure 4, the marginal effect of τ on non-interest income is significantlydifferent from zero only for small values of τ where it is negative, exactly asimplied by the model. The interpretation is the following: given that capi-tal requirements do not involve fee-generating activities, the unique way inwhich the CIT has an impact on non-interest income is through a shift ofthe demand of such services which always brings to a reduction of revenues(if the demand shifts downward, both the quantity and the price decrease).
4.4 Operating costs
The third column of Table 4 reports the results for the operating costs.The tests performed do not detect specification problems. Two lags of thedependent variable are included.
As intuition would suggest, operating expenses show a scarce correlationwith the business cycle. They are instead influenced by inflation (probablyin connection with some level of wage indexation, at least in the first partof the sample) and by the level of development of local financial markets(in coherence with the idea that the more sophisticated the services to beprovided, the higher the personnel costs).
As suggested by the theoretical model, only the linear term turns out tobe statistically significant and with a negative coefficient. When τ goes up,the demand for services decreases and the lower fees charged by the bankingsector only partially compensate such shift and operating costs, which areproportional to S, diminish.
As suggested by alternative model specification and coherently with thetheoretical model, the marginal impact of τ on C does not change signifi-cantly with the level of real economic activity.
4.5 Provisions
The fourth section of Table 3 displays the results for provisions. Credit lossesand readjustment values are negatively correlated with GDP and long-terminterest rates, while they increase with short-term interest rate and stockmarket volatility.
The negative sign for GDP is in line with Salas and Saurina (2002),Arpe et al. (2001), and Laeven and Mainoni (2003): when real economicconditions improve, banks expect lower future credit losses and diminishprovisions accordingly. The negative impact of long-term interest rate isrelated to the fact that such variable (as GDP) tends to rise in periods ofgood economic conditions, which are characterized by a smaller probability ofdefault. Provisions increase with the money market rate, consistently with
16
the “financial stability hypothesis” (Fisher, 1933; Minsky, 1975 and 1982;Kindleberger 1978): high interest rates increase the burden for borrowersand their default probability.
With regard to taxation, the results show that γ1 is negative, as expectedfrom equation (10), but not significant.23
4.6 Profit before taxes
The final column of Table 3 presents the results for the profit before taxes.Given that these are defined as gross income (the sum between net in-
terest income and non-interest income) at the net of operating expenses andprovisions, this regression represents a summary of the previous four.
The tests performed are again well behaved. Two lags of the dependentvariable turns out to be significant.
Contrary to what happens when we consider the different componentsseparately, the square of the CIT rate is not statistically significant, showingthat the opposite signs of the two relevant coefficients in the regressions forthe net interest income and the non interest income, wash out.
The overall effect of an increase in the CIT rate is an increase in profitbefore taxes which shows that banks can shift at least part of the CIT. Thisis coherent with findings of Demirgüç-Kunt and Huizinga (2001). As weemphasized above, for high level of τ banks tend to shift toward buyers offee-generating services. On the contrary, for low level of τ banks tend to shiftmore toward borrowers and lenders. In the latter case, it becomes interestingto analyze if depositors or borrowers are bearing the cost of such tax shifting.This is what next paragraph is about.
4.7 Borrowers or depositors?
As we pointed out in section 4.2, the coefficients γ1 and γ2 in the regressionfor net interest income are both significant. From Figure 4, it emerges thatfor low levels of the CIT rate, a marginal increase in taxation has a positiveeffect on the net interest income, which signals tax shifting from bank towardsborrowers and depositors. On the contrary for high levels of the CIT thebank suffers a reduction of the overall amount of profits in the “traditional”intermediation activity: the negative effect produced directly by the CIT
23The uncertainty on the sign of the derivative dAdt
is consistent with a more generalformulation of the equation for provisions such that, for given L, A can be also considereda direct function of the interest rate paid on loans: A = a+ aLL+ aiil. The motivationfor this exressions, which would have left unaltered all the main conclusions of the model,is that il represents a proxy for the risk faced by the bank in the lending relationship.
17
on loan demand and the higher costs of capital requirements more thancompensate a possibile increase of the spread. In other words, for high levelof the CIT rate the price effect is more than compensated by the quantityeffect.
This aim of this section is to shed some light on the price effect. In ourmodel tax shifting may occurr in two ways: through an increase of the interestrate on lending (il) or through a decrease in the interests rate on deposits(id); it is therefore interesting to disentangle the effects on the spread (il−id)via the mark-up (il − im) and via the mark-down (im − id).
We have therefore estimated the following model:
(ik − im)i,t =2∑
k=1
(ik − im)j,t−k +2∑
k=0
β′kYj,t−k + γ1τ j,t + θtTt + ηj + εj,t (13)
where the subscript k = (l, d) while im represents the money market in-terest rate. In dealing with a spread variable, we used as control regres-sors Yj,t = [∆GDPj,t, (TA/GDP )j,t,MMVj,t] ,where MMVj,t stands for themoney market volatility. Following equations (9) only the CIT rate in linearterm has been considered (γ2 is never significant).
Table 4 shows the results of this exercise. Consistently with the predic-tion of the dealership model by Ho and Saunders (1981) and its extension byAngbazo (1997) the mark-up and the mark-down are positively correlatedwith higher money market volatility. However, only the effect on the mark-up is statistically significant. The same occurs for the degree of financialdeepness of the banking sector, measured by the ratio between total bankingassets and GDP, that tends to reduce mostly the mark-up. Real GDP growthdetermines an increase of deposit demand and therefore, other things beingequal, a positive effect on the mark-down. On the contrary the effect of anincrease in real GDP on the lending interest rate, even if positive, is statis-tically not significant. As stressed by Melitz and Pardue (1973) this couldbe associated with an increase in self-financing that tends to reduce the pro-portion of bank debt and may counterbalance the positive effect exerted onlending demand by higher economic activity (Friedman and Kuttner, 1993).
A one per cent increase in the CIT rate increases the spread by 7 basispoints. The effects is more pronounced for borrowers (6 basis points) thanfor depositors (1 basis point). This result is coherent with Caminal (2003)according to which competition and the presence of binding capital require-ments makes the corporate income tax (essentially a tax on equity) work as atax on loans, leaving therefore depositors unaffected. As discussed in Section
18
3 these findings calls for a situation of perfect competition. In this case evenin our model the derivative of id with respect to τ tends to zero, while thederivative od il does not, obtaining results which are coherent with those ofCaminal (2003).
Results on the mark-up and the mark-down mirror the findings for netinterest income (see figure 4a): since the effect on the spread is independentof the level of τ ,only for high values of the CIT rate the negative effect on thevolume of intermediated funds tend to dominate the positive price effect.24
4.8 Extensions and robustness checks
In order to better understand and to corroborate the results reported above,we carried out some more specific investigations and some robustness checks.
4.8.1 Analysis of the tax burden
As shown in the fifth column of table 3, in the equation for the profit beforetaxes, the CIT rate turns out to be significant and with a positive sign. Thissuggests the possibility of banks to shift part of the tax burden.
However, the specification adopted does not allow to get a quantitiveappraisal of the extent to which banks are actually able to operate such taxshifting. A first try consists in estimating a regression like equation (12) forthe profit after taxes. The results of this exercise reveal that the CIT rate τ i,thas a negative but non significant coefficient (−0.312 with a standard errorof 1.158)25. This means that an increase in taxation is likely to determinea drop in banks’ profits after taxes which is not significantly different fromzero; in other words, this evidence says that banks are able to shift large partof their tax burden.
An interesting check which can be made at this regard is to see if thisresult is influenced by the market power held by banks which, in the presentdataset, may be (roughly) measured by the interest rate spread. We rerunthe model specification (12) for the profit after taxes adding an additionalregressor given by τ i,t (il − id)i,t. While the coefficient for τ i,t remains notsignificant (−0.270 with a standard error of 1.170), the one for the interaction
24In order to corroborate results for the mark-up and the mark-down we have reesti-mated the benchmark model (1) for both the interest received on loans (ilL) and thosepaid on deposits (idD). Also in this case the effect of the CIT rate on NII comes via theinterest rate on loans, leaving all the other results unchanged.
25Results are unchanged if we include the quadratic term for τ and we consider thederivative for any value of τ , as we did for the net interest and the non-interest income.
19
term turns out to be significant and of the predicted positive sign (0.139 witha standard error of 0.068).
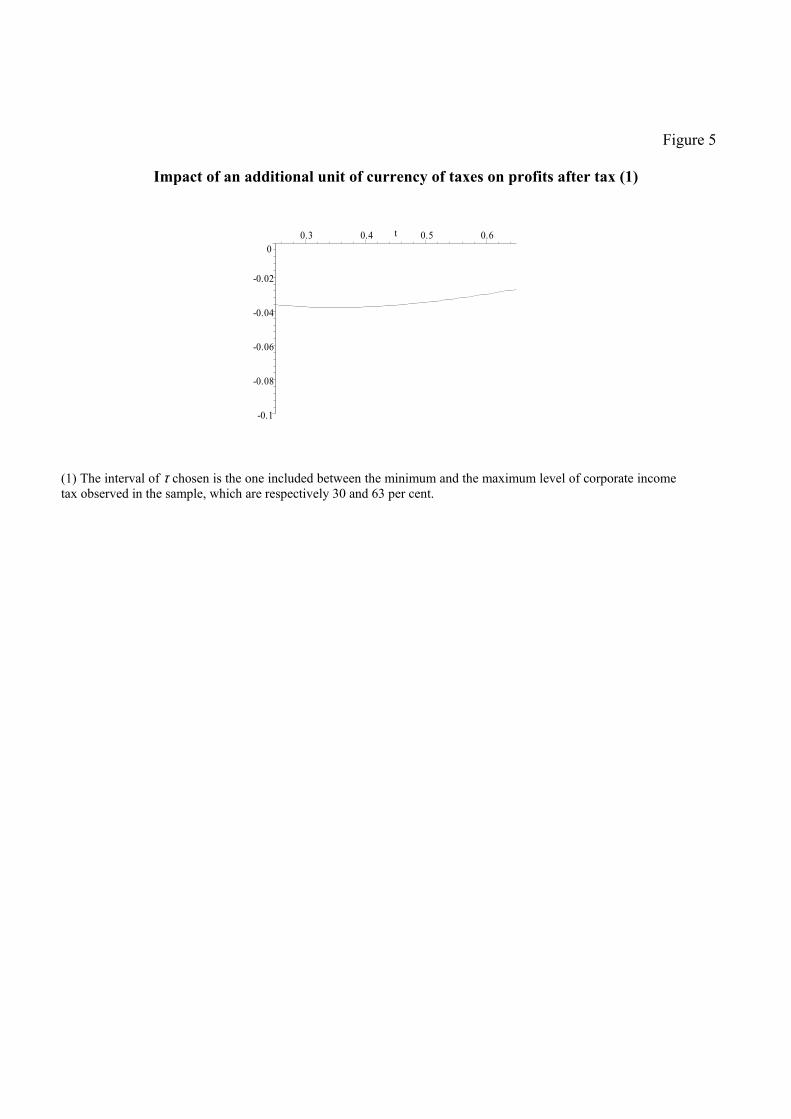
A better quantification of the tax burden for banks may be obtainedby computing the impact on profits of an additional unit of currency oftaxes. Few calculations allows to derive these quantities from the estimatedcoefficients of equation (12) for profit before taxes and profit after taxes.26
Figure 5 plots the result of this exercise and shows that if taxes are raisedby one euro, the reduction in banks profit after taxes is a slightly decreasingfunction of the CIT rate, which is never significantly different from zero andwith an average close to 3 cents.
Given that the above calculations are based on an approximation,27 as arobustness check we tried to corroborate the results by running a regressionfor banks profits similar to equation (12) but in which the tax rate hasbeen substituted by the amount of taxes actually paid.28 It turned out thatwhile in the regression for the profit after taxes the amount of taxes is notsignificant (-0.108 with a standard error of 0.137), in the one for profit beforetaxes the coefficient is almost equal to one and highly significant (0.945 witha standard error of 0.149).29
To sum up, banks display the ability to shift at least 90 per cent of theircorporate income tax burden, depending also on the competitive pressurethey face. This happens mainly through a reduction in operating costs andprovisions and, though not for very high levels of the CIT rate, an increase ofthe net interest income. It is interesting to note that, such tax shifting occurseven if, at least for low levels of taxations, non-interest income decreases (theonly effect that the CIT rate exerts on this income component is through ashift of the demand for fee-generating services which always implies a loss ofrevenues). Finally, coherently with the predictions of the theoretical model
26Denoting T the amount of tax paid by the bank, we have T = PBTτ which implies∂T/∂τ = ∂ (τPBT ) /∂τ = PBT + τ∂ (PBT ) /∂τ . This expression can be used to get the
following derivative ∂PAT/∂T = βPAT
(1−τ)1+βPBT ∗τ
, where βPAT = ∂ ln (PAT ) /∂τ and βPBT =
∂ ln (PBT ) /∂τ .27The starting equality T = PBTτ is valid for the effective (ex-post) CIT rate, while
the one we use in the regressions, for reasons related to possible problems of endogeneity,is the ex-ante one.
28Moreover, all variables previously taken in logarithm are left in levels, so that thecoefficient for the taxes can be interpreted as the impact on profits of an additional euroof taxes.
29This test is also useful in order to corroborate the findings with respect to another issueemphasized in the litearture. In fact, Huizinga and Laeven (2005) shows that multinationalfirms engage in substantial international profit shifting activities. This may render thestatutory tax rate not a perfect measure of the taxation actually beared by banks (acriticism which does not apply to the amount of taxes actually paid).
20
(for sufficiently competitive banking sectors), tax shifting on net interestincome takes place mainly through a rise in the interest rate on loans.
4.8.2 Differences across periods and groups of countries
In section 2 it has been argued that important structural changes concerningboth the real economy and the banking sector occurred from the first part ofthe sample (1981-1992) to the second one (1993-2003). For this reason it isnatural to investigate whether the results presented above holds indifferentlyacross sub-periods. In order to do so we estimated the benchmark modelfor all income components by allowing the effect of τ j,t and τ2j,t to differbetween the first and the second sub-period. In particular we have insertedin equation (1) the following term
(γ∗1τ j,tdt + γ∗
2τ 2j,tdt
)where dt is a dummy
that takes the value of 1 in the period 1993-2003 and 0 elsewhere. It turnedout that both coefficients γ∗
1and γ∗
2were not significant at conventional levels
in all the equations.As a second test, we estimated the model by allowing the effect of τ j,t and
τ 2j,t to differ between euro area and Anglo-Saxon countries. In this case wehave estimated the benchmark model for all income components by addingin equation (1) the following term
(γ∗1τ j,td
At + γ∗
2τ 2j,td
At
)where dAt is a dummy
that takes the value of 1 in the case of the US or the UK. Even in this caseboth coefficients γ∗
1and γ∗
2were never significant at conventional levels.
5 Conclusions
In this study we investigated, both from a theoretical and an empirical per-spective, how bank profitability is affected by the corporate income tax.
The theoretical model, though extremely simplified, has shed some lighton the different channels through which the CIT operate and how they in-teract. A first “direct” effect is connected with the presence of capital re-quirements and with the fact that the CIT is a tax on equity: accordingly,the CIT influences banks’ behavior by making lending more or less costly.A second “indirect” channel, not previously emphasized in the literature, isdue to the fact the the CIT is not specific to the banking sector: accordingly,the CIT may indirectly influence banks by moving upward or downward thecorporate demand of loans and of fee-generating services. In other words,the sign of tax shifting is uncertain a priori since the CIT affects banks andnon financial corporations as well.
Both mechanisms determine the presence of non linear relationships whichdiffer across the different components of the bank’s profits. In particular,
21
with regard to the net interest income, the indirect channel implies an in-creasing marginal effect while the direct effect implies a descreasing marginaleffect which may more than compensate the former. With regard to noninterest income, only the indirect effect is relevant (capital requirements donot involve fee-generating services) so that an increasing marginal effect isexpected. Moreover, the model suggests that the sign of the marginal impactdepends on the level of the CIT rate but also on a set of parameters like theelasticity of the demand of loans and of other banking services. All thesepredictions find support in the evidence produced in the empirical section.
A further examination consisted in checking whether the effect on netinterest income derives from the interests paid to depositors or from thosereceived from borrowers. Confirming the theoretical conjectures put forwardin the literature, at least for sufficiently competitive banking industries, itturns out that all the effect is through the interests received from borrowers.
Finally, banks display the ability to shift at least 90 per cent of theircorporate income tax burden, depending also on the competitive pressurethey face. This happens mainly through a reduction in operating costs andprovisions while tax shift on net interest income is more likely to occur forlow level of the CIT rate when the cost of equity due to regulation is low.No significant differences on the link between bank profitability and taxationemerges comparing the eighties with the nineties or euro area and anglo-saxoncountries.
22
Appendix: technical details on the data
The dataset includes figures for 10 countries over the period 1981-2003.We have analyzed 8 euro area countries (Germany, France, Italy, Spain, TheNetherlands, Austria, Portugal and Belgium), the United States and theUnited Kingdom. Data on income statements (net interest income, non-interest income, operating costs, provisions, and profit before taxes) and totalassets for the period 1981-2001are taken from OCSE Bank Profitability. Forthe period 2002-2003 data have been reconstructed using data from DeutscheBundesbank for Germany, Banco de Espana for Spain, Banca d’Italia forItaly, Dutch National Bank for the Netherlands, Banco de Portugal for Por-tugal, FDIC for the US and the BankScope database (Fitch-Ibca) for theremaining countries.
Total lending has been obtained by national harmonized statistics forcountries belonging to the euro area and from IMF Financial Statistics forUnited Kingdom and United States. Data on total lending for euro areacountries were not always available on the entire time period. For thoseyears we have reconstructed them backwards using the growth rates of IMFstatistics figures.
From IMF Financial Statistics we also obtained a set of macroeconomicindicators: consumer price index, gross domestic product, the interest ratepaid on long-term government bonds and the money market interest rate.
Data on national stock market capitalization and volatility were collectedfrom Thomson Financial Datastream. From Institute for Fiscal Studies weobtained information on statutory tax rates which include both the nationalcorporate income tax and the local taxes (their average across regions), wherethey exist. In the case of Netherlands, where the corporate income tax isprogressive, we used the maximum marginal rate.
23
References
[1] Albertazzi U. and Gambacorta L. (2005) “Bank Profitability and theBusiness Cycle”, mimeo, Banca d’Italia.
[2] Altunbas Y., Molyneux P. and Thornton J. (1997), “The Cost Implica-tions of Hypothetical Bank Mergers in Italy”, Economia Internazionale,Vol. 49, No. 1, pp. 1-18.
[3] Angbazo L. (1997), “Commercial Bank Net Interest Margins, DefaultRisk, Interest-rate risk, and Off-Balance Sheet Banking”, Journal ofBanking and Finance, Vol. 21, pp. 55-87.
[4] Angeloni I., Generale A. and Tedeschi R. (1999), “La redditività delsistema bancario italiano. Confronti internazionali e tendenza di mediotermine”, in Angeloni I. (eds.), Nuovi orizzonti per il sistema bancarioitaliano, Il Mulino, Bologna.
[5] Atkinson A. B. and Stiglitz J. E. (1980), “Lectures on public economics”,Mc Graw Hill International Editions.
[6] Banca d’Italia (2001), Relazione annuale sul 2000, Roma.
[7] Bell J. (2000), “Leading Indicator Models of Banking Crises”, FinancialStability Review, Bank of England, December.
[8] Berger A.N., DeYoung R. and G.F. Udell (2000), “Efficiency Barriersto the Consolidation of the European Financial Service Industry”, Eu-ropean Financial Management, Vol. 21, pp. 55-87.
[9] Berger A., Humphrey D. B. (1997) “Efficiency of Financial Institutions:International Survey and Directions for Future Research”, Federal Re-serve System, Board Of Governors, Finance And Economics DiscussionSeries, No.11.
[10] Berger A. N., Kashyap A.K. e Scalise J. M. (1995), “The Transformationof the U.S. Banking Industry: What a Long, Strange Trip It’s Been”,Brookings Papers on Economic Activity, No. 2, pp.55-218.
[11] Berger A.N. and Mester L.J. (1997), “Inside the Black Box: What Ex-plains differences in the Efficiecies of Financial institutions?”, Journalof Banking and Finance, Vol. 21, No.7, pp. 895-947.
[12] Bolton P. and X. Freixas (2001), “Corporate Finance and the MonetaryTransmission Mechanism”, CEPR, Discussion Paper Series, n. 2982.
24
[13] Bowen A., Hoggarth G. and Pain D. (1999), “The Recent Evolutionof the UK Banking Industry and Some Implications for Financial Sta-bility”, in BIS (1999), The Monetary an Regulatory Implications ofChanges in the Banking Industry, “BIS Conference Papers”, Vol. 7,March.
[14] Boyd J. H. and Gertler M. (1993), “U.S. Commercial Banking: Trends,Cycles, and Policy”, NBER Working Paper, No. 4404.
[15] Caminal R. (2003), “Taxation of Banks; Modeling the Impact in P.Phonohan (ed.), Taxation of Financial Intermediation: Theory andPractice for Emerging Economies, pp. 31-80, The World Bank and Ox-ford University Press.
[16] Caminal R. (2004), “Taxation of Financial Intermediaries”, ELS Opus-cles del Crei, No. 15.
[17] Ciocca P. (2000), “La nuova finanza in Italia. Una difficile metamorfosi(1980-2000)”, Bollati Boringhieri, Torino.
[18] Fama E. (1980), “Banking in the Theory of Finance”, Journal of Mon-etary Economics, Vol. 6, pp. 39-57.
[19] De Bonis R., Monacelli D., Pazienza M . G. (2005) “Taxing BankingFirms: a Conceptual Framework” mimeo, Banca d’Italia.
[20] Demirgüç-Kunt A. and Detragiache E. (1999), “Monitoring BankingSector Fragility: A multivariate Logit Approach with an Application tothe 1996/97 Banking Crises”, IMF mimeo.
[21] Demirgüç-Kunt A. and Huizinga H. (1999), “Determinants of Commer-cial Bank Interest Margins and Profitability: Some International Evi-dence”, The World Bank Economic Review, Vol. 13, pp. 379-408.2
[22] Demirgüç-Kunt A. and Huizinga H. (2001), “The Taxation of Domesticand Foreign Banking”, Journal of Public Economics, Vol. 79, No. 3, pp.429-453.
[23] DeYoung R. and Rice T. (2004a), “Noninterest income and financialperformance at US Commercial Banks”, Financial Review, Vol. 39, pp.101-127.
[24] DeYoung R. and Rice T. (2004b), “How Do Banks Make Money? TheFallacies of Fee Income”, Economic Perspectives, fourth quarter, FederalReserve Bank of Chicago, pp. 34-51.
25
[25] Fisher I. (1933), «The Debt Deflation Theory of Great Depressions»,Econometrica, pp.337-57.
[26] Friedman B. and Kuttner K. (1993), ”Economic Activity and the Short-Term Credit Markets: an Analysis of Prices and Quantities”, BrookingPapers on Economic Activity, Vol. 2, pp. 193-283.
[27] Gambacorta L., Gobbi G. and Panetta F. (2001), “Il sistema bancarioitaliano nell’area dell’euro”, Bancaria, Vol. 57, No. 3, pp. 21-32.
[28] Gambacorta L. and Mistrulli P.E. (2004), “Does Bank Capital AffectLending Behaviour?”, Journal of Financial Intermediation, Vol. 13, pp.436-457.
[29] Harberger (1962).“The incidence of Corporate Income Taxation”.
[30] Ho T.S.Y. and Saunders A. (1981), The Determinants of Bank InterestMargins: Theory and Empirical Evidence”, Journal of Financial andQuantitative Analysis, Vol. 16, No. 2, pp. 581-600.
[31] Hoggarth G. and Saporta V. (2000), “Costs of Banking System Insta-bility: Some Empirical Evidence”, Financial Stability Review, Bank ofEngland, June.
[32] Hughes J.P. andMester L.J. (1998), “Bank Capitalization and Cost: Ev-idence of Scale Economies in Risk Management and Signaling”, Reviewof Economics and Statistics, pp.314-25.
[33] Huizinga H. (2003), “The Taxation of Banking in an Integrating Eu-rope”, Tilburg University, mimeo.
[34] Huizinga H. and Laeven L. (2005) “International Profit Shifting withinEuropean Multinationals”, mimeo.
[35] Hutchinson M. and McDill K. (1999), “Are All Banking Crises Alike?The Japanese Experience in International Comparison”, NBER, Work-ing Paper, n. 7253.
[36] Kaminsky G. (1999), “Currency and Banking Crises: The Early Warn-ings of Distress”, IMF, Working Paper, n. 178.
[37] Kashyap A. K., Stein J. C. and Wilcox D. W. (1993) “Monetary Pol-icy and Credit Conditions: Evidence from the Composition of ExternalFinance” American Economic Review, Vol. 83, No. 1.
26
[38] Kindleberger C.P. (1978), “Manias, Panics and Crashes: A History of Fi-nancial Crises”, New York, Basic Books, (trad.it.: Bari, Laterza, 1981).
[39] Kishan R. P. and Opiela T. P. (2000), “Bank Size, Bank Capital and theBank Lending Channel”, Journal of Money, Credit and Banking, Vol.32, No. 1, pp. 121-41.
[40] Llewellyn D. T. (1990), “Competition, Diversification and StructuralChange in the British Financial System”, in Boissieu C. e Fair D. (eds.),Financial Institutions in Europe Under New Competitive Conditions.
[41] Logan A. (2000), “The Early 1990s Small Banks Crisis: Leading Indi-cators”, Financial Stability Review, Bank of England, December.
[42] Melitz J. and Pardue M. (1973), ”The Demand and Supply of Commer-cial Bank Loans”, Journal of Money, Credit and Banking, Vol. 5, No. 2,pp. 669-692.
[43] Minsky H.P. (1975), “John Maynard Keynes”, Columbia UniversityPress.
[44] Minsky H.P. (1982), “Can ‘It’ Happen Again? Essays on Instability andFinance”, Armonk, New York, M.E. Sharpe.
[45] Monacelli D. and Pazienza M. G. (2005) mimeo, Banca d’Italia.
[46] Pagan A. R. (1990), “Three Econometric Methodologies: a Critical Ap-praisal”, in Granger C. W. J. (eds.) Modelling Economic Series: Read-ings in Econometric, Oxford, Oxford University Press, pp. 97-120.
[47] Schure P. and Wagenvoort R. (1999) “Who Are Europe’s EfficientBankers?”, Cahiers Bei - Eib Papers, Vol.4 No.1.
[48] Thakor A.V. (1996), “Capital Requirements, Monetary Policy, and Ag-gregate Bank Lending: Theory and Empirical Evidence”, The Journalof Finance, Vol. 51, No. 1, pp. 279-324.
Source: Authors' calculations based on data from International Financial Statistics.
Note: (1) Thousands euros for all countries except United States (thousands Dollars) and United Kingdom (thousands Sterling Pounds). - (2) Data for Portugal refers to 1990-1992; those for Spain to-1987-1992.
Note: (1) Profit after tax as a percentage of capital and reserves. - (2) 1982-1992. - (3) 1984-1992.
Source: Authors' calculations based on data from OCSE, Bank Profitability. Data for the period 2002-2003 have been reconstructed using data from Deutsche Bundesbank for
Germany, Banco de Espana for Spain, Banca d'Italia for Italy, Dutch National Bank for the Netherlands, Banco de Portugal for Portugal, FDIC for the US and the BankScope database (Fitch-Ibca) for the remaining countries.
(1981-1992)
(1993-2003)
Bank profitability (as a percentage of total assets)
Table 3
Coeff. S. error Coeff. S. error Coeff. S. error Coeff. S. error Coeff. S. error
No of countries, no of observations 10 184 10 192 10 184 10 176 10 176
Operating cost (2)Other income (2)
Regressions Results (1)
Notes: (1) The model is given by equation (1), which includes two lags in order to obtain white noise residuals. Dependent variables are in logarithm. The model has been estimated using the GMM estimator suggested by Arellano
and Bond (1991) which ensures efficiency and consistency provided that the residuals are not subject to serial correlation of order two and that the instruments used are valid (which is tested for with the Sargan test). The sample goes
from 1981 to 2003. *Significant at the 10% level. ** Idem, 5%. *** Idem, 1%. Lagged values of the independent variables turned out to be not significant and have been removed, except where indicated. - (2) Inflation rate is one
period lagged.
Net interest income
(i)
Profit before taxes
(v)(ii) (iii) (iv)
Provisions
Table 4
Coeff. S. error Coeff. S. error
Endogenous var. jt-1 0,350 *** 0,072 0,567 *** 0,073
Endogenous var. jt-2 0,131 ** 0,063
Real GDP growth rate jt 0,001 0,001 0,003 *** 0,001
Total bank assets/GDP jt -0,011 ** 0,005 -0,001 0,003
Money market volatility jt 0,044 *** 0,016 0,014 0,016
Corporate Income Tax rate jt 0,059 ** 0,027 0,009 0,021
Sargan test (2nd step; p-value) 0,74 0,32
MA(1), MA(2) (p-value) 0,00 0,71 0,00 0,41
No of countries, no of observations 10 207 10 199
Regressions results for the spread (1)
Notes: (1) The model is given by equation (1), which includes two lags in order to obtain white noise residuals. The model has been
estimated using the GMM estimator suggested by Arellano and Bond (1991) which ensures efficiency and consistency provided that the
residuals are not subject to serial correlation of order two and that the instruments used are valid (which is tested for with the Sargan test).
The sample goes from 1981 to 2003. *Significant at the 10% level. ** Idem, 5%. *** Idem, 1%. Lagged values of the independent variables
turned out to be not significant and have been removed.
Source: Coefficients of variation (ratio of cross-country standard deviation to simple mean).
Figure 3
(a) Revenue diversification
(b) Cost-to-income ratio
Source: Authors' calculations based on data from OECD, Bank Profitability. Data for the period 2002-2003
have been reconstructed using data from Deutsche Bundesbank for Germany, Banco de Espana for Spain,
Banca d'Italia for Italy, FDIC for the US and the BankScope database (Fitch-Ibca) for France and the UK.
0.0
0.5
1.0
19
81
19
82
19
83
19
84
19
85
19
86
19
87
19
88
19
89
19
90
19
91
19
92
19
93
19
94
19
95
19
96
19
97
19
98
19
99
20
00
20
01
20
02
20
03
ITALY GERMANY FRANCE SPAIN UNITED KINGDOM USA
Non-interest income
(percent of gross income)
0.5
0.6
0.7
0.8
1981
1982
1983
1984
1985
1986
1987
1988
1989
1990
1991
1992
1993
1994
1995
1996
1997
1998
1999
2000
2001
2002
2003
ITALY GERMANY FRANCE SPAIN UNITED KINGDOM USA
Operating Expenses
(percent of gross income)
Figure 4
Marginal effect of the statutory tax rate (1)
Net Interest Income
-1
-0.5
0
0.5
1
0.35 0.4 0.45 0.5 0.55 0.6 0.65t
Non Interest Income
-3
-2
-1
0
1
2
0.35 0.4 0.45 0.5 0.55 0.6 0.65t
(1) Plots of the derivative of each income component with respect to τ , the corporate income tax bracket
(γ1t+2γ2τ j,t). The coefficients γ1 and γ2 are those reported in Table 3. The interval of τ chosen is the one included between the minimum and the maximum level of corporate income tax observed in the sample, which are
respectively 30 and 63 per cent. Dotted lines denote confidence bands at 95 per cent level of significance.
Figure 5
Impact of an additional unit of currency of taxes on profits after tax (1)
-0.1
-0.08
-0.06
-0.04
-0.02
0
0.3 0.4 0.5 0.6t
(1) The interval of τ chosen is the one included between the minimum and the maximum level of corporate income
tax observed in the sample, which are respectively 30 and 63 per cent.