108
1 BARNES-JEWISH HOSPITAL 2016 COMMUNITY HEALTH NEEDS ASSESSMENT & IMPLEMENTATION PLAN
1
BARNES-JEWISH HOSPITAL
2016 COMMUNITY HEALTH NEEDS
ASSESSMENT & IMPLEMENTATION PLAN

2
TABLE OF CONTENTS
Executive Summary ................................................................................................................................. 3
Community Description ........................................................................................................................... 4
Geography .................................................................................................................................... 4
Population Trends ......................................................................................................................... 5
Income........................................................................................................................................... 7
Education .................................................................................................................................... 10
Previous CHNA Measurement and Outcomes Results ...................................................................... 16
Conducting the 2016 CHNA .................................................................................................................. 18
Primary Data Collection .............................................................................................................. 18
Secondary Data Analyses ........................................................................................................... 21
Internal Work Group Prioritization Meetings ............................................................................... 74
Appendices ............................................................................................................................................. 82
Barnes-Jewish Hospital: Who We Are ........................................................................................ 83
Community Focus Group ............................................................................................................ 84
Focus Group Report .................................................................................................................... 85
Internal Work Group .................................................................................................................... 94
Internal Work Group Worksheet 1 .............................................................................................. 95
Internal Work Group Worksheet 2 .............................................................................................. 96
Internal Work Group Worksheet 3 .............................................................................................. 97
Implementation Plan .............................................................................................................................. 98
Community Health Needs to be Addressed ................................................................................ 98
Community Health Needs Identified that will not be addressed ............................................... 104

3
EXECUTIVE SUMMARY
Barnes-Jewish Hospital, a member of BJC HealthCare, is a 1,315-bed, academic medical center located
in the city of St. Louis, Missouri. Situated on Washington University Medical Campus, Barnes-Jewish
Hospital provides inpatient, outpatient, emergency/trauma and ambulatory clinic services. Barnes-Jewish
Hospital was created by the 1996 merger of Barnes Hospital and The Jewish Hospital of St. Louis. What
began more than 100 years ago as two separate hospitals has evolved into a nationally recognized
medical center delivering high quality health care services to patients across the St. Louis region. Barnes-
Jewish Hospital has also established effective partnerships towards the goals of improving the health of
the community. (See Appendix A for more information about Barnes-Jewish Hospital)
Like all nonprofit hospitals, Barnes-Jewish Hospital is required by the Patient Protection and Affordable
Care Act (PPACA) to conduct a community health needs assessment (CHNA) and create an
implementation plan every three years. Barnes-Jewish Hospital completed its first CHNA and
implementation plan on Dec. 31, 2013. The report was posted to the hospital’s website to ensure easy
access to the public.
As part of the CHNA process, each hospital is required to define its community. Barnes-Jewish Hospital
defined its community as St. Louis City. Once the community is defined, input must be solicited from
those who represent the broad interests of the community served by the hospital, as well as those who
have special knowledge and expertise in the area of public health.
Barnes-Jewish Hospital conducted its 2016 assessment in two phases. The first phase consisted of a
focus group discussion with key leaders and stakeholders representing the community. This group
reviewed the primary data and community health need findings from 2013 and discussed changes that
had occurred since 2013. Additionally, the focus group reviewed gaps in meeting needs, as well as
identified potential community organizations for Barnes-Jewish Hospital to collaborate with in addressing
needs.
During phase two, findings from the focus group meeting were reviewed and analyzed by a hospital
internal work group of clinical and non-clinical staff. Using multiple sources, including but not limited to
Healthy Communities Institute and the Centers for Disease Control and Prevention (CDC), a secondary
data analysis was conducted to further assess the identified needs. This data analysis identified some
unique health disparities and trends evident in St. Louis City when compared against data for the state
and country.
At the conclusion of the comprehensive assessment process, Barnes-Jewish Hospital identified four
health needs where focus is most needed to improve the health of the community it serves: 1) Access to
Services; 2) Healthy Lifestyles: Obesity; 3) Mental and Behavioral Health: Substance Abuse; and 4)
Public Safety: Violence.
The analysis and conclusions were presented, reviewed and approved by the Barnes-Jewish Hospital
board of directors.
4
COMMUNITY DESCRIPTION
GEOGRAPHY
Barnes-Jewish Hospital is the largest of the 15 BJC HealthCare hospitals that comprise the system. BJC
HealthCare hospitals serve urban, suburban and rural community locations primarily in the greater St.
Louis, southern Illinois and mid-Missouri regions. Barnes-Jewish Hospital and St. Louis Children’s
Hospital are the two BJC HealthCare hospitals located in St. Louis City.
Barnes-Jewish Hospital is the largest hospital in Missouri. Seventy-five percent of the hospital’s patients
come from the hospital’s primary service area, including eight counties in Missouri and eight counties in
Illinois. The remaining 25 percent of patients come from the surrounding 250 miles of St. Louis.
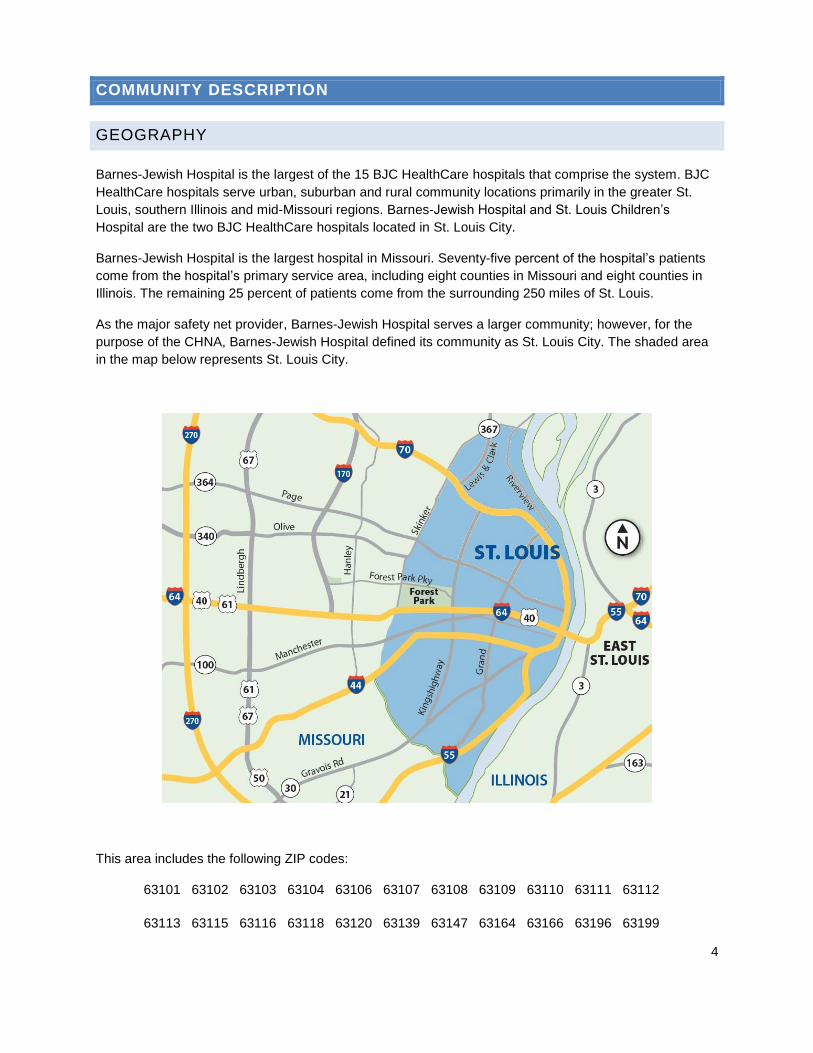
As the major safety net provider, Barnes-Jewish Hospital serves a larger community; however, for the
purpose of the CHNA, Barnes-Jewish Hospital defined its community as St. Louis City. The shaded area
in the map below represents St. Louis City.
This area includes the following ZIP codes:
63101 63102 63103 63104 63106 63107 63108 63109 63110 63111 63112
63113 63115 63116 63118 63120 63139 63147 63164 63166 63196 63199
5
POPULATION TREND
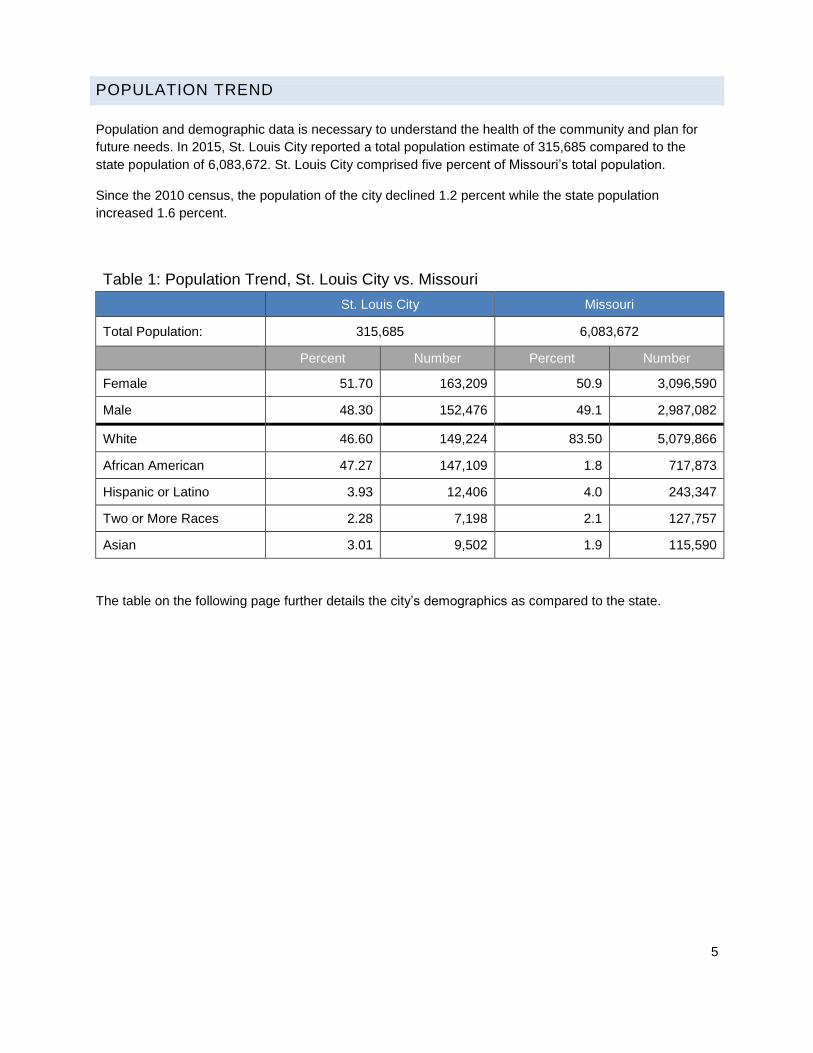
Population and demographic data is necessary to understand the health of the community and plan for
future needs. In 2015, St. Louis City reported a total population estimate of 315,685 compared to the
state population of 6,083,672. St. Louis City comprised five percent of Missouri’s total population.
Since the 2010 census, the population of the city declined 1.2 percent while the state population
increased 1.6 percent.
Table 1: Population Trend, St. Louis City vs. Missouri
St. Louis City Missouri
Total Population: 315,685 6,083,672
Percent Number Percent Number
Female 51.70 163,209 50.9 3,096,590
Male 48.30 152,476 49.1 2,987,082
White 46.60 149,224 83.50 5,079,866
African American 47.27 147,109 1.8 717,873
Hispanic or Latino 3.93 12,406 4.0 243,347
Two or More Races 2.28 7,198 2.1 127,757
Asian 3.01 9,502 1.9 115,590
The table on the following page further details the city’s demographics as compared to the state.

6
Table 2: Demographics, St. Louis City vs. Missouri
St. Louis City Missouri
Geography
Land area in square miles, 2010 61.91 68,741.52
Persons per square miles, 2010 5,157.50 87.1
Population
Population, July 1, 2015 estimate 315,685 6,083,672
Population, April 1, 2010 estimate base 319,365 5,988,923
Population, percent change – April 1, 2010 to July 1, 2015 -1.2% 1.6%
Population, 2010 317,294 5,988,927
Race / Ethnicity
White alone, percent, 2015 47.1% 83.3%
Black or African American alone, percent, 2015 46.9% 11.8%
American Indian and Alaska Native alone, percent, 2015 0.3% 0.6%
Asian alone, percent, 2015 3.3% 2.0%
Native Hawaiian and Other Pacific Islander alone, percent 2015 0.0% 0.1%
Two or more races, percent, 2015 2.4% 2.2%
Hispanic or Latino, percent, 2015 3.9% 4.1%
White alone, not Hispanic or Latino, percent, 2015 44.0% 79.8%
Foreign born persons, percent, 2010-2014 6.8% 3.9%
Age
Persons under 5 years, percent, 2015 6.7% 6.2%
Persons under 18 years, percent, 2015 20.1% 22.9%
Persons 65 years and over, percent, 2015 11.6% 15.7%
Language
Language other than English spoken at home, percent of age 5 years+, 2015
9.6% 6.1%
Gender
Female persons, percent, 2015 51.6% 51.0%
Male persons, percent, 2015 48.4% 49.0%
Source: United States Census Bureau
7
INCOME
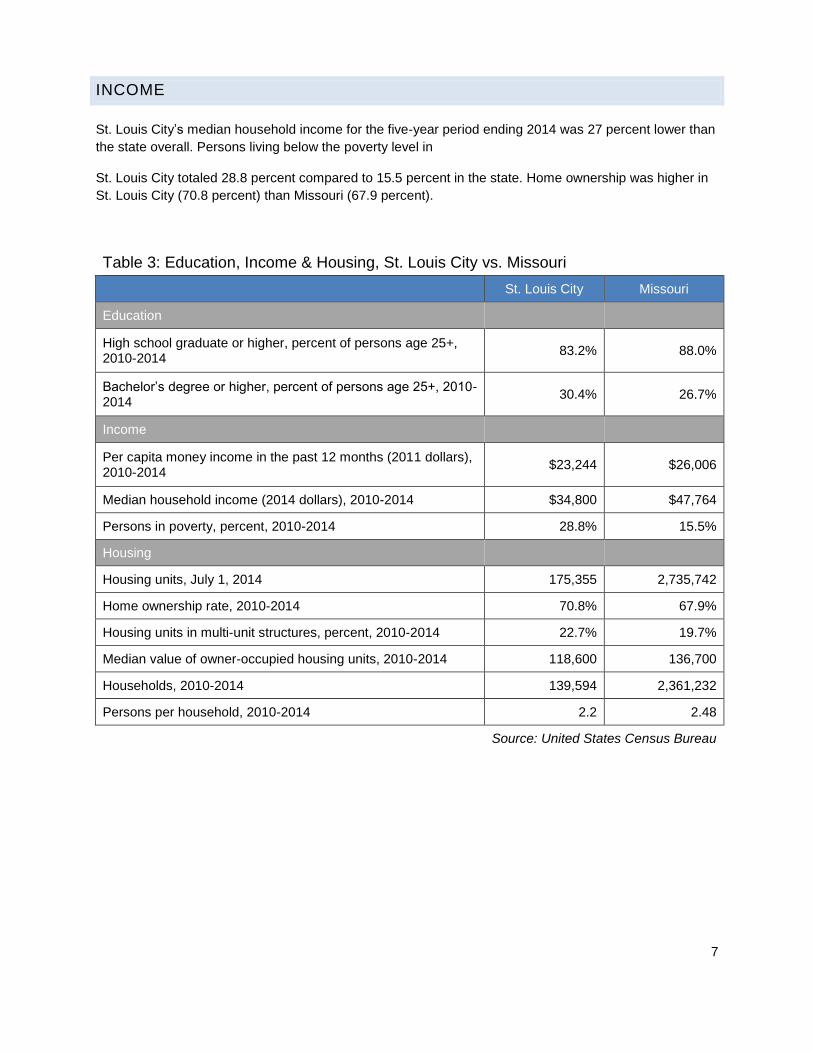
St. Louis City’s median household income for the five-year period ending 2014 was 27 percent lower than
the state overall. Persons living below the poverty level in
St. Louis City totaled 28.8 percent compared to 15.5 percent in the state. Home ownership was higher in
St. Louis City (70.8 percent) than Missouri (67.9 percent).
Table 3: Education, Income & Housing, St. Louis City vs. Missouri
St. Louis City Missouri
Education
High school graduate or higher, percent of persons age 25+, 2010-2014
83.2% 88.0%
Bachelor’s degree or higher, percent of persons age 25+, 2010-2014
30.4% 26.7%
Income
Per capita money income in the past 12 months (2011 dollars), 2010-2014
$23,244 $26,006
Median household income (2014 dollars), 2010-2014 $34,800 $47,764
Persons in poverty, percent, 2010-2014 28.8% 15.5%
Housing
Housing units, July 1, 2014 175,355 2,735,742
Home ownership rate, 2010-2014 70.8% 67.9%
Housing units in multi-unit structures, percent, 2010-2014 22.7% 19.7%
Median value of owner-occupied housing units, 2010-2014 118,600 136,700
Households, 2010-2014 139,594 2,361,232
Persons per household, 2010-2014 2.2 2.48
Source: United States Census Bureau
8
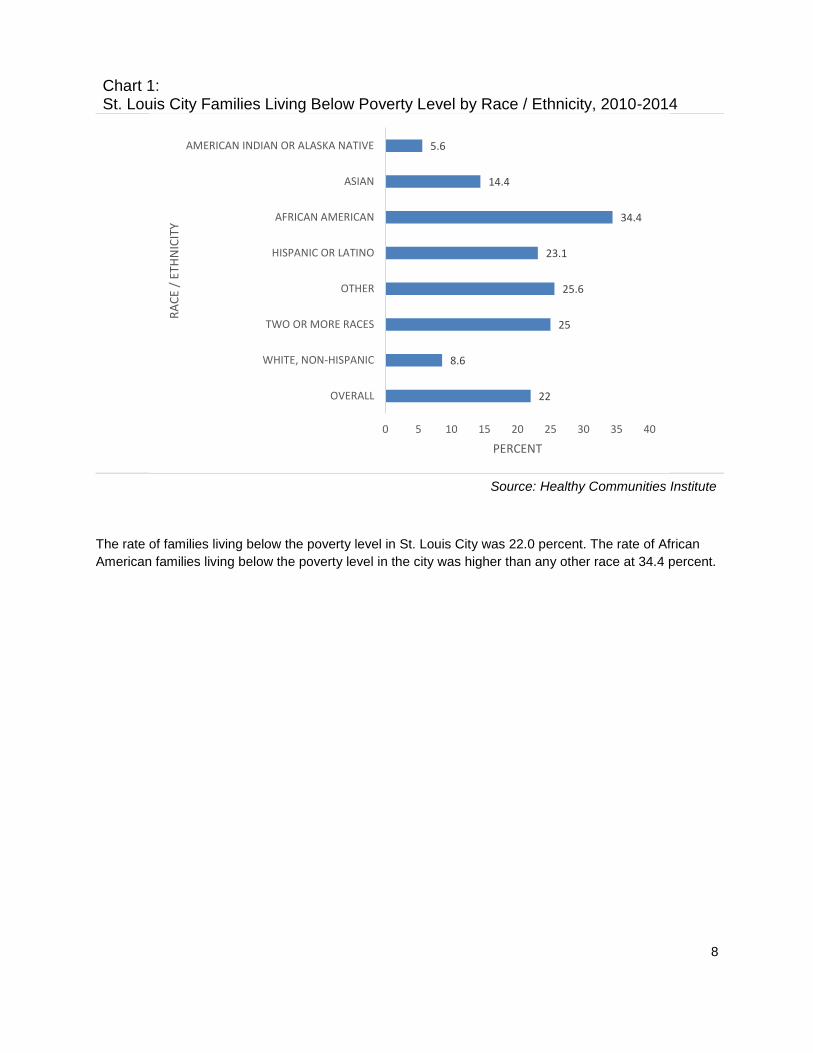
Chart 1: St. Louis City Families Living Below Poverty Level by Race / Ethnicity, 2010-2014
Source: Healthy Communities Institute
The rate of families living below the poverty level in St. Louis City was 22.0 percent. The rate of African
American families living below the poverty level in the city was higher than any other race at 34.4 percent.
22
8.6
25
25.6
23.1
34.4
14.4
5.6
0 5 10 15 20 25 30 35 40
OVERALL
WHITE, NON-HISPANIC
TWO OR MORE RACES
OTHER
HISPANIC OR LATINO
AFRICAN AMERICAN
ASIAN
AMERICAN INDIAN OR ALASKA NATIVE
PERCENT
RA
CE
/ ET
HN
ICIT
Y
9
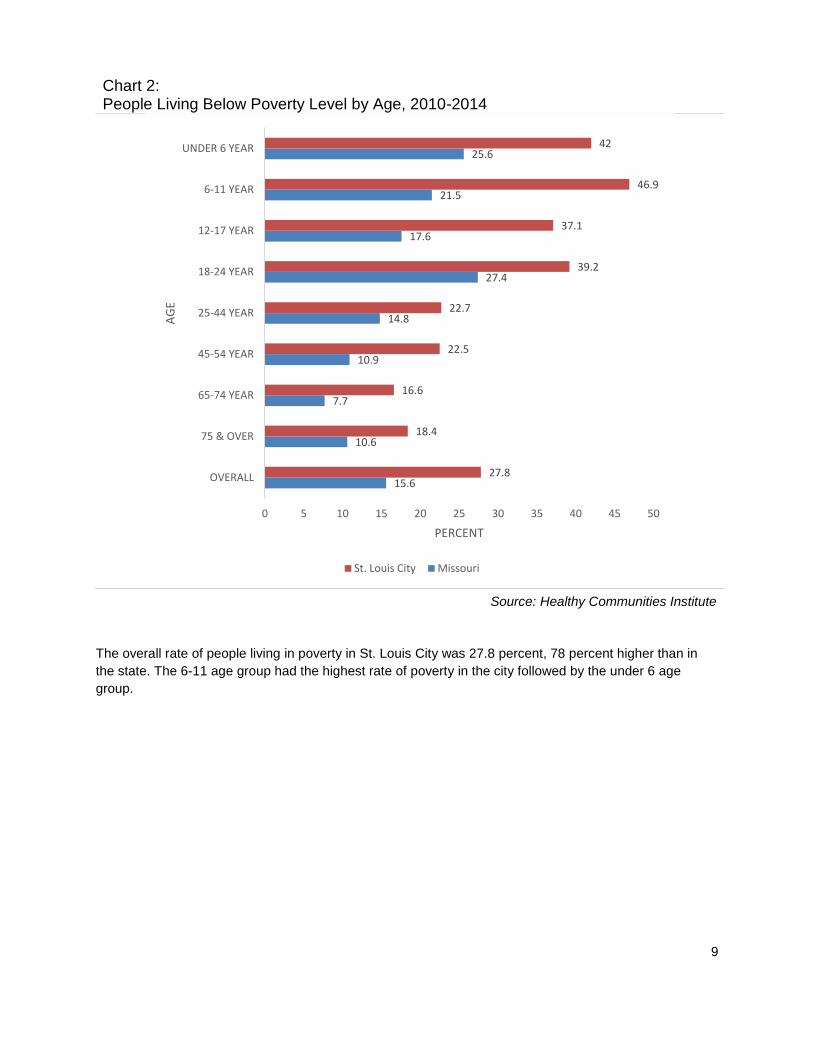
Chart 2: People Living Below Poverty Level by Age, 2010-2014
Source: Healthy Communities Institute
The overall rate of people living in poverty in St. Louis City was 27.8 percent, 78 percent higher than in
the state. The 6-11 age group had the highest rate of poverty in the city followed by the under 6 age
group.
15.6
10.6
7.7
10.9
14.8
27.4
17.6
21.5
25.6
27.8
18.4
16.6
22.5
22.7
39.2
37.1
46.9
42
0 5 10 15 20 25 30 35 40 45 50
OVERALL
75 & OVER
65-74 YEAR
45-54 YEAR
25-44 YEAR
18-24 YEAR
12-17 YEAR
6-11 YEAR
UNDER 6 YEAR
PERCENT
AG
E
St. Louis City Missouri

10
EDUCATION
Chart 3: People 25+ with a High School Degree or Higher by Age, 2010-2014
Source: Healthy Communities Institute
In St. Louis City, 83.2 percent of the population 25 and older had a high school diploma compared to
Missouri at 88 percent.
The Healthy People 2020 national health target is to increase the proportion of students who graduate
high school within four years of their first enrollment in 9th grade to 82.4 percent.
Individuals who do not finish high school are more likely than people who finish high school to lack the
basic skills required to function in an increasingly complicated job market and society. Adults with limited
education levels are more likely to be unemployed, on government assistance, or involved in crime.
(Healthy Communities Institute).
90.3 90.2 89.9
80.8
8889.2
84.4 84.1
69.9
83.2
0
10
20
30
40
50
60
70
80
90
100
25-34 35-44 45-64 65 & OVER OVERALL
PER
CEN
T
AGE
Missouri St. Louis City

11
Chart 4: People 25+ with a High School Degree or Higher by Race / Ethnicity, 2010-2014
Source: Healthy Communities Institute
Whites had the highest rate of individuals with a high school degree or higher in St. Louis City, followed
by American Indian or Alaska Native. Those who identify as Other had the lowest rate of individuals with
a high school degree or higher followed by Native Hawaiian or Other Pacific Islander. In Missouri, Whites
also had the highest rate of individuals with a high school degree or higher, followed by Native Hawaiian
or Other Pacific Islander. Those who identify as Other had the lowest rate of individuals with a high school
degree or higher followed by Hispanics.
88
89.4
83.6
60.8
87.9
68.5
83.1
86.2
84
83.2
90
78.7
59.1
65.4
70.1
77.1
77.3
85.2
0 10 20 30 40 50 60 70 80 90 100
OVERALL
WHITE, NON-HISPANIC
TWO OR MORE RACES
OTHER
NATIVE HAWAIIAN OR OTHER PACIFIC ISLANDER
HISPANIC OR LATINO
AFRICAN AMERICAN
ASIAN
AMERICAN INDIAN OR ALASKA NATIVE
PERCENT
RA
CE
/ ET
HN
ICIT
Y
St. Louis City Missouri
12
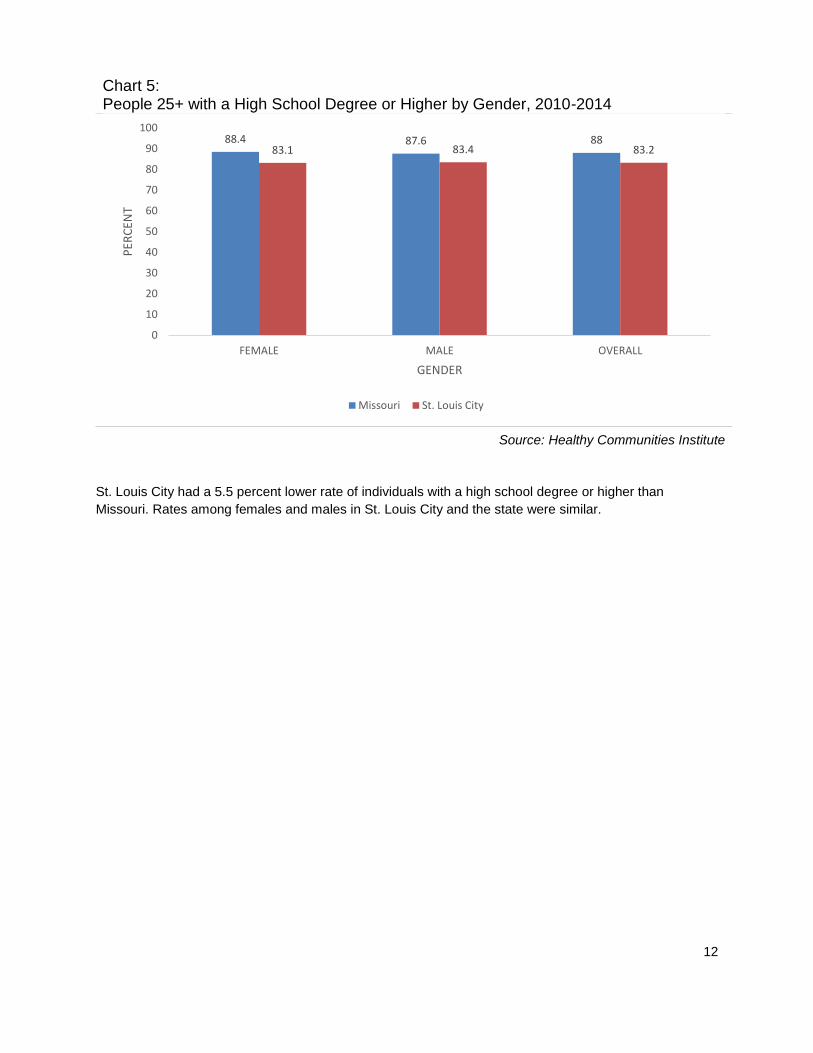
Chart 5: People 25+ with a High School Degree or Higher by Gender, 2010-2014
Source: Healthy Communities Institute
St. Louis City had a 5.5 percent lower rate of individuals with a high school degree or higher than
Missouri. Rates among females and males in St. Louis City and the state were similar.
88.4 87.6 8883.1 83.4 83.2
0
10
20
30
40
50
60
70
80
90
100
FEMALE MALE OVERALL
PER
CEN
T
GENDER
Missouri St. Louis City
13
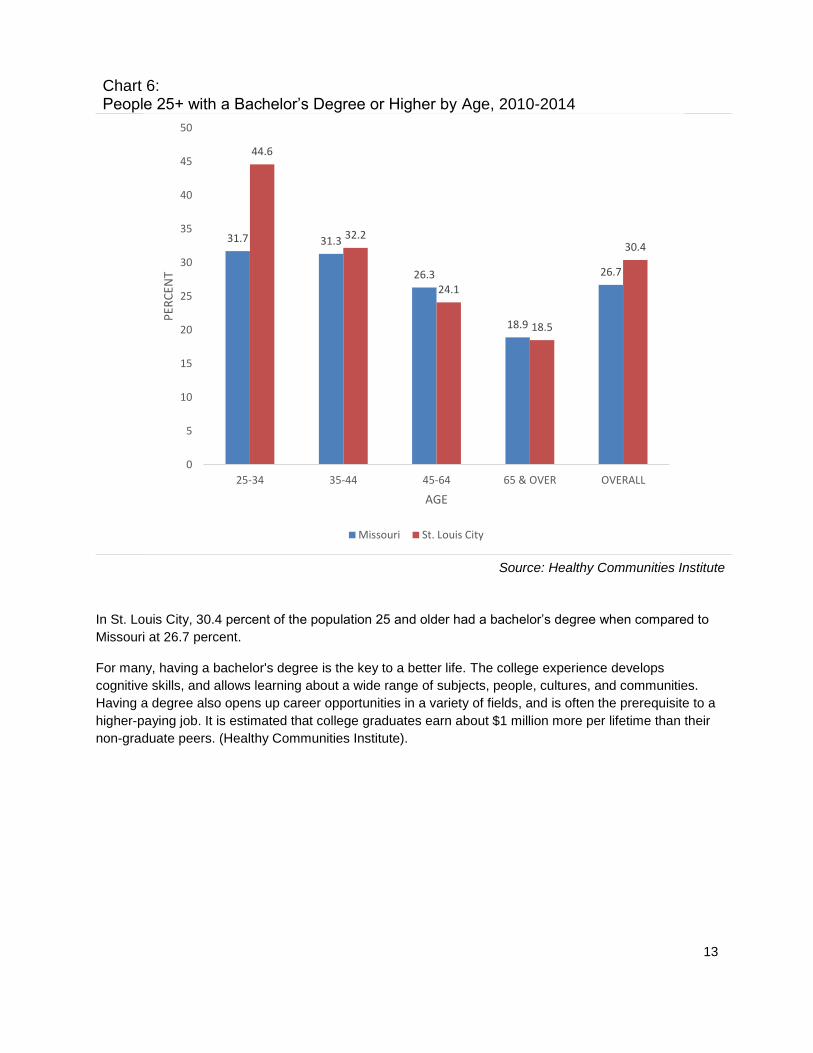
Chart 6: People 25+ with a Bachelor’s Degree or Higher by Age, 2010-2014
Source: Healthy Communities Institute
In St. Louis City, 30.4 percent of the population 25 and older had a bachelor’s degree when compared to
Missouri at 26.7 percent.
For many, having a bachelor's degree is the key to a better life. The college experience develops
cognitive skills, and allows learning about a wide range of subjects, people, cultures, and communities.
Having a degree also opens up career opportunities in a variety of fields, and is often the prerequisite to a
higher-paying job. It is estimated that college graduates earn about $1 million more per lifetime than their
non-graduate peers. (Healthy Communities Institute).
31.7 31.3
26.3
18.9
26.7
44.6
32.2
24.1
18.5
30.4
0
5
10
15
20
25
30
35
40
45
50
25-34 35-44 45-64 65 & OVER OVERALL
PER
CEN
T
AGE
Missouri St. Louis City

14
Chart 7: People 25+ with a Bachelor’s Degree or Higher by Race / Ethnicity, 2010-2014
Source: Healthy Communities Institute
Asians had the highest rate of individuals with a bachelor’s degree or higher both in St. Louis City and
Missouri. African Americans had the lowest rate in St. Louis City and Native Hawaiian or Other Pacific
Islander had the lowest rate in Missouri.
26.7
27.7
22.4
12.5
11.6
18.2
16.8
56.3
17.5
30.4
45
25.2
24.5
16.7
28.4
12.9
54.3
20.3
0 10 20 30 40 50 60
OVERALL
WHITE, NON-HISPANIC
TWO OR MORE RACES
OTHER
NATIVE HAWAIIAN OR OTHER PACIFIC ISLANDER
HISPANIC OR LATINO
AFRICAN AMERICAN
ASIAN
AMERICAN INDIAN OR ALASKA NATIVE
PERCENT
RA
CE
/ ET
HN
ICIT
Y
St. Louis City Missouri
15
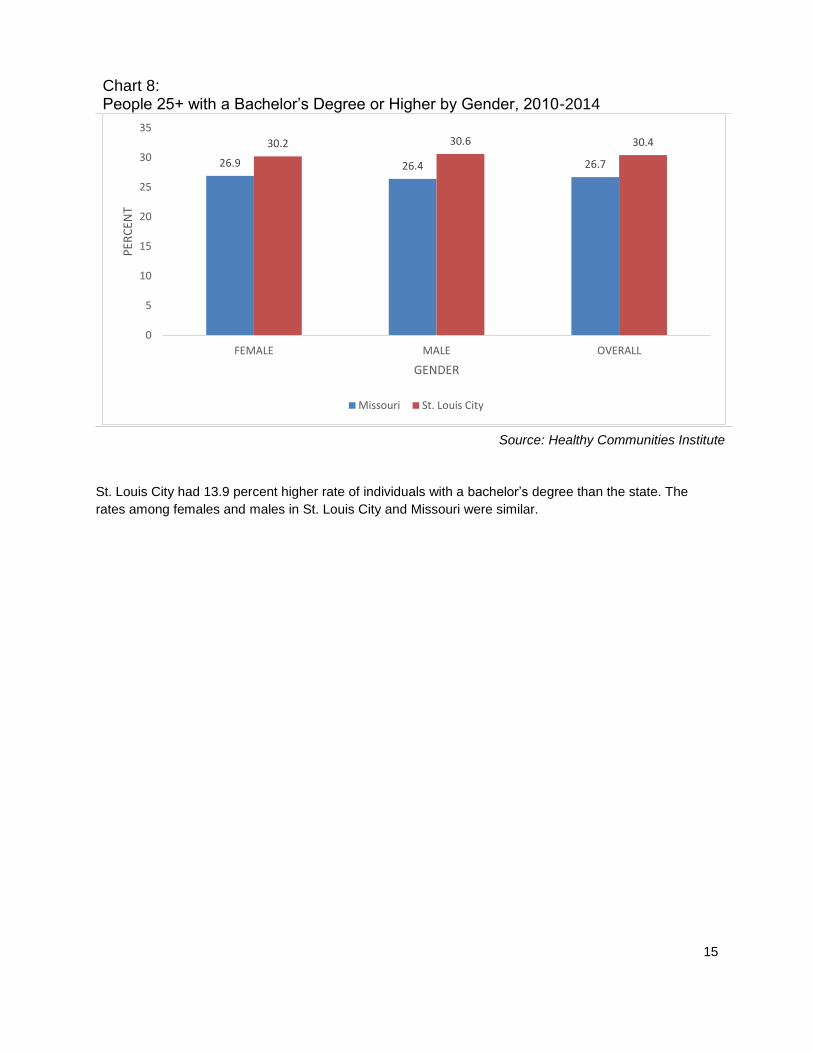
Chart 8: People 25+ with a Bachelor’s Degree or Higher by Gender, 2010-2014
Source: Healthy Communities Institute
St. Louis City had 13.9 percent higher rate of individuals with a bachelor’s degree than the state. The
rates among females and males in St. Louis City and Missouri were similar.
26.9 26.4 26.7
30.2 30.6 30.4
0
5
10
15
20
25
30
35
FEMALE MALE OVERALL
PER
CEN
T
GENDER
Missouri St. Louis City
16
PREVIOUS (2013) CHNA MEASUREMENT AND OUTCOMES RESULTS
At the completion of the 2013 CHNA, Barnes-Jewish Hospital outlined goals for meeting eight broad
categories of health needs in St. Louis City. Mission-core priorities were identified as aligning with the
strategic priorities of the hospital in order to ensure dedicated resources. These included Health Literacy
and Education and Chronic Conditions. The additional needs were included as supporting priorities:
Access to Health Care; Behavioral Health; Financial Barriers; Safety from Violence; Lack of Service
Coordination; and Training of Health Care Professionals.
Rather than choosing one program on which to focus for each of the priorities in the implementation plan,
Barnes-Jewish Hospital included all programs that were being conducted under each category. This was
done with the hopes of highlighting all the work being done for the community, even though it was not
necessary to do so. Due to the length of the listing of programs, the table below includes a selection of
major programs under mission-core priorities that outlines the details results, goals and current status of
these community health needs.
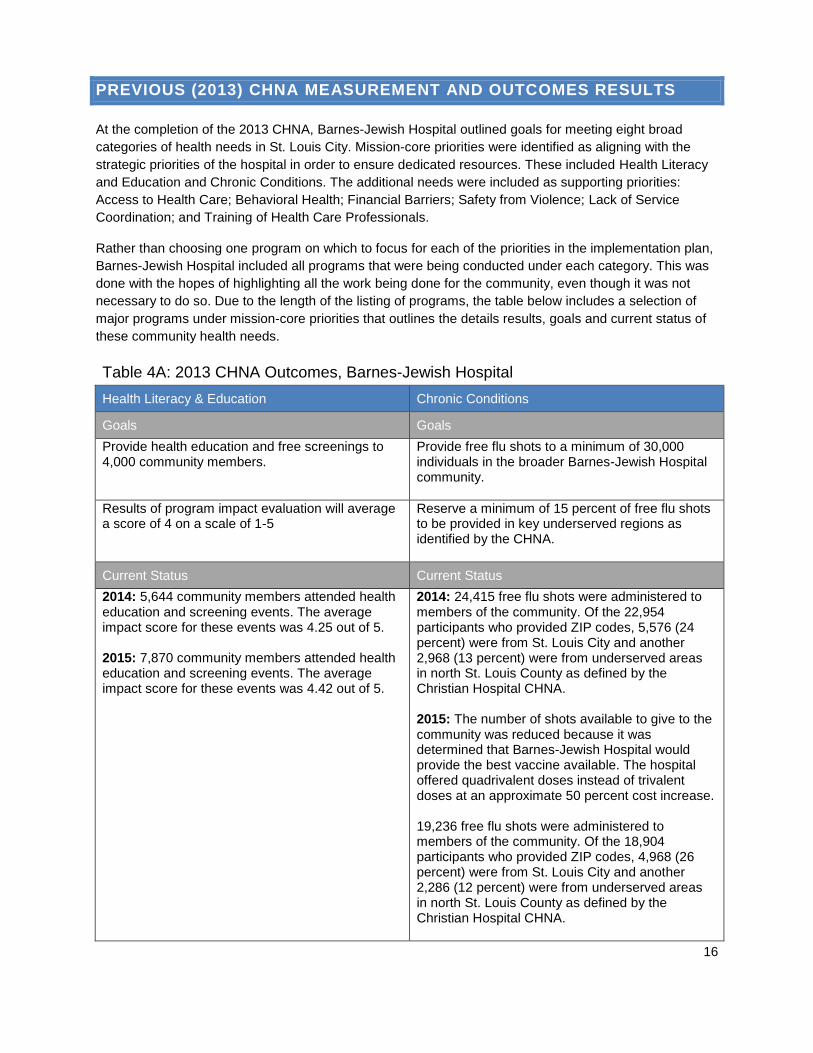
Table 4A: 2013 CHNA Outcomes, Barnes-Jewish Hospital
Health Literacy & Education Chronic Conditions
Goals Goals
Provide health education and free screenings to 4,000 community members.
Provide free flu shots to a minimum of 30,000 individuals in the broader Barnes-Jewish Hospital community.
Results of program impact evaluation will average a score of 4 on a scale of 1-5
Reserve a minimum of 15 percent of free flu shots to be provided in key underserved regions as identified by the CHNA.
Current Status Current Status
2014: 5,644 community members attended health education and screening events. The average impact score for these events was 4.25 out of 5. 2015: 7,870 community members attended health education and screening events. The average impact score for these events was 4.42 out of 5.
2014: 24,415 free flu shots were administered to members of the community. Of the 22,954 participants who provided ZIP codes, 5,576 (24 percent) were from St. Louis City and another 2,968 (13 percent) were from underserved areas in north St. Louis County as defined by the Christian Hospital CHNA. 2015: The number of shots available to give to the community was reduced because it was determined that Barnes-Jewish Hospital would provide the best vaccine available. The hospital offered quadrivalent doses instead of trivalent doses at an approximate 50 percent cost increase. 19,236 free flu shots were administered to members of the community. Of the 18,904 participants who provided ZIP codes, 4,968 (26 percent) were from St. Louis City and another 2,286 (12 percent) were from underserved areas in north St. Louis County as defined by the Christian Hospital CHNA.

17
Table 4B: 2013 CHNA Outcomes, OASIS
Chronic Disease & Diabetes Self-Management Physical Activity and Functional Fitness
Goals Goals
Increase enrollment in self-management programs by 5% annually.
Increase physical activity participation and functional fitness in adults ages 60 and older by 10% annually.
After establishing a baseline, increase knowledge of blood pressure management terms and tools, and positive medication management behaviors by 5%.
At least 50% of participants will see improvement in strength, flexibility, and balance and agility, as measured by the Senior Fitness Test (SFT).
Current Status Current Status
2014: Participation in OASIS self-management programs was inflated due to participation in a research study. 2015: Participation decreased by 41% from 2014 due to the previously inflated participation rates. In 2015, efforts to recruit participants was more evenly distributed among health programs. Increased knowledge in blood pressure management increased by 19%. Increased knowledge in medication management increased by 24%.
2015: 1859 participants was 20% increase from 2014. 68% of participants improved aerobic endurance; 61% of participants improved agility and balance; 60% of participants improved lower body strength; 50% of participants improved upper body flexibility.
For the 2013 CHNA, Barnes-Jewish Hospital chose to address all needs identified by the stakeholders
and confirmed by the secondary data. Regrettably, there was a lack of focus on particular areas. The
team was not able to show outcomes in all areas selected. Therefore, the team decided to limit priorities
and use resources wisely in order to show outcomes in 2016. Barnes-Jewish Hospital will continue with
all the programs from the 2013 CHNA and focus the implementation plan on fewer priorities and
demonstrate greater impact.

18
CONDUCTING THE 2016 CHNA
PRIMARY DATA COLLECTION: FOCUS GROUP
Barnes-Jewish Hospital conducted a focus group to solicit feedback from community stakeholders, public
health experts and those with a special interest in the health needs of residents located in St. Louis City.
Ten of 16 invited participants representing various St. Louis County organizations participated in the
focus group (See Appendix B for Community Focus Group list). The focus group was held March 28,
2015, at the Chase Park Plaza Hotel with the following objectives identified:
1. Determine whether the needs identified in the 2013 CHNA remain the correct focus areas.
2. Explore whether any needs on the list should no longer be a priority.
3. Determine where gaps exist in the plan to address the prioritized needs.
4. Identify other potential organizations for collaboration.
5. Discuss how the community had changed since 2013 when Barnes-Jewish Hospital first identified
these needs and whether there are new issues to consider.
6. Evaluate what issues the stakeholders anticipate becoming a greater concern in the future to
consider now.
2016 FOCUS GROUP SUMMARY
A general consensus was reached that needs identified in the previous assessment should remain as
focus areas for the hospital. A few participants suggested that mental health and behavioral health should
be rated higher in priority due to the effect these concerns have on contributing to violence in the
community (See Appendix C for complete Focus Group Report).
Needs that Should Be Removed
There was discussion about why training of health professionals and service coordination was not present
in the revised list of needs. The law now requires that any prioritized need must be measured so as to
determine the impact of any implementation tactics. These items were removed because there was a lack
of measures associated with them. Stakeholders from the Regional Health Commission indicated that
they have some metrics for Barnes-Jewish Hospital to consider around these needs.
Gaps in Implementation Strategies
Financial access to coverage continues to be an issue for St. Louis City residents who are low-income.
There was much discussion around the role that technology could play in improving access to services.
Other comments around access to services included care coordination. Discussion also took place
regarding increasing health provider awareness of trauma (post-traumatic stress disorder) and how
recognition can ultimately impact the treatment of chronic conditions along with behavioral health issues.
Special Populations
The homeless population was identified as one that may require additional consideration, particularly
following discharge, as no appropriate place currently exists. Additionally, several points were made in
regard to those who are deaf and blind.
Potential Partner Organizations
Barnes-Jewish Hospital was positively recognized for its numerous collaborative efforts with a variety of
organizations on various levels. The hospital was also noted for its excellent work on emergency
preparedness and responsiveness as well as for collaborating with the St. Louis Integrated Health

19
Network on placing referring coordinators in the facility. There was one suggestion to examine the
relationships the hospital has with homeless providers in the city to identify additional ways to address the
needs of the homeless upon discharge.
Needs of Increasing Importance
Safety from Violence – Although violence was identified in the 2013 CHNA, with the events that
occurred in Ferguson in 2014 and 2015, many see violence as an issue that will continue to exist
in St. Louis City.
Access: Coverage – The lack of Medicaid expansion will continue to affect access, as well as
disparities in access related to low-income populations.
Sexually Transmitted Disease (STD) – There continues to be concern about STDs including
gonorrhea as well as HIV/AIDs, especially within the African American community. Education is
needed on these issues and information should be made available especially at community
health fairs.
Behavioral Health –The spread of heroin and prescription drug abuse is a continued concern.
Chronic Conditions – Sickle cell anemia continues to be an issue among African Americans.
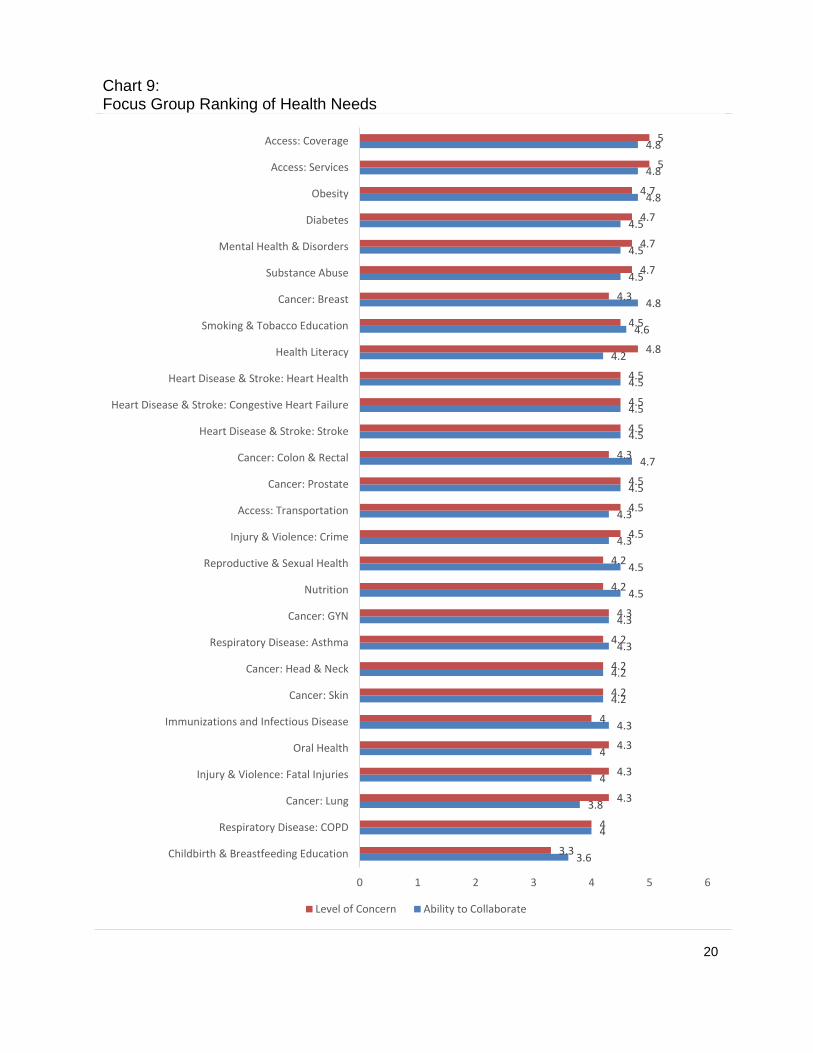
RATING OF NEEDS
Participants were given the list of the needs identified in the 2013 assessment and directed to re-rank
them on a scale of 1 (low) to 5 (high), based on their perceived level of community concern and the ability
of community organizations to address them collaboratively. The table on the following page shows the
results of this ranking.
Access to Coverage and Access to Services rated highest in terms of level of concern and ability to
collaborate. Childbirth and Breastfeeding Education rated lowest on ability to collaborate and the level of
concern.
20
Chart 9: Focus Group Ranking of Health Needs
3.6
4
3.8
4
4
4.3
4.2
4.2
4.3
4.3
4.5
4.5
4.3
4.3
4.5
4.7
4.5
4.5
4.5
4.2
4.6
4.8
4.5
4.5
4.5
4.8
4.8
4.8
3.3
4
4.3
4.3
4.3
4
4.2
4.2
4.2
4.3
4.2
4.2
4.5
4.5
4.5
4.3
4.5
4.5
4.5
4.8
4.5
4.3
4.7
4.7
4.7
4.7
5
5
0 1 2 3 4 5 6
Childbirth & Breastfeeding Education
Respiratory Disease: COPD
Cancer: Lung
Injury & Violence: Fatal Injuries
Oral Health
Immunizations and Infectious Disease
Cancer: Skin
Cancer: Head & Neck
Respiratory Disease: Asthma
Cancer: GYN
Nutrition
Reproductive & Sexual Health
Injury & Violence: Crime
Access: Transportation
Cancer: Prostate
Cancer: Colon & Rectal
Heart Disease & Stroke: Stroke
Heart Disease & Stroke: Congestive Heart Failure
Heart Disease & Stroke: Heart Health
Health Literacy
Smoking & Tobacco Education
Cancer: Breast
Substance Abuse
Mental Health & Disorders
Diabetes
Obesity
Access: Services
Access: Coverage
Level of Concern Ability to Collaborate

21
SECONDARY DATA ANALYSES
Based on the primary data reviewed by focus group members (see graph on previous page), key areas
were identified by the internal workgroup (see internal workgroup process beginning on page 66) for
secondary data analysis. These areas represent the most prevailing issues identified by the focus group.
DATA SOURCES
Healthy Communities Institute (HCI), an online community dashboard of health indicators for St. Louis
County as well as the ability to evaluate and track the information against state and national data and
Healthy People 2020 goals. This online dashboard of health indicators for St. Louis County evaluates and
tracks information against state and national data and Healthy People 2020 goals. Sources of data
include the National Cancer Institute, Environmental Protection Agency, US Census Bureau, US
Department of Education, and other national, state, and regional sources.
Healthy People 2020 provides science-based, 10-year national objectives for improving the health of all
Americans. For three decades, Healthy People has established benchmarks and monitored progress over
time in order to encourage collaborations across communities and sectors, empower individuals toward
making informed health decisions and measure the impact of prevention activities.
Hospital Industries Data Institute (HIDI, 2014) is a data source provides insight into the patterns and
frequency of health care utilization in the hospital.
Missouri Information for Community Assessment (MICA) is an online system that helps to prioritize
diseases using publicly available data. The system also provides for the subjective input of experts to
rank their perceived seriousness of each issue.
Centers for Disease Control and Prevention (CDC)/State Cancer Profiles is a web site that provide
data, maps, and graphs to help guide and prioritize cancer control activities at the state and local levels. It
is a collaboration of the National Cancer Institute and the Centers for Disease Control and Prevention.
https://statecancerprofiles.cancer.gov
Missouri Department of Mental Health provides numerous comprehensive reports and statistics on
mental health diseases, alcohol and drug abuse.
http://dmh.mo.gov/ada/countylinks/saint_louis_county_link.html
In addition to the resources listed above, while not directly cited in this report, Barnes-Jewish Hospital
utilized information from the following organizations during internal work group discussions:
The Commonwealth Fund
County Health Rankings and Roadmaps
Kaiser Family Foundation
Robert Wood Johnson Foundation

22
HEALTH NEEDS
In order to provide a comprehensive analysis of disparities and trends, the most up-to-date secondary
data was included on the following needs determined by the internal work group (see internal workgroup
process beginning on page 74):
Access: Coverage
Access: Services
Access: Transportation
Cancer
Diabetes
Healthy Lifestyles
Heart Health
Maternal & Child Health
Mental & Behavioral Health: Mental Illness
Mental & Behavioral Health: Substance Abuse
Public Safety: Violence
Reproductive & Sexual Health
Respiratory Disease: Asthma
We acknowledge that, like most cities, tremendous variation exists in demographic and health
characteristics between neighborhoods in the City of St. Louis. Some areas have multiple, high-risk
factors clustered together. However, most data is not available at a more granular level than by county.
For this reason, the analysis was completed comparing St. Louis City, Missouri and the U.S. When
necessary during implementation, more specific data will be used when available.
Following the secondary data analysis, a summary is provided that outlines observations noted in the
disparities and trends for each of the above needs. (See page 73).

23
ACCESS: COVERAGE
Individuals without medical insurance are more likely to lack a traditional source of medical care, such as
a Primary Care Provider (PCP), and are more likely to skip routine medical care due to costs, therefore,
increasing the risk for serious and debilitating health conditions. Those who access health services are
often burdened with large medical bills and out-of-pocket expenses. Increasing access to both routine
medical care and medical insurance are vital steps in improving the health of the community. (Healthy
Communities Institute).
Chart 10: Adults with Health Insurance by Age, 2014
Source: Healthy Communities Institute
The overall rate of adults in St. Louis City with health insurance in 2014 was 80.3 percent, 4.3 percent
lower than Missouri. Of the total number of insured adults, the 55-64 age group had the most adults with
health insurance in St. Louis City; the 18-24 age group and the 45-54 age group had the second highest
percentage of insured adults in St. Louis City. The 25-34 age group had the lowest number of insured
adults in St. Louis City. The Healthy People 2020 national health target is to increase the proportion of
people with health insurance to 100 percent.
83.9
91.1
86.5
82.4
77.5
80.8
80.3
89.2
81.7
76.1
75.6
81.7
0 10 20 30 40 50 60 70 80 90 100
OVERALL
55-64
45-54
35-44
25-34
18-24
PERCENT
AG
E
St. Louis City Missouri
24
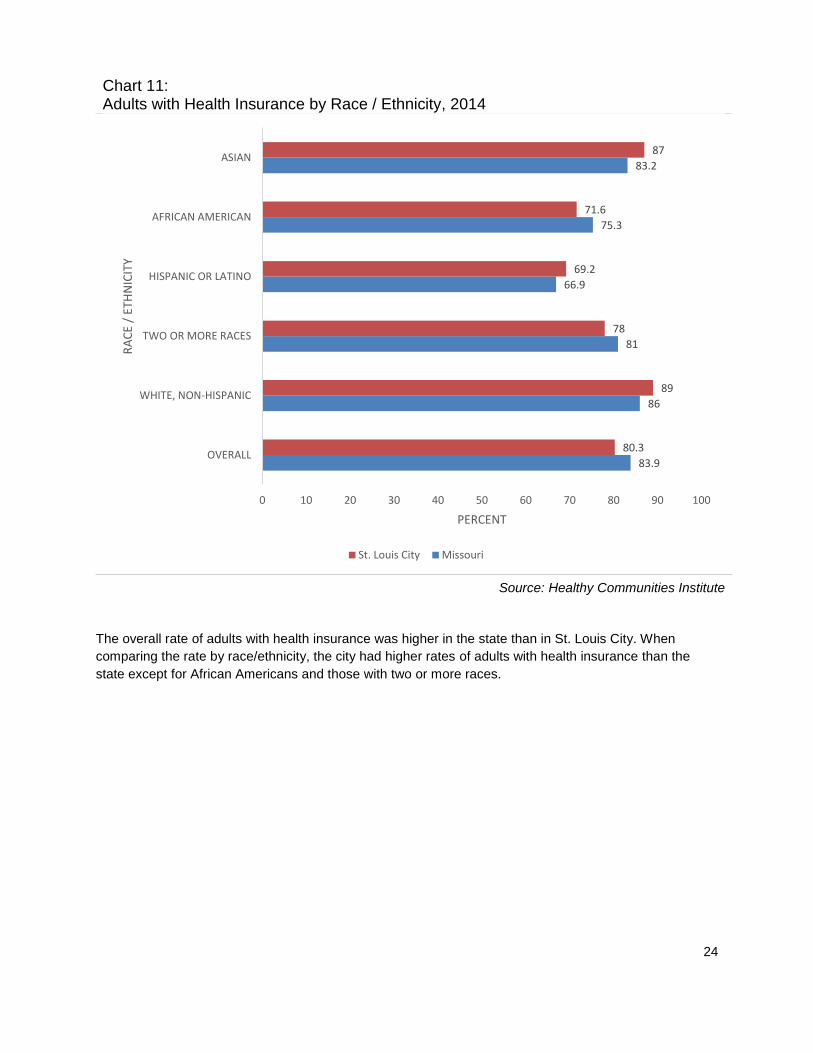
Chart 11: Adults with Health Insurance by Race / Ethnicity, 2014
Source: Healthy Communities Institute
The overall rate of adults with health insurance was higher in the state than in St. Louis City. When
comparing the rate by race/ethnicity, the city had higher rates of adults with health insurance than the
state except for African Americans and those with two or more races.
83.9
86
81
66.9
75.3
83.2
80.3
89
78
69.2
71.6
87
0 10 20 30 40 50 60 70 80 90 100
OVERALL
WHITE, NON-HISPANIC
TWO OR MORE RACES
HISPANIC OR LATINO
AFRICAN AMERICAN
ASIAN
PERCENT
RA
CE
/ ET
HN
ICIT
Y
St. Louis City Missouri

25
Chart 12: Adults with Health Insurance by Gender, 2014
Source: Healthy Communities Institute
The health insurance rate among females in St. Louis City was lower than Missouri, but higher than the
rate of males in the city. Males in St. Louis City also had a lower health insurance rate than the state.
Chart 13: Adults 18-64 with Health Insurance: Time Series
Source: Healthy Communities Institute
The graph above shows the rate of adults in St. Louis City with health insurance coverage from 2010 until
2014. A decline occurred in the city between 2010 and 2011 followed by an increase from 2012 to 2014.
This increase could have resulted from the ACA, which mandates that all residents should be covered
under some form of health insurance. The rate in Missouri was statistically the same from 2010 to 2013,
with an increase noted in 2014.
85.1 82.6 83.983.377.2 80.3
0
20
40
60
80
100
FEMALE MALE OVERALL
PER
CEN
T
GENDER
Missouri St. Louis City
81.4 80.7 80.9 81.7 83.9
74 72.675.3 76.8
80.3
0
10
20
30
40
50
60
70
80
90
2010 2011 2012 2013 2014
PER
CEN
T
Missouri St. Louis City
26
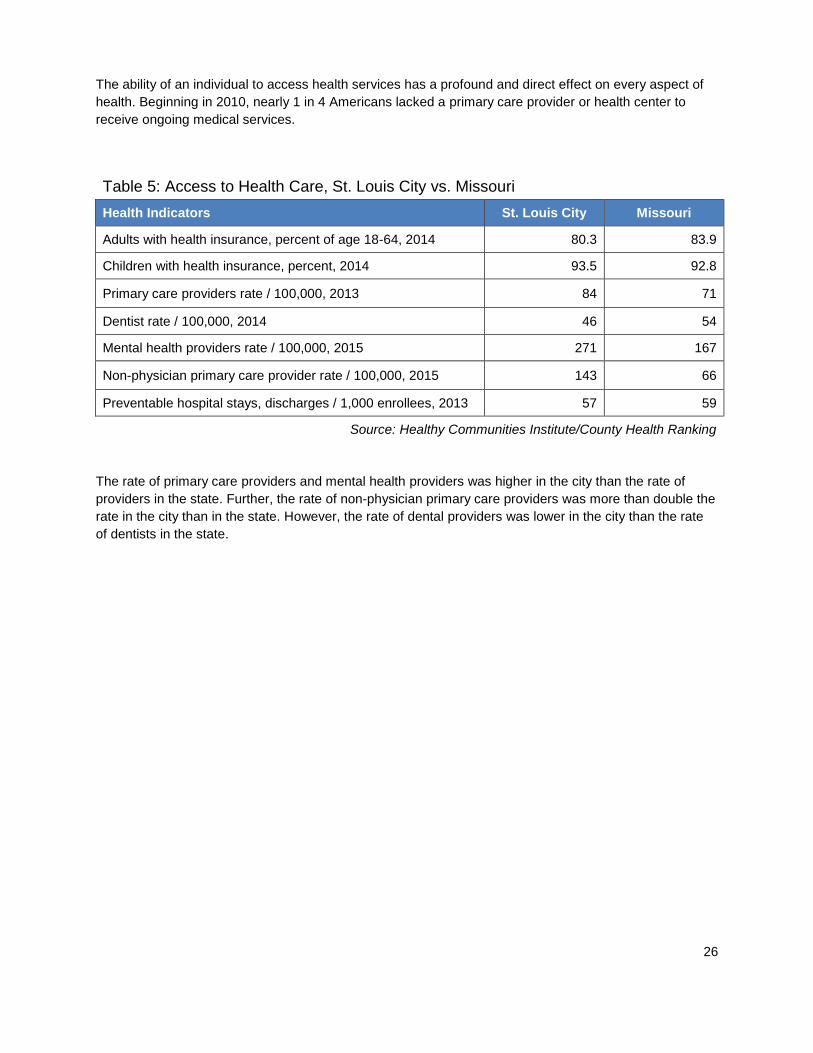
The ability of an individual to access health services has a profound and direct effect on every aspect of
health. Beginning in 2010, nearly 1 in 4 Americans lacked a primary care provider or health center to
receive ongoing medical services.
Table 5: Access to Health Care, St. Louis City vs. Missouri
Health Indicators St. Louis City Missouri
Adults with health insurance, percent of age 18-64, 2014 80.3 83.9
Children with health insurance, percent, 2014 93.5 92.8
Primary care providers rate / 100,000, 2013 84 71
Dentist rate / 100,000, 2014 46 54
Mental health providers rate / 100,000, 2015 271 167
Non-physician primary care provider rate / 100,000, 2015 143 66
Preventable hospital stays, discharges / 1,000 enrollees, 2013 57 59
Source: Healthy Communities Institute/County Health Ranking
The rate of primary care providers and mental health providers was higher in the city than the rate of
providers in the state. Further, the rate of non-physician primary care providers was more than double the
rate in the city than in the state. However, the rate of dental providers was lower in the city than the rate
of dentists in the state.

27
ACCESS: TRANSPORTATION
Owning a car has a direct correlation with the ability to travel. Individuals with no car in the household
make fewer than half the number of trips compared to those with a car and have limited access to
essential local services such as supermarkets, post offices, doctors' offices and hospitals. Most
households with above-average income own a car while only half of low-income households have a car.
(Healthy Communities Institute).
Table 6: Access: Transportation, St. Louis City vs. Missouri, 2010-2014
Health Indicators St. Louis City Missouri
Households without a vehicle, percent 21.9 7.4
Workers commuting by public transportation, percent 9.7 1.5
Mean travel time to work, age 16+ in minutes 23.8 23.1
Source: Healthy Communities Institute
St. Louis City had three times the number of households without a vehicle when compared to the state.

28
CANCER
Cancer is a leading cause of death in the United States, with more than 100 different types of the
disease. According to the National Cancer Institute, lung, colon and rectal, breast, pancreatic and
prostate cancer lead in the greatest number of annual deaths.
Chart 14: Death and Incidence Rates due to Cancer
Source: CDC State Cancer Profile
Overall, death and incidence rates of cancer in St. Louis City were higher than the respective rates in
Missouri and in the U.S.
Chart 15: Age-Adjusted Incidence Rate Compared to Age-Adjusted Death Rate Due to All Cancer: Time Series
Source: Healthy Communities Institute
485.1454.8 453.8
220.6184.1 171.2
0
100
200
300
400
500
600
ST. LOUIS CITY MISSOURI U.S.
CA
SES
/ 1
00
,00
0 P
OP
ULA
TIO
N
Incidence Rate Death Rate
438.9 435.4 439.8
488.3 490.2 485.1
221.5 217.4 210.7231.4 224 220.6
0
100
200
300
400
500
2003-2007 2004-2008 2005-2009 2006-2010 2007-2011 2008-2012
CA
SES
/ 1
00
,00
0
Incidences Deaths
29
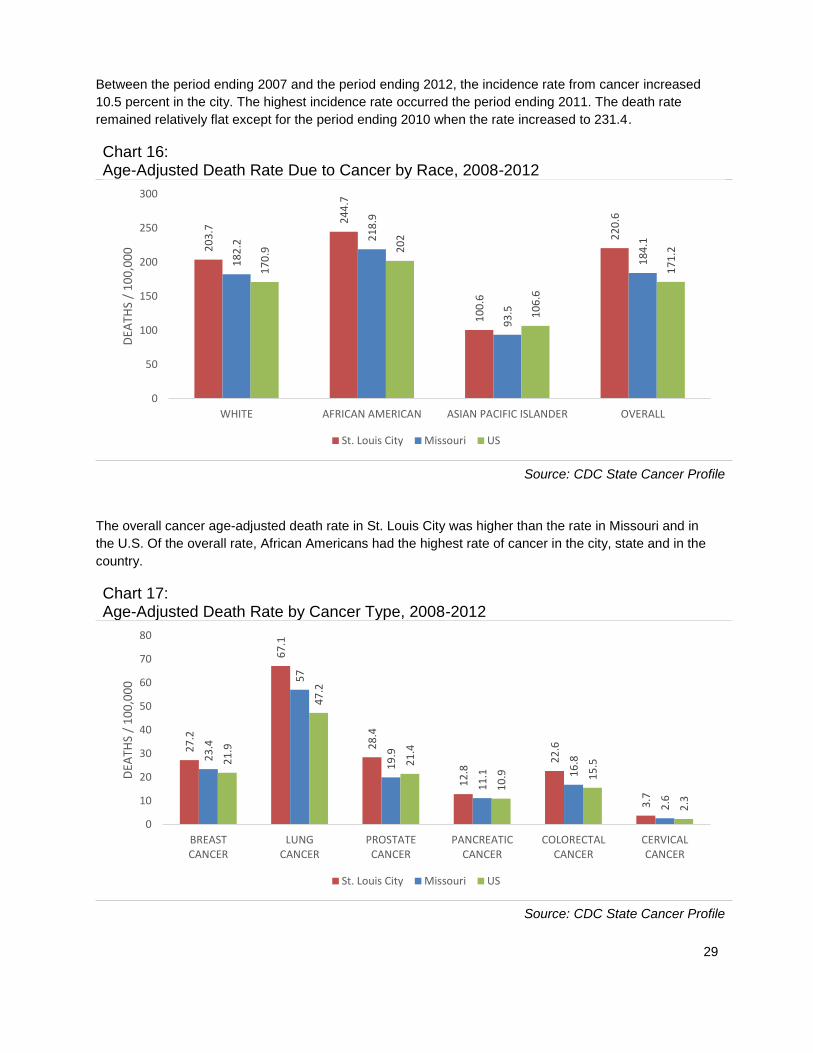
Between the period ending 2007 and the period ending 2012, the incidence rate from cancer increased
10.5 percent in the city. The highest incidence rate occurred the period ending 2011. The death rate
remained relatively flat except for the period ending 2010 when the rate increased to 231.4.
Chart 16: Age-Adjusted Death Rate Due to Cancer by Race, 2008-2012
Source: CDC State Cancer Profile
The overall cancer age-adjusted death rate in St. Louis City was higher than the rate in Missouri and in
the U.S. Of the overall rate, African Americans had the highest rate of cancer in the city, state and in the
country.
Chart 17: Age-Adjusted Death Rate by Cancer Type, 2008-2012
Source: CDC State Cancer Profile
20
3.7
24
4.7
10
0.6
22
0.6
18
2.2
21
8.9
93
.5
18
4.1
17
0.9 2
02
10
6.6
17
1.2
0
50
100
150
200
250
300
WHITE AFRICAN AMERICAN ASIAN PACIFIC ISLANDER OVERALL
DEA
THS
/ 1
00
,00
0
St. Louis City Missouri US
27
.2
67
.1
28
.4
12
.8
22
.6
3.7
23
.4
57
19
.9
11
.1 16
.8
2.6
21
.9
47
.2
21
.4
10
.9 15
.5
2.3
0
10
20
30
40
50
60
70
80
BREASTCANCER
LUNGCANCER
PROSTATECANCER
PANCREATICCANCER
COLORECTALCANCER
CERVICALCANCER
DEA
THS
/ 1
00
,00
0
St. Louis City Missouri US

30
The age-adjusted death rates of breast, lung and bronchus, prostate, pancreatic, colon and cervical
cancer in the city were higher than the rates in the state and the country. The highest death rate of cancer
in the city was reported in lung and bronchus cancer and prostate cancer. In Missouri, the highest death
rate occurred in lung and bronchus cancer and breast cancer.
According to Healthy Communities Institute:
Breast Cancer
Breast cancer is a leading cause of cancer death among women in the United States. According to the
American Cancer Society, about 1 in 8 women will develop breast cancer and about 1 in 36 women will
die from breast cancer. Breast cancer is associated with increased age, hereditary factors, obesity and
alcohol use. Since 1990, breast cancer death rates have declined progressively due to advancements in
treatment and detection. The Healthy People 2020 national health target is to reduce the breast cancer
death rate to 20.7 deaths per 100,000 females.
Lung Cancer
According to the American Lung Association, more people die from lung cancer annually than any other
type of cancer, exceeding the total deaths caused by breast cancer, colorectal cancer, and prostate
cancer combined. The greatest risk factor for lung cancer is duration and quantity of smoking. While the
mortality rate due to lung cancer among men has reached a plateau, the mortality rate due to lung cancer
among women continues to increase. African Americans have the highest risk of developing lung cancer.
The Healthy People 2020 national health target is to reduce the lung cancer death rate to 45.5 deaths per
100,000 population.
Prostate Cancer
Prostate cancer is a leading cause of cancer death among men in the United States. According to the
American Cancer Society, about 1 in 7 men will be diagnosed with prostate cancer. And about 1 in 36 will
die from prostate cancer. The two greatest risk factors for prostate cancer are age and race, with men
over the age of 65 and men of African descent possessing the highest incidence rates of prostate cancer
in the U.S.
The Healthy People 2020 national health target is to reduce the prostate cancer death rate to 21.8 deaths
per 100,000 males.
Colorectal Cancer
Colorectal cancer—cancer of the colon or rectum—is a leading cause of cancer-related deaths in the
United States. The Centers for Disease Control and Prevention estimates that if all adults aged 50 or
older had regular screening tests for colon cancer, as many as 60 percent of the deaths from colorectal
cancer could be prevented. While 90 percent of colorectal cancer cases occur in adults aged 50 or older,
it is essential for individuals with risk factors (those with a family history of colorectal cancer, inflammatory
bowel disease, or heavy alcohol use) to seek regular screening earlier.
The Healthy People 2020 national health target is to reduce the colorectal cancer death rate to 14.5
deaths per 100,000 population.

31
Chart 18: Age-Adjusted Incidence Rate Comparison Due to Cancer, 2008-2012
Source: CDC State Cancer Profile
The breast cancer incidence rate in the city was similar to the rate in the state and in the country. The
prostate cancer incidence rate in the city and the rate in the country were similar while the rate was lower
in the state. The rate of lung and bronchus cancer, pancreatic cancer, colon and rectum cancer and
cervical cancer was higher in the city than Missouri and the country.
Chart 19: Age-Adjusted Death Rate Due to Cancer Type by Race / Ethnicity
Source: Healthy Communities Institute
12
4.5
89
.7
13
2.3
14
.6
50
.5
11
.8
12
4.7
76
.2
11
3.6
12
.1
44
.5
8.4
12
3
63
.7
13
1.7
12
.3
41
.9
7.7
0
20
40
60
80
100
120
140
160
BREASTCANCER
LUNG &BRONCHUS
CANCER
PROSTATECANCER
PANCREATICCANCER
COLORECTALCANCER
CERVICALCANCER
CA
SES
/ 1
00
,00
0
St. Louis City Missouri US
34.2
26.7
71.1
40.3
21.818.3
66.1
19.9
0
10
20
30
40
50
60
70
80
BREASTCANCER
COLORECTALCANCER
LUNGCANCER
PROSTATECANCER
DEA
THS
/ 1
00
,00
0
African American White
32
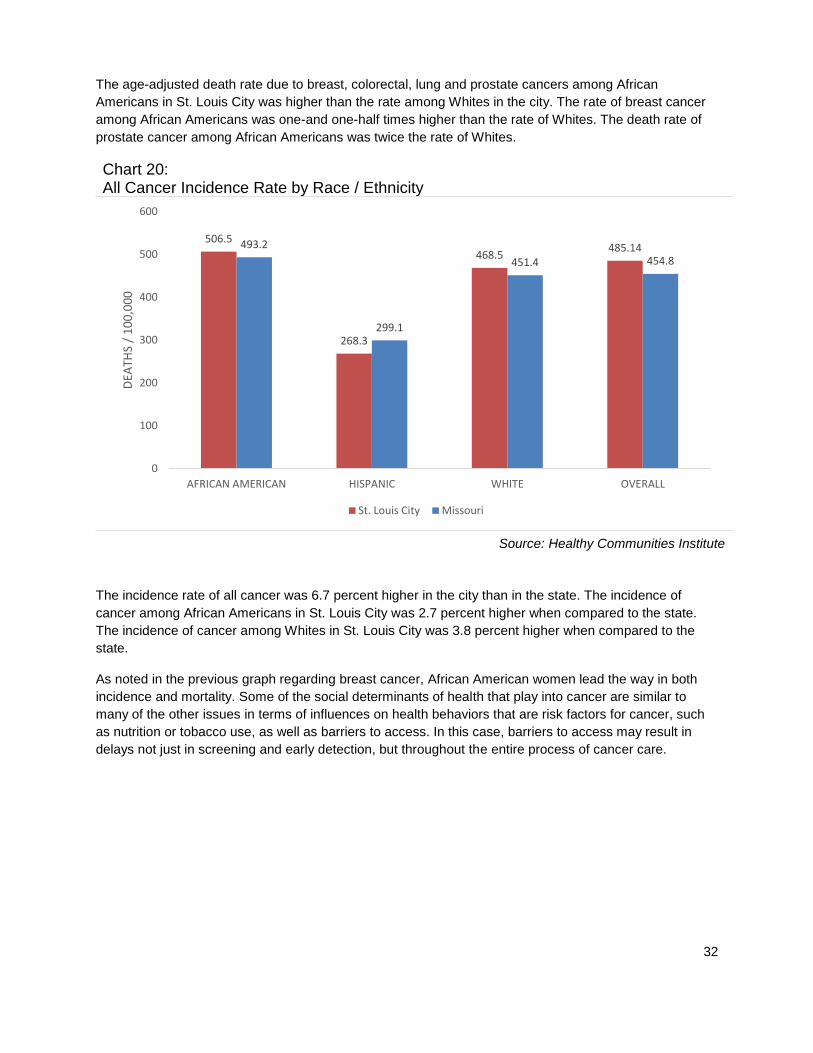
The age-adjusted death rate due to breast, colorectal, lung and prostate cancers among African
Americans in St. Louis City was higher than the rate among Whites in the city. The rate of breast cancer
among African Americans was one-and one-half times higher than the rate of Whites. The death rate of
prostate cancer among African Americans was twice the rate of Whites.
Chart 20: All Cancer Incidence Rate by Race / Ethnicity
Source: Healthy Communities Institute
The incidence rate of all cancer was 6.7 percent higher in the city than in the state. The incidence of
cancer among African Americans in St. Louis City was 2.7 percent higher when compared to the state.
The incidence of cancer among Whites in St. Louis City was 3.8 percent higher when compared to the
state.
As noted in the previous graph regarding breast cancer, African American women lead the way in both
incidence and mortality. Some of the social determinants of health that play into cancer are similar to
many of the other issues in terms of influences on health behaviors that are risk factors for cancer, such
as nutrition or tobacco use, as well as barriers to access. In this case, barriers to access may result in
delays not just in screening and early detection, but throughout the entire process of cancer care.
506.5
268.3
468.5485.14493.2
299.1
451.4 454.8
0
100
200
300
400
500
600
AFRICAN AMERICAN HISPANIC WHITE OVERALL
DEA
THS
/ 1
00
,00
0
St. Louis City Missouri
33
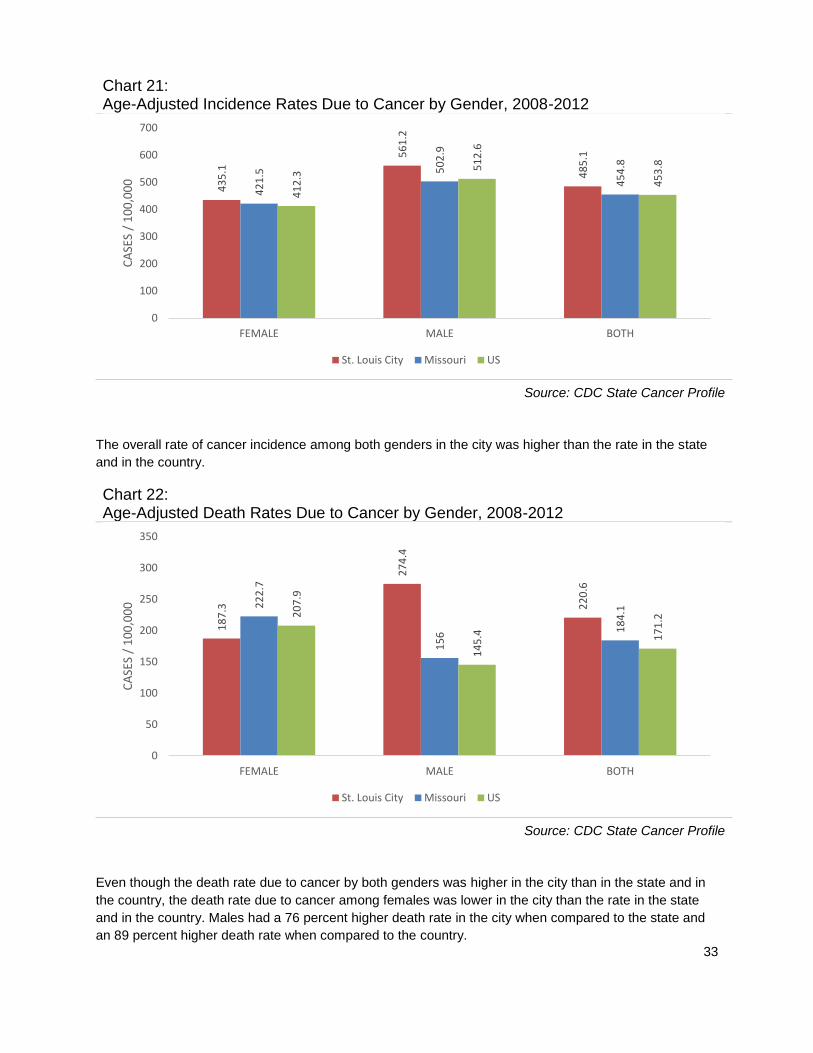
Chart 21: Age-Adjusted Incidence Rates Due to Cancer by Gender, 2008-2012
Source: CDC State Cancer Profile
The overall rate of cancer incidence among both genders in the city was higher than the rate in the state
and in the country.
Chart 22: Age-Adjusted Death Rates Due to Cancer by Gender, 2008-2012
Source: CDC State Cancer Profile
Even though the death rate due to cancer by both genders was higher in the city than in the state and in
the country, the death rate due to cancer among females was lower in the city than the rate in the state
and in the country. Males had a 76 percent higher death rate in the city when compared to the state and
an 89 percent higher death rate when compared to the country.
43
5.1
56
1.2
48
5.1
42
1.5 5
02
.9
45
4.8
41
2.3
51
2.6
45
3.8
0
100
200
300
400
500
600
700
FEMALE MALE BOTH
CA
SES
/ 1
00
,00
0
St. Louis City Missouri US
18
7.3
27
4.4
22
0.6
22
2.7
15
6 18
4.120
7.9
14
5.4 17
1.2
0
50
100
150
200
250
300
350
FEMALE MALE BOTH
CA
SES
/ 1
00
,00
0
St. Louis City Missouri US
34
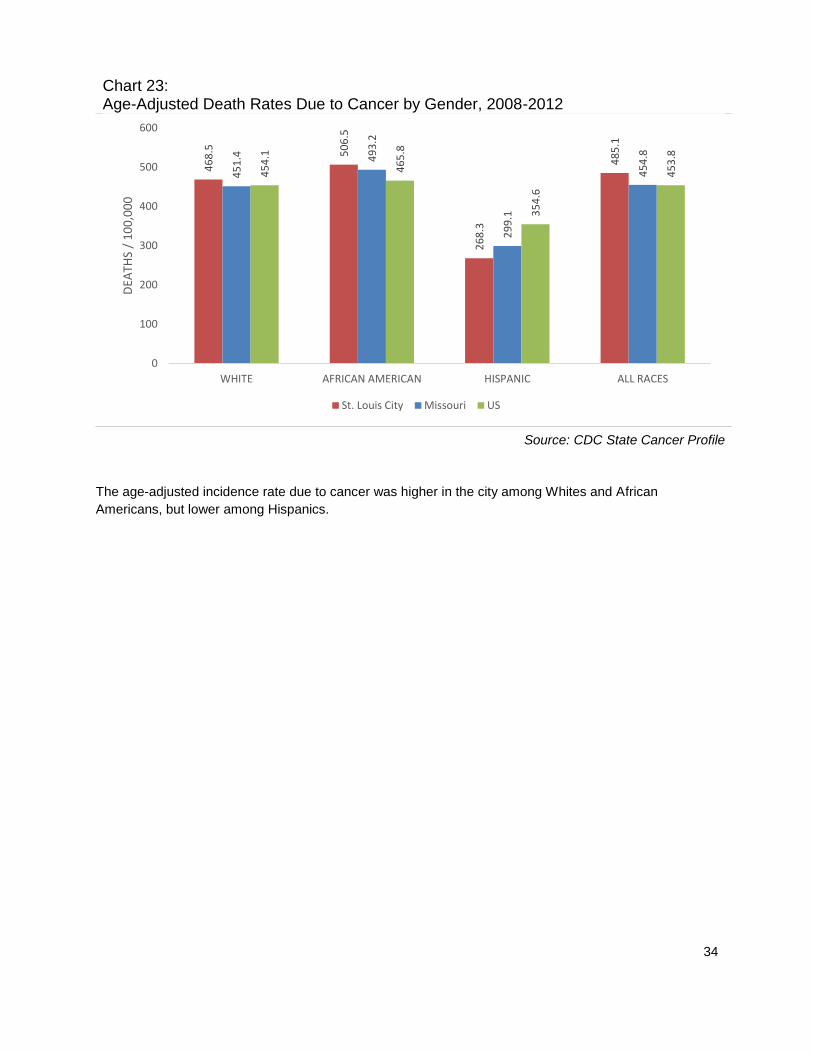
Chart 23: Age-Adjusted Death Rates Due to Cancer by Gender, 2008-2012
Source: CDC State Cancer Profile
The age-adjusted incidence rate due to cancer was higher in the city among Whites and African
Americans, but lower among Hispanics.
46
8.5 50
6.5
26
8.3
48
5.1
45
1.4 49
3.2
29
9.1
45
4.8
45
4.1
46
5.8
35
4.6
45
3.8
0
100
200
300
400
500
600
WHITE AFRICAN AMERICAN HISPANIC ALL RACES
DEA
THS
/ 1
00
,00
0
St. Louis City Missouri US
35
DIABETES
Diabetes is a leading cause of death in the United States. According to the Centers for Disease
Prevention and Control, more than 25 million people have diabetes, including both individuals already
diagnosed and those who have gone undiagnosed.
This disease can have harmful effects on most of the organ systems in the human body. It is a frequent
cause of end-stage renal disease, non-traumatic lower-extremity amputation, and a leading cause of
blindness among working-age adults. Persons with diabetes are also at increased risk for coronary heart
disease, neuropathy and stroke.
Diabetes disproportionately affects minority populations and the elderly, and its incidence is likely to
increase as minority populations grow and the U.S. population becomes older. (Healthy Communities
Institute).
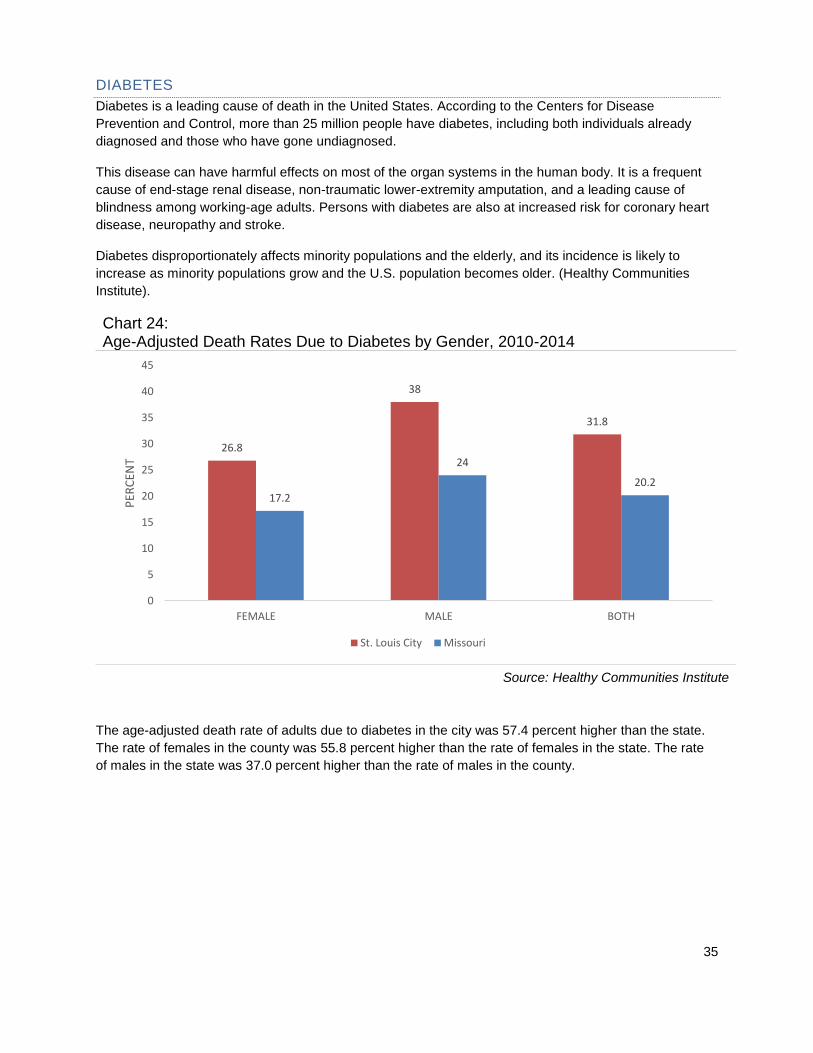
Chart 24: Age-Adjusted Death Rates Due to Diabetes by Gender, 2010-2014
Source: Healthy Communities Institute
The age-adjusted death rate of adults due to diabetes in the city was 57.4 percent higher than the state.
The rate of females in the county was 55.8 percent higher than the rate of females in the state. The rate
of males in the state was 37.0 percent higher than the rate of males in the county.
26.8
38
31.8
17.2
24
20.2
0
5
10
15
20
25
30
35
40
45
FEMALE MALE BOTH
PER
CEN
T
St. Louis City Missouri

36
Chart 25: Adults with Diabetes, 2013
Source: Healthy Communities Institute
The rate of adults with diabetes was 25 percent higher in the city when compared to the state. The rate of
females in the city was 33.3 percent higher than the state. The rate of males was 15.5 percent higher
than the state.
Chart 26: Age-Adjusted Death Rate Due to Diabetes by Race / Ethnicity
Source: Healthy Communities Institute
The age-adjusted death rate due to diabetes was 57.4 percent higher in the city than the state. African
Americans in the city had a 9.1 percent higher death rate when compared to the state. Whites in St. Louis
City had a 22.7 percent higher death rate than the state.
14.4
12.613.5
10.8 10.9 10.8
0
2
4
6
8
10
12
14
16
18
20
FEMALE MALE BOTH
PER
CEN
T
St. Louis City Missouri
41.9
22.7
31.8
38.4
18.520.2
0
5
10
15
20
25
30
35
40
45
50
AFRICAN AMERICAN WHITE OVERALL
DEA
THS
/ 1
00
,00
0 P
OP
ULA
TIO
N
St. Louis City Missouri

37
Chart 27: Adults with Diabetes: Time Series
Source: Healthy Communities Institute
From 2011 to 2013, the rate of adults with diabetes increased 9.8 percent. The rate in Missouri remained
relatively flat.
Chart 28: Age-Adjusted Death Rate Due to Diabetes, 2010-2014
Source: Healthy Communities Institute
The age-adjusted death rate due to diabetes for St. Louis City and Missouri remained relatively flat during
the period ending 2011 to the period ending 2014.
12.3 12.413.5
10.6 10.7 10.8
0
2
4
6
8
10
12
14
16
18
20
2011 2012 2013
PER
CEN
T
St. Louis City Missouri
32 31.332.7 31.8
20.8 20.2 20.3 20.2
0
5
10
15
20
25
30
35
2007-2011 2008-2012 2009-2013 2010-2014
DEA
THS
/ 1
00
,00
0 P
OP
ULA
TIO
N
St. Louis City Missouri

38
Chart 29: Medicare Population with Diabetes: Time Series
Source: Healthy Communities Institute
For the period ending 2010 to the period ending 2014, diabetes in the Medicare population in St. Louis
City and Missouri remained largely unchanged.
Chart 30: Medicare Population with Diabetes by Age, 2014
Source: Healthy Communities Institute
St. Louis City had a 15.4 percent higher rate of adults with diabetes than the state. The Under 65
Medicare population had a 14.1 percent higher rate than state. The 65 and Over Medicare population had
a 13.3 percent higher rate than the state.
29.4 29.8 30.1 30.1 29.9
25.9 26.1 26.1 26.1 25.9
0
5
10
15
20
25
30
35
2010 2011 2012 2013 2014
PER
CEN
T
St. Louis City Missouri
28.430.7 29.9
24.927.1
25.9
0
5
10
15
20
25
30
35
UNDER 65 65 & OVER OVERALL
PER
CEN
T
St. Louis City Missouri
39
HEALTHY LIFESTYLES
Obesity increases the risk of many diseases and health conditions including heart disease, type 2
diabetes, cancer, hypertension, stroke, liver and gallbladder disease, respiratory problems and
osteoarthritis. Losing weight and maintaining a healthy weight help to prevent and control these diseases.
Being obese also carries significant economic costs due to increased healthcare spending and lost
earnings. (Healthy Communities Institute).
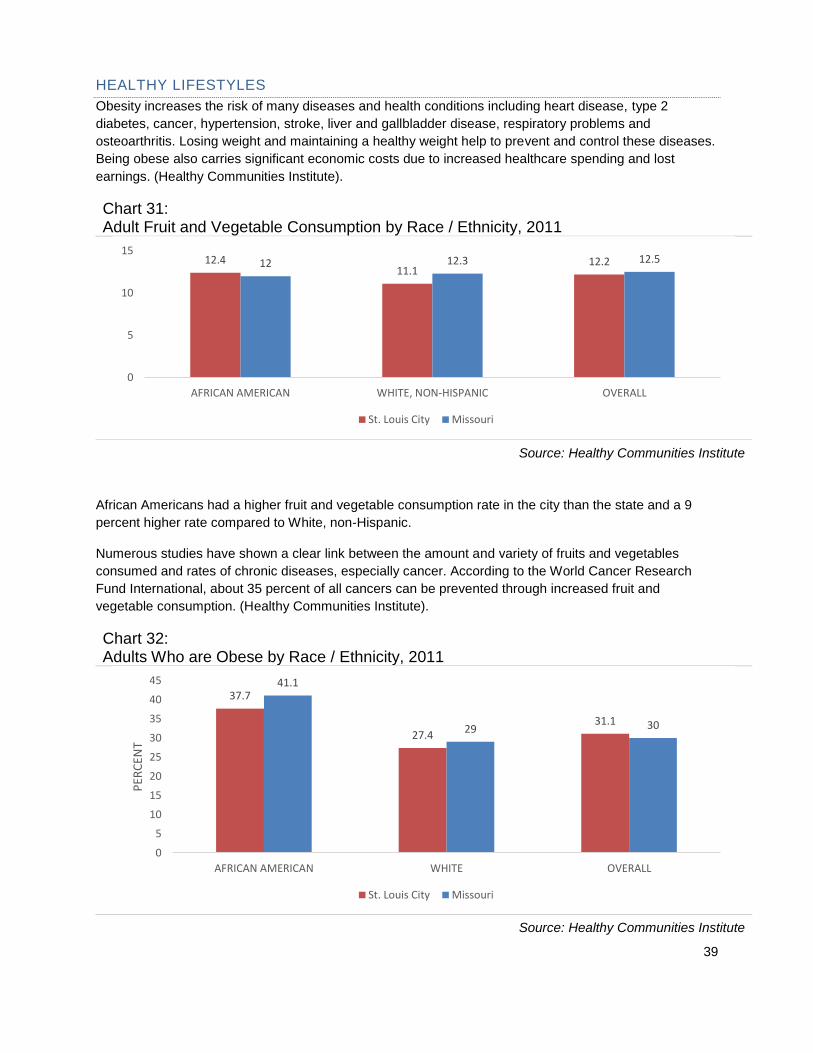
Chart 31: Adult Fruit and Vegetable Consumption by Race / Ethnicity, 2011
Source: Healthy Communities Institute
African Americans had a higher fruit and vegetable consumption rate in the city than the state and a 9
percent higher rate compared to White, non-Hispanic.
Numerous studies have shown a clear link between the amount and variety of fruits and vegetables
consumed and rates of chronic diseases, especially cancer. According to the World Cancer Research
Fund International, about 35 percent of all cancers can be prevented through increased fruit and
vegetable consumption. (Healthy Communities Institute).
Chart 32: Adults Who are Obese by Race / Ethnicity, 2011
Source: Healthy Communities Institute
12.411.1
12.212 12.3 12.5
0
5
10
15
AFRICAN AMERICAN WHITE, NON-HISPANIC OVERALL
St. Louis City Missouri
37.7
27.431.1
41.1
29 30
0
5
10
15
20
25
30
35
40
45
AFRICAN AMERICAN WHITE OVERALL
PER
CEN
T
St. Louis City Missouri

40
African Americans in the city had an 8.3 percent lower rate of obesity when compared to the state. Whites
also had a 5.5 percent lower rate of obesity when compared to the state.
Chart 33: Adults Who are Obese vs. HealthyPeople 2020, 2011
Source: Healthy Communities Institute
The Healthy People 2020 national health target is to reduce the proportion of adults age 20 and older who
are obese to 30.5 percent. In the graph above, St. Louis City and the state slightly exceeded the target.
31.1 31 30.5
0
5
10
15
20
25
30
35
ST. LOUIS CITY MISSOURI HP2020 TARGET
PER
CEN
T

41
HEART HEALTH
Heart disease is a term that encompasses a variety of different diseases affecting the heart and is the
leading cause of death in the United States accounting for 25.4 percent of total deaths.
Chart 34: Age-Adjusted Death Rate Due to Heart Disease by Race / Ethnicity, 2010-2014
Source: Healthy Communities Institute
The age-adjusted death rate due to heart disease in St. Louis City was 23.5 percent higher than the rate
in the state. African Americans in the city had a 16.4 percent higher death rate from heart disease in the
city when compared to the rate in the state.
Chart 35: High Cholesterol Prevalence in Adults 35+ by Race / Ethnicity, 2011
Source: Healthy Communities Institute
The overall high cholesterol prevalence was 4 percent lower in the city when compared to the state.
African Americans in the city had a 4 percent higher rate when compared to the state. White, Non-
Hispanics in the city had a 5.8 percent lower rate than the state.
267.6
220.4241
229.9
191.6 195
0
50
100
150
200
250
300
AFRICAN AMERICAN WHITE, NON-HISPANIC OVERALL
St. Louis City Missouri
39.7 40.8 41.238.1
43.3 42.9
0
10
20
30
40
50
AFRICAN AMERICAN WHITE, NON-HISPANIC OVERALL
PER
CEN
T
St. Louis City Missouri
42
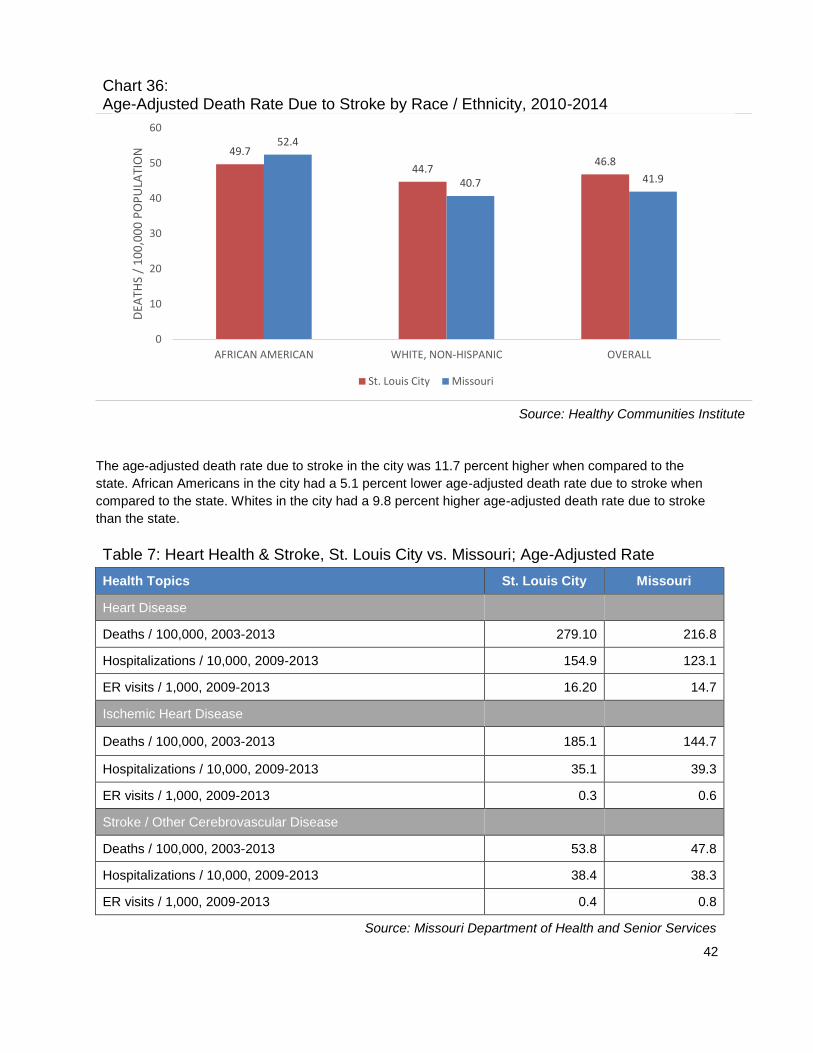
Chart 36: Age-Adjusted Death Rate Due to Stroke by Race / Ethnicity, 2010-2014
Source: Healthy Communities Institute
The age-adjusted death rate due to stroke in the city was 11.7 percent higher when compared to the
state. African Americans in the city had a 5.1 percent lower age-adjusted death rate due to stroke when
compared to the state. Whites in the city had a 9.8 percent higher age-adjusted death rate due to stroke
than the state.
Table 7: Heart Health & Stroke, St. Louis City vs. Missouri; Age-Adjusted Rate
Health Topics St. Louis City Missouri
Heart Disease
Deaths / 100,000, 2003-2013 279.10 216.8
Hospitalizations / 10,000, 2009-2013 154.9 123.1
ER visits / 1,000, 2009-2013 16.20 14.7
Ischemic Heart Disease
Deaths / 100,000, 2003-2013 185.1 144.7
Hospitalizations / 10,000, 2009-2013 35.1 39.3
ER visits / 1,000, 2009-2013 0.3 0.6
Stroke / Other Cerebrovascular Disease
Deaths / 100,000, 2003-2013 53.8 47.8
Hospitalizations / 10,000, 2009-2013 38.4 38.3
ER visits / 1,000, 2009-2013 0.4 0.8
Source: Missouri Department of Health and Senior Services
49.7
44.746.8
52.4
40.7 41.9
0
10
20
30
40
50
60
AFRICAN AMERICAN WHITE, NON-HISPANIC OVERALL
DEA
THS
/ 1
00
,00
0 P
OP
ULA
TIO
N
St. Louis City Missouri
43
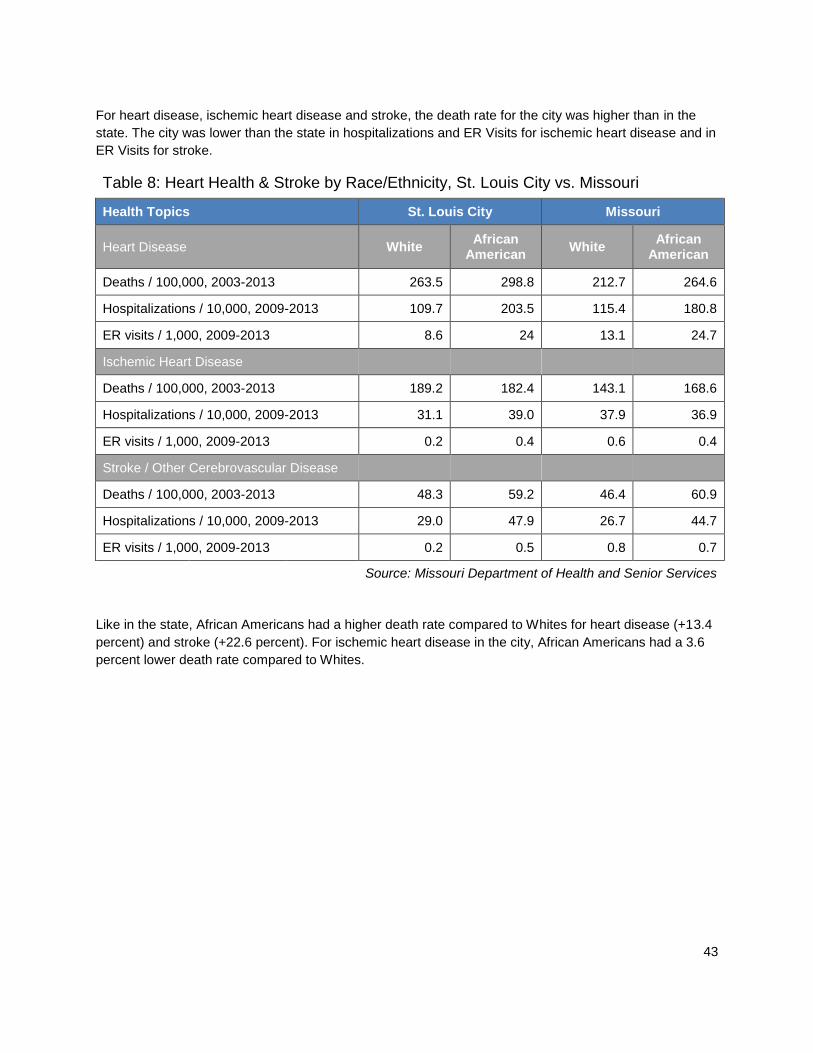
For heart disease, ischemic heart disease and stroke, the death rate for the city was higher than in the
state. The city was lower than the state in hospitalizations and ER Visits for ischemic heart disease and in
ER Visits for stroke.
Table 8: Heart Health & Stroke by Race/Ethnicity, St. Louis City vs. Missouri
Health Topics St. Louis City Missouri
Heart Disease White African
American White
African American
Deaths / 100,000, 2003-2013 263.5 298.8 212.7 264.6
Hospitalizations / 10,000, 2009-2013 109.7 203.5 115.4 180.8
ER visits / 1,000, 2009-2013 8.6 24 13.1 24.7
Ischemic Heart Disease
Deaths / 100,000, 2003-2013 189.2 182.4 143.1 168.6
Hospitalizations / 10,000, 2009-2013 31.1 39.0 37.9 36.9
ER visits / 1,000, 2009-2013 0.2 0.4 0.6 0.4
Stroke / Other Cerebrovascular Disease
Deaths / 100,000, 2003-2013 48.3 59.2 46.4 60.9
Hospitalizations / 10,000, 2009-2013 29.0 47.9 26.7 44.7
ER visits / 1,000, 2009-2013 0.2 0.5 0.8 0.7
Source: Missouri Department of Health and Senior Services
Like in the state, African Americans had a higher death rate compared to Whites for heart disease (+13.4
percent) and stroke (+22.6 percent). For ischemic heart disease in the city, African Americans had a 3.6
percent lower death rate compared to Whites.
44
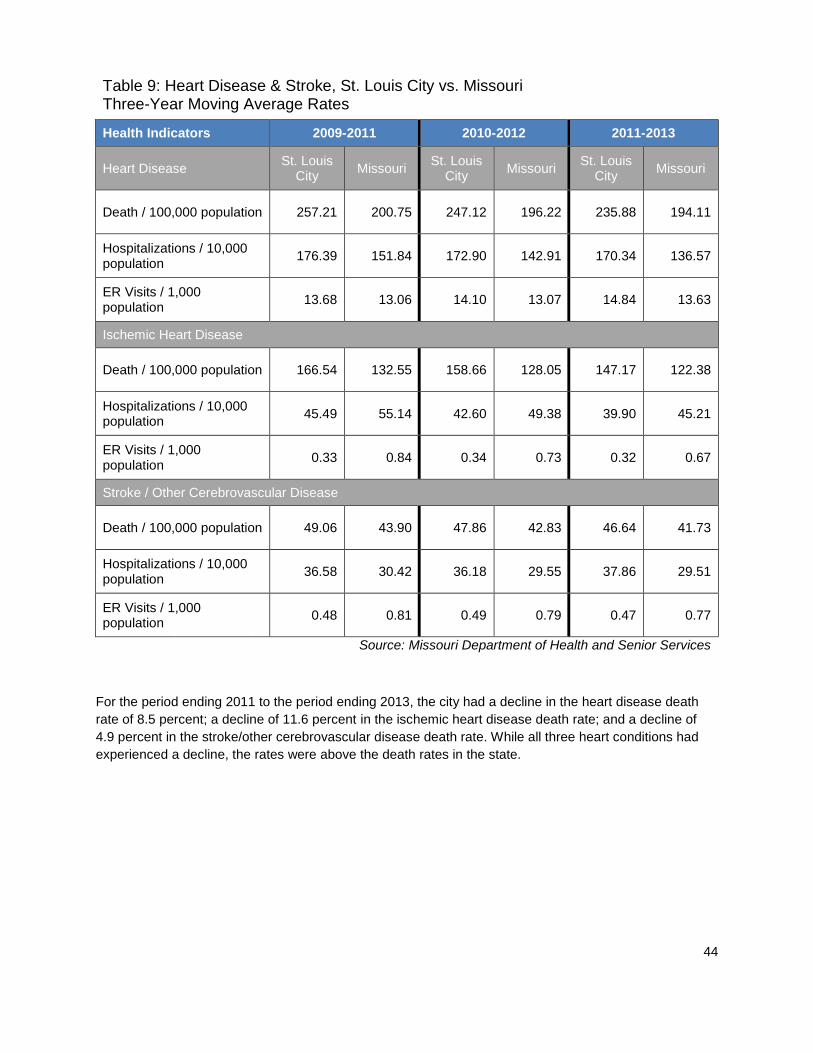
Table 9: Heart Disease & Stroke, St. Louis City vs. Missouri Three-Year Moving Average Rates
Health Indicators 2009-2011 2010-2012 2011-2013
Heart Disease St. Louis
City Missouri
St. Louis City
Missouri St. Louis
City Missouri
Death / 100,000 population 257.21 200.75 247.12 196.22 235.88 194.11
Hospitalizations / 10,000 population
176.39 151.84 172.90 142.91 170.34 136.57
ER Visits / 1,000 population
13.68 13.06 14.10 13.07 14.84 13.63
Ischemic Heart Disease
Death / 100,000 population 166.54 132.55 158.66 128.05 147.17 122.38
Hospitalizations / 10,000 population
45.49 55.14 42.60 49.38 39.90 45.21
ER Visits / 1,000 population
0.33 0.84 0.34 0.73 0.32 0.67
Stroke / Other Cerebrovascular Disease
Death / 100,000 population 49.06 43.90 47.86 42.83 46.64 41.73
Hospitalizations / 10,000 population
36.58 30.42 36.18 29.55 37.86 29.51
ER Visits / 1,000 population
0.48 0.81 0.49 0.79 0.47 0.77
Source: Missouri Department of Health and Senior Services
For the period ending 2011 to the period ending 2013, the city had a decline in the heart disease death
rate of 8.5 percent; a decline of 11.6 percent in the ischemic heart disease death rate; and a decline of
4.9 percent in the stroke/other cerebrovascular disease death rate. While all three heart conditions had
experienced a decline, the rates were above the death rates in the state.
45
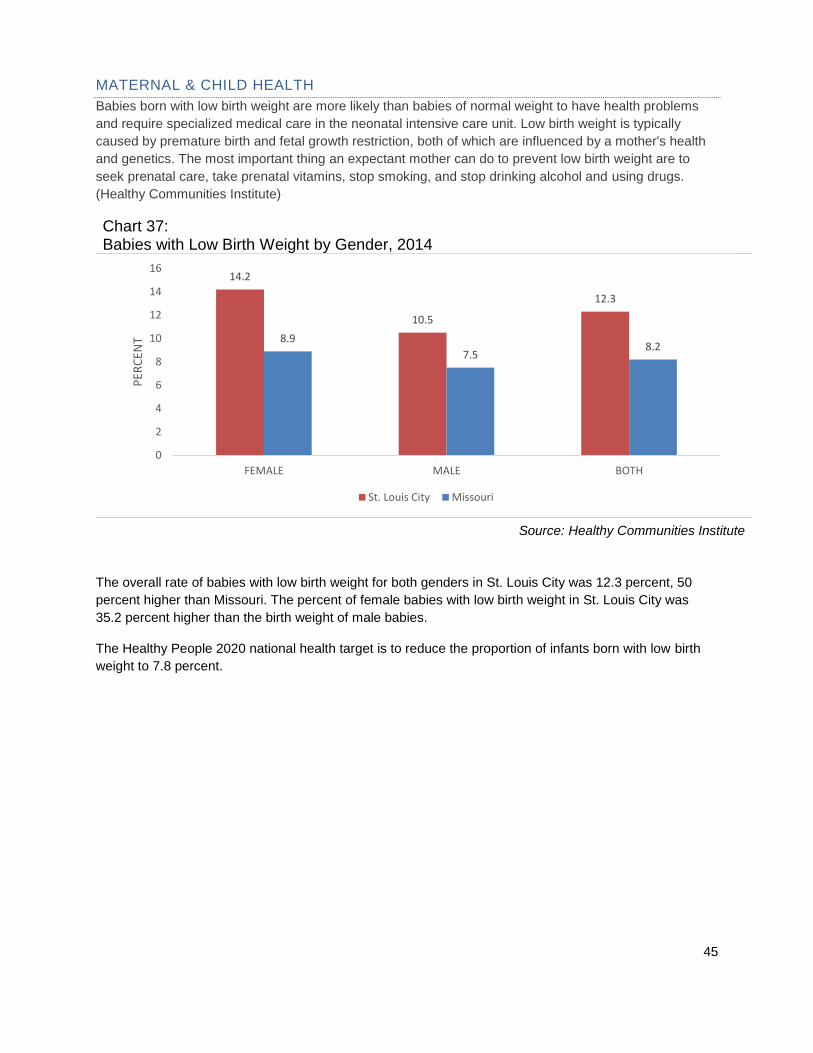
MATERNAL & CHILD HEALTH
Babies born with low birth weight are more likely than babies of normal weight to have health problems
and require specialized medical care in the neonatal intensive care unit. Low birth weight is typically
caused by premature birth and fetal growth restriction, both of which are influenced by a mother's health
and genetics. The most important thing an expectant mother can do to prevent low birth weight are to
seek prenatal care, take prenatal vitamins, stop smoking, and stop drinking alcohol and using drugs.
(Healthy Communities Institute)
Chart 37: Babies with Low Birth Weight by Gender, 2014
Source: Healthy Communities Institute
The overall rate of babies with low birth weight for both genders in St. Louis City was 12.3 percent, 50
percent higher than Missouri. The percent of female babies with low birth weight in St. Louis City was
35.2 percent higher than the birth weight of male babies.
The Healthy People 2020 national health target is to reduce the proportion of infants born with low birth
weight to 7.8 percent.
14.2
10.5
12.3
8.9
7.58.2
0
2
4
6
8
10
12
14
16
FEMALE MALE BOTH
PER
CEN
T
St. Louis City Missouri
46
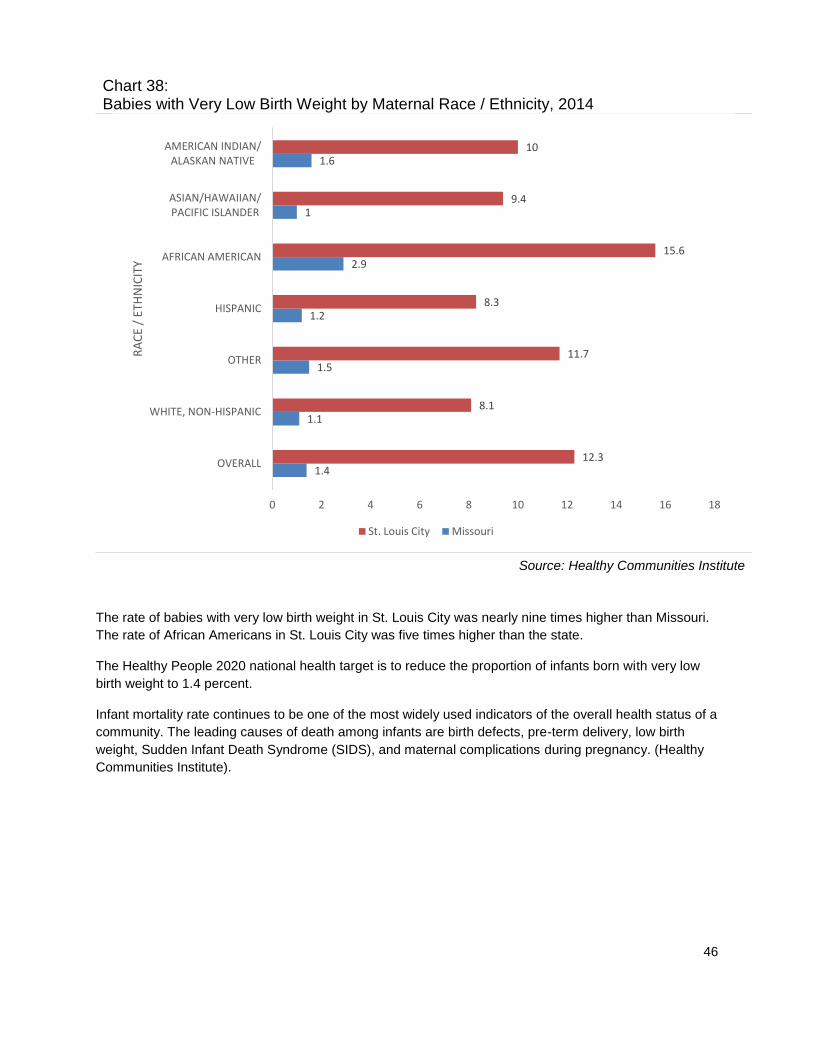
Chart 38: Babies with Very Low Birth Weight by Maternal Race / Ethnicity, 2014
Source: Healthy Communities Institute
The rate of babies with very low birth weight in St. Louis City was nearly nine times higher than Missouri.
The rate of African Americans in St. Louis City was five times higher than the state.
The Healthy People 2020 national health target is to reduce the proportion of infants born with very low
birth weight to 1.4 percent.
Infant mortality rate continues to be one of the most widely used indicators of the overall health status of a
community. The leading causes of death among infants are birth defects, pre-term delivery, low birth
weight, Sudden Infant Death Syndrome (SIDS), and maternal complications during pregnancy. (Healthy
Communities Institute).
1.4
1.1
1.5
1.2
2.9
1
1.6
12.3
8.1
11.7
8.3
15.6
9.4
10
0 2 4 6 8 10 12 14 16 18
OVERALL
WHITE, NON-HISPANIC
OTHER
HISPANIC
AFRICAN AMERICAN
ASIAN/HAWAIIAN/PACIFIC ISLANDER
AMERICAN INDIAN/ALASKAN NATIVE
RA
CE
/ ET
HN
ICIT
Y
St. Louis City Missouri

47
Chart 39: Infant Mortality Rate by Race / Ethnicity, 2002-2012
Source: Healthy Communities Institute
The infant mortality rate by race was 11.2 percent, 53.4 percent higher than the state. The rate of infant
mortality among African Americans in the city was nearly three times higher than the rate of Whites.
The Healthy People 2020 national health target is to reduce the infant mortality rate to 6 deaths per 1,000
live births.
Babies born to mothers who do not receive prenatal care are three times more likely to have a low birth
weight and five times more likely to die than those born to mothers who do get care. Early prenatal care
(i.e. care in the first trimester of a pregnancy) allows women and their health care providers to identify
and, when possible, treat or correct health problems and health-compromising behaviors that can be
particularly damaging during the initial stages of fetal development. Increasing the number of women who
receive prenatal care, and who do so early in their pregnancies, can improve birth outcomes and lower
health care costs by reducing the likelihood of complications during pregnancy and childbirth. (Healthy
Communities Institute).
15.3
5.1
11.2
14.4
6.1
7.3
0
2
4
6
8
10
12
14
16
AFRICAN AMERICAN WHITE OVERALL
PER
CEN
T
St. Louis City Missouri

48
Chart 40: Mothers Who Received Early Prenatal Care by Age, 2010-2014
Source: Healthy Communities Institute
The rate of mothers who received early prenatal care in St. Louis City was 73.2 percent, 1.9 points below
the state rate. The 30-34 age group had the highest rate among all age groups in St. Louis City and
Missouri followed by the 35-39 age group. The 10-14 age group received the lowest rate of early prenatal
care in both St. Louis City and Missouri.
The Healthy People 2020 national health target is to increase the proportion of pregnant women who
receive prenatal care in the first trimester to 77.9 percent.
75.1
75.6
80.9
83
78.4
68.9
61.9
55.2
37.3
73.2
76
82.3
83.2
76
64.5
59.4
48.2
33.3
0 10 20 30 40 50 60 70 80 90
OVERALL
40+
35-39
30-34
25-29
20-24
18-19
15-17
10-14A
GE
IN Y
EAR
S
St. Louis City Missouri

49
Chart 41: Mothers Who Received Early Prenatal Care by Race / Ethnicity, 2010-2014
Source: Healthy Communities Institute
Among all races residing in the city, Whites received the highest percentage of early prenatal care both in
the city and the state. African Americans had the lowest rate in the city and the state.
Smoking during pregnancy poses risks for both mother and fetus. A baby born to a mother who has
smoked during her pregnancy is more likely to have less developed lungs and a lower birth weight, and is
more likely to be born prematurely. It is estimated that smoking during pregnancy causes up to 10 percent
of all infant deaths. Even after a baby is born, secondhand smoking can contribute to SIDS (Sudden
Infant Death Syndrome), asthma onset, and stunted growth.
The Healthy People 2020 national health target is to decrease the percentage of women who gave birth
and who smoked cigarettes during pregnancy to 1.4 percent.
75.1
77.8
65.5
63.1
62.5
73.6
63.4
73.2
87
67.7
72.2
63.5
77.6
67.8
0 10 20 30 40 50 60 70 80 90 100
OVERALL
WHITE
OTHER
HISPANIC
AFRICAN AMERICAN
ASIAN/HAWAIIAN/PACIFIC ISLANDER
AMERIAN INDIAN/ALASKA NATIVE
St. Louis City Missouri

50
Chart 42: Mothers Who Smoked During Pregnancy by Race / Ethnicity, 2014
Source: Healthy Communities Institute
The rate of mothers who smoke during pregnancy in the city was 13.5 percent, 18.7 percent lower than
the state. African Americans had the highest rate in St. Louis City and American Indian/Alaska Native had
the highest rate in the state.
Babies born premature are likely to require specialized medical care, and oftentimes must stay in
intensive care nurseries. While there have been many medical advances enabling premature infants to
survive, there is still risk of infant death or long-term disability. The most important things an expectant
mother can do to prevent prematurity and low birth weight are to take prenatal vitamins, stop smoking,
stop drinking alcohol and using drugs, and get prenatal care. (Healthy Communities Institute).
16.6
17.9
2.4
6.3
13.6
2.6
27.1
13.5
10.9
3.6
4.9
16.7
3.9
5
0 5 10 15 20 25 30
OVERALL
WHITE
OTHER
HISPANIC
AFRICAN AMERICAN
ASIAN/HAWAIIAN/PACIFIC ISLANDER
AMERIAN INDIAN/ALASKA NATIVE
PERCENT
St. Louis City Missouri

51
Chart 43: Preterm Births by Maternal Race / Ethnicity, 2014
Source: Healthy Communities Institute
The rate of preterm births is 12.5 percent in St. Louis City, 28.9 percent higher than in Missouri. Preterm
births among African Americans had the highest rate in the city and the state.
The Healthy People 2020 national health target is to reduce the proportion of infants who are born
preterm to 11.4 percent.
9.7
8.9
8.2
8.8
14.2
9.2
10.1
12.5
9.3
12.6
10.8
15
11.6
0
0 2 4 6 8 10 12 14 16
OVERALL
WHITE
OTHER
HISPANIC
AFRICAN AMERICAN
ASIAN/HAWAIIAN/PACIFIC ISLANDER
AMERIAN INDIAN/ALASKA NATIVE
PERCENT
St. Louis City Missouri
52
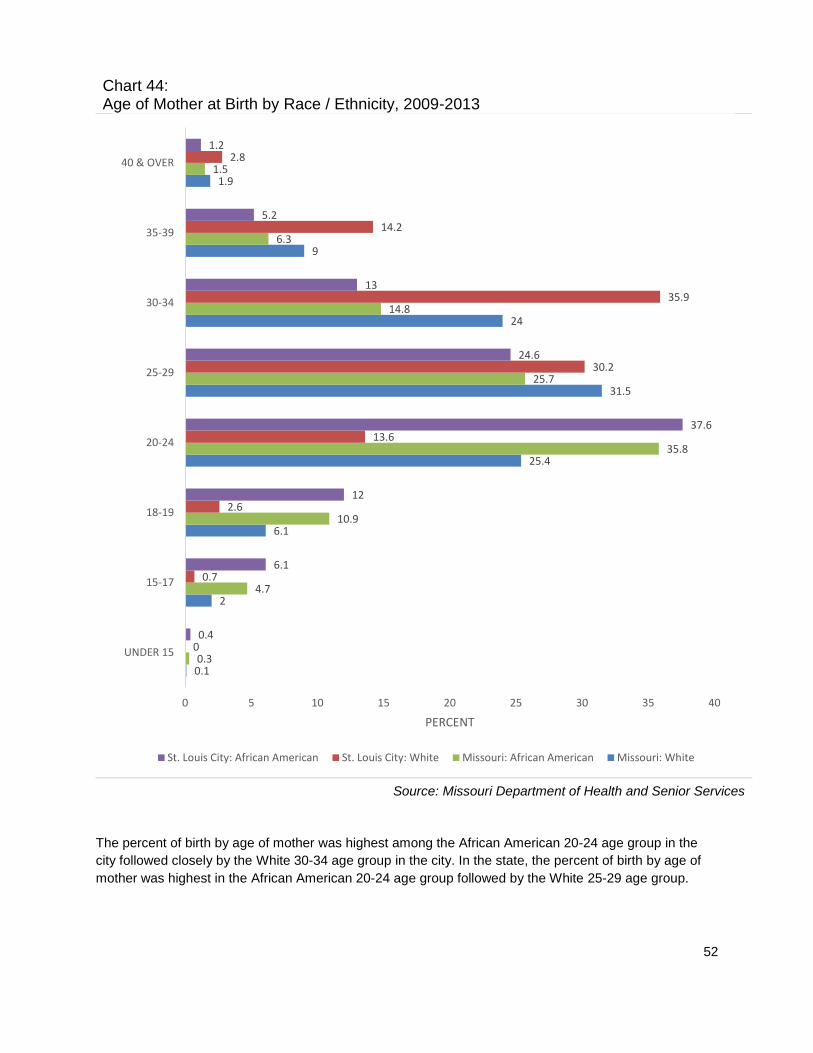
Chart 44: Age of Mother at Birth by Race / Ethnicity, 2009-2013
Source: Missouri Department of Health and Senior Services
The percent of birth by age of mother was highest among the African American 20-24 age group in the
city followed closely by the White 30-34 age group in the city. In the state, the percent of birth by age of
mother was highest in the African American 20-24 age group followed by the White 25-29 age group.
0.1
2
6.1
25.4
31.5
24
9
1.9
0.3
4.7
10.9
35.8
25.7
14.8
6.3
1.5
0
0.7
2.6
13.6
30.2
35.9
14.2
2.8
0.4
6.1
12
37.6
24.6
13
5.2
1.2
0 5 10 15 20 25 30 35 40
UNDER 15
15-17
18-19
20-24
25-29
30-34
35-39
40 & OVER
PERCENT
St. Louis City: African American St. Louis City: White Missouri: African American Missouri: White
53
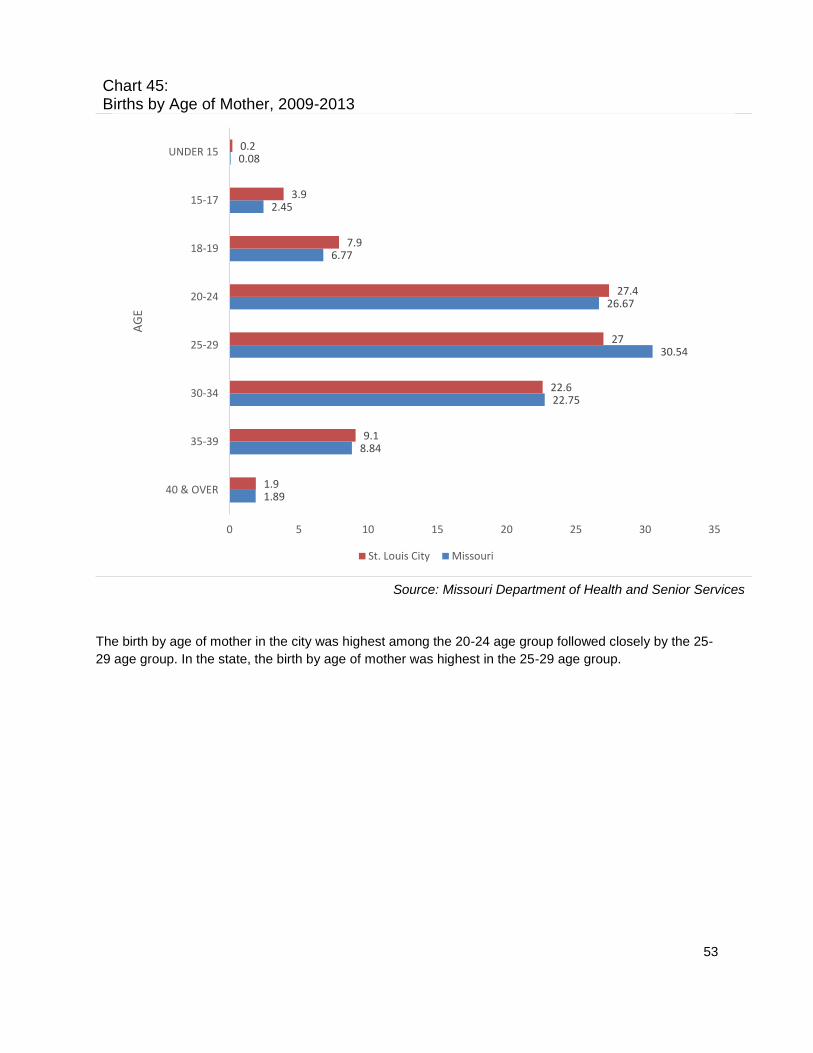
Chart 45: Births by Age of Mother, 2009-2013
Source: Missouri Department of Health and Senior Services
The birth by age of mother in the city was highest among the 20-24 age group followed closely by the 25-
29 age group. In the state, the birth by age of mother was highest in the 25-29 age group.
1.89
8.84
22.75
30.54
26.67
6.77
2.45
0.08
1.9
9.1
22.6
27
27.4
7.9
3.9
0.2
0 5 10 15 20 25 30 35
40 & OVER
35-39
30-34
25-29
20-24
18-19
15-17
UNDER 15A
GE
St. Louis City Missouri
54
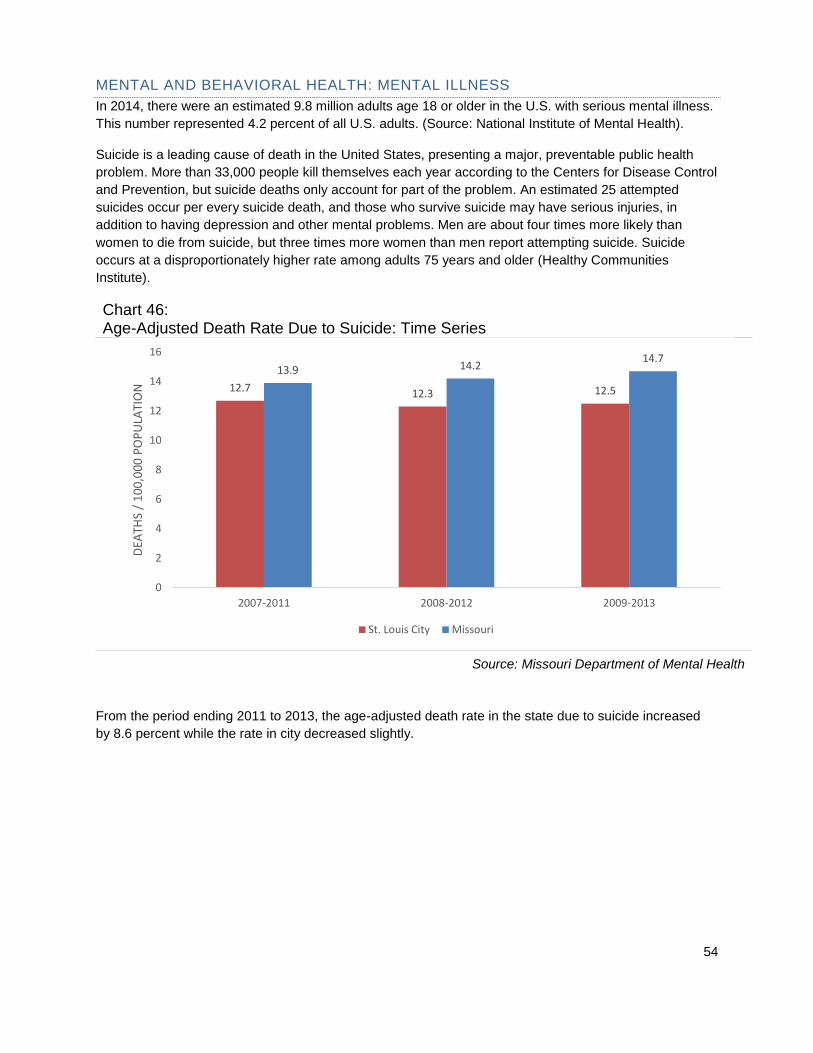
MENTAL AND BEHAVIORAL HEALTH: MENTAL ILLNESS
In 2014, there were an estimated 9.8 million adults age 18 or older in the U.S. with serious mental illness.
This number represented 4.2 percent of all U.S. adults. (Source: National Institute of Mental Health).
Suicide is a leading cause of death in the United States, presenting a major, preventable public health
problem. More than 33,000 people kill themselves each year according to the Centers for Disease Control
and Prevention, but suicide deaths only account for part of the problem. An estimated 25 attempted
suicides occur per every suicide death, and those who survive suicide may have serious injuries, in
addition to having depression and other mental problems. Men are about four times more likely than
women to die from suicide, but three times more women than men report attempting suicide. Suicide
occurs at a disproportionately higher rate among adults 75 years and older (Healthy Communities
Institute).
Chart 46: Age-Adjusted Death Rate Due to Suicide: Time Series
Source: Missouri Department of Mental Health
From the period ending 2011 to 2013, the age-adjusted death rate in the state due to suicide increased
by 8.6 percent while the rate in city decreased slightly.
12.7 12.3 12.5
13.9 14.214.7
0
2
4
6
8
10
12
14
16
2007-2011 2008-2012 2009-2013
DEA
THS
/ 1
00
,00
0 P
OP
ULA
TIO
N
St. Louis City Missouri
55
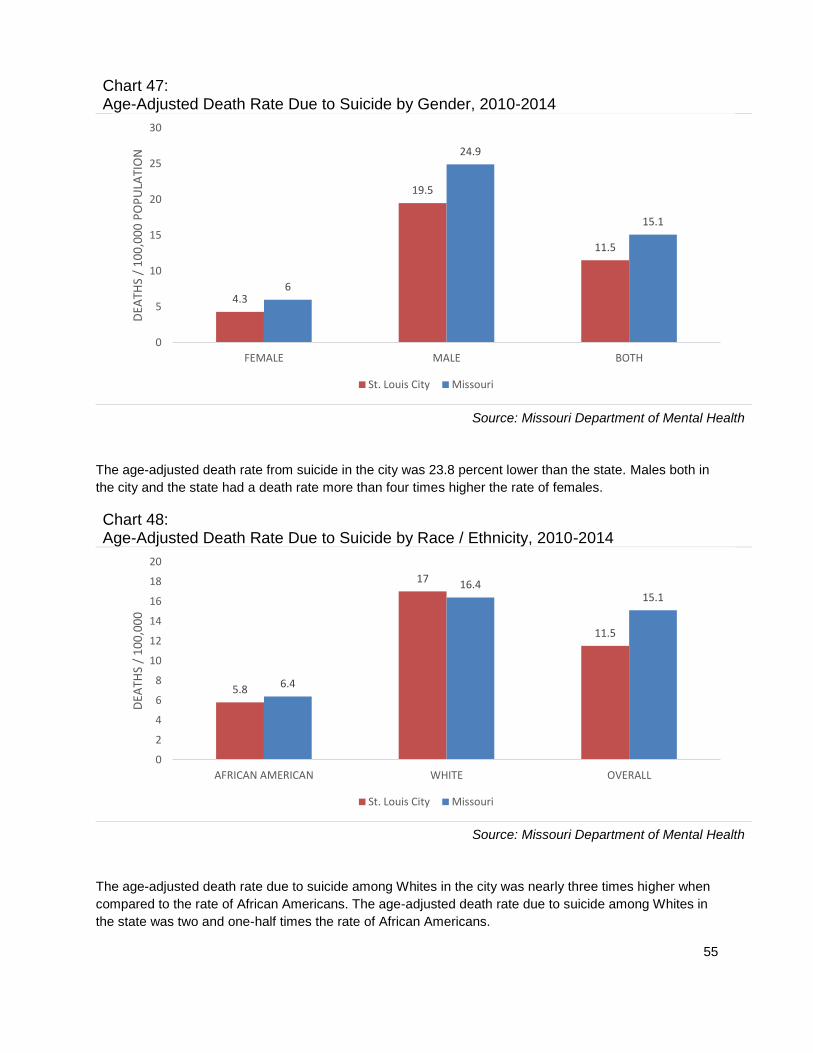
Chart 47: Age-Adjusted Death Rate Due to Suicide by Gender, 2010-2014
Source: Missouri Department of Mental Health
The age-adjusted death rate from suicide in the city was 23.8 percent lower than the state. Males both in
the city and the state had a death rate more than four times higher the rate of females.
Chart 48: Age-Adjusted Death Rate Due to Suicide by Race / Ethnicity, 2010-2014
Source: Missouri Department of Mental Health
The age-adjusted death rate due to suicide among Whites in the city was nearly three times higher when
compared to the rate of African Americans. The age-adjusted death rate due to suicide among Whites in
the state was two and one-half times the rate of African Americans.
4.3
19.5
11.5
6
24.9
15.1
0
5
10
15
20
25
30
FEMALE MALE BOTH
DEA
THS
/ 1
00
,00
0 P
OP
ULA
TIO
N
St. Louis City Missouri
5.8
17
11.5
6.4
16.415.1
0
2
4
6
8
10
12
14
16
18
20
AFRICAN AMERICAN WHITE OVERALL
DEA
THS
/ 1
00
,00
0
St. Louis City Missouri
56
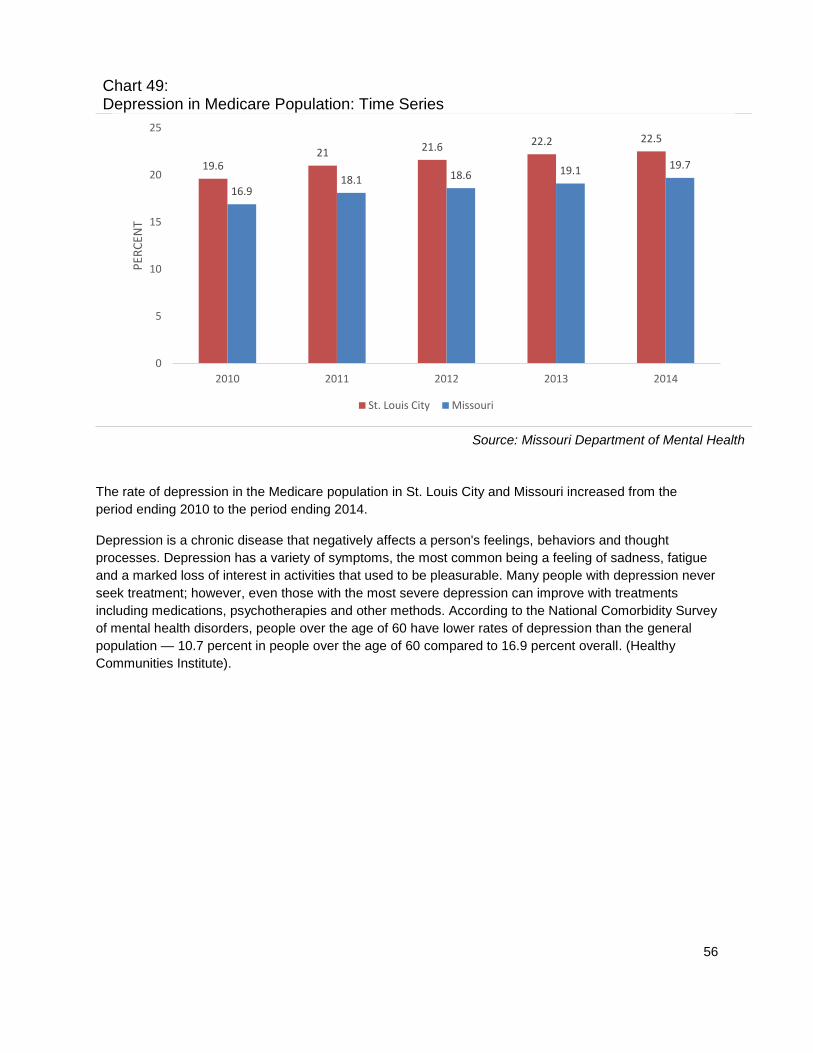
Chart 49: Depression in Medicare Population: Time Series
Source: Missouri Department of Mental Health
The rate of depression in the Medicare population in St. Louis City and Missouri increased from the
period ending 2010 to the period ending 2014.
Depression is a chronic disease that negatively affects a person's feelings, behaviors and thought
processes. Depression has a variety of symptoms, the most common being a feeling of sadness, fatigue
and a marked loss of interest in activities that used to be pleasurable. Many people with depression never
seek treatment; however, even those with the most severe depression can improve with treatments
including medications, psychotherapies and other methods. According to the National Comorbidity Survey
of mental health disorders, people over the age of 60 have lower rates of depression than the general
population — 10.7 percent in people over the age of 60 compared to 16.9 percent overall. (Healthy
Communities Institute).
19.621 21.6 22.2 22.5
16.918.1 18.6 19.1 19.7
0
5
10
15
20
25
2010 2011 2012 2013 2014
PER
CEN
T
St. Louis City Missouri

57
Chart 50: Depression in Medicare Population by Age, 2014
Source: Healthy Communities Institute
The rate of depression among the Medicare population in the city was higher than in the state. The rate of
depression among the Under 65 Medicare population was 12.5 percent lower than in the state. The rate
of depression among the 65 & Over Medicare population was 12.1 percent higher than the state.
Medicare is the federal health insurance program for persons aged 65 years or older, persons under age
65 years with certain disabilities, and persons of any age with end-stage renal disease (ESRD).
31.6
17.6
22.5
36.1
15.7
19.7
0
5
10
15
20
25
30
35
40
UNDER 65 65 & OVER OVERALL
PER
CEN
T
St. Louis City Missouri
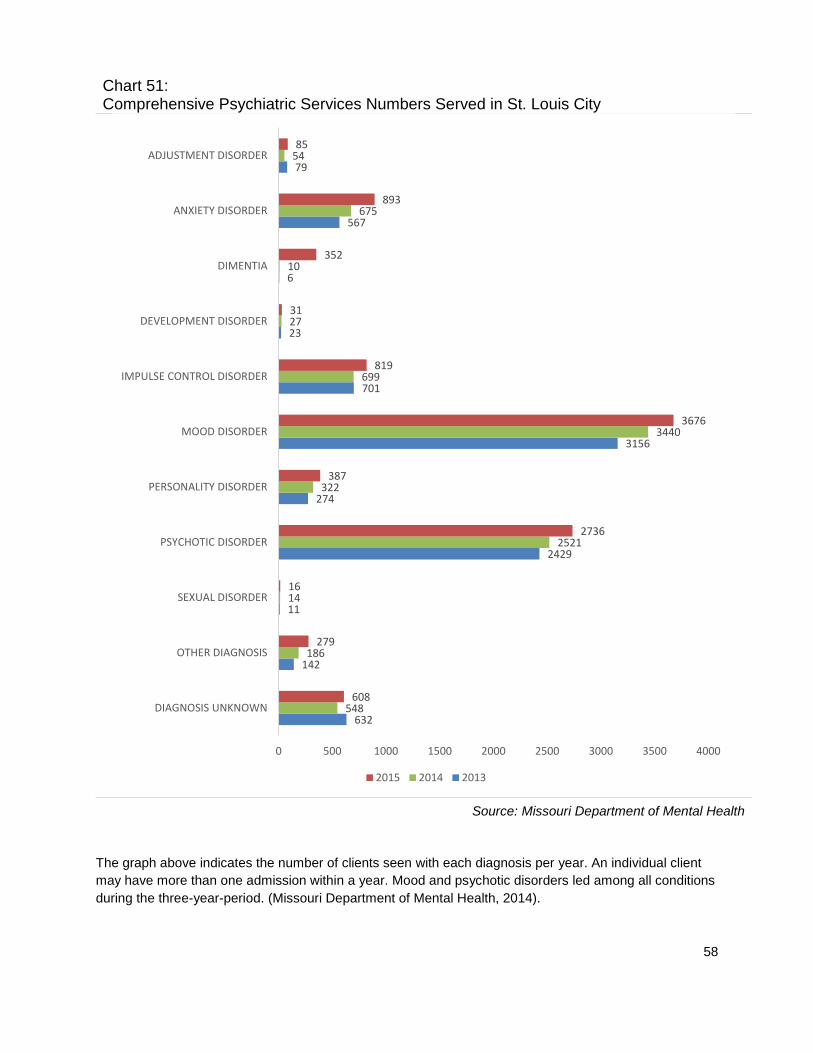
58
Chart 51: Comprehensive Psychiatric Services Numbers Served in St. Louis City
Source: Missouri Department of Mental Health
The graph above indicates the number of clients seen with each diagnosis per year. An individual client
may have more than one admission within a year. Mood and psychotic disorders led among all conditions
during the three-year-period. (Missouri Department of Mental Health, 2014).
632
142
11
2429
274
3156
701
23
6
567
79
548
186
14
2521
322
3440
699
27
10
675
54
608
279
16
2736
387
3676
819
31
352
893
85
0 500 1000 1500 2000 2500 3000 3500 4000
DIAGNOSIS UNKNOWN
OTHER DIAGNOSIS
SEXUAL DISORDER
PSYCHOTIC DISORDER
PERSONALITY DISORDER
MOOD DISORDER
IMPULSE CONTROL DISORDER
DEVELOPMENT DISORDER
DIMENTIA
ANXIETY DISORDER
ADJUSTMENT DISORDER
2015 2014 2013
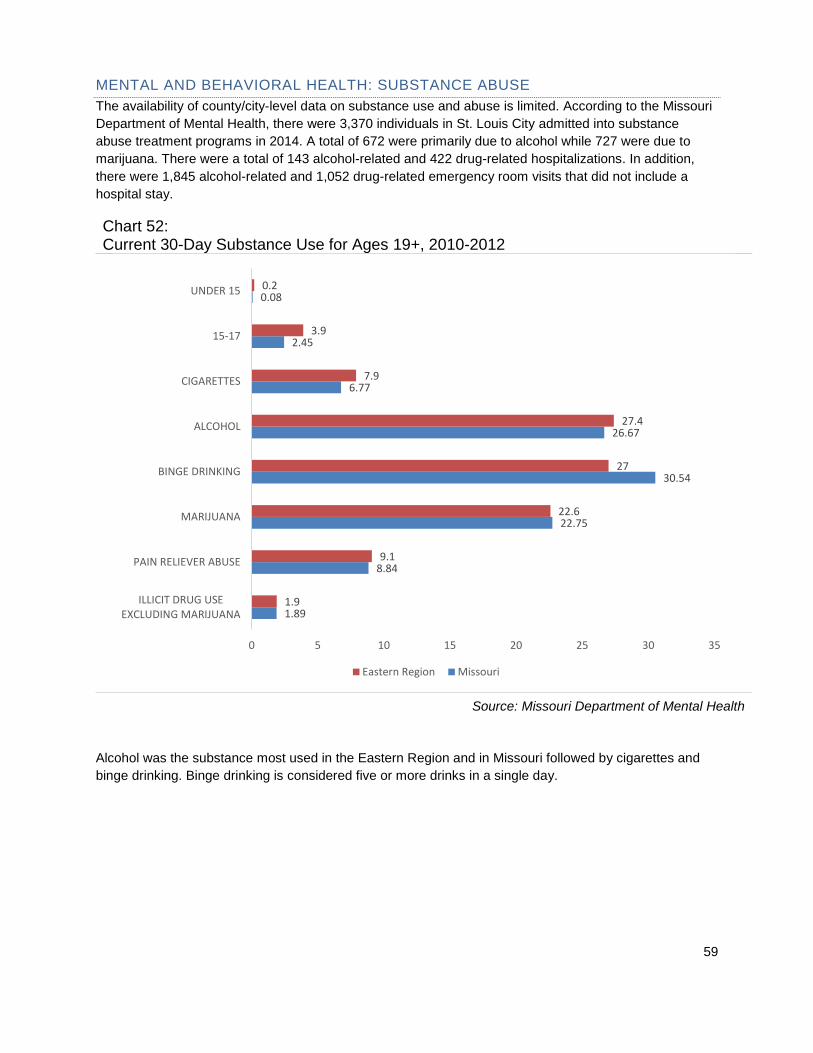
59
MENTAL AND BEHAVIORAL HEALTH: SUBSTANCE ABUSE
The availability of county/city-level data on substance use and abuse is limited. According to the Missouri
Department of Mental Health, there were 3,370 individuals in St. Louis City admitted into substance
abuse treatment programs in 2014. A total of 672 were primarily due to alcohol while 727 were due to
marijuana. There were a total of 143 alcohol-related and 422 drug-related hospitalizations. In addition,
there were 1,845 alcohol-related and 1,052 drug-related emergency room visits that did not include a
hospital stay.
Chart 52: Current 30-Day Substance Use for Ages 19+, 2010-2012
Source: Missouri Department of Mental Health
Alcohol was the substance most used in the Eastern Region and in Missouri followed by cigarettes and
binge drinking. Binge drinking is considered five or more drinks in a single day.
1.89
8.84
22.75
30.54
26.67
6.77
2.45
0.08
1.9
9.1
22.6
27
27.4
7.9
3.9
0.2
0 5 10 15 20 25 30 35
ILLICIT DRUG USEEXCLUDING MARIJUANA
PAIN RELIEVER ABUSE
MARIJUANA
BINGE DRINKING
ALCOHOL
CIGARETTES
15-17
UNDER 15
Eastern Region Missouri

60
Chart 53: Primary Drug Problem in St. Louis City Substance Abuse Treatment Programs Per Total Individuals: Time Series
Source: Missouri Department of Mental Health
The graph above shows that heroin was the drug of choice among individuals admitted to substance
abuse treatment programs in the city for the past three years. From 2012 to 2014, heroin treatment use
among those admitted increased 17.1 percent.
In 2012, the average age for first-time drug use was 20.6 years; 20.5 years in 2013 and 21.1 years in
2014. (Missouri Department of Mental Health).
8
6
17
111
1220
46
376
695
684
10
10
32
114
1338
62
403
727
672
8
15
26
130
1436
93
358
699
691
0 200 400 600 800 1000 1200 1400 1600
OTHER MEDICATION/ILLICIT DRUG
TRANQUILIZER
PCP/LSD/OTHERHALLUCINOGEN
ANALGESIC EXCEPTHEROIN
HEROIN
STIMULANT TOTAL
COCAINE TOTAL
MARIJUANA/HASHISH
ALCOHOL
2015 2014 2013
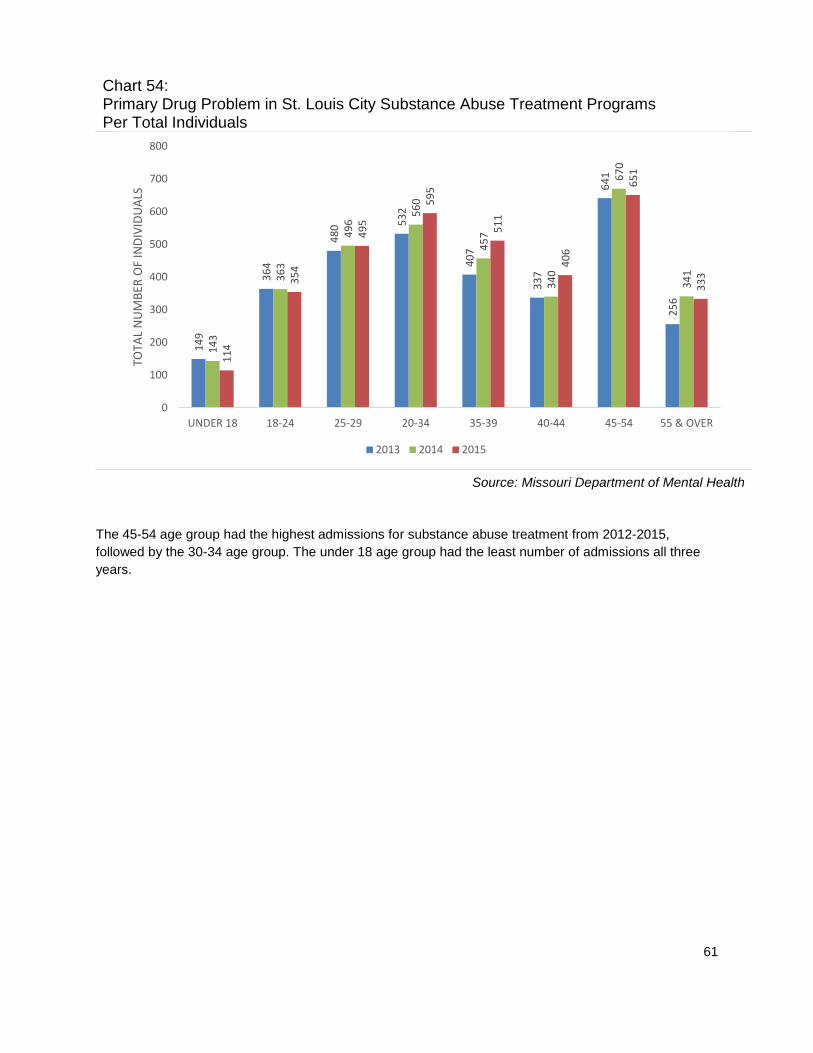
61
Chart 54: Primary Drug Problem in St. Louis City Substance Abuse Treatment Programs Per Total Individuals
Source: Missouri Department of Mental Health
The 45-54 age group had the highest admissions for substance abuse treatment from 2012-2015,
followed by the 30-34 age group. The under 18 age group had the least number of admissions all three
years.
14
9
36
4
48
0 53
2
40
7
33
7
64
1
25
6
14
3
36
3
49
6
56
0
45
7
34
0
67
0
34
1
11
4
35
4
49
5
59
5
51
1
40
6
65
1
33
3
0
100
200
300
400
500
600
700
800
UNDER 18 18-24 25-29 20-34 35-39 40-44 45-54 55 & OVER
TOTA
L N
UM
BER
OF
IND
IVID
UA
LS
2013 2014 2015

62
Chart 55: Total Number of Individuals Who Attended Substance Abuse Treatment Programs by Education Level: Time Series
Source: Missouri Department of Mental Health
Individuals with a bachelor or advanced degree had the lowest number of individuals in substance abuse
treatment followed by those with an associate degree or some college.
13
31
12
83
53
1
21
14
33
13
62
55
5
20
14
91
14
91
54
2
24
0
200
400
600
800
1000
1200
1400
1600
LESS THANHIGH SCHOOL
HIGH SCHOOLGRADUATE OR G.E.D.
ASSOCIATE DEGREEOR SOME COLLEGE
BACHELOR ORADVANCED DEGREE
TOTA
L N
UM
BER
OF
IND
IVID
UA
LS
2013 2014 2015
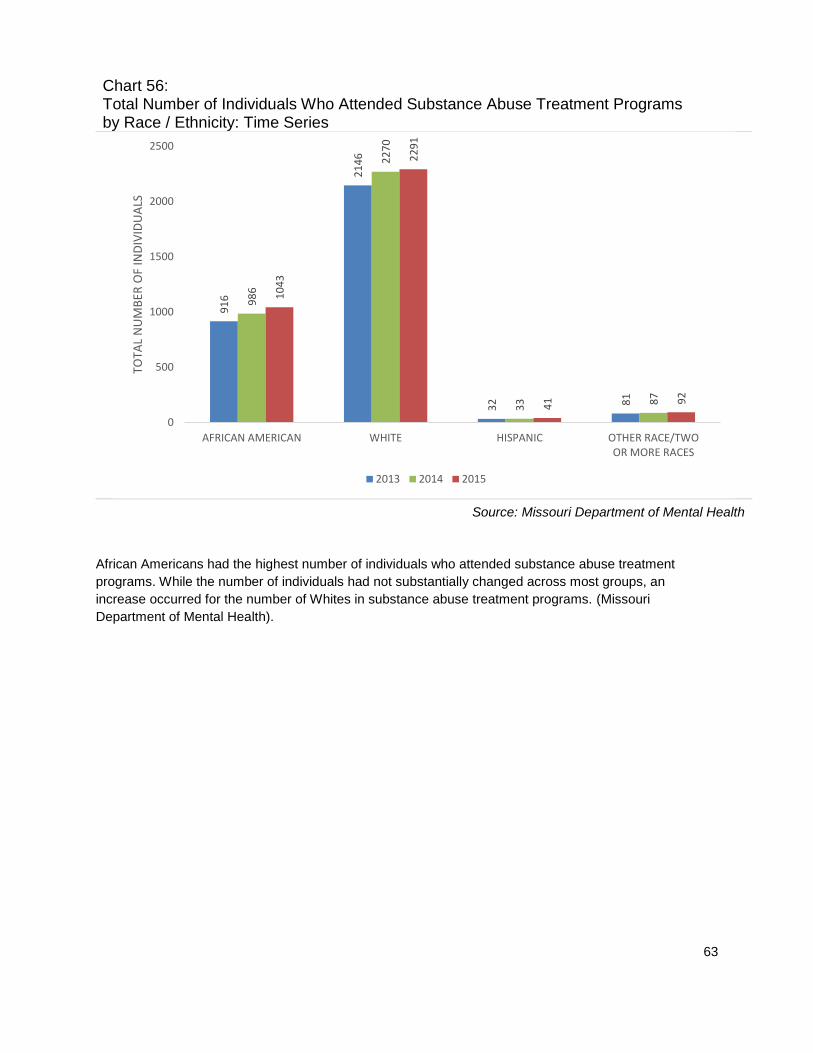
63
Chart 56: Total Number of Individuals Who Attended Substance Abuse Treatment Programs by Race / Ethnicity: Time Series
Source: Missouri Department of Mental Health
African Americans had the highest number of individuals who attended substance abuse treatment
programs. While the number of individuals had not substantially changed across most groups, an
increase occurred for the number of Whites in substance abuse treatment programs. (Missouri
Department of Mental Health).
91
6
21
46
32 81
98
6
22
70
33 8
7
10
43
22
91
41 9
2
0
500
1000
1500
2000
2500
AFRICAN AMERICAN WHITE HISPANIC OTHER RACE/TWOOR MORE RACES
TOTA
L N
UM
BER
OF
IND
IVID
UA
LS
2013 2014 2015

64
PUBLIC SAFETY: VIOLENCE
A violent crime is a crime in which the offender uses or threatens to use violent force upon the victim.
Violence negatively impacts communities by reducing productivity, decreasing property values, and
disrupting social services. (Healthy Communities Institute).
Chart 57: Age-Adjusted Death Rate Due to Assault Injury, 2003-2013
Source: Missouri Department of Health and Senior Services
The age-adjusted death rate due to assault injury in St. Louis City was four times higher than the rate in
the state. The death rate due to firearms was nearly four and one-half times higher in the city than the
state.
1.2
0.1
0.1
5.1
0.06
7.2
3
0.2
0.1
23.3
2.2
28.8
0 5 10 15 20 25 30 35
OTHER ASSAULTINJURIES
BLUNT OBJECT
CHILD ABUSE
FIREARMS
CUT-PIERCE
TOTAL ASSAULTINJURIES
St. Louis City Missouri
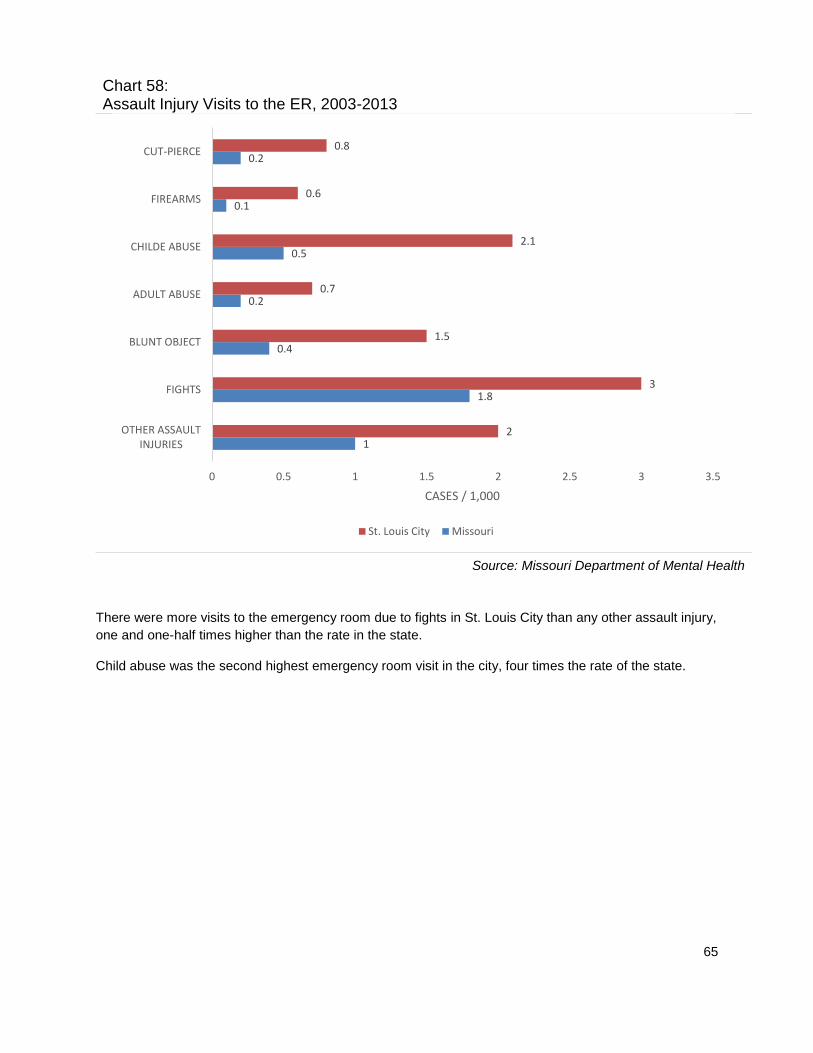
65
Chart 58: Assault Injury Visits to the ER, 2003-2013
Source: Missouri Department of Mental Health
There were more visits to the emergency room due to fights in St. Louis City than any other assault injury,
one and one-half times higher than the rate in the state.
Child abuse was the second highest emergency room visit in the city, four times the rate of the state.
1
1.8
0.4
0.2
0.5
0.1
0.2
2
3
1.5
0.7
2.1
0.6
0.8
0 0.5 1 1.5 2 2.5 3 3.5
OTHER ASSAULTINJURIES
FIGHTS
BLUNT OBJECT
ADULT ABUSE
CHILDE ABUSE
FIREARMS
CUT-PIERCE
CASES / 1,000
St. Louis City Missouri

66
Chart 59: Assault Injury Hospitalizations, 2003-2013
Source: Missouri Department of Mental Health
Hospitalization rate due to firearms in the city was more than five times the rate of hospitalization in the
state. Child abuse was the second highest rate in the city, two and one-half times the rate in the state.
0.5
0.6
0.4
0.1
0.8
0.8
0.5
1.6
1.3
1.2
0.1
2.1
4.2
1.7
0 0.5 1 1.5 2 2.5 3 3.5 4 4.5
OTHER ASSAULTINJURIES
FIGHTS
BLUNT OBJECT
ADULT ABUSE
CHILDE ABUSE
FIREARMS
CUT-PIERCE
CASES / 1,000
St. Louis City Missouri

67
Table 10: Assault Injury & Firearm, St. Louis City vs. Missouri Three-Year Moving Average Rates
Health Indicators 2009-2011 2010-2012 2011-2013
Assault Injury St. Louis
City Missouri
St. Louis City
Missouri St. Louis
City Missouri
Deaths / 100,000 population 257.21 200.75 247.12 196.22 235.88 194.11
Hospitalizations / 10,000 population 176.39 151.84 172.90 142.91 170.34 136.57
ER visits / 1,000 population 13.68 13.06 14.10 13.07 14.84 13.63
Firearm
Deaths / 100,000 population 166.54 132.55 158.66 128.05 147.17 122.38
Hospitalizations / 10,000 population 45.49 55.14 42.60 49.38 39.90 45.21
ER visits / 1,000 population 0.33 0.84 0.34 0.73 0.32 0.67
Source: Missouri Department of Health and Senior Services
Based on the three-year moving assault injury average rates from 2009-2013, a slight decline occurred in
the total number of assault deaths, injury hospitalizations and ER Visits, firearm deaths and firearm
hospitalizations in the city as well as in the state. An increase occurred in firearm ER Visits in St. Louis
City.
Table 11: Assault Injury & Firearm by Race/Ethnicity, St. Louis City vs. Missouri 2003-2013
Health Topics St. Louis City Missouri
Assault Injury White African
American White
African American
Deaths / 100,000 population 6.13 53.21 3.29 32.63
Hospitalizations / 10,000 population 3.35 17.60 1.62 10.80
ER visits / 1,000 population 3.89 13.59 2.93 9.78
Firearm
Deaths / 100,000 population 3.24 45.16 1.79 26.53
Hospitalizations / 10,000 population 0.35 8.06 0.15 4.65
ER visits / 1,000 population 0.06 1.10 0.02 0.59
Source: Missouri Department of Health and Senior Services
The total number of assault injury deaths among African Americans was more than 8 times the rate of
Whites in the city and 16 times the rate of Whites in the state. Death due to firearms among African
Americans in the city was nearly 14 times the rate of death among Whites in the city and just over 25
times the rate of death of Whites in the state.

68
REPRODUCTIVE & SEXUAL HEALTH
The Centers for Disease Control and Prevention (CDC) estimates that there are approximately 20 million
new STD infections each year—almost half of them among young people ages 15 to 24. The cost of
STDs to the U.S. health care system is estimated to be as much as $16 billion annually. Because many
cases of STDs go undiagnosed—and some common viral infections, such as human papillomavirus
(HPV) and genital herpes, are not reported to the CDC at all—the reported cases of chlamydia,
gonorrhea, and syphilis represent only a fraction of the true burden of STDs in the U.S.
Untreated STDs can lead to serious long-term health consequences, especially for adolescent girls and
young women. The CDC estimates that undiagnosed and untreated STDs cause at least 24,000 women
in the U.S. each year to become infertile. (Healthy People 2020).
Chart 60: Infectious Diseases Incidence: Time Series
Source: Missouri Department of Mental Health
While there has been a decline in the rate of incidence/cases of Hepatitis C from 2011-2013, Hepatitis C
had the highest rate of incidence/cases in St. Louis City when compared to HIV/AIDS and Hepatitis B
over the three years.
12
2
53
82
3
12
7
68
78
0
11
3
73
77
4
0
100
200
300
400
500
600
700
800
900
HIV/AIDS HEPATITIS B(CHRONIC, ACUTE & PRENATAL)
HEPATITIS C(CHRONIC & ACUTE)
TOTA
L C
ASE
S
2011 2012 2013
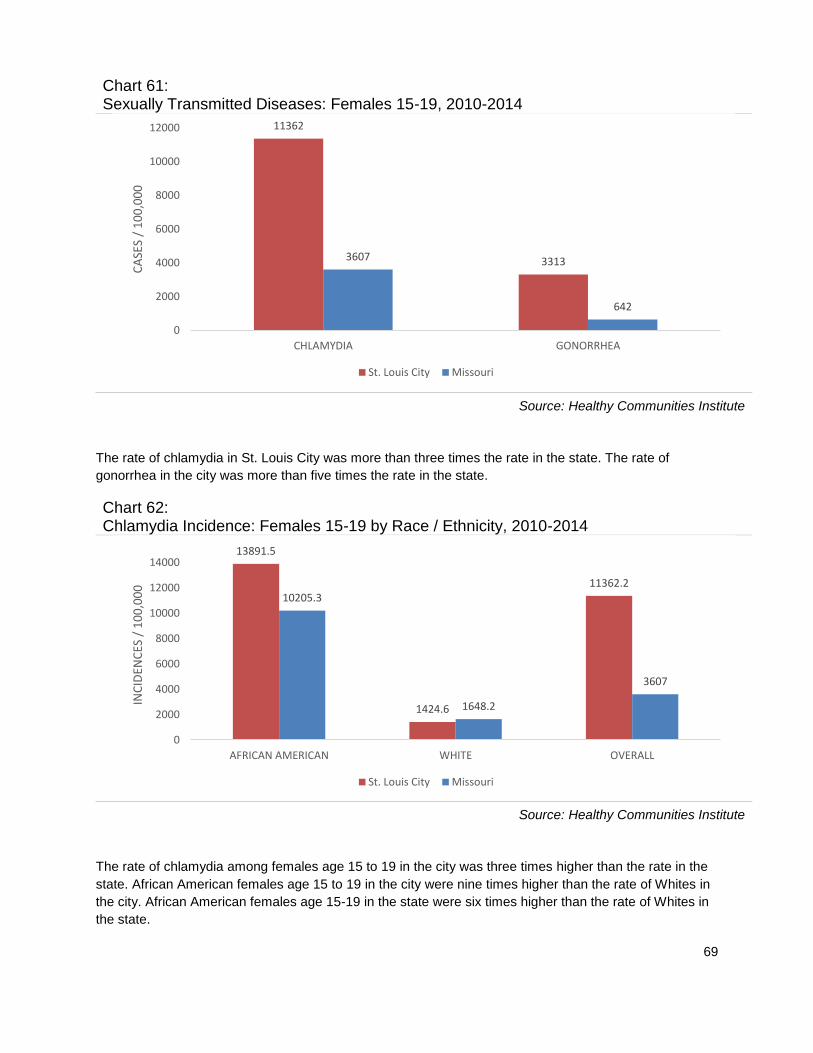
69
Chart 61: Sexually Transmitted Diseases: Females 15-19, 2010-2014
Source: Healthy Communities Institute
The rate of chlamydia in St. Louis City was more than three times the rate in the state. The rate of
gonorrhea in the city was more than five times the rate in the state.
Chart 62: Chlamydia Incidence: Females 15-19 by Race / Ethnicity, 2010-2014
Source: Healthy Communities Institute
The rate of chlamydia among females age 15 to 19 in the city was three times higher than the rate in the
state. African American females age 15 to 19 in the city were nine times higher than the rate of Whites in
the city. African American females age 15-19 in the state were six times higher than the rate of Whites in
the state.
11362
33133607
642
0
2000
4000
6000
8000
10000
12000
CHLAMYDIA GONORRHEA
CA
SES
/ 1
00
,00
0
St. Louis City Missouri
13891.5
1424.6
11362.210205.3
1648.2
3607
0
2000
4000
6000
8000
10000
12000
14000
AFRICAN AMERICAN WHITE OVERALL
INC
IDEN
CES
/ 1
00
,00
0
St. Louis City Missouri
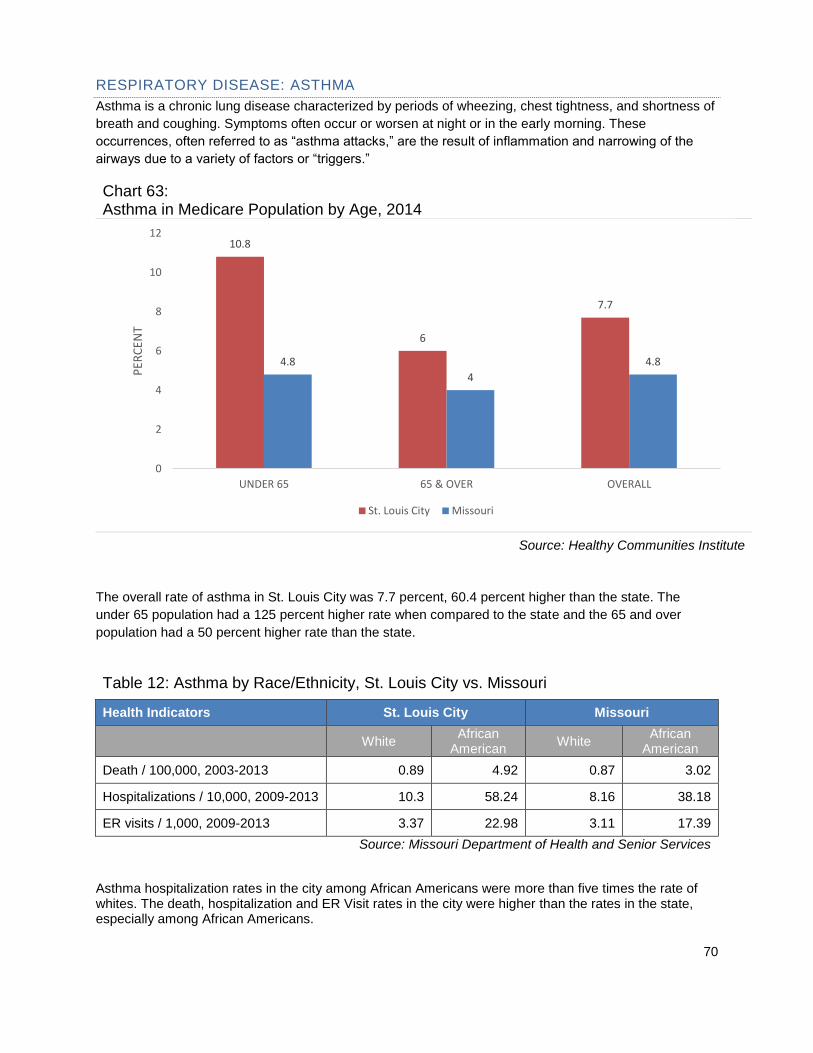
70
RESPIRATORY DISEASE: ASTHMA
Asthma is a chronic lung disease characterized by periods of wheezing, chest tightness, and shortness of
breath and coughing. Symptoms often occur or worsen at night or in the early morning. These
occurrences, often referred to as “asthma attacks,” are the result of inflammation and narrowing of the
airways due to a variety of factors or “triggers.”
Chart 63: Asthma in Medicare Population by Age, 2014
Source: Healthy Communities Institute
The overall rate of asthma in St. Louis City was 7.7 percent, 60.4 percent higher than the state. The
under 65 population had a 125 percent higher rate when compared to the state and the 65 and over
population had a 50 percent higher rate than the state.
Table 12: Asthma by Race/Ethnicity, St. Louis City vs. Missouri
Health Indicators St. Louis City Missouri
White African
American White
African American
Death / 100,000, 2003-2013 0.89 4.92 0.87 3.02
Hospitalizations / 10,000, 2009-2013 10.3 58.24 8.16 38.18
ER visits / 1,000, 2009-2013 3.37 22.98 3.11 17.39
Source: Missouri Department of Health and Senior Services
Asthma hospitalization rates in the city among African Americans were more than five times the rate of whites. The death, hospitalization and ER Visit rates in the city were higher than the rates in the state, especially among African Americans.
10.8
6
7.7
4.8
4
4.8
0
2
4
6
8
10
12
UNDER 65 65 & OVER OVERALL
PER
CEN
T
St. Louis City Missouri

71
Table 13: Asthma, St. Louis City vs. Missouri; Three-Year Moving Average Rates
Health Indicators 2009-2011 2010-2012 2011-2013
St. Louis
City Missouri
St. Louis City
Missouri St. Louis
City Missouri
Asthma death / 100,000 population
2.62 1.08 2.08 1.03 2.22 0.9
Asthma hospitalizations / 10,000 population
35.77 13.38 37.54 13.5 38.72 13.64
Asthma ER visits / 1,000 population
13.91 5.15 14.06 5.2 14.31 5.22
Source: Missouri Department of Health and Senior Services
The asthma death rate in St. Louis City declined from the period ending 2011 to 2012, but increased in
the period ending in 2013. The death rate in Missouri decreased over the three-year-period. The
hospitalization and ER Visit rates in the city and the state increased over the three-year-period.
Table 14: Asthma Rates, St. Louis City vs. Missouri
Health Indicators St. Louis City Missouri
Asthma deaths, 2003-2013 2.90 1.11
Asthma hospitalizations, 2009-2013 36.20 12.45
Asthma ER visits, 2009-2013 14.50 5.32
Source: Missouri Department of Health and Senior Services
Among asthma health indicators, St. Louis City had higher rates than Missouri. Asthma hospitalizations in
St. Louis City were nearly three times the rate in the state and asthma ER Visits were more than double
the rate in Missouri.

72
Chart 64: Adults with Current Asthma by Race / Ethnicity, 2011
Source: Healthy Communities Institute
The rate of adults with asthma in the city in 2011 was 11.7 percent, 15.8 percent higher than the rate in
Missouri, and 10.1 percent, as noted in table 9 below. The rate of African American is twice the rate of
White, Non-Hispanic and higher than the overall rate.
Table 15: Respiratory Disease Rates, St. Louis City vs. Missouri
Health Indicators St. Louis City Missouri
Adults with current asthma, percent, 2011 11.7 10.1
Age-adjusted death rate due to chronic lower respiratory disease / 100,000 population, 2010-2014
45.5 51.7
Asthma: Medicare population, percent, 2014 7.7 4.8
COPD: Medicare population, percent, 2014 11.9 13.2
Source: Missouri Department of Health and Senior Services
St. Louis City had higher rates than the state in the Medicare population including adults with asthma,
asthma in the Medicare population and COPD. St. Louis City had a 12.0 percent lower rate than the state
for age-adjusted death rate due to Chronic Lower Respiratory Disease.
15.3
7.6
11.7
0
2
4
6
8
10
12
14
16
18
20
AFRICAN AMERICAN WHITE, NON-HISPANIC OVERALL
PER
CEN
T

73
SECONDARY DATA SUMMARY
The collection of secondary data presented on the preceding pages revealed a number of findings:
The overall rate of adults in St. Louis City with health insurance in 2014 was 80.3 percent, 4.3
percent lower than Missouri.
St. Louis City had three times the number of households without a vehicle when compared to the
state.
The overall rate of asthma in St. Louis City was 7.7 percent, 60.4 percent higher than the state.
The under 65 population had a 125 percent higher rate when compared to the state and the 65
and over population had a 50 percent higher rate than the state.
Between the period ending 2007 and the period ending 2012, the incidence rate from cancer
increased 10.5 percent in the city. The incidence rate of all cancer was 6.7 percent higher in the
city than in the state.
Even though the death rate due to cancer by both genders was higher in the city than in the state
and in the country, the death rate due to cancer among females was lower in the city than the
rate in the state and in the country. Males had a 76 percent higher death rate in the city when
compared to the state and an 89 percent higher death rate when compared to the country.
The age-adjusted death rate due to heart disease in St. Louis City was 23.5 percent higher than
the rate in the state.
The age-adjusted death rate due to stroke in the city was 11.7 percent higher when compared to
the state.
The age-adjusted death rate of adults due to diabetes in the city was 57.4 percent higher than the
state. The rate of females in the county was 55.8 percent higher than the rate of females in the
state. The rate of males in the state was 37.0 percent higher than the rate of males in the county.
The overall rate of babies with low birth weight for both genders in St. Louis City was 12.3
percent, 50 percent higher than Missouri The rate of babies with very low birth weight in St. Louis
City was nearly nine times higher than Missouri. Missouri.
The rate of chlamydia in St. Louis City was more than three times the rate in the state. The rate of
chlamydia among females age 15 to 19 in the city was three times higher than the rate in the
state. The rate of gonorrhea in the city was more than five times the rate in the state.
Heroin was the drug of choice among individuals admitted to substance abuse treatment
programs in the city for the past three years. From 2012 to 2014, heroin treatment use among
those admitted increased 17.1 percent.
There were more visits to the emergency room due to fights in St. Louis City than any other
assault injury, one and one-half times higher than the rate in the state.
Child abuse was the second highest emergency room visit in the city, four times the rate of the
state.
Hospitalization rate due to firearms in the city was more than five times the rate of hospitalization
in the state. Child abuse was the second highest rate in the city, two and one-half times the rate
in the state.
The age-adjusted death rate due to assault injury in St. Louis City was four times higher than the
rate in the state. The death rate due to firearms was nearly four and one-half times higher in the
city than the state.
74
INTERNAL WORK GROUP MEETINGS
Barnes-Jewish Hospital chose 18 employees to participate on an internal CHNA work group representing
various hospital departments including Ambulatory Services, Case Management and Social Work, Center
for Diversity and Cultural Competence, Emergency Services, Hospitality Services, Marketing and
Communications, Outpatient Clinics, Patient Access, Pharmacy, Siteman Cancer Center, and
Washington University School of Medicine (See Appendix D for Internal Work Group List).
The CHNA internal work group met three times to analyze the primary and secondary data, to complete
the priority ranking for the hospital’s CHNA and to determine the community’s most critical needs.
Members reviewed data provided by the external focus group as well as information collected through the
secondary data analyses.
MEETING 1
The work group first met as a team on Dec. 1, 2015 to review the purpose for the CHNA, role of the work
group and goals for the project. The team reviewed the key findings from the 2013 report and the current
findings from the 2015 focus group. The 2015 focus group perceptions were then reviewed and
discussed.
After the discussion, the team was asked to complete a worksheet (Appendix E) to prioritize the 28 health
needs identified by the focus group. The following table includes the results of this initial ranking in rank
order.

75
Table 16: Barnes-Jewish Hospital CHNA Internal Work Group: Ranking of health needs identified by focus group
Rank Health Need Total Score
1. Access: Coverage 66
2. Access: Services 67
3. Health Literacy 82
4. Mental & Behavioral Health 97
5. Obesity 123
6. Diabetes 132
7. Heart Disease & Stroke: Heart Health 141
8. Nutrition 149
9. Respiratory Disease: Asthma 151
10. Access: Transportation 153
11. Substance Abuse 171
12. Heart Disease & Stroke: Stroke 172
13. Childbirth & Breastfeeding Education 178
14. Public Safety: Violence 182
15. Heart Disease & Stroke: CHF 186
16. Reproductive & Sexual Health 189
17. Smoking & Tobacco Education 192
18. Immunizations & Infectious Disease 211
19. Public Safety: Fatal Injuries 212
20. Respiratory Disease: COPD 215
21. Cancer: Breast 238
22. Cancer: Colon & Rectal 255
23. Oral Health 256
24. Cancer: GYN 275
25. Cancer: Prostate 279
26. Cancer: Lung 288
27. Cancer: Head & Neck 300
28. Cancer: Skin 319
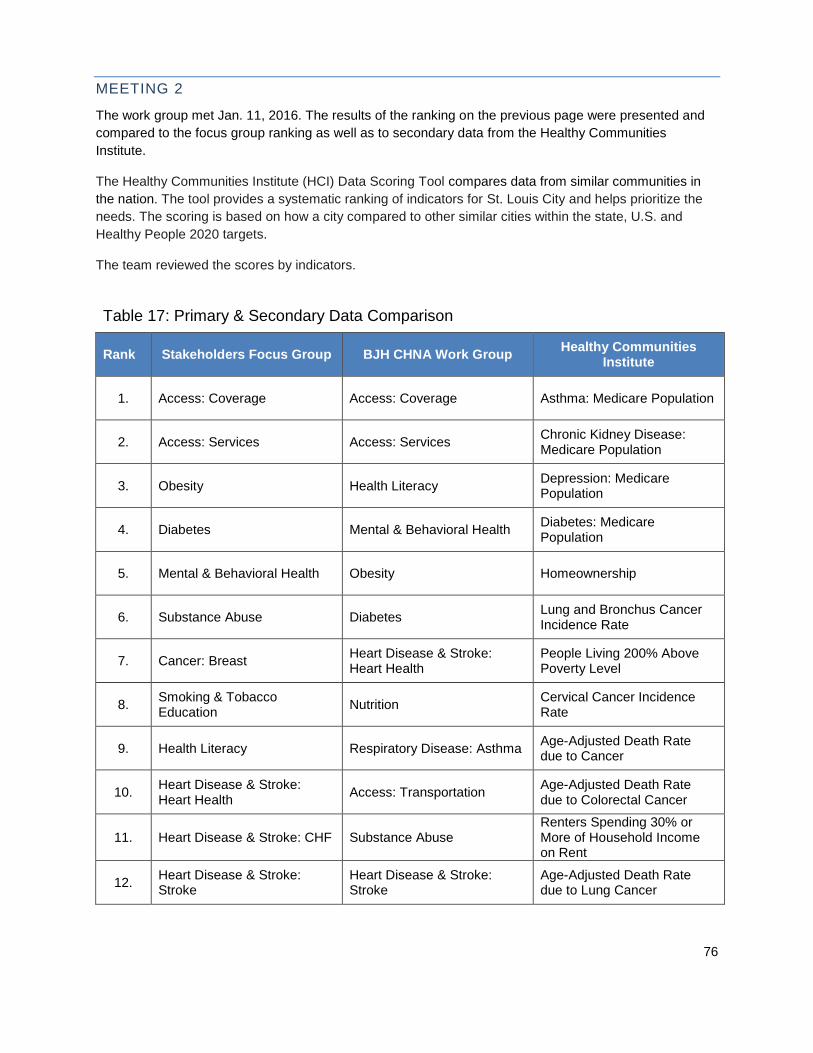
76
MEETING 2
The work group met Jan. 11, 2016. The results of the ranking on the previous page were presented and
compared to the focus group ranking as well as to secondary data from the Healthy Communities
Institute.
The Healthy Communities Institute (HCI) Data Scoring Tool compares data from similar communities in
the nation. The tool provides a systematic ranking of indicators for St. Louis City and helps prioritize the
needs. The scoring is based on how a city compared to other similar cities within the state, U.S. and
Healthy People 2020 targets.
The team reviewed the scores by indicators.
Table 17: Primary & Secondary Data Comparison
Rank Stakeholders Focus Group BJH CHNA Work Group Healthy Communities
Institute
1. Access: Coverage Access: Coverage Asthma: Medicare Population
2. Access: Services Access: Services Chronic Kidney Disease: Medicare Population
3. Obesity Health Literacy Depression: Medicare Population
4. Diabetes Mental & Behavioral Health Diabetes: Medicare Population
5. Mental & Behavioral Health Obesity Homeownership
6. Substance Abuse Diabetes Lung and Bronchus Cancer Incidence Rate
7. Cancer: Breast Heart Disease & Stroke: Heart Health
People Living 200% Above Poverty Level
8. Smoking & Tobacco Education
Nutrition Cervical Cancer Incidence Rate
9. Health Literacy Respiratory Disease: Asthma Age-Adjusted Death Rate due to Cancer
10. Heart Disease & Stroke: Heart Health
Access: Transportation Age-Adjusted Death Rate due to Colorectal Cancer
11. Heart Disease & Stroke: CHF Substance Abuse Renters Spending 30% or More of Household Income on Rent
12. Heart Disease & Stroke: Stroke
Heart Disease & Stroke: Stroke
Age-Adjusted Death Rate due to Lung Cancer

77
Rank Stakeholders Focus Group BJH CHNA Work Group Healthy Communities
Institute
13. Cancer: Colon & Rectal Childbirth & Breastfeeding Education
Children Living Below Poverty Level
14. Cancer: Prostate Public Safety: Violence Families Living Below Poverty Level
15. Access: Transportation Heart Disease & Stroke: CHF Households with Cash Public Assistance Income
16. Public Safety: Violence Reproductive & Sexual Health
Households without a Vehicle
17. Reproductive & Sexual Health
Smoking & Tobacco Education
People 65+ Living Alone
18. Nutrition Immunizations & Infectious Disease
People Living Below Poverty Level
19. Cancer: GYN Public Safety: Fatal Injuries Young Children Living Below Poverty Level
20. Respiratory Disease: Asthma Respiratory Disease: COPD Adults who Drink Excessively
21. Cancer: Head & Neck Cancer: Breast Age-Adjusted Death Rate due to Breast Cancer
22. Cancer: Skin Cancer: Colon & Rectal Babies with Very Low Birth Weight
23. Immunizations & Infectious Disease
Oral Health Colorectal Cancer Incidence Rate
24. Oral Health Cancer: GYN Food Insecurity Rate
25. Public Safety: Fatal Injuries Cancer: Prostate High School Graduation
26. Cancer: Lung Cancer: Lung Heart Failure: Medicare Population
27. Respiratory Disease: COPD Cancer: Head & Neck Median Household Income
28. Childbirth & Breastfeeding Education
Cancer: Skin People 65+ Living Below Poverty Level
Through discussion and group consensus, the team narrowed the list of health needs from 28 to 12. In
addition to using secondary data, the team made their decision based on their expertise in the field and
their experiences in the hospital. The following table lists the 12 health needs and corresponding
indicators.

78
Table 18: Barnes-Jewish Hospital CHNA Internal Work Group: Top 12 community healthy needs based on ranking and considerations
Health Need Indicators
Access: Coverage Insurance coverage and ability to pay
Access: Services Availability of primary care physicians, specialty care, clinics, mental health services, etc.
Access: Transportation Access to transportation, including owned and public
Cancer Breast, colorectal, prostate, gynecological (GYN), head & neck, skin and lung
Healthy Lifestyles
Adults who are overweight, adults who are obese, adults 20+ who are sedentary, adult fruit and vegetable consumption, food insecurity rate, physical inactivity, access to exercise opportunities, food environment index
Health Literacy Education level, English proficiency, language spoken at home
Maternal & Child Health Birth weight, infant mortality, prenatal care, childbirth and breastfeeding education
Mental & Behavioral Health: Mental Illness
Suicide, depression and other mental health issues and disorders
Public Safety: Violence Violence and violence prevention
Reproductive & Sexual Health HIV, Syphilis, Gonorrhea, Chlamydia, birth control
Respiratory Disease: Asthma Asthma and contributing risk factors including smoking, environmental risk factors, etc.
Mental & Behavioral Health: Substance Abuse
Adults who drink excessively, adults who smoke, death rate due to drug poisoning, etc.
After consensus, the work group members were asked to complete a second worksheet (Appendix F) to
determine the ranking of these top 12 needs. The criteria (below) for prioritizing the needs was agreed
upon by the Barnes-Jewish Hospital internal team.
How many people are affected by the problem?
What are the consequences of not addressing the problem?
Are existing programs addressing the issue?
How important is the problem to community members?
How does this problem affect vulnerable populations?
For each health need, each of these criteria was given a rank from 1-5 and a weight of importance from
1-3. Based on the total scores, the following rank was given to the top 12 needs.
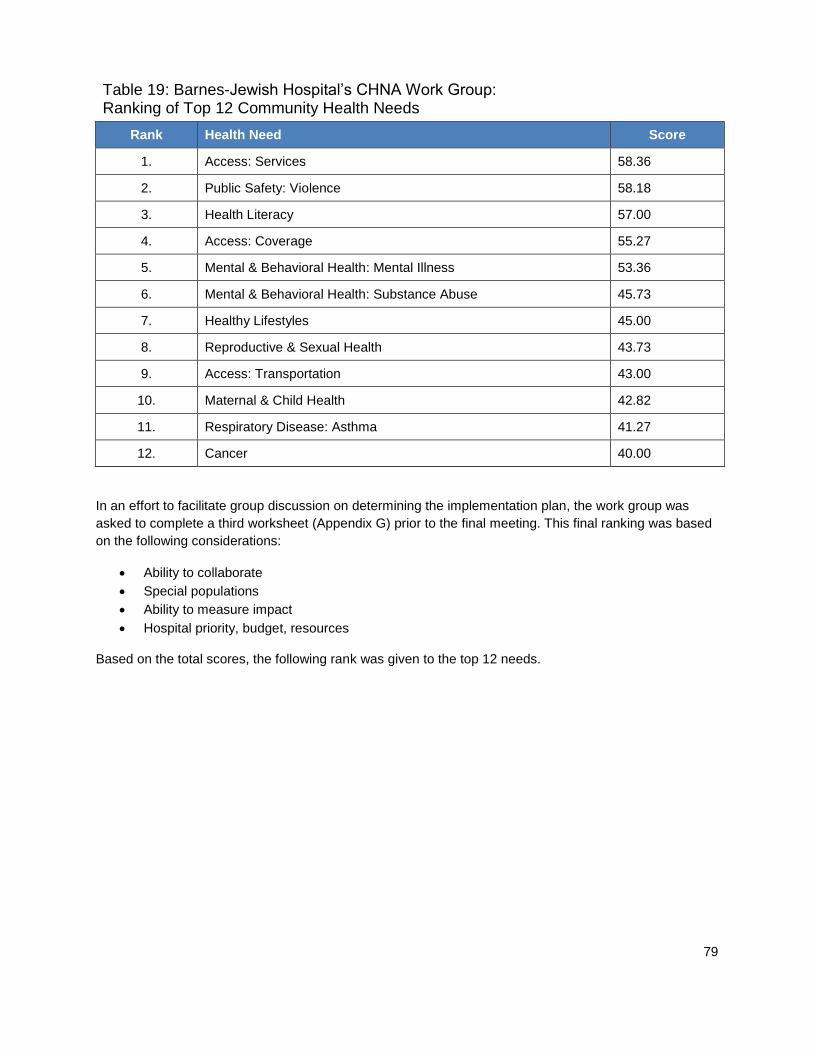
79
Table 19: Barnes-Jewish Hospital’s CHNA Work Group: Ranking of Top 12 Community Health Needs
Rank Health Need Score
1. Access: Services 58.36
2. Public Safety: Violence 58.18
3. Health Literacy 57.00
4. Access: Coverage 55.27
5. Mental & Behavioral Health: Mental Illness 53.36
6. Mental & Behavioral Health: Substance Abuse 45.73
7. Healthy Lifestyles 45.00
8. Reproductive & Sexual Health 43.73
9. Access: Transportation 43.00
10. Maternal & Child Health 42.82
11. Respiratory Disease: Asthma 41.27
12. Cancer 40.00
In an effort to facilitate group discussion on determining the implementation plan, the work group was
asked to complete a third worksheet (Appendix G) prior to the final meeting. This final ranking was based
on the following considerations:
Ability to collaborate
Special populations
Ability to measure impact
Hospital priority, budget, resources
Based on the total scores, the following rank was given to the top 12 needs.
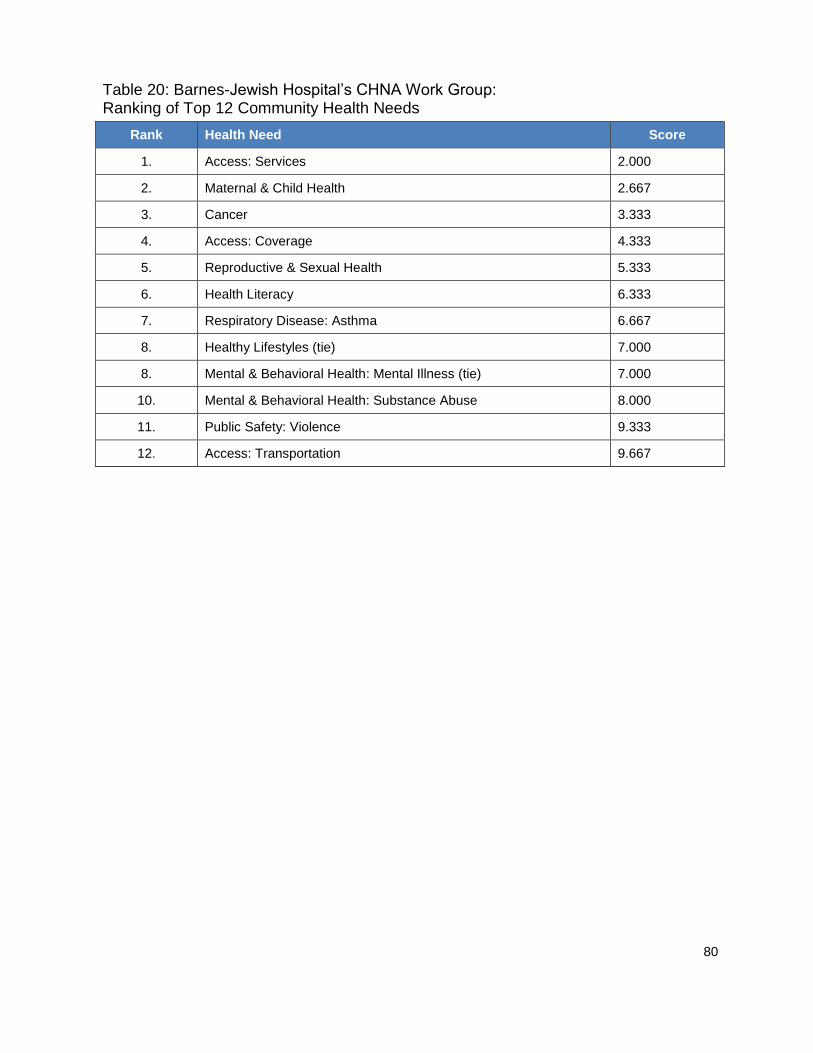
80
Table 20: Barnes-Jewish Hospital’s CHNA Work Group: Ranking of Top 12 Community Health Needs
Rank Health Need Score
1. Access: Services 2.000
2. Maternal & Child Health 2.667
3. Cancer 3.333
4. Access: Coverage 4.333
5. Reproductive & Sexual Health 5.333
6. Health Literacy 6.333
7. Respiratory Disease: Asthma 6.667
8. Healthy Lifestyles (tie) 7.000
8. Mental & Behavioral Health: Mental Illness (tie) 7.000
10. Mental & Behavioral Health: Substance Abuse 8.000
11. Public Safety: Violence 9.333
12. Access: Transportation 9.667

81
MEETING 3
The internal work group’s final meeting took place on Jan. 21, 2016. The final ranking of the top 11 needs
was presented. The internal work group engaged in conversation around each area of need. While the
group recognized the great need to address all areas of need, focusing on a select few would allow for
greater impact. The following key points helped determine the needs which will be addressed.
Access: Services – While the group recognized the great need around mental health, the availability of
services was determined the most important and immediate issue. Therefore, this issue will be included in
access to services.
Healthy Lifestyles – The activities to address healthy lifestyles are similar to activities to address many
health conditions, such as heart and vascular diseases, lung diseases, cancer prevention, etc. Therefore,
because the impact of such programs will directly improve the health of the community, it was decided
focus will include healthy lifestyles rather than specific diseases.
Mental & Behavioral Health: Substance Abuse – Addressing substance abuse is an immediate need in
our community, so we will focus on this area in our implementation plan.
Public Safety: Violence – It is known that violence, trauma, poverty, and other adverse experiences and
chronic stressors have both short and long-term effects on the health and wellbeing of individuals. Toxic
stress contributes to regional health disparities, particularly when these same communities have trouble
accessing medical and supportive services in the aftermath of trauma. Therefore, we will address
violence in our implementation plan.
At the conclusion of the comprehensive assessment process to determine the most critical needs in St.
Louis City, the group concluded that Barnes-Jewish Hospital will focus on:
Access to Services
Healthy Lifestyles
Mental & Behavioral Health: Substance Abuse
Public Safety: Violence
82
O
APPENDICES
A. Barnes-Jewish Hospital: Who We Are B. Community Focus Group C. Focus Group Report D. Internal Work Group E. Internal Work Group: Worksheet 1 F. Internal Work Group: Worksheet 2 G. Internal Work Group: Worksheet 3

83
APPENDIX A: BARNES-JEWISH HOSPITAL: WHO WE ARE
Barnes-Jewish Hospital at Washington University Medical Center is the largest hospital in Missouri and
the largest private employer in the St. Louis region. An affiliated teaching hospital of Washington
University School of Medicine, Barnes-Jewish Hospital has a 1,800 member medical staff with many who
are recognized as "Best Doctors in America." They are supported by residents, interns and fellows, in
addition to nurses, technicians and other health-care professionals.
Recognizing its excellent nursing care, Barnes-Jewish Hospital was the first adult hospital in Missouri to
be certified as a "Magnet Hospital" by the American Nurses Credentialing Center (ANCC). The Magnet
Award is the highest honor awarded for hospital nursing by the ANCC.
Barnes-Jewish Hospital was created by the 1996 merger of Barnes Hospital and The Jewish Hospital of
St. Louis. Each hospital brought a rich tradition of excellence. Barnes Hospital opened in 1914 and
became one of the first medical teaching centers in the United States. Jewish Hospital opened in 1902 to
care for St. Louis’ growing immigrant population. Barnes-Jewish Hospital is a member of BJC HealthCare,
one of the nation’s leading health-care organizations.
Exceptional quality and unmatched experience has earned Barnes-Jewish Hospital a place on the U.S.
News & World Report honor roll of America’s Best Hospitals for 24 consecutive years, with 12 nationally
ranked medical specialties recognized in 2016.
Our patients have access to leading-edge treatments as a result of research from one of the top-ranked
medical schools in the nation. As one of the leading recipients of National Institutes of Health grant
money for medical research funding, Washington University School of Medicine and Barnes-Jewish
Hospital are proud of advancements they’ve developed through bench-to-bedside research and
treatment.
Barnes-Jewish Hospital’s care extends into the community. Our refugee health department supports new
immigrants, assisting patients in 33 different languages and dialects. Our AWARE program counsels
victims of domestic violence. The Siteman Cancer Center focuses on outreach including providing
mammograms, prostate PSA screenings and colonoscopy screening to the indigent. The hospital also
provides more than 100 community education events annually.

84
APPENDIX B: COMMUNITY FOCUS GROUP
Name Organization Attended
Focus Group Participants
Judy Bentley President, CHIPS X
Larry Bonds Patient X
Barbara Bowman Urban League of Greater St. Louis
Web Brown Missouri Foundation for Health
Colleen Burdis Paraquad X
Ariel Burgess International Institute
Marlene Davis Alderwoman, Ward 19 X
Susan DiSario Regional Health Commission X
Alan Freeman Affinia Healthcare, formerly Grace Hill Health Centers
Rob Fruend Regional Health Commission X
Kelly Hall St. Louis Area Food Bank
Joyce Hoth Gateway Region YMCA X
Dr. Jade James St. Louis County Health Department
Dr. Katherine Mathews Casa de Salud X
Michael McMillan Urban League of Greater St. Louis
Melba Moore City of St. Louis Health Commissioner X
Amanda Stoermer St. Louis Integrated Health Network X
Hospital Observers
Jennifer Arvin Communications & Marketing X
Robin Bonn Interpreter, American Sign Language X
Bob Cannon President X
Angela Chambers Market Research X
Erin Curran Center for Diversity & Cultural Competence X
Elizabeth Kalicak Community Outreach / Community Benefit X
Karley King BJC HealthCare, Community Benefit X
Susan Kraenzle Siteman Cancer Center X
Dr. John Lynch Chief Medical Officer & Vice President X
Dale Peluso Communications & Marketing X
Jacqueline Randolph Ambulatory Services X
Pat Rekart Outpatient Clinics X

85
APPENDIX C: FOCUS GROUP REPORT
PERCEPTIONS OF THE HEALTHCARE NEEDS
OF ST. LOUIS CITY RESIDENTS
FROM THE VIEWPOINT OF COMMUNITY LEADERS
Prepared by:
Angela Ferris Chambers
Manager, Market Research
BJC HealthCare
Prepared for:
Elizabeth Kalicak
Team Lead
Barnes-Jewish Hospital
May 25, 2015
Updated August 10, 2015

86
TABLE OF CONTENTS
BACKGROUND ............................................................................................. 2
RESEARCH OBJECTIVES .......................................................................... 2
METHODOLOGY.......................................................................................... 2
KEY FINDINGS ............................................................................................. 5
NEXT STEPS .................................................................................................. 8
APPENDIX A (PARTICIPANT/OBSERVER LISTS) ............................... 9

87
BACKGROUND
The Patient Protection and Affordable Care Act (PPACA, March 2010) requires that non-profit
hospitals conduct a community health needs assessment (CHNA) every three years. As part of
that process, each hospital is required to solicit input from those who represent the broad
interests of the community served by the hospital as well as those who have special knowledge
and expertise in the area of public health.
Barnes-Jewish Hospital completed its first needs assessment in December 2013, implementing a
plan to address those prioritized needs between January 1, 2014 and December 31, 2016. It is
now in the process of preparing the next needs assessment, including an evaluation of progress
made in achieving the objectives identified in the first plan.
RESEARCH OBJECTIVES
The main objective for this research is to solicit input from healthcare experts and those who
have a special interest in the healthcare needs of the St. Louis City population served by Barnes-
Jewish Hospital. Specifically, the discussion identified the following objectives:
1) Determine whether the needs identified in the 2013 CHNA are still the right areas on which to
focus
2) For the purposes of the cancer needs assessment required by the Commission on Cancer,
discuss whether the barriers to access are different for cancer
3) Explore whether there is there anything on the list that should no longer be a priority
4) Determine where there are the gaps in the plan to address the prioritized needs
5) Identify other organizations addressing these needs with whom we should consider
collaborating
6) Discuss how the world has changed since 2013 when BJH first identified these needs and
whether there are there new issues we should consider addressing
7) Evaluate what issues the stakeholders anticipate becoming a greater concern in the future that
we need to consider now

88
METHODOLOGY
To fulfill the PPACA requirements, Barnes-Jewish Hospital conducted a single focus group with
public health experts and those with a special interest in the healthcare needs of St. Louis City
residents. It was held on March 28, 2015 at the Chase Park Plaza Hotel in the city of St. Louis.
The group was facilitated by Angela Ferris Chambers, Manager of Market Research & CRM for
BJC HealthCare. The discussion lasted ninety minutes.
10 individuals representing various St. Louis City organizations participated in the discussion.
Eight additional individuals were invited, but were unable to attend (Appendix A).
Dr. John Lynch, BJH Vice President and Chief Medical Officer, welcomed participants at the
beginning of the evening and introduced Mr. Bob Cannon, BJH President. Those who were
observing on behalf of Barnes-Jewish Hospital were also introduced to the group (Appendix A).
During the group, the moderator reminded the community leaders why they were invited - that
their input is needed to help the hospital move forward in this next phase of the needs assessment
process.
The moderator shared the needs prioritized by BJH in the first assessment and discussed where
the hospital is in its implementation plan. She also mentioned that as a system, BJC is working to
standardize the language for identifying prioritized needs across all of its hospitals so that impact
can be measured consistently. This will allow the sharing of best practices among all BJC
hospitals.
The “mission core priorities” that were identified in the 2013 BJH CHNA are Health Literacy &
Education and Chronic Conditions. In the revised nomenclature, we anticipate that these needs
may be classified as follows, although they may be subject to further revision before the 2016
CHNA is finalized.
Health Literacy & Education:
Childbirth and Breastfeeding Education
Health Literacy (general health education)
Immunizations and Infectious Diseases
Oral Health
Reproductive and Sexual Health
Smoking/Tobacco Education
Chronic Conditions:
Cancer
o Breast Cancer
o Colon & Rectal Cancer
o GYN Cancer
o Head & Neck Cancer
o Lung Cancer
o Prostate Cancer
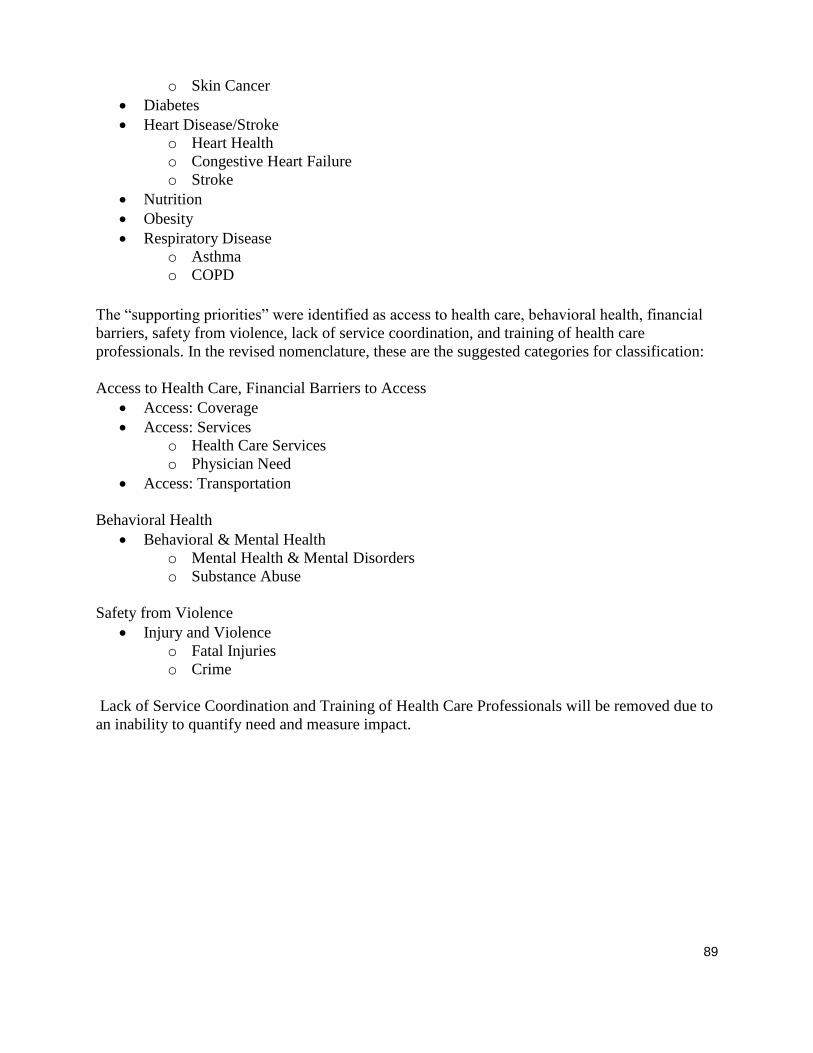
89
o Skin Cancer
Diabetes
Heart Disease/Stroke
o Heart Health
o Congestive Heart Failure
o Stroke
Nutrition
Obesity
Respiratory Disease
o Asthma
o COPD
The “supporting priorities” were identified as access to health care, behavioral health, financial
barriers, safety from violence, lack of service coordination, and training of health care
professionals. In the revised nomenclature, these are the suggested categories for classification:
Access to Health Care, Financial Barriers to Access
Access: Coverage
Access: Services
o Health Care Services
o Physician Need
Access: Transportation
Behavioral Health
Behavioral & Mental Health
o Mental Health & Mental Disorders
o Substance Abuse
Safety from Violence
Injury and Violence
o Fatal Injuries
o Crime
Lack of Service Coordination and Training of Health Care Professionals will be removed due to
an inability to quantify need and measure impact.
90
KEY FINDINGS
PERCEPTION OF 2013 PRIORITIES:
There was general consensus that the needs identified in the previous assessment are still those
on which BJH should focus. A few suggested that the issues of mental health and behavioral
health should be rated higher in priority due to the impact they have on contributing to violence
in our community.
NEEDS THAT SHOULD BE REMOVED: There was some discussion about why training of health professionals and service coordination
were not present in the revised list of needs. The law now requires that any prioritized needs be
able to be measured so as to determine the impact of any implementation tactics. These items
were removed because there was a lack of measures associated with them. Stakeholders from the
Regional Health Commission indicated that they have some metrics for BJH to consider around
these needs.
GAPS IN IMPLEMENTATION STRATEGIES:
ACCESS: COVERAGE Financial access to coverage continues to be an issue for St. Louis
City residents who are low-income.
The fact that the Medicaid program was not expanded in Missouri has created large gaps
in access for those in low income categories.
When ConnectCare closed, access was reduced. Those who are referred to BJH found
that they were expected to pay a $50 co-pay to receive services. For some, this is an
insurmountable financial barrier.
The differences between BJH and WU financial aid policies also create a lot of confusion
for patients, and may act as a psychological barrier to care.
ACCESS: SERVICES: There was much discussion around the role that technology could
play in improving access to services. These are some of the ideas that were mentioned:
Use technology to share information among all of a patient’s different health providers,
regardless of with which hospital or health system they are affiliated. Access to test
results and medications via a common electronic medical record can reduce unnecessary
utilization and improve continuity of care.
Use of “Facetime” and telemedicine capabilities can improve physician access to those
who might not otherwise see one. For example, incorporating this technology at health
fairs would give those who are identified with extremely high blood pressure or blood
sugar an opportunity to immediately interact with a physician and address the issue.
Otherwise, the condition may go untreated and end up becoming more severe.
Technology can also be used for the communication of health messages to educate
patients and encourage them to be pro-active about their health. It can positively impact
the health literacy of those at high risk for certain conditions.
Technology could be used to identify someone who missed an appointment and flag him
to be contacted for follow-up.
A medical card that contains all of your health history would be useful when a person
enters the health system. Caregivers would immediately have access to previous health
91
information, be made aware of the person’s issues and how they have been treated.
Although this use of technology could improve access and continuity, a few expressed
concern about privacy breaches.
ACCESS: SERVICES: Other comments around access to services revolved more around
care coordination.
We need to examine how patients transition from primary care to specialty care and how
we can seamlessly make that happen, especially for low-income patients.
The relationship that BJH has with the Integrated Health Network (IHN) and their
community health referral coordinators has helped to improve access for patients. BJH
should take more credit than they do for putting this program into place.
Working in teams that include both medical and mental health experts will help to better
identify whether issues are physical, mental, social and/or environmental and improve
our plans to address them.
Access to services is impacted by the cultural sensitivity of those who are providing
them. BJH should explore their patient satisfaction data by race, and especially the
attributes related to feeling listened to and respected. There may be opportunities for the
hospital to change behavior and improve performance on these metrics.
There was a specific question about perceptions of access to cancer services. Due to a
change in the Medicaid law in 2001, access to some cancer screening services is actually
better than for other services. However, this does not necessarily mean that once a condition
is identified through the screening, that access to treatment is readily accessible.
BEHAVIORAL/MENTAL HEALTH ISSUES: Increasing health providers’ awareness of
trauma (post-traumatic stress disorder) and how to recognize/assess it can ultimately impact
the treatment of chronic conditions along with behavioral health issues.
SPECIAL POPULATIONS:
HOMELESS: The homeless population was identified as one that may require additional
consideration. There is concern about where a homeless person would go when s/he is
released from the hospital as there is currently no appropriate place to release them.
THOSE WHO ARE DEAF/BLIND: Several points were made in regard to these
populations.
These individuals may not attend health fairs; often, there are no interpreters available.
We need to remember them when planning these events.
A law passed in 2014 requires that all videos be close-captioned/subtitled so that
members of these communities can easily access the information.
In the St. Louis community, there is a large need for a deaf psychologist who is not
personally familiar with members of the deaf community.
According to new legislation that is anticipated to soon be passed, a deaf/blind person
will be accompanied by a support person to all medical visits. This person cannot be
asked to leave the room. We need to make members of the medical profession aware of
these situations.
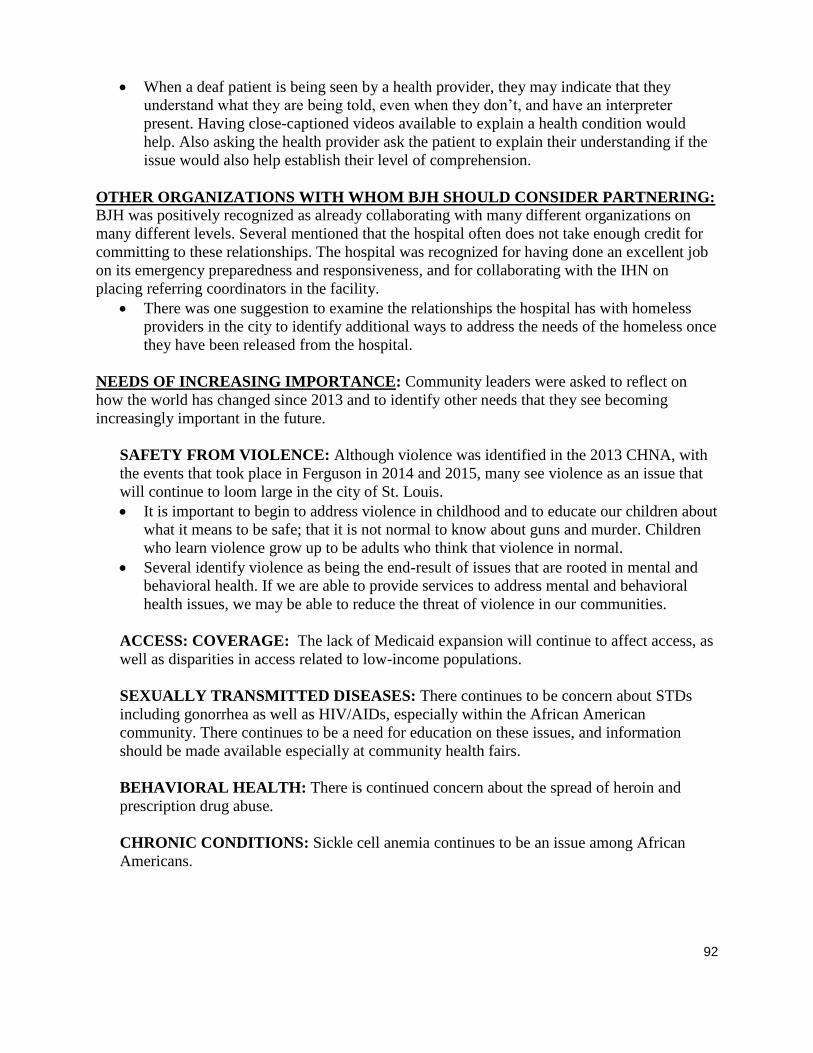
92
When a deaf patient is being seen by a health provider, they may indicate that they
understand what they are being told, even when they don’t, and have an interpreter
present. Having close-captioned videos available to explain a health condition would
help. Also asking the health provider ask the patient to explain their understanding if the
issue would also help establish their level of comprehension.
OTHER ORGANIZATIONS WITH WHOM BJH SHOULD CONSIDER PARTNERING: BJH was positively recognized as already collaborating with many different organizations on
many different levels. Several mentioned that the hospital often does not take enough credit for
committing to these relationships. The hospital was recognized for having done an excellent job
on its emergency preparedness and responsiveness, and for collaborating with the IHN on
placing referring coordinators in the facility.
There was one suggestion to examine the relationships the hospital has with homeless
providers in the city to identify additional ways to address the needs of the homeless once
they have been released from the hospital.
NEEDS OF INCREASING IMPORTANCE: Community leaders were asked to reflect on
how the world has changed since 2013 and to identify other needs that they see becoming
increasingly important in the future.
SAFETY FROM VIOLENCE: Although violence was identified in the 2013 CHNA, with
the events that took place in Ferguson in 2014 and 2015, many see violence as an issue that
will continue to loom large in the city of St. Louis.
It is important to begin to address violence in childhood and to educate our children about
what it means to be safe; that it is not normal to know about guns and murder. Children
who learn violence grow up to be adults who think that violence in normal.
Several identify violence as being the end-result of issues that are rooted in mental and
behavioral health. If we are able to provide services to address mental and behavioral
health issues, we may be able to reduce the threat of violence in our communities.
ACCESS: COVERAGE: The lack of Medicaid expansion will continue to affect access, as
well as disparities in access related to low-income populations.
SEXUALLY TRANSMITTED DISEASES: There continues to be concern about STDs
including gonorrhea as well as HIV/AIDs, especially within the African American
community. There continues to be a need for education on these issues, and information
should be made available especially at community health fairs.
BEHAVIORAL HEALTH: There is continued concern about the spread of heroin and
prescription drug abuse.
CHRONIC CONDITIONS: Sickle cell anemia continues to be an issue among African
Americans.
93
NEXT STEPS
Based on the input the hospital received from community stakeholders, Barnes-Jewish will
examine secondary data for St. Louis City to explore the size of the needs that have been
identified.
The hospital has established an internal stakeholder group to assess this information and evaluate
whether the priorities should change.
The needs assessment and associated implementation plan must be revised and updated for
release by December 31, 2016.
The community stakeholder group will continue to be updated as to the progress of the internal
work group as they work to meet this deadline.
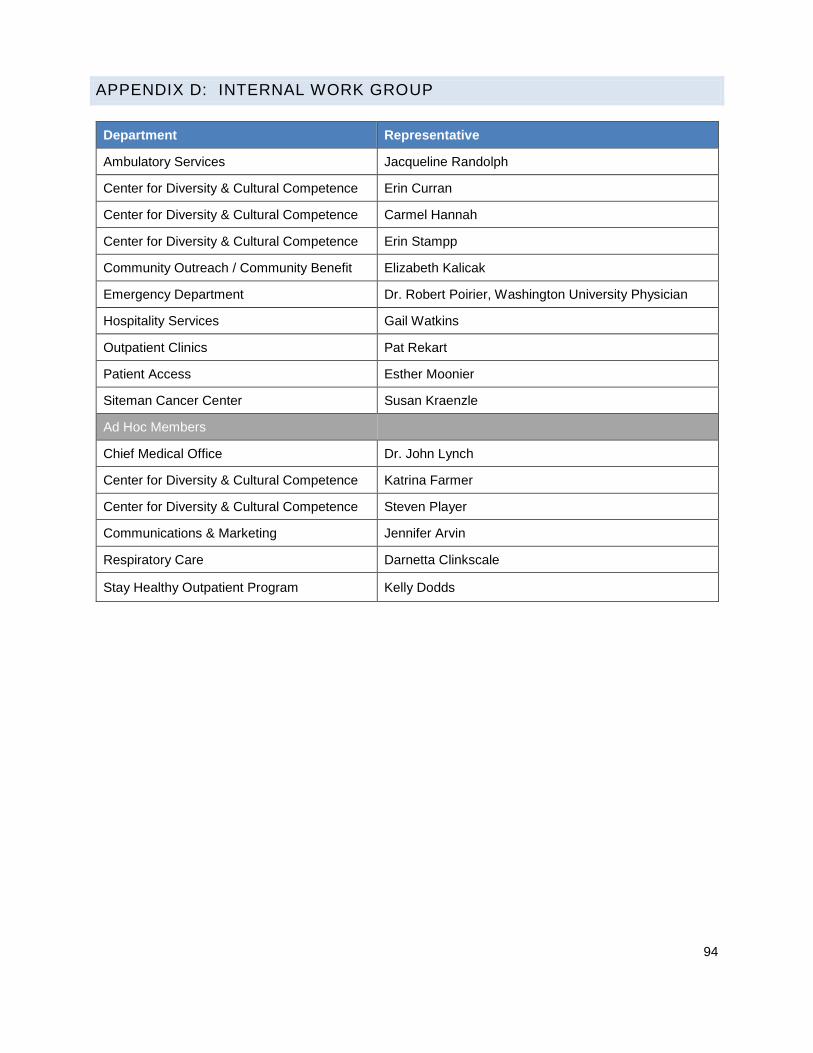
94
APPENDIX D: INTERNAL WORK GROUP
Department Representative
Ambulatory Services Jacqueline Randolph
Center for Diversity & Cultural Competence Erin Curran
Center for Diversity & Cultural Competence Carmel Hannah
Center for Diversity & Cultural Competence Erin Stampp
Community Outreach / Community Benefit Elizabeth Kalicak
Emergency Department Dr. Robert Poirier, Washington University Physician
Hospitality Services Gail Watkins
Outpatient Clinics Pat Rekart
Patient Access Esther Moonier
Siteman Cancer Center Susan Kraenzle
Ad Hoc Members
Chief Medical Office Dr. John Lynch
Center for Diversity & Cultural Competence Katrina Farmer
Center for Diversity & Cultural Competence Steven Player
Communications & Marketing Jennifer Arvin
Respiratory Care Darnetta Clinkscale
Stay Healthy Outpatient Program Kelly Dodds
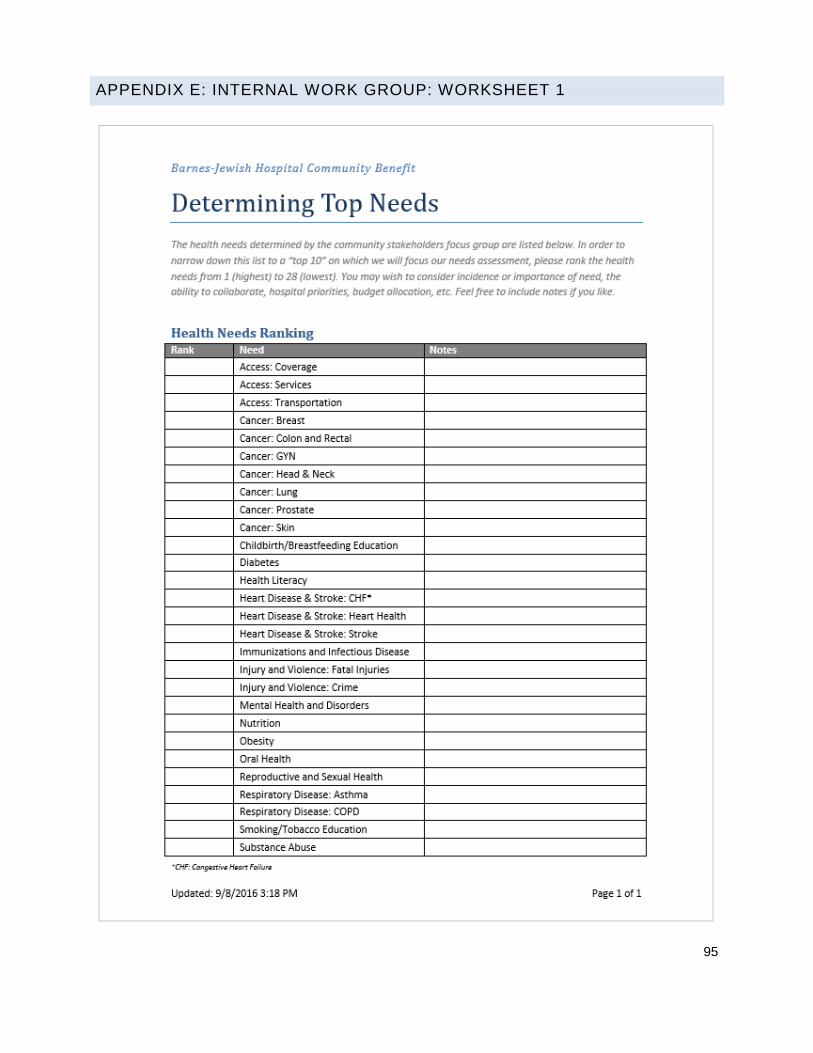
95
APPENDIX E: INTERNAL WORK GROUP: WORKSHEET 1

96
APPENDIX F: INTERNAL WORK GROUP: WORKSHEET 2

97
APPENDIX G: INTERNAL WORK GROUP: WORKSHEET 3

98
IMPLEMENTATION PLAN
The purpose of an implementation plan is to identify the goals, objectives, rationale, activities, outcomes
and evaluation strategy to meet the community health needs identified through the community health
needs assessment.
Barnes-Jewish Hospital prioritized the needs based on the ranking of each health topic and a variety of
other factors. The hospital chose four needs on which to focus:
Access to Services
Healthy Lifestyles
Mental & Behavioral Health: Substance Abuse
Public Safety: Violence
COMMUNITY HEALTH NEEDS TO BE ADDRESSED
ACCESS TO SERVICES:
.Rationale
Access to healthcare is an ongoing and national concern. Access to comprehensive, quality health care
services is important for the achievement of health equity and for increasing the quality of a healthy life for
everyone. It allows individuals to gain entry into the health care system, access a health care location
where needed services are provided and find a health care provider with whom the patient and
community can trust.
Additionally, access to mental health services in particular is a great need in St. Louis City. The burden of
mental illness is among the highest of all diseases, and mental disorders are among the most common
cause of disability. Mental health is essential to a person’s well-being, healthy family and interpersonal
relationships, and the ability to live a full and productive life.
Program Goal
To improve access to comprehensive, quality health care services
Program Objectives
After baseline studies are completed, we will:
Reduce avoidable Emergency Department utilization for patients who visit most often.
Increase coordination of community resources to assist in reducing access challenges for
patients.
Identify methods for successful management of frequent and complex patients in the emergency
department.
Action Plan
As healthcare evolves, it is increasingly important patients are cared for in the most effective location for
quality, continuity or care, and total cost of care management. Recognizing the social challenges many
residents of St. Louis City face, a team at Barnes-Jewish Hospital has increased efforts to understand the

99
complex reasons patients utilize the Emergency Room for non-emergent needs. In partnership with BJC’s
Center for Clinical Excellence, the Barnes-Jewish team is analyzing barriers to accessing healthcare in
the most appropriate setting for the patient. While some conditions may be better treated in a primary
care physician’s office, financial, transportation and many other resource challenges lead to increase
potentially avoidable visits to the Emergency Room. By regularly gathering a multi-disciplinary team to
discuss patient’s care on an individual basis, the Barnes-Jewish team will work to improve the continuity
of care for its patients and identify barriers that may be preventing the individual from being as healthy as
they can be.
Expected Outcomes
Access to health services affects a person’s health and well-being. Regular and reliable access to health
services can:
Prevent disease and disability
Detect and treat illnesses or other health conditions
Increase quality of life
Reduce the likelihood of premature (early) death
Increase life expectancy
Outcomes Measurement
After baseline studies are completed, the following will be used to measure impact:
Total number of visits from top 100 utilizers of the BJH Emergency Department
30-day ED revisit rate
Follow-up appointment success rate

100
HEALTHY LIFESTYLES
Goal
Improve knowledge and skill in leading a healthy lifestyle.
Rationale
Good nutrition, physical activity and a healthy body weight are essential parts of a person’s overall health
and well-being. Together, these can help decrease a person’s risk of developing serious health
conditions, such as high blood pressure, high cholesterol, diabetes, heart disease, stroke, and cancer. A
healthful diet, regular physical activity, and achieving and maintaining a healthy weight also are
paramount to managing health conditions so they do not worsen over time. (HealthyPeople 2020)
The health impact of eating a healthful diet and being physically active cannot be understated. Together,
a healthful diet and regular physical activity can help people:
Achieve and maintain a healthy weight
Reduce the risk of heart disease, stroke and diabetes
Reduce the risk of certain forms of cancer
Improve mood and energy level
Chief among the benefits of a healthful diet and physical activity is reduction in the risk of obesity. Obesity
is a major risk factor for several of today’s most serious health conditions and chronic diseases, including
high blood pressure, high cholesterol, diabetes, heart disease and stroke, and osteoarthritis. Obesity also
has been linked to many forms of cancer. (HealthyPeople 2020)
Objectives
Once phase one of tool development is complete, provide Your Disease Risk assessments to 100
community members each year.
Improve knowledge of the importance of a healthful diet, physical activity and healthy weight in a
minimum of 50% of participants who complete an assessment, as measured by pre- and post-
tests.
Improve the health of the people we serve as measured by the pre- and post-tests conducted
after phase two of tool development is completed.
Action Plan
Your Disease Risk is an assessment tool developed over the past ten years by world-renowned experts.
It collects the latest scientific evidence on disease risk factors into one easy-to-use tool. Each participant
who completes the assessment can learn their risk for various diseases and get personalized tips for
preventing them.
Barnes-Jewish Hospital and Siteman Cancer Center will redevelop the comprehensive online Your
Disease Risk tool, as well as develop a more simplified assessment for use at community events.
Beginning in 2017, both Barnes-Jewish and Siteman will conduct opportunities for community members
to take the Your Disease Risk Assessment.
A second phase of tool development will be conducted by 2019. This will allow us to record risk by
individual participant and measure change in risk over time.

101
Expected Outcomes
For those who participate in the program:
Improvement in knowledge of healthy lifestyles, as measured by score from pre- to post- test with
average improvement being a minimum of 10%
Once phase two of tool development is complete:
o Average risk of heart disease, stroke and diabetes will be reduced by a minimum of 3%
o Average BMI improvement will be at least 3%
Outcomes Measurement
After the first phase of tool development, this program will be evaluated by measuring the
increase in knowledge of the importance of a healthful diet, physical activity and healthy weight in
preventing disease by comparing post-test results to pre-tests.
After the second phase of tool development, this program will be evaluated by measuring
improvements in Your Disease Risk Assessment scores for each participant over time.
102
MENTAL & BEHAVIORAL HEALTH: SUBSTANCE ABUSE
Goal
Increase awareness of prescription drug misuse.
Rationale
Although progress has been made in substantially lowering rates of substance abuse in the United
States, the use of mind- and behavior-altering substances continues to take a major toll on the health of
individuals, families and communities nationwide.
Substance Abuse – involving drugs, alcohol, or both – is associated with a range of destructive social
conditions, including family disruptions, financial problems, lost productivity, failure in school, domestic
violence, child abuse and crime. (HealthyPeople 2020)
Substance abuse continues to be one of the most complex public health issues:
As the numbers of prescribed opioids rise, there is an increase in overdoses and death.
Prescription opioid drugs are a gateway to heroin, an illegal substance that is easier to get and
less expensive than prescription opioids.
If diagnosed on time, opioid overdoses can be reversed with the administration of naloxone by a
healthcare professional. Assistance into a treatment program should be provided to patient.
Objectives
In 2017, baseline percentage change from pre- and post- tests will be taken to show impact of education.
By 2019, increase knowledge test scores of prescription drug misuse in 8 percent of the patients who participate as compared to 2017.
Action Plan
Beginning in 2017, Barnes-Jewish Hospital will require online training to educate health care providers on standards of care when reviewing opioid prescriptions with emergency room patients.
Before a patient is discharged, the provider will review all instructions including but not limited to, dosage, home safety, risks of misuse and proper disposal.
Provide web-based and print materials to health care providers so they can offer immediate assistance to a patient who presents with a chemical dependency disorder (drug or alcohol) or classified as high risk.
Raise awareness of resources through social media, and internal communications to physicians and clinical staff on the campus of Barnes-Jewish West County Hospital and Barnes-Jewish Hospital.
Expected Outcomes
Preventing prescription drug misuse will improve quality of life, lower health care costs and promote a
safer community.
Outcomes Measurement
Record the total number of Barnes-Jewish Hospital health care providers who complete the online competency training in Saba.
Conduct pre- and post-tests to 100 emergency room patients who are discharged with an opioid
prescription.
Measure pre- and post-test results to measure awareness and confidence in addressing prescription drug misuse and illicit drug use.

103
PUBLIC SAFETY: VIOLENCE
Goal
Support the regional effort to make St. Louis a trauma-informed community and reduce the impacts of
violence on patient care and outcomes by training Barnes-Jewish Hospital team members in trauma-
informed care.
Rationale
The impacts of stress and trauma are a harmful and pervasive public health problem. The effects of
traumatic events and chronic stress place a heavy burden on individuals, families, communities and
create challenges for the public organizations that work to serve them. Trauma results from things such
as violence, abuse, neglect, loss, disaster, war and other emotionally harmful experiences. The science
and information about trauma is growing rapidly as is the work to promote more trauma informed
communities and institutions.
St. Louis has one of the highest crimes rates in the country and with that comes citizens experiencing
high levels of trauma. As we learn more about trauma, we understand that childhood trauma and chronic
stress can lead to destructive behaviors include participating in criminal activities. As the city’s safety net
hospital and a level one trauma center, we face the challenges of serving a community that is impacted
by trauma and need to have the tools to navigate those challenges. As a hospital we can be actively
engaged in reducing crime and minimizing its long term effects on our patients by becoming a trauma
informed organization.
Objectives
75% of all Barnes-Jewish Hospital team members will be trained in trauma-informed care.
50% improvement in patient post-test scores compared to pre-tests.
Action Plan
Beginning in 2017, Barnes-Jewish Hospital team members will be required to participate in
training designed for trauma-informed communities.
Team members will be given access to resources for recognizing and addressing traumatic and
toxic stress.
Expected Outcomes
As a trauma informed hospital, we can be better equipped to meet our patients and families where they
are and therefore provide care that better meets their needs.
With team members who have been trained to identify and address issues related to trauma, we
will improve the patient experience and give them the best chance for improving their health.
The impact of violence on patient care and outcomes will be reduced.
Outcomes Measurement
Through the BJC Learning Management System, team member training will be offered and
tracked for completion.
Pre- and post-tests will be conducted in priority areas of the hospital, including the Emergency
Department.

104
COMMUNITY HEALTH NEEDS NOT TO BE ADDRESSED
Following the 2013 Community Health Needs Assessment process, the Barnes-Jewish Hospital internal
work group decided that with too many areas of focus, minimal impact would be made. While the
following needs are important to the hospital and our community, they are not included in the
implementation plan so that we can dedicate necessary resources to fewer focus areas. Programs will
continue to be conducted for each of these needs, but they will not be the hospital’s primary focus.
ACCESS TO COVERAGE
Barnes-Jewish Hospital provides financial assistance to the patients and community we serve.
This includes help in applying for health insurance through the new Marketplace, applying for
Medicaid assistance and determining if you qualify for financial assistance from BJC.
Other organizations addressing this need include, but are not limited to:
o Cover Missouri
o St. Louis Regional Health Commission
ACCESS TO TRANSPORTATION
Barnes-Jewish Hospital provides transportation assistance to qualified patients via cab vouchers.
Other organizations addressing this need include, but are not limited to:
o Metro Transit – St. Louis
o Organized Alternative Transportation Services (OATS)
CANCER
Siteman Cancer Center provides a variety of health education and screening events for the
community, as well as through the Program for the Elimination of Cancer Disparities (PECaD).
Other organizations addressing this need include, but are not limited to:
o American Cancer Society
o Cancer Support Community
DIABETES
Barnes-Jewish Hospital provides diabetes education and services through the Diabetes Center.
Other organizations addressing this need include, but are not limited to:
o American Diabetes Association
o St. Louis County Department of Health
HEALTH LITERACY
All patient education materials provided by Barnes-Jewish Hospital are reviewed by the Center
for Practice Excellence to ensure they meet health literacy standards.
Other organizations addressing this need include, but are not limited to:
o Health Literacy Missouri
105
HEART DISEASE & STROKE
Barnes-Jewish Hospital offers various opportunities for education and screenings for heart
disease and stroke.
Other organizations addressing this need include, but are not limited to:
o American Heart Association
o American Stroke Association
IMMUNIZATIONS & INFECTIOUS DISEASE
Each year, Barnes-Jewish Hospital offers 20,000 free flu shots to members of our community
who would otherwise not have access to one.
Other organizations addressing this need include, but are not limited to:
o City of St. Louis Department of Health
o St. Louis County Department of Health
MATERNAL & CHILD HEALTH
Barnes-Jewish Hospital’s OB-GYN Clinic and Women & Infants programs provide health
education, classes, etc. for expecting and new mothers.
Other organizations addressing this need include, but are not limited to:
o St. Louis Maternal, Child & Family Health Coalition
o Annie Malone Children & Family Service Center
MENTAL HEALTH & DISORDERS
BJC Behavioral Health offers a continuum of services including early intervention services,
school-based services, outpatient services, comprehensive children’s services and adult
psychiatric rehabilitation services.
To support much-needed regional acute mental health care delivery, Barnes-Jewish Hospital
assumed operations and ownership of the St. Louis Regional Psychiatric Stabilization Center, a
25-bed adult impatient acute psychiatric program in St. Louis. Barnes-Jewish Hospital operates
the facility, with medical staffing by physicians of the Department of Psychiatry at Washington
University School of Medicine. It is now called the Barnes-Jewish Hospital Psychiatric Support
Center.
Other organizations addressing this need include, but are not limited to:
o Mental Health America of Eastern Missouri
o Missouri Department of Mental Health
o St. Louis Mental Health Board
NUTRITION
Barnes-Jewish Hospital will include nutrition education when addressing healthy lifestyles.
Other organizations addressing this need include, but are not limited to:
o City of St. Louis Department of Health
o St. Louis County Department of Health

106
OBESITY
Barnes-Jewish Hospital will include obesity education when addressing healthy lifestyles.
Other organizations addressing this need include, but are not limited to:
o City of St. Louis Department of Health
o Missouri Foundation for Health
o St. Louis County Department of Health
ORAL HEALTH
The Foundation for Barnes-Jewish Hospital funds dental and oral assistance programs at Barnes-
Jewish Hospital.
Other organizations addressing this need include, but are not limited to:
o Affinia Healthcare
PUBLIC SAFETY: FATAL INJURIES
Barnes-Jewish Hospital’s trauma center provides various opportunities for public safety and fatal
injuries education.
Other organizations addressing this need include, but are not limited to:
o American Trauma Society
o ThinkFirst Saint Louis
o Trauma Survivors Network
REPRODUCTIVE & SEXUAL HEALTH
Organizations addressing this need include, but are not limited to:
o Family Care Health Centers
o La Leche League, Gateway Area
o Myrtle Hilliard Davis Comprehensive Health Centers, Inc.
o People’s Health Center, Inc.
o ThriVe St. Louis
RESPIRATORY DISEASE: ASTHMA & COPD
Barnes-Jewish Hospital offers respiratory disease education through various programs.
Other organizations addressing this need include, but are not limited to:
o American Lung Association
o Asthma & Allergy Foundation of America, St. Louis Chapter
SMOKING & TOBACCO EDUCATION
Barnes-Jewish Hospital offers smoking and tobacco education through various programs.
Other organizations addressing this need include, but are not limited to:
o American Heart Association

107
American Lung Association

108


