73
BAY OF BENGAL PROGRAMME BOBP/INF/3
Development of Small-Scale Fisheries (GCP/RAS/040/SWE)
MARINE SMALL-SCALEFISHERIES OF INDIA:A GENERAL DESCRIPTION
Executing Agency :
Food and Agriculture Organisationof the United Nations
Funding Agency :
Swedish InternationalDevelopment Authority
Development of Small-Scale Fisheries in the Bay of BengalMadras, India, October 1982
PREFACE
This document attempts a brief and factual presentation of data and baseline information onthe main features of the small-scale marine fisheries of India.
It could serve as an introduction to the problems and prospects of this sector leading to deeperstudies of particular aspects; as a source of general information about the sector; or, more parti-cularly, as a background document for use in discussions on the planning and programming ofdevelopment assistance.
This is a revised and updated edition of a General Description of Small-Scale Fisheries, India,originally prepared in 1976 by the Fisheries Division of the Department of Agriculture, Ministryof Agriculture and Irrigation, New Delhi, India in consultation with the FAO/UNDP Project forDevelopment of Small-Scale Fisheries in Southwest Asia, RAS/74/031, revised in consulta-tion with the Project by Dr. P. V. Rao, Scientist, Central Marine Fisheries Research Institute,Cochin in 1976 and published as RAS/74/031 Working Paper No. 2. The present revision wascarried out with the assistance of a national consultant, Dr. T. A. Mammen, formerly JointCommissioner (Fisheries) to the Government of India.
The preparation of this document is an activity of the Bay of Bengal Programme for Small-ScaleFisheries Development, GCP/RAS/040/SWE, a regional FAO programme funded by theSwedish International Development Authority (SIDA) and executed by the Food and AgricultureOrganisation of the United Nations (FAO). Five countries are members- Bangladesh, India,Malaysia, Sri Lanka and Thailand. The aims of the BOBP are to develop, demonstrate andpromote appropriate technologies and methodologies to improve the conditions of small-scalefisherfolk and to increase the supply of fish from the small-scale sector in the member countries.
The document is a working paper and has not been officially cleared by the Government or bythe FAO.
[iii]
CONTENTS
1 . Introduction
2. Fishery resources
3. Fishing fleet
4. Infrastructure and service facilities
5. Production
6. Handling and processing
7. Distribution and marketing
8. Export and import
9. Coastal aquaculture
10. Socio-economics
11. Fisheries administration and institutions
11.1 Fisheries administration
11.2 Institutes
11.2.1 Research and development institutes
11.2.2 Training institutes
1 1.2.3 Others
12. Industry organisations
12.1 Fisheries corporations
12.2 Fisheries cooperatives
13. Government policy
14. Development plans
15. Bibliography
Tables
7.1 Wholesale prices of fish (Rs./quintal) in some importantmarket centres
8.1
8.2
9.1
10.1
10.2
10.3
Exports of Indian marine products
Import of fish into India
Areas for brackishwater fish culture
Employment of fisher-folk (1979)
Boat ownership patterns in different maritime states
Income of fishermen operating country craft and mechanised boats
11.2.1.5.1 Training facilities and courses conducted by IFP
11.2.2.2.1 Duration and intake of training courses for marine fisheriesoperatives at CIFNET
12.2.1 Situation of primary fisheries cooperative societies 1977/78
12.2.2 Performance of primary fisheries cooperatives in themaritime states 1976/77
Page
1
2
5
6
7
7
8
1 0
11
1 3
1 5
1 5
1 6
16
2 1
23
23
23
24
26
28
29
9
10
10
1 2
13
14
1 5
1 9
22
25
25
[iv]

Appendices
1 . 11.2
3.1
3.23.3
3.4
3.5
4.1
4.2
4.3
4.4
4.54.65 . 1
5.2
Map of India
Country data
Statewise distribution of mechanised boats (1980)
Statewise distribution of non-mechanised marine fishing craft in India (1980)
Salient features of some important fishing craft typesStatewise figures of marine fishing gears in India 1980
Common craft-gear combinations
Fishing harbours at major ports under construction/completed (1981)
Fishing harbours at minor ports under construction/completed (1981)
Planwise outlays and expenditure for fishing harbours at major and minor ports
Development of refrigeration facilities for storage and distribution - planwise
Statewise distribution of refrigeration facilities 1980Manufacture of marine diesel enginesMarine fish production in India
Percentage composition of marine fish catch by the traditional andmechanised sectors
5.3 Marine fish production by the traditional and mechanised sectors in themaritime states
5.4
5.5
Trends in fish production by the traditional sector in the maritimestates during 1969-77
Trends in fish production by the mechanised sector in the maritimestates during 1969-77
5.6
5.7
Composition of marine fish landings in India during 1977 to 1980
Estimated statewise and species-wise marine fish landings in Indiaduring 1980 (in tonnes)
6.1
8.1
8.2
9.1
10.1
Statewise capacities for fish canning and fish meal manufactureStructure of exports of marine products from India yearwise bybroad categories (1977/78 to 1979/80)
Percentage composition of marine products exported from India(1978/79-1979/80)Selected data on production rates in brackishwater fish/prawn cultureStatewise figures of marine fishing villages and fisherfolk populationin India 1980
11.1 Crganisational set-up of the fisheries administration in theGovernment of India
11.2 Nodal organizations and the specialised institutes under theiradministrative control
12.1
14.1
14.2
Subsidies provided by different states in the fisheries sector
Outlays and expenditure for fishery development during the plan periods
Central sector and centrally sponsored schemes - outlays in thesixth five-year plan (1980-85)
14.3 Statewise outlays for fisheries during sixth plan
14.4 State plan outlay for fisheries development by broad heads of development
14.5 List of aid projects
Publications of the Bay of Bengal Programme
Page
3 1
3236
3 7
383 9
40
4 14 1
43
44
444546
47
48
49
50
5 1
51 -A
5 2
5 3
53
54
55
56
5 7
58
5 9
6061
62
63
65
[v]
1. INTRODUCTION
India is situated between latitudes 8” 4’ and 37” 6’ north and longitudes 68” 7’ and 97” 25’east. It is bounded in the north by China, Nepal and Bhutan; in the east by Burma and Bangladesh;and in the north-west by Afghanistan and Pakistan. South of the Tropic of Cancer the countrytapers off into the Indian Ocean between the Arabian Sea on the west and Bay of Bengal on theeast. The Gulf of Mannar and the Palk Strait separate India from Sri Lanka. The Andaman andNicobar Islands in the Bay of Bengal and Lakshadweep Islands in the Arabian Sea are parts ofthe territory of India. A map is given in Appendix 1.1.
The maritime States and Union Territories (UT) are as follows:
West Coast East Coast
GujaratMaharashtraGoa, Daman and Diu (UT)KarnatakaLakshadweep Islands (UT)K e r a l a
West BengalOrissaTamil NaduPondicherry (UT)Andaman and Nicobar Islands (UT)
The present total marine fish production is about 1 million tonnes. In 1980-81 India’s total exportof fish and fish products was valued at Rs. 2,348 million, which represented about 3.4% of thetotal foreign exchange earnings of the country. The fisherfolk population of the country is esti-mated at 5.38 million, representing about 0.8% of the total population of India. Fishing providesdirect employment to about 1.8 million fishermen, 0.9 million being engaged in fishing, fishseed collection, etc., and the rest in net-making, fish curing, marketing,etc. Fishermen also oftencarry on other vocations such as ferrying, salt-making, etc.
The small-scale fisheries sector plays a significant role in Indian fisheries. It contributes about62% of the country’s fish production and about 0.5% of food supplies.
The inland fishermen live in isolated hamlets distributed over a vast geographical area, practi-cally without communication and infrastructural facilities. Quite a number of them are nomads.Compared to this, the marine fishermen are a more compact group of 1.44 million, living in1,913 villages. Both inland and marine fishermen belong to economically and socially backwardcommunities characterised by large families, low levels of income and literacy and a high degreeof indebtedness and a conservative approach to life and vocation.
The problems of small-scale fishermen received little attention prior to independence. The post-independence developmental effort too has been directed largely towards areas like establish-ment of research institutes, provision of training and infrastructure for mechanised fishing anddeep-sea fishing, establishment of ice-making and refrigeration plants and improvement ofdomestic and export marketing. The benefits of modernisation have been garnered by a minorityof energetic fishermen and non-fishermen who could assimilate modern technology, while themajority of fishermen, though marginally benefited by use of synthetic nets, higher market demandfor fish and fishery products, etc., have remained virtually unaffected.
Prior to 1944, fisheries was a ‘transferred’ subject. The administration and management offisheries were the direct responsibility of the erstwhile provinces. Although the Government ofIndia enacted the Indian Fisheries Act in 1897, it was mostly for empowering the provincialgovernments to frame rules under the Act. The provincial governments concerned themselvesmainly with administering the Fisheries Act and issuing licences for fishing or leasing outGovernment-owned water areas for fishing. Studies on fishes and other aquatic fauna werecarried out mainly by the Marine Survey of India, Zoological Society of India and some univer-sities.
[1]
The constitution of a Fish Sub-Committee of the Policy Committee on Agriculture, Forestryand Fisheries in 1944 to review the position of fisheries of the country and to report on the mea-sures necessary for its improvement and development marks the recognition of the need for thedevelopment of fisheries by the Government of India. The recommendations of that Committeepaved the way for the formulation of various programmes for fisheries development.
After independence, fisheries development was given enhanced importance particularly in theNational Plan Schemes (Five-Year Plans), the first of which started from 1951, and significantprogress was achieved in different sectors of the fisheries. An organised industry was graduallyestablished. The discovery of rich fishing grounds close to the shore ; improvement of traditionalcoastal fishing by fishermen; introduction of modern fishing technology; mechanisation offishing craft and introduction of mechanised fishing boats; establishment of processing, landingand othar infrastructural facilities; improvement in distribution and marketing and an ever-increasing demand for fish and fishery products in the internal as well as external markets werefactors that contributed to the progressive development of the marine fisheries.
During the first five Five-Year Plans and intervening three annual plan years (1951-79), themain emphasis in marine fisheries development was on the introduction of mechanised fishingboats and mechanisation of fishing craft. At the commencement of the first Five-Year Plan period,there were only 13 mechanised boats in operation. The number went up to 863, 2161, 5206,7708, 10,576, at the end of the first, second, third plan periods, the 3 annual plan years and thefourth plan periods respectively and stood at about 19,000 at the end of the fifth plan period.Besides this, emphasis was also given to popularisation of synthetic fishing twine and assistanceto small fishermen in the form of supply of fishing requisites, salt for fish curing, etc. A large num-ber of ice plants and cold storages were established by the public and private sectors during thisperiod. This development, along with the increasing demand for shrimp in the internationalmarket, stimulated the private sector to establish facilities for freezing and canning and it alsoled to an export trade. Institutes for the training of fisheries personnel of various categories tomeet the technical and operative manpower requirements of the fishing industry were established.Fishery survey and research programmes were intensified. The construction of fishing harboursat major and minor ports and provision of landing facilities at various sites were taken up. Inorder to improve the socio-economic conditions of fishermen and marketing, establishment offisheries cooperative societies and fisheries corporations was encouraged.
Marine fish production increased from 0.534 million tonnes in 1951 to 1.388 million tonnes in1979, the base year for the current Sixth Five-Year Plan. Exports of marine products rose from22,200 tonnes valued at Rs. 33 million in 1951/52 to 86,400 tonnes valued at Rs. 2,488 millionin 1979/80.
2. FISHERY RESOURCES
India’s climate presents many variations and contrasts. In the north-west, the Rajasthan deserthas an average annual rainfall of less than 127 mm, while in the north-east, Chirapunji in Assamrecords an average rainfall of over 11,000 mm. Temperatures as low as -9.5ºC in Kashmir andas high as 49.5ºC at Jodhpur have been recorded. The mean annual range of temperature of66°C at the southern tip of India is less than the daily range at many places in north India.
It may be broadly described as a tropical monsoonal climate. There are four seasons : the winterseason (January-February) ; the warm season, summer (March-May) ; the rainy season, south-west monsoon (June-September) ; and the post-monsoon season, which is the north-eastmonsoon period in the southern peninsula (October-December).
The continental shelf area between 0 and 50 m depth is estimated at 1,94,972 km2 and between0 and 200 m depth at 452,060 km2. The average width of the shelf from the shore-base variesfrom 32 km off the coast of Andhra Pradesh to 174.6 km off the coast of Maharashtra. OffGujarat and Kerala, it is about 65 km while off Goa and Karnataka it is over 90 km.
The fishing grounds in the north-west coast cf India are extensive, the sea-bottom being generallymuddy and suitable for trawling; in the south-west coast too, the sea-bottom in the inshore
[2]
fishing grounds is muddy and productive grounds forshrimp lie within this region. The sea-bottomon the south-east coast is characterised by coral or rocky ground interspersed with even ground.On the north-east coast, the sea-bottom is predominantly muddy in the depth range of 25-100 mand suitable for bottom trawling. In general, between 100-140 metres depth and in some caseseven beyond, the bottom is uneven, making bottom trawling difficult.
In recent years, several investigations have been conducted on the physical, chemical andbiological oceanography of the seas around India. Several layers of water masses such as theIndian Ocean Central Water, the Indian Ocean Equatorial Water, and the Deep Water at a depth of2000 metres are recognisable in the region of sub-tropical convergence at about 40ºS latitudein the Indian Ocean below the surface waters. There are also the Antarctic Intermediate Waterand the Red Sea Water. The movement of the cold Antarctic Bottom Water (Deep Water) fromthe polar regions into the Arabian Sea and the Bay of Bengal has a bearing on the organic pro-ductivity in the region. The Red Sea Water penetrates to great depths across the equator andmeets the Antarctic Bottom Water.
The surface temperature along the Indian coast varies from 23°C to 29ºC. A comparatively lowertemperature reaching a value of 21°C occurs in November-December on the north-western coastof India. In the Bay of Bengal, the usual range of surface temperature is between 27°C and 29°C.
On the west coast of India, the thermocline fluctuates a great deal showing a definite seasonaltrend, being found at 100-125 m during winter, at 75-90 m between the monsoons and20-30 m with the progress of the south-west monsoon. In the Bay of Bengal, the thermoclinelevel is usually below 50-55 m and at times goes down to 100-125 m. The shelf waters ingeneral are mostly isothermal or nearly isothermal. Large-scale upwelling occurs during thesouth-west monsoon off the west coast. During the north-east monsoon fairly strong conver-gences develop on the east coast of India and the Andaman Sea.
The average salinity range in the Arabian Sea is between 34% & 37% and between 30%and 34% in the Bay of Bengal. The higher salinity of the waters of the Arabian Sea is mainlydue to high saline water flowing from the Red Sea and the Persian Gulf. The low salinity of theBay of Bengal is due to the influence of large river systems emptying into it. Investigations haveshown that the waters of the Arabian Sea are somewhat deficient in oxygen at a depth of 200-500 m. This oxygen-deficient water is subject to movement as a result of upwellings.
Various techniques have been employed to estimate the productivity of Indian waters. Theseinclude exploratory fishing surveys by the Exploratory Fisheries Project (EFP), the IntegratedFisheries Project (IFP) and the Central Institute for Fisheries Nautical and EngineeringTraining (CIFNET); acoustic surveys by the former Pelagic Fisheries Project; studies ofthe oceanography, primary production, chlorophyll, a particulate organic carbon,phaeophytin, etc., by the Central Marine Fisheries Research Institute (CMFRI), theNational Institute of Oceanography (NIO) and various universities. CMFRI scientistshave estimated the rate of primary production on tha east coast at 0.63 gC/m2/dayon the shelf and 0.19 gC/m2/day outside the shelf; the mean value within 50 metres depth onthe west coast as 1.24 gC/m3/day, the daily rate of production for the rest of the west coastshelf as 0.47 gC/m3/day and for the oligotrophic regions outside the shelf as 0.19 gC/m2/day.The more recent work of NIO seems to indicate that these estimates are low for the east coastand high for the west coast, although strict comparisons are not possible due to differences inanalytical methods, variability in time and heterogeneity in space.
Ths role of oceanographic parameters in relation to the occurrence and migration of fish isrelatively better understood for the south-west coast of India. Along the south-west coast,upwelling recurs annually. Meteorological and other oceanographic parameters which influencethe fishery also exhibit wide variations in space and time. The most important aspect of the oceano-graphic features of the area is the prevailing current system at the surface levels which changesdirection from one season to another. The southerly currentwhich develops in May continuestill November when it reverses and the northerly current continues till April. The southerly currentbrings comparatively high saline Arabian Sea water southward and the northerly current carriesthe less saline equatorial waters northward. The spreading effect of the high saline Arabian seawater towards the south is largely neutralised by south-west monsoon rain and river run-off.
2 [3]
Thus, the annual salinity cycle at the surface levels is dependent on the onset of the south-westmonsoon and the direction, velocity and duration of the two current systems. The sea-watertemperature shows wide seasonal and spatial fluctuations. In areas where upwelled waterreaches the surface, the temperature falls considerably below that which could be otherwiseexpected for the season. The shelf waters are well aerated during most of the year except for thesouth-west monsoon and the associated upwelling. In August,theoxycline becomes very shallowand in areas of intense upwelling, the low intermediate waters reach the surface and remainthere until October especially in areas where upwelling is intense. By December, the shelf watersare once again well aerated. The immediate effect of upwelled water reaching the surface, whichis highly oxygen-deficient, is the expulsion of all animals including fish from the vicinity. Dis-solved oxygen concentration in these waters slowly increases due to dissolution of atmosphericoxygen. Increased phytoplankton production leading to a zooplankton bloom commences inareas where highly productive water from the bottom levels is brought to the surface. The oilsardine and mackerel fisheries commence immediately after the south-west monsoon, when thezooplankton biomass at the surface layers reaches a peak. A study of the behavioural pattern ofthe oil sardine, mackerel and white bait and the environmental parameters indicates that thetemperature of the sea water and dissolved oxygen at the surface levels influences the seasonalmigration of these species which avoid areas of intense upwelling activity mainly because oflow oxygen concentration and low temperature conditions.
The ‘Muraena’ survey has broadly indicated the greater biological production connected withexchange of water masses in the frontal zone between coastal and deeper Arabian Sea. Thissurvey and surveys by vessels of the Exploratory Fisheries Project and Pelagic Fisheries Projecthave shown the presence of large stocks of horse-mackerel, ribbon fish, etc., in the outer shelfarea. Surveys conducted by Dr. FRIDTJOF NANSEN outside Indian waters seem to indicatelarge resources of mesopelagic species.
In the Bay of Bengal, the surface currents vary from south-westerly to southerly in the north-western part of the bay. A clockwise gyre is present in the north central portion. Off the riverGodavari the flow is northwards. South of the Godavari, the flow is complicated with severaleddies and a clockwise circulation. These eddies in turn lead to sinking and upwelling whichresult in alternation of lower and higher production. Because of the lower salinity at the top, thesub-surface water may not reach the surface. A factor however that helps the admixture of thesub-surface nutrient-rich water with the surface layer is the intense cyclonic activity during thepost-southwest monsoon period.
The fishing season for the country as a whole is the period October - December. For Msharashtraand Gujarat, the period July-September and for Kerala and Karnataka the period April - Juneare relatively poor seasons. On the east coast, the peak seasons are October - December forWest Bengal and Orissa and January - March for Tamil Nadu and Andhra Pradesh.
Estimates of 10 to 20 million tonnes of potential fish resource for the Indian Ocean have beengiven by various authors on the basis of relative productivity of the waters and exploratory surveys.For the seas around India, the potential annual fish production in the continental shelf (O-200 mdepth) has been estimated at between 2.3 and 4 million tonnes.
Studies conducted by the Exploratory Fisheries Project (EFP) on demersal fishery resourcesindicated that the most extensive trawling grounds are on the north-west coast of India borderingthe Gujarat and Maharashtra coasts up to 75 m depth. Along the east coast, the better trawlinggrounds in which prawns form an important component of the catch are off the Orissa andWest Bengal coasts. On the south-west coast, fishing grounds for prawns are off Maharashtraand Cochin; for elasmobranchs, off Cape Comorin, Cochin, Cannanore and Mangalore; forLactarius, off Mangalore; for Nemipferus japonicus, off Cape Comorin, Cochin and Cannanore;for ribbon fish, off Cochin and Cannanore; and for catfish and ‘Kalava’, off Cochin.
Less information is available on pelagic fishary resources except for the south-west coast. As aresult of the investigations conducted by the Pelagic Fisheries Project, the magnitude of pelagicfishery resources off the south-west coast were assessed at 400,000 tonnes of oil sardine,300,000 tonnes of mackerel, 400,000 tonnes of white bait, 150,000 tonnes each of horse mackerel
[4]
and catfish, besidessignificant quantities of silver bellies, golden scad, butter fish, etc. Oil sardine,mackerel, white bait and horse mackerel were found to have protracted spawning periods withno definitely demarcated spawning grounds. Oil sardine was found to breed closer to the shorethan mackerel.
Recent work by the Exploratory Fisheries Project has given an indication of the presence oflarge stocks of horse mackerel and ribbon fish along the north-eastern shelf area and of mackerelalong the east coast. No quantitative estimates or biological studies however have been under-taken in these areas.
India’s fishing effort has been generally increasing. However, the catch and catch per unit ofeffort indicate fluctuations, mainly due to large-scale fluctuations in major pelagic fisheries likemackerel and oil sardine. The catch per unit of effort for the country as a whole is not more than5 kg per man-hour.
3. FISHING FLEET
3.1 Fishing craft
It is estimated that there are about 19,000 mechanised marinefishing crafts in India. Thestatewisedistribution of these craft is given in Appendix 3.1.
The majority of marine fishing craft are non-mechanised. Complete figures of these craft are notavailable. Appendix 3.2 gives the statewise figures for these craft under four categories with theexception of the figures for Maharashtra. The figures also refer only to craft owned/shared byfishermen. Salient features of some types of fishing craft in India are given in Appendix 3.3.
Fishing gears
A wide variety of fishing gears is used in India. These include drift/giIInets, traps, lines, fixedbagnets, boat seines, shore seines and trawls. The statewise distribution of fishing gears is shownin Appendix 3.4. These figures do not include Maharashtra and refer only to gear owned/sharedby fishermen. The main craft-gear combinations are indicated in Appendix 3.5.
The operational pattern of some of the main fishing gears ‘is as follows : Two main types ofshore seines and inshore drag nets are employed. The first type consists of a bag and two wings.These are operated along the Orissa, Andhra Pradesh and Tamil Nadu coasts. The other type isthe “Rampan” net operated along the Goa, southern Maharashtra, Karnataka and Malabarcoasts. The method of operation of both types is that one extremity of the net remains on theshore, while the rest of the net is carried out to sea in a boat, paid out in a semi-circular pathand the other extremity brought to another point on the shore. The two ends are then slowlydragged by two parties of men.
Fixed nets are generally rectangular in shape, but vary in size from place to place. They are fixedin the inshore tidal region with stakes or by use of floats and sinkers during low tide periods.The fish coming in with the tide are trapped in the net when the tide recedes.
Bagnets and boat seines are generally conical nets with or without wings. Two catamarans orcanoes operate tha net when the fishes are trapped in the bag portion. The do/ net is a bagnetfixed in the sea by stakes or buoys and is operated in Maharashtra and Gujarat waters.
Gillnets and drift-nets are operated by paying out the net from a boat in the fishing ground withone end of tha net secured to the boat. The boat and the net are then allowed to drift with thecurrent and the tide. Fish are gilled or entangled in the net.
Cast nets are operated by throwing the net fully spread over a collection/shoal of fish whichget trapped within the circumference of the net as it closes due to the weights attached.
Bottom trawling was introduced into India as a commercial gear around ‘1950. There are severalmodes of trawl net operation with varying arrangements to keep the mouth open, but the mostcommon method employed is stern trawling with a pair of other boards. The principle in all
[5 ]
methods is to drag a bag-type net along the sea-floor with two warps of wire-ropes paid out froma winch worked generally by the main engine of the vessel. Many small trawlers, however,operate without winches, using coir or cotton towing ropes and hauling the trawl-net manually.
4. INFRASTRUCTURE AND SERVICE FACILITIES
There are about 1,300 fish landing centres scattered along the Indian coastline. Most centresare open beaches, where basic facilities for landing and disposal of the catch are not available.
The need for providing landing and berthing facilities for fishing vessels was appreciated earlyin the planning for fisheries development and during the second Five-Year Plan, assistance of theFAO was availed of in identifying suitable sites and deciding on the nature of facilities to beprovided.
The initial approach was to provide limited landing and berthing facilities such as a jetty, deepen-ing of the entrance channel, provision of a breakwater, market hall, guide lights, etc. Such facili-ties have already been provided at about 90 sites, the most important of which are Porbander,Mangrol, Veraval, Navabunder and Jaffrabad in Gujarat, Karwar in Karnataka, Ponnani, Balia-patnam, Mopla Bay, Beypore, Azhicode and Vizhinjam in Kerala, Rameswaram, Nagapatnam,Cuddalore and Tuticorin in Tamil Nadu, Kakinada in Andhra Pradesh and Chandipur in Orissa.
With the establishment of the Pre-Investment Survey of Fishing Harbours project at Bangalorein 1968, detailed surveys were undertaken and designs were prepared for the construction oflarge, self-contained fishing harbours, usually with components such as breakwater, navigationlights, dredged channel and basin, jetties, wharves, auction halls, slipways, boat and net repairsheds, public utilities, electricity, water supply, sewerage, drainage, approach roads and back-upspace for fish-based industries, such as ice plants, processing plants, cold storages, etc. On thebasis of preinvestment surveys and evaluation, investment decisions are made and the work ofconstruction entrusted to the various state governments. At major ports, however, the entire workof survey, design and construction of fishing harbours is the responsibility of the major PortTrusts.
The cost of construction of fishing harbours at major ports is met by the Central Government,while the cost of construction of fishing harbours at minor ports is shared between the Centreand the states concerned, presently on an equal basis. The fishing harbours under constructionor completed at both major and minor ports in 1981 are shown in Appendices 4.1 and 4.2.Planwise outlays and expenditure on fishing harbours at major and minor ports are given inAppendix 4.3.
Commencing from the first Five-Year Plan period, construction of ice plants, freezing plants andcold storages was undertaken. The development of these facilities by plan periods is set out inAppendix 4.4. The Statewise distribution of these facilities is shown in Appendix 4.5.
There are 117 registered boatbuilding yards of which 69 construct wooden boats, 35 are equippedfor the construction of large vessels and 13 where FRP boats are constructed. Besides these,there are numerous small boatyards, which are not registered, constructing different types ofindigenous craft and small mechanised boats.
Local capability exists for the construction of wooden vessels up to 14 m and steel vessels up to23 m. Expertise in the construction of larger vessels is in the process of being acquired - aforeign consultant has been engaged to design a large wooden trawler and design and shop-floor drawings have been acquired for indigenous construction of a 23 mshrimp trawler. TheGoa shipyard has been strengthened with assistance from the Government of Norway for theconstruction of large fishing vessels and vessels intended for government departments areunder construction under this programme. A government scheme has been announced underwhich indigenously constructed fishing vessels are eligible for subsidy up to 33% with provisionfor import of components up to 20% of the value of the vessel.
There are 8 manufacturers of marine diesel engines. The firms, makes and horsepower of theengines and the annual licensed manufacturing capacities are given in Appendix 4.6.
[6]
Service stations and workshops providing repair and servicing facilities for fishing boats areavailable at important fishing centres such as Veraval, Porbander, Bulsar in Gujarat; Satpati,Bassein, Bombay, Ratnagiri and Alibag in Maharashtra; Marmugao in Goa; Karwar, Malpe andMangalore in Karnataka; Cannanore, Cochin and Quilon in Kerala; Cuddalore, Nagapatnam,Colachel, Rameswaram, Mandapam and Madras in Tamil Nadu; and Kakinada and Visakha-patnam in Andhra Pradesh. Dry-dock and slipway facilities for underwater maintenance areavailable at Bombay, Goa, Cochin, Mandapam, Madras, Visakhapatnam and Calcutta. Slipwaysare under construction at fishing harbours such as Cochin, Madras, Visakhapatnam, Ratnagiri,Veraval, Mangrol, Porbander, Kakinada and Bhavanapadu.
Most of the indigenous fishing gears are fabricated by the fisherfolk themselves. There are fourpublic sector net making plants with a manufacturing capacity of over 149 tonnes of syntheticwebbing per annum and 20 private sector units with a total capacity of 622 tonnes of syntheticwebbing per annum.
Various fishing vessel components such as reverse-reduction gears, stern gear, power-take offclutches, auxiliary engines and machinery, trawl winches and other equipment such as radiotelephone, refrigeration equipment and life-saving appliances required by the fishing industryare also manufactured in the country.
5. PRODUCTION
Capture fisheries account for the entire marine fish production. The highest marine fish produc-tion of 1.422 million tons was achieved in 1975, after which catches showed a slight decline.This decline is in the traditional sector, while the mechanised sector has been, by and large,maintaining a steady increase, except very recently when this sector was badly affected by theincrease in fuel prices. The total annual production between 1969 and 1980 is shown in Appendix5.1. The composition of the marine fish landings for 1977-80 is given in Appendix 5.6. Appendix5.7 gives a statewise and specieswise breakdown of the marine fish landings for 1980.The patterns and trends in the marine fishery are diagrammatically represented in Appendices5.2 to 5.5.
Besides the marine capture fisheries, there is some production from traditional coastal aquacul-ture. The age-old ‘Bhasa bada’ system of fishery in West Bengal accounts for about 9,000 ha ofimpoundments and a production of 3,000 tons of prawn per annum and the system of trappingand holding in the ‘Pokhali’ paddy fields in Kerala covers about 4,500 ha and produces about4,000 tons per annum of prawn along with other miscellaneous species.
6. HANDLING AND PROCESSING
Traditional fishing craft do not carry ice and the fish caught is kept exposed to sun and wind,Many of the smaller mechanised fishing boats do not have fish holds and the catch is kept onthe deck in baskets. In slightly larger boats fish holds are provided but are not insulated. The useof ice for preservation of fish on board fishing boats is however on the increase. On shore, fishwhich is to be transported to inland places and processing plants is repacked with ice.
Transportation by road is the most preferred mode of transportation for fish but rail transportationis also widely used. Freezing, canning and curing are the important methods employed forprocessing the marine fish catch for human consumption. Fish is also processed for productionof fish-meal, oils, manure and other industrial commodities.
India’s fish catch in 1979 was disposed of as follows: 65.03% by marketing in the wet form,5.65% by freezing, 22.17% by curing, 0.19% by canning, 5.37% by reduction and 1.59% bymiscellaneous processing.
[7 ]
Freezing is mainly carried out for prawns and to a lesser extent for lobster tails, frog legs, cuttlefish and fish. Shrimp is mostly block frozen, fish is blast frozen, while the rest is wrap frozen.36% of the freezing capacity is in Kerala followed by Maharashtra with 20%.
Canning now accounts for an insignificant proportion of fish processing in view of the high cancost and the preference for aluminium cans in the export market. No commercial undertaking hasan aluminium canning line. The only one in the country is the plant used by IFP which is usedprimarily for demonstration and training. The Statewise canning and fish meal manufacturingcapacities are shown in Appendix 6.
Curing as a method of preservation is becoming less and less popular. The demand is mostlyin areas such as the hill country, the plantations, etc., where it is difficult to transport fresh fish.
India introduced compulsory pre-shipment inspection of exportable fish products in 1965.The rules governing the inspection of these products were formulated under the Export (QualityControl and Inspection) Act of 1963. Later at the end of 1977, a system of in-process qualitycontrol for fish and fishery products was introduced. This was slightly modified in 1980 to allowself-inspection in respect of units having the prescribed facilities.
7. DISTRIBUTION AND MARKETING
A recent market survey has estimated that for India as a whole, 53% of the population in metro-politan cities, 50% in urban areas and 56% in rural locations are fish-eating. On an all-India basis15% of the non-fishcooking households have at least one fish-eating member. The percentageof fish-eating population ranges from 13% in Jaipur to 95.6% in rural Kerala. Over 76% of thebuyers purchase fresh fish only once a week, except in Kerala, where daily purchase is thecommon procedure. A preponderant portion (85%) of marine fish purchases are consumed thesame day, while practically the entire balance (14.5%) is consumed the next day. 70% of themarine fish consuming households purchase fish from retail markets in their locality and the restfrom vendors who arrange home delivery. Consumers prefer home delivery and some are willingto/pay extra for this facility, even though the majority of consumers feel that the vendors’ marginsare high. Quality fish like pomfret, seer and mackerel generally move into metropolitan andurban markets, while cheaper fish like sardines go into the rural areas,
The faster pace in the rise of fish prices, compared to all commodities and food items, is anindication that the demand for fish has outstripped supplies. A recent study on ‘Marine fishmarketing in India’ has placed the total aggregated demand for marine fish by 1984-85 at2.9 million tons at an annual compound growth rate of 15%, while the aggregated supply ofmarine fish, including catches from deep-sea fishing, is expected to reach only 1.57 to 1.67million tons by that time, indicating thereby that the gulf between demand and supply wouldfurther widen in the coming years.
In the absence of adequate marketing infrastructure, 97.8% of marine fish consumption is inthe coastal states, whose total population is only 50.6%. As much as 49.4% of the marine fishis consumed in the producing centres and nearby areas (say less than 40 km from the coast)about 45.4% move up to 200 km, while only 4.5% move beyond 200 km. The metropolitan citiesand urban locations account for 40.12% of the marine fish consumption, even though theyrepresent only 23.12% of the total population.
There are six principal types of market intermediaries, viz., auctioneers, purchase commissionagents, wholesalers, retail commission agents, retailers and vendors. Processors are the addi-tional link in this chain for the dry fish trade. However, 16.4% of the total fresh fish is sold directlythrough retailers/vendors, and 70% pass through three intermediaries or less. Extension of loansby auctioneers, wholesalers and purchase commission agents is quite common in all the States.However, 43.5% of the fresh fish is sold by fishermen by auction. Direct sales are at pre-fixedprices. Fishermen’s share of the consumer price is the highest (95%) in the case of direct sales toconsumers and lowest (21.9%) in sales involving the multilocational distribution system.
[8]

Wholesale and retail prices of fish naturally differ from place to place. The price of fish is alsoinfluenced by seasonal availability and demand. Wholesale prices reported by the Directorateof Economics and Statistics of the Ministry of Agriculture on the last Friday in each month fornine months of 1981 are given in Table 7.1.
Table 7.1
Wholesale prices of fish (Rs./quintal) in some important market centres
Market centre Variety Jan. Feb. Mar. April May June July Aug. Sept.
Calcutta Rohu
Bhekti
H i l s a
Bombay Catfish 650 550
Pomfret 2200 1650
Madras Catfish
Prawn
Pomfret
Seer
1600 1300
1400 1400
1700 N.A.
560 570 575 560 570 570 570 N.R. N.R.
800 810 850 850 870 870 870 N.R. N.R.
1000 1200 1200 1200 1200 1200 1300 N.R. N.R.
1300 1300 1310 1300 1300 1300 1200 N.R. N.R.
1600 1600 1600
1500 1500 1500
N.A. N.S. 1400
425 N.A. 1000
1650 1760 1760
1700 1700* 1800* 1800
1500 1500* 1500* 1500
1500 1500 1600 1600
N.A. N.A.
N.A. N.A.
a75 a50
2860 1980
N.A. - Not available; N.S. - No supply; N.R. - Not reported; * - Relates to the previousweek.
Calcutta is the largest market for fish in India. The city has six wholesale markets of which thelargest is the Howrah market which handles about 64% of a total turnover of about 137,000tonnes of fish per annum. During 1974-76, as much as 92-94% of the fish reaching Calcuttamarkets arrived by rail from over 10 states.
Bombay is the next largest market. Unlike Calcutta, Bombay meets the bulk of the fish consumedfrom landings at 20 centres within Greater Bombay, of which Sassoon dock, Kasara Bunderand Versova are the most important. The biggest wholesale market is the Chatrapati Shivajimarket which handles about 50% of the total turnover of fish in Bombay. However, fish is soldin this market only from 6 a.m. to 8 a.m. after which the floor is cleaned and vegetables take theplace of fish. The Sewree dry fish market handles the bulk of the dry fish trade. There are about4000 retailers of fish in Bombay.
Delhi does not have an organised wholesale market, but about 30 wholesale shops operate inthe by-lanes of Urdu Bazaar. According to a 1976 survey, there were 148 retail shops in Delhi.
None of the wholesale markets have proper storage facilities. Improvised stores are used forstoring fish on ice for short periods.
8. EXPORT AND IMPORT
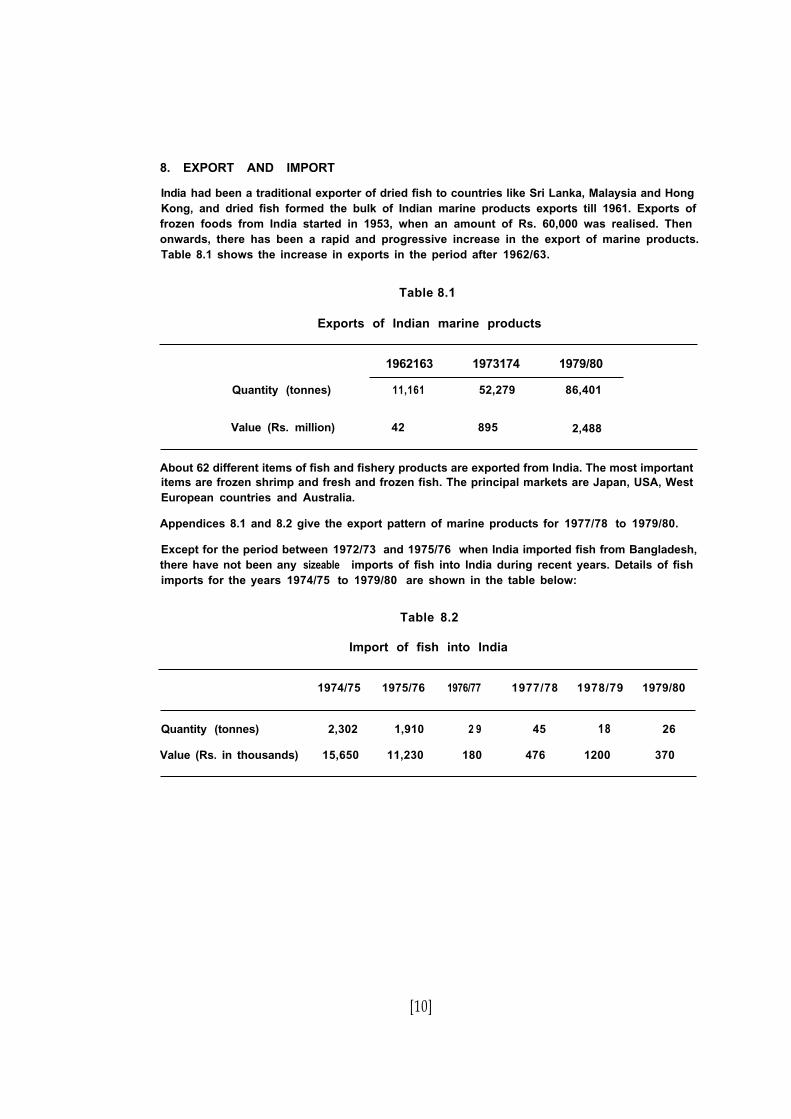
India had been a traditional exporter of dried fish to countries like Sri Lanka, Malaysia and HongKong, and dried fish formed the bulk of Indian marine products exports till 1961. Exports offrozen foods from India started in 1953, when an amount of Rs. 60,000 was realised. Thenonwards, there has been a rapid and progressive increase in the export of marine products.Table 8.1 shows the increase in exports in the period after 1962/63.
Table 8.1
Exports of Indian marine products
1962163 1973174 1979/80
Quantity (tonnes) 11,161 52,279 86,401
Value (Rs. million) 42 895 2,488
About 62 different items of fish and fishery products are exported from India. The most importantitems are frozen shrimp and fresh and frozen fish. The principal markets are Japan, USA, WestEuropean countries and Australia.
Appendices 8.1 and 8.2 give the export pattern of marine products for 1977/78 to 1979/80.
Except for the period between 1972/73 and 1975/76 when India imported fish from Bangladesh,there have not been any sizeable imports of fish into India during recent years. Details of fishimports for the years 1974/75 to 1979/80 are shown in the table below:
Table 8.2
Import of fish into India
1974/75 1975/76 1976/77 1977/78 1978/79 1979/80
Quantity (tonnes) 2,302 1,910 2 9 45 18 26
Value (Rs. in thousands) 15,650 11,230 180 476 1200 370
[10]
9 . COASTAL AQUACULTURE
Coastal aquaculture in India is a promising area of development for increasing fish production,boosting foreign exchange earnings through export of marine products, providing more employ-ment opportunities, raising incomes, and improving the economy of the coastal belt throughrelated economic activities.
Only rough estimates are available about the potential for coastal aquaculture. The immediateprospects are in brackishwater fish and prawn culture while the prospects for mariculture aresubject to technological improvements and considerable changes in the attitudes and foodhabits of the local people.
The practice of trapping and holding fish and prawn is an old tradition in the deep water paddy(Pakhali) fields of Kerala, mostly reclaimed from the backwaters. When the rains stop, the waterin the backwaters and paddy fields turns brackish and no more paddy cultivation is possibleuntil the rains start again and flush out the brackish water. By providing sluice-gates to the paddyfields, the latter are naturally stocked with fish and prawn fry that come with the tides, parti-cularly during the new moon and full moon tides. They grow quickly, foraging for the foodbrought in by the tides and on the hay stumps and filamentous algae available in the paddyfields. Harvesting is done by straining the water during low tides associated with spring andneap tides.
In West Bengal, where the tide is much higher, the saline effect is felt far up in the Sunderbansestuary. Here large areas have been impounded by constructing perimeter dykes forming ‘bheels’.During the high tides, generally from March onwards, water containing prawn and fish seed isdrawn into the bheels. The seed is allowed to grow for a few months and harvesting starts byJuly.
With the boom in the shrimp export trade, farmers started stocking young ones of fast growingshrimp and production increased. Currently about 4,500 ha of paddy fields in Kerala, 9,000 ha ofbheries in West Bengal, and a slightly smaller extent of land in Karnataka are under fish and prawnculture.
Large stretches of land, previously subject to saline ingress, have been brought under paddy byelaborate saline protection works. The whole of Kuttanad in Kerala comes within this category.These saline protection works have to some extent affected the natural fishery, while paddycultivation has not been very successful. With minor modifications, more lucrative use could bemade of such impoundments in Kerala as well as in other states for brackish water fish andprawn culture. Besides, the Rann of Kutch, the Khar lands of Maharashtra, Goa and Karnataka,
, the coastal backwaters of Kerala and Tamil Nadu, the large lakes like Pulicat and Chilka and theestuarine areas of river systems and their adjoining regions, impoundments used for storing seawater for salt-making, etc., are all areas with potential for brackishwater fish/prawn culture.Table 9.1 gives an estimate of the areas available for brackishwater fish culture and the extentof utilisation.
3 [11]
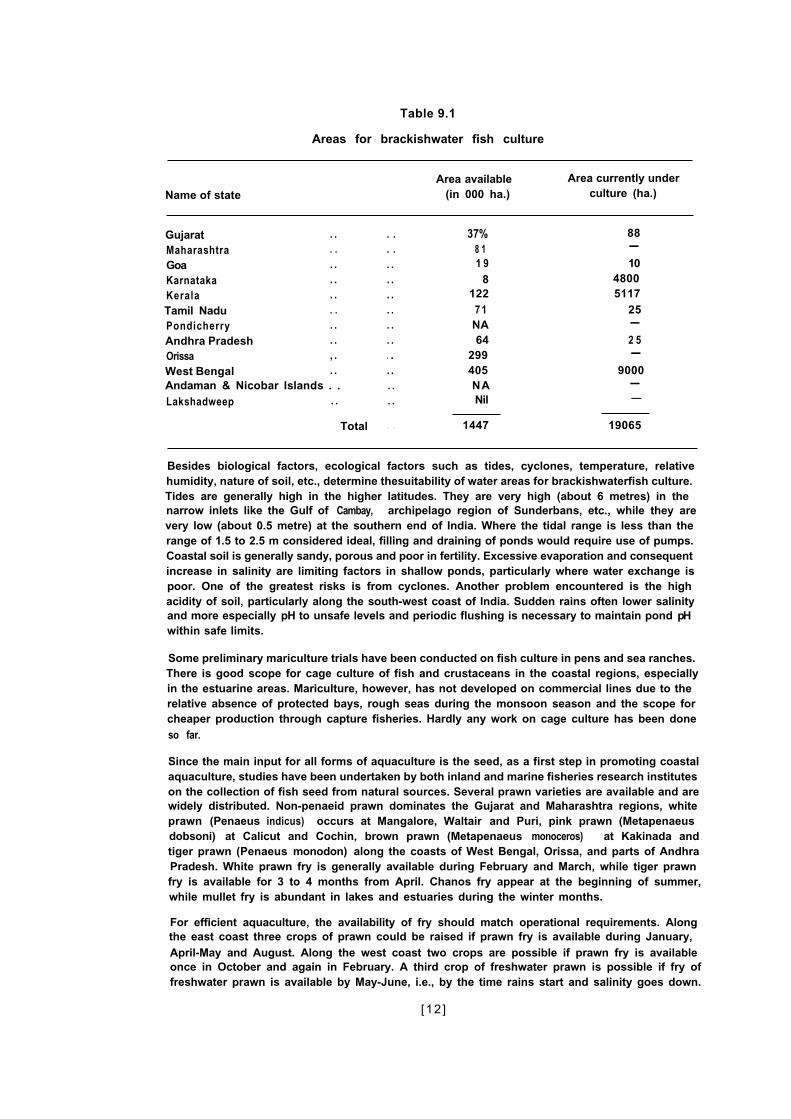
Table 9.1
Areas for brackishwater fish culture
Name of stateArea available
(in 000 ha.)Area currently under
culture (ha.)
Gujarat . .Maharashtra . .Goa . .Karnataka . .Kerala . .Tamil Nadu . .Pondicherry . .Andhra Pradesh . .Orissa , .West Bengal . .Andaman & Nicobar Islands . .Lakshadweep . .
Total
. . 37%
. . 8 1
. . 1 9
. . 8
. . 122
. . 7 1
. . NA
. . 64
. . 299
. . 405. . NA. . Nil
. . 1447 19065
88-
1048005117
25-
2 5-
9000--
Besides biological factors, ecological factors such as tides, cyclones, temperature, relativehumidity, nature of soil, etc., determine thesuitability of water areas for brackishwaterfish culture.Tides are generally high in the higher latitudes. They are very high (about 6 metres) in thenarrow inlets like the Gulf of Cambay, archipelago region of Sunderbans, etc., while they arevery low (about 0.5 metre) at the southern end of India. Where the tidal range is less than therange of 1.5 to 2.5 m considered ideal, filling and draining of ponds would require use of pumps.Coastal soil is generally sandy, porous and poor in fertility. Excessive evaporation and consequentincrease in salinity are limiting factors in shallow ponds, particularly where water exchange ispoor. One of the greatest risks is from cyclones. Another problem encountered is the highacidity of soil, particularly along the south-west coast of India. Sudden rains often lower salinityand more especially pH to unsafe levels and periodic flushing is necessary to maintain pond pHwithin safe limits.
Some preliminary mariculture trials have been conducted on fish culture in pens and sea ranches.There is good scope for cage culture of fish and crustaceans in the coastal regions, especiallyin the estuarine areas. Mariculture, however, has not developed on commercial lines due to therelative absence of protected bays, rough seas during the monsoon season and the scope forcheaper production through capture fisheries. Hardly any work on cage culture has been doneso far.
Since the main input for all forms of aquaculture is the seed, as a first step in promoting coastalaquaculture, studies have been undertaken by both inland and marine fisheries research instituteson the collection of fish seed from natural sources. Several prawn varieties are available and arewidely distributed. Non-penaeid prawn dominates the Gujarat and Maharashtra regions, whiteprawn (Penaeus indicus) occurs at Mangalore, Waltair and Puri, pink prawn (Metapenaeusdobsoni) at Calicut and Cochin, brown prawn (Metapenaeus monoceros) at Kakinada andtiger prawn (Penaeus monodon) along the coasts of West Bengal, Orissa, and parts of AndhraPradesh. White prawn fry is generally available during February and March, while tiger prawnfry is available for 3 to 4 months from April. Chanos fry appear at the beginning of summer,while mullet fry is abundant in lakes and estuaries during the winter months.
For efficient aquaculture, the availability of fry should match operational requirements. Alongthe east coast three crops of prawn could be raised if prawn fry is available during January,April-May and August. Along the west coast two crops are possible if prawn fry is availableonce in October and again in February. A third crop of freshwater prawn is possible if fry offreshwater prawn is available by May-June, i.e., by the time rains start and salinity goes down.
[12 ]
Commercial fish and prawn seed farms do not exist. The technologies of maturation and breeding- of induced breeding of fish through hypophysation and of prawn through unilateral eye-stalk ablation -are known, but still require a great deal of refinement. Many research anddevelopment agencies, including some in the private sector, are engaged in this work.
Available data on the rate of fish/prawn production achieved in experimental coastal aquacultureunder the All India Coordinated Research Project on brackishwater fish culture in various fish/prawn farms, mostly through stocking of the young ones of fast-growing species collected fromtheir natural environments, are summarised in Appendix 9.1.
The culture of both brown and green mussel on ropes suspended from floating rafts in bays andopen seas has been carried out by the Central Marine Fisheries Research institute.
Production at the rate of 10-15 kg per metre length of rope has been obtained in 5-6 months.While this high production is indicative of good potential, many related problems have to besolved. The most important problem is the development of an economically priced raft thatcan take the load and withstand the monsoon surges. Secondly, mussel meat is still a cheappoor man’s food in India. Demand is limited both within India and outside. Production throughbreeding and artificial spat collection, use of ropes and rafts, etc., would not be economicallyviable unless suitable remunerative markets are tapped.
Coastal aquaculture poses the question as to who should be the allottees of low-lying coastalland which is largely Government-owned at present. While the larger farmers and industrialentrepreneurs are better equipped for larger scale development of coastal aquaculture, bothfinancially and due to their capacity to absorb modern technology, the landless labourers andfisherfolk, etc., also have competing claims. Only the Government of Andhra Pradesh has comeout with a policy of long-term leases of such areas to small, medium and larger farmers.
10. SOCIO-ECONOMICS
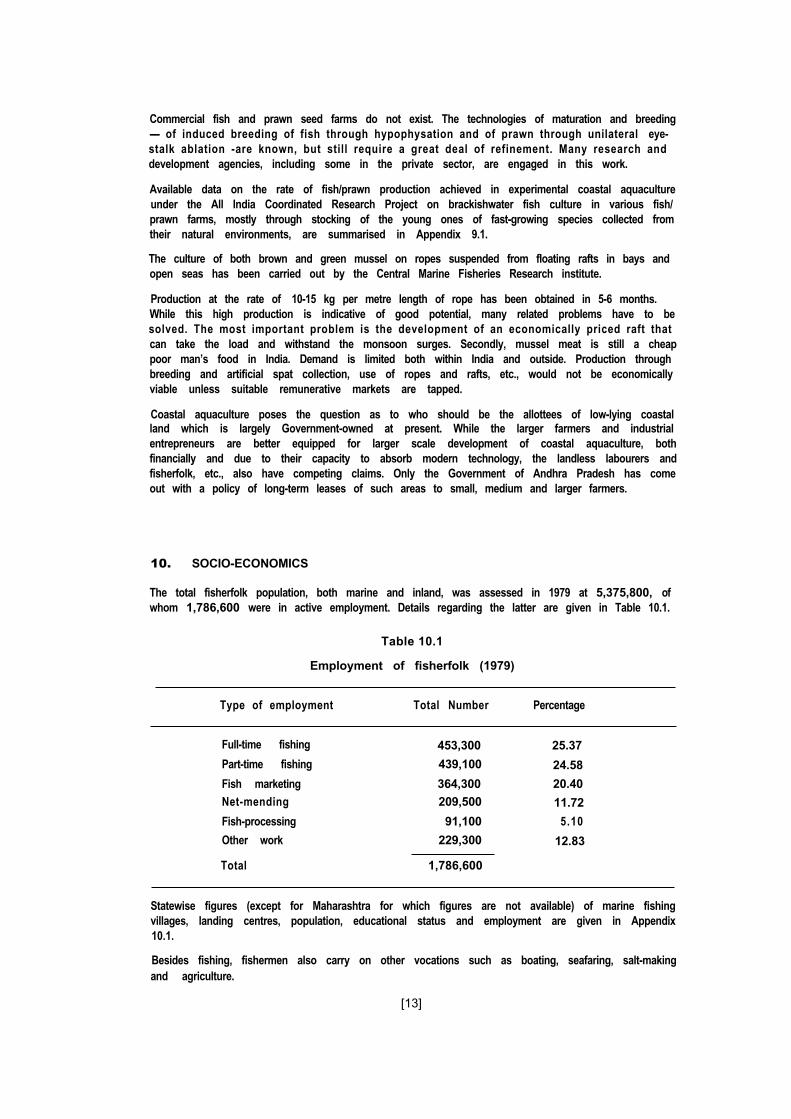
The total fisherfolk population, both marine and inland, was assessed in 1979 at 5,375,800, ofwhom 1,786,600 were in active employment. Details regarding the latter are given in Table 10.1.
Table 10.1
Employment of fisherfolk (1979)
Type of employment Total Number Percentage
Full-time fishing 453,300 25.37
Part-time fishing 439,100 24.58
Fish marketing 364,300 20.40Net-mending 209,500 11.72
Fish-processing 91,100 5.10
Other work 229,300 12.83
Total 1,786,600
Statewise figures (except for Maharashtra for which figures are not available) of marine fishingvillages, landing centres, population, educational status and employment are given in Appendix10.1.
Besides fishing, fishermen also carry on other vocations such as boating, seafaring, salt-makingand agriculture.
[13]
The fisherfolk of India belong to all the major religions of the country, viz., Hinduism, Islam andChristianity. In each state they belong to several different castes. The castes often have a socialorganisation of their own, with their own chiefs who exercise great authority over certain socio-economic aspects of the life of the fisherfolk.
The average size of a fisherfolk family varies between 4.7 and 8.6 in different states.
Although the majority of them are poor, there has been considerable improvement in the livingconditions of fisherfolk in recent years. Many fishermen have organised themselves to formwelfare or self-help organisations in several states.
Fisherwomen play a very important part in the economic as well as the social and domesticlife of fisherfolk. They take an active part in net-making, net-mending and sale of fish in thenearby markets, besides attending to domestic work.
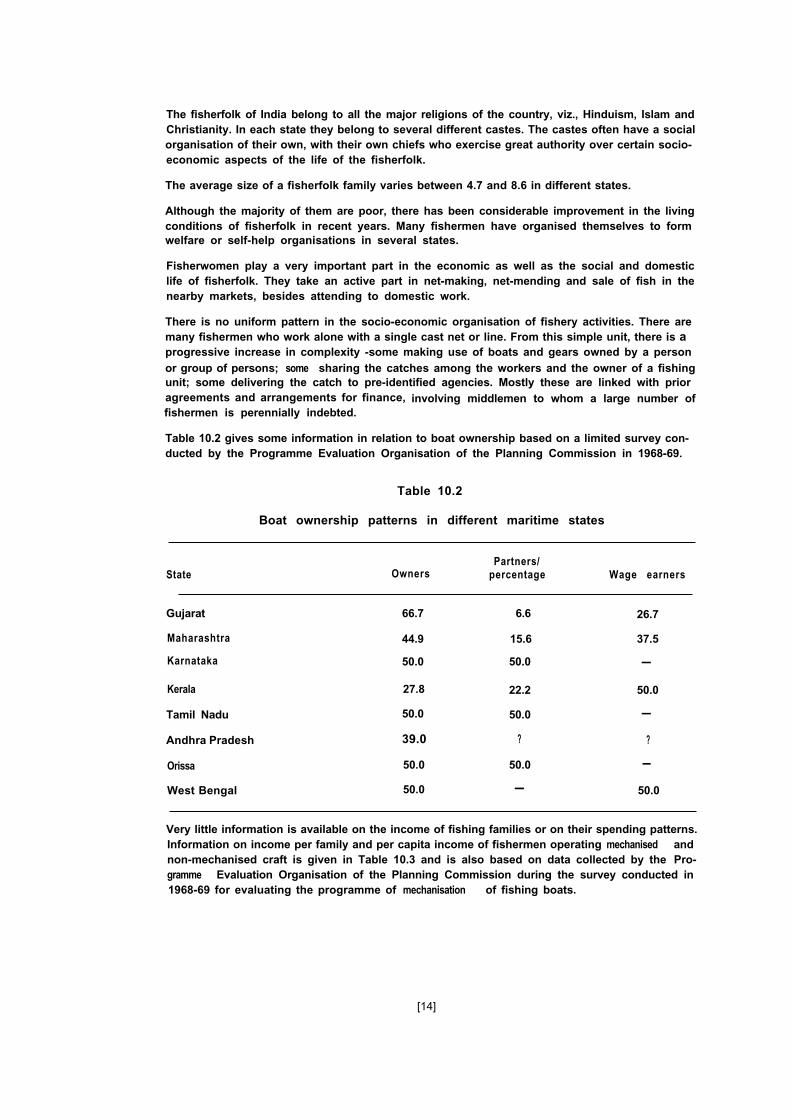
There is no uniform pattern in the socio-economic organisation of fishery activities. There aremany fishermen who work alone with a single cast net or line. From this simple unit, there is aprogressive increase in complexity -some making use of boats and gears owned by a personor group of persons; some sharing the catches among the workers and the owner of a fishingunit; some delivering the catch to pre-identified agencies. Mostly these are linked with prioragreements and arrangements for finance, involving middlemen to whom a large number offishermen is perennially indebted.
Table 10.2 gives some information in relation to boat ownership based on a limited survey con-ducted by the Programme Evaluation Organisation of the Planning Commission in 1968-69.
Table 10.2
Boat ownership patterns in different maritime states
State
Gujarat
Maharashtra
Karnataka
Kerala
Owners
66.7
44.9
50.0
27.8
Partners/percentage
6.6
15.6
50.0
22.2
Wage earners
26.7
37.5
-
50.0
Tamil Nadu 50.0 50.0 -
Andhra Pradesh 39.0 ? ?
Orissa 50.0 50.0 -
West Bengal 50.0 - 50.0
Very little information is available on the income of fishing families or on their spending patterns.Information on income per family and per capita income of fishermen operating mechanised andnon-mechanised craft is given in Table 10.3 and is also based on data collected by the Pro-gramme Evaluation Organisation of the Planning Commission during the survey conducted in1968-69 for evaluating the programme of mechanisation of fishing boats.
[14]
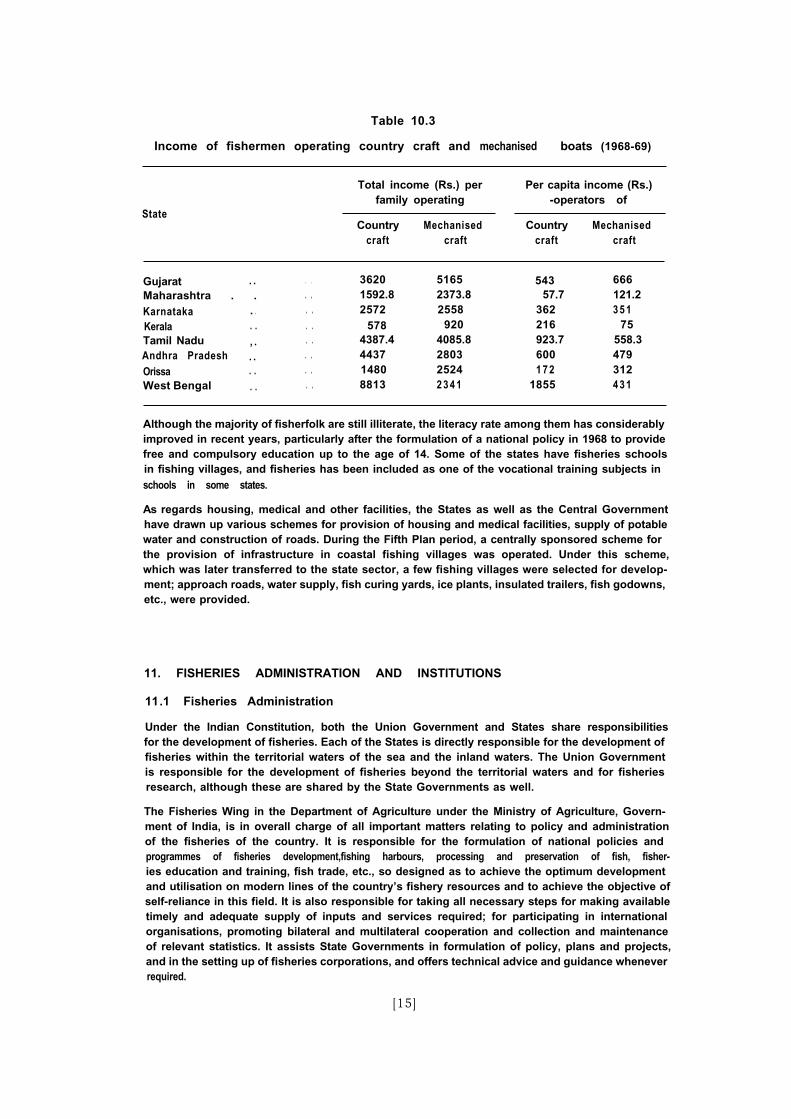
Table 10.3
Income of fishermen operating country craft and mechanised boats (1968-69)
State
Total income (Rs.) per Per capita income (Rs.)family operating -operators of
Country Mechanised Country Mechanisedcraft craft craft craft
Gujarat . .Maharashtra . .Karnataka . .Kerala . .Tamil Nadu , .Andhra Pradesh . .Orissa . .West Bengal . .
. . 3620 5165
. . 1592.8 2373.8. . 2572 2558. . 578 920. . 4387.4 4085.8. . 4437 2803. . 1480 2524. . 8813 2 3 4 1
543 66657.7 121.2
362 3 5 1216 75923.7 558.3600 4791 7 2 312
1855 4 3 1
Although the majority of fisherfolk are still illiterate, the literacy rate among them has considerablyimproved in recent years, particularly after the formulation of a national policy in 1968 to providefree and compulsory education up to the age of 14. Some of the states have fisheries schoolsin fishing villages, and fisheries has been included as one of the vocational training subjects inschools in some states.
As regards housing, medical and other facilities, the States as well as the Central Governmenthave drawn up various schemes for provision of housing and medical facilities, supply of potablewater and construction of roads. During the Fifth Plan period, a centrally sponsored scheme forthe provision of infrastructure in coastal fishing villages was operated. Under this scheme,which was later transferred to the state sector, a few fishing villages were selected for develop-ment; approach roads, water supply, fish curing yards, ice plants, insulated trailers, fish godowns,etc., were provided.
11. FISHERIES ADMINISTRATION AND INSTITUTIONS
11 .1 Fisheries Administration
Under the Indian Constitution, both the Union Government and States share responsibilitiesfor the development of fisheries. Each of the States is directly responsible for the development offisheries within the territorial waters of the sea and the inland waters. The Union Governmentis responsible for the development of fisheries beyond the territorial waters and for fisheriesresearch, although these are shared by the State Governments as well.
The Fisheries Wing in the Department of Agriculture under the Ministry of Agriculture, Govern-ment of India, is in overall charge of all important matters relating to policy and administrationof the fisheries of the country. It is responsible for the formulation of national policies andprogrammes of fisheries development,fishing harbours, processing and preservation of fish, fisher-ies education and training, fish trade, etc., so designed as to achieve the optimum developmentand utilisation on modern lines of the country’s fishery resources and to achieve the objective ofself-reliance in this field. It is also responsible for taking all necessary steps for making availabletimely and adequate supply of inputs and services required; for participating in internationalorganisations, promoting bilateral and multilateral cooperation and collection and maintenanceof relevant statistics. It assists State Governments in formulation of policy, plans and projects,and in the setting up of fisheries corporations, and offers technical advice and guidance wheneverrequired.
[15]
Apart from the Department of Agriculture at the Union Government level, the Ministry of commerce also looks after certain functions concerning fisheries. These relate to export promotion.developing the production base, and quality control.
Fisheries education and research are the responsibilities of the Indian Council of AgriculturalResearch (ICAR), a registered society under the Department of Agricultural Research andEducation (DARE). DARE is under the Ministry of Agriculture and provides ICAR with therequisite linkages with central and state governments who are the agencies to extend the tech-nology evolved at the research institutes to the field.
In order to plan, coordinate and develop indigenous capability in oceanographic research, anOceanic Science Technology Agency (OSTA) has been established. OSTA, which was underthe Union Department of Science and Technology, has now been transferred to the new Depart-ment of Ocean Development.
The Union Minister for Agriculture is in overall charge of fisheries in the country. He is assistedby the Minister of State. The Secretary (Agriculture), who is the official head of the Departmentof Agriculture and the Additional Secretary (Relief and Fisheries) hold charge of fisheries. TheJoint Secretary is the head of the Fisheries Division in the Department of Agriculture. On theadministrative side, he is assisted by a Deputy Secretary and an Under-Secretary. On the technicalside, the Joint Commissioner was formerly the principal adviser to the Government on all mattersconcerned with fisheries development. He has now been replaced by the Fisheries DevelopmentCommissioner. The latter is assisted by Deputy Commissioners and Assistant Commissioners.The Union Minister for Agriculture who has overall charge of the Department of AgriculturalResearch and Education (DARE) is also the President of the Indian Council of AgriculturalResearch (ICAR). In all matters of policy and administration relating to the Department, he isassisted by a Minister of State. The Director General, ICAR, who is also Secretary to DARE, isthe principal Executive Officer and Vice-President of ICAR. On the administrative side, he isassisted by the Secretary of the Council, who is a Joint Secretary to the Government of India,and Additional Secretaries and Under-Secretaries. On the technical side, the Director General isassisted by a Deputy Director General (Animal Sciences), an Assistant Director General (Fisheries)and a Scientist (Fisheries). The organisational set-up of the fisheries administration in the UnionGovernment is shown in Appendix 11.1.
There is considerable diversity in the organisation of fisheries departments in the different states.In general, one of the ministers of the State Government is in overall charge of fisheries. TheSecretary in charge of fisheries is the principal secretariat officer. The Directorates of Fisheriesare headed by the Director of Fisheries and are responsible for the planning and implementationof fisheries programmes. The Director of Fisheries may be either a technical officer or an officerfrom the Indian Administrative Service. He is assisted by Joint Directors, Deputy Directors,Assistant Directors and Superintendents of Fisheries, District Fishery Officers and Wardens, whoare in charge of districts or particular programmes. Under these district officers, Inspectors ofFisheries and other field officers function.
ln the Union Territories, the fisheries programmes are administered by Directorates of Fisheries.
11.2 Institutes
A chart showing the nodal organisations and the specialised institutes under their control isfound in Appendix 11.2.
11.2.1 Research and Development Institutes
11.2.1 .1 Central Marine Fisheries Research Institute (CMFRI)
The Institute was established in 1947 by the then Ministry of Food and Agriculture. It came underthe control of ICAR in 1967. The headquarters of the Institute is at Cochin and it has a regionalcentre at Mandapam Camp in Tamil Nadu. Besides these, there are 11 research centres and 29field centres on both coasts. Field experimental stations are located at Narakkal, Kovalam,Tuticorin, Mandapam, Vizhinjam and Calicut.
[16]
The overall objectives of the Institute are to conduct short-term and long-term multi-disciplinaryresearches on the marine capture and culture fisheries of the country. It thus seeks to provideresearch support for the rational exploitation, conservation and management of marine andbrackishwater resources, and development support for the growth and stability of the industrial,artisanal, and culture fisheries. Its functions include transfer of technology, dissemination ofinformation and education, training and extension.
The scientific work of the Institute is organised under nine divisions, viz., Fishery ResourcesAssessment; Pelagic Fisheries; Demersal Fisheries; Crustacean Fisheries; Molluscan Fisheries;Fishery Environment Management; Physiology, Nutrition and Pathology; Extension and FisheryEconomics; Library and Documentation ; and under 7 other activities, viz., Inter-divisional andInstitutional projects; Sponsored Projects; UNDP/FAO Centre of Advanced Studies in Mari-culture; Training Centre and Krishi Vigyan Kendra; Training Programmes; Operational ResearchProject; and Lab-to-Land Programme.
The Institute has 960 staff members, including a scientific staff of 193, technical staff of 364,administrative staff of 141 and supporting staff of 262. During 1979-80 the Institute had abudget of Rs. 20.1 million.
The Institute’s major activities in achieving the various objectives inter alia include survey of theExclusive Economic Zone for assessing the fishery resources; estimation of marine fish produc-tion and monitoring of the fishery resources in the traditional grounds in relation to fishing effort;studies on primary and secondary production; assessment of potential yield and MSY levels ofimportant fisheries; fisheries information and forecasting ; environmental monitoring ; develop-ment and standardisation of mariculture technologies for increasing fish and shellfish productionby upgrading research and providing post-graduate research and education facilities; extensioneducation facilities in mariculture; extension education programme; training programmes andconsultancy services.
11.2.1.2 Central Institute of Fisheries Technology (CIFJ)
CIFT was established in 1957 with its headquarters at Cochin and is now under the IndianCouncil of Agricultural Research. Research centres of the institute function at Calicut (Kerala),Panaji (Goa), Bombay (Maharashtra), Veraval (Gujarat), Burla (Orissa), Kakinada (AndhraPradesh) and Madras (Tamil Nadu).
The aims of CIFT are to develop improved fishing techniques, gear, craft and implements; todevelop improved and new technology for the optimum and economic utilisation of fish catch ;to develop technology for economic utilisation of wastes from the fishery industry and also fishand shellfish which do not have a ready market for human consumption; to popularise theresearch results; to provide a forum for feedback to the Institute on technical problems and toconduct short-term refresher training courses in the improved technology evolved.
The Institute is organised into six divisions- craft; gear; processing and packaging; bio-chemistry, nutrition and microbiology; engineering ; and extension, information and statistics.
11.2.1.3 Central Inland Fisheries Research Institute (CIFRI)
The Institute was established in 1947 at Calcutta, under the then Ministry of Food and Agri-culture, Government of India. The administrative control of the Institute was taken over by theICAR in 1967. The headquarters of the Institute is at Barrackpore near Calcutta.
The main objective of the Institute is to elucidate the scientific principles which can be appliedfor full utilisation of all available inland waters of the country for maximising fish production.This objective entails evolving sound fish husbandry techniques; acquiring understanding ofthe biology of food fishes; conducting investigations on the hydrology and ecology of differentwaters; performing research on population dynamics of fish in natural waters, such as rivers,lakes, reservoirs, estuaries, etc. ; formulating artificial feeds and evolving feeding techniques;and developing fishery management techniques relating to both fresh and brackishwaterenvironments.
[17]

The Institute presently has 37 centres spread across the country. It has a total staff of 857 con-sisting of 206 scientific, 120 technical and 531 non-technical and supporting staff. In 1980/81the Institute had a budget provision of Rs. 17.6 million.
The research work currently done at CIFRI pertains to the following: seed production: bundhbreeding, induced breeding of fish, prawn and frog; rearing of spawn; culture investigationand allied topics; fish culture in running water and in recirculatory filtering pond systems, coldwater fish and prawn culture, cage culture, culture systems integrating fish, livestock andagriculture; culture of carp, hilsa, air-breathing fish, other catfish, etc. ; fish genetics and nutrition,fish health, weed control, farm designing, etc.; economic investigations; fishery management;resource investigations; and ancillary projects such as energy flow and radiotracer techniquesin aquatic ecosystems, adaptive research in fish culture and fisheries extension.
In addition to the research activities, state government employees are trained through KrishiVigyan Kendra and the Teachers Training Centre. The Institute also supplies technical informa-tion on inland fisheries.
11.2.1.4 National Institute of Oceanography (N/O)
The National Institute of Oceanography was established in 1966 under the Council of Scientificand Industrial Research (CSIR). The headquarters of the institute is at Panaji in Goa and it hasthree regional centres at Visakhapatnam, Cochin and Bombay. The institute is engaged instudies of the seas around India with the objective of making proper and judicious use of theirresources.
The institute is organised in six divisions. Research on 35 projects and 36 sponsored projects arein progress at the institute. Important projects relating to fisheries include physical and chemicaloceanography; protection of the marine environment and monitoring of pollutants along theIndian coast; characteristics of estuarine regions of major Indian rivers; survey of biologicalresources: coastal aquaculture etc.
The institute has 350 staff members. It had a budget provision of Rs. 22.346 million during1980-81.
11.2.1.5 Integrated Fisheries Project (IFP)
Until 1973 this was known as the Indo-Norwegian Project. It was started in 1952 as an areadevelopment project with the objective of uplifting the fishing communities of Neendakara andSaktikulangara villages in Kerala State.
During the first phase between 1952 and 1963, the project established in the project area aboatbuilding yard, a workshop, a training centre, an ice-cum-freezing plant, a health centre anda pipe factory for protected water supply and assisted in the all-round development of thesevillages. At the end of the first phase, these establishments were handed over to the Governmentof Kerala.
The second phase was started in 1963 with Cochin as headquarters. The project extendedNeendakara-type fishery development activities to Mandapam in Tamil Nadu, Cannanore inKerala and Karwar in Karnataka. Exploratory and experimental deep sea fishing was also takenup from Cochin, large vessels were acquired, and related facilities such as slipway, workshop,fish landing jetty, processing and marketing facilities established.
At the end of the second phase in 1972, the activities at Mandapam, Cannanore and Karwarwere vested in the respective state fisheries departments, while the project activities at Cochincontinued as a Central Government project under the name Integrated Fisheries Project.
The project now carries out a marine fishery demonstration programme of an integrated nature.It provides training in refrigeration, processing, and purse seining and extends sea and workshopqualifying time facilities to CIFNET trainees. The details of the training courses are shown inTable 11.2.1 .5.1.
[ 18 ]
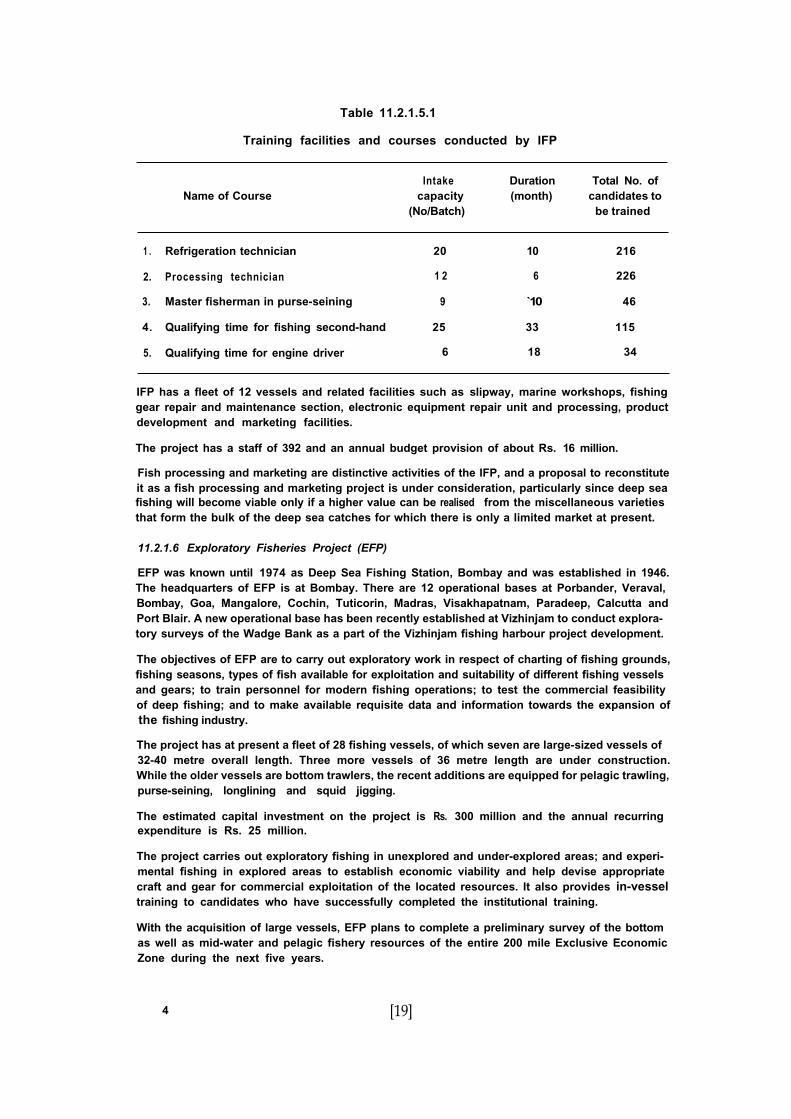
Table 11.2.1.5.1
Training facilities and courses conducted by IFP
Name of CourseIntake
capacity(No/Batch)
Duration(month)
Total No. ofcandidates to
be trained
1 . Refrigeration technician 20 10 216
2. Processing technician 1 2 6 226
3. Master fisherman in purse-seining 9 1̀0 46
4. Qualifying time for fishing second-hand 25 33 115
5. Qualifying time for engine driver 6 18 34
IFP has a fleet of 12 vessels and related facilities such as slipway, marine workshops, fishinggear repair and maintenance section, electronic equipment repair unit and processing, productdevelopment and marketing facilities.
The project has a staff of 392 and an annual budget provision of about Rs. 16 million.
Fish processing and marketing are distinctive activities of the IFP, and a proposal to reconstituteit as a fish processing and marketing project is under consideration, particularly since deep seafishing will become viable only if a higher value can be realised from the miscellaneous varietiesthat form the bulk of the deep sea catches for which there is only a limited market at present.
11.2.1.6 Exploratory Fisheries Project (EFP)
EFP was known until 1974 as Deep Sea Fishing Station, Bombay and was established in 1946.The headquarters of EFP is at Bombay. There are 12 operational bases at Porbander, Veraval,Bombay, Goa, Mangalore, Cochin, Tuticorin, Madras, Visakhapatnam, Paradeep, Calcutta andPort Blair. A new operational base has been recently established at Vizhinjam to conduct explora-tory surveys of the Wadge Bank as a part of the Vizhinjam fishing harbour project development.
The objectives of EFP are to carry out exploratory work in respect of charting of fishing grounds,fishing seasons, types of fish available for exploitation and suitability of different fishing vesselsand gears; to train personnel for modern fishing operations; to test the commercial feasibilityof deep fishing; and to make available requisite data and information towards the expansion ofthe fishing industry.
The project has at present a fleet of 28 fishing vessels, of which seven are large-sized vessels of32-40 metre overall length. Three more vessels of 36 metre length are under construction.While the older vessels are bottom trawlers, the recent additions are equipped for pelagic trawling,purse-seining, longlining and squid jigging.
The estimated capital investment on the project is Rs. 300 million and the annual recurringexpenditure is Rs. 25 million.
The project carries out exploratory fishing in unexplored and under-explored areas; and experi-mental fishing in explored areas to establish economic viability and help devise appropriatecraft and gear for commercial exploitation of the located resources. It also provides in-vesseltraining to candidates who have successfully completed the institutional training.
With the acquisition of large vessels, EFP plans to complete a preliminary survey of the bottomas well as mid-water and pelagic fishery resources of the entire 200 mile Exclusive EconomicZone during the next five years.
4 [19]
11.2.1.7 Pre-Investment Survey of Fishing Harbours (PISFH)
PISFH was established with UNDP special fund assistance in 1968, initially for a period offive years. SIDA provided funding for two more years. Thereafter it has been a national projectfully funded by the Government of India. The objective of PISFH is to conduct economic andengineering investigations to locate prospective sites for fishing harbours and to prepare projectreports.
There are 58 members on the staff of the project and the annual expenditure is in the region ofRs. 1 million.
The main activities of PISFH cover engineering and economic studies, and the preparation offeasibility reports to facilitate investment decisions. It also provides construction designs, drawingsand specifications for approved harbour projects, monitors progress in construction and assistsstates, as required, in the preparation of tender documents, etc. In recent years, the project hasalso been providing assistance to states and other agencies in the design of brackishwater fishfarms.
A proposal is under consideration to enlarge the scope of PISFH and make it undertake feasibilitystudies of brackishwater fish farms in addition to fishing harbours.
11.2.1.8 Marine Products Export Development Authority (MPEDA)
MPEDA is the successor to the Marine Products Export Promotion Council set up in the Ministryof Commerce in 1961. It was establishea in 1972 by an Act of Parliament (Act No. 13 of 1972).MPEDA has its headquarters at Cochin, regional offices at Calcutta, Bhubaneswar, Cochin andBombay and trade promotion offices at Tokyo and New Delhi.
MPEDA is a statutory authority consisting of 30 members, viz., a Chairman, a Director, membersof Parliament, representatives of the Union Ministries of Agriculture, Finance, Foreign Trade,Industry, Shipping and Transport and of maritime states/union territories; owners of fishingvessels, representatives of marine product processing, storage, transport research and otherinterests. The Chairman, Director and Secretary are appointed by the Government. The mainobjective of the authority is to develop the marine products industry with special reference toexports, MPEDA has a staff strength of 300 and an annual budget of Rs. 20 million, of whichabout Rs. 18 million is earmarked for developmental activities.
The activities of MPEDA broadly relate to development, market and product research, andpublicity and propaganda.
The development strategy is aimed at increasing value realisation for existing products, increasingproduction through adoption of appropriate capture and culture practices, diversifying theproduct range and improving quality.
In order to improve the quality of fish products, MPEDA has prescribed standards for fishingvessels, peeling sheds, frog cutting centres, processing plants and transportation. All processingplants are encouraged to have their own mini-laboratories with qualified personnel, the cost ofwhich is subsidised by the MPEDA. Subsidies are also given for improving peeling sheds,putting up fish landing platforms and purchase of insulated fish boxes. Extension programmesare carried out in prawn farming and in educating workers in the hygienic handling of sea food.Overseas market surveys are conducted and commodity notes and country profiles circulated.Market intelligence in the form of ruling prices in major markets, statistics of fish landing inproducing countries, cold storage holdings, etc., are mailed on a weekly basis. Trade promotionoffices are maintained at New Delhi and Tokyo for effective market intelligence and promotion.The research and product development wing transfers processing and packaging technologyfrom research institutions to the industry.
New and value-added products are given preference for exhibition in trade fairs. Subsidies aregiven for air-freighting samples and where possible assistance is given in respect of overseassales promotion visits. MPEDA organises the Indian Sea Food Trade Fair biennially, and alsoregularly participates in major food exhibitions all over the world.
[20]

11.2.2 Training Institutes
11.2.2.1 Central Institute of Fisheries Education (C/FE)
CIFE was established at Bombay in July 1961 under the Ministry of Agriculture. Its administra-tion was transferred to ICAR in 1979. The objective of the Institute is to train fisheries officers inservice in various states in the country by means of a comprehensive course of fisheries educa-tion aimed at equipping them with the technical know-how necessary for implementing fisheriesdevelopment projects. A limited number of private candidates and nominees from the industryand foreign countries are also admitted.
Under the Sixth Five-Year Plan, the Institute will have seven departments, viz., ocean manage-ment and marine fisheries; fishing technology; processing and quality control; inland fisheries;aquaculture; economics and administration ; and project planning and evaluation.
CIFE has well equipped class rooms, a laboratory, farm and hostel facilities for students. It hasfour fishery training vessels of 38’, 50’. 55’ and 120’ respectively, equipped for effective instruc-tion in marine fishing techniques, fishery biology and oceanography. There are two field stationsin Andhra Pradesh, one for brackishwater fish culture (at Kakinada) and the other for freshwater fish culture (at Balabhadrapuram) at which students receive field training in all aspectsof fish culture work.
The Institute offers a two-year post-graduate diploma course in fishery science. The syllabuscovers fisheries biology (inland and marine), fish processing technology, fishing technology,fisheries administration and economics, fisheries statistics, marketing and cooperation.
On successful completion of the course, the institute awards an Associate Diploma which isrecognised as an alternative qualification to an M.Sc. degree in biological sciences of Indianuniversities for purposes of recruitment to posts of fisheries officers and other higher posts. Atotal of 625 students would have received training at the institute by 1981 - 82.
The institute has 269 staff members and its budget provision during 1981 - 82 is Rs. 9.72 million.The Sixth Plan outlay is in the order of Rs. 49.00 million.
The institute’s primary concern is the training of senior level fishery officers. It also has a numberof subordinate establishments for providing junior level training courses, details of which aregiven below :
Inland Fisheries Training Unit, Barrackpore
Started in 1947, the unit offers a one-year certificate course in inland fisheries development andadministration to candidates sponsored by states, private candidates and nominees from foreigncountries. The intake capacity is 40 per year. The entry qualification to the course is a B.Sc.degree with zoology as one of the subjects. A total of 989 students would have received trainingat this unit by 1981-82.
Regional Training Centre for Inland Fisheries Operatives, Agra
Established in 1967 to impart organised training in inland fish culture practices, the centre offers ag-month certificate course to nominees of state governments as well as private candidates. Theintake capacity is 40 per batch. The entry qualification is the secondary school leaving certificate.The Centre has so far trained 702 persons.
Central Fisheries Extension Training Centre, Hyderabad
The Centre was set up in 1973 for imparting specialised training in extension techniques in fishculture at the post-graduate level, mainly for in-service personnel from different states in thecountry. The duration of the course is 10 months; intake capacity is 25 for each session. Thiscentre has so far trained 162 persons.
CIFE also conducts periodic ad hoc training courses on specialised subjects and conductsworkshops either independently or in collaboration with other agencies.
[21]

11.2.2.2 Central institute of Fisheries Nautical and Engineering Training (CIFNEJ)
The institute, known until 1977 as Central Institute of Fisheries Operatives, was established atCochin in 1963. A unit of this institute was established at Madras in 7968 and at Visakhapatnamin 1981. The purpose of the institute is to train various categories of fisheries operatives to manand provide supporting services for the operation of deep sea fishing vessels.
The teaching facilities of the institute are organised under five divisions -seamanship andnavigation; marine engineering; craft and gear; boatbuilding; vessel maintenance and opera-tion. The institute has well equipped workshops and laboratories. It has nine training vessels,six of which are over 28 metres long. They are equipped for stern trawling, pair trawling, purse-seining and longlining. The institute runs trainees’ hostels at Cochin, Madras and Visakhapatnam.
The institute has a total staff of 302.
The institute provides institutional and practical training to candidates intending to appear forvarious competency certificate examinations-skipper, engineer, fishing second hand andengine driver - conducted by the Mercantile Marine Department. It also trains boatbuilders,shore mechanics, gear technicians, radio telephone operators and teachers for fishermen trainingcentres. The details of these courses are set out in Table 11.2.2.2.1.
Table 11.2.2.2.1
Duration and intake of training courses formarine fisheries operatives at CIFNET
Course Duration(months)
Intake capacity per course
Cochin Madras Visakhapatnam
1. Fishing second-hand 1 5 40 40 202. Engine driver 1 5 40 40 203. Boatbuilding foreman 1 5 20 - -
4. Shore mechanics 1 2 20 20 -5. Gear technicians 9 20 20 -
6. Radio telephone operators 9 1 5 1 5 -7. Teachers training 6 10 - -
A limited number of places is allotted to foreign candidates.
The institute provides, through arrangement with other projects under the Government of India,as well as in its own vessels and workshop, the requisite practical training for those who havecompleted institutional training to sit for Fishing Second-Hand and Engine Driver Competencyexaminations. Once qualified at these examinations, a further term of practical and ad hocinstitutional training is provided for them to qualify as skippers and engineers of fishing vessels.In order to meet periodic shortage of certificated personnel, crash programmes of training arearranged for ex-naval personnel as well as mechanical engineering diploma holders.
11.2.2.3 Marine Fishermen Training Centres
Fishermen Training Centres are set up by the States for the training of fishermen in the operationof small mechanised fishing boats. There are at present 30 such training centres - 4 in Orissa,2 in Gujarat, 4 each in Maharashtra and Karnataka, 5 in Kerala, 6 in Tamil Nadu, 2 in AndhraPradesh and one each in the Union Territories of Lakshadweep, Goa and Andaman and NicobarIslands.
The training given at these centres includes basic lessons in navigation,engines,gear construc-tion and maintenance and different aspects of fishing.
[22]
The duration of training varies from state to state. The total intake capacity of the 30 trainingcentres is about 1,000 trainees at a time. Candidates of age between 17 and 30 years andbona fide fishermen with at least five years’ experience in fishing are admitted to the course.
After successful completion of the training, the trainees in groups of four and five are assistedto acquire small mechanised boats through loan and subsidy arrangements so as to afford theman opportunity for self-employment. About 10,000 persons have so far been trained at thesetraining centres.
11.2.3 Others
11.2.3.1 College of Fisheries, Mangalore
The University of Agricultural Sciences, Karnataka, established the country’s first college offisheries at Mangalore in 1969.
This institute offers a four-year bachelor’s degree programme in fishery science (B.F.Sc.), a2-year master’s degree programme in fishery science (M.F.Sc.), and a 3-year doctorate (Ph.D.)programme. The master’s degree programme is in industrial fishery technology and fishproduction and management, while the Ph.D. programme is in fishery biology, aquaculture,aquatic biology, fishery oceanography and fish processing technology.
The entry qualification for the B.F.Sc. programme is a pass in the pre-university course (science)or its equivalent. The intake capacity is 40 students per year, with 339% set apart, at the dis-posal of the Indian Council of Agricultural Research, for allotment to other states and countries.Up to 15 students are admitted for each of the two M.F.Sc. programmes, while generally about2 are admitted for the Ph.D. programme in each subject.
Besides the regular courses, the college periodically conducts short-term training programmeson various aspects of fishery science for the benefit of technical personnel of the KarnatakaDepartment of Fisheries. Further, a 3-month fish processing technicians’ course is periodicallyorganised for the benefit of technicians employed in the fish processing industry, as and whenrequested by the Marine Products Export Development Authority.
In addition to professional and extension education in fisheries, the college also conductsextensive research on certain aspects of fishery science.
11.2.3.2 University of Cochin, Department of Industrial Fisheries
In 1977, the University of Cochin started a post-graduate course leading to the M.Sc. degree inIndustrial Fisheries.
This 4-semester course has an intake capacity of 15 students per batch. The syllabus includesfisheries resources, fishing craft and gear technology, fish processing technology, fisherieseconomics and fisheries management.
12 . INDUSTRY ORGANISATIONS
12.1 Fisheries corporations
With a view to providing the flexibility necessary for undertaking activities of a promotionalnature, it was decided at the end of the Third Plan to establish fisheries corporations.
Accordingly the Central Fisheries Corporation was established in 1965 at Calcutta. State FisheriesCorporations were established in practically all the maritime states and in some inland states.
The corporations in inland states are recent developments, most of them being fish seed corpora-tions. The Assam Fisheries Corporation, however, concentrates on Bheel development.
[23]
The fisheries corporations in marine states mostly concentrate on marine fisheries, undertakingactivities such as deep sea fishing, processing, marketing, boatbuilding, net-making, ice making,etc.
The corporations are registered under the Companies Act. The organisationalset-up of a corpora-tion consists of a Chairman, Board of Directors, a Managing Director and executive officers.The Managing Director is the principal executive officer.
The Central Fisheries Corporation, Orissa Fisheries Corporation and the Maharashtra FisheriesCorporation are under liquidation although the last mentioned was revived for a while. In Orissa,a new corporation, viz., Orissa Maritime and Chilka Area Development Corporation, has beenformed in place of the former Orissa Fisheries Corporation ; in Kerala, a Kerala Fishermen WelfareCorporation and a Kerala Inland Fisheries Corporation have been established in addition to theearlier Kerala Fisheries Corporation ; in Gujarat, Gujarat Agro-Marine Products, a subsidiaryof the Gujarat Agro Industries Corporation, has taken the place of a fisheries corporation.
The financial performance of most corporations has been disappointing.
12.2 Fisheries cooperatives
The fisheries cooperative system in the country was organised with a view to providing assistanceto the actual producers, the fishermen. Fisheries cooperatives are societies governed by aseparate set of rules to channel government assistance on the basis of principles of self-helpand management.
The fisheries cooperative structure in India is broadly three-tiered. It consists of a primarycooperative for a village or group of villages; a district or regional federation; and a state-levelapex body constituted as a cooperative federation.
The primary fishery cooperative is expected to function as a multi-purpose agency providingcredit, supplies (including domestic necessities), elementary guidance and supervision of theutilisation of loans, assembly of the fish-catch and its transportation to marketing centres.Member education and extension programmes are supplementary functions expected to beundertaken by the primary society in collaboration with other concerned agencies. In practice,however, primary fisheries cooperatives are mainly engaged in the provision of loans to themember fishermen. Some cooperatives have organised the provision of supplies and only avery few societies are engaged in activities such as construction of fishing boats and processing.
The regional federation is the district-level organisation which is expected to act as a usefuland conveniently located intermediate agency between the apex body and the primary coopera-tive. It is expected to have an important role in marketing and, for that purpose, is located in thelarger towns. Most of the other functions of the federation are similar to those of the primarycooperative but on a larger scale and catering to a wider area in providing assistance to themember-primary cooperatives.
The apex federation is the state-level organisation and is expected to provide support to theprimary and district-level cooperatives. Through its location, size, capacity to command resourcesof men, material and market, it is expected to provide leadership to the entire movement.
In 1977-78, 72 fisheries federations had annual sales of Rs. 66.8 million excluding Rs. 3.9million worth of exports. The eight apex societies in Andhra, Gujarat, Maharashtra, Kerala, Goa,Bihar, Pondicherry, and Andaman and Nicobar Islands handled business worth Rs. 47.1 million.
The overall performance of fisheries cooperatives has been poor and insufficient to make anysignificant impact on the lives of fisherfolk. Many of the cooperatives are operating at a lossand a large number are dormant. Their membership, share capital base and turnover are alsooften too weak and inadequate for viable operations. An indication of the status and performanceof primary fisheries cooperative societies during 1976-77 is given in Tables 12.2.1 and 12.2.2.
[24]
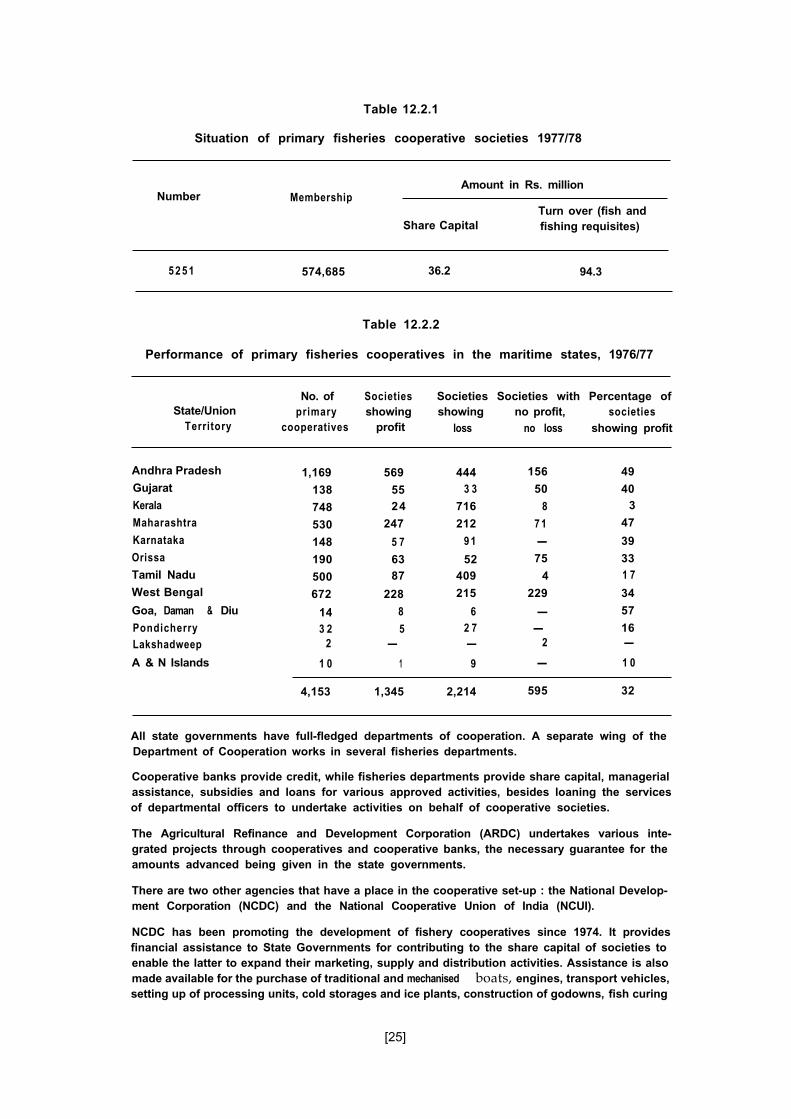
Table 12.2.1
Situation of primary fisheries cooperative societies 1977/78
Number MembershipAmount in Rs. million
Turn over (fish andShare Capital fishing requisites)
5 2 5 1 574,685 36.2 94.3
Table 12.2.2
Performance of primary fisheries cooperatives in the maritime states, 1976/77
State/UnionTerritory
No. of Societies Societies Societies with Percentage ofprimary showing showing no profit, societies
cooperatives profit loss no loss showing profit
Andhra Pradesh
Gujarat
Kerala
Maharashtra
Karnataka
Orissa
Tamil Nadu
West Bengal
Goa, Daman & Diu
PondicherryLakshadweep
A & N Islands
1,169 569 444 156 49
138 55 3 3 50 40
748 24 716 8 3
530 247 212 7 1 47
148 5 7 9 1 - 39
190 63 52 75 33
500 87 409 4 1 7
672 228 215 229 34
14 8 6 - 57
3 2 5 2 7 - 162 - - 2 -
1 0 1 9 - 1 0
4,153 1,345 2,214 595 32
All state governments have full-fledged departments of cooperation. A separate wing of theDepartment of Cooperation works in several fisheries departments.
Cooperative banks provide credit, while fisheries departments provide share capital, managerialassistance, subsidies and loans for various approved activities, besides loaning the servicesof departmental officers to undertake activities on behalf of cooperative societies.
The Agricultural Refinance and Development Corporation (ARDC) undertakes various inte-grated projects through cooperatives and cooperative banks, the necessary guarantee for theamounts advanced being given in the state governments.
There are two other agencies that have a place in the cooperative set-up : the National Develop-ment Corporation (NCDC) and the National Cooperative Union of India (NCUI).
NCDC has been promoting the development of fishery cooperatives since 1974. It providesfinancial assistance to State Governments for contributing to the share capital of societies toenable the latter to expand their marketing, supply and distribution activities. Assistance is alsomade available for the purchase of traditional and mechanised boats, engines, transport vehicles,setting up of processing units, cold storages and ice plants, construction of godowns, fish curing
[25]
yards, boatbuilding yards; establishment of service and repair centres; establishment of technicaland promotional cells; preparation of project reports for the establishment of processing units;undertaking of feasibility studies; specialised training of technical and managerial personnel offishery cooperatives. Up to 31 March, 1981, the NCDC had sanctioned financial assistance ofRs. 77.4 million and the Government of India had provided Rs. 13.6 million under a centralsector scheme to various fishery cooperatives.
NCUI is a body which is essentially intended for education of member fishery cooperatives andfunctionaries. With the aid of a sum of Rs. 2.7 million provided by NCDC, this body is implement-ing a three-year educational scheme since 1977/78 at nine locations, viz., Kozhikode,Tuticorin,Pondicherry, Contai, Berhampur, Kuluba, Kakinada, Mangalore and Valsad.
13. GOVERNMENT POLICY
Government policy in terms of objectives and strategy has been indicated as follows in theSixth Five-Year Plan (1980/81-1 984/85) document.
The objectives are :
- significant step-up in the rate of growth of the economy, the promotion of efficiency in thecase of resources and improved productivity;
- strengthening the impulses of modernisation for the achievement of economic and techno-logical self-reliance;
- progressive reduction in the incidence of poverty and unemployment;
- speedy development of indigenous sources of energy, with proper emphasis on conservationand efficiency in energy use;
- improving the quality of life of the people in general with special reference to the economicallyand socially handicapped population through a minimum needs programme whose coverageis so designed as to ensure that all parts of the country attain within a prescribed periodnationally accepted standards;
- strengthening the redistributable bias of the public policies in favour of the poor, contributingto a reduction in inequalities of income and wealth;
- progressive reduction in regional inequalities in the pace of development and in the diffusionof technological benefits;
- promoting policies for controlling the growth of population through voluntary acceptance ofthe small family norm ;
- bringing about harmony between the short and the long term goals of development bypromoting the protection and improvement of ecological and environmental assets; and
- promoting the active involvement of all sections of the people in the process of developmentthrough appropriate education, communication and institutional strategies.
The strategy adopted in the Sixth Plan consists essentially in moving simultaneously to strengthenthe infrastructure for both agriculture and industry so as to create conditions for an acceleratedgrowth in investment, output and exports and to provide, through special programmes designedfor the purpose, increased opportunitiesforemployment,speciaIly inruralareasand theunorganisedsector and meet the minimum basic needs of the people. Stress is laid on dealing with inter-related problems through a systems approach rather than in separate compartments; on greatermanagement efficiency and intensive monitoring in all sectors and active involvement of thepeople in formulating specific schemes for the development of the local level and in securingtheir speedy and effective implementation. The attack on the problem of poverty is most effectiveonly in the conditions of an expanding economy. Since growth by itself may not, however,
[26]
suffice, other programmes and policies will need to be adopted with the specific aim of improvingthe living conditions of the masses and to bring about a reduction in inequalities of income andwealth. The scheme of the Sixth Plan outlays provides for specific allocations for such pro-grammes.
In the fisheries sector, during the Sixth Five-Year Plan period, the main thrust in marine fisherieswill be to increase production through fish culture, deep-sea fishing with special reference tomanagement of the Exclusive Economic Zone and diversification of fishing with emphasis onconservation of heavily exploited marine fishery resources on the one hand and the exploitationof new resources on the other.
On the deep-sea fishing front, one of the main limiting factors had been the problems in respectof arrangementsforfinancing and acquisition of vessels. Soft term financing through the ShippingDevelopment Fund Committee has been revived during the Sixth Plan period.
The introduction of mechanised boats will be on a selective basis; while they will be introducedfreely in areas with a low density of fishing effort, they will be restricted in areas already having alarge fishing fleet. Efforts will be made to diversify fishing methods by techniques such as purse-seining, longlining, squid-jigging, etc., to tap resources which are at present not being fullyharvested.
Fiscal and administrative measures are to be taken to encourage fishermen cooperatives andsmall entrepreneurs to enter deep-sea fishing. The acquisition and operation of fishery vessels isbeing monitored with a view to removing various constraints and bottlenecks.
Protecting and promoting the interests of small fishermen by demarcating fishing zones and bydevelopmental measures is one of the main planks of fisheries policy.
Since increase in marine fish production will be mainly from unconventional varieties for whichpresently there is little market demand, it has been proposed that IPF should be reorganisedas a fish processing and marketing project.
EFP and CIFNET are to be revamped to improve the quality of survey as well as training. Theactivities of PISFH are to be enlarged to cover survey, design and preparation of project proposalsfor large brackishwater farms in addition to its present functions relating to fishing harbours.
Besides completing fishing harbours under construction, additional fishing harbours will betaken up at major and minor ports. A new programme during the Sixth Plan will be provisionof landing and berthing facilities even for non-mechanised boats.
Since lack of adequate production of fish seed is one of the main constraints in inland fisheries,a national programme for ‘fish seed’ development has been proposed.
It has been proposed that a number of pilot projects relating to reservoir fisheries beundertaken.
The inland fisheries projects in West Bengal, Orissa, Madhya Pradesh, Uttar Pradesh and Biharand the World Bank-assisted integrated marine fisheries projects in Gujarat and Andhra Pradeshwill be implemented during the Plan period besides smaller projects with bilateral assistance.
5 [27]
14. DEVELOPMENT PLANS
Planned development of fisheries commenced from the first Five-Year Plan, which started in1951-52. Outlays and expenditure for fisheries development in the respective plan periods isshown in Appendix 14.1.
Programmes and schemes drawn up for the Sixth Five-Year Plan (1980/81-1984/85) are acontinuation of the developmental activities in the various fields with special emphasis onsectors to which adequate attention had not been given.
The various plan schemes are formulated after a critical review of the progress achieved by pro-grammes during the previous years and the difficulties/bottlenecks encountered in implementa-tion. Each of the plan schemes includes objectives, physical programmes, targets and otherobjectives as may be relevant to its subject with due regard to the national objectives of self-reliance, export promotion, more equitable distribution of income and wealth, generation ofmore employment and improvement in the social and economic conditions of the weaker sectionsof society.
Based on functional pattern and administrative nature, the various fisheries plans are classifiedunder three categories-central sector schemes, centrally sponsored schemes and state sectorschemes.
The central sector schemes cover activities which are either the direct responsibility of theCentral Government or in which the Centre has direct promotional interest.
The centrally sponsored schemes are schemes sanctioned by the Central Government to assistthe states in key areas where central assistance becomes necessary. These schemes are adminis-tered by state governments.
The state sector schemes are formulated, financed and administered by the states themselves.
A list of central and centrally sponsored schemes, along with outlays in the Sixth Plan is givenin Appendix 14.2. Appendix 14.3 shows the statewise outlays for fisheries. An analysis of thestate plan outlay by broad heads of development is given in Appendix 14.4.
India is actively associated with international endeavours in fostering cooperation for fisheriesdevelopment. She is the recipient of international assistance for fisheries under multilateraland bilateral programmes; and of her own also gives cooperation and assistance in fields whereit can be beneficial to other countries.
Among past assistance programmes, TCM Aid, Norwegian project assistance and UNDP/SFassistance are important. Norway continues assistance by way of commodity aid, assistancefor fishing vessel construction, strengthening of facilities at Goa Shipyard and a small areadevelopment project at Balasore (Orissa). Holland, Denmark, and Japan provided aid for theacquisition of exploratory and training vessels. Denmark, Sweden and the United Kingdom haveshown interest in undertaking area development projects in Karnataka, Andhra Pradesh andOrissa. A Danish proposal for an area development project at Tadri (Karnataka) is nearingfinalisation.
India has also obtained World Bank assistance for two integrated marine fisheries projects, onein Gujarat and the other in Andhra Pradesh and for an inland fisheries project covering WestBengal, Bihar, Orissa, Uttar Pradesh and Madhya Pradesh.
A list of aid projects is given in Appendix 14.5.
Under the Indian Technical and Economic Cooperation (ITEC) programme, assistance is extendedto other countries and training facilities are provided at various fisheries training institutes/centres. India also subscribes to the concept of Technical Cooperation among DevelopingCountries (TCDC).
15. BIBLIOGRAPHY
B. N. Chopra. 1951
- 1 9 7 0
- 1971
- 1973
E. G. Silas, S. K. Dharmarajanand K. Rangarajan. 1976
Anon. 1976
R. S. Saksena, T. A. Mammen,M. Devidas Menon & N. P. Bhakta,1976
P. C. George, B. T. Antony Rajaand K. C. George. 1977
- 1 9 7 8
T. A. Mammen, D.A. S. Gnanadoss,George Varghese & P. K. Eapen,1978
Anon.
Anon. 1980
Anon. 1980
Handbook of Indian Fisheries, prepared for the ThirdMeeting of the lndo-Pacific Fisheries Council, Madras,February 1951.
Proceedings of the Symposium on Development ofDeep-Sea Fishing sponsored by Govt. of India, Ministryof Food and Agriculture (Department of Agriculture),New Delhi.
Evaluation of the Programme of Mechanisation of FishingBoats. State Reports. Programme Evaluation Organisa-tion, Planning Commission, Government of India.
Proceedings of the Symposium on Living Resourcesof the Seas around India. Special publication of theCentral Marine Fisheries Research Institute, Cochin 11.
Exploited Marine Fishery Resources of India : A synopticsurvey with comments on potential resources. Cent.Mar. Fish Res. lnstt. Bulletin 27.
Report of the National Commission on Agriculture,Part VIII : Fisheries. Government of India, Ministry ofAgriculture and irrigation, New Delhi.
Report of the Technical Team on Development ofFisheries in Andaman & Nicobar Islands.
Fishery Resources of the Indian Economic Zone.Souvenir issued on the occasion of the silver jubileecelebrations of the Integrated Fisheries Project, Cochin,India, October 7977.
Report of the Working Group on Fisheries for Formula-tion of Five-Year Plan 1978-83. Ministry of Agricultureand Irrigation (Department of Agriculture, New Delhi).
Report of the Working Group on Development ofFisheries in the Lakshadweep Islands.
Summary of Report on Cruise of M/T Muraena in theNorth-West Coast of India. Sea Fisheries Institute,Gdynia, Poland; Govt. of India, Ministry of Agriculture(in press).
India, Oceanographic Investigations along the South-West Coast of India (1976-78). A report prepared forPelagic Fishery Investigations on the South-west Coast,Phase II-Project. FAO of the UN, Rome FI: DP/IND/75/038, Field Document 5.
Proceedings of the First National Symposium on ShrimpFarming, Bombay, 16-I 8 August, 1978. Marine ProductsExport Development Authority, Cochin.
[29]
E. G. Silas, K. Alagiriswamy.1980
Country Status Report on India, Indo-Pacific FisheriesCouncil, 19th Session, Section III Symposium onDevelopment and Management of Small-Scale Fisheries,pp. 19-1 36.
Anon. 1980
- 1981
- 1981
E. H. Nichols. 1981
- 1981 Marine Products Export Review 1980-81. MarineProducts Export Development Authority, Cochin. Mimeo.
- 1981 Statistics of Marine Exports 1979. Ibid.
K. M. Joseph. 1981 Report on the Marine Fishery Resources of India, Part I :Resources of the West Coast of India. M. VisveswarayaIndustrial Research and Development Centre. MSS.
Anon. 1981
- 1981
- 1981
- 1981
A Note on Indian Sea Food Industry- The role ofMPEDA in its development. Mimeo.
Sixth Five-Year Plan - 1980-85. Planning Commission,New Delhi.
Proceedings of the Seminar on the role of Small-ScaleFisheries and Coastal Aquaculture, Central MarineFisheries Research Institute, Cochin 682018.
Possibilities of Technical Cooperation between Develop-ing Countries (T.C.D.C.) in Fisheries. Bay of BengalProgramme Development of Small-Scale Fisheries.
Master Plan for Development of Fishery Harbours. /bid.
Handbook of Fisheries Statistics, Department of Agri-culture, New Delhi.
Annual Report 1980-81, Department of Agriculture,Ministry of Agriculture and irrigation, New Delhi.
Marine Fish Marketing in India Vol. II-VIII. CentreforManagement in Agriculture, Indian Institute of Manage-ment, Ahmedabad. Mimeo.
[30]
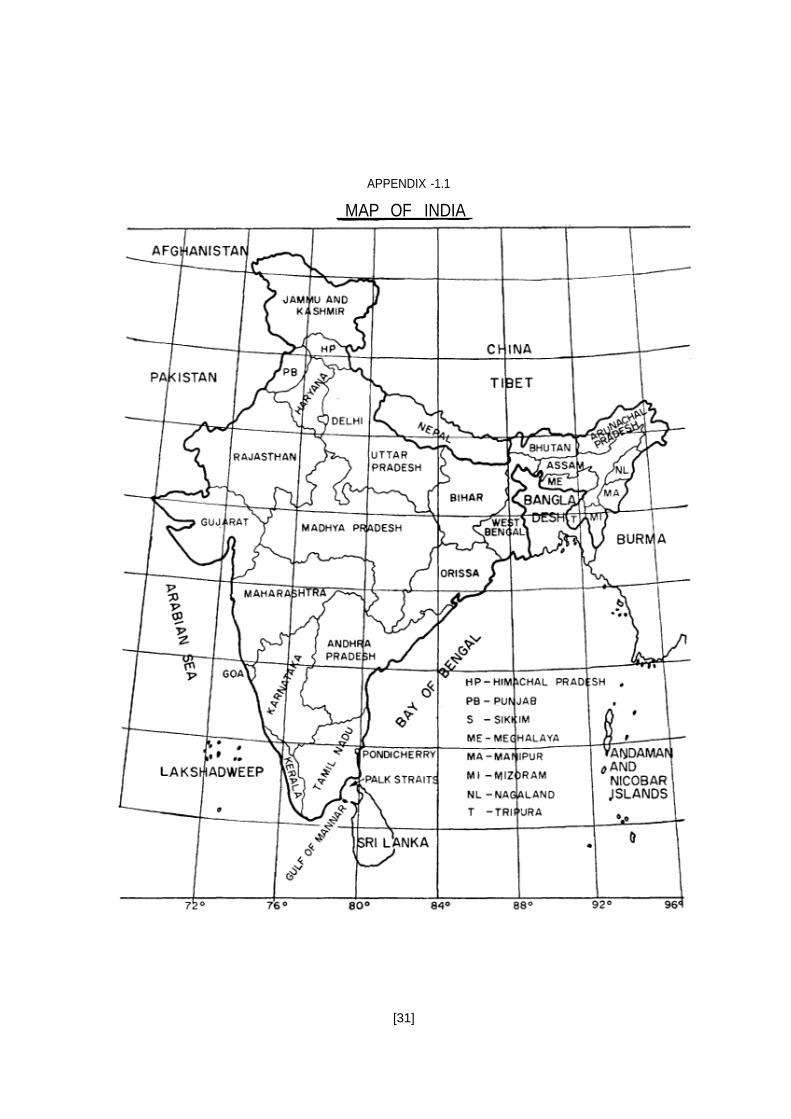
APPENDIX -1.1
[31]
MAP OF INDIA
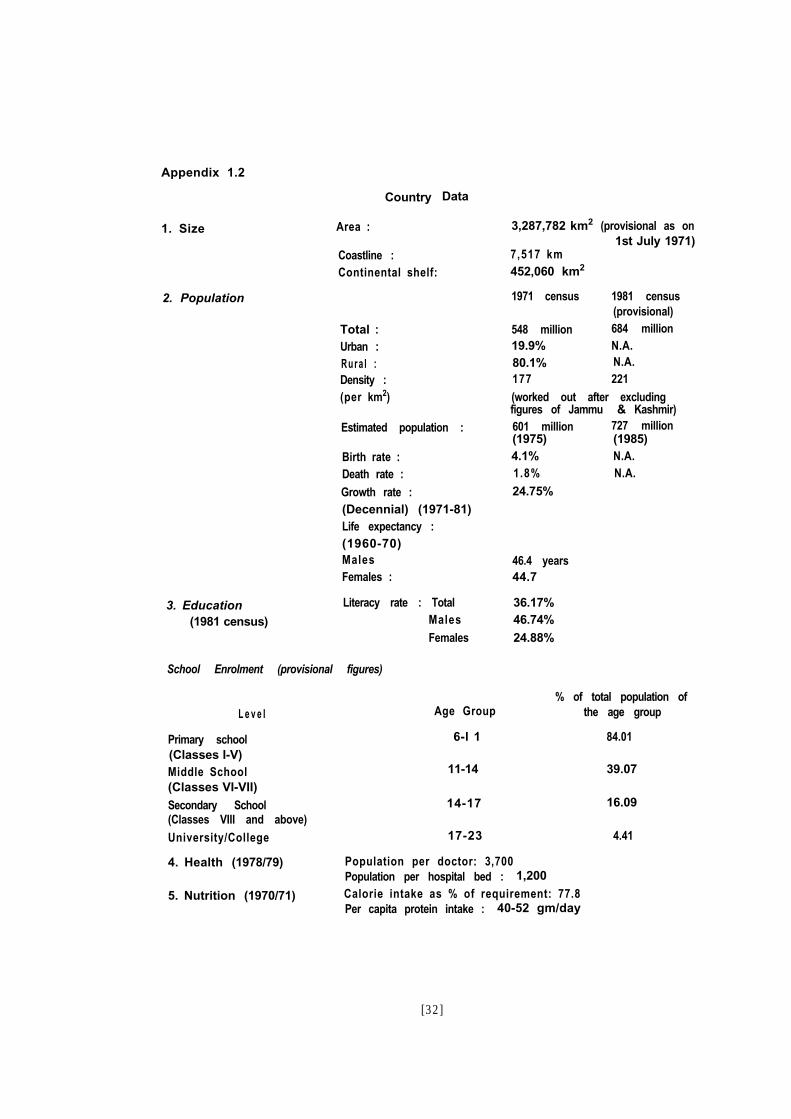
Appendix 1.2
1. Size
Country
Area :
Coastline :Continental shelf:
2. Population
Total :Urban :Rura l :Density :(per km2)
Estimated population :
Birth rate :Death rate :Growth rate :(Decennial) (1971-81)Life expectancy :(1960-70)MalesFemales :
1971 census 1981 census(provisional)
548 million 684 million19.9% N.A.80.1% N.A.177 221(worked out after excludingfigures of Jammu & Kashmir)601 million 727 million(1975) (1985)4.1% N.A.1.8% N.A.24.75%
46.4 years44.7
3. Education(1981 census)
Literacy rate : Total 36.17%Males 46.74%Females 24.88%
Data
3,287,782 km2 (provisional as on
7,517 km1st July 1971)
School Enrolment (provisional figures)
L e v e l
Primary school(Classes I-V)Middle School(Classes VI-VII)Secondary School(Classes VIII and above)University/College
Age Group
6-l 1
11-14
14-17
17-23
452,060 km2
% of total population ofthe age group
84.01
39.07
16.09
4.41
4. Health (1978/79)
5. Nutrition (1970/71)
Population per doctor: 3,700Population per hospital bed : 1,200Calorie intake as % of requirement: 77.8Per capita protein intake : 40-52 gm/day
[32]
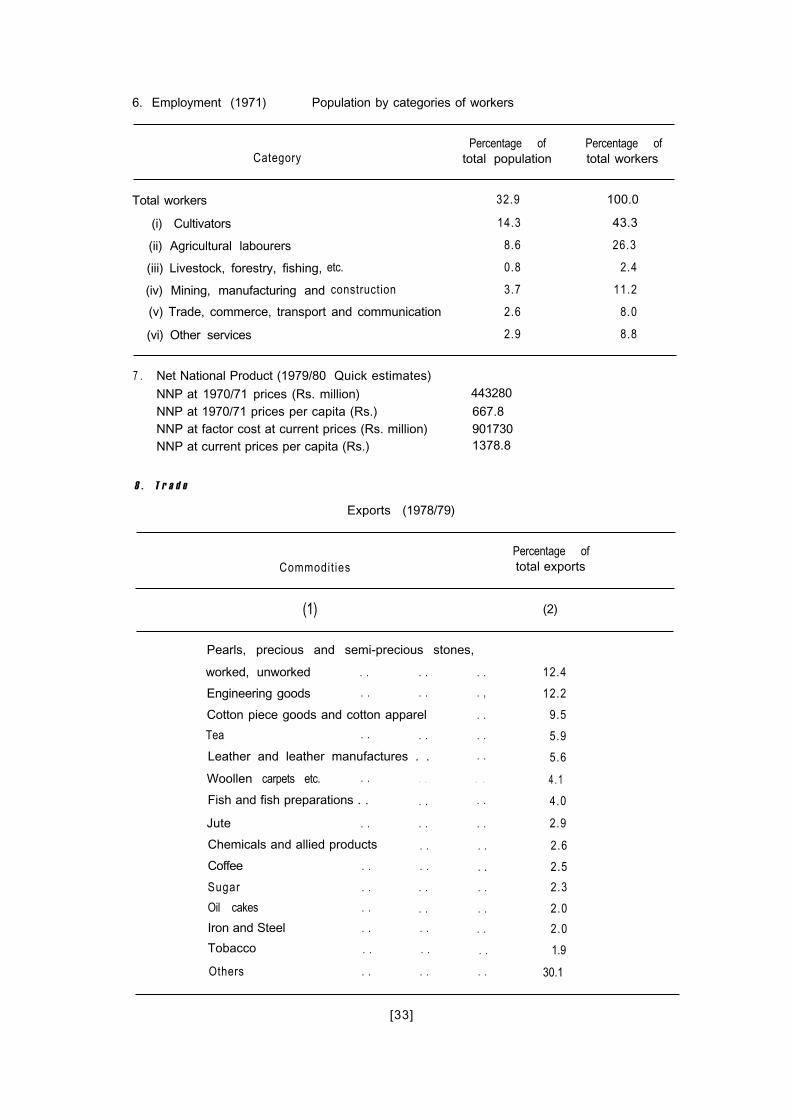
6. Employment (1971) Population by categories of workers
Percentage ofCategory total population
Total workers 32.9
(i) Cultivators 14.3
(ii) Agricultural labourers 8.6
(iii) Livestock, forestry, fishing, etc. 0.8
(iv) Mining, manufacturing and construction 3.7
(v) Trade, commerce, transport and communication 2.6
(vi) Other services 2.9
Percentage oftotal workers
100.0
43.3
26.3
2.4
11.2
8.0
8.8
7 . Net National Product (1979/80 Quick estimates)NNP at 1970/71 prices (Rs. million) 443280NNP at 1970/71 prices per capita (Rs.) 667.8NNP at factor cost at current prices (Rs. million) 901730NNP at current prices per capita (Rs.) 1378.8
8 . T r a d e
Exports (1978/79)
Commodit iesPercentage oftotal exports
(1) (2)
Pearls, precious and semi-precious stones,
worked, unworked . . . .
Engineering goods . . . .
Cotton piece goods and cotton apparel
Tea . . . .
Leather and leather manufactures . .
. . 12.4
. , 12.2
. . 9.5
. . 5.9
. . 5.6
Woollen carpets etc. . .
Fish and fish preparations . .
Jute . .
Chemicals and allied products
Coffee . .
Sugar . .
Oil cakes . .
Iron and Steel . .
Tobacco . .
Others . .
. . . . 4 . 1
. . . . 4.0
. . . . 2.9
. . . . 2.6
. . . . 2.5
. . . . 2.3
. . . . 2.0
. . . . 2.0
. . . . 1.9
. . . . 30.1
[33]
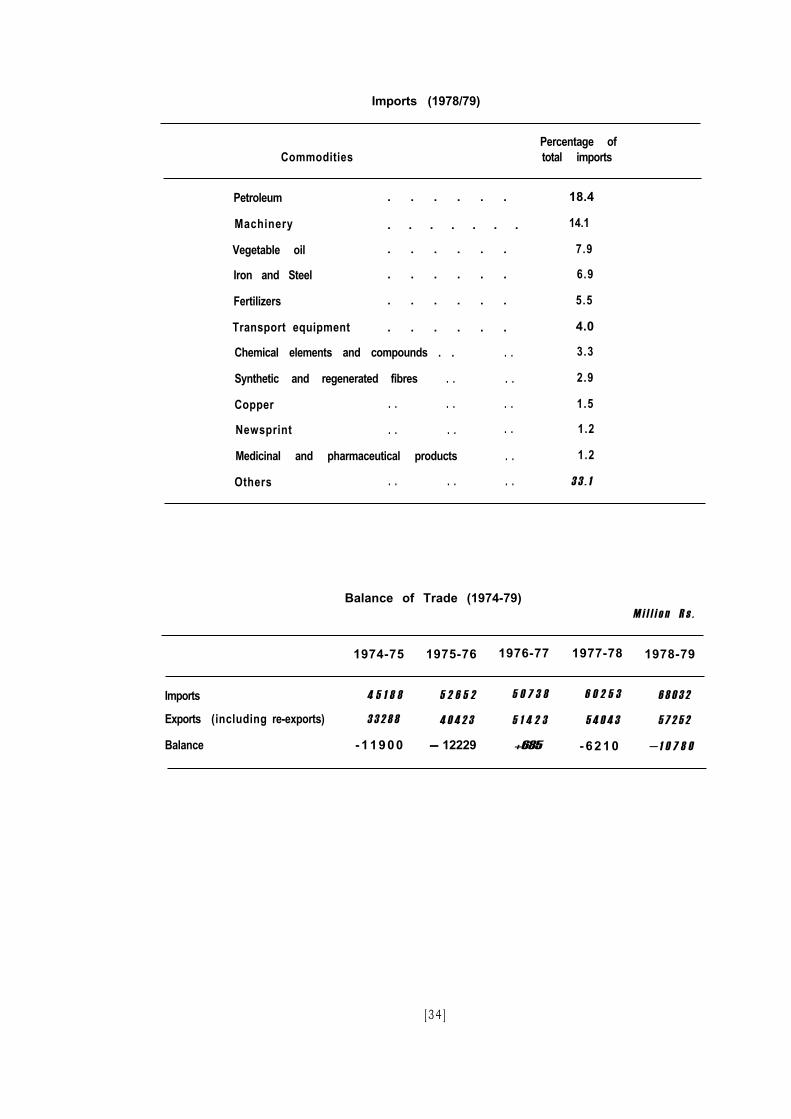
Imports (1978/79)
CommoditiesPercentage oftotal imports
Petroleum . . . . . . 18.4
Machinery . . . . . . . 14.1
Vegetable oil . . . . . . 7.9
Iron and Steel . . . . . . 6.9
Fertilizers . . . . . . 5.5
Transport equipment . . . . . . 4.0
Chemical elements and compounds . . . . 3.3
Synthetic and regenerated fibres . .
Copper . . . .
Newsprint . . . .
Medicinal and pharmaceutical products
Others . . . .
. . 2.9
. . 1.5
. . 1.2
. . 1.2
. . 3 3 . 1
Balance of Trade (1974-79)M i l l i o n R s .
1974-75 1975-76 1976-77 1977-78 1978-79
Imports 4 5 1 8 8 5 2 6 5 2 5 0 7 3 8 6 0 2 5 3 6 8 0 3 2
Exports (including re-exports) 3 3 2 8 8 4 0 4 2 3 5 1 4 2 3 5 4 0 4 3 5 7 2 5 2
Balance -11900 - 12229 +685 - 6210 - 1 0 7 8 0
[ 34 ]
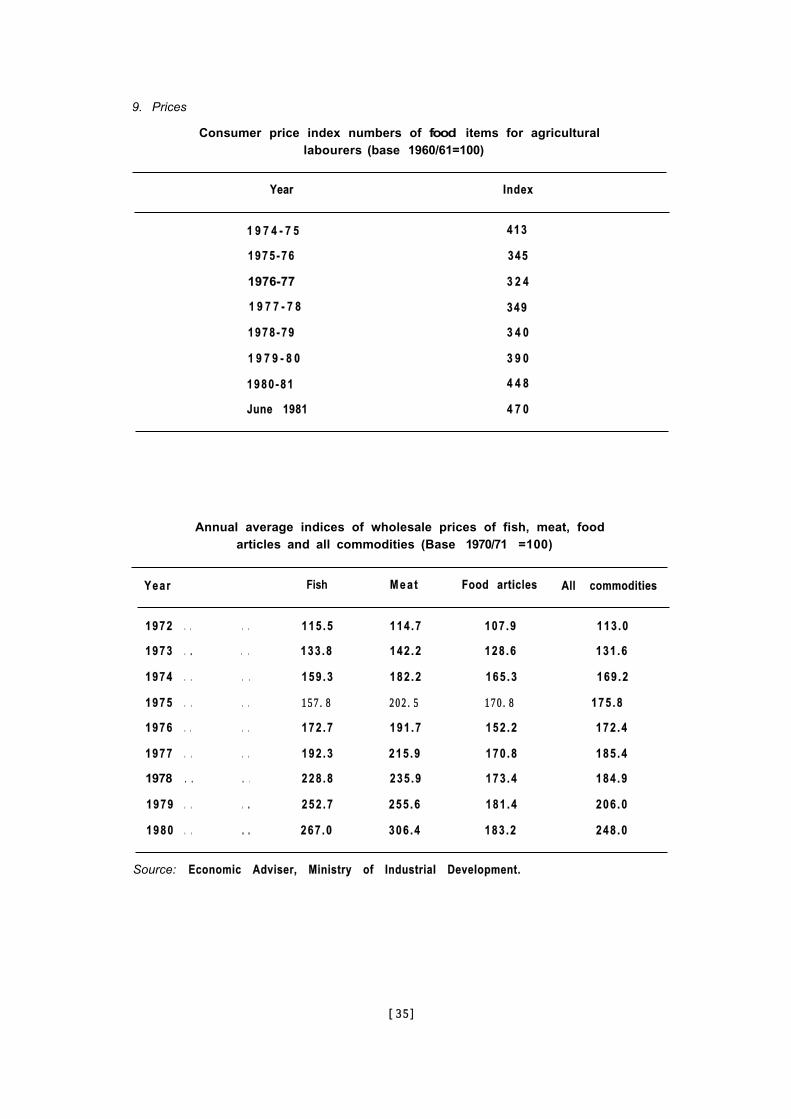
9. Prices
Consumer price index numbers of food items for agriculturallabourers (base 1960/61=100)
Year Index
1 9 7 4 - 7 5 413
1 9 7 5 - 7 6 345
1976-77 3 2 4
1 9 7 7 - 7 8 349
1 9 7 8 - 7 9 3 4 0
1 9 7 9 - 8 0 3 9 0
1 9 8 0 - 8 1 4 4 8
June 1981 4 7 0
Annual average indices of wholesale prices of fish, meat, foodarticles and all commodities (Base 1970/71 =100)
Year Fish M e a t Food articles All commodities
1972 . . . . 1 15 .5 114 .7 107 .9 113 .0
1973 . . . . 1 33 .8 142 .2 128 .6 131 .6
1974 . . . . 1 59 .3 182 .2 165 .3 169 .2
1975 . . . . 157.8 202.5 170.8 175 .8
1976 . . . . 1 72 .7 191 .7 152 .2 172 .4
1977 . . . . 1 92 .3 215 .9 170 .8 185 .4
1978 . . . . 228 .8 235 .9 173 .4 184 .9
1979 . . . . 2 52 .7 255 .6 181 .4 206 .0
1980 . . . . 267 .0 306 .4 183 .2 248 .0
Source: Economic Adviser, Ministry of Industrial Development.
[35]
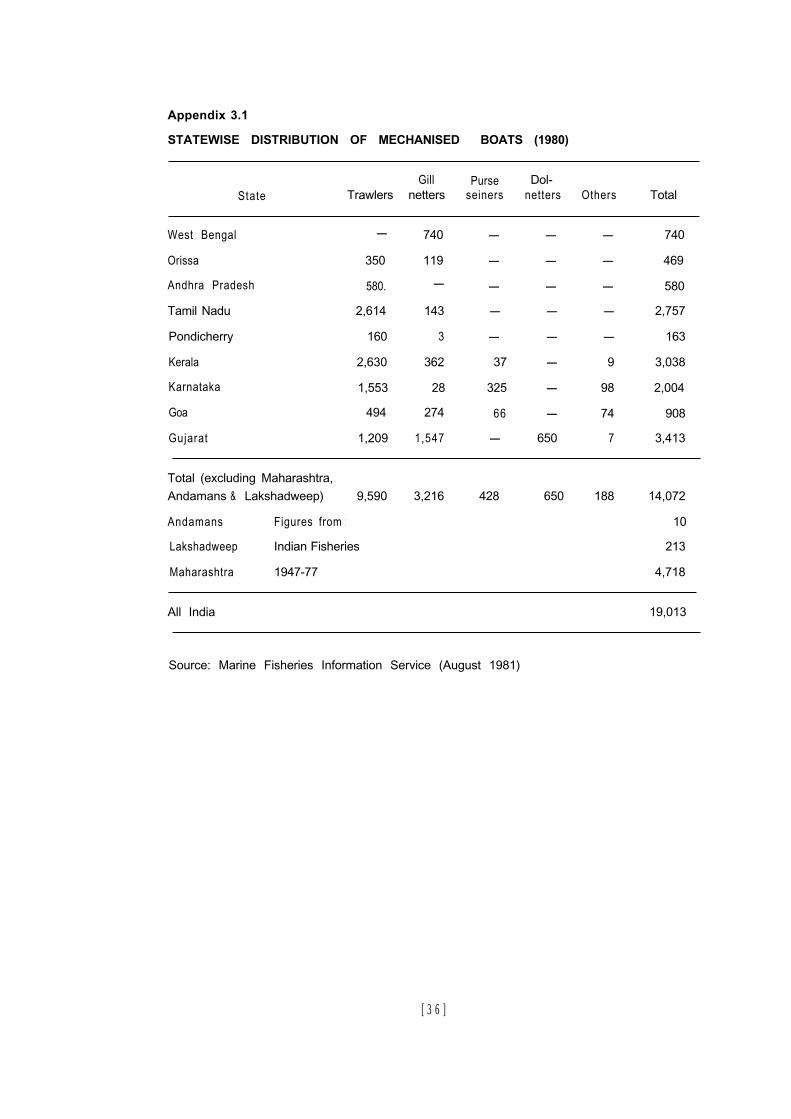
Appendix 3.1
STATEWISE DISTRIBUTION OF MECHANISED BOATS (1980)
StateGill Purse Dol-
Trawlers netters seiners netters Others Total
West Bengal -
Orissa 350
Andhra Pradesh 580.
Tamil Nadu 2,614
Pondicherry 160
Kerala 2,630
Karnataka 1,553
Goa 494
Gujarat 1,209
740
119
-
143
3
362
28
274
1,547
- - - 740
- - - 469
- - - 580
- - - 2,757
- - - 163
37 - 9 3,038
325 - 98 2,004
66 - 74 908
- 650 7 3,413
Total (excluding Maharashtra,Andamans & Lakshadweep) 9,590 3,216 428 650 188 14,072
Andamans Figures from : 10
Lakshadweep Indian Fisheries 213
Maharashtra 1947-77 4,718
All India 19,013
Source: Marine Fisheries Information Service (August 1981)
[ 3 6 ]
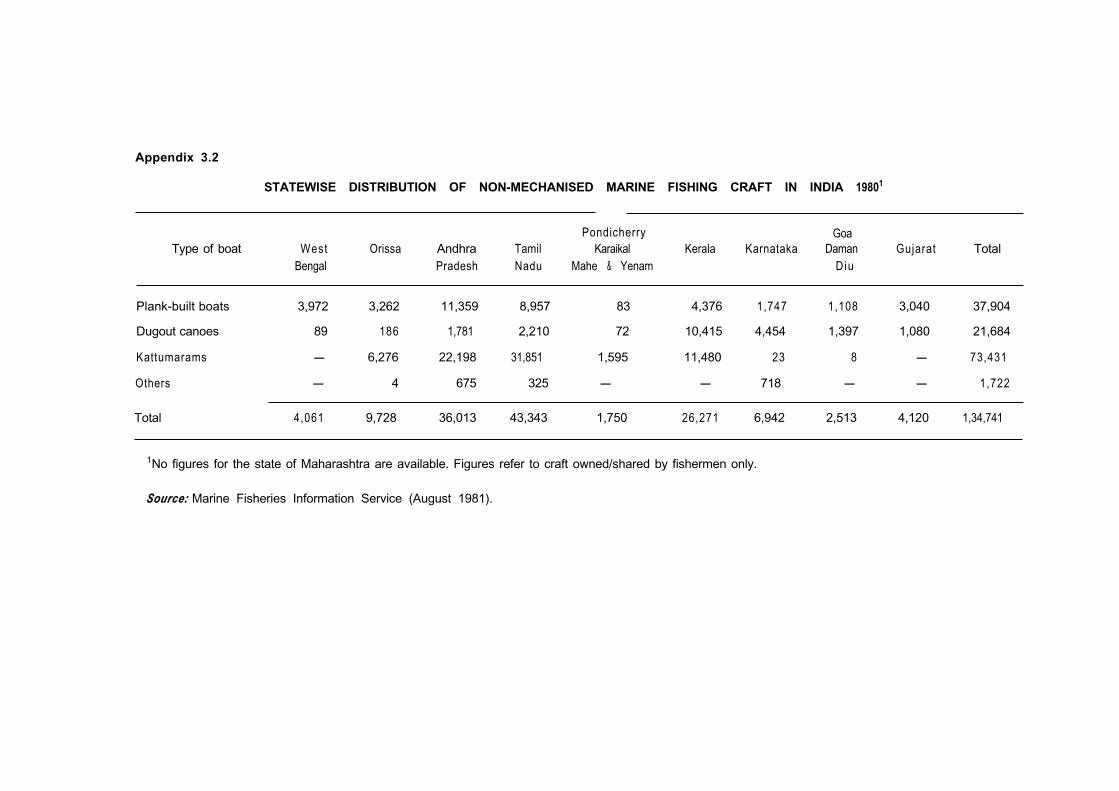
Appendix 3.2
STATEWISE DISTRIBUTION OF NON-MECHANISED MARINE FISHING CRAFT IN INDIA 19801
Type of boat WestBengal
Orissa Andhra TamilPradesh Nadu
Pondicherry GoaKaraikal Kerala Karnataka Daman Gujarat Total
Mahe & Yenam Diu
Plank-built boats 3,972 3,262 11,359 8,957 83 4,376 1,747 1,108 3,040 37,904
Dugout canoes 89 186 1,781 2,210 72 10,415 4,454 1,397 1,080 21,684
Kattumarams - 6,276 22,198 31,851 1,595 11,480 23 8 - 73,431
Others - 4 675 325 - - 718 - - 1,722
Total 4,061 9,728 36,013 43,343 1,750 26,271 6,942 2,513 4,120 1,34,741
1No figures for the state of Maharashtra are available. Figures refer to craft owned/shared by fishermen only.
Source: Marine Fisheries Information Service (August 1981).
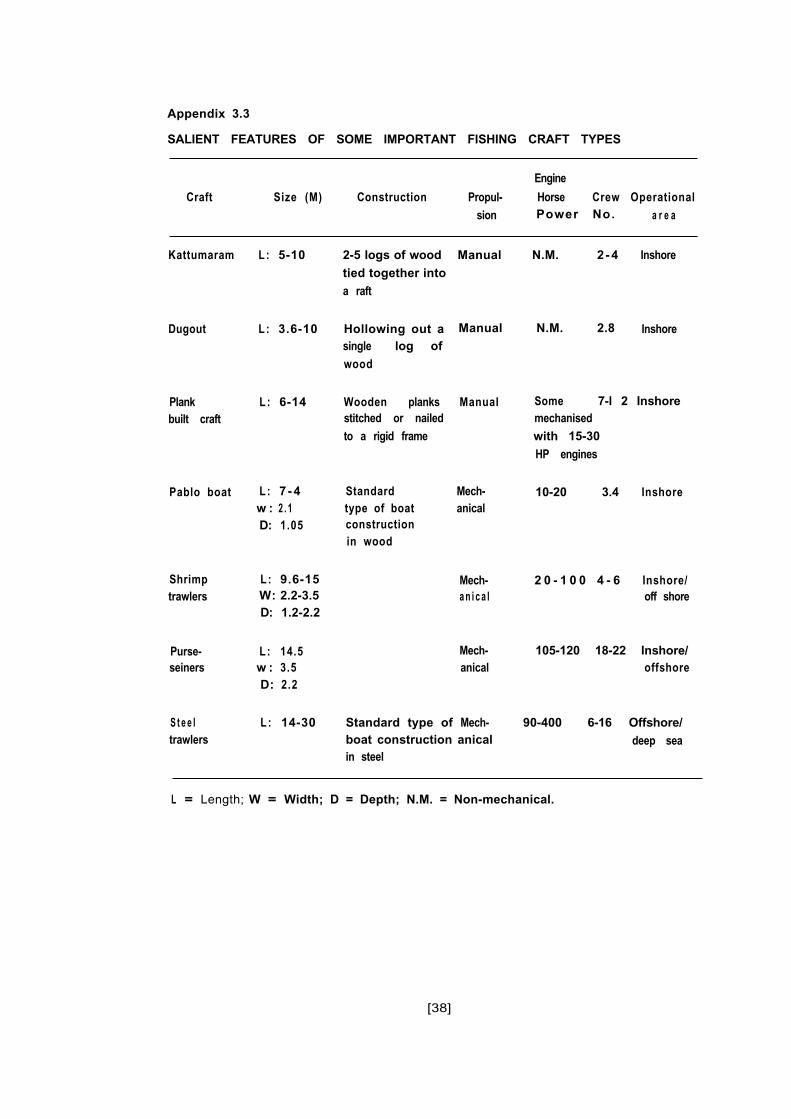
Appendix 3.3
SALIENT FEATURES OF SOME IMPORTANT FISHING CRAFT TYPES
Craft Size (M) Construction Propul-sion
Engine
Horse Crew OperationalPower No. a r e a
Kattumaram L: 5-10
Dugout L: 3.6-10
Plankbuilt craft
L : 6-14
Pablo boat L: 7 -4w : 2 . 1D: 1.05
Shrimptrawlers
Purse-seiners
S t e e ltrawlers
L: 9.6-15W: 2.2-3.5D: 1.2-2.2
L: 14.5w : 3.5D: 2.2
L: 14-30
2-5 logs of woodtied together intoa raft
Hollowing out asingle log ofwood
Wooden planksstitched or nailedto a rigid frame
Standardtype of boatconstructionin wood
Manual N.M. 2 -4 Inshore
Manual N.M. 2.8 Inshore
Manual Some 7-l 2 Inshoremechanisedwith 15-30HP engines
Mech-anical
10-20 3.4 Inshore
Mech-a n i c a l
2 0 - 1 0 0 4 - 6 Inshore/off shore
Mech-anical
105-120 18-22 Inshore/offshore
Standard type of Mech-boat construction anicalin steel
90-400 6-16 Offshore/deep sea
L = Length; W = Width; D = Depth; N.M. = Non-mechanical.
[38]
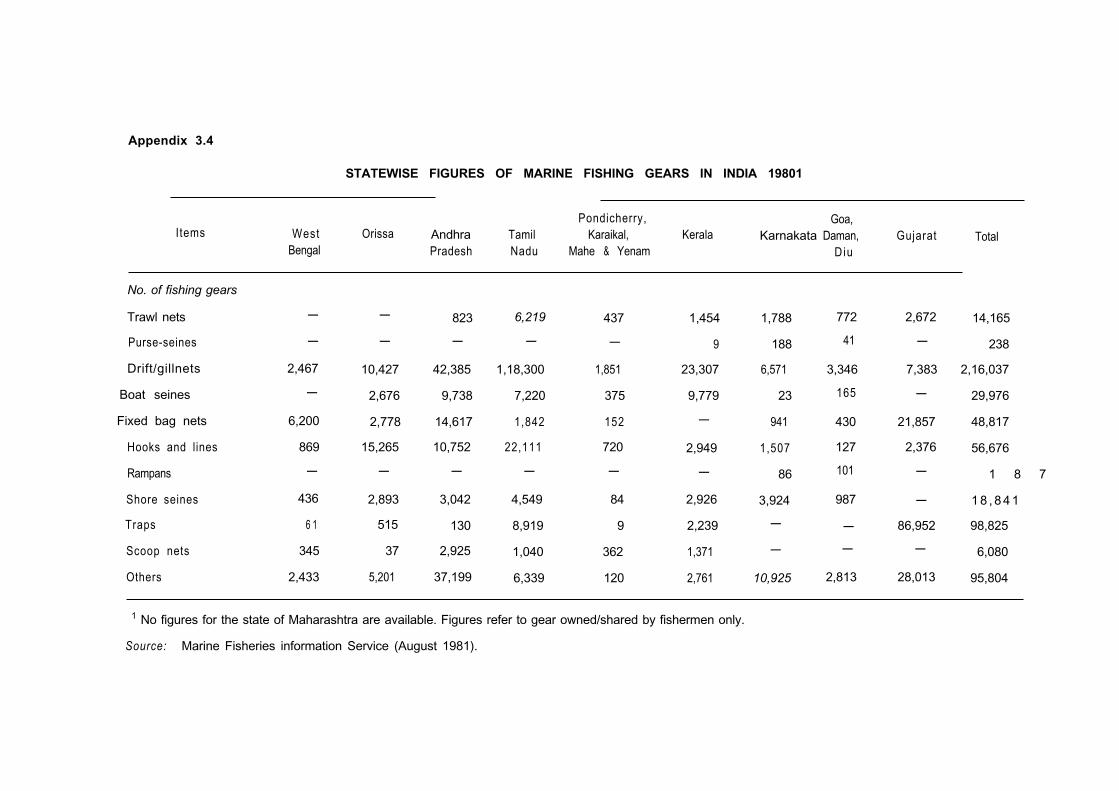
Appendix 3.4
STATEWISE FIGURES OF MARINE FISHING GEARS IN INDIA 19801
Pondicherry, Goa,Items West Orissa Andhra Tamil Karaikal, Kerala Karnakata Daman, Gujarat Total
Bengal Pradesh Nadu Mahe & Yenam Diu
No. of fishing gears
Trawl nets
Purse-seines
Drift/gillnets
Boat seines
Fixed bag nets
Hooks and lines
Rampans
Shore seines
Traps
Scoop nets
Others
-
-
2,467
-
6,200
869
- - - -
10,427 42,385 1,18,300 1,851
2,676 9,738 7,220 375
2,778 14,617 1,842 152
15,265 10,752 22,111 720
- - - -
436 2,893 3,042 4,549
6 1 515 130 8,919
345 37 2,925 1,040
2,433 5,201 37,199 6,339
- 823 6,219 437 1,454
9
23,307
9,779
-
2,949
- -
84 2,926
9 2,239
362 1,371
120 2,761
1,788
188
6,571
23
941
1,507
86
3,924
-
-
10,925
772 2,672
41 -
3,346 7,383
165 -
430 21,857
127 2,376
101 -
987 -
- 86,952
- -
2,813 28,013
14,165
238
2,16,037
29,976
48,817
56,676
1 8 7
1 8 , 8 4 1
98,825
6,080
95,804
1 No figures for the state of Maharashtra are available. Figures refer to gear owned/shared by fishermen only.
Source: Marine Fisheries information Service (August 1981).
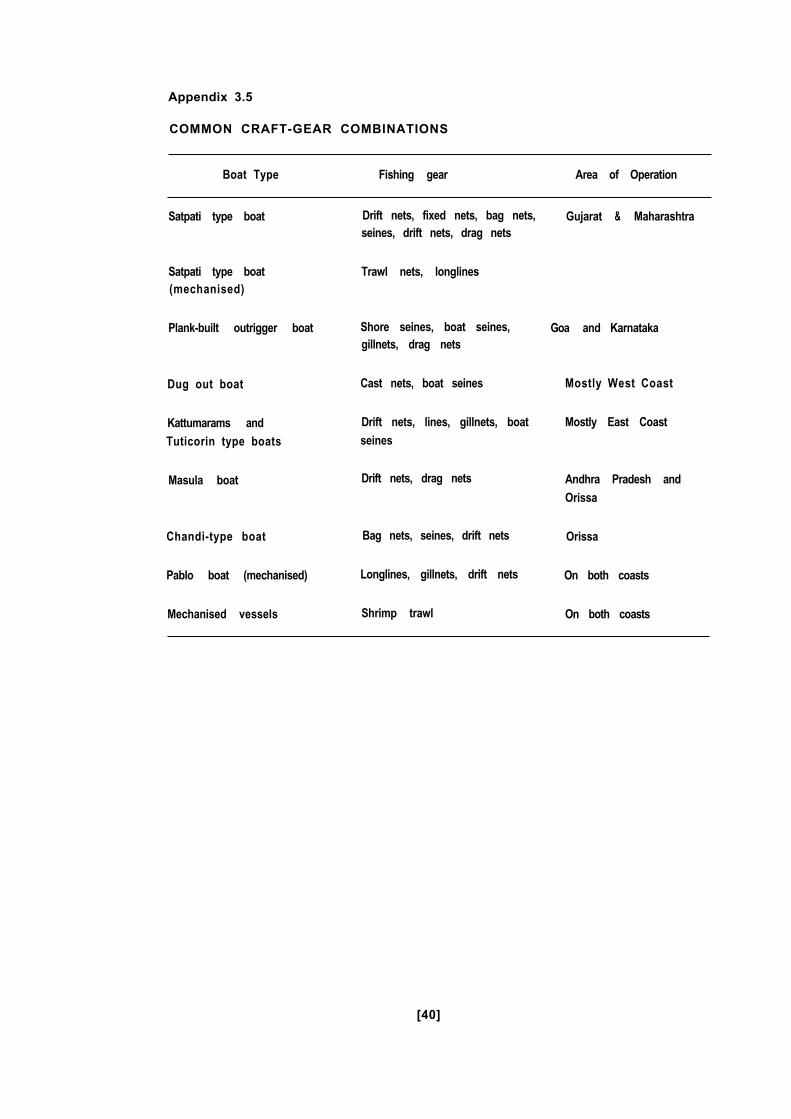
Appendix 3.5
COMMON CRAFT-GEAR COMBINATIONS
Boat Type Fishing gear Area of Operation
Satpati type boat
Satpati type boat(mechanised)
Plank-built outrigger boat
Dug out boat Cast nets, boat seines
Kattumarams andTuticorin type boats
Drift nets, lines, gillnets, boatseines
Masula boat Drift nets, drag nets
Chandi-type boat
Pablo boat (mechanised)
Mechanised vessels
Drift nets, fixed nets, bag nets,seines, drift nets, drag nets
Trawl nets, longlines
Gujarat & Maharashtra
Shore seines, boat seines,gillnets, drag nets
Goa and Karnataka
Bag nets, seines, drift nets
Longlines, gillnets, drift nets
Shrimp trawl
Mostly West Coast
Mostly East Coast
Andhra Pradesh andOrissa
Orissa
On both coasts
On both coasts
[40]
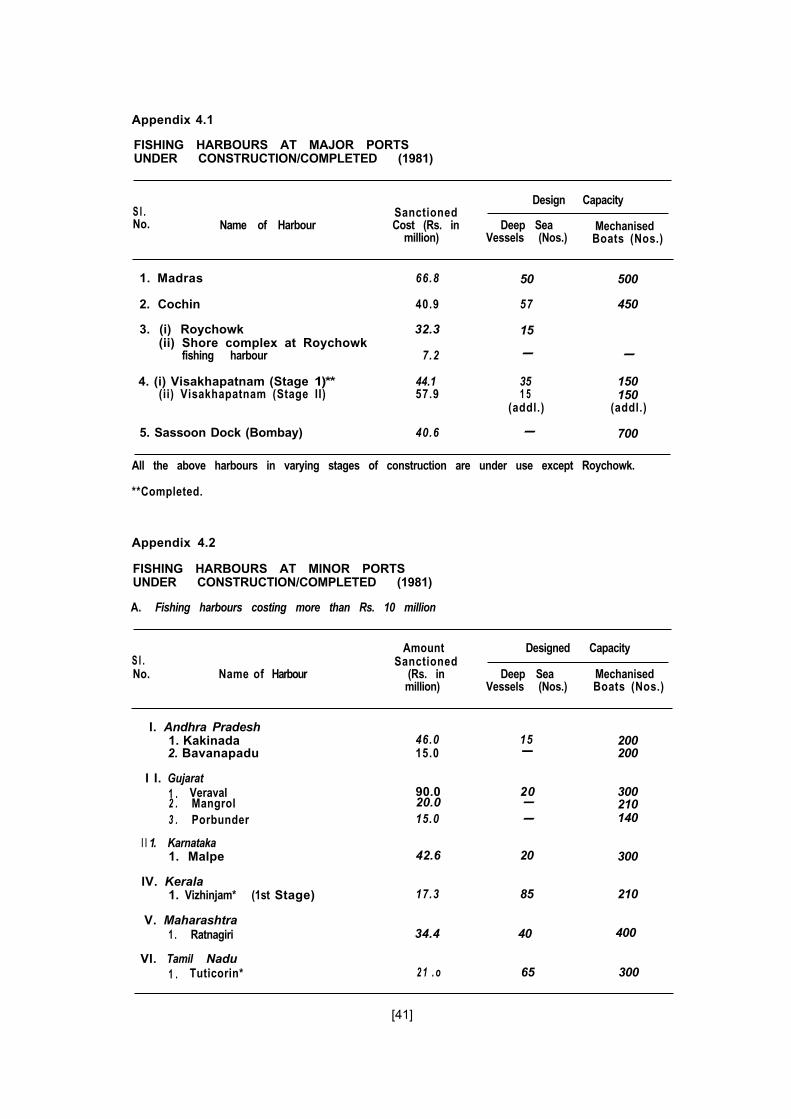
Appendix 4.1
FISHING HARBOURS AT MAJOR PORTSUNDER CONSTRUCTION/COMPLETED (1981)
S I .No. Name of Harbour
SanctionedCost (Rs. in
million)
Design Capacity
Deep Sea MechanisedVessels (Nos.) Boats (Nos.)
1. Madras 66.8 50 500
2. Cochin 40.9 57 450
3. (i) Roychowk(ii) Shore complex at Roychowk
fishing harbour
32.3 15
7.2 - -
4. (i) Visakhapatnam (Stage 1)** 44.1 35(ii) Visakhapatnam (Stage II) 57.9 1 5
(addl.)
150150
(addl.)
5. Sassoon Dock (Bombay) 40.6 - 700
All the above harbours in varying stages of construction are under use except Roychowk.
**Completed.
Appendix 4.2
FISHING HARBOURS AT MINOR PORTSUNDER CONSTRUCTION/COMPLETED (1981)
A. Fishing harbours costing more than Rs. 10 million
S I .No. Name of Harbour
AmountSanctioned
(Rs. inmillion)
Designed Capacity
Deep Sea MechanisedVessels (Nos.) Boats (Nos.)
I. Andhra Pradesh1. Kakinada2. Bavanapadu
46.0 15 20015.0 - 200
I I. Gujarat1 . Veraval2 . Mangrol3 . Porbunder
90.0 20 30020.0 - 21015.0 - 140
I I 1. Karnataka1. Malpe 42.6 20 300
IV. Kerala1. Vizhinjam* (1st Stage) 17.3 85 210
V. Maharashtra1 . Ratnagiri
VI. Tamil Nadu1 . Tuticorin*
34.4 40 400
2 1 . o 65 300
[41]
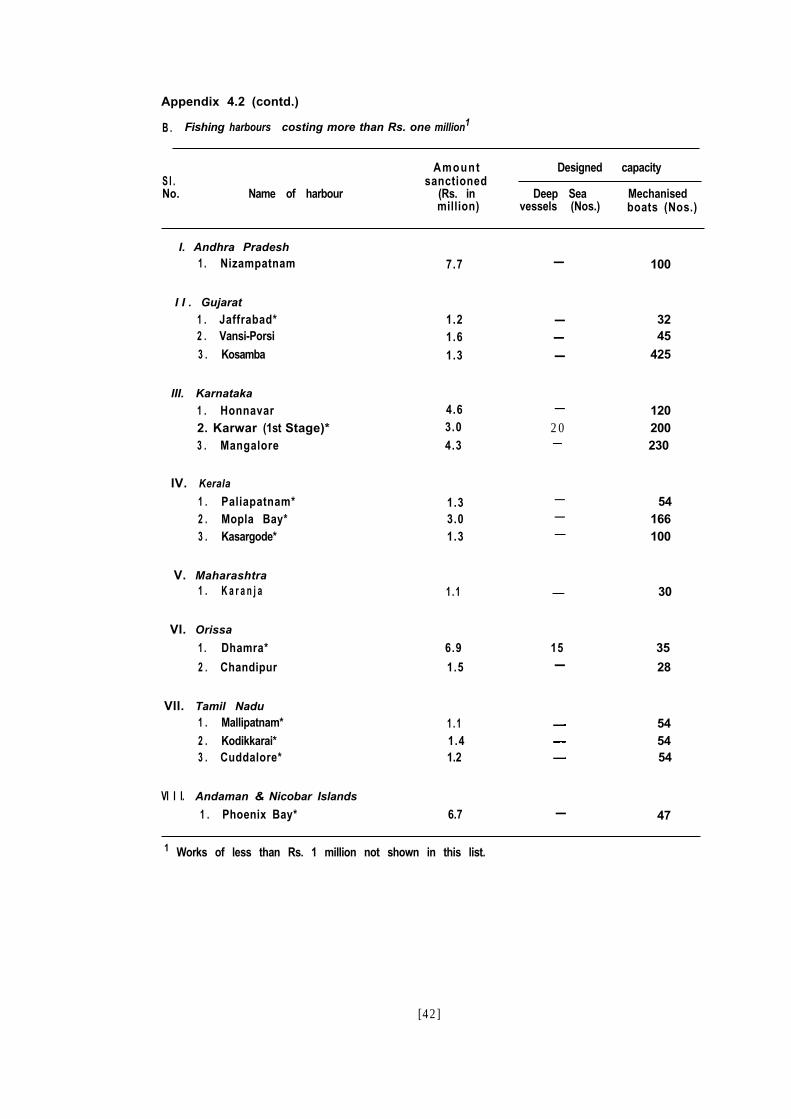
Appendix 4.2 (contd.)
B . Fishing harbours costing more than Rs. one million1
S I .No. Name of harbour
I. Andhra Pradesh1 . Nizampatnam
I I . Gujarat
1 . Jaffrabad*2 . Vansi-Porsi3 . Kosamba
III. Karnataka
1 . Honnavar2. Karwar (1st Stage)*3 . Mangalore
IV. Kerala
1 . Paliapatnam*2 . Mopla Bay*3 . Kasargode*
V. Maharashtra1 . K a r a n j a
VI. Orissa
1 . Dhamra*
2 . Chandipur
VII. Tamil Nadu1 . Mallipatnam*2 . Kodikkarai*3 . Cuddalore*
VI I I. Andaman & Nicobar Islands
1 . Phoenix Bay*
Amountsanctioned
(Rs. inmillion)
Designed capacity
Deep Sea Mechanisedvessels (Nos.) boats (Nos.)
7.7 - 100
1.2 - 321.6 - 45
1.3 - 425
4.6 - 1203.0 20 2004.3 - 230
1.33.01.3
1 . 1
6.9 15 35
1.5 - 28
1 . 11.41.2
---
54166100
30
545454
6.7 - 47
1 Works of less than Rs. 1 million not shown in this list.
[42]
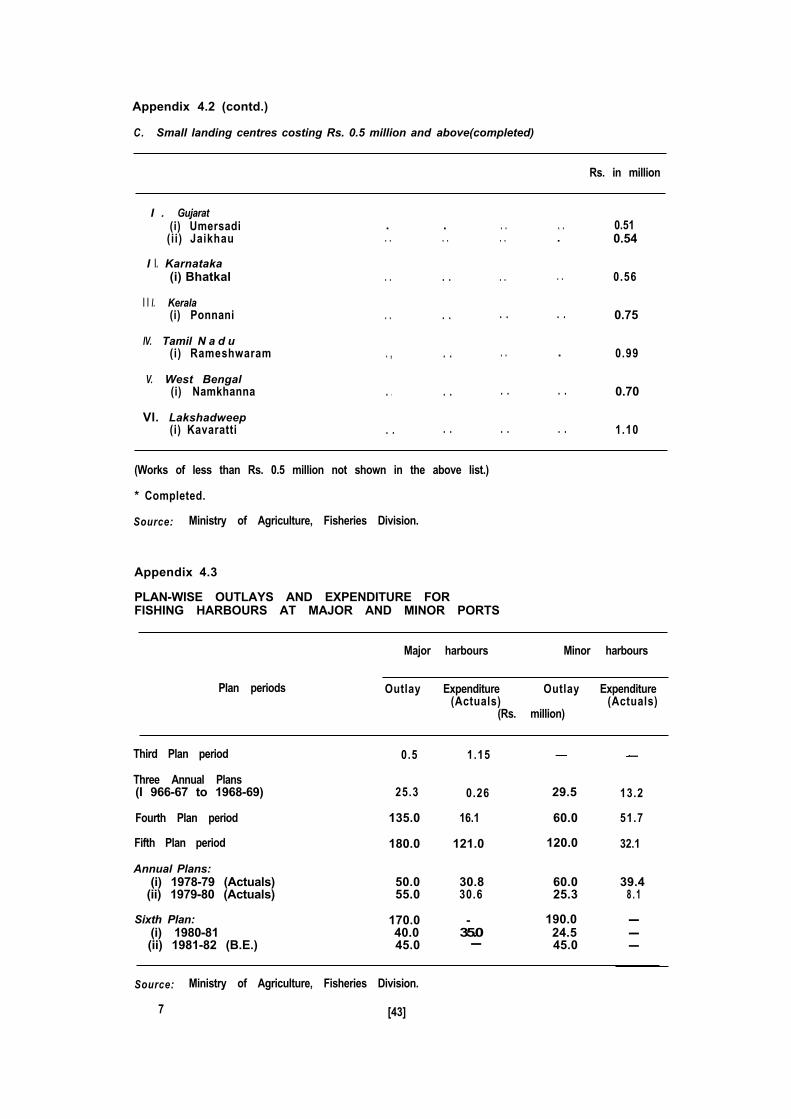
Appendix 4.2 (contd.)
C. Small landing centres costing Rs. 0.5 million and above(completed)
Rs. in million
I . Gujarat(i) Umersadi(ii) Jaikhau
I I. Karnataka(i) Bhatkal
I I I. Kerala(i) Ponnani
IV. Tamil N a d u(i) Rameshwaram
V. West Bengal(i) Namkhanna
VI. Lakshadweep(i) Kavaratti
. . . . . . 0.51. . . . . . . 0.54
. . . . . . . . 0.56
. . . . . . . . 0.75
. , . . . . . 0.99
. . . . . . . . 0.70
. . . . . . . . 1.10
(Works of less than Rs. 0.5 million not shown in the above list.)
* Completed.
Source: Ministry of Agriculture, Fisheries Division.
Appendix 4.3
PLAN-WISE OUTLAYS AND EXPENDITURE FORFISHING HARBOURS AT MAJOR AND MINOR PORTS
Major harbours Minor harbours
Plan periods Outlay Expenditure Outlay Expenditure(Actuals) (Actuals)
(Rs. million)
Third Plan period 0.5
Three Annual Plans(I 966-67 to 1968-69) 25.3
Fourth Plan period 135.0
Fifth Plan period 180.0
Annual Plans:(i) 1978-79 (Actuals)
(ii) 1979-80 (Actuals)
Sixth Plan:(i) 1980-81(ii) 1981-82 (B.E.)
50.055.0
170.0 -40.045.0
1.15
0.26
16.1
121.0
30.830.6
35.0-
29.5 13.2
60.0 51.7
120.0 32.1
60.0 39.425.3 8 . 1
190.0 -24.5 -45.0 -
Source: Ministry of Agriculture, Fisheries Division.
7 [43]
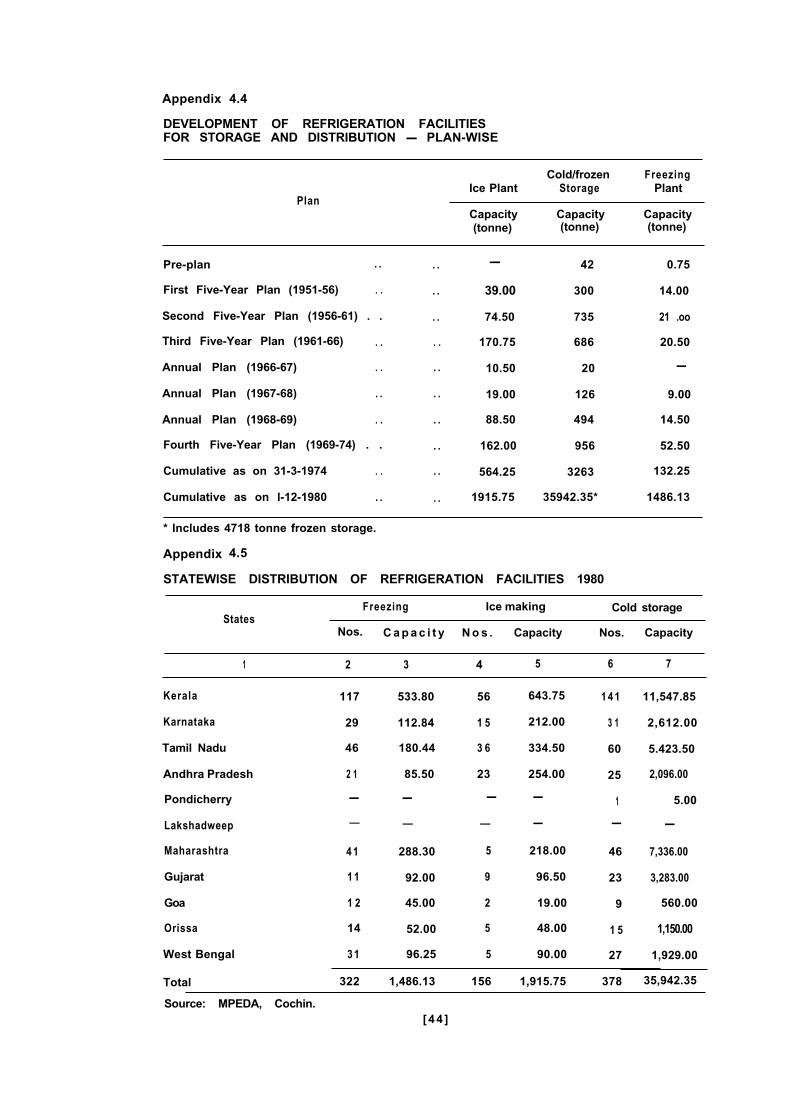
Appendix 4.4
DEVELOPMENT OF REFRIGERATION FACILITIESFOR STORAGE AND DISTRIBUTION - PLAN-WISE
PlanIce Plant
Capacity(tonne)
Cold/frozen FreezingStorage Plant
Capacity Capacity(tonne) (tonne)
Pre-plan . .
First Five-Year Plan (1951-56) . .
Second Five-Year Plan (1956-61) . .
Third Five-Year Plan (1961-66) . .
Annual Plan (1966-67) . .
Annual Plan (1967-68) . .
Annual Plan (1968-69) . .
Fourth Five-Year Plan (1969-74) . .
Cumulative as on 31-3-1974 . .
Cumulative as on l-12-1980 . .
-. .
. . 39.00
. . 74.50
. . 170.75
. . 10.50
. . 19.00
. . 88.50
. . 162.00
. . 564.25
. . 1915.75
42
300
735
686
20
126
494
956
3263
35942.35*
0.75
14.00
21 .oo
20.50
-
9.00
14.50
52.50
132.25
1486.13
* Includes 4718 tonne frozen storage.
Appendix 4.5
STATEWISE DISTRIBUTION OF REFRIGERATION FACILITIES 1980
FreezingStates
Ice making Cold storage
Nos. C a p a c i t y N o s . Capacity Nos. Capacity
1 2 3 4 5 6 7
Kerala
Karnataka
Tamil Nadu
Andhra Pradesh
Pondicherry
Lakshadweep
Maharashtra
Gujarat
Goa
Orissa
West Bengal
117 533.80
29 112.84
46 180.44
2 1 85.50
- -
- -
4 1 288.30
1 1 92.00
1 2 45.00
14 52.00
3 1 96.25
56
1 5
3 6
23
-
-
5
9
2
5
5
643.75
212.00
334.50
254.00
-
-
218.00
96.50
19.00
48.00
90.00
1 4 1 11,547.85
3 1 2,612.00
60 5.423.50
25 2,096.00
1 5.00
- -
46 7,336.00
23 3,283.00
9 560.00
1 5 1,150.00
27 1,929.00
Total 322 1,486.13 156 1,915.75 378 35,942.35
Source: MPEDA, Cochin.[ 44 ]
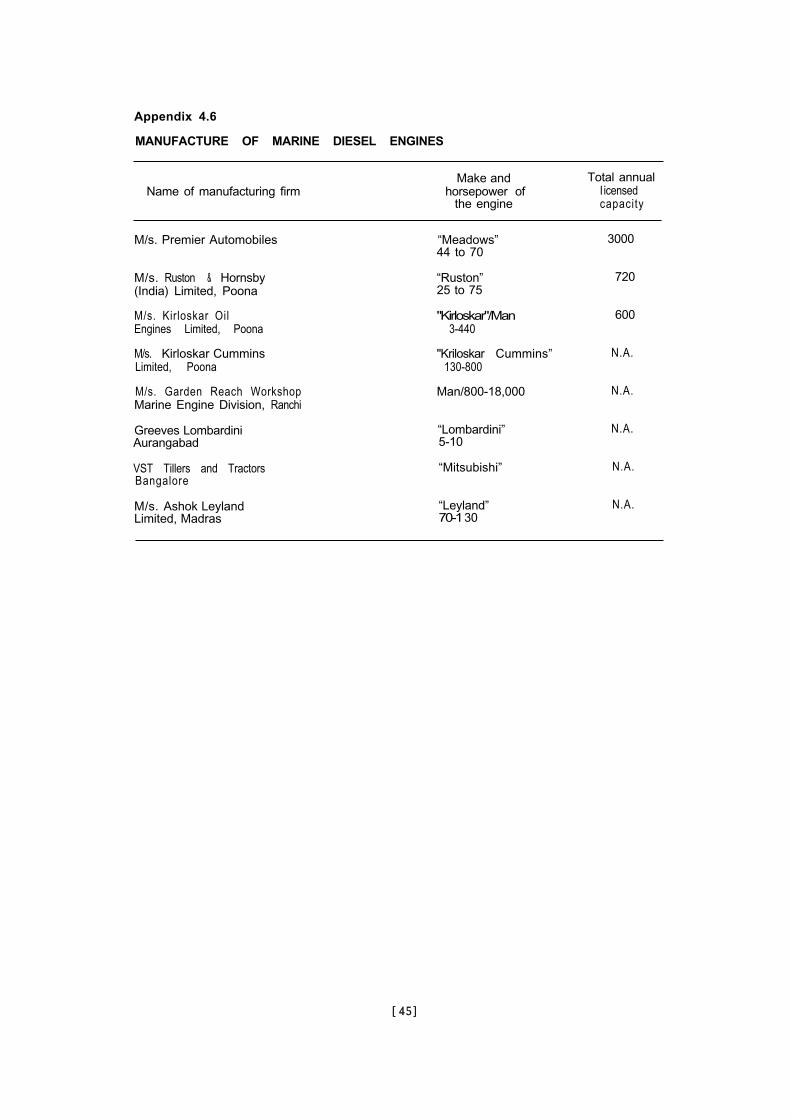
Appendix 4.6
MANUFACTURE OF MARINE DIESEL ENGINES
Name of manufacturing firm
M/s. Premier Automobiles
M/s. Ruston & Hornsby(India) Limited, Poona
M/s. Kirloskar OilEngines Limited, Poona 3-440
M/s. Kirloskar CumminsLimited, Poona 130-800
Make andhorsepower of
the engine
“Meadows”44 to 70
“Ruston”25 to 75
"Kirloskar"/Man
"Kriloskar Cummins”
Man/800-18,000
“Lombardini”5-10
“Mitsubishi”
“Leyland”70-130
Total annualI icensedcapacity
3000
720
600
N.A.
M/s. Garden Reach WorkshopMarine Engine Division, Ranchi
Greeves LombardiniAurangabad
VST Tillers and TractorsBangalore
M/s. Ashok LeylandLimited, Madras
N.A.
N.A.
N.A.
N.A.
[45]
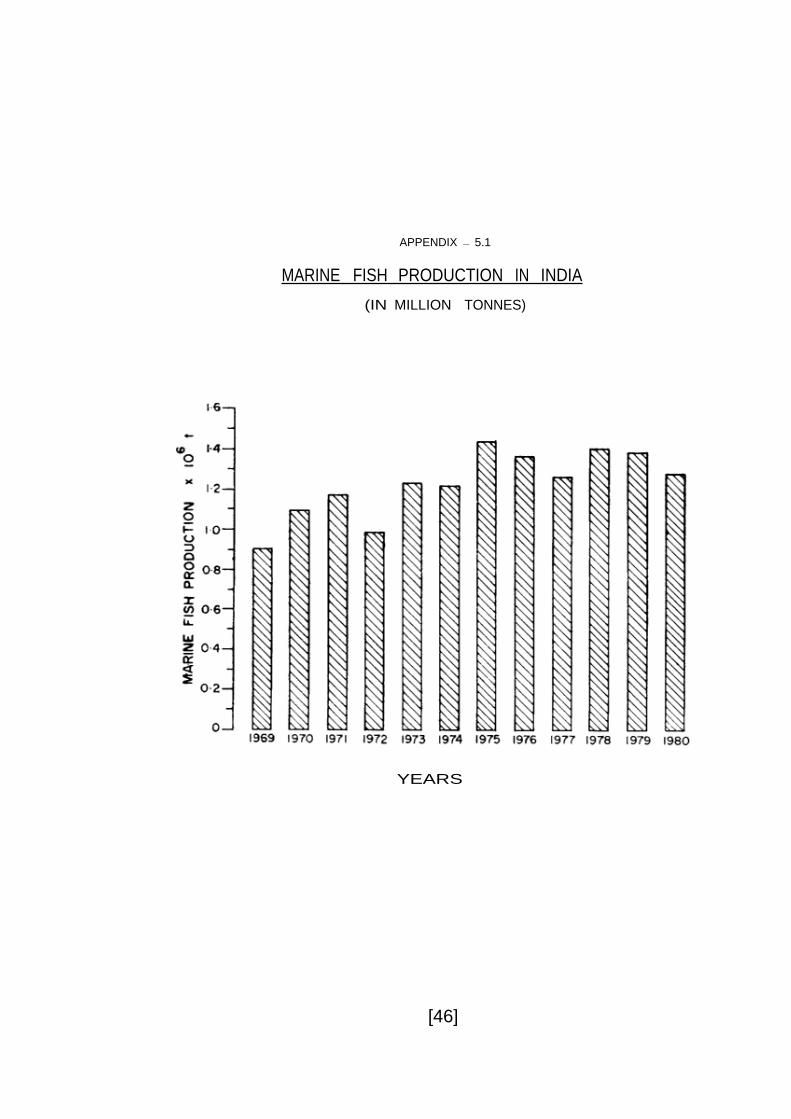
APPENDIX — 5.1
MARINE FISH PRODUCTION IN INDIA
(IN MILLION TONNES)
[46]
YEARS
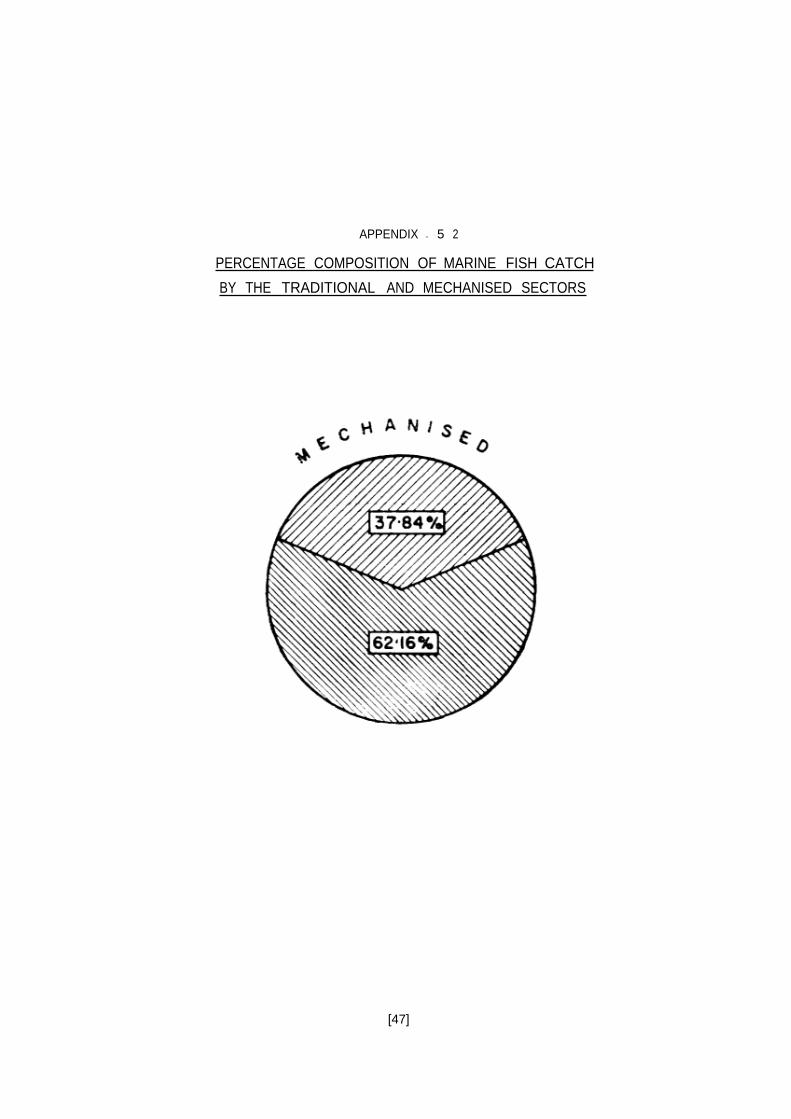
APPENDIX - 5 2
PERCENTAGE COMPOSITION OF MARINE FISH CATCH
BY THE TRADITIONAL AND MECHANISED SECTORS
[47]
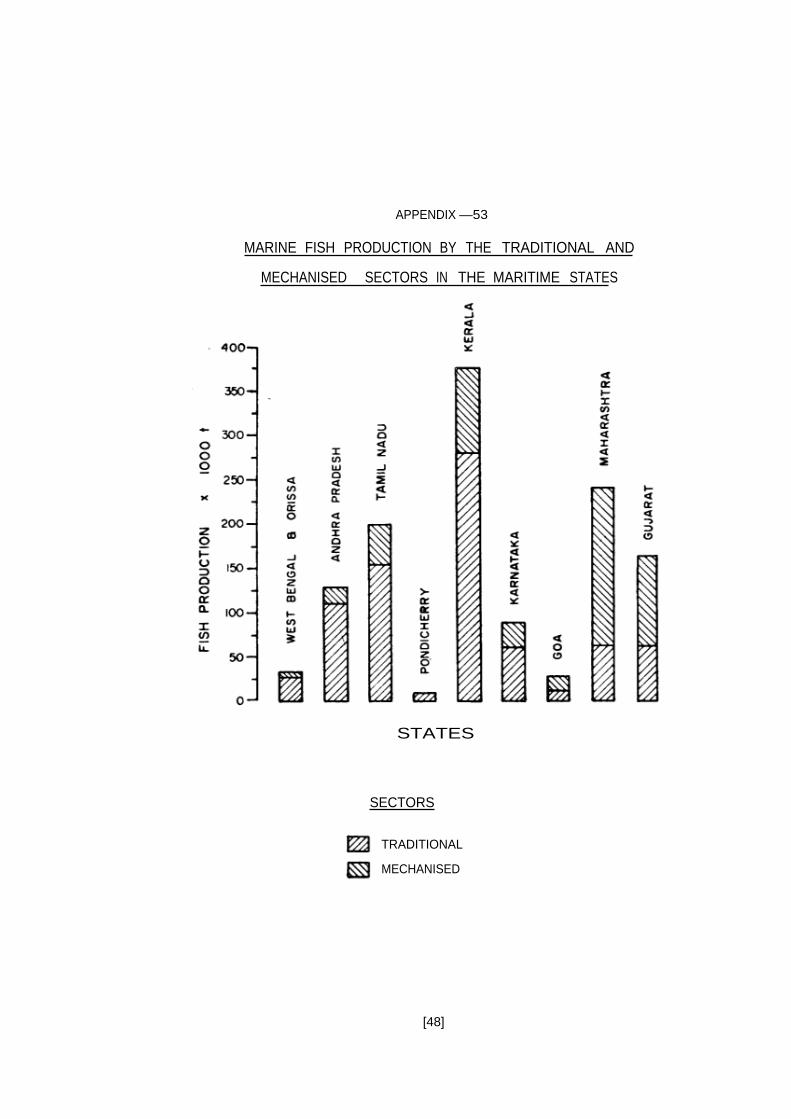
APPENDIX —53
MARINE FISH PRODUCTION BY THE TRADITIONAL AND
MECHANISED SECTORS IN THE MARITIME STATES
SECTORS
[48]
STATES
TRADITIONAL
MECHANISED
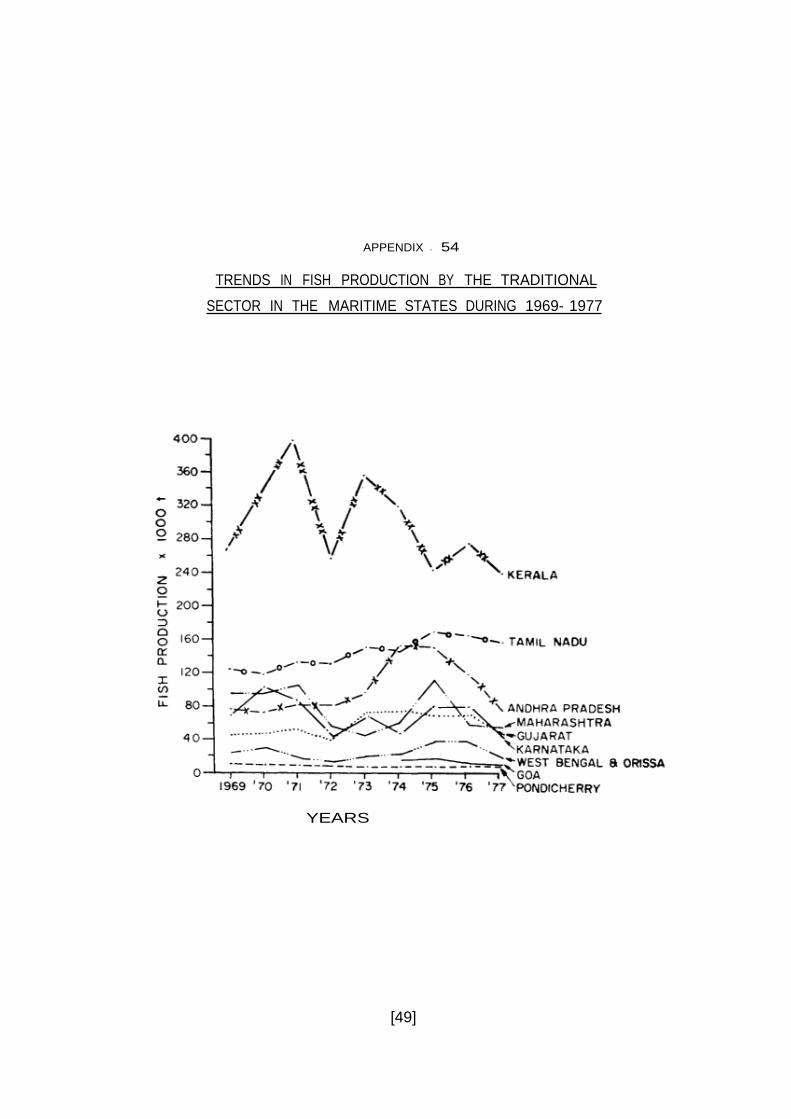
APPENDIX - 54
TRENDS IN FISH PRODUCTION BY THE TRADITIONAL
SECTOR IN THE MARITIME STATES DURING 1969- 1977
[49]
YEARS
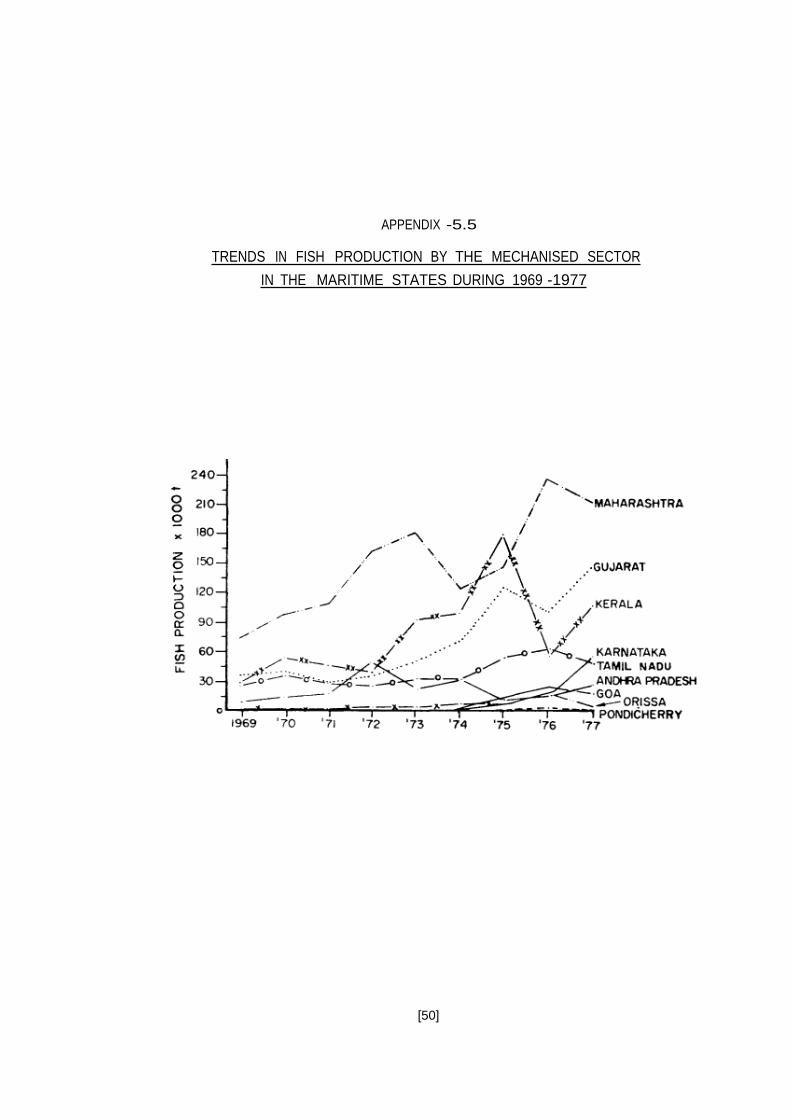
APPENDIX -5.5
TRENDS IN FISH PRODUCTION BY THE MECHANISED SECTOR
IN THE MARITIME STATES DURING 1969 -1977
[50]
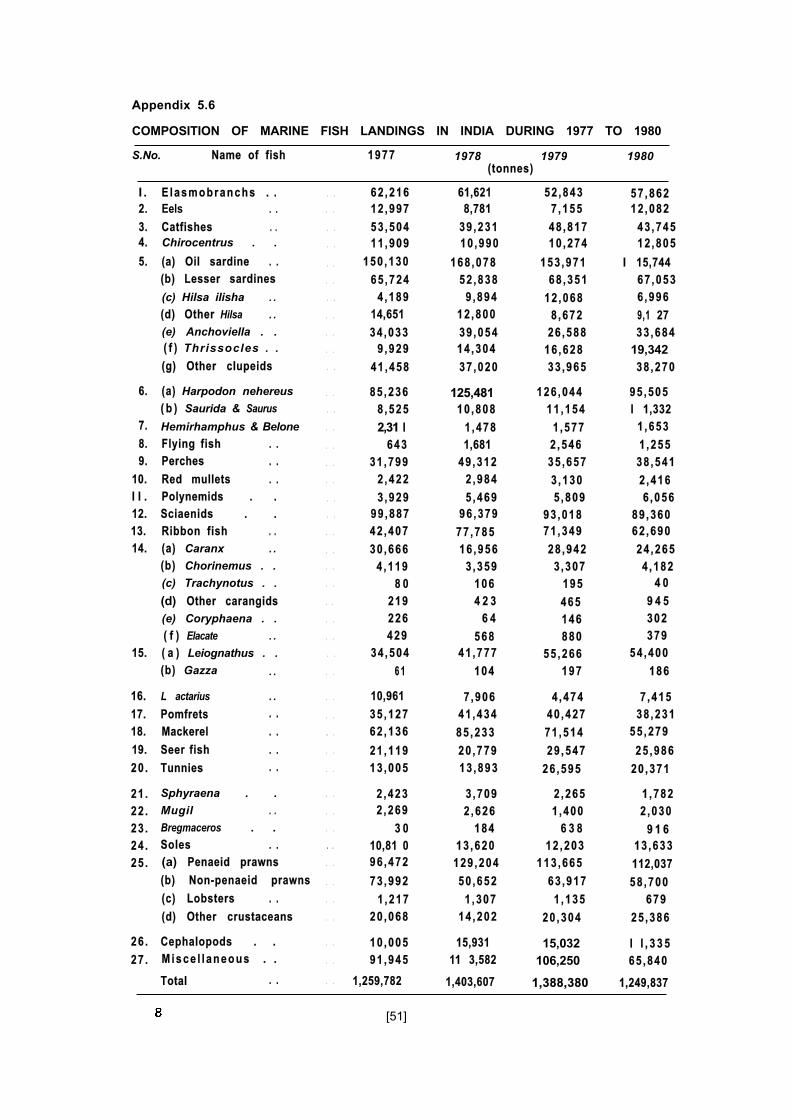
Appendix 5.6
COMPOSITION OF MARINE FISH LANDINGS IN INDIA DURING 1977 TO 1980
S.No. Name of fish 1977
I .2.
3.
4.
5.
6.
7.
8.
9.
10.
I I .
12.
13.
14.
15.
16.
17.
18.
19.
20 .
E l a s m o b r a n c h s . .
Eels . .Catfishes . .
Chirocentrus . .
(a) Oil sardine . .
(b) Lesser sardines
(c) Hilsa ilisha . .
(d) Other Hilsa . .
(e) Anchoviella . .( f ) Thrissocles . .
(g) Other clupeids
(a) Harpodon nehereus
( b ) Saurida & Saurus
Hemirhamphus & Belone
Flying fish . .
Perches . .
Red mullets . .
Polynemids . .
Sciaenids . .
Ribbon fish . .
(a) Caranx . .
(b) Chorinemus . .
(c) Trachynotus . .
(d) Other carangids
(e) Coryphaena . .
( f ) Elacate . .
( a ) Leiognathus . .
(b) Gazza . .
L actarius . .
Pomfrets . .
Mackerel . .
Seer fish . .
Tunnies . .
21 .
22 .
23 .
24 .
25 .
26 . Cephalopods . .
27 . M i s c e l l a n e o u s . .
Sphyraena . .
Mugil . .
Bregmaceros . .
Soles . .
(a) Penaeid prawns
(b) Non-penaeid prawns
(c) Lobsters . .
(d) Other crustaceans
Total . .
. .. .. .. .
. .. .. .
. .
. .
. .. .
. .. .
. .
. .
. .
. .. .. .
. .
. .
. .
. .
. .
. .
. .. .
. .
. .
. .
.. .
. .
. .
. .
. .
. .
. .
. .
. .
. .
. .
. .
. .
. .
62 ,216 61,621 52 ,843 57 ,862
12 ,997 8,781 7 ,155 12 ,082
53 ,504 39 ,231 48 ,817 43 ,745
11 ,909 10 ,990 10 ,274 12 ,805
150 ,130 168 ,078 153 ,971 I 15,744
65 ,724 52 ,838 68 ,351 67 ,053
4 ,189 9 ,894 12 ,068 6 ,996
14,651 12 ,800 8 ,672 9,1 27
34 ,033 39 ,054 26 ,588 33 ,684
9 ,929 14 ,304 16 ,628 19,34241 ,458 37 ,020 33 ,965 38 ,270
85 ,236 125,481 126 ,044 95 ,505
8 ,525 10 ,808 11 ,154 I 1,332
2,31 I 1 ,478 1 ,577 1 ,653
643 1,681 2 ,546 1 ,255
31 ,799 49 ,312 35 ,657 38 ,541
2 ,422 2 ,984 3 ,130 2 ,416
3 ,929 5 ,469 5 ,809 6 ,056
99 ,887 96 ,379 93 ,018 89 ,360
42 ,407 77 ,785 71 ,349 62 ,690
30 ,666 16 ,956 28 ,942 24 ,265
4 ,119 3 ,359 3 ,307 4 ,182
8 0 106 195 4 0
219 4 2 3 465 9 4 5
226 6 4 146 302
429 568 880 379
34 ,504 41 ,777 55 ,266 54 ,400
6 1 104 197 186
10,961 7 ,906 4 ,474 7 ,415
35 ,127 41 ,434 40 ,427 38 ,231
62 ,136 85 ,233 71 ,514 55 ,279
21 ,119 20 ,779 29 ,547 25 ,986
13 ,005 13 ,893 26 ,595 20 ,371
2 ,423 3 ,709 2 ,265 1 ,782
2 ,269 2 ,626 1 ,400 2 ,030
3 0 184 6 3 8 9 1 6
10,81 0 13 ,620 12 ,203 13 ,633
96 ,472 129 ,204 113 ,665 112,037
73 ,992 50 ,652 63 ,917 58 ,700
1 ,217 1 ,307 1 ,135 679
20 ,068 14 ,202 20 ,304 25 ,386
10 ,005 15,931
91 ,945 11 3,582
1,259,782 1,403,607
15,032 I I , 3 3 5
106,250 65 ,840
1,388,380 1,249,837
1978 1979 1980(tonnes)
[51]
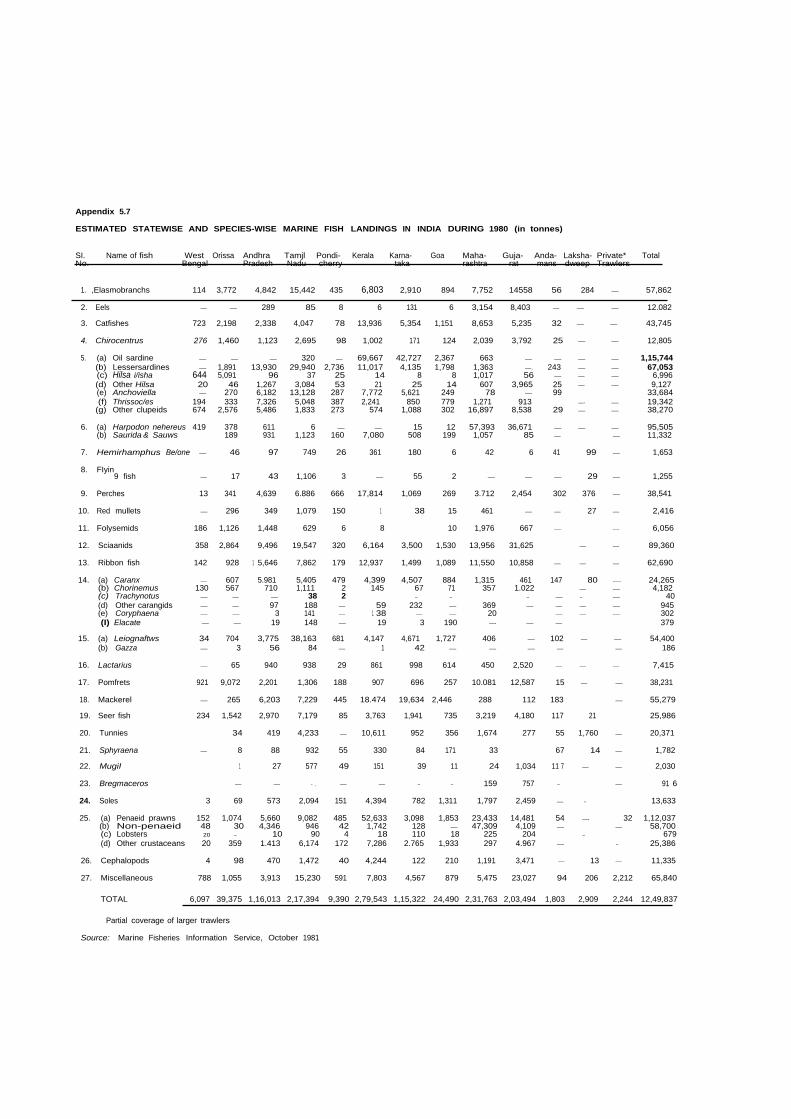
Appendix 5.7
ESTIMATED STATEWISE AND SPECIES-WISE MARINE FISH LANDINGS IN INDIA DURING 1980 (in tonnes)
SI. Name of fish West Orissa Andhra Tamjl Pondi- Kerala Karna- Goa Maha- Guja- Anda- Laksha- Private* TotalNo. Bengal Pradesh Nadu cherry taka rashtra rat mans dweep Trawlers
1. ,Elasmobranchs 114 3,772 4,842 15,442 435 6,803 2,910 894 7,752 14558 56 284 — 57,862
2. Eels — — 289 85 8 6 131 6 3,154 8,403 — — — 12.082
3. Catfishes 723 2,198 2,338 4,047 78 13,936 5,354 1,151 8,653 5,235 32 — — 43,745
4. Chirocentrus 276 1,460 1,123 2,695 98 1,002 171 124 2,039 3,792 25 — — 12,805
5. (a) Oil sardine — — — 320 — 69,667 42,727 2,367 663 — — — — 1,15,744(b) Lessersardines — 1,891 13,930 29,940 2,736 11,017 4,135 1,798 1,363 —. 243 — — 67,053(c) Hilsa i/isha 644 5,091 96 37 25 14 8 8 1,017 56 — — — 6,996(d) Other Hilsa 20 46 1,267 3,084 53 21 25 14 607 3,965 25 — — 9,127(e) Anchoviella — 270 6,182 13,128 287 7,772 5,621 249 78 — 99 33,684(f) Thrissoc/es 194 333 7,326 5,048 387 2,241 850 779 1,271 913 —- — 19,342
(g) Other clupeids 674 2,576 5,486 1,833 273 574 1,088 302 16,897 8,538 29 — — 38,270
6. (a) Harpodon nehereus 419 378 611 6 — — 15 12 57,393 36,671 — — — 95,505(b) Saurida & Sauws 189 931 1,123 160 7,080 508 199 1,057 85 — — 11,332
7. Hemirhamphus Be/one — 46 97 749 26 361 180 6 42 6 41 99 — 1,653
8. FIyin9 fish — 17 43 1,106 3 — 55 2 — — — 29 — 1,255
9. Perches 13 341 4,639 6.886 666 17,814 1,069 269 3.712 2,454 302 376 — 38,541
10. Red mullets — 296 349 1,079 150 1 38 15 461 — — 27 — 2,416
11. Folysemids 186 1,126 1,448 629 6 8 10 1,976 667 — — 6,056
12. Sciaanids 358 2,864 9,496 19,547 320 6,164 3,500 1,530 13,956 31,625 — — 89,360
13. Ribbon fish 142 928 1 5,646 7,862 179 12,937 1,499 1,089 11,550 10,858 — — — 62,690
14. (a) Caranx — 607 5.981 5,405 479 4,399 4,507 884 1,315 461 147 80 -— 24,265(b) Chorinemus 130 567 710 1,111 2 145 67 71 357 1.022 — — 4,182(c) Trachynotus — — — 38 2 - - - — - — 40(d) Other carangids — — 97 188 — 59 232 — 369 — — — — 945(e) Coryphaena — — 3 141 — 1 38 — — 20 — — — 302(I) Elacate — — 19 148 — 19 3 190 —- — — 379
15. (a) Leiognaftws 34 704 3,775 38,163 681 4,147 4,671 1,727 406 — 102 — — 54,400(b) Gazza — 3 56 84 — 1 42 — — — — — 186
16. Lactarius — 65 940 938 29 861 998 614 450 2,520 — — — 7,415
17. Pomfrets 921 9,072 2,201 1,306 188 907 696 257 10.081 12,587 15 — — 38,231
18. Mackerel — 265 6,203 7,229 445 18.474 19,634 2,446 288 112 183 — 55,279
19. Seer fish 234 1,542 2,970 7,179 85 3,763 1,941 735 3,219 4,180 117 21 25,986
20. Tunnies 34 419 4,233 — 10,611 952 356 1,674 277 55 1,760 — 20,371
21. Sphyraena — 8 88 932 55 330 84 171 33 67 14 — 1,782
22. MugiI 1 27 577 49 151 39 11 24 1,034 11 7 — — 2,030
23. Bregmaceros — — - . — — - - 159 757 - — 91 6
24. Soles 3 69 573 2,094 151 4,394 782 1,311 1,797 2,459 — - 13,633
25. (a) Penaeid prawns 152 1,074 5,660 9,082 485 52,633 3,098 1,853 23,433 14,481 54 —- 32 1,12,037(b) Non-penaeid 48 30 4,346 946 42 1,742 128 — 47,309 4,109 — —— 58,700(c) Lobsters 20 - 10 90 4 18 110 18 225 204 - 679(d) Other crustaceans 20 359 1.413 6,174 172 7,286 2.765 1,933 297 4.967 — - 25,386
26. Cephalopods 4 98 470 1,472 40 4,244 122 210 1,191 3,471 — 13 — 11,335
27. Miscellaneous 788 1,055 3,913 15,230 591 7,803 4,567 879 5,475 23,027 94 206 2,212 65,840
TOTAL 6,097 39,375 1,16,013 2,17,394 9,390 2,79,543 1,15,322 24,490 2,31,763 2,03,494 1,803 2,909 2,244 12,49,837
Partial coverage of larger trawlers
Source: Marine Fisheries Information Service, October 1981
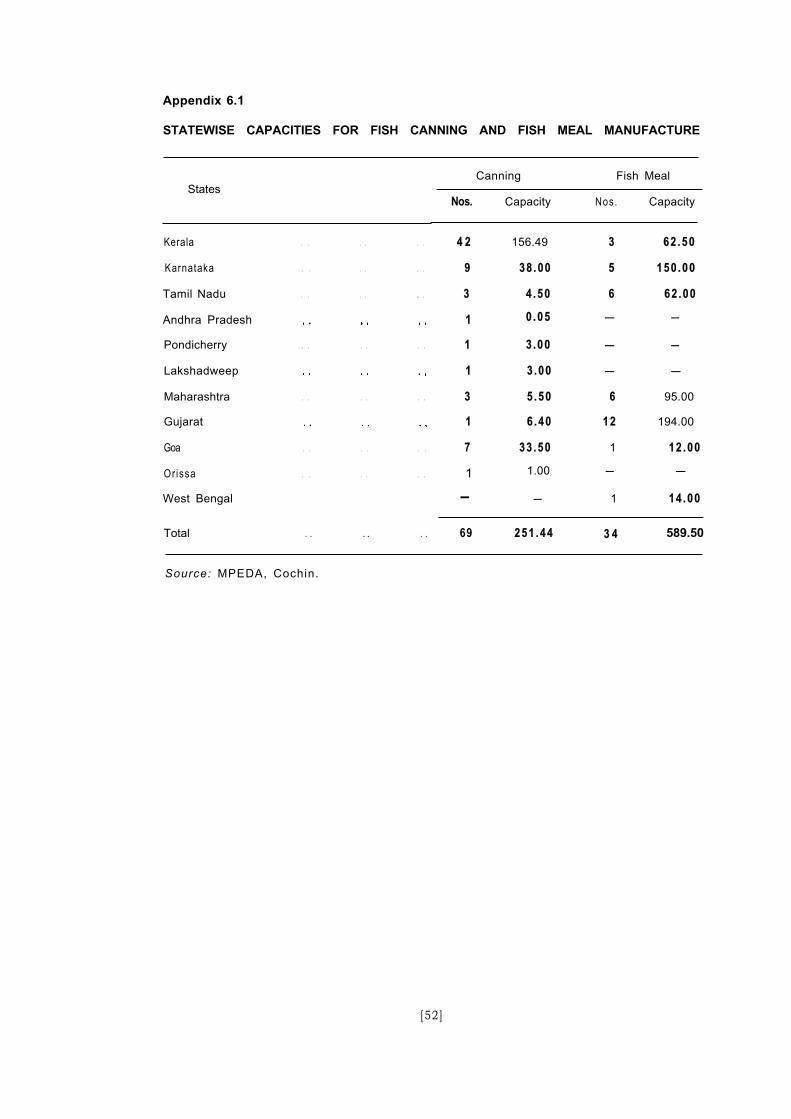
Appendix 6.1
STATEWISE CAPACITIES FOR FISH CANNING AND FISH MEAL MANUFACTURE
States
Kerala
Karnataka
Tamil Nadu
Andhra Pradesh
Pondicherry
Lakshadweep
Maharashtra
Gujarat
Goa
Orissa
West Bengal
. . . . . .
. . . . . .
. . . . .. .
. . . . . .
. . . . . .
. . . . . .
. . . . . .
Canning Fish Meal
Nos. Capacity Nos. Capacity
4 2
9
3
1
1
1
3
1
7
1
-
156.49 3 62 .50
38 .00 5 150 .00
4 .50 6 62 .00
0 .05 - -
3 .00 - -
3 .00 - -
5 .50 6 95.00
6 .40 12 194.00
33 .50 1 12 .00
1.00 - -
- 1 14 .00
Total . . . . . . 69 251 .44 3 4 589.50
Source: MPEDA, Cochin.
[52]
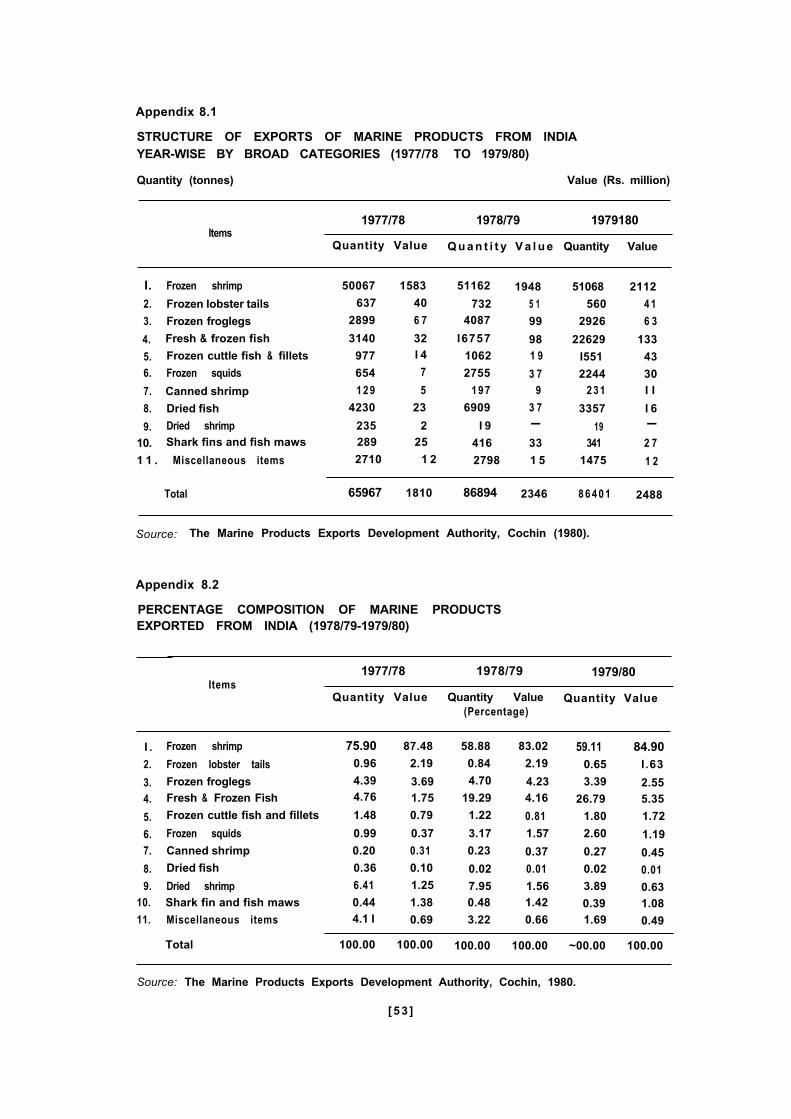
Appendix 8.1
STRUCTURE OF EXPORTS OF MARINE PRODUCTS FROM INDIAYEAR-WISE BY BROAD CATEGORIES (1977/78 TO 1979/80)
Quantity (tonnes) Value (Rs. million)
Items1977/78 1978/79 1979180
Quantity Value Q u a n t i t y V a l u e Quantity Value
I. Frozen shrimp 50067 1583 51162
2. Frozen lobster tails 637 40 732
3. Frozen froglegs 2899 6 7 4087
4. Fresh & frozen fish 3140 32 I6757
5. Frozen cuttle fish & fillets 977 I 4 1062
6. Frozen squids 654 7 2755
7. Canned shrimp 1 2 9 5 1 9 7
8. Dried fish 4230 23 6909
9. Dried shrimp 235 2 I 9
10. Shark fins and fish maws 289 25 416
1 1 . Miscellaneous items 2710 1 2 2798
Total 65967 1810 86894 2346 8 6 4 0 1 2488
1948
5 1
99
981 9
3 79
3 7-
33
1 5
51068
560
2926
22629
I551
22442 3 1
3357
19341
1475
2112
4 1
6 3
133
43
30I I
I 6-
2 7
1 2
Source: The Marine Products Exports Development Authority, Cochin (1980).
Appendix 8.2
PERCENTAGE COMPOSITION OF MARINE PRODUCTSEXPORTED FROM INDIA (1978/79-1979/80)
Items1977/78 1978/79 1979/80
Quantity Value Quantity Value Quantity Value(Percentage)
I .
2.
3.4.
5.
6.7.
8.
9.10.
11.
Frozen shrimp
Frozen lobster tails
Frozen froglegsFresh & Frozen Fish
Frozen cuttle fish and fillets
Frozen squids
Canned shrimp
Dried fish
Dried shrimpShark fin and fish maws
Miscellaneous items
75.90 87.48 58.88 83.02 59.11 84.900.96 2.19 0.84 2.19 0.65 I.634.39 3.69 4.70 4.23 3.39 2.554.76 1.75 19.29 4.16 26.79 5.351.48 0.79 1.22 0.81 1.80 1.72
0.99 0.37 3.17 1.57 2.60 1.190.20 0.31 0.23 0.37 0.27 0.450.36 0.10 0.02 0.01 0.02 0.016.41 1.25 7.95 1.56 3.89 0.630.44 1.38 0.48 1.42 0.39 1.084.1 I 0.69 3.22 0.66 1.69 0.49
Total 100.00 100.00 100.00 100.00 ~00.00 100.00
Source: The Marine Products Exports Development Authority, Cochin, 1980.
[53 ]
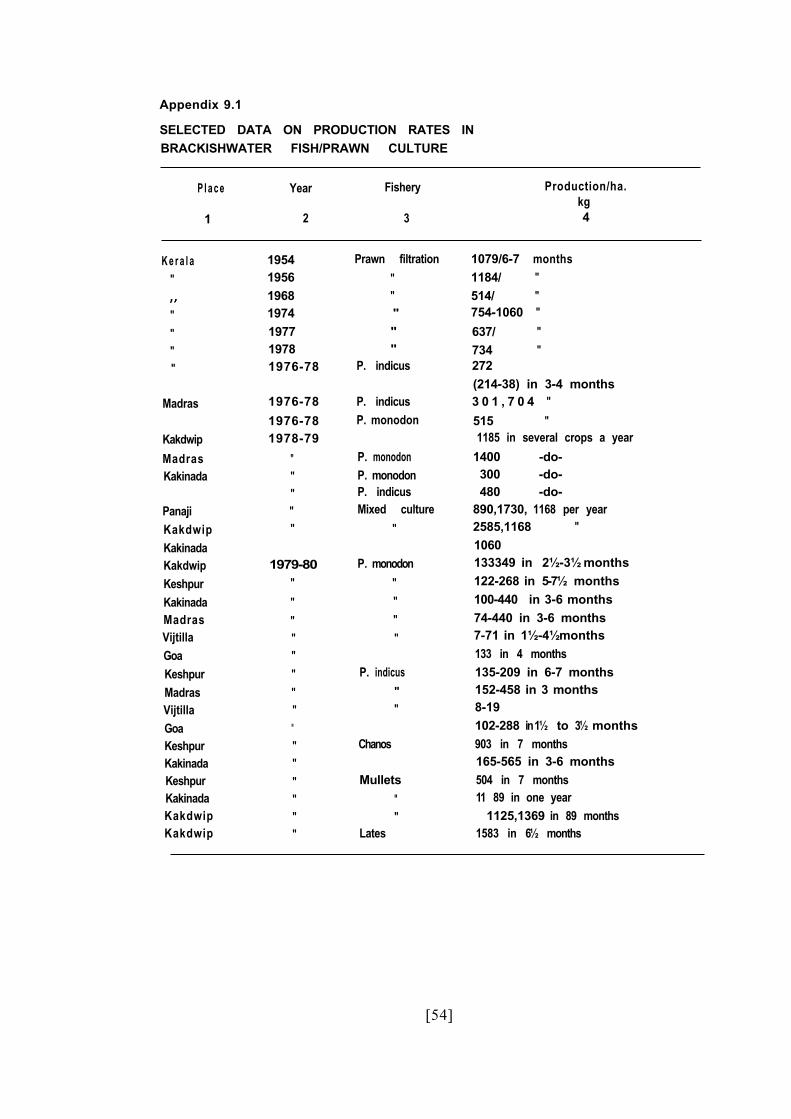
Appendix 9.1
SELECTED DATA ON PRODUCTION RATES INBRACKISHWATER FISH/PRAWN CULTURE
P l a c e Year Fishery
1 2 3
Production/ha.kg4
K e r a l a"
""""
Madras
Kakdwip
MadrasKakinada
PanajiKakdwipKakinadaKakdwipKeshpurKakinadaMadrasVijtillaGoaKeshpurMadrasVijtillaGoaKeshpurKakinadaKeshpurKakinadaKakdwipKakdwip
1954195619681974 "1977 "1978 "1976-78
1976-78
1976-781978-79
"""""
1979-80"
""""""""""""""
Prawn filtration
""
P. indicus
P. indicusP. monodon
P. monodonP. monodonP. indicusMixed culture
"
P. monodon
""""
P. indicus
""
Chanos
Mullets
""
Lates
1079/6-7 months1184/ "514/ "754-1060 "
637/ "734 "272(214-38) in 3-4 months3 0 1 , 7 0 4 "
515 "1185 in several crops a year
1400 -do-300 -do-480 -do-
890,1730, 1168 per year2585,1168 "1060133349 in 2½-3½ months122-268 in 5-7½ months100-440 in 3-6 months74-440 in 3-6 months7-71 in 1½-4½ months133 in 4 months135-209 in 6-7 months152-458 in 3 months8-19102-288 in 1½ to 3½ months903 in 7 months165-565 in 3-6 months504 in 7 months11 89 in one year
1125,1369 in 89 months1583 in 6½ months
[54]
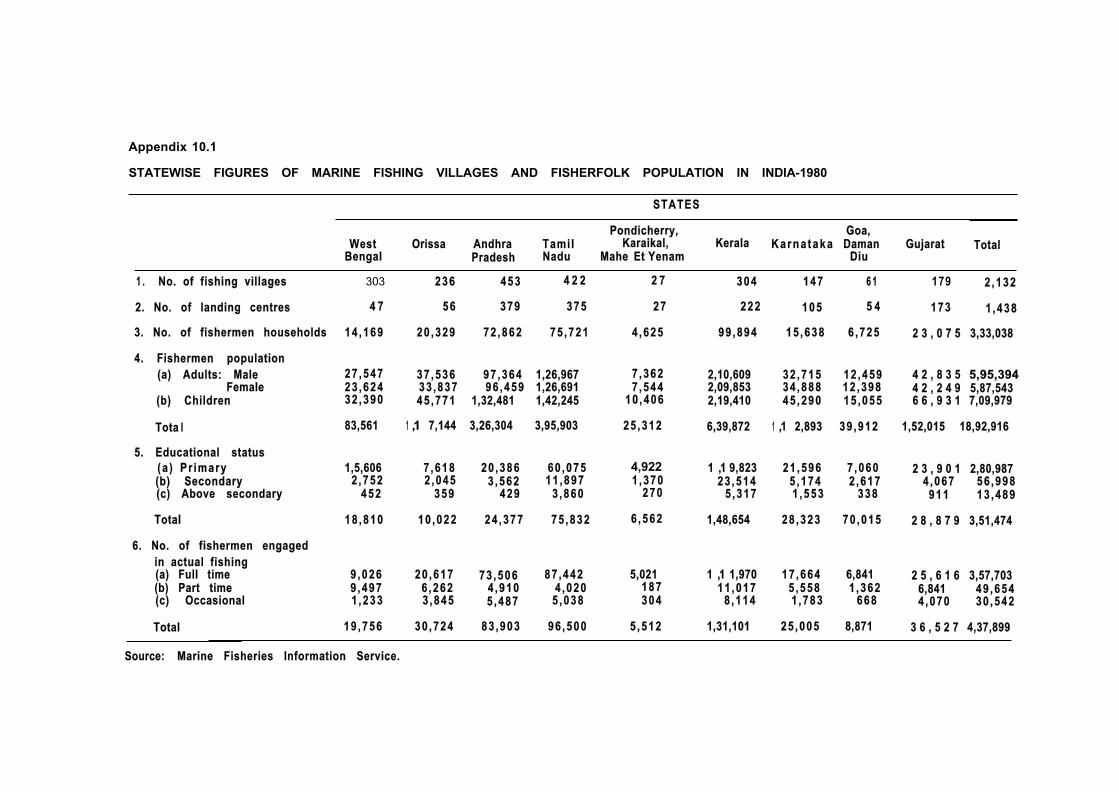
Appendix 10.1
STATEWISE FIGURES OF MARINE FISHING VILLAGES AND FISHERFOLK POPULATION IN INDIA-1980
STATES
WestBengal
Orissa Andhra TamilPradesh Nadu
Pondicherry,Karaikal,
Mahe Et YenamKerala
Goa,K a r n a t a k a Daman
DiuGujarat Total
1 . No. of fishing villages
2. No. of landing centres
3. No. of fishermen households
4 7
14 ,169
4. Fishermen population
(a) Adults: MaleFemale
(b) Children
Tota I
27 ,547 37 ,536 97 ,364 1,26,96723 ,624 33 ,837 96 ,459 1,26,69132 ,390 45 ,771 1,32,481 1,42,245
83,561 1 ,1 7,144 3,26,304 3,95,903
5. Educational status
(a ) Pr imary(b) Secondary(c) Above secondary
Total
1,5,606 7 ,618 20 ,386 60 ,0752 ,752 2 ,045 3 ,562 11 ,897
452 359 429 3 ,860
18 ,810 10 ,022 24 ,377 75 ,832
6. No. of fishermen engaged
in actual fishing(a) Full time(b) Part time(c) Occasional
9 ,0269 ,4971 ,233
Total 19 ,756
236 453 4 2 2 2 7 304 147 6 1 179 2 ,132
56 379 375 27 222 105 5 4 173 1 ,438
20 ,329 72 ,862 75 ,721 4 ,625 99 ,894 15 ,638 6 ,725 2 3 , 0 7 5 3,33,038
20 ,617 73 ,506 87 ,4426 ,262 4 ,910 4 ,0203 ,845 5 ,487 5 ,038
30 ,724 83 ,903 96 ,500
7 ,3627 ,544
10 ,406
25 ,312
4,9221 ,370
270
6 ,562
5,021187304
5 ,512
2,10,609 32 ,715 12 ,4592,09,853 34 ,888 12 ,3982,19,410 45 ,290 15 ,055
6,39,872 1 ,1 2,893 39 ,912
1 ,1 9,823 21 ,596 7 ,060 2 3 , 9 0 1 2,80,98723 ,514 5 ,174 2 ,617 4 ,067 56 ,998
5 ,317 1 ,553 338 911 13 ,489
1,48,654 28 ,323 70 ,015 2 8 , 8 7 9 3,51,474
1 ,1 1,970 17 ,664 6,841 2 5 , 6 1 6 3,57,70311 ,017 5 ,558 1 ,362 6,841 49 ,654
8 ,114 1 ,783 668 4 ,070 30 ,542
1,31,101 25 ,005 8,871 3 6 , 5 2 7 4,37,899
4 2 , 8 3 5 5,95,3944 2 , 2 4 9 5,87,5436 6 , 9 3 1 7,09,979
1,52,015 18,92,916
Source: Marine Fisheries Information Service.
303

[56]
APPENDIX- 11.1
ORGANISATIONAL SET-UP OF THE FISHERIES ADMINISTRATION
IN THE GOVERNMENT OF INDIA
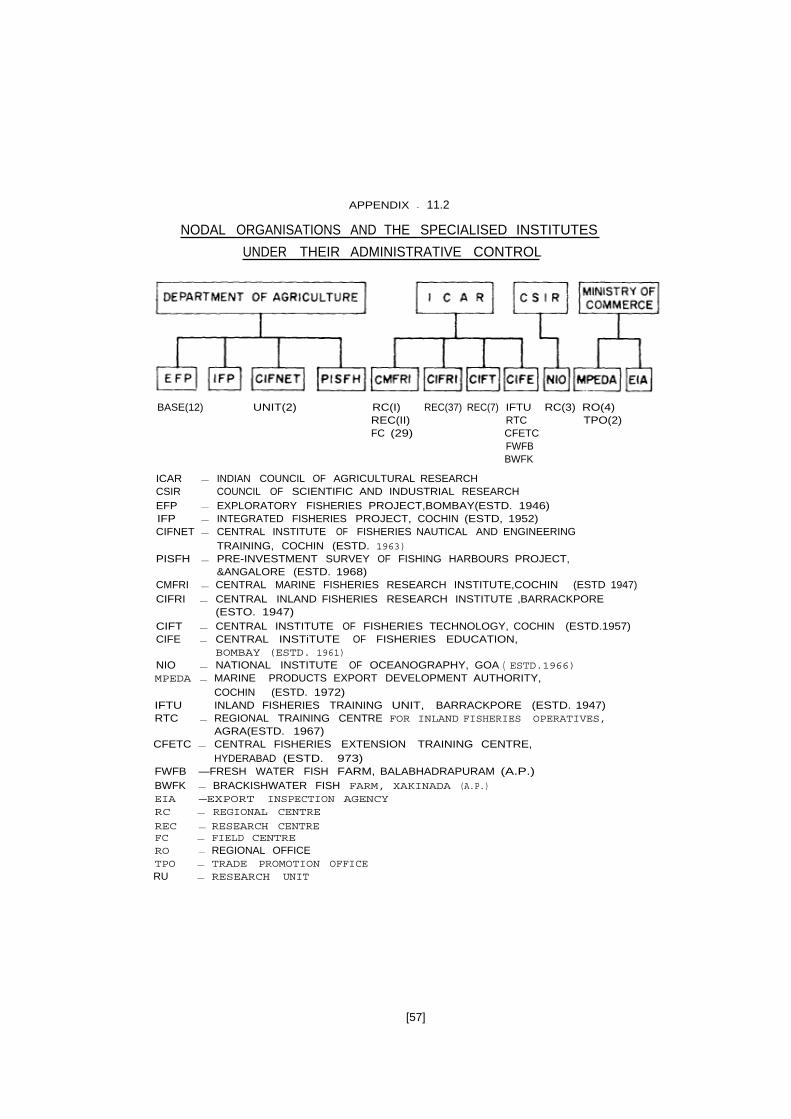
APPENDIX - 11.2
NODAL ORGANISATIONS AND THE SPECIALISED INSTITUTES
UNDER THEIR ADMINISTRATIVE CONTROL
BASE(12) UNIT(2) RC(I) REC(37) REC(7) IFTU RC(3) RO(4)REC(II) RTC TPO(2)FC (29) CFETC
FWFBBWFK
ICAR — INDIAN COUNCIL OF AGRICULTURAL RESEARCHCSIR COUNCIL OF SCIENTIFIC AND INDUSTRIAL RESEARCHEFP — EXPLORATORY FISHERIES PROJECT,BOMBAY(ESTD. 1946)IFP — INTEGRATED FISHERIES PROJECT, COCHIN (ESTD, 1952)CIFNET — CENTRAL INSTITUTE OF FISHERIES NAUTICAL AND ENGINEERING
TRAINING, COCHIN (ESTD. 1963)PISFH — PRE-INVESTMENT SURVEY OF FISHING HARBOURS PROJECT,
&ANGALORE (ESTD. 1968)CMFRI — CENTRAL MARINE FISHERIES RESEARCH INSTITUTE,COCHIN (ESTD 1947)CIFRI — CENTRAL INLAND FISHERIES RESEARCH INSTITUTE ,BARRACKPORE
(ESTO. 1947)CIFT — CENTRAL INSTITUTE OF FISHERIES TECHNOLOGY, COCHIN (ESTD.1957)CIFE — CENTRAL INSTiTUTE OF FISHERIES EDUCATION,
BOMBAY (ESTD. 1961)NIO — NATIONAL INSTITUTE OF OCEANOGRAPHY, GOA ( ESTD.1966)MPEDA — MARINE PRODUCTS EXPORT DEVELOPMENT AUTHORITY,
COCHIN (ESTD. 1972)IFTU INLAND FISHERIES TRAINING UNIT, BARRACKPORE (ESTD. 1947)RTC — REGIONAL TRAINING CENTRE FOR INLAND FISHERIES OPERATIVES,
AGRA(ESTD. 1967)CFETC — CENTRAL FISHERIES EXTENSION TRAINING CENTRE,
HYDERABAD (ESTD. 973)FWFB —FRESH WATER FISH FARM, BALABHADRAPURAM (A.P.)BWFK — BRACKISHWATER FISH FARM, XAKINADA (A.P.)EIA —EXPORT INSPECTION AGENCYRC — REGIONAL CENTRE
REC — RESEARCH CENTREFC — FIELD CENTRERO — REGIONAL OFFICETPO — TRADE PROMOTION OFFICERU — RESEARCH UNIT
[57]
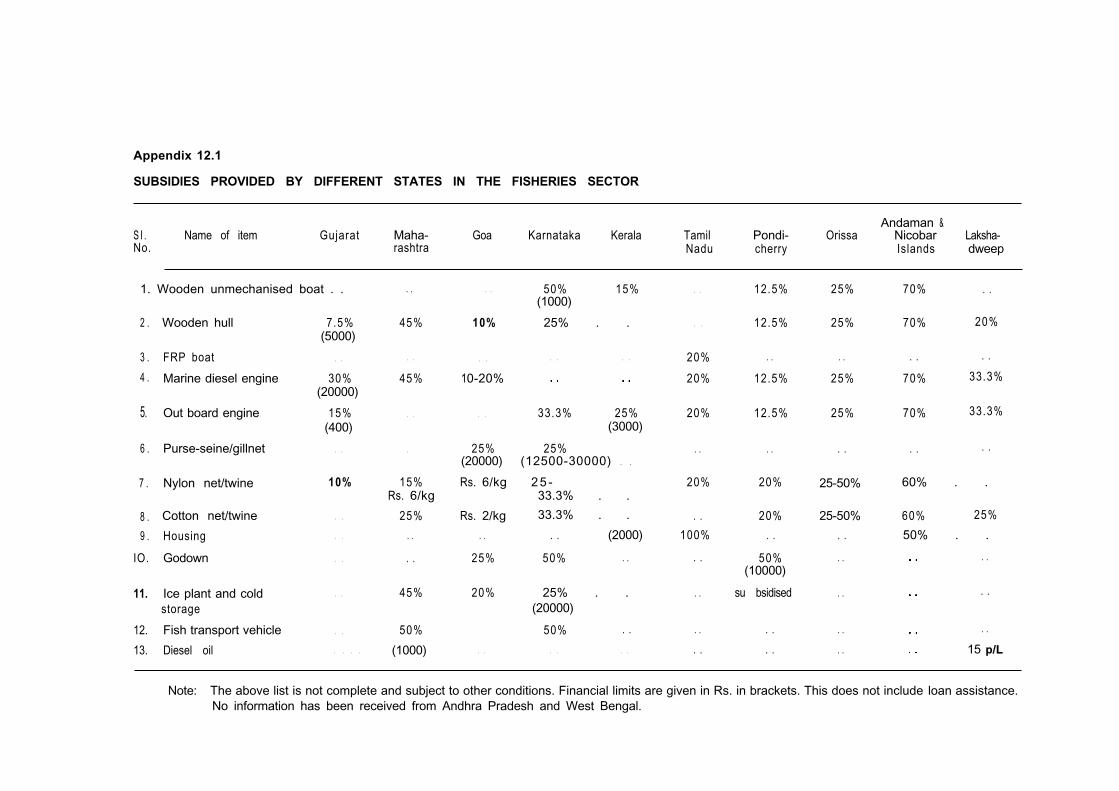
Appendix 12.1
SUBSIDIES PROVIDED BY DIFFERENT STATES IN THE FISHERIES SECTOR
S I .No.
Name of item Gujarat Maha-rashtra
Goa Karnataka Kerala TamilNadu
Pondi-cherry
Andaman &Orissa Nicobar Laksha-
Islands dweep
1. Wooden unmechanised boat . . . . 50% 15%(1000)
25% . .
12.5% 25%
12.5% 25%
. .
12.5%
. .
25%
12.5% 25%
. . . .
20%
20%
. .
50%(10000)
su bsidised
25-50%
25-50%
. .
. .
. .
. .
. .
. .
. .
70% . .
70% 20%
. . . .
70% 33.3%
70% 33.3%
. . . .
60% . .
60% 25%
50% . .
. .
. .
. .
15 p/L
. . . .
. .
20%
20%
20%
. .
20%
. .
100%
. .
. .
. .
. .
2 .
3 .
4 .
Wooden hull 7.5%(5000)
45% 10%
FRP boat
Marine diesel engine
. .
30%(20000)
. .
45%
. .
1 0-20%
. . . .
5. Out board engine 15%(400)
33.3% 25%(3000)
25%(12500-30000) . .
25 -33.3% . .
33.3% . .
. . (2000)
50% . .
. . . .
6 . Purse-seine/gillnet 25%(20000)
Rs. 6/kg
. . .
7 . Nylon net/twine 10% 15%Rs. 6/kg
25%
. .
. .
8 . Cotton net/twine
9 . Housing
IO. Godown
Rs. 2/kg
. .
25%
. .
. .
. .
11. Ice plant and coldstorage
Fish transport vehicle
Diesel oil
45% 20% 25% . .(20000)
50% . .
. .
12.
13.
50%
(1000)
. .
. . . . . . . . . .
Note: The above list is not complete and subject to other conditions. Financial limits are given in Rs. in brackets. This does not include loan assistance.No information has been received from Andhra Pradesh and West Bengal.
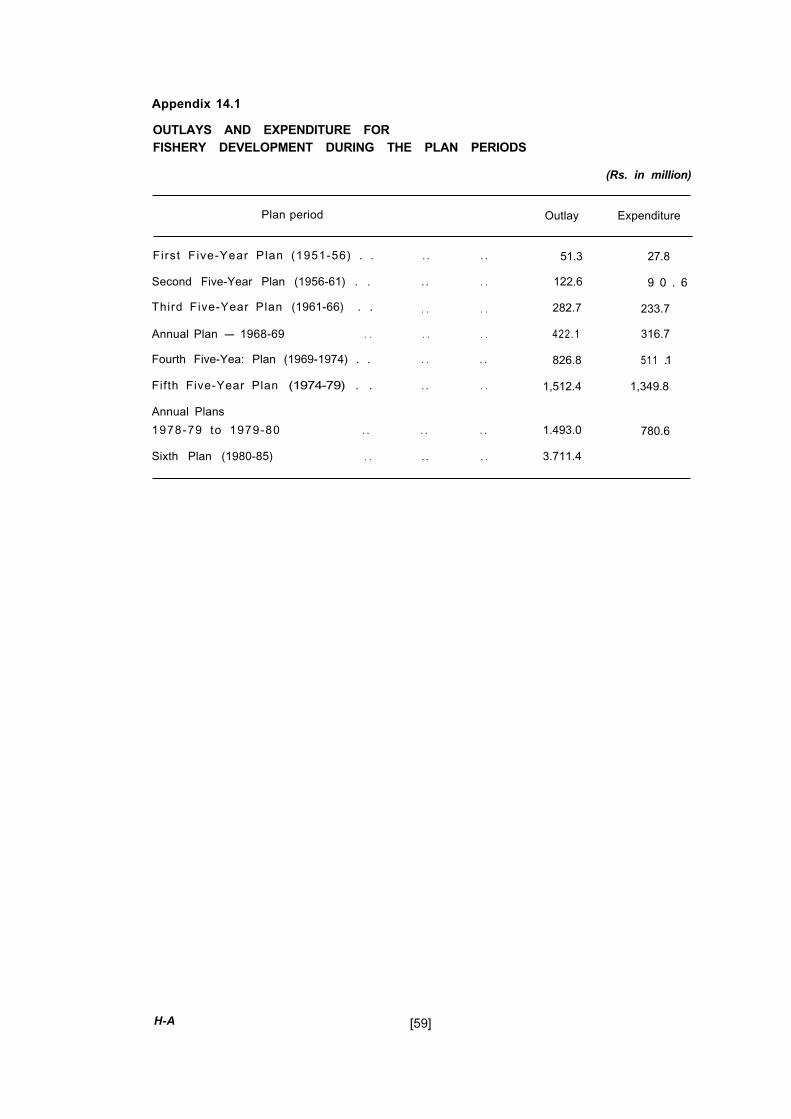
Appendix 14.1
OUTLAYS AND EXPENDITURE FORFISHERY DEVELOPMENT DURING THE PLAN PERIODS
(Rs. in million)
Plan period Outlay Expenditure
First Five-Year Plan (1951-56) . .
Second Five-Year Plan (1956-61) . .
Third Five-Year Plan (1961-66) . .
Annual Plan - 1968-69 . .
Fourth Five-Yea: Plan (1969-1974) . .
Fifth Five-Year Plan (1974-79) . .
Annual Plans
1978-79 to 1979-80 . .
Sixth Plan (1980-85) . .
. .
. .
. .
. .
. .
. .
. .
. .
. .
. .
. .
. .
. .
. .
. .
. .
51.3 27.8
122.6 9 0 . 6
282.7 233.7
422.1 316.7
826.8 511 .1
1,512.4 1,349.8
1.493.0 780.6
3.711.4
H-A [59]
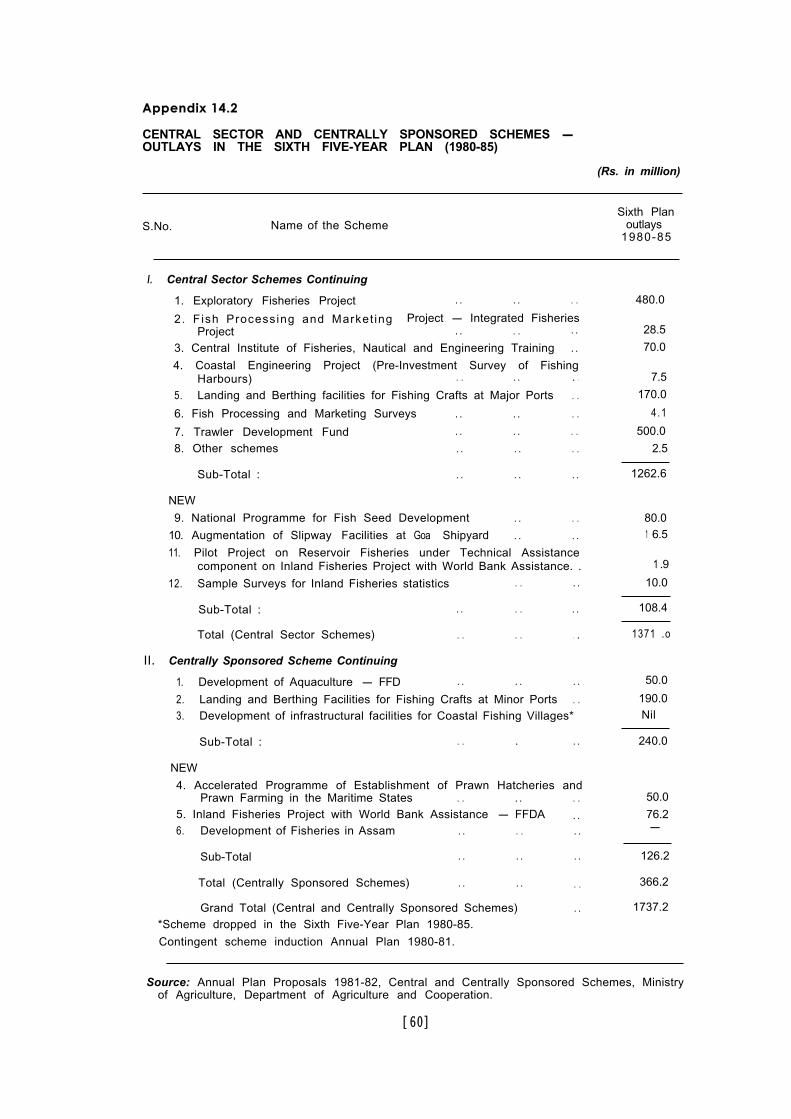
Appendix 14.2
CENTRAL SECTOR AND CENTRALLY SPONSORED SCHEMES -OUTLAYS IN THE SIXTH FIVE-YEAR PLAN (1980-85)
(Rs. in million)
S.No. Name of the SchemeSixth Plan
outlays1980-85
I . Central Sector Schemes Continuing
1. Exploratory Fisheries Project . . . . . .
2 . F ish Processing and Market ing Project - Integrated FisheriesProject . . . . . .
3. Central Institute of Fisheries, Nautical and Engineering Training . .
4. Coastal Engineering Project (Pre-Investment Survey of FishingHarbours) . . . . . .
5. Landing and Berthing facilities for Fishing Crafts at Major Ports . .
6. Fish Processing and Marketing Surveys . . . . . .
7. Trawler Development Fund . . . . . .
8. Other schemes . . . . . .
480.0
28.5
70.0
7.5
170.0
4.1
500.0
2.5
Sub-Total : . . . . . . 1262.6
NEW
9. National Programme for Fish Seed Development . . . .
10. Augmentation of Slipway Facilities at Goa Shipyard . . . .
11. Pilot Project on Reservoir Fisheries under Technical Assistancecomponent on Inland Fisheries Project with World Bank Assistance. .
12. Sample Surveys for Inland Fisheries statistics . . . .
80.01 6.5
1 .9
10.0
Sub-Total : . . . . . . 108.4
Total (Central Sector Schemes) . . . . . . 1371 .o
I I . Centrally Sponsored Scheme Continuing
1. Development of Aquaculture - FFD . . . . . . 50.0
2. Landing and Berthing Facilities for Fishing Crafts at Minor Ports . . 190.0
3. Development of infrastructural facilities for Coastal Fishing Villages* Nil
Sub-Total : . . . . . 240.0
NEW
4. Accelerated Programme of Establishment of Prawn Hatcheries andPrawn Farming in the Maritime States . . . . . .
5. Inland Fisheries Project with World Bank Assistance - FFDA . .6. Development of Fisheries in Assam . . . . . .
50.0
76.2-
Sub-Total . . . . . . 126.2
Total (Centrally Sponsored Schemes) . . . . . . 366.2
Grand Total (Central and Centrally Sponsored Schemes)*Scheme dropped in the Sixth Five-Year Plan 1980-85.
Contingent scheme induction Annual Plan 1980-81.
. . 1737.2
Source: Annual Plan Proposals 1981-82, Central and Centrally Sponsored Schemes, Ministryof Agriculture, Department of Agriculture and Cooperation.
[60]
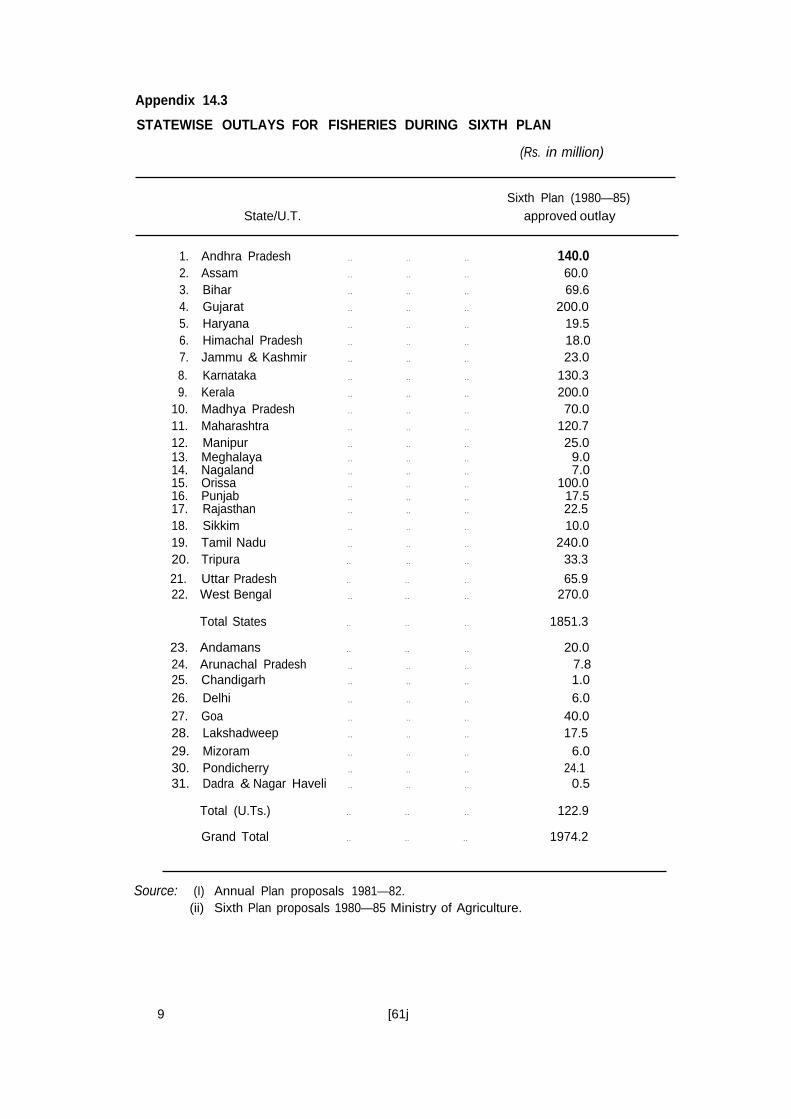
Appendix 14.3
STATEWISE OUTLAYS FOR FISHERIES DURING SIXTH PLAN
(Rs. in million)
Sixth Plan (1980—85)State/U.T. approved outlay
1. Andhra Pradesh .. .. .. 140.02. Assam .. .. .. 60.03. Bihar .. .. .. 69.64. Gujarat .. .. .. 200.05. Haryana .. .. .. 19.56. Himachal Pradesh .. .. .. 18.07. Jammu & Kashmir .. .. .. 23.08. Karnataka .. .. .. 130.39. Kerala .. .. .. 200.0
10. Madhya Pradesh .. .. .. 70.011. Maharashtra .. .. .. 120.712. Manipur .. .. .. 25.013. Meghalaya .. .. .. 9.014. Nagaland .. .. .. 7.015. Orissa .. .. .. 100.016. Punjab .. .. .. 17.517. Rajasthan .. .. .. 22.518. Sikkim .. .. .. 10.019. Tamil Nadu .. .. .. 240.020. Tripura .. .. .. 33.3
21. Uttar Pradesh .. .. .. 65.922. West Bengal .. .. .. 270.0
Total States .. .. .. 1851.3
23. Andamans .. .. .. 20.024. Arunachal Pradesh .. .. .. 7.825. Chandigarh .. .. .. 1.026. Delhi .. .. .. 6.027. Goa .. .. .. 40.028. Lakshadweep .. .. .. 17.529. Mizoram .. .. .. 6.030. Pondicherry .. .. .. 24.131. Dadra & Nagar Haveli .. .. .. 0.5
Total (U.Ts.) .. .. .. 122.9
Grand Total .. .. .. 1974.2
Source: (I) Annual Plan proposals 1981—82.(ii) Sixth Plan proposals 1980—85 Ministry of Agriculture.
9 [61j
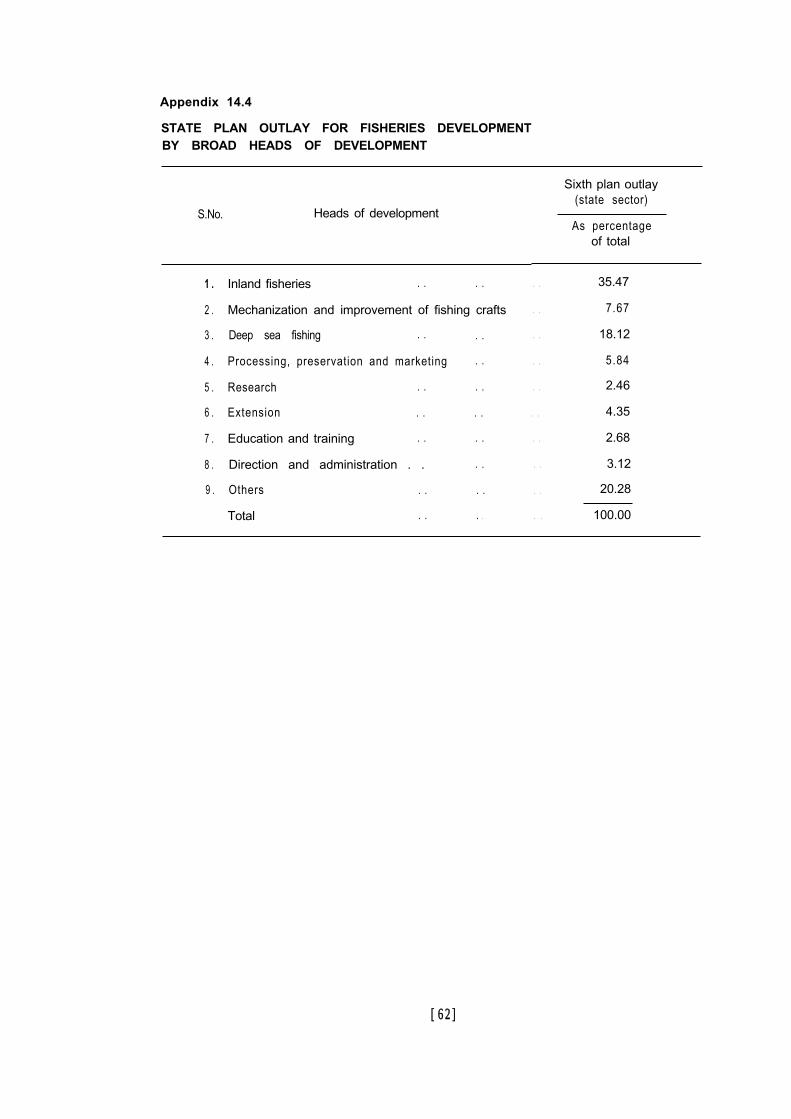
Appendix 14.4
STATE PLAN OUTLAY FOR FISHERIES DEVELOPMENTBY BROAD HEADS OF DEVELOPMENT
S.No. Heads of development
1 .
2 .
3 .
4 .
5 .
6 .
7 .
8 .
9 .
Inland fisheries . . . .
Mechanization and improvement of fishing crafts
Deep sea fishing . .
Processing, preservation and marketing
Research . .
Extension . .
Education and training . .
Direction and administration . .
Others . .
Total . .
. .
. .
. .
. .
. .
. .
. .
. .
Sixth plan outlay(state sector)
As percentageof total
. . 35.47
. . 7.67
. . 18.12
. . 5.84
. . 2.46
. . 4.35
. . 2.68
. . 3.12
. . 20.28
. . 100.00
[62]
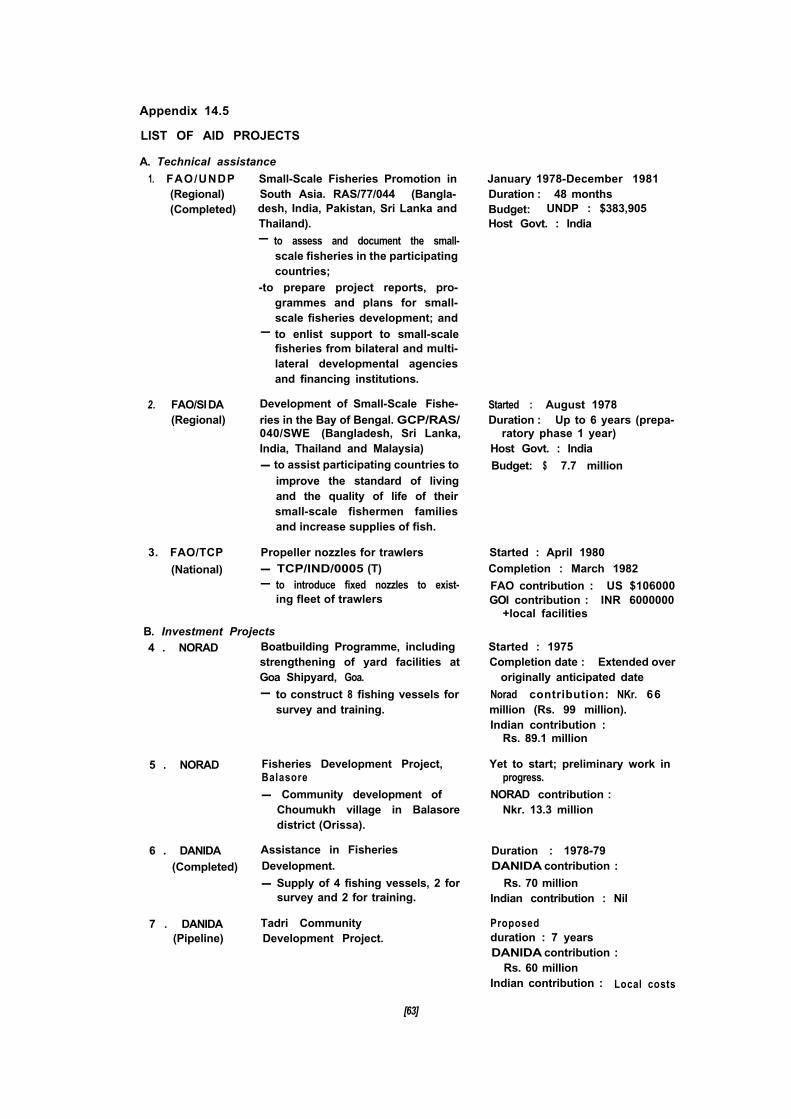
Appendix 14.5
LIST OF AID PROJECTS
A. Technical assistance
1. FAO/UNDP Small-Scale Fisheries Promotion in(Regional) South Asia. RAS/77/044 (Bangla-(Completed) desh, India, Pakistan, Sri Lanka and
Thailand).- to assess and document the small-
scale fisheries in the participatingcountries;
-to prepare project reports, pro-grammes and plans for small-scale fisheries development; and
- to enlist support to small-scalefisheries from bilateral and multi-lateral developmental agenciesand financing institutions.
2. FAO/SIDA(Regional)
Development of Small-Scale Fishe-ries in the Bay of Bengal. GCP/RAS/040/SWE (Bangladesh, Sri Lanka,India, Thailand and Malaysia)- to assist participating countries to
improve the standard of livingand the quality of life of theirsmall-scale fishermen familiesand increase supplies of fish.
3. FAO/TCP
(National)
Propeller nozzles for trawlers- TCP/IND/0005 (T)- to introduce fixed nozzles to exist-
ing fleet of trawlers
B. Investment Projects4 . NORAD Boatbuilding Programme, including
strengthening of yard facilities atGoa Shipyard, Goa.- to construct 8 fishing vessels for
survey and training.
5 . NORAD Fisheries Development Project,Balasore
- Community development ofChoumukh village in Balasoredistrict (Orissa).
Yet to start; preliminary work inprogress.
NORAD contribution :Nkr. 13.3 million
6 . DANIDA Assistance in Fisheries Duration : 1978-79(Completed) Development. DANIDA contribution :
- Supply of 4 fishing vessels, 2 for Rs. 70 millionsurvey and 2 for training. Indian contribution : Nil
7 . DANIDA(Pipeline)
Tadri CommunityDevelopment Project.
Proposedduration : 7 yearsDANIDA contribution :
Rs. 60 millionIndian contribution : Local costs
January 1978-December 1981Duration : 48 monthsBudget: UNDP : $383,905Host Govt. : India
Started : August 1978Duration : Up to 6 years (prepa-
ratory phase 1 year)Host Govt. : India
Budget: $ 7.7 million
Started : April 1980Completion : March 1982
FAO contribution : US $106000GOI contribution : INR 6000000
+local facilities
Started : 1975Completion date : Extended over
originally anticipated date
Norad contribution: NKr. 66million (Rs. 99 million).Indian contribution :
Rs. 89.1 million
[63]
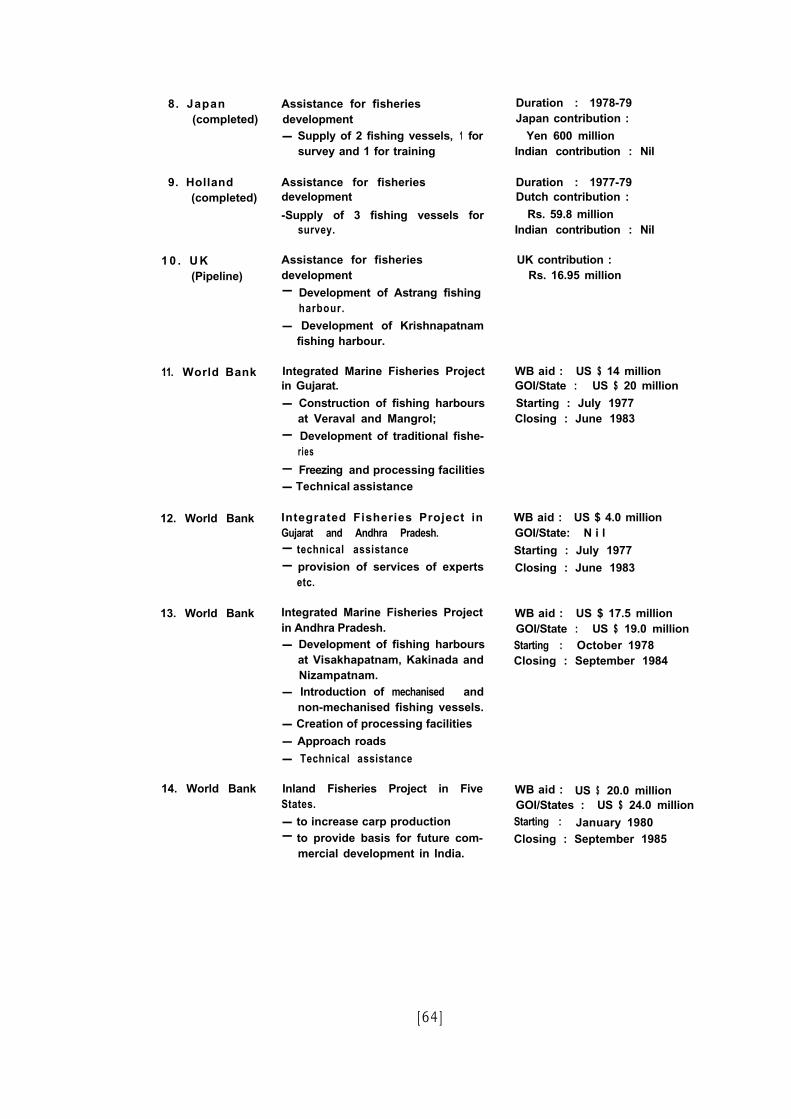
8. Japan(completed)
9. Holland(completed)
1 0 . U K(Pipeline)
11. World Bank
12. World Bank
13. World Bank
14. World Bank
Assistance for fisheriesdevelopment- Supply of 2 fishing vessels, 1 for
survey and 1 for training
Assistance for fisheriesdevelopment
-Supply of 3 fishing vessels forsurvey.
Assistance for fisheriesdevelopment- Development of Astrang fishing
harbour.
- Development of Krishnapatnamfishing harbour.
Integrated Marine Fisheries Projectin Gujarat.
- Construction of fishing harboursat Veraval and Mangrol;
- Development of traditional fishe-ries
- Freezing and processing facilities- Technical assistance
Integrated Fisheries Project inGujarat and Andhra Pradesh.- technical assistance- provision of services of experts
etc.
Integrated Marine Fisheries Projectin Andhra Pradesh.- Development of fishing harbours
at Visakhapatnam, Kakinada andNizampatnam.
- Introduction of mechanised andnon-mechanised fishing vessels.
- Creation of processing facilities
- Approach roads
- Technical assistance
Inland Fisheries Project in FiveStates.
- to increase carp production- to provide basis for future com-
mercial development in India.
Duration : 1978-79Japan contribution :
Yen 600 millionIndian contribution : Nil
Duration : 1977-79Dutch contribution :
Rs. 59.8 millionIndian contribution : Nil
UK contribution :Rs. 16.95 million
WB aid : US $ 14 millionGOI/State : US $ 20 million
Starting : July 1977Closing : June 1983
WB aid : US $ 4.0 millionGOI/State: N i l
Starting : July 1977
Closing : June 1983
WB aid : US $ 17.5 millionGOI/State : US $ 19.0 millionStarting : October 1978Closing : September 1984
WB aid : US $ 20.0 millionGOI/States : US $ 24.0 millionStarting : January 1980Closing : September 1985
[64]

Publications of the Bay of Bengal Programme (BOBP)
Development of Small-Scale Fisheries (GCP/RAS/040/SWE)
Reports (BOBPIREPI. . . .)
1 .
2.
3.
4.
5.
6 .
7.
8.
9.
10.1
10.2
11.
12.
13.
14.
15.
Report of the First Meeting of the Advisory Committee.Colombo, Sri Lanka, 28-29 October 1976.(Published as Appendix I of lOFC/DEV/78/44.1, FAO, Rome, 1978)
Report of the Second Meeting of the Advisory Committee.Madras, India, 29-30 June 1977.(Published as Appendix 2 of IOFC/DEV/78/44.1, FAO, Rome, 1978)
Report of the Third Meeting of the Advisory Committee.Chittagong, Bangladesh, 1-10 November 1978. Colombo, Sri Lanka, 1978.(Reissued Madras, India, September 1980)
Role of Women in Small-Scale Fisheries of the Bay of Bengal.Madras, India, October 1980.
Report of the Workshop on Social Feasibility in Small-Scale Fisheries Development.Madras, India, 3-8 September 1979. Madras, India, April 1980.
Report of the Workshop on Extension Service Requirements in Small-Scale Fisheries.Colombo, Sri Lanka, 8-12 October 1979. Madras, India, June 1980.
Report of the Fourth Meeting of the Advisory Committee.Phuket, Thailand, 27-30 November 1979. Madras, India, February 1980.
Pre-Feasibility Study of a Floating Fish Receiving and Distribution Unit for Dubla Char,Bangladesh. G. Eddie, M. T. Nathan. Madras, India, April 1980.
Report of the Training Course for Fish Marketing Personnel of Tamil Nadu.Madras, India, 3-14 December 1979. Madras, India, September 1980.
Report of the Consultation on Stock Assessment for Small-Scale Fisheries in theBay of Bengal. Chittagong, Bangladesh, 16-21 June 1980.Volume 1 : Proceedings. Madras, India, September 1980.
Report of the Consultation on Stock Assessment for Small-Scale Fisheries in theBay of Bengal. Chittagong, Bangladesh, 16-21 June 1980.Volume 2 : Papers. Madras, India, October 1980.
Report of the Fifth Meeting of the Advisory Committee, Penang, Malaysia,4-7 November 1980. Madras, India, January 1981.
Report of the Training Course for Fish Marketing Personnel of Andhra Pradesh.Hyderabad, India, 11-26 November 1980. Madras, India, September 1981.
Report of the Sixth Meeting of the Advisory Committee.Colombo, Sri Lanka, 1-5 December 1981. Madras, India, February 1982.
Report of the First Phase of the “Aquaculture Demonstration for Small-Scale FisheriesDevelopment Project” in Phang Nga Province, Thailand. Madras, India, March 1982.
Report of the Consultation-cum-Workshop on Development of Activities for Improve-ment of Coastal Fishing Families. Dacca, Bangladesh, October 27-November 6, 1981.Madras, India, May 1982.
[ 6 5 ]
Working Papers (BOBP/WP/.. . .)
1.
2.
3.
4.
5.
6.
7.
8.
9.
10.
11.
12.
13.
14.
15.
16.
17.
18.
Investment Reduction and Increase in Service Life of Kattumaram Logs.R. Balan. Madras, India, February 1980.
Inventory of Kattumarams and their Fishing Gear in Andhra Pradesh and Tamil Nadu.T. R. Menon. Madras, India, October 1980.
Improvement of Large-Mesh Driftnets for Small-Scale Fisheries in Sri Lanka.G. Pajot. Madras, June 1980.
Inboard Motorisation of Small G.R.P. Boats in Sri Lanka.Madras, India, September 1980.
Improvement of Large-Mesh Driftnets for Small-Scale Fisheries in Bangladesh.G. Pajot. Madras, India, September 1980.
Fishing Trials with Bottom-Set Longlines in Sri Lanka.G. Pajot, K. T. Weerasooriya. Madras, India, September 1980.
Technical Trials of Beachcraft Prototypes in India.f Gulbrandsen, G. P. Gowing, R. Ravikumar. Madras, India, October 1980.
Current Knowledge of Fisheries Resources in the Shelf Area of the Bay of Bengal.B. T. Antony Raja. Madras, India, September 1980.
Boatbuilding Materials for Small-Scale Fisheries in India.Madras, India, October 1980.
Fishing Trials with High-Opening Bottom Trawls in Tamil Nadu, India.G. Pajot, John Crockett. Madras, India, October 1980.
The Possibilities for Technical Cooperation between Developing Countries (TCDC) inFisheries. E. H. Nichols. Madras, India, August 1981.
Trials in Bangladesh of Large-Mesh Driftnets of Light Construction.G. Pajot, T. K. Das. Madras, India, October 1981.
Trials of Two-Boat Bottom Trawling in Bangladesh.G. Pajot, J. Crockett. Madras, India, October 1981.
Three Fishing Villages in Tamil Nadu.Edeltraud Drewes. Madras, India, February 1982.
Pilot Survey of Driftnet Fisheries in Bangladesh.M. Bergstrom. Madras, India, May 1982.
Further Trials with Bottom Longlines in Sri Lanka. Madras, India, July 1982.
Exploration of the Possibilities of Coastal Aquaculture Development in Andhra Pradesh.Soleh Samsi, Sihar Siregar and Martono of the Directorate General of Fisheries, Jakarta,
Indonesia. Madras, India, August 1982.
Review of Brackishwater Aquaculture Development in Tamil Nadu.Kasemsant Chalayondeja and Anant Saraya of the Department of Fisheries, Thailand.Madras, India, September 1982.
Miscellaneous Papers (BOBP/MIS/. . . . )
1. Fishermen’s Cooperatives in Kerala : A Critique.John Kurien. Madras, India, October 1980.
[66]
Newsletters:
Bay of Bengal News. January 1981, May 1981, September 1981, December 1981,March 1982, June 1982, September 1982.
information Documents: (BOBP/INF/.. . .)
1. Women and Rural Development in the Bay of Bengal Region :Information Sources. Madras, India, February 1982.
2. Fish Aggregation Devices : Information Sources.Madras, India, February 1982.
3. Marine Small-Scale Fisheries of India : A General Description.Madras, India, October 1982.
Published by the Bay of Bengal Programme, FAO, 91, St. Mary’s Road, Abhiramapuram,Madras 600 018, India. Printed at Amra Press, Madras 600 041.


