Journal of Economic Perspectives—Volume 29, Number 4—Fall 2015—Pages 37–60 C hief executive officers of major corporations have often had larger-than-life images in American culture. CEOs regularly grace magazine covers and news headlines. Four times in the last 25 years Time magazine has selected CEOs of US corporations as their “Person of the Year”: Ted Turner, Andrew Grove, Jeff Bezos, and Mark Zuckerberg. Prominent advertising campaigns have linked the images of companies with the images of their high-profile CEOs—think Lee Iacocca and Chrysler, or Dave Thomas and Wendy’s. CEOs also author books to share their stories and advice with the world. Andrew Grove of Intel, for example, has written four such books: Only the Paranoid Survive: How to Exploit the Crisis Points That Chal- lenge Every Company ; One-on-One with Andy Grove: How to Manage Your Boss, Yourself, and Your Coworkers ; High Output Management ; and Swimming Across: A Memoir . They even appear on popular television shows (for example, Bill Gates on Frasier and Lee Iacocca on Miami Vice ) and run for major political offices including President of the United States (for example, Ross Perot of Electronic Data Systems and Perot Systems in 1992 and Carly Fiorina of HP in 2016). All of these examples suggest an image of CEOs that is deeply rooted in self-confidence, and many CEOs actively cultivate their public personas. Thus, it is not surprising that when investment decisions turn out badly, the CEO is often Behavioral CEOs: The Role of Managerial Overconfidence † ■ Ulrike Malmendier is Edward J. and Mollie Arnold Professor of Finance at the Haas School of Business and Professor of Economics, University of California, Berkeley, California. Geoffrey Tate is Associate Professor of Finance, Kenan-Flagler Business School, University of North Carolina, Chapel Hill, North Carolina. Their email addresses are [email protected]and [email protected]. † For supplementary materials such as appendices, datasets, and author disclosure statements, see the article page at http://dx.doi.org/10.1257/jep.29.4.37 doi=10.1257/jep.29.4.37 Ulrike Malmendier and Geoffrey Tate
Transcript
Journal of Economic Perspectives—Volume 29, Number 4—Fall 2015—Pages 37–60
C hief executive officers of major corporations have often had larger-than-life images in American culture. CEOs regularly grace magazine covers and news headlines. Four times in the last 25 years Time magazine has selected
CEOs of US corporations as their “Person of the Year”: Ted Turner, Andrew Grove, Jeff Bezos, and Mark Zuckerberg. Prominent advertising campaigns have linked the images of companies with the images of their high-profile CEOs—think Lee Iacocca and Chrysler, or Dave Thomas and Wendy’s. CEOs also author books to share their stories and advice with the world. Andrew Grove of Intel, for example, has written four such books: Only the Paranoid Survive: How to Exploit the Crisis Points That Chal-lenge Every Company; One-on-One with Andy Grove: How to Manage Your Boss, Yourself, and Your Coworkers; High Output Management; and Swimming Across: A Memoir. They even appear on popular television shows (for example, Bill Gates on Frasier and Lee Iacocca on Miami Vice) and run for major political offices including President of the United States (for example, Ross Perot of Electronic Data Systems and Perot Systems in 1992 and Carly Fiorina of HP in 2016).
All of these examples suggest an image of CEOs that is deeply rooted in self-confidence, and many CEOs actively cultivate their public personas. Thus, it is not surprising that when investment decisions turn out badly, the CEO is often
Behavioral CEOs: The Role of Managerial Overconfidence†
■ Ulrike Malmendier is Edward J. and Mollie Arnold Professor of Finance at the Haas School of Business and Professor of Economics, University of California, Berkeley, California. Geoffrey Tate is Associate Professor of Finance, Kenan-Flagler Business School, University of North Carolina, Chapel Hill, North Carolina. Their email addresses are [email protected] and [email protected].† For supplementary materials such as appendices, datasets, and author disclosure statements, see the article page athttp://dx.doi.org/10.1257/jep.29.4.37 doi=10.1257/jep.29.4.37
Ulrike Malmendier and Geoffrey Tate
38 Journal of Economic Perspectives
accused of overconfidence. A famous example is Steve Case’s merger of AOL with Time Warner in 2000. Initially, the proposed merger was hailed as two firms “impeccably complementing each other’s businesses” (reported in Dugan and Cha 2000). However, as stock prices dropped, AOL’s operating performance suffered (−30 percent by mid-2002) and the merged company had to write down $54 billion in goodwill related to the deal (Peers and Angwin 2003), the failure was swiftly attributed to Steve Case being “over-ambitious,” and to his “hubris” and “magical thinking” (The Economist 2002). The deal is now sometimes considered the “worst merger of all time” (McGrath 2015).
Other famous examples revolve around merger contests. Extended bidding wars often lead to value losses for the shareholders of the acquiring firms (Malmendier, Moretti, and Peters 2015). For example, when Sumner M. Redstone of Viacom won an extended competition with QVC to acquire Paramount in 1994, the target was deemed to be so overpriced that Viacom’s stock plummeted and the company found itself under a devastating debt burden (Fabrikant 1994; Hietala, Kaplan, and Robinson 2003; Kamar 2009).
Are the accusations of managerial hubris, as voiced by practitioners and often by politicians, justified? While such events carry a whiff (perhaps even a stench) of overconfidence, they offer no systematic evidence that these CEOs in particular, or CEOs as a group, are indeed overconfident, nor do they suggest what consequences might flow from that overconfidence.
In the social and experimental psychology literatures, overconfidence and other self-serving biases have had a prominent position for many decades (for example, Svensson 1981; Miller and Ross 1975; Alicke 1985; Larwood and Whittaker 1977). By comparison, managerial biases have only begun to receive serious attention in the economics and finance literatures. Building on the early work of Roll (1986), Shefrin (2001), Statman and Sepe (1989), and Heaton (2002), the last decade has seen considerable growth in research taking this perspective. By our count, about two dozen articles in top economics and finance journals have been published on the topic since the publication of our paper Malmendier and Tate (2005), along with the appearance of a myriad of other publications and working papers. Reversing earlier resistance against the notion that top managers could make systematically biased decisions, corporate finance research has started to catch up.1
1 Beyond overconfidence, studies have also analyzed a number of other decision biases of top executives. For example, Baker, Pan, and Wurgler (2012) consider the role of reference points and anchoring and show that prior stock price peaks affect mergers and acquisitions through offer prices, deal success, and bidders’ announcement effects. Baker and Wurgler (2013) survey literature on how bounded rationality could explain the adoption of capital budgeting criteria, and how loss aversion could explain investment patterns such as “throwing good money after bad.” Other research on mana-gerial biases and distortions in decision-making include work on managerial risk aversion (Lewellen 2006), military experience (Malmendier, Tate, and Yan 2011; Benmelech and Frydman 2015), industry expertise (Custodio and Metzger 2013), general ability and execution skills (Kaplan, Klebanov, and Sorensen 2012), age and closeness to retirement ( Jenter and Lewellen forthcoming; Yim 2013), MBA degree and working experience (Beber and Fabbri 2012), and personal frugality (Davidson, Dey, and Smith 2013; Cronqvist, Makhija, and Yonker 2012).
Ulrike Malmendier and Geoffrey Tate 39
In this paper, we provide a theoretical and empirical framework that allows us to synthesize and assess the burgeoning literature on CEO overconfidence. We also provide novel empirical evidence that overconfidence matters for corporate invest-ment decisions in a framework that explicitly addresses the endogeneity of firms’ financing constraints.
We begin by describing the empirical approach used in much of the existing literature to measure CEO overconfidence. The most common approach, which we first established in Malmendier and Tate (2005), involves drawing implications from when CEOs choose to exercise their executive stock options. We discuss how to apply this approach to more recent data sources, and also some of the recent efforts to measure CEO overconfidence in other ways.
In considering how CEO overconfidence might affect decision-making, it is important to model an explicit decision-making framework that offers predictions about how rational CEOs will differ from overconfident CEOs. As an example of the pitfalls that can arise with a model-free approach, we point to the common intuition equating hubris with corporate overinvestment—whether in terms of internal investment (measured in capital expenditures) or external investment (merger and acquisition spending). We sketch a theoretical framework to explain why this intuition is not quite right. Instead, CEO overconfidence implies overinvestment only when the firm is flush in internal funds, and it implies a heightened sensitivity of investment to the availability of cash and other forms of capital that the CEO perceives to be relatively cheap.
We then turn to the empirical findings that have been established using the correlations between measures of CEO overconfidence and decisions that CEOs make. We review the evidence about the effects on investment, mergers, choices of internal or external financing, dividend payment levels, and other policies. We also use the workhorse regression models that are most common in this line of research to update some of our own results from a decade ago about the rela-tionship among CEO overconfidence, available cash flow, and investment levels. Because many of the existing empirical studies, including our own, are based on correlations between overconfidence measures and corporate policies, they are subject to the standard concern that correlation does not imply causation. Given that the measurement of biases themselves is challenging, it is important to limit the sources of endogeneity that can complicate the interpretation of empirical results wherever possible. We offer some new empirical results that use the finan-cial shock to interest rates in fall 2007 as an exogenous shock to the pricing and availability of capital. Using this shock for identification, we revisit the prediction that investments of overconfident CEOs will be particularly sensitive to the avail-ability or cost of debt financing.
While our discussion focuses on the decision-making of biased managers in (otherwise) efficient markets and facing rational investors, there is a large parallel literature in behavioral finance that studies the decisions of rational managers oper-ating in inefficient capital markets in which prices are affected by the decisions of irrational investors (for a survey, see Baker and Wurgler 2013). The two literatures
40 Journal of Economic Perspectives
make opposite baseline assumptions on the source of the behavioral friction, and one may wonder how to reconcile the two literatures conceptually. We show that the implications of the two approaches are not inconsistent with each other but comple-ment each other well. A more realistic model would allow for both types of friction and explore how they interact. We discuss ways in which future work can move in this direction.
Measuring CEO Overconfidence
In the behavioral finance literature, the most common approach to measuring CEO overconfidence has been to use decisions that the executive makes on his or her personal portfolio of company stock options. This approach, first intro-duced in Malmendier and Tate (2005), builds on the following logic: Since the 1980s (and particularly during the 1990s), top US executives have received increasingly large stock and option grants as part of their compensation (Hall and Murphy 2003). As a result, they commonly find themselves in a position where they are under-diversified with respect to company-specific risk. Moreover, the value of a CEO’s human capital is tied to the success of the firm, heightening the under-diversification problem. CEOs and other executives have a limited ability to address this issue. For example, stock awards may be restricted such that they can only be sold after the grant “vests”—that is, either after a number of years (time-based vesting) or after certain long-term performance targets are met (performance-based vesting). Stock options are not tradeable and typically also take years to vest before they can be exercised to purchase (and then sell) the underlying stock. Moreover, executives are contractually prohibited from taking short positions in the company’s stock.
Under these conditions, a rational, risk-averse executive should seek to exer-cise stock options, once they are vested, before expiration in order to diversify. The exact timing of optimal option exercise will vary depending on the “moneyness” of the options (that is, on how far the current price of the underlying stock exceeds the strike price at which the executive has an option to purchase the stock), the risk aversion of the executive, and the extent to which the executive is under-diversified (Lambert, Larcker, and Verrechia 1991; Hall and Murphy 2002). Overconfident executives, however, overestimate the future performance of their firms and are therefore more willing to hold options, expecting to profit from future stock price appreciation. Building on this logic, in Malmendier and Tate (2005), we proposed the systematic tendency to hold options longer before exercise as a measure of overconfidence.
More concretely, executive options typically have a ten-year lifespan at grant. While exact vesting schedules vary from one option package to the next, they are almost always fully vested after four years. Thus, CEOs who hold options all the way to expiration have taken a long-term bet on the future performance of their company’s stock, despite their under-diversification. Classifying such CEOs as
Behavioral CEOs: The Role of Managerial Overconfidence 41
overconfident is the basic idea of the “Longholder” measure we developed in earlier papers (Malmendier and Tate 2005; 2008).
In this earlier work, we classify a CEO as overconfident if that executive ever held vested options until the year of expiration, provided that the options were at least 40 percent “in the money” at the start of the final year.2 Imposing the 40 percent threshold ensures that we do not classify CEOs as overconfident who hold “underwater” options to expiration: when an option is “underwater” the current market price of the underlying stock is lower than the strike price, so, of course, a rational executive in any model will decide against exercising such an option. In Malmendier and Tate (2005; 2008), we extensively discuss other factors that might explain why a CEO could choose to exercise an option very late during its duration—in particular, the possi-bility of (persistent) positive private information about future firm performance. As we show, this and other factors either do not drive the variation in the measure or do not predict the same correlations with corporate policies as overconfidence.
In our earlier work, we construct the “Longholder” measure described above using data from Hall and Liebman (1998), which covers CEO stock and option holdings in Forbes 500 companies from 1980 to 1994. In this paper, we update the Longholder measure to more recent time periods. First, we use Thomson Reuters’ Insider Filings database for the 1996–2012 time period and, second, we use the detailed data on executive stock and option holdings from Compustat’s Execucomp database in the format available after 2006. Our discussion provides a blueprint for updating these measures to more recent data.
Before presenting the details, we note that there are prior efforts to update the option-based overconfidence measures by other researchers. Several researchers, including Campbell, Gallmeyer, Johnson, Rutherford, and Stanley (2011), Hirshleifer, Low, and Teoh (2012), and Banerjee, Dai, Humphery-Jenner, and Nanda (2015a, b), have used the annual data on CEO vested option hold-ings in Execucomp’s pre-2006 reporting format, beginning in 1992, to construct a measure of CEO overconfidence. Though the exact implementations vary, the general approach is to classify CEOs as overconfident when they have large enough holdings of vested options that are sufficiently in-the-money. One problem is that the pre-2006 Execucomp data does not contain details about individual option packages. For example, we do not know individual grant dates, expiration dates, or strike prices. As a result, researchers cannot assess the timing of exercise rela-tive to expiration (or grant) dates. Instead, they typically calculate some form of approximate “average moneyness.” But variation in moneyness is a direct func-tion of stock prices. In these approaches, it is therefore crucial to include careful controls for stock returns to avoid entangling measurements of overconfidence with stock market returns.
2 For example, options would be 40 percent “in the money” if the strike price is $100, but the stock is currently trading at $140. The 40 percent threshold comes from a calibration of the Hall and Murphy (2002) model of rational option exercise using a constant relative risk aversion coefficient of three and assuming the CEO holds 67 percent of personal wealth in company stock.
42 Journal of Economic Perspectives
Thomson Reuters data and post-2006 Execucomp data allow researchers to avoid these potentially confounding factors. The first data source, Thomson Reuters data, provides transaction-level data on when options are exercised. Corporate insiders are required by the Securities and Exchange Commission to file what is called “Form 4” when they undertake a transaction that changes their ownership position in the company. From this data source, we retrieve all filings by CEOs that report derivative transactions (in Table 2 of Form 4) from January 1996 through 2012. We isolate the records that identify call option exercises, strike prices at which the option allows exec-utives to purchase the stock, and exercise dates. We then merge the resulting records with monthly stock price data from the Center for Research on Security Prices (CRSP). We identify option exercises that meet two criteria: 1) the exercise occurred within one calendar year of option expiration and 2) the option was at least 40 percent in the money 12 months prior to expiration. We translate the data into a firm-year panel using Compustat’s Execucomp database, which provides us with the identity of the CEO in all Standard & Poor’s 1500 firms year-by-year, together with information on the CEO’s aggregate holdings of company stock and options. We code the binary variable Longholder as 1 if someone working as a CEO exercised an option meeting the criteria above. Remaining CEOs are the control sample and have Longholder set equal to 0.
The second data source, Compustat’s Execucomp database, includes grant-level data on CEO option holdings. In this case, we set the variable Longholder equal to one if someone working as a CEO continues to hold options during the final year before expiration, provided, again, that the options are at least 40 percent in-the-money entering the final year. The Execucomp version of the measure cannot be constructed pre-2006 because the required data became available only after a change in reporting requirements (specifically, on the DEF14A form in FAS123R). Thus, there is a relatively short time series for which we can use this measure.
Figure 1 shows the proportion of CEOs who are overconfident using these two data sources as well as the Hall and Liebman data from Malmendier and Tate (2005; 2008). Assuming that CEOs do not allow “in-the-money” options (that is, options where the strike price at which the executive can purchase the stock is lower than the market price) to expire without exercising them and that there are no errors in reporting, the two Longholder variables should be equivalent. We find that the percentage of CEOs identified as overconfident lies around 40 percent using either source. However, we also find that the correlation between the two variables is 0.56, and the source of the measurement error is difficult to identify. It is comforting to see, though, that the two measures appear to converge in the most recent years. For the empirical work later in the paper, we will carry out the exercise with each of these datasets.
The figure also reveals that the parallel measure of Longholder for the earlier period from 1980 to the mid-1990s, with the same 40 percent threshold, identi-fies a lower percentage of overconfident CEOs, around 20 percent in that sample. While there is no particular economic reason to expect that the proportions of CEOs classified as overconfident under the measures would remain constant over a 30-year period, some of the differences might be attributable to differences in the distributions of option-based compensation between the earlier and the later
Ulrike Malmendier and Geoffrey Tate 43
samples. The use of executive options was relatively limited in the 1980s and early 1990s compared to the later sample years. Both the absolute level of option compen-sation and its relative level (percent of compensation paid via options) increased dramatically from about 1995 to 2000 (Murphy 2013). It is conceivable that the frequency of biases differs in the broader (and younger) set of CEOs. The change in compensation may also explain the jump between the Malmendier and Tate and Thomson Longholder measures in Figure 1 on a purely mechanistic level: the increase provides for significantly more opportunities to identify a CEO as over-confident in the late 1990s and early 2000s than in the 1980s and early 1990s. The subsequent decline of option compensation3 is also consistent with the right half of the Thomson-based graph, though less with the Execucomp measure.
Alternatively, the experience of a prolonged up-market might have instilled over-confidence in CEOs. In fact, building on the argument from Murphy (1999), the
3 In more recent years, option compensation has been declining, while the use of restricted stock grants has started to rise. Shareholder demands, tax-law changes, and the experience of worthless options in the wake of the financial crisis are typically cited as reasons (Chasan 2013).
Figure 1 Option-based Overconfidence Measure
Notes: In earlier work (Malmendier and Tate 2005; 2008), we classified a CEO as overconfident if that executive ever held vested options until the year of expiration, provided that the options were at least 40 percent “in the money” at the start of the final year. We show the “Longholder” measure from Malmendier and Tate (2008) and update it to more recent time periods, first using Thomson Reuters’ Insider Filings database for the 1996–2012 time period (Thomson Longholder), and second using the detailed data on executive stock and option holdings from Compustat’s Execucomp database in the format available after 2006 (Execucomp Longholder). Average option compensation is computed using data from Compustat’s Execucomp database.
1980 1985 1990 1995 2000 2005 2010Fiscal year
Prop
orti
on o
f CE
Os
clas
si�
ed
as o
verc
on�
den
t
0
0.2
0.4
0.6
0.8
1 Average option
compen
sation (1,000s of $)
0
1,000
2,000
3,000
4,000
5,000Overcon�dence measures (left axis):
Thomson Longholder
Execucomp Longholder
Malmendier and Tate (2008)
Average option compensation (right axis)
44 Journal of Economic Perspectives
explosion in stock option grants might be attributable to the nearly two decades of bull market conditions after 1987. Executives who had not personally experienced a major market downturn were eager to receive option compensation, especially after having witnessed the substantial fortunes it created for many of their colleagues. As Murphy points out, there is a clear correlation between market conditions and option programs. During the decline in stock prices in the early 1970s, companies systematically replaced their “underwater” option programs with accounting-based performance plans, and they then reversed the trend during the following market upturn. If these factors are indeed a significant factor in the demand for and supply of option compensation, they would automatically be correlated with excessively opti-mistic beliefs, and their reversal.
Regardless of the underlying mechanism explaining the relative increase in measured overconfidence, the imperfect correlation of the parallel measures underscores the usefulness of seeking other ways to measure overconfidence. In fact, if the recent decline of option-based compensation continues, it may become impractical to use option exercise to measure beliefs in the future.
Several promising recent approaches to measuring CEO overconfidence are not tied to option exercise decisions. As a first example, Otto (2014) and Hribar and Yang (forthcoming) suggest managerial forecasts of earnings as a possible lens through which researchers can observe overconfident beliefs. Specifically, Otto (2014) measures CEO overconfidence by using the fraction of a firm’s volun-tary earnings forecasts that later turned out to exceed the realized earnings. He shows that this measure is positively correlated with option-based measures of overconfidence. Hribar and Yang (forthcoming) also show that CEO overconfi-dence captured by option-exercise behavior affects management forecasts. Unlike the failure to exercise an option over its ten-year duration, however, there are no (implicit) repeated decisions built into a management forecast. Thus, in oper-ationalizing this measure, it will be important to require repeatedly optimistic forecasts to separate CEO bias from mistakes or simple unfavorable resolutions of uncertainty. Nevertheless, these papers provide a clear foundation for exploring earnings forecasts as a measure of overconfidence.
Second, a number of papers use portrayal in the business press as a way to measure CEO beliefs. A common approach, first used in our paper Malmendier and Tate (2008), is to count past articles in prominent business publications like the Wall Street Journal or BusinessWeek that refer to CEOs using words that suggest overconfi-dence (“confident”/“confidence,” “optimistic”/“optimism”) relative to the number of articles that refer to CEOs with words that are unlikely to suggest overconfidence (“cautious,” “conservative,” “practical,” “reliable,” and “steady”). This alternative measure tends to positively correlate with option-based measures like “Longholder,” and also with the forecast-based measures (Hribar and Yang forthcoming). Given recent advances in text analysis in the empirical literature, more sophisticated imple-mentations of this approach hold great promise for future research.
Third, some papers use survey instruments to elicit a direct measure of overcon-fidence. For example, Ben-David, Graham, and Harvey (2013) measure executive
Behavioral CEOs: The Role of Managerial Overconfidence 45
biases using 10 years of a quarterly survey conducted by Duke University between 2001 and 2011, which contains projections by US chief financial officers. They use the 80 percent confidence interval of the CFOs’ predictions of one- and ten-year market-wide stock returns to illustrate the miscalibration of senior executives’ beliefs. They find that realized stock-market returns fall within executives’ 80 percent confi-dence interval only 36 percent of the time, implying that financial executives are, on a whole, too confident in their projections. Graham, Harvey, and Puri (2013) directly measure the psychological traits and attitudes of senior executives. The authors designed and administered an anonymous psychometric personality test of risk-aversion, optimism, time preferences, loss aversion, and other personality traits. Survey participants included CEOs and CFOs who subscribed to Chief Executive maga-zine, CFO magazine, and executives who attended the World Economic Forum in Davos. (Most surveys were administered online, though some were administered through fax.) This approach has great potential to add important refinement and color to our understanding of how biases matter in firms because the questions we can answer are not limited by the availability of accounting data or even to the sample of public firms. Given that this type of methodology has a longer tradition in neighboring fields in the social sciences, there is also potential in cross-disciplinary research to exploit best practices in survey design and implementation.
Modeling the Implications of Overconfident CEOs
Following the approaches outlined above, a large body of research has used these overconfidence measures as the right-hand-side variables of interest to explain various corporate outcomes. While such an analysis seems straightforward, the theoretical predictions for how CEOs’ overestimation of their own abilities (and, consequently, of the future performance of the firm under their leadership) affect corporate outcomes are oftentimes more subtle than they may at first appear. For example, the seemingly straightforward argument that an overconfident CEO will tend to overinvest is incomplete in a way that could be misleading. Here, we will sketch a simple decision-making model to illustrate that hubris does not necessarily imply “too much investment” or “too many mergers” (which could be mis-inferred from Roll 1986). Instead, it induces a tradeoff between misperceived gains from investment and the costs of external financing. As empirical work progresses in this area, it may prove useful to model more explicitly the decision-making problem of the CEO in other contexts to avoid similar potential pitfalls.
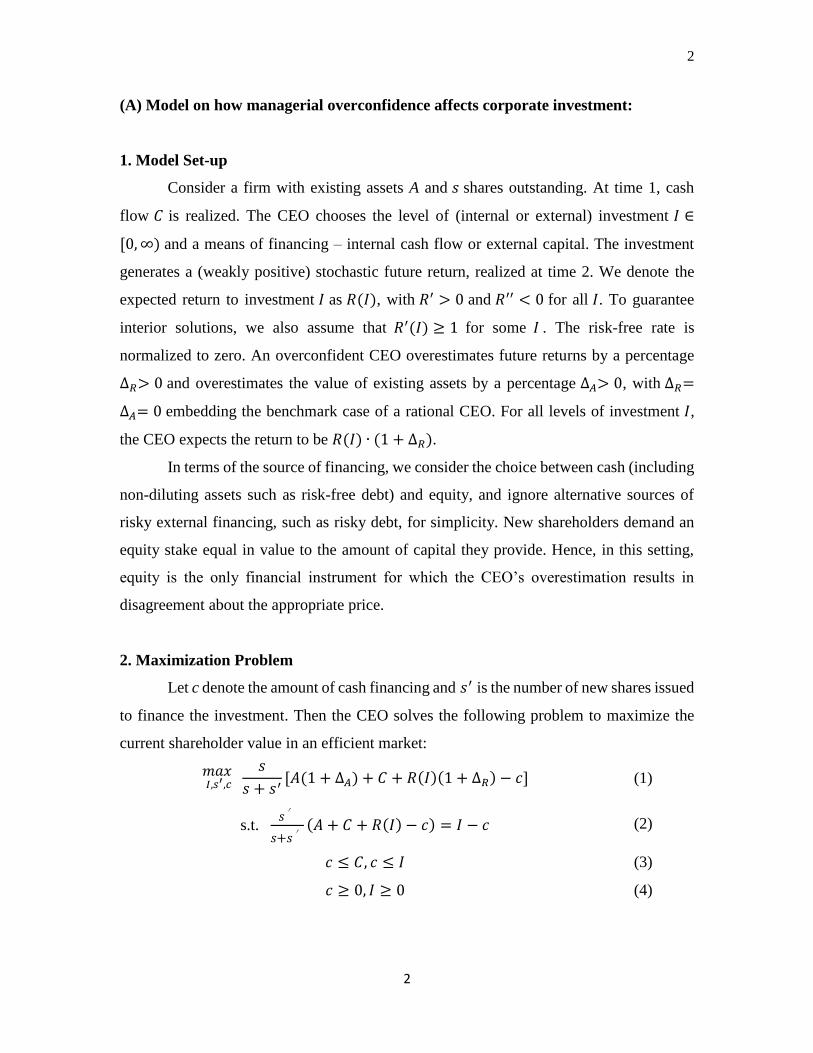
We consider a unifying framework that seeks to capture how managerial over-confidence affects corporate investment, including both internal and external projects as well as the firm’s capital structure.4 Because our goal is to demon-strate the distortionary power of overconfidence, we abstract from informational
4 An algebraic exposition of this model in the spirit of Malmendier and Tate (2005) appears in the online Appendix available with this paper at http://e-jep.org.
46 Journal of Economic Perspectives
asymmetries and agency problems and assume that the firm’s manager maximizes current shareholder value in an efficient capital market.
We define overconfidence as the overestimation of the value a manager believes he or she can create. This bias manifests itself in two forms. First, an overconfident manager believes that the company’s current assets are undervalued by the market. Second, an overconfident manager overestimates the value of future potential investments he or she might pick.
The CEO makes two decisions: 1) the level of investment, including both internal investment (capital expenditure) and external investment (mergers); and 2) whether financing of the investment will rely on internal cash flow (or, equiva-lently, on riskless debt) versus external equity capital.
In this setting, an overconfident CEO believes that the market price for riskless debt financing is accurate, but disagrees with potential new shareholders as to what an equity stake in the firm is worth, and hence on the appropriate price of newly issued shares. As a result, the model generates two main testable predictions about the difference in behavior between a rational and an overconfident CEO.
Prediction 1: The investment of overconfident CEOs is more sensitive to the availability of internal cash flow than the investment of CEOs who are not overconfident.
Rational CEOs are indifferent between all available sources of capital for an investment project. They view the price of equity (and, in a more general model, of risky debt) as set appropriately in the market. Thus it doesn’t matter whether an investment is paid for with internal cash, or if the firm raises funds by issuing stock (or, in a more general model, risky corporate bonds) at a fair market price. Rational CEOs’ investment decisions exclusively depend on whether the project generates value for existing shareholders.
Overconfident CEOs, instead, shy away from risky external equity capital, because they believe that the market is setting the price of equity in the firm too low and they are trying to protect existing shareholders from (perceived) dilution. As a result, overconfident CEOs first exhaust internal sources of financing before turning to risky external financing, and investment choices deviate from the first best as they depend to a greater extent on whether internal cash flow is available.
A key insight is that overconfident CEOs do not necessarily overinvest even though, by definition, they overestimate the returns to their internal investment or merger projects. It is true that this overestimation unambiguously induces the CEOs to prefer a higher level of investment than optimal. However, they will invest according to this preference only if they can access internal funds or riskless debt, the pricing of which they do not perceive to be distorted. Their calculation changes when they have to finance the investment by issuing equity. The need to access financing that they misperceive to be more costly than it is curbs their desire to overinvest. Depending on whether a CEO is more overconfident about what the current stock price of the firm should be or what the investment return will be, the ultimate decision could be to invest either above or below the first-best level. In other words, overconfident CEOs only overinvest if their company is flush with internal funds.
Ulrike Malmendier and Geoffrey Tate 47
Rational CEOs do not make this mistake. They understand the equivalence of external and internal financing, and thus choose the value-maximizing level of investment regardless of the type of financing available to their firm.
While it is difficult to test for over- and underinvestment directly since it is hard to measure the right (optimal) level of investment, it is feasible to test the investment–cash flow prediction spelled out above.
We can also derive a second testable prediction, which further links the cash-flow dependence to the firm’s financial constraints:
Prediction 2: The investment–cash flow sensitivity of overconfident CEOs is more pronounced in equity-dependent firms.
As spelled out above, the overconfident CEO overinvests when internal sources of finance are abundant. Hence, in a cash-rich situation, variations in investment will be less correlated with the exact amount of (abundant) internal funds. It is only when the limitation of internal funding is binding, relative to the desired level of investment, that the extra-degree of investment–cash flow sensitivity kicks in.
Although the simple version of our model does not include a separate param-eter for the riskiness of debt, the argument can easily be extended. Moreover, it can be used directly to illuminate the importance of a firm’s debt capacity. Think of available debt financing as essentially riskless debt—maybe in the form of a credit line. The higher is the amount of riskless debt the firm can utilize, the more likely are such nondiluting forms of financing to be sufficient for any desired level of investment. Thus, we expect to observe that investment–cash flow sensitivity is more pronounced in equity-dependent firms with overconfident CEOs than in firms with untapped debt capacity.
In short, the main takeaway of this model is that the positive relation between CEO overconfidence and investment is not unambiguous once we also explicitly model the CEO’s interactions with (potentially) unbiased agents in external capital markets. In this richer environment, the CEO faces a tradeoff between the perceived benefits of investment and the perceived costs of raising unduly expensive financing. Instead, the clear prediction of the model is that investment is sensitive to the avail-ability of cash or other forms of capital that the CEO perceives to be relatively cheap.
The Evidence on Overconfidence and Corporate Investment
A decade of empirical work using various measures of CEO overconfidence is now yielding an intriguing array of results. We begin this section by reviewing some of the most prominent papers, including studies that test the predictions of the basic model in the previous section, along with other implications of overconfidence for corporate policies. We then reanalyze one concrete example of empirical work in this area, the prediction that the investment of overconfident CEOs is more sensitive to the costs of external finance. We first revisit our investment–cash flow sensitivity model from Malmendier and Tate (2005) using more modern data, from 1996 to 2012. This analysis will use the kind of regression model that has been a workhorse in
48 Journal of Economic Perspectives
this literature. We then exploit a natural-experiment design in the spirit of Almeida, Campello, Laranjeira, and Weisbenner (2012) to isolate plausibly exogenous expo-sure to a shock to external financing costs, in order to demonstrate that the model can be verified using more robust and current econometric techniques.
Some Main Results in the Previous LiteratureThe model of decision-making by overconfident CEOs in the previous section
predicts that corporate investment in firms run by overconfident executives should be more sensitive to the availability of internal resources than the investment of other firms, in particular at times when the firm is facing financial constraints. In Malmendier and Tate (2005), we test this prediction by applying the traditional investment–cash flow sensitivity model of Fazzari, Hubbard, and Peterson (1988) and Kaplan and Zingales (1997). The key result is that the relation between investment and the interaction of various overconfidence measures with cash flow is estimated to be significantly positive, implying a significantly higher sensitivity of investment to internal resources among overconfident CEOs than among rational peers, which is consistent with Prediction 1 in the previous section. The cash flow sensitivity also appears most prominently among equity-dependent firms—measured using a variety of common proxies from the literature, including firm size, firm age, and the Kaplan-Zingales index—which is consistent with Prediction 2.
In Malmendier and Tate (2008), we use a similar dataset in the context of mergers, and show that overconfident CEOs also tend to have a higher tendency to undertake mergers and, particularly, diversifying deals, especially if they have access to internal financing. This is again consistent with Prediction 2. The market reac-tion to merger announcements of overconfident CEOs is also significantly more negative than that of non-overconfident CEOs, pointing to the suboptimality of overconfident CEOs’ chosen level of (external) investment. Outside the merger context, the optimality of investment is hard to assess.
Several papers in the literature consider capital-structure decisions. Deshmukh, Goel, and Howe (2013) examine the interaction of overconfidence and dividend policy and show that firms with overconfident CEOs generally pay out smaller divi-dends, which is consistent with overconfident CEOs viewing external financing as costly and wishing to build financial slack for future investment needs. In Malmendier, Tate, and Yan (2011), we show that overconfident managers use less external finance and, conditional on accessing external capital, issue less equity (more debt) than their peers, consistent with overconfident managers’ aversion to equity financing.
Another strand of this work relates CEO overconfidence to earnings manage-ment and the incidence of earnings misstatements. Because overconfident CEOs overestimate future earnings, they borrow more aggressively against future earnings to avoid missing current earnings forecasts and generally practice less-conservative accounting practices—for example, in delaying recognition of losses (Bouwman 2014; Ahmed and Duellman 2013). Schrand and Zechman (2012) find that over-confident executives are more likely to exhibit an optimistic bias that leads to
Behavioral CEOs: The Role of Managerial Overconfidence 49
nonintentional earnings misstatement, which can raise their incentive to misstate earnings intentionally in subsequent periods.
Though the studies described thus far all point to potential value-destruction as a result of CEO overconfidence, another strand of this work finds evidence of a “bright side” to overconfidence. Galasso and Simcoe (2011) and Hirshleifer, Low, and Teoh (2012) link managerial overconfidence with innovation, finding that overcon-fidence is generally beneficial for a firm’s innovation performance, and especially so in competitive and innovative industries. These benefits can help us begin to under-stand why we consistently observe overconfidence among CEOs over time.
Building on this point, another strand of literature considers explicitly the impli-cations of overconfidence for firms’ hiring and compensation practices. Though one possibility is that firms cannot recognize overconfidence in CEO candidates, Banerjee, Dai, Humphery-Jenner, and Nanda (2015a) find that firms choose overconfident CEOs at times when the predictable consequences of overconfidence on policies—like high levels of investment given abundant internal funds—are likely to benefit the firm. They provide evidence that overconfident senior executives are indeed more likely to be selected as CEOs and that they tend to enhance firm performance during the period when there is a change in strategy for more mature firms. Building on the theoretical insight of Goel and Thakor (2008), who argue that moderate biases can increase value by mitigating the effects of risk aversion, Campbell, Gallmeyer, Johnson, Rutherford, and Stanley (2011) show that CEOs with relatively low or rela-tively high optimism face a higher probability of forced turnover than moderately optimistic CEOs, which is consistent with the view that there is an interior optimum level of managerial optimism that maximizes firm value. Otto (2014) finds that firms are able to profit from the overconfidence of CEOs when providing equity-linked or bonus compensation: they provide CEOs who overestimate the future value of the firm’s equity with smaller grants and fewer bonus payments—which illustrates one way in which sophisticated principals can take advantage of biased agents.
The diversity of applications in which these measures of CEO overconfidence are associated with the predicted outcome assuages concerns about how overcon-fidence is being captured in any one particular empirical setting. Several recent papers also take the promising direction of looking beyond broad data aggregates—like net debt issuance or corporate investment—and instead study micro-level variation in contract features. For example, Adam, Burg, Scheinert, and Streitz (2014) link overconfidence with the corporate choice to issue performance-sensi-tive debt. Sunder, Sunder, and Tan (2010) study the inclusion of covenants in the debt contract, and provide evidence that creditors appear to recognize behavioral biases of the managers with whom they interact in the market.
Overconfidence and Investment–Cash Flow Sensitivity since 1996Below, as an illustration, we run through a test for the effect of CEO overcon-
fidence on corporate outcomes in the context of corporate investment decisions. First, we use a regression approach of the kind commonly used in this literature and update the investment–cash flow sensitivity findings from Malmendier and Tate
50 Journal of Economic Perspectives
(2005) using data from 1996 to 2012. Second, we provide one example of how to combine the best available overconfidence measures with better identification of corporate outcomes, following the supply-shock approach of Almeida et al. (2012).
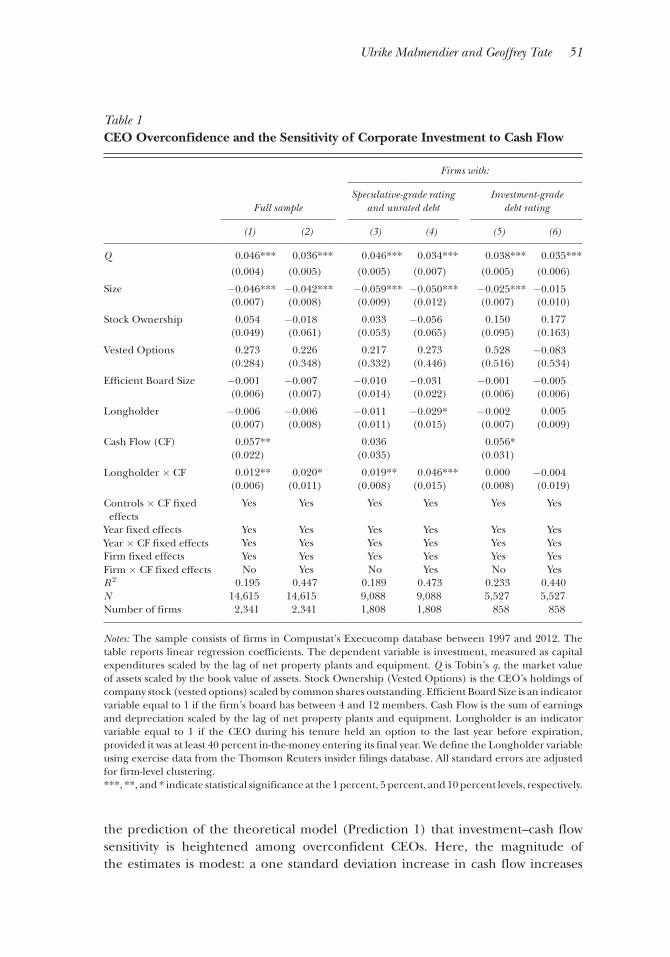
We obtain data on firm fundamentals from the Compustat database and data on stock prices from the CRSP database. The dependent variable in the analysis is corpo-rate investment, which we measure using capital expenditures scaled by the lagged value of net property, plants, and equipment. The main independent regressors are: cash flow (measured as the sum of earnings and depreciation scaled by the lagged value of net property, plants, and equipment); Tobin’s q (measured as the ratio of the market value to the book value of assets); firm size (measured as the natural logarithm of total assets); CEO stock ownership (measured as the percentage of company stock held by the CEO); CEO vested option holdings (measured as the number of CEO vested options scaled by the number of outstanding common shares); and an indi-cator variable that equals one if the board of directors has between four and twelve members. The last-mentioned proxy builds on evidence that smaller boards of direc-tors are associated with higher market valuations (for example, Yermack 1996) and provides a crude but readily available proxy for the within-firm variation in corpo-rate governance over time that we cannot capture by including firm fixed effects. We include the latter five regressors both in levels and interacted with cash flow. We use lags of all of the independent regressors to ensure that their values predate the firm’s investment choice. We also include year fixed effects and their interaction with cash flow to capture variation in macroeconomic conditions during the 17-year sample period that might correlate both with investment and the presence (or measurement) of CEO overconfidence. Similarly, we include firm fixed effects to capture unobserved time-invariant differences between firms. Because the data contain severe outliers, we drop observations in the upper and lower 1 percent of the distributions of cash flow, Tobin’s q, and investment. We cluster standard errors at the firm level.
The full results of this regression appear in the online Appendix available with this paper at http://e-jep.org. Table 1 presents estimated coefficients for the main variables. Our main explanatory variables of interest are the Longholder variable measuring CEO overconfidence and its interaction with cash flow. Remember that the model presented earlier predicts a positive coefficient on the interaction, since overconfident CEOs will tend to overvalue investment projects but also view external finance as unduly costly. Here we use the version of Longholder constructed from Thomson Reuters data to be able to exploit the 17-year sample period on which it is available.5
In column 1 of Table 1, we provide estimates of the regression model. Consis-tent with prior research, we find firms with higher values of Tobin’s q and firms with higher cash flows invest significantly more than other firms. We also confirm
5 We do not find a significant effect of overconfidence in the investment–cash flow sensitivity model using the Execucomp-based measure during the Great Recession years. However, it is likely that all firms were investment–cash flow sensitive during this period, reducing the ability to differentiate between firms in the cross-section.
the prediction of the theoretical model (Prediction 1) that investment–cash flow sensitivity is heightened among overconfident CEOs. Here, the magnitude of the estimates is modest: a one standard deviation increase in cash flow increases
Table 1 CEO Overconfidence and the Sensitivity of Corporate Investment to Cash Flow
Notes: The sample consists of firms in Compustat’s Execucomp database between 1997 and 2012. The table reports linear regression coefficients. The dependent variable is investment, measured as capital expenditures scaled by the lag of net property plants and equipment. Q is Tobin’s q, the market value of assets scaled by the book value of assets. Stock Ownership (Vested Options) is the CEO’s holdings of company stock (vested options) scaled by common shares outstanding. Efficient Board Size is an indicator variable equal to 1 if the firm’s board has between 4 and 12 members. Cash Flow is the sum of earnings and depreciation scaled by the lag of net property plants and equipment. Longholder is an indicator variable equal to 1 if the CEO during his tenure held an option to the last year before expiration, provided it was at least 40 percent in-the-money entering its final year. We define the Longholder variable using exercise data from the Thomson Reuters insider filings database. All standard errors are adjusted for firm-level clustering.***, **, and * indicate statistical significance at the 1 percent, 5 percent, and 10 percent levels, respectively.
52 Journal of Economic Perspectives
investment by 8 percent of a standard deviation more among overconfident CEOs than among rational peers.
In column 2, we augment the regression specification by allowing the sensitivity of investment to cash flow to vary by firm—that is, we include the interactions of firm fixed effects with cash flow. This specification allows us to separate variation in investment–cash flow sensitivity that is due to managerial overconfidence from vari-ation that may be driven by time-invariant firm effects of firms with overconfident managers. In the augmented specification, we identify the interaction of Longholder and cash flow using only cases in which we can compare the sensitivity of CEOs with different Longholder values who have operated the same firm. In Malmendier and Tate (2005), we were not able to estimate this specification due to the shorter time series and much smaller cross-section of firms in the data. We continue to estimate a heightened sensitivity of investment to cash flow among overconfident CEOs in this more conservative specification; indeed, the magnitude of the effect is nearly double what we find in column 1.
In Malmendier and Tate (2005), we argue that the overconfidence model also produces a nuanced prediction that CEOs with access to cheap debt financing should not exhibit heightened sensitivity of investment to the availability of cash in the firm because they can also finance desired (over)investment by tapping unused debt capacity. It is instead “equity-dependent” or financially constrained firms in which we should observe the effects of overconfidence on investment financing, as also spelled out in Prediction 2 of our model. In the remainder of Table 1, we test this second prediction by splitting the sample of firms based on whether the firm has an investment-grade long-term debt rating. We then rerun the specifica-tions from columns 1 and 2 on the resulting subsamples of the data. In columns 3 and 4 of Table 1, we present the results for the subsample of firms without access to investment grade debt. We find, as predicted, a positive effect of the overconfi-dence measure on the sensitivity of investment to internal resources that is even stronger than the estimates in the first two columns, both economically and statisti-cally. The estimate in column 4, which includes the interaction of firm fixed effects with cash flow, is roughly 4 times the size of the baseline estimate in column 1. In the last two columns, we provide the complementary estimates for firms that have investment-grade debt ratings. Here we do not find any difference between the investment to cash flow sensitivities of firms with and without CEOs we classify as overconfident. Apparently, access to cheap debt capital already allows CEOs the ability to invest at desired levels or, put differently, perceived financing constraints do not bind.
Taken as a whole, this regression evidence corroborates and in some ways strengthens the evidence from Malmendier and Tate (2005). For example, here we are able to separate definitively the effect of the Longholder measure from time-invariant differences across firms in cash flow sensitivities. It is intriguing that the estimated effect of cash flow on investment is substantially smaller over the last two decades than estimates using earlier data: for comparison, see Kaplan and Zingales (1997) for evidence from the 1970s and 1980s. Whether this reflects an
Behavioral CEOs: The Role of Managerial Overconfidence 53
increase in the efficiency of financial markets, changes in CEO choices, or a failure of the econometric model is an open question.
It is natural to have some concerns about the overall validity of this type of model formulation and, in particular, about the endogenous availability of internal financing sources. Moreover, we note that our choice to measure cash flow over the prior fiscal year—to ensure that our measure of cash coming into the firm predates the firm’s investment choice—appears to matter for the results. The connection between over-confidence, cash flow, and firm investment is no longer statistically significant if we measure investment and cash flow simultaneously, as many prior papers in the litera-ture have done. This variation of the key results from what may seem to be innocuous choices in specification underscores the importance of taking measurement and endogeneity seriously. In practice, this means attempting to identify new and robust settings in which to measure the effects of CEO biases on corporate choices.
Overconfidence and an Exogenous ShockWe examine one such setting, using a recent shock to corporate debt markets
to provide exogenous variation in the availability of debt financing. Almeida et al. (2012) describe a supply shock that occurred in corporate credit markets begin-ning in August 2007, at the outset of the financial crisis. Over the three prior years, average spreads on both investment-grade and high-yield bonds were generally stable and, if anything, mildly decreasing. However, in August 2007, the shock to credit markets that started with a decline in housing prices in 2006 and a wave of subprime mortgage defaults began to show up in the prices of long-term corpo-rate bonds. By early 2008, spreads on investment-grade corporate bonds had risen from roughly 1 percent to nearly 3 percent; similarly, spreads on high-yield corpo-rate bonds rose from roughly 3 percent to the range of 7–8 percent. To be clear, these changes occurred before the Great Recession had a chance to take hold, and well before the Lehman bankruptcy and the other economic catastrophes in September 2008. To identify the effect of a shock to financing constraints on corpo-rate investment, Almeida et al. (2012) exploit differences across firms in the portion of long-term debt that matured just after the credit-market shock hit. Specifically, they identify as “treated” those firms that had at least 20 percent of their long-term debt maturing in 2008 and thus faced the choice of refinancing or raising alternative sources of finance during the credit market disruption in late summer and fall of 2007. For their key test, Almeida et al. compare treated firms to a matched sample of firms without large amounts of debt maturing in the crisis period, finding that firms affected by the shock to financing constraints significantly cut investment, in absolute terms and relative to control firms.
For our purposes, a simpler approach will suffice. We exploit variation within the set of firms affected by the credit market shock, computing the difference-in-differences of investment between firms run by overconfident and rational CEOs. To measure overconfidence, we employ again the Longholder measure—this time using both the Thomson Reuters and the Execucomp data discussed earlier. We also allow for variation in the threshold percentage of maturing long-term debt required
54 Journal of Economic Perspectives
for treatment, measuring the difference in treatment effects for thresholds of 15, 20, 25, and 30 percent.
We estimate differences-in-differences between firms run by overconfident and rational CEOs using a panel regression. Each firm accounts for two obser-vations in the regression, one prior to the shock and one after. Following the specification in Almeida et al. (2012), the dependent variable is the average of a firm’s quarterly capital expenditures relative to a lagged value of capital, for the average of the first three quarters of 2007 and 2008 in the prior and after periods, respectively. We measure the difference in investment by including an indicator variable called “After,” which takes the value one for the “After” observation. The difference-in-differences is captured by the interaction of After with the Longholder overconfidence measure. We cluster the standard errors by firm.
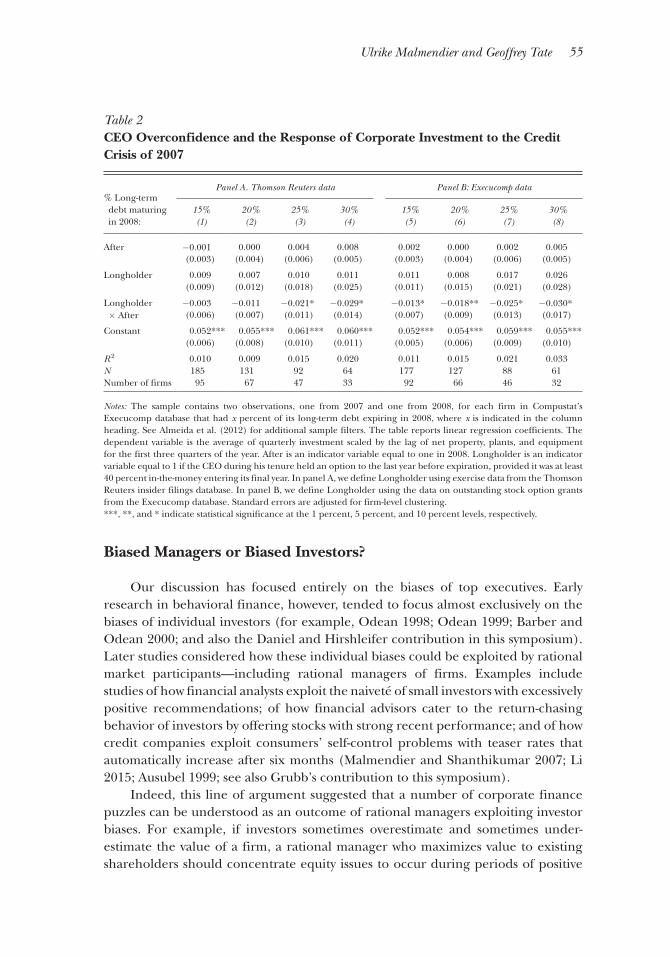
In panel A of Table 2, we present the results using the version of Longholder computed from Thomson Reuters insider filings data. Looking at the interaction of the After and the Longholder variables, we find a larger drop in investment expenditures following the financing shock among overconfident CEOs that increases in magnitude monotonically as we raise the threshold for sample inclu-sion—that is, as we compare firms that had greater exposure to the credit market shock. The difference-in-differences are statistically significant for thresholds of 25 and 30 percent of long-term debt maturing just after the shock, with p -values of 0.059 and 0.056, respectively. The effects are also economically large. The economic magnitude of the difference-in-differences increases monotonically with the threshold, from 7.5 percent of a standard deviation of investment in column 1 to 55 percent of a standard deviation in column 4.
In panel B, we report the results using the version of Longholder computed from Execucomp data. We find the same qualitative pattern. Here, the larger drop in investment following the shock among overconfident CEOs is statistically significant for all the thresholds for sample inclusion. The results are also stronger economi-cally: the difference-in-differences ranges from 34 percent of a standard deviation of investment in column 5 to 58 percent of a standard deviation in column 8.
Overall, the results confirm the theoretical prediction that the investment of overconfident CEOs is more sensitive to external financing costs than is the invest-ment of rational CEOs. This empirical methodology has the advantage of allowing us to sidestep the endogeneity of cash flow in standard investment–cash flow regressions. Nevertheless, the approach has some limitations. First, we are using only a small subsample of the data on which we observe clean variation around the shock, raising the question of whether the estimates are more broadly valid. Second, exog-enous shocks are likely to be relatively rare, meaning that similar opportunities for identification in other samples are not guaranteed. Third, while our approach is an improvement in the sense that it uses an exogenous financing shock and thus clarifies the identification issues, it does not address potential error in the measurement of overconfidence. Despite these limitations, we view the analysis as representative of the type of approach that is necessary to demonstrate the importance of behav-ioral factors within the broader corporate finance and economics literatures.
Ulrike Malmendier and Geoffrey Tate 55
Biased Managers or Biased Investors?
Our discussion has focused entirely on the biases of top executives. Early research in behavioral finance, however, tended to focus almost exclusively on the biases of individual investors (for example, Odean 1998; Odean 1999; Barber and Odean 2000; and also the Daniel and Hirshleifer contribution in this symposium). Later studies considered how these individual biases could be exploited by rational market participants—including rational managers of firms. Examples include studies of how financial analysts exploit the naiveté of small investors with excessively positive recommendations; of how financial advisors cater to the return-chasing behavior of investors by offering stocks with strong recent performance; and of how credit companies exploit consumers’ self-control problems with teaser rates that automatically increase after six months (Malmendier and Shanthikumar 2007; Li 2015; Ausubel 1999; see also Grubb’s contribution to this symposium).
Indeed, this line of argument suggested that a number of corporate finance puzzles can be understood as an outcome of rational managers exploiting investor biases. For example, if investors sometimes overestimate and sometimes under-estimate the value of a firm, a rational manager who maximizes value to existing shareholders should concentrate equity issues to occur during periods of positive
Table 2 CEO Overconfidence and the Response of Corporate Investment to the Credit Crisis of 2007
% Long-term debt maturing in 2008:
Panel A. Thomson Reuters data Panel B: Execucomp data
Notes: The sample contains two observations, one from 2007 and one from 2008, for each firm in Compustat’s Execucomp database that had x percent of its long-term debt expiring in 2008, where x is indicated in the column heading. See Almeida et al. (2012) for additional sample filters. The table reports linear regression coefficients. The dependent variable is the average of quarterly investment scaled by the lag of net property, plants, and equipment for the first three quarters of the year. After is an indicator variable equal to one in 2008. Longholder is an indicator variable equal to 1 if the CEO during his tenure held an option to the last year before expiration, provided it was at least 40 percent in-the-money entering its final year. In panel A, we define Longholder using exercise data from the Thomson Reuters insider filings database. In panel B, we define Longholder using the data on outstanding stock option grants from the Execucomp database. Standard errors are adjusted for firm-level clustering.***, **, and * indicate statistical significance at the 1 percent, 5 percent, and 10 percent levels, respectively.
56 Journal of Economic Perspectives
sentiment. Baker and Wurgler (2000; 2002) provide evidence that firms tend to issue relatively more equity than debt just before periods of low market returns and shun equity, in favor of debt, before periods of high returns. Their results suggest that managers exploit the inefficiency of the stock market and that market timing has large and persistent effects on capital structure.
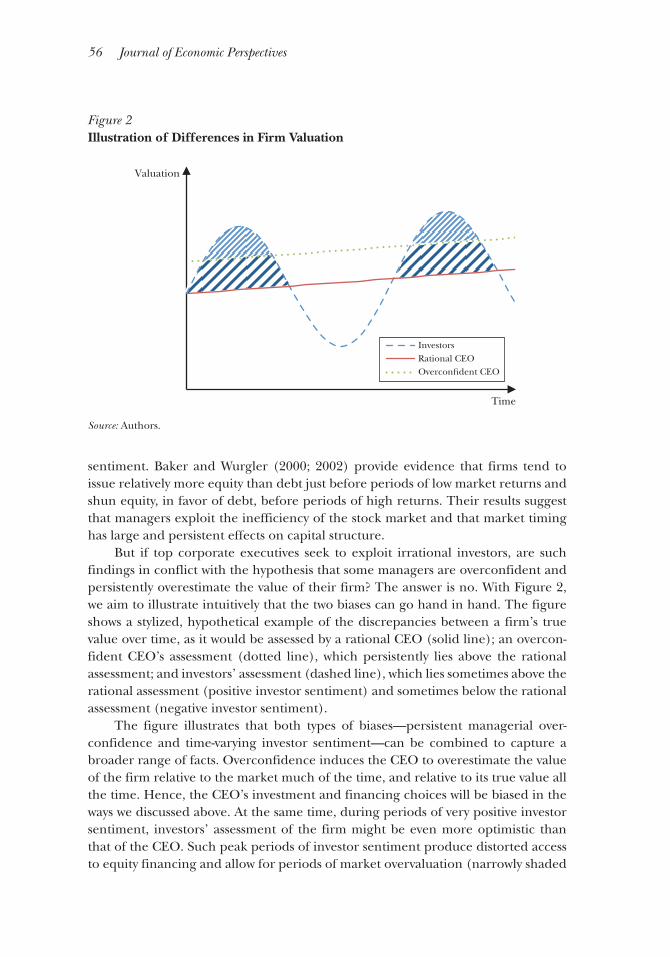
But if top corporate executives seek to exploit irrational investors, are such findings in conflict with the hypothesis that some managers are overconfident and persistently overestimate the value of their firm? The answer is no. With Figure 2, we aim to illustrate intuitively that the two biases can go hand in hand. The figure shows a stylized, hypothetical example of the discrepancies between a firm’s true value over time, as it would be assessed by a rational CEO (solid line); an overcon-fident CEO’s assessment (dotted line), which persistently lies above the rational assessment; and investors’ assessment (dashed line), which lies sometimes above the rational assessment (positive investor sentiment) and sometimes below the rational assessment (negative investor sentiment).
The figure illustrates that both types of biases—persistent managerial over-confidence and time-varying investor sentiment—can be combined to capture a broader range of facts. Overconfidence induces the CEO to overestimate the value of the firm relative to the market much of the time, and relative to its true value all the time. Hence, the CEO’s investment and financing choices will be biased in the ways we discussed above. At the same time, during periods of very positive investor sentiment, investors’ assessment of the firm might be even more optimistic than that of the CEO. Such peak periods of investor sentiment produce distorted access to equity financing and allow for periods of market overvaluation (narrowly shaded
Figure 2 Illustration of Differences in Firm Valuation
Source: Authors.
Valuation
Time
InvestorsRational CEOOvercon�dent CEO
Behavioral CEOs: The Role of Managerial Overconfidence 57
areas), as predicted by Baker and Wurgler (2000, 2002), albeit shorter ones than in a world with (only) rational managers (narrowly shaded plus widely shaded areas).
In short, there is no inherent inconsistency between these two strands of behav-ioral corporate finance. For further discussion of these biases and how they can interact, see also the survey articles by Barberis and Thaler (2003), Baker, Ruback, and Wurgler (2007), and Baker and Wurgler (2013).
Discussion and Conclusion
A large and growing body of evidence suggests that a substantial share of top corporate executives exhibit symptoms of overconfidence in their decisions. The main measure of CEO overconfidence used here has been the willingness of CEOs to keep their personal wealth undiversified by holding stock options until very close to their expiration. Other measures of CEO overconfidence include earn-ings forecasts, survey responses, and even psychometric tests. The presence of CEO overconfidence—that is, of a belief by the top executive that the price of the firm’s stock should be higher than it is—seems to matter for a variety of firm decisions and the choice of financing for those decisions. Notably, it matters for the extent to which investment choices, both those involving internal investment and external mergers, track the available cash and easy-to-obtain debt available to firms. But CEO overconfidence also appears to be correlated with other choices like paying less in dividends and relying less on external equity-based finance. Other research suggests that firms are able to identify overconfident CEOs, and firms that plan to under-take a change in strategy or to vigorously pursue innovation may prefer a degree of overconfidence. Moreover, firms can offer overconfident CEOs lesser amounts of company stock as part of their compensation packages. This body of research keeps expanding, with additional measures of CEO overconfidence, theoretical models linking overconfidence to various practices and outcomes, and empirical tests that pay more attention to exogeneity and identification of cause and effect.
The immediate focus of this literature is often to identify specific instances in which CEO overconfidence matters. But in a broader sense, this literature is proposing and exploring a different approach to the key agency problem of the firm, involving the separation of ownership and control. The classic statement of this problem is that managers of firms have an incentive to pursue their own private benefits, while shareholders and other claimholders of the firm would like the manager to act as an agent for their interests. The evidence here suggests that even when managers intend to maximize claimholder value, they can fail to do so because they hold overconfident beliefs. To the extent that CEO overconfidence (and other potential biases) matter, then some approaches to corporate governance will be more robust than others. Providing equity-linked compensation may miti-gate traditional misalignment of CEO incentives but is unlikely to affect the choices of biased managers, who already believe they are maximizing value. On the other hand, measures to improve active monitoring of the firm—to the extent that the
58 Journal of Economic Perspectives
monitors themselves are rational—may address both concerns. Recent work has begun to look seriously at how and when governance can mitigate managerial biases (Banerjee, Humphery-Jenner, and Nanda 2015b; Kolasinski and Li 2013), which seems to offer a promising direction for additional research. Ultimately, behavioral biases like CEO overconfidence matter not just for the choices and outcomes of the agents who are subject to them, but also for the (potentially rational) agents with whom they interact, transact, and contract in the market place.
References
Adam, Tim R., Valentin Burg, Tobias Scheinert, and Daniel Streitz. 2014. “Managerial Optimism and Debt Contract Design: The Case of Syndicated Loans.” Available at SSRN: http://papers.ssrn.com/sol3/papers.cfm?.
Ahmed, Anwer S., and Scott Duellman. 2013. “Managerial Overconfidence and Accounting Con-servatism.” Journal of Accounting Research 51(1): 1–30.
Alicke, Mark D. 1985. “Global Self-Evaluation as Determined by the Desirability and Controllability of Trait Adjectives.” Journal of Personality and Social Psychology 49(6): 1621–30.
Almeida, Heitor, Murillo Campello, Bruno Laranjeira, and Scott Weisbenner. 2012. “Corpo-rate Debt Maturity and the Real Effects of the 2007 Credit Crisis.” Critical Finance Review 1(1): 3–58.
Ausubel, Lawrence M. 1999. “Adverse Selection in the Credit Card Market.” Working paper, June 17. http://www.ausubel.com/creditcard-papers/adverse.pdf.
Barber, Brad, and Terry Odean. 2000. “Trading is Hazardous to Your Wealth: The Common Stock Investment Performance of Individual Investors.” Journal of Finance 55(2): 773–806.
Barberis, Nicholas, and Richard Thaler. 2003. “A Survey of Behavioral Finance.” Chap. 18 in Handbook of the Economics of Finance Vol. 1B, edited by G.M. Constantinides, M. Harris, and R. Stulz. North Holland: Elsevier Science B.V.
Baker, Malcom, Xin Pan, and Jeffrey Wurgler. 2012. “The Effect of Reference Point Prices on Mergers and Acquisitions.” Journal of Financial Economics 106(1): 49–71.
Baker, Malcom, Richard S. Ruback, and Jeffrey Wurgler. 2007. “Behavioral Corporate Finance.
Chap. 4 in Handbook of Corporate Finance: Empirical Corporate Finance Vol. 1, edited by B. Espen Eckbo. New York: Elsevier/North-Holland.
Baker, Malcom and Jeffrey Wurgler. 2000. “The Equity Share in New Issues and Aggregate Stock Returns.” Journal of Finance 55(5): 2219–57.
Baker, Malcom and Jeffrey Wurgler. 2002. “Market Timing and Capital Structure.” Journal of Finance 57(1): 1–32.
Baker, Malcolm and Jeffrey Wurgler. 2013. “Behavioral Corporate Finance: An Updated Survey.” Chap. 5 in Handbook of the Economics of Finance Vol. 2A, edited by George M. Constantinides, Milton Harris, Rene M. Stulz. North Holland: Elsevier.
Banerjee, Suman, Lili Dai, Mark Humphery-Jenner, and Vikram Nanda. 2015a. “Top Dogs: Overconfident Executives and New CEO Selec-tion.” Available at SSRN: http://papers.ssrn.com/sol3/papers.cfm?abstract_id=2371435.
Banerjee, Suman, Mark Humphery-Jenner, and Vikram Nanda. 2015b. “Restraining Overconfident CEOs through Improved Governance: Evidence from the Sarbanes-Oxley Act.” Review of Financial Studies 28(10): 2812–58.
Beber, Alessandro, and Daniela Fabbri. 2012. “Who Times the Foreign Exchange Market? Corporate Speculation and CEO Characteristics.” Journal of Corporate Finance 18(5): 1065–87.
Benmelech, Efraim, and Carola Frydman. 2015. “Military CEOs.” Journal of Financial Economics 117(1): 43–59.
Ben-David, Itzhak, John R. Graham, and Camp-bell R. Harvey. 2013. “Managerial Miscalibration.” Quarterly Journal of Economics 128(4): 1547–84.
Bernardo, Antonio E., and Ivo Welch. 2001. “On the Evolution of Overconfidence and Entrepre-neurs.” Journal of Economics & Management Strategy 10(3): 301–30.
Bouwman, Christa. 2014. “Managerial Opti-mism and Earnings Smoothing.” Journal of Banking and Finance 41(C): 283–303.
Campbell, T. Colin, Michael Gallmeyer, Shane A. Johnson, Jessica Rutherford, and Brooke W. Stanley. 2011. “CEO Optimism and Forced Turnover.” Journal of Financial Economics 101(3): 695–712.
Chasan, Emily. 2013. “Last Gasp for Stock Options?” Wall Street Journal: CFO Journal, August 26.
Cronqvist, Henrik, Anil K. Makhija, Scott E. Yonker. 2012. “Behavioral Consistency in Corporate Finance: CEO Personal and Corporate Leverage.” Journal of Financial Economics 103(1): 20–40.
Custódio, Cláudia, and Daniel Metzger. 2013. “How Do CEOs Matter? The Effect of Industry Expertise on Acquisition Returns.” Review of Finan-cial Studies 26(8): 2008–47.
Davidson, Robert, Aiyesha Dey, Abbie J. Smith. 2013. “Executives’ ‘Off-the-Job’ Behavior, Corporate Culture, and Financial Reporting Risk.” Chicago Booth Research Paper No. 12-24. Available at SSRN: http://papers.ssrn.com/sol3/papers.cfm?abstract_id=2096226.
Deshmukh, Sanjay, Anand M. Goel, and Keith M. Howe. 2013. “CEO Overconfidence and Dividend Policy.” Journal of Financial Intermediation 22(3): 440–63.
Dugan, Ianthe Jeanne, and Ariana Eunjung Cha. 2000. “AOL to Acquire Time Warner in Record $183 Billion Merger.” Washington Post, January 11.
Economist, The. 2002. “After Hubris, Nemesis.” July 19.
Fabrikant, Geraldine. 1994. “Executives Say That Viacom Has Won Paramount Battle.” New York Times, February 15.
Fazzari, Steven, M., R. Glenn Hubbard, and Bruce C. Peterson. 1988. “Financing Constraints and Corporate Investment.” Brookings Papers on Economic Activity, no. 1, pp. 141–95.
Galasso, Alberto, and Timothy S. Simcoe. 2011. “CEO Overconfidence and Innovation.” Manage-ment Science 57(8): 1469–84.
Goel, Anand M., and Anjan V. Thakor. 2008. “Overconfidence, CEO Selection, and Corporate Governance.” Journal of Finance 63(6): 2737–84.
Graham, John R., Campbell R. Harvey, and Manju Puri. 2013. “Managerial Attitudes and Corporate Actions.” Journal of Financial Economics 109(1): 103–21.
Hall, Brian J., and Kevin J. Murphy. 2002. “Stock
Options for Undiversified Executives.” Journal of Accounting and Economics 33(2): 3–42.
Hall, Brian J., and Kevin J. Murphy. 2003. “The Trouble with Stock Options.” Journal of Economic Perspectives 17(3): 49–70.
Hall, Brian J., and Jeffrey B. Liebman. 1998. “Are CEOs Really Paid Like Bureaucrats?” Quar-terly Journal of Economics 113(3): 653–91.
Heaton, J. B. 2002. “Managerial Optimism and Corporate Finance.” Financial Management 31(2): 33–45.
Hietala, Pekka, Steven N. Kaplan, and David T. Robinson. 2003. “What is the Price of Hubris? Using Takeover Battles to Infer Overpayments and Synergies.” Financial Management 32(3): 5–31.
Hirshleifer, David, Angie Low, and Siew Hong Teoh. 2012. “Are Overconfident CEOs Better Innovators?” Journal of Finance 67(4): 1457–98.
Hribar, Paul, and Holly Yang. Forthcoming. “CEO Overconfidence and Management Fore-casting.” Contemporary Accounting Research.
Jenter, Dirk, and Katharina Lewellen. Forth-coming. “CEO Preferences and Acquisitions.” Journal of Finance.
Kamar, Ehud. 2009. “The Story of Paramount Communications v. QVC Network: Everything is Personal.” Chap. 10 in Corporate Law Stories, edited by J. Mark Ramseyer. New York: Foundation Press.
Kaplan, Steven, Mark Klebanov, and Morten Sorensen. 2012. “Which CEO Characteristics and Abilities Matter?” Journal of Finance 67(3): 973–1007.
Kaplan, Steven N., and Luigi Zingales. 1997. “Do Investment–Cash Flow Sensitivities Provide Useful Measures of Financing Constraints?” Quar-terly Journal of Economics 112(1): 169–215.
Kolasinski, Adam C., and Xu Li. 2013. “Can Strong Boards and Trading Their Own Firm’s Stock Help CEOs Make Better Decisions? Evidence from Corporate Acquisitions by Overconfident CEOs.” Journal of Financial and Quantitative Analysis 48(4): 1173–1206.
Lambert, Richard, A., David F. Larcker, and Robert E. Verrecchia. 1991. “Portfolio Consid-erations in Valuing Executive Compensation.” Journal of Accounting Research 29(1): 129–49.
Larwood, Laurie, and William Whittaker. 1977. “Managerial Myopia: Self-Serving Biases in Orga-nizational Planning.” Journal of Applied Psychology 62(2): 194–98.
Lewellen, Katharina. 2006. “Financing Deci-sions When Managers Are Risk Averse.” Journal of Financial Economics 82(3): 551–90.
Li, Sheng. 2015. “The Influence of Financial Advisers on Return Chasing.” Job Market Paper. https://dl.dropboxusercontent.com/u/193 86549/shengli_jmp.pdf.
Malmendier, Ulrike, Enrico Moretti, and Florian Peters. 2015. “Winning by Losing: Evidence on the Long-Run Effects of Mergers.” Unpublished paper.
Malmendier, Ulrike, and Devin Shanthikumar. 2007. “Are Small Investors Naive about Incentives?” Journal of Financial Economics 85(2): 457–89.
Malmendier, Ulrike, and Geoffrey Tate. 2005. “CEO Overconfidence and Corporate Invest-ment.” Journal of Finance 60(6): 2661–2700.
Malmendier, Ulrike, and Geoffrey Tate. 2008. “Who Makes Acquisitions? CEO Overconfidence and the Market’s Reaction.” Journal of Financial Economics 89(1): 20–43.
Malmendier, Ulrike, Geoffrey Tate, and Jon Yan. 2011. “Overconfidence and Early-Life Experiences: The Effect of Managerial Traits on Corporate Financial Policies.” Journal of Finance 66(5): 1687–1733.
McGrath, Rita Gunther. 2015. “15 Years Later, Lessons from the Failed AOL-Time Warner Merger.” Fortune, January 10.
Merrow, Edward W., Kenneth E. Phillips, and Christopher W. Myers. 1981. Understanding Cost Growth and Performance Shortfalls in Pioneer Process Plants. Santa Monica, CA: Rand.
Miller, Dale T., and Michael Ross. 1975. “Self-Serving Biases in the Attribution of Causality: Fact or Fiction?” Psychological Bulletin 82(2): 213–25.
Murphy, Kevin J. 1999. “Executive Compensa-tion.” Chap. 38 in Handbook of Labor Economics Vol. 3B, edited by O. Ashenfelter and D. Card, 2485–2563. Elsevier.
Murphy, Kevin J. 2013. “Executive Compensa-tion: Where We Are, and How We Got There.” Chap. 4 in Handbook of the Economics of Finance Vol. 2A, edited by George M. Constantinides, Milton Harris, and René M. Stulz. North Holland: Elsevier.
Odean, Terry. 1998. “Are Investors Reluctant
to Realize Their Losses?” Journal of Finance 53(5): 1775–98.
Odean, Terry. 1999. “Do Investors Trade Too Much?” American Economic Review 89(5): 1279–98.
Otto, Clemens A. 2014. “CEO Optimism and Incentive Compensation.” Journal of Financial Economics 114(2): 366–404.
Peers, Martin, and Julia Angwin. 2003. “AOL Posts a $98.7 Billion Loss on New Goodwill Write-Down.” Wall Street Journal, January 30.
Roll, Richard. 1986. “The Hubris Hypothesis of Corporate Takeovers.” Journal of Business 59(2): 197–216.
Schrand, Catherine M., and Sarah L. C. Zechman. 2012. “Executive Overconfidence and the Slippery Slope to Financial Misreporting.” Journal of Accounting and Economics 53(1–2): 311–29.
Statman, Meir, and James F. Sepe. 1989. “Project Termination Announcements and the Market Value of the Firm.” Financial Management 18(4): 74–81.
Sunder, Jayanthi, Shyam V. Sunder, and Liang Tan. 2010. “The Role of Managerial Overconfi-dence in the Design of Debt Covenants.” http://papers.ssrn.com/sol3/papers.cfm?abstract_id=1595007.
Svenson, Ola. 1981. “Are We All Less Risky and More Skillful Than Our Fellow Drivers?” Acta Psychologica 47(2): 143–48.
Yermack, David. 1996. “Higher Market Valuation of Companies with a Small Board of Directors.” Journal of Financial Economics 40(2): 185–211.
Yim, Soojin. 2013. “The Acquisitiveness of Youth: CEO Age and Acquisition Behavior.” Journal of Financial Economics 108(1): 250–73.
Firm * Cash Flow Fixed Effects no yes no yes no yes
R2
0.195 0.447 0.189 0.473 0.233 0.440
N 14,615 14,615 9,088 9,088 5,527 5,527
Number of Firms 2,341 2,341 1,808 1,808 858 858
The sample consists of firms in Compustat's Execucomp database between 1997 and 2012. The table reports linear regression coefficients. The dependent
variable is investment, measured as capital expenditures scaled by the lag of net property plants and equipment. Q is the market value of assets scaled by the
book value of assets. Stock Ownership (Vested Options) is the CEO's holdings of company stock (vested options) scaled by common shares outstanding.
Efficient Board Size is an indicator variable equal to 1 if the firm's board has between 4 and 12 members. Cash Flow is the sum of earnings and depreciation
scaled by the lag of net property plants and equipment. Longholder is an indicator variable equal to 1 if the CEO during his tenure held an option to the last year
before expiration, provided it was at least 40% in-the-money entering its final year. We define the Longholder variable using exercise data from the Thomson
Reuters insider filings database. All standard errors are adjusted for firm-level clustering. ***, **, and * indicate statistical significance at the 1%, 5%, and 10%
levels, respectively.
Speculative Grade and Unrated Debt Investment Grade DebtFull Sample
CEO Overconfidence and the Sensitivity of Corporate Investment to Cash Flow