44
PENETRATING RADAR BELLO YUSUF IDI FACULTY OF GEOINFORMATION AND REAL ESTATE, UNIVERSITI TEKNOLOGI MALAYSIA

PENETRATING RADAR
BELLO YUSUF IDI
FACULTY OF GEOINFORMATION AND REAL ESTATE,
UNIVERSITI TEKNOLOGI MALAYSIA

BELLO YUSUF IDI
A thesis submitted in fulfilment of the
requirements for the award of the degree of
Doctor of Philosophy (Geomatic Engineering)
Faculty of Geoinformation and Real Estate,
Universiti Teknologi Malaysia
JANUARY 2013
ACKNOWLEDGEMENTS
All praises and thanks be to Allah the Lords of all that exists, Who exalted in
high rank those whom He granted knowledge, for granting me long life, good health
and the opportunity to pursue this noble cause. May the peace and blessing of Allah
be to our noble Prophet, Muhammad (PBUH) who directed us to seek for beneficial
knowledge and impact it to others, and who assured those who traveled in search of
knowledge an easy path to paradise.
Although my name is printed on as the author of this thesis, I deliberately
avoided the use of first person singular pronoun “I” in the text as a tribute to the
enormous contribution of my supervisor, Associate Prof. Dr. Md Nor Kamarudin,
without which the work would have been far from reality. I am therefore highly
indebted to him for his contribution, support, guidance and corrections that lead to
the success of the work.
Special thanks are due to my mom, Hajiya Hafsat Yusuf, my wife, Jamila
Bello, and my children Muhammed, Amina and Hafsat, for their patience
cooperation and endurance of my absence during the period of the study. Thanks are
due to my brother Tasiu Idi for shouldering enormous task of taking care of the
extended family despite his tide official responsibilities.
I would like to acknowledge with thanks the contribution of Jurukur Abadi of
No. 06-01, Jalan Padi Emas 4/5, Pusat Bandar Tampoi, 81200, Johor Bahru for the
provision of the survey equipment and technical assistance used for the field data
acquisition. Special thank is due to Akmal Hijaz bin Ahmad Rustami of Jurukur
Abadi, Tampoi for his tireless effort toward the success of the work.

I would like to gratefully acknowledge the contribution of many individuals
to this work especially the staff and students of Geotechnical Department, Faculty of
Civil Engineering, UTM. Special thanks are due to PM Muhd For Muhd, head of
admin, Geotechnical Laboratory for granting me a special permission to conduct
laboratory work in the lab. Thanks are also due to the following individuals: En
Zukifly, En Sahrul Nizam, En Hadiyat, En Noor Azlan and En Muhd Ekhsan all of
Geotechnical Laboratory for their advice and assistance during the laboratory works.
I am highly indebted to my friends and brothers in persons of Engr Oyeleke
Raifu Brown and Engr Saidu Muhammed of the Faculty of Civil Engineering for
their guidance and support. Special thanks are due to my brothers and colleaques
Ahmad Idi, Bashir Sajo, Ismaila Yada Sudi, Abdulhamid Umar, Hassan Sule and
Bashir Gabdo for their assistance.
I would also like to acknowledge the contribution of staff and students of the
Institute of High Voltage and High Current (IVAT), FKE, UTM for their
contribution toward successful execution a part the experiment. Special thanks are
due to Dr. Nouruddeen Bashir Umar of the IVAT for his tremendous assistance.
Finally, I will never forget to express my sincere gratitude to the institutions
and organizations who contributed financially and morally toward the success of this
work. They are: Malaysian Ministry for Higher Education, Adamawa State
University (ADSU), Mubi Nigeria, management of Universiti Teknologi Malaysia
IDF UTM, and Education Tax Fund (ETF) Nigeria. Special gratitude is also due to
K. J. Sandmeier of Zipser Strabe 1, D-76227, Karlsruhe, the copy right owner of
Reflexw used for the radar image interpretation.
ABSTRACT
Peatland’s economic importance and environmental impact have made it
attractive to scientific research. Great amount of works were done in studying its
petrophysical behaviours. Most of the works are however done with reference to the
peatland deposit of the temperate and cold belt region of the Northern Hemisphere.
The complex behavior of petrophysical properties of peat soil especially in relation
to changes in climatic conditions necessitates the need for extensive research toward
understanding the behavior of these properties in relation to tropical climate. In this
work, field survey data acquired with ground penetrating radar and laboratory
analysis of core samples collected were used to model Ground Penetrating Radar
(GPR) data with moisture content for the purpose of developing empirical
relationship between the two parameters. A third-order polynomial relation was
found to be the best fitting model (R2=0.9657, N=36, P <0.001) with a standard error
of 0.0124. The model was used to map the spatial distribution of moisture content of
the study area. A texture extraction technique was used to map the biogenic gas
content of the deposit based on the effect of the gas on radar image texture and signal
parameters. Three regions of high gas concentration were identified with a maximum
content of 19.57% recorded at the northwest end of the study area. The regions are
therefore considered as forest fire hotspot. Stratigraphic sequences of the peat deposit
were also delineated based on signal reflection boundaries. Three major stratigraphic
layers were identified and analyzed with core samples. The layers and their mean ash
contents are experimentally found to be: Fibric (33.34%) at 0.3-1.2 m depth range,
Hemic (3.74%) at 1.2 - 2.6 m depth range and kaolinite clay (20.27%) at 1.7-2.5 m
depth range. The work provides bases for the survey of tropical peatland with GPR.

ABSTRAK
Kepentingan ekonomi terhadap tanah gambut dan impaknya kepada alam
sekitar telah membina daya tarikan tersendiri bagi penyelidikan saintifik.
Kebanyakan kerja-kerja telah dilakukan terhadap sifat petro-fizikal tanah gambut
dengan merujuk kepada kandungan tanah gambut dari lingkaran kawasan sederhana
dan sejuk di Hemisfera Utara. Ciri-ciri kompleks dalam sifat petro-fizikal tanah
gambut ini berhubung dengan perubahan keadaan iklim memerlukan suatu tindakan
penyelidikan yang meluas ke arah memahami hubungannya dengan iklim tropika.
Dalam kajian ini, data kajian lapangan diperolehi dari tanah gambut Pontian
menggunakan Ground Penetrating Radar (GPR) manakala analisis makmal dilakukan
terhadap sampel utama untuk angkatap model dielectric yang didapati dari data GPR
dengan kandungan lembapan bertujuan membangunkan hubungan empirikal antara
dua parameter. Polynomial darjah ketiga memenuhi kehendak menjadi model terbaik
(R2 = 0.9657, N = 36, P <0.001) bersesuaian dengan ralat piawai 0.0124. Model ini
telah digunakan untuk memeta taburan spatial kandungan kelembapan kawasan
tersebut. Satu teknik pengekstrakan tekstur telah digunakan untuk memetakan
kandungan gas biogenik tanah tersebut berdasarkan kesan gas terhadap tekstur imej
radar dan parameter isyarat. Tiga kawasan yang telah dikenal pasti dengan kepekatan
maksimum kandungan gas yang tinggi 19.57% direkodkan pada kawasan barat laut
dikawasan kajian ini yang dianggap boleh berlakunya kebakaran hutan. Berdasarkan
refleksi isyarat lapisan sempadan tanah gambut, tiga lapisan urutan stratigrafik utama
telah dikenal pasti dan dianalisis dengan sampel utama. Lapisan diujikaji mendapati
purata kandungan abu Fibric (33.34%) pada tahap kedalaman 0.3 hingga 1.2 m,
Hemic (3.74%) pada tahap kedalaman 2.1 hingga 2.6 m dan tanah liat Kaolinit
(20.27%) pada tahap kedalaman 1.7 hingga 2.5 m. Kajian ini menunjukkan kerja ini
dapat menyediakan asas-asas bagi kajian tanah gambut tropika dengan menggunakan
GPR.

TABLE OF CONTENTS
CHAPTER TITLE PAGE
DECLARATION ii
DEDICATION iii
ACKNOLWLEDGEMENTS iv
ABSTRACT vi
ABSTRAK vii
TABLE OF CONTENTS viii
LIST OF TABLES xii
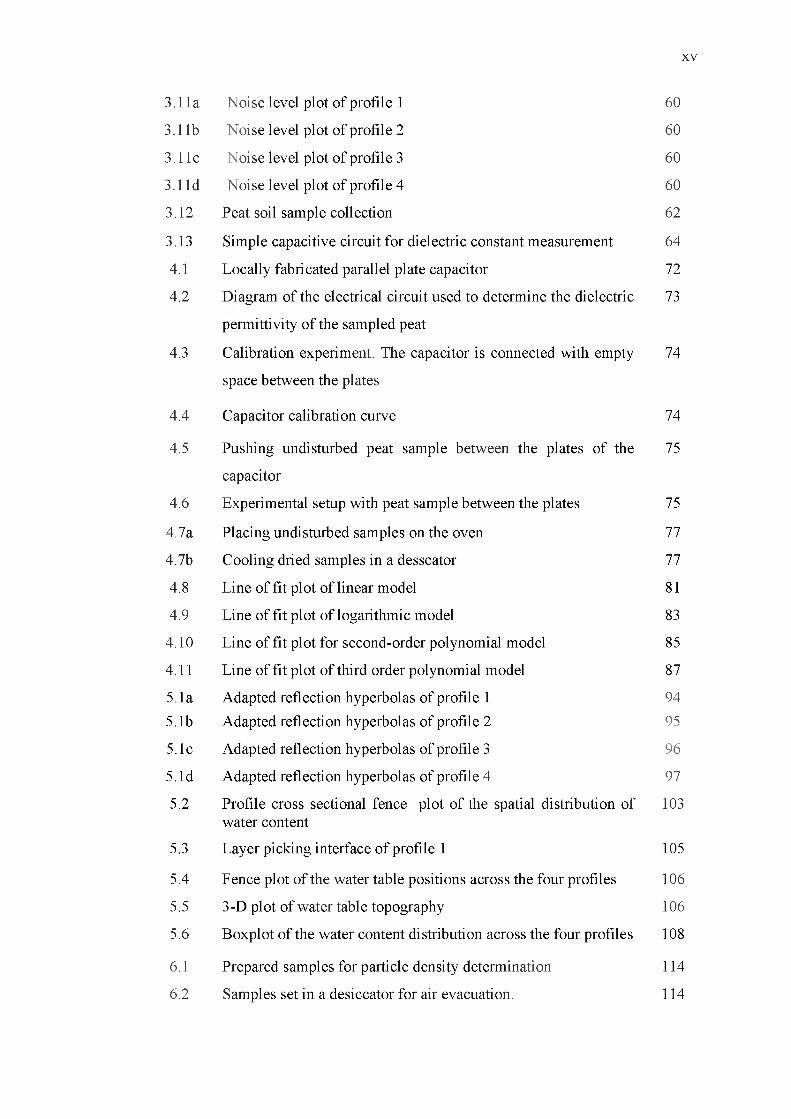
LIST OF FIGURES xiv
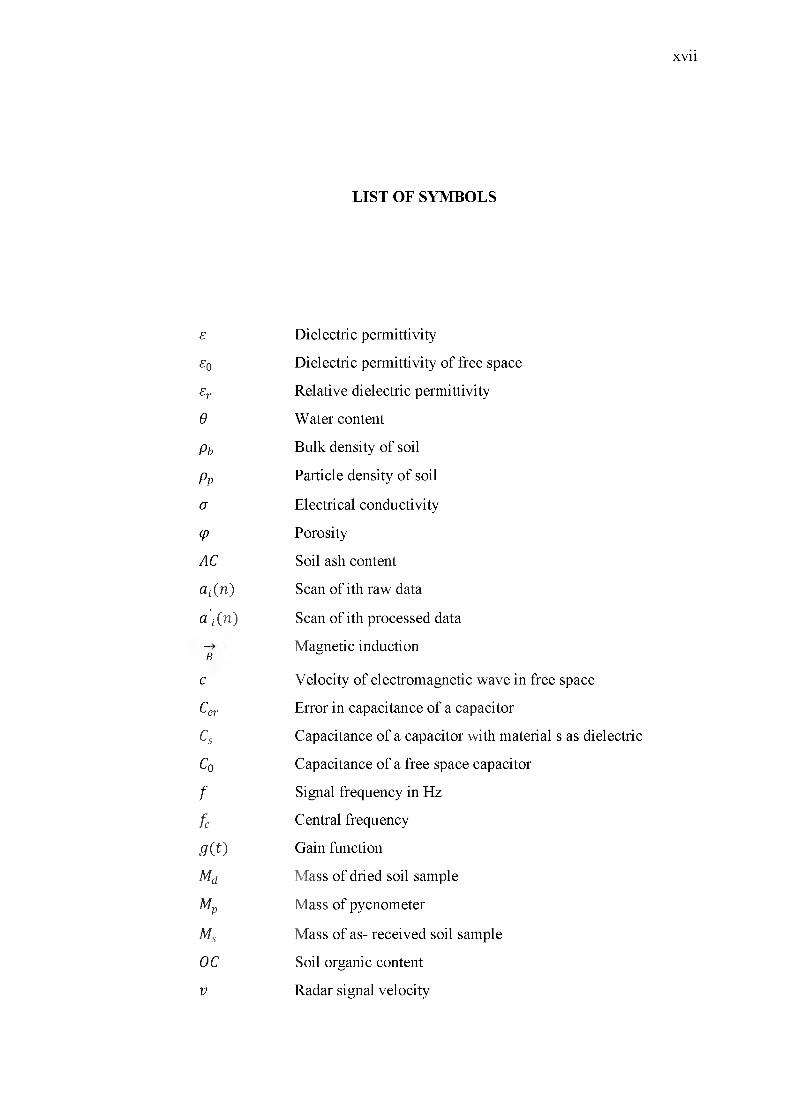
LIST OF SYMBOLS xvii
LIST OF APPENDICES xix
LIST OF ABBREVIATIONS xx
1 INTRODUCTION 1
1.1 Background 1
1.2 Trends in Ground Penetrating Radar (GPR) surveying 6
1.3 Statement of problem 9
1.4 Objectives 12
1.5 Significance of the study 13
1.6 Scope and limitations 14
1.7 Research contribution 15
1.8 Thesis organization 16

2 LITERATURE REVIEW 17
2.1 Introduction 17
2.2 Peat water content estimation with GPR 19
2.3 Estimation of biogenic gas content of peat with GPR 22
2.4 Stratigraphic characterization of peatland 25
2.5 Summary 27
3 RESEARCH METHODOLOGY 30
3.1 Introduction 30
3.2 Study area 30
3.2.1 Geology of the study area 32
3.2.2 Climate and vegetation 33
3.2.3 Topography and hydrology 34
3.2.4 Soil type of the study area 34
3.3 Research design 35
3.4 Data acquisition and processing 38
3.4.1 Field works 38
3.4.2 Peat sampling 61
3.5 Data processing 45
3.5.1 Basic data processing 45
3.5.1.1 Subtract mean (dewow) 46
3.5.1.2 Static correction, 47
3.5.1.3 Time gain 47
3.5.1.4 Background removal. 50
3.5.2 Data processing evaluation 58
3.5.3 Advanced data processing 61
3.6 Peat sampling 61
3.7 Laboratory eXperiments 62
3.7.1 Determination of the dielectric constant of 63
peat samples
3.7.2 Laboratory determination of water content 65
3.7.3 Laboratory determination of porosity 66
3.7.4 Laboratory determination of organic content 67

3.8 Data analysis and interpretation 68
3.8.1 Instrument for data analysis 68
3.8.1.1 Velocity adaptation 68
3.8.1.2 Event picking and migration 69
3.8.2 Empirical analysis 69
4 MODELLING DIELECTRIC PERMITTIVITY AND 71 MOISTURE CONTENT
4.1 Introduction 71
4.2 Laboratory determination of the dielectric constant of peat 71
4.3 Laboratory determination of moisture content 77
4.4 Moisture content modeling 79
4.4.1 Simple linear model 79
4.4.2 Logarithmic model 82
4.4.3 Second-order polynomial model 84
4.4.4 Third-order polynomial model 86
4.5 Discussion 89
5 ESTIMATION PEAT SOIL WATER CONTENT 92 FROM GPR RADARGRAM5.1 Introduction 92
5.2 Data processing and interpretation 935.2.1 Velocity adaptation 935.2.2 Moisture content estimation 93
5.2.3 Water table detection 102
5.3 Discussion 104
6 MAPPING BIOGENIC GAS CONTENT 110
6.1 Introducti on 110
6.2 Data acquisition 111
6.2.1 Laboratory determination of porosity 112
6.3 Biogenic gas identification and estimation from radar image 118
6.3.1 Rule-based texture extracti on 118
6.3.2 Identification and estimation of biogenic gas content 120
6.4 Results 130
6.5 Discussion 130
7 STRATIGRAHIC SEQUENCES AND HUMIFICATION 134 LEVEL OF PEAT SOIL7.1 Introducti on 134
7.2 Data acquisition 135
7.3 Determination of organic content of peat samples 145
7.4 Results 147
7.5 Interpretation 147
7.6 Discussion 151
8 CONCLUSION AND RECOMMENDATION 155
8.1 Conclusions 155
8.2 Recommendation 158
REFERENCES 160
APPENDICES A-J 168-219
TABLE NO. TITLE PAGE
3.1 Descriptive statistics of the acquired raw radargram 40
3.2 Descriptive statistics of the processed radar image 58
3.3 Validation parameters of the four profiles 61
4.1 Computed capacitance of air-filled capacitors for different 74
plate separations
4.2 Computed dielectric permittivity with associated slopes and 76
capacitance for the sampled depth positions
4.3 Records of laboratory determined water content and 78
correspondent dielectric permittivity with respect to sampled
depth
4.4a Linear model output summary 80
4.4b Linear model ANOVA analysis 80
4.4c Linear model coefficients analysis table 80
4.5 a Logarithmic model output summary 82
4.5b Logarithmic model ANOVA analysis 82
4.5c Logarithmic model coefficients analysis table 83
4.6a Second-order polynomial output summary 84
4.6b Second order polynomial model ANOVA analysis 84
4.6c Second-order polynomial model coefficients analysis table 84
4.7a Third-order polynomial model output summary 86
4.7b Third-order polynomial model ANOVA analysis 86
4.7c Third-order polynomial model coefficients analysis table 86
4.8 Modeling results summary 88

5.1a Water content computation of profile 1 98
5.1b Water content computation of profile 2 99
5.1c Water content computation of profile 3 100
5.1d Water content computation of profile 4 101
6.1 Computed bulk density, particle density and porosity 117
6.2 Descriptive statistics of the texture extraction outputs 121
6.3 Computed fractional volume of biogenic gas 130
7.1 Organic content computation 148
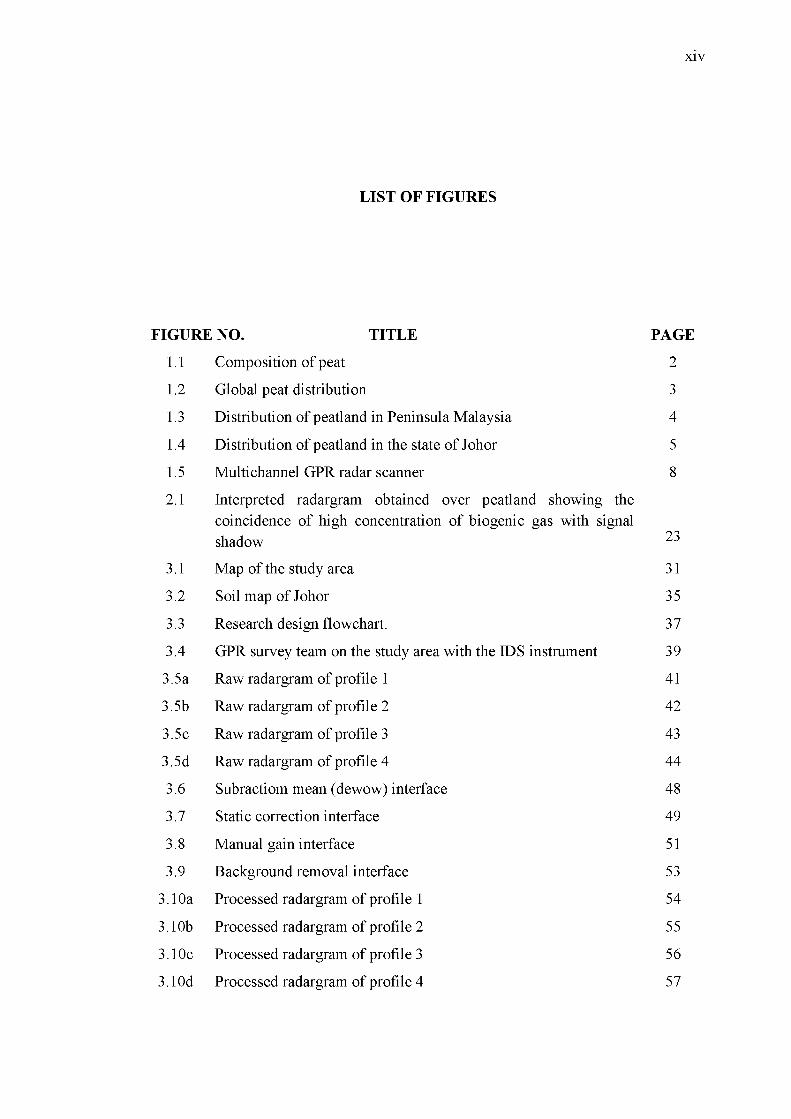
FIGURE NO. TITLE PAGE
1.1 Composition of peat 2
1.2 Global peat distribution 3
1.3 Distribution of peatland in Peninsula Malaysia 4
1.4 Distribution of peatland in the state of Johor 5
1.5 Multichannel GPR radar scanner 8
2.1 Interpreted radargram obtained over peatland showing the coincidence of high concentration of biogenic gas with signalshadow 23
3.1 Map of the study area 31
3.2 Soil map of Johor 35
3.3 Research design flowchart. 37
3.4 GPR survey team on the study area with the IDS instrument 39
3.5 a Raw radargram of profile 1 41
3.5b Raw radargram of profile 2 42
3.5c Raw radargram of profile 3 43
3.5d Raw radargram of profile 4 44
3.6 Subractiom mean (dewow) interface 48
3.7 Static correction interface 49
3.8 Manual gain interface 51
3.9 Background removal interface 53
3.10a Processed radargram of profile 1 54
3.10b Processed radargram of profile 2 55
3.10c Processed radargram of profile 3 56
3.10d Processed radargram of profile 4 57
3.11a Noise level plot of profile 1 60
3.11b Noise level plot of profile 2 60
3.11c Noise level plot of profile 3 60
3.11d Noise level plot of profile 4 60
3.12 Peat soil sample collection 62
3.13 Simple capacitive circuit for dielectric constant measurement 64
4.1 Locally fabricated parallel plate capacitor 72
4.2 Diagram of the electrical circuit used to determine the dielectric 73
permittivity of the sampled peat
4.3 Calibration experiment. The capacitor is connected with empty 74
space between the plates
4.4 Capacitor calibration curve 74
4.5 Pushing undisturbed peat sample between the plates of the 75
capacitor
4.6 Experimental setup with peat sample between the plates 75
4.7a Placing undisturbed samples on the oven 77
4.7b Cooling dried samples in a desscator 77
4.8 Line of fit plot of linear model 81
4.9 Line of fit plot of logarithmic model 83
4.10 Line of fit plot for second-order polynomial model 85
4.11 Line of fit plot of third order polynomial model 87
5.1a Adapted reflection hyperbolas of profile 1 94
5.1b Adapted reflection hyperbolas of profile 2 95
5.1c Adapted reflection hyperbolas of profile 3 96
5.1d Adapted reflection hyperbolas of profile 4 97
5.2 Profile cross sectional fence plot of the spatial distribution of water content
103
5.3 Layer picking interface of profile 1 105
5.4 Fence plot of the water table positions across the four profiles 106
5.5 3-D plot of water table topography 106
5.6 Boxplot of the water content distribution across the four profiles 108
6.1 Prepared samples for particle density determination 114
6.2 Samples set in a desiccator for air evacuation. 114

6.3 Air evacuation in progress
xv
115
6.4 Variation of total porosity with depth at sample collection site 117
6.5 Boxplot of the measured porosity 118
6.6 Texture extraction implementation on profile 1 using range
filter
120
6.7a Extracted low textured regions of Profile 1 122
6.7b Extracted low textured regions of Profile 2 123
6.7c Extracted low textured regions of profile 3 124
6.7d Extracted low textured regions of profile 4 125
6 .8a Profile 1, stacked velocity and texture layers 126
6 .8b Profile 2, stacked velocity and texture layers 127
6 .8c Profile 3, stacked velocity and texture layers 128
6 .8d Profile 4, stacked velocity and texture layers 129
6.9 Image map of the lateral distribution of biogenic gas 131
7.1a Profile 1 layer picking interface 137
7.1b Profile 2 layer picking interface. 138
7.1c Profile 3 layer picking interface 139
7.1d Profile 4 layer picking interface 140
7.2a Picked layers of profile 1 141
7.2b Picked layers of profile 2 142
7.2c Picked layers profile 3 143
7.2d Picked layers profile 4 144
7.3 Crucibles arranged in moffle furnace in readiness for ashing 146
7.4 Ash remnants of the burnt dried samples 146
7.5 Plot of the variation of organic content with depth 149
7.6 Comparison of the measured organic content with detected subsurface layers
150
7.7 Whitish clay obtained at a depth of 2.5m 150
7.8 3-D fence map of stratigraphic layers of the peat deposit. 152
£ Dielectric permittivity
^0 Dielectric permittivity of free space
Er Relative dielectric permittivity
6 Water content
Pb Bulk density of soil
Pp Particle density of soil
a Electrical conductivity
<P Porosity
AC Soil ash content
at (n) Scan of ith raw data
a' i (n) Scan of ith processed data
~B Magnetic induction
C Velocity of electromagnetic wave in free space
c'-er Error in capacitance of a capacitor
Cs Capacitance of a capacitor with material s as dielectric
Co Capacitance of a free space capacitor
f Signal frequency in Hz
fc Central frequency
g (t ) Gain function
Md Mass of dried soil sample
Mp Mass of pycnometer
Ms Mass of as- received soil sample
OC Soil organic content
V Radar signal velocity

Vc Electric potential across a capacitor
Xc Reactance of a capacitor

APPENDIX TITLE PAGEA1 Amplitude records of a trace on the acquired data 169
A2 Plots of the raw and processed data 171
B1 I-V records of air-filled capacitors at different plate 172
separations
B2 I-V plot of capacitor with empty space for different plate 173
seperation l(in cm)
C1 I-V records of capacitance with sampled soils as dielectric 175
C2 I-V plots of capacitor with sampled soils as dielectric 178
D1 Calibration of mass measuring chemical balance calibration 184
readings
D2 calibration curve 184
E Water content determination data sheets 185
F1 computed regression residuals 187
F2 Regression residual plots 191G1 Bulk density 192
G2 Particle density measurement 194
H Organic content measurement data sheets 197
I Water content contour map gridding report 200
J ENVI ZOOM Texture extraction report sheet 216

Abbreviation Meaning
A C Aalternating Current
ASEAN Asssociation of Southeas Asian Nations
ANOVA Analysis of Variance
ASTM American Society for Testing and Measurement
CEC Cation Exchange Capacity
CIFOR Centre for International Forestry Research
CRIM Complex Refrective Index Model
EM Electromagnetic
FAO Food and Agriculture Organization
f-k, Frequency -W ave number
GPR Ground Penetrating Radar
H1-H10 Level of decomposition of peat from list decomposed
(H1) to most decomposed (H10)
HYMENET Hygrometric Measurement Network
IDS Ingegneria Dei Sistemi, a brand name for GPR
equipment manufacture
MS Mean Squared
NRMSE Normalized Root Mean Squared Error
RMSN Root Means Square Noise
SNR Signal to Noise Ratio
SS Sum of Squared
TDR Time Domain Reflectometry
UNEP United Nations Environmental programme
UNESCO United Nations Educational, Scientific and Cultural
organization
INTRODUCTION
1.1 B ackground
The vegetation of forest wetland under waterlog and moderate topographic
conditions is continuously being decomposed due to series of chemical changes
thereby transforming the forest soil structure through fossilization and sedimentation
at different rate on different locations. This enhances the heterogeneity and
biodiversity of the soil resources. The transformation plays a key role in climate
regulation, biodiversity conservation and support for human welfare. Prominent
product of this ecosystem transformation is the formation and accumulation of peat
soil.
Peat is described as the accumulation of partly decomposed remains of dead
plants under waterlogged conditions for thousands of years (Huat, et al, 2009). The
formation of peat is as a result of gradual accumulation and decaying of the dead
plant materials mostly in marshy areas. These include various types and parts of
plant vegetation such as trees, grasses, fungi and their respective parts such as stems,
leaves, roots etc. The gradual processes of decomposition lead to the variation in
both physical and chemical structure under anaerobic conditions leading to an
ecosystem with excessive production of organic matter. Peat can ordinarily be
described as organic soil but the continuous accumulation and decomposition of the
organic materials leads to the development of a system where the production and
accumulation rate of the organic constituents exceed the decomposition rate. This is
as a result of the continuous processes of production, death and deposition of plant

materials within the forest. Thus peat soil is characterized with excessively
higherproportion of organic matter.
Peat is naturally composed of four major components: water, organic matter,
mineral matter and gas (Xuehui and Jinming, 2009). Peat contains excessive high
water content which ranges from 60% to 90% by mass (Figure 1.1). It could however
be as high as 150% to 700% as observed in West Malaysian peat deposit (Huat et al.,
2009). The water content of the peat can be chemically or physically bound to the
solid component or appears as permeable or free-space pore water.
Figure 1.1 Composition of peat (Xuehui and Jinming, 2009)
The organic and mineral matters form the solid components of the peat.
Organic component consists of the plant debris with high decomposition resistance
such as plant roots, stems, leaves, spores, fruits etc. The mineral component of peat
has two sources: transport agents such as running water and wind during
accumulation processes, and chemical processes associated with the decomposition
of plant materials.
Peatlands are geographically spread in almost all regions of the world (Figure
1.2). They are however more abundant in the higher latitude continents of Eurasia

Figure 1.2 Global peat distribution (DOE, 2010)
and North America (Objective Corporate Research, 2005). It represents about 50% to
70% of the global wetlands (Finlayson and Spiers, 1999) making it the most
widespread of all wetlands on the earth. With a deposit covering an area of about 1.4
million square km, Russia has the highest deposit of peatlands covering about 8% of
the total land mass of the country (UNEP et al, 2005). In Southeast Asia, about 25
million hectares of the land are peat, representing about 60% of the global tropical
peatland resources (UNEP et al, 2005) and nearly one-tenth of the entire extent of
global peat resources (ASEAN, 2007). The largest Peatland deposit in Southeast Asia
is found in Indonesia with over 70% of the total Peatland resources of the region
(ASEAN, 2007).
Peatland is also available in many parts of Malaysia where it occurs in both
highland and lowland region of the country. It is however more extensive in low
lying poorly drained depression basins of the coastal areas. The total peatland area in
Malaysia is approximately 2.4 million hectares, representing 8% of the country’s
total land area (Mamit, 2009). About 1.6 million hectares of this are found in
Sarawak, representing 13% of the state’s total land area. Peninsular Malaysia and
Sabah have peatland areas of 0.7 million and 0.1 million hectares respectively.
(Mamit, 2009). The largest deposit of peat soil in Peninsula Malaysia is found in the
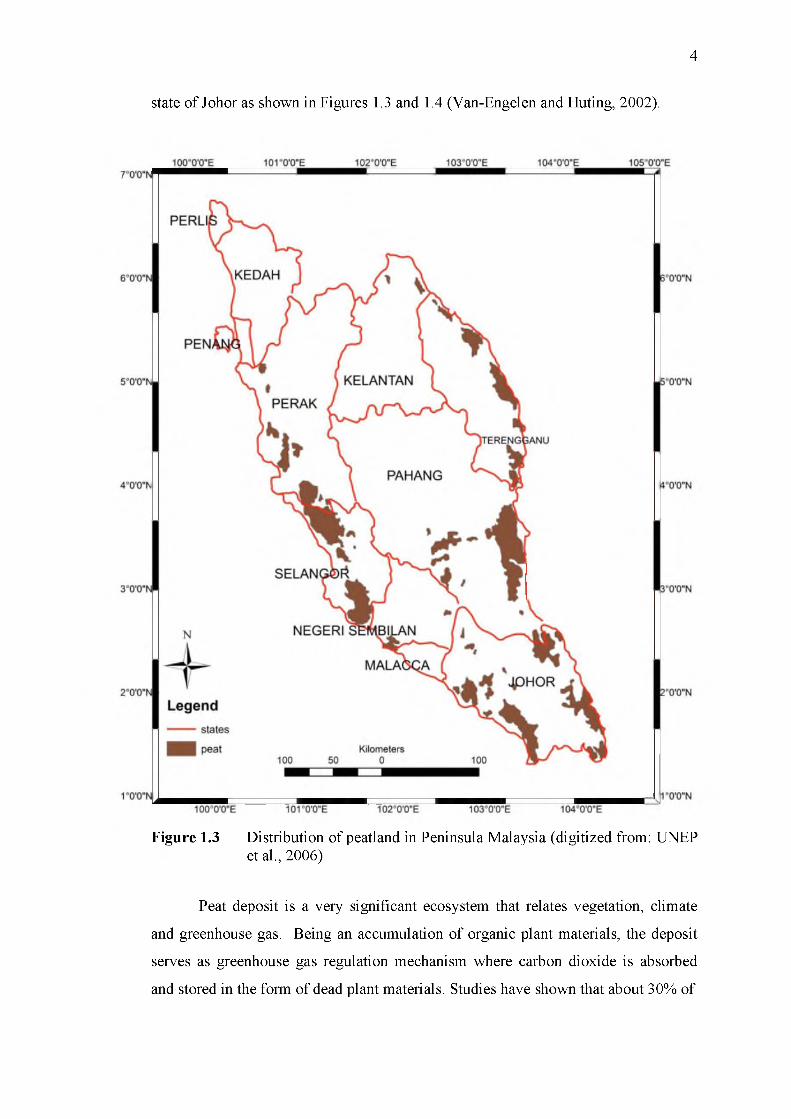
state of Johor as shown in Figures 1.3 and 1.4 (Van-Engelen and Huting, 2002).
Figure 1.3 Distribution of peatland in Peninsula Malaysia (digitized from: UNEP etal., 2006)
Peat deposit is a very significant ecosystem that relates vegetation, climate
and greenhouse gas. Being an accumulation of organic plant materials, the deposit
serves as greenhouse gas regulation mechanism where carbon dioxide is absorbed
and stored in the form of dead plant materials. Studies have shown that about 30% of

Figure 1.4 Distribution of peatland in the state of Johor. (digitized from: Wetland International, 2010)
terrestrial carbon is stored in the peat ecosystem (UNEP et al., 2005). About 15% of
the global peatland carbon is stored in the tropical peatland alone (Mamit, 2009).
Peatland drainage therefore leads to the oxidation and subsequent release of carbon
dioxide into the atmosphere.
Peat soil has high water retention capacity (Mamit, 2009). The soil acts as a
water stabilizing mechanism by releasing stored water during the dry season and rain
water absorbed during heavy rainfall. This helps in releasing water stress and
providing drainage for agricultural activities. Peat is highly flammable due to high
carbon content. The soil can easily burn under low moisture condition. It therefore
makes the soil to serve as energy resource that is useful in domestic heat production
(Objective Corporate Research, 2005).
Thus peatland has a significant effect on millions of people around the world.
Knowledge about the extent, quantity and composition of peat deposit is therefore of
great importance in assessing the economic potentialities of the natural resources.
Analysis of the stratigraphic sequences and petrophysical parameters of peatland is
therefore needed for effective understanding of the distribution of its hydrological
and chemical variables and the exchange of carbon within the ecosystem for
sustainable development of the resource and its benefit to the present and future
generations.
Being carbon storage ecosystem, invasive and destructive surveying of
peatland will adversely have negative environmental effects as exposing the interior
of the deposit will lead to the disturbance of the balance of atmospheric gas and
contributes to the greenhouse gas emission (Page et al, 2011). Noninvasive
geophysical techniques therefore offer tremendous advantages of environmental
friendliness as they cause minimal disturbance thereby preserving the natural storage
of the system. Ground Penetrating Radar (GPR) is the most extensively used
noninvasive technique for mapping and estimating the composition and hydrological
parameters of peatland. Thus there is the need for extensive research toward
enhancement and effective development of this noninvasive surveying techniques
with the aim of improving the various models applicable for the investigation of
peatland parameters.
1.2 Trends in G round P enetratin g Radar (G PR) Surveying
The term Ground Penetrating Radar or ground probing radar refers to a range
of electromagnetic techniques designed primarily for the location of objects or
interfaces buried beneath the earth surfaces or located within a visually opaque
structure (Daniels, 2004). GPR has become a useful and efficient instrument for
gathering information about subsurface soil and geologic formations. It records
continuous graphic profiles of the subsurface interfaces with a high degree of
accuracy. The technique is particularly found to be successful in detecting subsurface
geologic structures (Pauselli et al, 2010), buried archeological remains, subsurface

fracture zones and cavities (El-Qady et al, 2005) etc.
The use of electromagnetic signal to determine the presence of a remote
terrestrial metal object was first conducted by a German physicist, Christian
Hulsmeyer in 1904 who used radio waves in a collision avoidance device for ships
(Daniels, 2004). The first description of the use of radar in the location of buried
object however appears six years later in Germany when Leimbach and Lowy
patented the technique by burying a dipole antenna in an array of vertical borehole
and comparing the magnitude of the signals received when successive signals are
transmitted and received. A crude image was formed whose analysis led to the
estimation of the depth of the buried interface. The technique was later used by
Hulsenbeck for the first time in 1926 to determine the structure of buried features
(Daniels, 2004). He noted that any change in dielectric properties of the subsurface,
not necessarily involving conductivity, will also produce reflection and thus the
technique, through realization of directional source, had advantages over the seismic
method which has similar principle.
The subject generated considerable interest in the early 1970s when in the
1972 Apollo 17 mission whose primary purpose was to search for subsurface
features of the moon, a coherent radar system was used to measure both the phase
and the amplitude characteristics of the radar echo (Sensors and Software, 2012).
The instrument was able to detect a layer-like dielectric discontinuity of about 1.3 to
1.0 at a depth as high as 1km. Since then to the present day, the method has
effectively been used in space and other planetary exploration because of its ability
to use remote non-contact transducers of the radiated energy rather than the ground
contact type needed for seismic investigation.
There are two modes of operation of the GPR survey technique: shallow
subsurface and deep borehole surveys (Annan, 2001). The shallow surface GPR,
which is the most commonly used includes a hand pushed or pulled GPR chart
(Figure 1.5), airborne and satellite surveying as well as high speed surveying from
vehicle mounted radar. The deep borehole GPR survey involves the transmission of
electromagnetic waves through a vertical borehole log. The reflected transient

electromagnetic waves are received by the receiving antenna and the received signal
can be analyzed to detect the subsurface discontinuity through the changes in the
vertical electrical properties notably electrical conductivity and dielectric constant.
Figure 1.5 Multichannel GPR radar scanner (IDS DAD Inc, 2011).
GPR has a wide range of applications which expands steadily due to the
development of more sophisticated computing devices. These include: outlining the
foundation of building and other engineering structures, (Abbas, et al, 2009), mine
detection (Bruschini et al, 1998), archeological investigation (Negri et al, 2008),
location of water table, and characterization of subsurface contamination (Hamzah et
al, 2009), road inspection (Loizos and Plati, 2007), stratigraphic studies of
sedimentary formation (Bristow and Jol, 2003) and geomorphic controls of
floodplain and surface subsidence (Poole et al, 2002).
The suitability of GPR as a subsurface survey tool for the imaging and
characterizing the internal structure of peat deposit is strongly influenced by the
petrophysical and electrical properties of the deposit. Peat is characterized by, high
porosity and water content, and low magnitude of electrical conductivity due to the
presence of highly concentrated inactive and strongly bound organic compounds.
The low level of electrical conductivity enables larger depth of penetration within the

peat deposit. Radar signal through the water saturated peat gives a high resolution
image to a depth of about 16m is some cases (Lowry, et al, 2009). Thus GPR appears
to be a highly suitable tool for peat analysis.
Remarkable achievements were recorded in peat land surveying with GPR.
These include among others, peatland boundary delineation (Palletier et al, 1991),
imaging dominant stratigraphic layers and carbon pool estimation (Dallaire et al,
2009) and evaluating spatial variability of free-phase biogenic gas of the peat soil
(Strack and Mierau, 2010). All the previous studies however are conducted at the
northern peatland, that is the largest peat deposit of the northern hemisphere that
covers large areas of Canada, Finland, Sweden and Russia. The region is a low
temperate zone where in most cases the deposit is covered by snow. Site-specific
calibration of water content with dielectric constant is normally done on estimating
the peat’s water content while biogenic gas content is usually quantified using the
complex refractive index model.
Peat soil in all the previous works was characterized based on Von post’s
scale of humification level owing to its suitability to the low temperate climatic
condition. It is however observed that parametric properties of peat soil are greatly
influenced by weather and climatic variables such as subsurface water condition,
temperature and the type of peat-forming plant community (Xuehui and Jinming,
2009). There is therefore a need for extensive research toward development of a
model for peatland surveying with GPR with respect to the tropical region of the
earth for the purpose of maximizing the benefits of the potentialities of the tool
particularly in Southeast Asia which accommodates the largest deposit of the soil in
the tropical region.
1.3 Statem ent o f problem
Petrophysical properties of peat soil such as water, biogenic gas and organic
contents are vital parameters that define the physical and chemical properties of the
soil. They determine the transformation processes taking place and its environmental

impact on the deposit. They can be used to predict the effect of seasonal and climatic
changes to the environment and the ecosystem in general. Mapping and modeling
these properties are therefore strategic move toward effective acquisition of useful
data necessary for sustainable management initiative of the resources.
Mapping petrophysical properties of peat is a major area of research with a
wide range of application in geosciences, soil science, agriculture and remote
sensing. It had been a labor intensive process that involved sampling for point
observation with limited areas of coverage and broad sample spacing. The exercise
was however simplified by the introduction of remote mapping devices such as
optical and radar satellite imagery and surface radar scanners. The application of
satellite images is however limited due to the fact that major physio-chemical
transformations of the soil which influence the petrophysical properties occur at the
subsurface deeply beyond the reach of the sensor’s energies. Thus with regard to
depth of coverage, fastness and continuous data acquisition over a larger area GPR is
the most convenient technique of peat soil surveying (Doolittle and Butnor, 2009).
Unlike mineral soil, Peat has the most complex and unpredictable
petrophysical properties that made it impossible to have a global prediction model.
For instance even though there is a clear relationship between moisture content and
apparent (measured) dielectric permittvity of peat as in the case of mineral soils, the
former tends to deviate from the globally acceptable model relations that is found to
be applicable to all mineral soils. Further research work on peat soil moisture
content: dielectric permittivity relationship such as the work of Pumpanem and
Ilvesniems (2005) and Persekian et al (2011) showed that both the nature and
parametric coefficients of the model are site-specific due to the variation in climate
and vegetation type of the peat-forming plant community.
Mapping relevant petrophysical properties of peat soil such as porosity and gas
content are done based on the empirical relationship between the dielectric
permittivity and moisture content. Despite the relevance of this relation however,
literature evidences has shown that virtually no attempt is done to develop the model
with respect to the tropical peat deposit of the Southeast Asian region. All the

existing models are relative to high latitude peatland of the Northern Hemisphere.
Considering the great variability in climate and vegetation type between the forest of
the humid temperate region of the Northern Hemisphere and that of Southeast
tropical region, it is believed that numerical modeling of these parameters with
respect to Southeast Asian peatland will provide a bases for the surveying and
mapping of the deposit noninvasively with GPR.
This work therefore involves the numerical modeling of dielectric
permittivity of the peat soil and water content uniquely applicable to Southwestern
Malaysian peatland which could however be applicable to any tropical peatland with
same or similar vegetation cover. The model equation obtained was used to map the
spatial distribution of water content within the area, a parameter of great economic
and environmental relevance to the deposit.
One of the major environmental challenges facing Asian countries including
Malaysia is the issue of forest fire facilitated by degradation of peatland. Forest fire
occurred in many peatland forests at the pineapple plantation in Malaysia since
1970s (Nuruddin, 1998). The most prominent incidence is the 1997/1998 En-Nino
disaster which affected many countries of the region. El-nino destroyed about 10% of
the total peatland areas of Indonesia (UNEP et al, 2005). In that year alone, four
incidences of forest fire were recorded in Peninsular Malaysia with a total burnt area
of 425.27 hectares (Nuruddin, 1998). The Centre for International Forestry Research
(CIFOR) in Jakarta, Indonesia, where the fire originated from, reported that the cause
of the fire was from unconsolidated peat burning (Rowell and Moore, 2000).
A common forest fire preventive technique is the surveying of forest region
to detect fire hotspot using remote sense imagery (Kudoh and Hosoi, 2003). Peatland
forest fire is primarily caused by the accumulation of free-phase biogenic gas (Page
et al, 2 0 0 2 ), a product of microbial activities that is usually trapped within the pore
space at the interior of the deposit. Thus subsurface mapping will by far be more
effective.
Mapping biogenic gas is mostly done based on complex refractive index
model (Strack and Mierau, 2010) which provides imperial equation relating the gas
content with porosity, water content and the dielectric permittivites of the air and the
soil. Although the model was found to be effective in gas content estimation, its
dependent on large number of literature parameters results into high measurement
uncertainty (Persekian et al, 2011). Experimental verification of the parameters on
the other hand will make the overall experiment very cumbersome. In this work, a
technique is developed for the mapping and identification of the subsurface free-
phase gas accumulation based on the effect of the gas on radar signal velocity and
attenuation rate.
Peat stratigraphy is a consequence of great variability in the decompositional
resistance of various types and parts of peat-forming plants. The sequences of the
stratigraphic layers are associated with the variation in nutrient content, acidity and
humification levels of the deposit. The sequences were classified based on Von-Post
scale of decomposition from least (H1) to highly decomposed (H10) (Huat et al,
2011) which is more detail of ASTM classification.
It is however observed that classification of peat on the bases of
decomposition though suitable to high-latitude peat deposit, failed to adequately
characterize tropical peat deposit owing to the variation in climate, vegetation and
soil type (Wust et al, 2003). Thus a unique peat classification scheme more suitable
to tropical peat deposit was adopted in classifying stratigraphic sequence detected
from the radar image based on ash content
1.4 O bjectives
The aim of this work is to develop a model for the mapping and analysis of
petrophysical properties and delineate stratigraphy of tropical peatland with ground
penetrating radar (GPR). The objectives of the study are:
(1) To develop an empirical model relationship between the moisture content and
relative dielectric permittivity of Pontian peat soil.
(2) To map and estimate the spatial distribution of moisture content and delineate the
spatial location of the water table of the peatland within the study area.
(3) To map the spatial distribution of biogenic gas content and estimate fractional
volume of the gas within the interior of the deposit.
(4) To map and delineate the stratigraphic sequence of the peat deposit and classify
the stratigraphic layers on the basis of ash and organic matter contents.
1.5 S ign ificance o f the study
One of the major advantages of GPR over other geophysical survey tools is
its non-invasive and non-destructive nature. The tool is therefore cost effective in
terms of finance, labor, and time. This study will provide a time and cost effective
means of mapping the peat soil and identifying the areas that are susceptible to the
hazard of forest fire. The study will serve as an assessment of the economic
potentialities of the peat resources with respect to agriculture and possible production
of commercial energy.
Stratigraphic analysis of GPR image will reveal regions of the peat deposit
associated with high carbon content and give more accurate in situ stratigraphic
depth information. The study will also contribute immensely to the development of
agriculture by providing on-the-spot means of peat soil characterization with respect
to soil fertility which is related to organic content, with high cost effectiveness and
reasonable degree of accuracy. It will also play a significant role in monitoring and
control of flood plains. The moisture content and stratigraphic analysis can reveal
information about the soil subsidence drainage of the peat. This will serve as an
indicator of the biophysical condition and the effect of varying climatic condition to
the peat ecosystem.
The study will generally provide background information about the effective
carbon storage, energy and economic potentialities of the peatland at all levels with
respect to the study area, leading to effective management of the resources. The
study will also contribute greatly to knowledge in related disciplines such as
radiation science, geophysics, remote sensing and geomatic engineering and other
areas that require accurate subsurface imaging and soil resources management.it will
specifically expand the scope of application of GPR as a remote sensing and
Geomatic Engineering tool.
1.6 Scope and lim itation s
This research was carried out in two phases: field and laboratory activities.
the field operation involves scanning of four profiles with a multichannel IDS radar
scanner. The profiles are 20m long each spaced at equal intervals of 4m. Two factors
that determine the selection of the site and area of coverage are: accessibility and
occurrence of water table sufficiently below the surface. The four profiles were
chosen based on the need to achieve adequate coverage within the accessible regions
of the area. The profiles were scanned with IDS scanner at a frequency of
200MHz.Core samples were collected from the surface to a depth of 3.5m at a depth
interval of 0.1m. The collected samples were analyzed in order to determine the
required geotechnical and physical properties of the soil with depth. All laboratory
experiments were carried out based on American Standard for Testing and
Measurement (ASTM) standard for peat soil.
The depth of penetration of the radar signal did not exceed 5m. This is due to
the strong attenuation of the signal with the soil owing to its limitation by both the
radar frequency and the soil characteristics of the study area. A careful frequency
selection was made based on channel output selection to ensure maximum depth of
coverage within a reasonable level of depth resolution. After several processing trials
with the output radargrams from the three channels of the scanner (200MHz,
450MHz and 600MHz), observation showed that the 200MHz antenna gives a better
resolution within the 5m depth, a mean peat thickness of deep peat in the study area
according to Wetland International (2010). The channel was therefore selected and
used throughout the work.
The reflexw interactive interpretation software was used for the interpretation
and visualization of the data. The software is compatible with various data formats
and is equipped with user-friendly processing interfaces.
1.7 R esearch contribu tion
The academic and industrial contributions of this research work are
summarized as follows:
> A model for application of GPR in the assessment and quantitative estimation of
water content of Pontian peat soil is developed based on the derived empirical
equation. The equation is applicable to any peat deposit of the same climate
condition having the same vegetation type cover.
> The developed model also provides the bases for the application of GPR in the
estimation biogenic gas content of tropical peat soil. Thus the gas content of the peat
deposit can be estimated from a remote surface measurement. Biogenic gas mapping
can be used to identify regions of the deposit that are prone forest fire due to high
accumulation of the inflammable gas. The gas mapping can also be used to assess the
level of impact of the deposit to greenhouse gas emission.
> The work revealed for the first time, the thickness and the level of humification of
Pontian peat soil from surface radar measurement. This is in contrast to the invasive
and destructive core analysis technique which is labor intensive and less accurate.
The humification level of peat soil is related organic content which determine
nutrient content of the soil, a parameter of great importance to agricultural and
horticultural application of the soil.
> The work also provides for the first time, information about the stratigraphic
sequence of Pontian peat deposit on the bases of ash content, another important
parameter that determine the agricultural yield of the soil.
1.8 Thesis organization
This thesis is divided into eight chapters. Chapter one introduces the research
work by presenting the background of the study, problem statement, research
objectives, significance of the study, scopes of the study and thesis organization.
Chapter two covers literature review. This includes review of literatures related to the
application of GPR in peat mapping with particular emphasis on water content,
biogenic gas and stratigraphic mappings. Chapter three describes the research
methodology and includes a brief description of the study area, research design, GPR
system description, laboratory experimental procedure, field procedure, method for
data collection, data processing strategy, interpretation procedure and method for
data analysis. Chapter four to seven covers respectively the four objectives of the
research these involve step by step report of the data processing and analysis relative
to the objective including laboratory procedures used in order to achieve the
objective. Chapter eight covers in general the conclusion and recommendation.
REFERENCES
Abbas A. M ,. Kamei H,. Helal, A , Atya M. A &. Shaaban F. A (2009) Contribution of
geophysics to outlining the foundation structure of the Islamic Museum, Cairo, Egypt
Archaeological Prospection, 12(3), 167-176.
Alhaddad, B, Burns, M and Cladera, J (2007). Texture Analysis for Correcting and
Detecting Classification Structures in Urban Land Uses. “Metropolitan area case
study - Spain” IEEE. Urban Remote Sensing Joint Event . 1-4244-0712-5/07.
Annan , A. P. (1999). Practical Processing o f GPR Data. Sensors and Software Incorporate.
Missisauga, Canada
Annan, A. P. (2001). Ground Penetrating Radar Workshop Notes. Sensors and Software Inc.
Missisauga, Canada.
ASEAN (2007). Asean Peatland Management Strategy. Strategy and Action Plan for
Sustainable Management o f Peatlands in Asian Member Countries. ASEAN
Peatland Management Initiative; Jakarta, Indonesia.Peatland Management Initiative;
Jakarta, Indonesia.
ASTM D 2974-87 (1987). Standard Test Methods for Moisture, Ash, and Organic Matter o f
Peat and Other Organic Soils. American Society of Testing and Materials, 1916
Race Street, Philadelphia, PA 19103.
ASEAN-USCRMP (1991). The Coastal Environmental Profile of South Johore,
Malaysia.Association of Southeast Asian Nations/United States Coastal Resources
Management Project, Technical Series No.6. Manila, Philipines.
ASTM D2974-07 (2007). Standard Test Methods for Moisture, Ash, and Organic Matter o f
Peat and Other Organic Soils. D2974 - 07. DOI: 10.1520/D2974-07A.
ASTM D4427 - 07 (2007). Standard Classification o f Peat Samples by Laboratory Testing.
D4427 - 02, (2007). DOI: 10.1520/D4427-07.
ASTM D854 - 10 (2010). Standard Test Methods for Specific Gravity o f Soil Solids by
Water Pycnometer. D854 - 06 '1. D0I:10.1520/D0854-10.

Baili, J, Lahouar, S, Hergli, M, Al-Qadi, I and Besbes, K. (2009). GPR Signal Denoising by
Discrete Wavelet Transform. NDT & E International. 42:696-703.
Bradford, J. H., McNamara, J. P., Bowden, W., and Gooseff, M. N., (2005). Measuring
Thaw Depth Beneath Peat-lined Arctic Streams using Ground-Penetrating Radar.
Hydrological Processes, 19, 2689-2699.
Bristow, C and Jol, H. M (2003). An Introduction to Ground Penetrating Radar (GPR) in
Sediment; Geological Society, London, special publication, 211, 1-7
Bruschini, C., Gros, B., Guerne, F., Pierre, P., Carmonia, O. (1998). Ground Penetrating
Radar and Imaging Metal Detector for Antipersonnel Mine Detection. Journal o f
Applied Geophysics. 40, 59-71.
Cannazza, G., Cateldo, A. and De Benedetto, E., (2009). An Innovative Method for TDR
Measurement of Static Electrical Conductivity in Granular Materials. I2MTC 2009-
International Instrumentation and Measurement Technology Conference, I2MTC
2009. Singapore.Pattern Recognition Letters, 29, 905-917.
Caron, J and Riviere, L.(2003). Quality of subtrates for plant growth in containers. In: Parent, L
and Ilnicki, P (Ed). Organic Soils and Peat Materials for Sustainable Agriculture. CRC
Press LLC, Boca Raton, Florida.
Castellano, G, Bonilha, L., Li L.M.& Cendes F. (2004).Texture Analysis of Medical Images.
Clinical Radiology . 59, 1061-1069.
Chambers, F M, Beilman, D. W and Yu, Z. (2011). Methods for determining peat
humification and for quantifying peat bulk density, organic matter and carbon
content for palaeostudies of climate and peatland carbon dynamics. Mires and Peat.
7 ( 07), 1-10.
Comas, X. and Slater, L. (2009). Non-Invasive field-scale characterization of gaseous-phase
methane dynamics in peatlands using the Ground Penetrating Radar (GPR) Cycling in
Northern Peatlands, Geophysical Monograph 184, American Geophysical Union
(AGU). pp. 159-172.
Comas X, Slater L. and Reeve A (2005). Spatial variability in Biogenic Gas Accumulations in
Peat soils is revealed by ground penetrating radar ( G P R ) . G e o p h y s i c a l
R e s e a r c h L e t t e r s , 32. L 0 8 4 0 1, doi :10.1 029/2004GL022297.
Comas, X., Slater, L. and Reeve, A. (2008). Seasonal geophysical monitoring of biogenic gas
in northern peatland: Implication for temporal and spatial variability in free phase gas
production rate. Journal o f Geophysical Research. 113 (G01012), 1-12.

Cosenza, P. and Tabbagh, A (2004). Electromagnetic determination of clay water content: role
of the microporosity. Applied Clay Science, 26: 21-36.
Dallaire P, Garneau M, Giroux B (2009). High-resolution carbon pool estimation at peatland
scale using ground-penetrating radar and paleoecological data. The 2nd International
Symposium: Peatlands in the Global Carbon Cycle. Praha, Czech Republic, pp. 25-30.
Daniels, J D. (Ed.) (2004). Ground Penetrating Radar. (2nd ed.), Institute of Electrical
Engineers, United Kingdom.
Derobert, X, Iaquinta, J, Klysz, G and Balayssac, J. (2008). Use of capacitive and GPR
techniques for the non-destructive evaluation of cover concrete. NDT & T, 41, 44-52.
Development Projects (2002). Jenis Tanah Nigeri Johor. Unpublished, Entrepreneurial
Projects / Direct Selling / Idle Land Program / Flagship Projects / Events and News /
Technology.
DOE (2010). Global Peatlands. Northern Ireland Environmental Agency. Retrieved May 19,
2012 from http://www.doeni.gov.uk/niea/biodiversity/habitats-
2/peatlands/about_peatlands/global_peatland.htm
Doolittle, J. A. and Butnor, J. R. (2009). Soils, peatlands, and Biomonitoring. In: Jol, H. M.
(Ed), Chapter 6, Ground Penetrating radar: Theory and Applications. Elsevier,
Amsterdam, the Netherlands, pp179-202.
Doolittle, J. A., Minzenmayer, F. E., Waltman, S. W., Benham, E. C., Tuttle, J. W., Peaslee,
S. D. (2007). Ground-Penetrating Radar soil suitability map of the conterminous
United States. Geoderma 141, 416-421.
El-Qady, G., Hafez, Mahfooz, Abdalla, M. and Ushijima, K. imaging subsurface cavities
using geoelectric tomography and ground penetrating radar. Journal of Cave and
Karst, Vol. 67, No. 3, p 174-181.
Finlayson C.M. & Spiers A.G. (Eds), (1999): Global Review of Wetland Resources and
Priorities for Wetland Inventory. Supervising Scientist Report 144 & Wetlands
International Publication 53, Supervising Scientist, Canberra, 520 pp.
Frangi, J, Richard, D, Chavanne, X., Bexi, I., and Guibert, V. (2009). New in situ techniques
for the estimation of the dielectric properties and moisture content of soils. C. R,
Geosciences. 341, 831-845.
Fisher, S. C., Steward, R. R. and Jol, H. M. (1992). Processing ground penetrating radar
data. Consortium for Research in Elastic Wave Exploration Seismology (CREWES)
Research Report. Volume 4.
Gadani, D. H. and Vyas, A. D., (2008). Measurement of complex dielectric constant of soils
of Gujarat at X-and C-bands microwave frequencies. Indian Journal o f Radio and
Space Physics. 37, 221-229.
Gader, P. D., Nelson, B. N., Frigui, H., Vaillette, G. and Keller, J. M. (2000). Fuzzy logic
detection of landmines with Ground Penetrating Radar. Journal of Signal Processing.
80 (4), 509-526.
Hamzah U, Ismail M. A, Samsudin A. R (2009). Geoelectrical resistivity and Ground
Penetrating Radar techniques in the study of hydrocarbon- contaminated. Soil Sains
Malaysiana, 38 (3), 305-311.
Heiri, O., Lotter, A. F., and Lemcke, G. (2001). Loss on ignition as a method for estimating
organic and carbonate content in sediments: reproducibility and comparability of
results. Journal o f Paleolimnology 25, 101-110.
Hou, Z and Parker, J (2005). Texture Defect Detection Using Support Vector Machines with
Adaptive Gabor Wavelet Features. Proceedings o f the Seventh IEEE Workshop on
Applications o f Computer Vision (WACV/MOTION’05).
Huang, P., Patel, M., Santagata, M. C. and Bobet, A. (2009). Classification o f Organic Soils.
Publication FHWA/IN/JTRP-2008/02. Joint Transportation Research Program,
Indiana Department of Transportation and Purdue University, West Lafayette,
Indiana, 2009. doi: 10.5703/ 1288284314328.
Huat, B. K., Asadi, A & Kazemian, S. (2009). Experimental Investigation on
Geomechanical Properties of Tropical Organic Soils and Peat. American Journal. o f
Engineering and Applied Sciences 2 (1):184-188.
Huat, B. K., Kazemian, S., Prasad, A., and Barghchi, M. (2011). State of an art review of
peat: general perspective. International Journal o f the Physical Sciences. 6(8),
1988-1996.
IDS DAD Inc (2011). Ground Penetrating Radar Products. GeoRadar Division. Retrieved
February 24th, 2011 from: http://www.idscompany.it/page.php?f=117&id_div=4.
Inisheva, L. I. (2006). Peat Soil: Genesis and Classification. Euroasian Soil Science, 39(7),
699-704.
Jagatsetha, M. (1997). Geology and Mineral Distribution Map of Johore, Version 10, Kuala
Lumpur, Jabatan Penyiasatan K.
Jol H. M (2009). Ground Penetrating Radar Theory and Applications. Elsevier Science,
Amsterdam, the Neitherlands. Provide P. 208.

Jol, H. M., and Bristow, C. S. (2003). GPR in sediments: advice on data collection, basic
processing and interpretation, a good practice guide. In Bristow , C. S. and Jol, H. M.
(Eds) Ground Penetrating Radar Radar in Sediment. Geological Society, London,
Special publication 211. pp 9-27.
JPNJ (2011) Summary o f the State o f Johor Forest Management Plan for the Period
Between 2006-2015. Jabatan Perhutanan Negeri Johor (JPNJ).
http://www.johorforestry.gov.my/ Retrieved Sept. 2011.
Katimon, A. and Abd-Wahab, A. (2003). Hydrologichal characteristics of a drained tropical
peat catchment: runoff coefficients, water table and flow duration curves. Jurnal
Teknologi, 38(B), 39-54.
Kellner, E. and Waddington, J. M. (2005). Dynamics of biogenic gas bubbles in peat:
Potential effect on water storage and peat deformation. Water Resource Research.
41 (W08417), 1-12.
Kellner, E. and Lundin, L. (2001). Calibration of time domain reflectometry for water
content in peat. Nordic hydrology 32(4/5), 315-332.
Klavins, M., Sire, J., Purmalis, O and Melecis, V. (2008). Approaches to estimating
humification indicators for peat. Mires and Peat, Volume 3, Article 07.
Kudoh, J. and Hosoi, K. (2003). Two dimensional forest fire detection method by using
NOAA AVHRR images. IGARSS 2003. 2003 IEEE International Geoscience and
Remote Sensing Symposium. Proceedings, 4,2494-2495
Leong, E. C. and Chin, C. Y. (2000). Geotechnical characteristics of peaty soils in
Southeast Asia. Proceedings o f Geoengineering, 2000, Melbourne, Australia.
Loizos, A and Plati, C. (2007). Accuracy of pavement thickness using different ground
penetrating radar analysis approaches. NDT & EInternational. 40, 147-157
Lowry, C. S., Fratta, D. and Anderson, M. P. (2009). Ground Penetrating Radar and spring
formation in a groundwater dominated peat wetland. Journal o f Hydrology 373, 68
79.
Mamit, J. D. (2009). Peatland Utilization in Malaysia: the Present Status. IPS meeting. 13
15th February, 2009.
Nagare, R. M., Schincariol, R. A., Quinton, W. L., and Hayashi, M. (2011). Laboratory
calibration of time domain reflectometry to determine moisture content in
undisturbed peat sample. European Journal o f Soil Science. 62, 505-515.

Negri, S, Leucci, G and Mazzone, F (2008). High resolution 3D ERT to help GPR data
interpretation for researching archaeological items in geologically complex surface;
Journal o f Applied Geophysics, 65 (2008), 111-120.
Nuruddin, A. A. (1998). Forest Fire in Malaysia: an Overview. IFFN 18: 51-52. Faculty of
Forestry, Universiti Putra Malaysia.
Objective Corporate Research (2005) The Peat Industry Alternative Energy Out o f the Bog.
Introducing Peat Resources (PET.V) Objective Capital Limited, UK. Corporate:
www.ObjectiveCapital.com
Page, S. E., Morrison, R., Malins, C., Hooijer, A., Rieley, J. O. and Jauhianen, J. (2011).
Review of Peat Surface greenhouse gas Emissions from Oil palm Plantations in
Southeast Asia. White paper No. 15, September, Internaltional Council on Clean
transportation.
Page, S. E., Siegert, F., Rieley, J. O., Boehm, H., Jaya, A. and Limin, S., (2002). The amount
of carbon released from peat and forest fires in Indonesia during 1997. Nature: 420,
61-65.
Parsekian, A. and Slater, L. (2009). A comparison of 1 D vertical models of biogenic gas
content within a northern peatland from common midpoint and cross-borehole
GPR. IEEE. 978-1-4244-4605.
Parsekian, A.D., Slater, L. and Gimenez, D., (2012). Application of Ground Penetrating
Radar to measure near-saturation soil water content in Peat soils. Water Resources
Research, 48, W02533, d0i: 10.1029/2011WR011303.
Parsekian, A. and Slater, L.(2011). Near-saturation dielectric properties of peat soil with
entrapped free-phase gas determined using ground penetrating radar. SEG San
Antonio 2011 Annual Meeting. 3745-3749.
Parsekian, A. D., Comas, X., Slater, L, and Glaser, P. H., (2011). Geophysical evidence for
the lateral distribution of free phase gas at the peat basin scale in a large northern
peatland. Journal o f Geophysical Research, 116, doi: 10.1029/2010JG001543.
Parsekian, A. D., Slater, L., Comas, X., and Glaser, P. H. (2010). Variation in free-phase
gases in peat landforms determined by ground penetrating radar. Journal o f
Geophysical Research. 115 (G02002), 1-13.
Parsekian, A., Slater, L., Comas, X. (2009). A comparison of 1D vertical models of biogenic
gas content within a northern peatland from common mid-point and cross-borehole
GPR IEEE, 978-1-4244-46056.
Pauselli, C., Federico, C., Frigeri, A., Orosei, R., Barchi, M. and Basile, G. (2010). Ground
penetrating radar investigations to study active faults in the Narcia basin (central
Italy). Journal of Applied Geophysics. 72, 39-45.
Pelletier R E, Davis J L, Rossiter J R (1991). Peat analysis in the Hudson Bay Lowlands
using gound penetrating radar. IEEE, CH2971-0/91/0000-2141, 2141-2144.
Poole, G. C, Stanford, J. A, Frissell C A and Running, S. W (2002). Three-dimensional
mapping of geomorphic controls on flood-plain hydrology and connectivity from
aerial photos; Geomorphology 48, 329-347.
Pumpanen. J and Ilvesniemi, H. (2005). Calibration of time domain reflectometry for
forest humus layers. Boreal Environment Research, 10: 589- 595.
Ramli, A. T. (1997). Environmental terrestrial gamma radiation dose and its relationship
with soil type and underlying geological formations in Pontian district, Malaysia.
Applied Radiation and Isotope, 48(3), 407-412.
Rongqun, Z. and Daolin, Z. (2011). Study of land cover classification based on knowledge
rules using high-resolution remote sensing images. Expert Systems with Applications
38, 3647-3652.
Rowell A, Moore PF (2000). Global Review of Forest Fires. WWF and IUCN report. Gland,
Swizerland. P. 35.
Sandmeier K. J. (2009). Reflexw: the 2D processing and 2D/3D interpretation software for
GPR. Sandmeier software, ZipserStrabe 1-76227, Karlsruhe, Germany.
Sandmeier, K. J. (2010) Reflexw: Version 5.5. Windows 9X/NT/2000/XP-Program for
processing o f seismic, acoustic or electromagnetic reflection,refraction and
transmission data. Sandmeier software, ZipserStrabe 1-76227, Karlsruhe, Germany.
Sandmeier Scientific Software (2010) Reflexw. the complete 2D processing and 2D/3Drdinterpretation software. Retrieved on October, 3 , 2010 from: http://www.sandmeier-
geo.de/reflexw.html
Santos, T., Johansson, A. J. and Tufvesson, F. (2009). Dielectric Characterization of Soil
Samples by Microwave Measurements. Series o f Technical Reports, No. 10, Dept. of
Electrical and Information Technology Lund University September 23.
Sensors and software (2012). GPR Lunar Exploration, Where the Innovation begins. Sensors
and Software Inc. retrieved September 8, 2012 from:
http://www.sensoft.ca/NewsAndEvents/NewsItems/Lunar-GPR.aspx?print=true

Slater L., and Comas, X., 2009. The contribution of GPR to water resources research. In:
Jol,H. M (Ed). Chapter 7, Ground Penetrating Radar: Theory and Applications,
Elsevier, Amsterdam, the Netherlands, pp 203-246.
Soil Survey Staff, (1999). Soil Taxonomy, A Basic System o f Soil Classification for Making
and Interpreting Soil Surveys (2nd ed). US Department of Agriculture- Natural
Resources Conservation Service, Agriculture Handbook No. 436, US Government
Printing Office, Washington, District of Columbia.
Strack, M. and Mierau, T. (2010). Evaluating spatial variability of free-phase gas in peat
using ground-penetrating radar and direct measurement. Journal o f Geophysical
Research. 115, G02010, doi: 1029/2009JG001045.
Strack, M., and J. M. Waddington (2008), Spatiotemporal variability in peatland subsurface
methane dynamics, Journal o f Geophysical Research, 113, G02010,
doi:10.1029/2007JG000472.
Topp, G. C., Davis, J.L., Annan, A. P. 1980. Electromagnetic determination of soil water
content: measurements in coaxial transmission lines, Water Resources Research, 16
(3), 574-582.
Tsofias, G. C., Schillig, P., McGlashan, M., Robert, J. and Devlin, J. (2010). Field and
Laboratory GPR monitoring of Biological activities in saturated porous media.
Geophysical Research Abstract, 12, EGU2010-6415-1.
UNEP, GEF, Wetland International & Global Environment Centre (2005). Peat Matters,
volume 2; July, Petaling Jaya, Selango, Malaysia.
UNEP, GEF, Wetland International, and Global Environmental Centre (2006). Assessment
o f Peatland, Biodiversity and Climate Change. Key Interim Findings Related to
Climate Change. October, Petaling Jaya, Selango, Malaysia.
Van-Engelen V, Huting J (2002) Peatlands o f the World. An interpretation of the World Soil
Map. ISRIC, Wageningen,Unpublished . GPI Project 29 GPI 1
Wagner, N., Kupfer, K. and Trinks, E. (2007). A broadband dielectric spectroscopy study of
the relaxation behavior of subsoil. ISEMA 2007. Proceedings o f the 7th International
Conference on Electromagnetic Wave Interaction with Water and Moist Substances.
1-8.
Wetland International (2010). A Quick Scan o f Peatlands in Malaysia. Wetlands
International-Malaysia, petaling Jaya, Malaysia, 50 pp.
Wust, R. A., Bustin, R. M. and Lavkulich, L. M. (2003). New Classification Systems for
Tropical Organic-rich Deposits based on studies of the Tasek Bera Basin, Malaysia.
Catena. 53,133-163.
Wust, R. A., Ward, C. R., Bustin, R. M and Hawke, M. I. (2002). Characterization and
Quantification of inorganic constituents of tropical peats and organic-rich deposits
from Tasek Bera (Peninsular Malaysia): implications for coals. International Journal
o f Coal Geology 49, 215- 249.
Xuehui, M. and Jinming, H.,(2009). Classification of peat and peatland. In Jinsheng, Gao
(Ed). Coal, Oil Shale, Natural Bitumen, Heavy Oil and Peat.Volime II. Encyclopedia
o f Life Support System. Eolss Publishers Co. Ltd, Oxford, United Kingdom.
Young, H. D. (2012). Sears and Zemansky’s College Physics. (9th ed). Addison-Wesley,
Boston.
Zainorabidin, A. and Wijeyesekera, D. C. (2008). Geotechnical characteristics of peat.
Proceeding o f Advance Computing and Technology (AC and T), PP. 71-78.


