41
BENCHMARKING THE ACCOUNTING & FINANCE FUNCTION 2015

BENCHMARKING THE ACCOUNTING & FINANCE FUNCTION
2015

TABLE OFCONTENTS
Executive Summary
Research Methodology & Respondent Demographics
Workforce Management: Benchmarking staff size, personnel costs, typical hours worked and the use of temporary and project professionals
Accounting Operations: Accounting standards and financial statement preparation
Financial Systems: Primary systems, providers and planning tools
Sourcing: Outsourcing, shared service centers, functions and locations
Internal Controls & Compliance: Management of regulatory compliance and key controls
Summary: Putting the Data to Work
About the Authors
About Robert Half & Financial Executives Research Foundation
Acknowledgments
4
6
9
16
21
27
31
36
37
38
39

Thomas Thompson, Jr. Senior Associate, Research Financial Executives Research Foundation
Paul McDonald Senior Executive Director Robert Half
the source for financial solutions
1250 Headquarters Plaza West Tower, 7th Floor Morristown, NJ 07960 ferf.org
2884 Sand Hill Road Menlo Park, CA 94025 650-234-6000 roberthalf.com
BENCHMARKINGTHE ACCOUNTING & FINANCE FUNCTION 2015

4 Robert Half | Financial Executives Research Foundation Benchmarking the Accounting & Finance Function 2015
Benchmarking the accounting and finance function may be more important — and more difficult — than ever. Businesses have grown increasingly complex and global, while the pace of change has accelerated. The result? Many finance organizations struggle to simply keep pace.
When asked about the department’s challenges, one financial executive said, “Our experience is the same as that of most companies — trying to get all the work done with a limited set of resources.” Another executive talked about the ongoing struggle to identify and balance priorities and bring the greatest value to the business. Numerous executives mentioned the pressure their departments are under to ensure they provide timely, relevant and accurate information to the business. This pressure has intensified as finance is increasingly asked to provide more predictive, actionable information.
Amid these growing demands, it’s not easy for financial executives to make time for benchmarking their accounting and finance operations. Yet they must do so to keep their organizations moving forward. Benchmarking encourages reflection and comparison. The information can be used to gain
critical insight, validate practices, initiate change and point the way toward more efficient, effective and innovative practices.
By peering into what other finance departments are doing when it comes to practices such as closing the books, using technology, managing compliance and staffing their departments, financial executives can gain a valuable point of reference when making decisions.
Benchmarking the Accounting & Finance Function 2015, by Financial Executives Research Foundation (FERF) and Robert Half, is divided into sections representing key operational categories including workforce management, accounting operations, financial systems, sourcing, and internal controls and compliance.
ExecutiveSummary

5 Robert Half | Financial Executives Research Foundation Benchmarking the Accounting & Finance Function 2015
Report HighlightsSome of the key findings from the report:
• Accounting and finance management staff in the United States typically work 47 hours per week, while nonmanagement personnel work 42 hours. In Canada, management staff work 44 hours per week, on average, while nonmanagement personnel work 40 hours.
• The median cost for internal finance staff as a percentage of revenue held steady at companies with revenue under $499 million but grew at the largest companies.
• More than half of respondents surveyed said they still reconcile accounts manually — 54 percent of U.S. firms and 55 percent of Canadian companies. This is a decrease compared to 59 percent and 66 percent, respectively, last year.
• Approximately half (49 percent) of U.S. companies and 55 percent of Canadian companies report that they don’t use cloud-based solutions and do not plan to do so in the future.
• Payroll and tax, in almost equal measure, are the most commonly outsourced functions for both U.S. and Canadian companies.
• For the second year in a row, more companies overall report that compliance costs remained steady, rather than rising.
KEY FINDINGS
POINTS OF VIEW TAKEAWAYS
DISCUSSION AND ANALYSIS
QUESTIONS TO CONSIDER
How to Use This ReportBenchmarking the Accounting & Finance Function 2015 is divided into sections representing key functional categories: workforce management, accounting operations, financial systems, sourcing, and internal controls and compliance. Within each category are:
• Key Findings — An overview of trends identified in the survey and in follow-up interviews with executives
• Discussion and Analysis — Summaries of survey results, accompanied by charts and tables
• Points of View — Real examples taken from interviews with executives
• Takeaways — Insights from executives
• Questions to Consider — Actionable steps for finance leaders
AcknowledgmentsFERF and Robert Half would like to thank the nearly 1,400 finance leaders who participated in the online survey and the many executives who spoke with the authors in follow-up interviews. Their real-life experiences and comments gave us a deeper understanding and appreciation for the role of the accounting and finance departments at companies and organizations of all sizes and of the opportunities and challenges that lie ahead. While many of these executives are acknowledged within the report, others requested anonymity, yet offered valuable insights.
KEY FINDINGS
POINTS OF VIEW TAKEAWAYS
DISCUSSION AND ANALYSIS
QUESTIONS TO CONSIDER
KEY FINDINGS
POINTS OF VIEW TAKEAWAYS
DISCUSSION AND ANALYSIS
QUESTIONS TO CONSIDER
KEY FINDINGS
POINTS OF VIEW TAKEAWAYS
DISCUSSION AND ANALYSIS
QUESTIONS TO CONSIDER
KEY FINDINGS
POINTS OF VIEW TAKEAWAYS
DISCUSSION AND ANALYSIS
QUESTIONS TO CONSIDER
KEY FINDINGS
POINTS OF VIEW TAKEAWAYS
DISCUSSION AND ANALYSIS
QUESTIONS TO CONSIDER
KEY FINDINGS
POINTS OF VIEW TAKEAWAYS
DISCUSSION AND ANALYSIS
QUESTIONS TO CONSIDER
201
KEY FINDINGS
POINTS OF VIEW TAKEAWAYS
DISCUSSION AND ANALYSIS
QUESTIONS TO CONSIDER
201
KEY FINDINGS
POINTS OF VIEW TAKEAWAYS
DISCUSSION AND ANALYSIS
QUESTIONS TO CONSIDER
201
KEY FINDINGS
POINTS OF VIEW TAKEAWAYS
DISCUSSION AND ANALYSIS
QUESTIONS TO CONSIDER
201
KEY FINDINGS
POINTS OF VIEW TAKEAWAYS
DISCUSSION AND ANALYSIS
QUESTIONS TO CONSIDER
201
KEY FINDINGS
POINTS OF VIEW TAKEAWAYS
DISCUSSION AND ANALYSIS
QUESTIONS TO CONSIDER
201
The information in this report is based on our sixth annual survey of nearly 1,400 financial executives representing companies across the United States and Canada, spanning a full range of industries and sectors. The firms range in size from multibillion-dollar public companies to private organizations with revenue of less than US $25 million, from companies operating in a single state to businesses that reach every corner of the globe with their products. Respondents considered part of the “finance function” include professionals in general accounting, accounts payable (A/P), accounts receivable (A/R), budget and analysis, cost accounting, credit and collections, finance, financial reporting, international accounting, payroll, internal audit, tax and treasury.

6 Robert Half | Financial Executives Research Foundation Benchmarking the Accounting & Finance Function 2015
From September through December 2014, FERF and Robert Half conducted their sixth annual benchmarking survey of accounting and finance departments at nearly 1,400 public and private companies, mainly in the United States and Canada. The data contained within this report was compiled from U.S. and Canadian responses to a 40-question online survey. Seventy percent of respondents identified themselves as being at the senior management level or above, and most (71 percent) are located in the United States, while 26 percent are in Canada. More than half of respondents work at private companies (63 percent), while nearly a fifth (19 percent) work at public companies. More than three-quarters of respondents (80 percent) said their company’s annual revenue is less than $500 million.
Manufacturing is the most heavily represented industry (18 percent), followed by services (16 percent) and finance, insurance and real estate (14 percent). In addition, the survey also looked at the number of business divisions/units of respondent companies; whether they have centralized or decentralized finance functions; and where their finance and accounting operations are based. The charts and graphs that follow represent the demographic profile of respondents.
Throughout this report you will find tables referring to the top and bottom quartile, as well as the median. These quartiles and the median represent the three points that divide the total response rate for a given question into four groups. Each group represents a fourth of the sample group. Therefore, a response or value that is equal to or above the top quartile figure would be considered in the top or upper quartile.* Additionally, in our narrative, we compare this year’s data to results from previous years’ surveys to highlight key trends or developing issues.
Research Methodology & Respondent Demographics
Current Title
23%Corporate controller
10%Director title
11%Manager title (i.e. manager of finance, accounting, etc.)
14%Other
1%Managing director
27%Chief financial officer
1%General manager
1%Chief accounting officer
1%Management consultant
4%Assistant/divisional controller
4%Business owner,
principal or partner7%Vice president of finance
*Due to response rate variation (not every respondent answered every question) and rounding, totals may not equal 100 percent.

7 Robert Half | Financial Executives Research Foundation Benchmarking the Accounting & Finance Function 2015
Industry
Mining
Agriculture, forestry and fishing
Public administration
Retail trade
Transportation, communications, electric, gas and sanitary
Construction
Wholesale trade
Services
Finance, insurance and real estate
Manufacturing
0 5 10 15 20 25 30
26%
18%
16%
14%
7%
5%
5%
5%
2%
2%
1%
Annual Company Revenue
38%Less than $25 million
5%$5 billion and over
25%$25–99 million
8%$1–4.9 billion
17%$100–499 million
Other
7%$500–999 million

8 Robert Half | Financial Executives Research Foundation Benchmarking the Accounting & Finance Function 2015
Number of Divisions/ Business Units
Less than $25M
$25M– $99M
$100M– $499M
$500M– $999M
$1B– $4.9B
$5B and over
United States Canada
1 29% 12% 8% 3% 4% 0% 17% 14%
2–10 60% 65% 49% 41% 41% 30% 55% 54%
11–20 7% 14% 27% 30% 15% 15% 14% 16%
21–30 3% 4% 5% 7% 16% 7% 5% 6%
31–49 1% 2% 5% 10% 9% 10% 3% 5%
50 or more 0% 4% 6% 10% 15% 38% 6% 6%
Centralized/ Decentralized
Less than $25M
$25M– $99M
$100M– $499M
$500M– $999M
$1B– $4.9B
$5B and over
United States Canada
Centralized 90% 84% 65% 52% 41% 21% 78% 68%
Decentralized 3% 3% 6% 11% 11% 20% 5% 7%
Both (some functions centralized; some functions decentralized)
7% 13% 29% 37% 48% 59% 17% 25%
Domestic/ International
Less than $25M
$25M– $99M
$100M– $499M
$500M– $999M
$1B– $4.9B
$5B and over
United States Canada
Domestic only 86% 79% 67% 49% 39% 23% 75% 69%
Domestic and international 14% 21% 33% 51% 61% 77% 25% 31%
63%Private
19%Public
Company Type
4%Government
14%Nonprofit

9 Robert Half | Financial Executives Research Foundation Benchmarking the Accounting & Finance Function 2015
Key Findings• The percentage of financial staff devoted to A/P
and A/R rose slightly, to 27 percent.
• The median cost for internal financial staff as a percentage of revenue held steady at companies with revenue under $499 million but grew at the largest companies.
• U.S. managers work an average of 47 hours per week, and nonmanagement staff work 42 hours per week. In Canada, managers typically work 44 hours per week, while staff work 40 hours per week.
Discussion and AnalysisTo get a better picture of how companies allocate personnel resources, we asked respondents what percentage of their staff is assigned to various areas (see Fig. 1). General accounting, A/P, A/R, financial reporting, and budgets and analysis represent the highest allocation of staff resources, at 23 percent, 15 percent, 12 percent, 10 percent and 8 percent, respectively (see Fig. 1). The percentage of financial staff resources devoted to general accounting and A/R both rose slightly this year; this may be a reflection of improving economic conditions, as companies typically add staff in these key areas as business expands.
Workforce Management
KEY FINDINGS
POINTS OF VIEW TAKEAWAYS
DISCUSSION AND ANALYSIS
QUESTIONS TO CONSIDER
KEY FINDINGS
POINTS OF VIEW TAKEAWAYS
DISCUSSION AND ANALYSIS
QUESTIONS TO CONSIDER
KEY FINDINGS
POINTS OF VIEW TAKEAWAYS
DISCUSSION AND ANALYSIS
QUESTIONS TO CONSIDER
201
KEY FINDINGS
POINTS OF VIEW TAKEAWAYS
DISCUSSION AND ANALYSIS
QUESTIONS TO CONSIDER
201
KEY FINDINGS
POINTS OF VIEW TAKEAWAYS
DISCUSSION AND ANALYSIS
QUESTIONS TO CONSIDER
201
“ We have to be flexible in how
we define jobs and how we stage
them in terms of adding people.” — Brian Ruttencutter, CFO,
Cumming Corporation

10 Robert Half | Financial Executives Research Foundation Benchmarking the Accounting & Finance Function 2015
Not surprisingly, the median number of internal financial employees, up to and including the CFO, varies widely based on company size (see Fig. 2). The median number of staff at the smallest companies (less than $25 million) is three, compared to a median of 250 at the largest companies ($5 billion and over). But even among the largest companies, the number of internal staff varies considerably.
Figure 2: Number of Internal Accounting and Finance Function Staff by Company Size and Location
Less than $25M
$25M– $99M
$100M– $499M
$500M– $999M
$1B– $4.9B
$5B and over
United States Canada
Bottom quartile 2 5 10 18 50 52 3 4
Median 3 7 15 36 100 250 6 6
Top quartile 5 10 25 70 250 1,000 12 17
23%General accounting
1%International accounting
2%Tax
2%Treasury
3%Other
3%Internal audit
4%Cost accounting
4%Credit and collections
6%Finance
12%A/R
15%A/P
7%Payroll
8%Budgets and analysis
10%Financial reporting
Figure 1: Allocation of Accounting and Finance Staff

11 Robert Half | Financial Executives Research Foundation Benchmarking the Accounting & Finance Function 2015
The 2015 median cost — defined as base salary, bonus and benefits — of internal financial department staff in the United States is 2 percent of revenue (see Fig. 3); this finding is consistent with last year’s survey. In Canada, the median cost is also 2 percent of revenue, a gradual increase from 1.5 percent last year and 1 percent reported in the 2013 survey.
Although the median cost of internal financial staff as a percentage of revenue held steady this year at companies with revenue in the lower ranges of our study (less than $25 million, between $25 million and $99 million, and $100 million to $499 million), median costs grew at larger companies. The median cost of internal financial staff at companies with revenue between $500 million and $999 million rose the most — 2 percent this year compared to 1 percent in 2014. At companies with $1 billion to $4.9 billion in revenue, median costs rose to 1.4 percent from 0.90 percent. At the largest companies (those with revenue of $5 billion and over), median costs also increased, but only slightly — 1.10 percent, up from 1 percent last year (see Fig. 3). Based on interviews with financial executives, cost increases are likely a reflection of the heightened competition for skilled accounting and finance staff, which has further intensified with an improving economy. Companies are having to spend more to recruit and hire professionals. Higher compensation packages for staff with sought-after skills are common, and rising healthcare costs have also been a factor in some cases.
Just over one-quarter (26 percent) of U.S. companies report that they use temporary or project professionals. The percentage of Canadian companies using temporary professionals is 31 percent (see Fig. 4).
As in past studies, the findings show that larger companies — especially those with $500 million or more in annual revenue — tend to rely more heavily on the use of temporary professionals or independent project consultants. For example, more than two-thirds (67 percent) of the largest companies said they use temporary or project professionals to augment the work of full-time staff.
Also of note, 63 percent of U.S. firms and 52 percent of Canadian companies indicated that their use of temporary or project-based staff fluctuates based on the amount of work to be done (see Fig. 5). In fact, respondents also report a continuing and steady reliance on temporary or project professionals to augment staff during peak periods, fill in for absent employees and supply short-term expertise. In addition, many businesses report a preference for using temporary-to-hire arrangements to evaluate potential hires or to further assess whether the workload can sustain a full-time hire.
Figure 3: Cost of Internal Accounting and Finance Function Staff as a Percentage of Revenue by Company Size and Location
Less than $25M
$25M– $99M
$100M– $499M
$500M– $999M
$1B– $4.9B
$5B and over
United States Canada
Bottom quartile 2.00% 1.00% 0.55% 0.50% 0.50% 0.75% 0.90% 1.00%
Median 3.00% 1.50% 1.00% 2.00% 1.40% 1.10% 2.00% 2.00%
Top quartile 5.00% 2.60% 2.10% 3.00% 5.00% 3.00% 4.00% 5.00%
Figure 4: Use Temporary or Project Professionals by Company Size and Location
Less than $25M
$25M– $99M
$100M– $499M
$500M– $999M
$1B– $4.9B
$5B and over
United States Canada
Yes 20% 19% 39% 61% 53% 67% 26% 31%
No 80% 81% 61% 39% 48% 33% 74% 69%

12 Robert Half | Financial Executives Research Foundation Benchmarking the Accounting & Finance Function 2015
Figure 5: Change in Usage of Temporary and Project Professionals Based on Workload by Company Size and Location
Less than $25M
$25M– $99M
$100M– $499M
$500M– $999M
$1B– $4.9B
$5B and over
UnitedStates Canada
Changes 56% 46% 64% 75% 73% 77% 63% 52%
Does not change 44% 54% 36% 25% 27% 23% 37% 48%
The percentage of accounting and finance staff at U.S. companies who are temporary or project professionals remains steady (see Fig. 6); like last year, the median is 8 percent of the workforce. The percentage of temporary, contract or project professionals is highest at the smallest companies. In Canadian firms, the number of financial professionals who are temporary or contract workers rose slightly to 6 percent from 5 percent last year.
Figure 6: Percentage of Accounting and Finance Function Staff Who Are Temporary, Contract or Project Professionals by Company Size and Location
Less than $25M
$25M– $99M
$100M– $499M
$500M– $999M
$1B– $4.9B
$5B and over
United States Canada
Bottom quartile 5% 4% 5% 3% 2% 1% 3% 4%
Median 20% 9% 5% 5% 5% 2% 8% 6%
Top quartile 30% 32% 10% 10% 7% 15% 16% 15%
U.S. managers work an average of 47 hours per week (see Fig. 7), and nonmanagement staff work 42 hours per week; both figures are unchanged from last year. In Canada, trends also remain relatively steady: Managers work an average of 44 hours per week, down from 46 hours, while nonmanagement staff work 40 hours per week, the same as last year.
40424447
Management Nonmanagement
United States
Canada
Figure 7: Standard Weekly Hours Worked
0
10
20
30
40
50
NonManagementManagement

13 Robert Half | Financial Executives Research Foundation Benchmarking the Accounting & Finance Function 2015
Figure 8: Standard Hours Worked by Full-Time Employees Changes During Peak Times by Company Size and Location
Less than $25M
$25M– $99M
$100M– $499M
$500M– $999M
$1B– $4.9B
$5B and over
United States Canada
Yes, it increases 63% 77% 85% 88% 82% 100% 75% 69%
No, stays the same due to use of temporary professionals
37% 23% 15% 12% 18% 0% 25% 31%
Consistent with past editions of this study, the work hours of full-time employees in both the United States and Canada increase during peak periods — an expected response, perhaps, in deadline-oriented financial departments. However, this trend line declined markedly for the third year in a row. Overall, U.S. executives report that work hours for 75 percent of their full-time accounting and finance department staff increase during peak times, but this is down from 89 percent last year and 93 percent in 2013 (see Fig. 8). In Canada, 69 percent of employees’ hours increase in response to higher workloads — a significant drop from 93 percent in both of the past two years.
With an improving economy, companies may feel they now have more flexibility in their budgets to bring in supplemental staff when needed to address workload peaks. One-quarter (25 percent) of U.S. respondents cited this reason in explaining why their employees’ hours remain the same even when workloads spike (see Fig. 8). This percentage has more than doubled from 11 percent in 2014 and more than tripled from 7 percent in 2013. In Canada, this pattern is even more pronounced: Thirty-one percent of executives said they bring in temporary professionals to offset the need for core employees to work longer hours, up from 7 percent in both of the past two years.
Points of View: Flexibility Is Key to Meeting Staffing ChallengesAs the global economy has improved, companies seem increasingly receptive to using whatever staffing approach works for securing the talent they need, when they need it.
“We’re using more flexible approaches,” said Brian Ruttencutter, CFO of Cumming Corp., a construction management services firm in San Diego, California. “It’s such a dynamic environment that we may start with a part-time, temporary person. That segues into a full-time/part-time person, and that segues into a full-time position. So, we have to be flexible in how we define jobs and how we stage them in terms of adding people.”
At SecureKey Technologies Inc., headquartered in Toronto, temporary professionals serve as both a hedge against uncertain demand and a source of specialized skills. “We have four contract professionals who provide very specific skills to fill an expertise gap we have,” said Susan Fisher, vice president for finance and human resources. “If there is a long-term need for a skill, we will hire a new employee. If we’re not sure, or if a specific skill is needed, it’s easier to just bring someone on as a contractor.”
She added, “We have hired several people initially brought in on contract because we found they have many other valuable skills.”
KEY FINDINGS
POINTS OF VIEW TAKEAWAYS
DISCUSSION AND ANALYSIS
QUESTIONS TO CONSIDER

14 Robert Half | Financial Executives Research Foundation Benchmarking the Accounting & Finance Function 2015
An accounting manager working for a Canadian financial services firm said his company uses temporary professionals to meet a range of internal needs. The firm currently has a consultant leading an enterprise resource planning (ERP) system upgrade, as well as temporary accounting staff helping with transactional activities. And like many other companies, his business will bring in temporary professionals to fill in for employees taking leave after the birth of a child. Canada offers a yearlong leave that is available to either parent following childbirth; many Canadian companies use temporary professionals to backfill during these leave periods.
As the needs and goals of both businesses and workers continue to evolve, temporary assignments offer professionals with advanced skills an opportunity to assume challenging short-term roles. One CFO, for example, reported being brought in on an interim basis to steer a public company through either a sale of the business or a transition to a private entity.
In another instance, Clearwater Seafoods, a public company based in Nova Scotia, Canada, hired an accountant on a project basis to oversee the financial aspects of a conversion of a vessel for clam fishing, a project in Spain expected to cost approximately $60 million. “It’s a big enough project that we added an accountant to focus exclusively on the project,” said Tyrone Cotie, Clearwater’s treasurer.
Full-Time Hiring ConsiderationsAn improving economy and organic business growth are also leading to more full-time hiring for accounting and finance teams in the United States. “We’ve had to add a lot of people throughout the company, and that includes accounting and finance, so we’re doing more recruiting,” said Ruttencutter, adding, “We have to be quicker on our feet. We’re increasing our compensation packages because good people are snapped up quickly.”
Executives said factors such as company size or prominence, culture and work-life balance continue to be important considerations for professionals they are trying to recruit. Executives at smaller businesses acknowledged that their close relationships with staff members and family-like culture are often enough to retain key employees. Meanwhile, executives with large public companies said name recognition and varied work opportunities often make recruiting easier.
SecureKey has a small, close-knit finance department with fewer than five full-time employees. “We work together constantly,” said Fisher. “My staff would tell me if they thought they’re not being challenged enough or want a different opportunity. I can try to provide what they need or say, ‘Let me help you find something else outside the organization.’ I’m not naive enough to think I’m going to keep these employees forever, but I can help them transition out when the time comes.”

15 Robert Half | Financial Executives Research Foundation Benchmarking the Accounting & Finance Function 2015
Indeed, financial executives indicated that focusing on ongoing staff development is an important element in retaining top talent over the long term. A large multinational IT services company headquartered in Canada aims to hire externally for the junior ranks but tries to promote people internally for higher-level positions. New financial hires often rotate through different parts of the organization before being placed in a full-time role. The company is also willing to move professionals around to different positions, other areas of the business or even different countries.
Takeaways• Recruiting skilled professionals is becoming
more challenging.
• Expedited hiring, improved compensation packages and other incentives are being used to secure top talent.
• Businesses frequently use temporary staffing arrangements as a way to evaluate professionals for full-time positions and to gauge whether a workload is sustainable.
• Companies are using promotion opportunities, career development and succession plans to encourage retention.
Questions to Consider• Are there opportunities to improve workflow or
relieve pressure on your existing staff through the use of temporary professionals?
• Have you considered using temporary-to-hire arrangements as a way to recruit new employees?
• What recruiting challenges does your company have? What strengths can your company highlight during the recruitment process?
• What steps are you taking to retain top performers?
• Do you have the required subject matter expertise in-house for special projects or strategic initiatives?
KEY FINDINGS
POINTS OF VIEW TAKEAWAYS
DISCUSSION AND ANALYSIS
QUESTIONS TO CONSIDER
KEY FINDINGS
POINTS OF VIEW TAKEAWAYS
DISCUSSION AND ANALYSIS
QUESTIONS TO CONSIDER
KEY FINDINGS
POINTS OF VIEW TAKEAWAYS
DISCUSSION AND ANALYSIS
QUESTIONS TO CONSIDER
201
KEY FINDINGS
POINTS OF VIEW TAKEAWAYS
DISCUSSION AND ANALYSIS
QUESTIONS TO CONSIDER
201
KEY FINDINGS
POINTS OF VIEW TAKEAWAYS
DISCUSSION AND ANALYSIS
QUESTIONS TO CONSIDER
201
KEY FINDINGS
POINTS OF VIEW TAKEAWAYS
DISCUSSION AND ANALYSIS
QUESTIONS TO CONSIDER
201
KEY FINDINGS
POINTS OF VIEW TAKEAWAYS
DISCUSSION AND ANALYSIS
QUESTIONS TO CONSIDER
201
KEY FINDINGS
POINTS OF VIEW TAKEAWAYS
DISCUSSION AND ANALYSIS
QUESTIONS TO CONSIDER
201
KEY FINDINGS
POINTS OF VIEW TAKEAWAYS
DISCUSSION AND ANALYSIS
QUESTIONS TO CONSIDER
201
KEY FINDINGS
POINTS OF VIEW TAKEAWAYS
DISCUSSION AND ANALYSIS
QUESTIONS TO CONSIDER
201
KEY FINDINGS
POINTS OF VIEW TAKEAWAYS
DISCUSSION AND ANALYSIS
QUESTIONS TO CONSIDER
201
The median cost for internal finance staff as a percentage of revenue held steady at companies with revenue under $499 million but grew at the largest companies.
16 Robert Half | Financial Executives Research Foundation Benchmarking the Accounting & Finance Function 2015
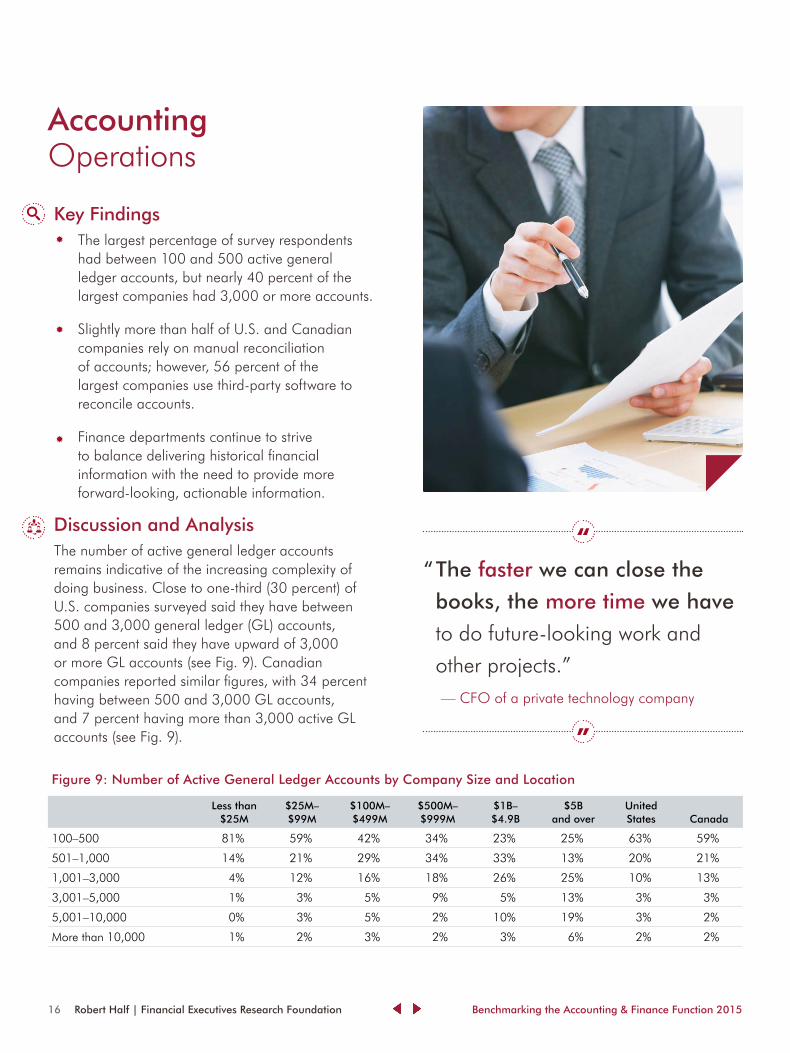
Key Findings• The largest percentage of survey respondents
had between 100 and 500 active general ledger accounts, but nearly 40 percent of the largest companies had 3,000 or more accounts.
• Slightly more than half of U.S. and Canadian companies rely on manual reconciliation of accounts; however, 56 percent of the largest companies use third-party software to reconcile accounts.
• Finance departments continue to strive to balance delivering historical financial information with the need to provide more forward-looking, actionable information.
Discussion and AnalysisThe number of active general ledger accounts remains indicative of the increasing complexity of doing business. Close to one-third (30 percent) of U.S. companies surveyed said they have between 500 and 3,000 general ledger (GL) accounts, and 8 percent said they have upward of 3,000 or more GL accounts (see Fig. 9). Canadian companies reported similar figures, with 34 percent having between 500 and 3,000 GL accounts, and 7 percent having more than 3,000 active GL accounts (see Fig. 9).
AccountingOperations
Figure 9: Number of Active General Ledger Accounts by Company Size and Location
Less than $25M
$25M– $99M
$100M– $499M
$500M– $999M
$1B– $4.9B
$5B and over
United States Canada
100–500 81% 59% 42% 34% 23% 25% 63% 59%
501–1,000 14% 21% 29% 34% 33% 13% 20% 21%
1,001–3,000 4% 12% 16% 18% 26% 25% 10% 13%
3,001–5,000 1% 3% 5% 9% 5% 13% 3% 3%
5,001–10,000 0% 3% 5% 2% 10% 19% 3% 2%
More than 10,000 1% 2% 3% 2% 3% 6% 2% 2%
KEY FINDINGS
POINTS OF VIEW TAKEAWAYS
DISCUSSION AND ANALYSIS
QUESTIONS TO CONSIDER
KEY FINDINGS
POINTS OF VIEW TAKEAWAYS
DISCUSSION AND ANALYSIS
QUESTIONS TO CONSIDER
KEY FINDINGS
POINTS OF VIEW TAKEAWAYS
DISCUSSION AND ANALYSIS
QUESTIONS TO CONSIDER
201
KEY FINDINGS
POINTS OF VIEW TAKEAWAYS
DISCUSSION AND ANALYSIS
QUESTIONS TO CONSIDER
201
KEY FINDINGS
POINTS OF VIEW TAKEAWAYS
DISCUSSION AND ANALYSIS
QUESTIONS TO CONSIDER
201
“ The faster we can close the
books, the more time we have
to do future-looking work and
other projects.” — CFO of a private technology company

17 Robert Half | Financial Executives Research Foundation Benchmarking the Accounting & Finance Function 2015
Among executives surveyed this year, 17 percent in the United States and 12 percent in Canada indicated they reconciled upward of 500 accounts at least quarterly (see Fig. 10). This number increased slightly for U.S. companies, up from 15 percent in 2014, but decreased for Canadian companies (from 19 percent).
Figure 10: General Ledger Accounts Reconciled at Least Quarterly by Company Size and Location
Less than $25M
$25M– $99M
$100M– $499M
$500M– $999M
$1B– $4.9B
$5B and over
United States Canada
100–500 1% 3% 6% 11% 18% 19% 83% 87%
501–1,000 93% 87% 75% 66% 54% 38% 10% 7%
1,001–3,000 0% 2% 1% 0% 3% 0% 4% 5%
3,001–5,000 0% 0% 1% 2% 5% 19% 1% 0%
5,001–10,000 5% 8% 17% 20% 21% 19% 1% 0%
More than 10,000 1% 0% 0% 0% 0% 6% 1% 0%
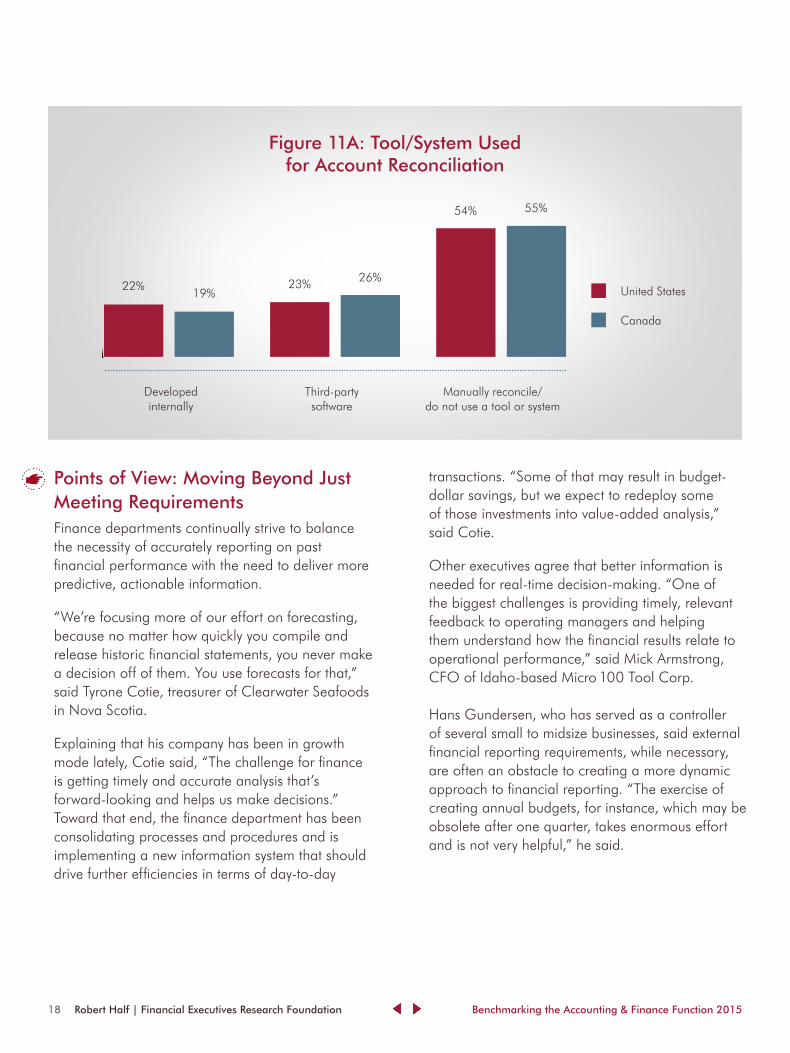
The high volume of reconciliations has an impact on accounting and finance departments because the process remains labor-intensive and is often manual. More than half (54 percent) of U.S. executives said their reconciliation process is manual (see Fig. 11), but that percentage has steadily declined over the past two years, from 59 percent last year and 65 percent in 2013. Among Canadian companies, 55 percent said they reconcile accounts manually, compared to 66 percent in 2014. Manual reconciliation of accounts places a burden on finance departments and takes away from their ability to engage in more value-added analysis.
Figure 11: Tool/System Used for Account Reconciliations by Company Size and Location
Less than $25M
$25M– $99M
$100M– $499M
$500M– $999M
$1B– $4.9B
$5B and over
United States Canada
Developed internally 22% 19% 19% 34% 23% 25% 22% 19%
Third-party software 29% 20% 16% 14% 31% 56% 23% 26%
Manually reconcile/do not use a tool or system
49% 61% 64% 52% 46% 19% 54% 55%
18 Robert Half | Financial Executives Research Foundation Benchmarking the Accounting & Finance Function 2015
Figure 11A: Tool/System Used for Account Reconciliation
55%54%
26%19%
22% 23%
Developed internally
Third-party software
Manually reconcile/ do not use a tool or system
United States
Canada
Points of View: Moving Beyond Just Meeting RequirementsFinance departments continually strive to balance the necessity of accurately reporting on past financial performance with the need to deliver more predictive, actionable information.
“We’re focusing more of our effort on forecasting, because no matter how quickly you compile and release historic financial statements, you never make a decision off of them. You use forecasts for that,” said Tyrone Cotie, treasurer of Clearwater Seafoods in Nova Scotia.
Explaining that his company has been in growth mode lately, Cotie said, “The challenge for finance is getting timely and accurate analysis that’s forward-looking and helps us make decisions.” Toward that end, the finance department has been consolidating processes and procedures and is implementing a new information system that should drive further efficiencies in terms of day-to-day
transactions. “Some of that may result in budget-dollar savings, but we expect to redeploy some of those investments into value-added analysis,” said Cotie.
Other executives agree that better information is needed for real-time decision-making. “One of the biggest challenges is providing timely, relevant feedback to operating managers and helping them understand how the financial results relate to operational performance,” said Mick Armstrong, CFO of Idaho-based Micro 100 Tool Corp. Hans Gundersen, who has served as a controller of several small to midsize businesses, said external financial reporting requirements, while necessary, are often an obstacle to creating a more dynamic approach to financial reporting. “The exercise of creating annual budgets, for instance, which may be obsolete after one quarter, takes enormous effort and is not very helpful,” he said.
KEY FINDINGS
POINTS OF VIEW TAKEAWAYS
DISCUSSION AND ANALYSIS
QUESTIONS TO CONSIDER
0
10
20
30
40
50
60
do not use toolthird party softwaredeveloped internally
19 Robert Half | Financial Executives Research Foundation Benchmarking the Accounting & Finance Function 2015
Gundersen added, “A small but growing number of companies are moving toward a continuous or quarterly planning model where incremental planning and adjustments keep the data better aligned with a changing environment.”
Improving Efficiency and Expediting ProcessesFinance departments are always striving to improve underlying processes through additional automation, better workflow, process simplification and other tactics. “We started to hold people accountable by setting timelines, which forced them to think a bit more about when they do reconciliations,” Cotie said. “Do you do all your reconciliations at period end, or do you do some throughout the period? They need an adequate checklist so they can go through the month and do a good job, but not be starting from zero every month.”
When it comes to benchmarking certain processes, such as the financial close, executives emphasized that there are many variables that add complexity and can affect the speed of the close.
“It’s all over the place — a pretty big spread,” Gundersen said, noting that he has seen companies of major size and complexity finalize their financials in approximately five business days, while some take considerably longer.
In addition to company size and complexity, factors that can influence metrics in this area include financial system sophistication, degree of automation and even external reporting requirements. Businesses without external reporting requirements may not be as focused on expediting the process.
Executives interviewed for this year’s report agreed that the most compelling reason to speed the closing process is to free up financial staff to focus on more value-added work. One CFO of a private technology company said her team takes about 10 working days to finalize the actual financial
statements, then about five more days to prepare notes and formal statements. “We look to speed up the month- and year-end closes each year,” she said, adding, “The faster we can close the books, the more time we have to do future-looking work and other projects.”
Despite significant efficiency gains through process improvements and increased automation, several executives said there would always be a need for human involvement. One CFO said: “We’re always looking at improving our systems and using tools to the best capability, but I don’t think you’ll ever get to 100 percent automated reconciliation. There are a number of accounts where there’s a level of subjectivity, which requires human intervention and review.”

20 Robert Half | Financial Executives Research Foundation Benchmarking the Accounting & Finance Function 2015
Takeaways• The ability to speed the closing process is key to
the finance department’s capacity for delivering more forward-looking financial information and freeing up staff for more value-added work.
• Automation of the account reconciliation process is a worthy goal, but executives said there would likely continue to be some accounts that require a manual approach.
• Although finance departments regularly evaluate the speed of the closing process, financial executives also acknowledge that there are many variables that can affect the speed of the close, making direct comparisons difficult.
Questions to Consider• Is the number of your company’s general ledger
accounts increasing or decreasing? Why? Are there opportunities to further reduce the number of general ledger accounts?
• Are there aspects of your company’s reconciliation process that can be further improved through automation, better workflow, process improvement or even better accountability among staff?
• What percentage of your accounts do you think you can automate? Have you reached your optimal level of automation?
• Conversely, what percentage of your accounts require manual reconciliation?
KEY FINDINGS
POINTS OF VIEW TAKEAWAYS
DISCUSSION AND ANALYSIS
QUESTIONS TO CONSIDER
KEY FINDINGS
POINTS OF VIEW TAKEAWAYS
DISCUSSION AND ANALYSIS
QUESTIONS TO CONSIDER
201
KEY FINDINGS
POINTS OF VIEW TAKEAWAYS
DISCUSSION AND ANALYSIS
QUESTIONS TO CONSIDER
201
KEY FINDINGS
POINTS OF VIEW TAKEAWAYS
DISCUSSION AND ANALYSIS
QUESTIONS TO CONSIDER
201
KEY FINDINGS
POINTS OF VIEW TAKEAWAYS
DISCUSSION AND ANALYSIS
QUESTIONS TO CONSIDER
KEY FINDINGS
POINTS OF VIEW TAKEAWAYS
DISCUSSION AND ANALYSIS
QUESTIONS TO CONSIDER
201
KEY FINDINGS
POINTS OF VIEW TAKEAWAYS
DISCUSSION AND ANALYSIS
QUESTIONS TO CONSIDER
201
KEY FINDINGS
POINTS OF VIEW TAKEAWAYS
DISCUSSION AND ANALYSIS
QUESTIONS TO CONSIDER
201
KEY FINDINGS
POINTS OF VIEW TAKEAWAYS
DISCUSSION AND ANALYSIS
QUESTIONS TO CONSIDER
201
Finance departments continue to strive to balance delivering historical financial information with the need to provide more forward-looking, actionable information.
21 Robert Half | Financial Executives Research Foundation Benchmarking the Accounting & Finance Function 2015
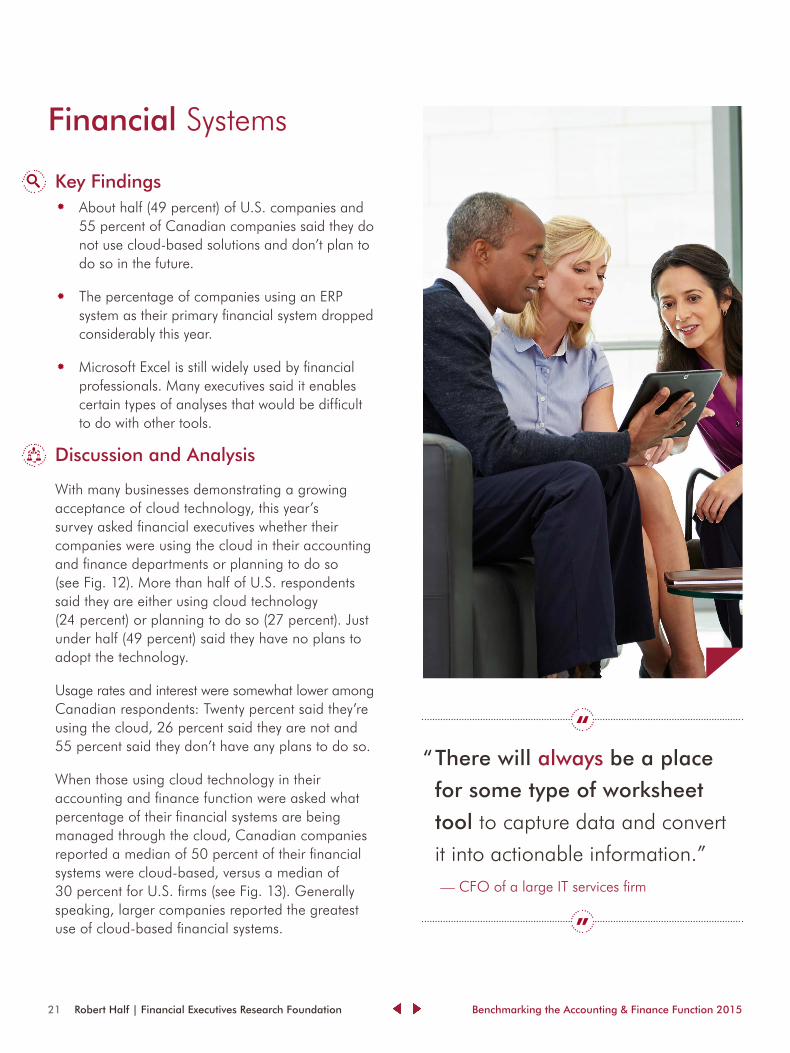
Key Findings • About half (49 percent) of U.S. companies and
55 percent of Canadian companies said they do not use cloud-based solutions and don’t plan to do so in the future.
• The percentage of companies using an ERP system as their primary financial system dropped considerably this year.
• Microsoft Excel is still widely used by financial professionals. Many executives said it enables certain types of analyses that would be difficult to do with other tools.
Discussion and Analysis
With many businesses demonstrating a growing acceptance of cloud technology, this year’s survey asked financial executives whether their companies were using the cloud in their accounting and finance departments or planning to do so (see Fig. 12). More than half of U.S. respondents said they are either using cloud technology (24 percent) or planning to do so (27 percent). Just under half (49 percent) said they have no plans to adopt the technology.
Usage rates and interest were somewhat lower among Canadian respondents: Twenty percent said they’re using the cloud, 26 percent said they are not and 55 percent said they don’t have any plans to do so.
When those using cloud technology in their accounting and finance function were asked what percentage of their financial systems are being managed through the cloud, Canadian companies reported a median of 50 percent of their financial systems were cloud-based, versus a median of 30 percent for U.S. firms (see Fig. 13). Generally speaking, larger companies reported the greatest use of cloud-based financial systems.
Financial SystemsKEY FINDINGS
POINTS OF VIEW TAKEAWAYS
DISCUSSION AND ANALYSIS
QUESTIONS TO CONSIDER
KEY FINDINGS
POINTS OF VIEW TAKEAWAYS
DISCUSSION AND ANALYSIS
QUESTIONS TO CONSIDER
KEY FINDINGS
POINTS OF VIEW TAKEAWAYS
DISCUSSION AND ANALYSIS
QUESTIONS TO CONSIDER
201
KEY FINDINGS
POINTS OF VIEW TAKEAWAYS
DISCUSSION AND ANALYSIS
QUESTIONS TO CONSIDER
201
KEY FINDINGS
POINTS OF VIEW TAKEAWAYS
DISCUSSION AND ANALYSIS
QUESTIONS TO CONSIDER
201
“ There will always be a place
for some type of worksheet
tool to capture data and convert
it into actionable information.” — CFO of a large IT services firm

22 Robert Half | Financial Executives Research Foundation Benchmarking the Accounting & Finance Function 2015
Figure 13: Percentage of Financial Systems That Are Cloud-Based Solutions by Company Size and Location
Less than $25M
$25M– $99M
$100M– $499M
$500M– $999M
$1B– $4.9B
$5B and over
United States Canada
Bottom quartile 10% 10% 10% 15% 5% 5% 10% 10%
Median 50% 25% 50% 40% 10% 35% 30% 50%
Top quartile 80% 90% 80% 100% 20% 50% 75% 100%
Figure 12: Use of Cloud-Based Solutions by Company Size and Location
Less than $25M
$25M– $99M
$100M– $499M
$500M– $999M
$1B– $4.9B
$5B and over
United States Canada
Use cloud-based solutions 20% 25% 27% 25% 26% 31% 24% 20%
Do not currently use cloud-based solutions but plan to in the future
26% 27% 27% 23% 24% 25% 27% 26%
Do not currently use cloud-based solutions and do not plan to in the future
54% 48% 47% 52% 50% 44% 49% 55%
The percentage of overall respondents who use an ERP system as their primary financial system declined this year, a possible response to the growing use of cloud technology. U.S. companies included in the survey who use an on-premise ERP system as their primary financial system dropped to 53 percent in this year’s survey, compared to 78 percent last year.
The use of on-premise ERP systems among Canadian firms surveyed also dropped considerably, from 90 percent last year to 58 percent in this year’s study. Use of Software as a Service (SaaS) remained more consistent, especially among smaller companies in both the United States and Canada. Eleven percent of companies with revenue less than $25 million reported using a SaaS financial system (see Fig. 14), the same as last year.
Figure 14: Primary Financial System Used by Company Size and Location
Less than $25M
$25M– $99M
$100M– $499M
$500M– $999M
$1B– $4.9B
$5B and over
United States Canada
On-premise ERP 39% 59% 71% 68% 79% 75% 53% 58%
Cloud ERP 4% 3% 7% 11% 5% 13% 5% 4%
SaaS (hosted applications other than ERP)
11% 10% 6% 2% 5% 0% 9% 7%
In-house 15% 12% 8% 7% 8% 6% 13% 11%
Other 31% 15% 8% 11% 3% 6% 20% 20%

23 Robert Half | Financial Executives Research Foundation Benchmarking the Accounting & Finance Function 2015
Among the largest companies, SAP and Oracle/PeopleSoft dominate as the most popular ERP systems. Oracle/PeopleSoft was cited most frequently among businesses with revenue of $1 billion to $4.9 billion, while SAP was the favorite among companies with revenue of $5 billion and over. Among smaller firms, specifically those at $99 million and below, Microsoft Dynamics GP was their leading choice (see Fig. 15). However, the market is not uniform: More than half of companies surveyed for this year’s report said that they are using “other” types of ERP systems (see Fig. 15). Some of the software providers cited included Deltek, Epicor, Infor, Quickbooks, Sage and other Microsoft Dynamics products.
Figure 14A: Primary Financial System Used
58%
5% 4%9% 7%
13% 11%
20% 20%
53%
On-premise ERP Cloud ERP SaaS (hosted application other than ERP)
In-house Other
United States
Canada
Figure 15: Leading Brand of On-Premise ERP or Cloud ERP System Used by Company Size and Location
Less than $25M
$25M– $99M
$100M– $499M
$500M– $999M
$1B– $4.9B
$5B and over
United States Canada
SAP 5% 5% 17% 22% 20% 38% 10% 14%
Oracle/ PeopleSoft 2% 5% 14% 16% 34% 24% 9% 10%
Microsoft Dynamics GP 20% 26% 18% 16% 6% 14% 19% 21%
JD Edwards 0% 1% 1% 9% 11% 10% 2% 2%
Legacy 1% 3% 4% 0% 3% 5% 2% 2%
Other 72% 60% 47% 38% 26% 10% 58% 50%
And while SaaS solutions remain a distinct minority, the leading brands were ADP and Microsoft (see Fig. 16) in both the United States and Canada — though again, “other” systems were heavily used. Quickbooks and Sage were once again among the more popular choices.
0
10
20
30
40
50
60
OtherHouseSaaSCERPERP

24 Robert Half | Financial Executives Research Foundation Benchmarking the Accounting & Finance Function 2015
When it comes to budgeting and long-range planning tools, Microsoft Excel continues to dominate: Sixty-three percent of U.S. companies and 69 percent of Canadian firms rely on Excel for budgeting and planning (see Fig. 17). In addition, 63 percent of executives surveyed in both countries use Excel for long-term planning (see Fig. 18). While Excel is frequently used by accounting and finance professionals at businesses of all sizes, the survey responses indicate it is especially popular with smaller companies (less than $25 million). Three-quarters (75 percent) of those businesses said they use Excel for budgeting and planning, and 66 percent said they use it for long-term planning.
Figure 16: Leading Brand of SaaS System Used by Company Size and Location
Less than $25M
$25M– $99M
$100M– $499M
$500M– $999M
$1B– $4.9B
$5B and over
United States Canada
ADP 28% 23% 22% 100% 40% 50% 29% 20%
Intacct 6% 13% 6% 0% 0% 0% 7% 5%
Microsoft 13% 20% 22% 0% 20% 17% 17% 20%
NetSuite 7% 7% 17% 0% 0% 0% 5% 15%
WebEx 0% 3% 0% 0% 0% 17% 1% 0%
Other 46% 33% 33% 0% 40% 17% 41% 40%
Figure 18: Leading Types of Long-Term Planning Tools Used by Company Size and Location
Less than $25M
$25M– $99M
$100M– $499M
$500M– $999M
$1B– $4.9B
$5B and over
United States Canada
ERP 7% 12% 10% 9% 12% 5% 9% 10%
Legacy 1% 1% 1% 0% 0% 0% 1% 1%
IBM/Cognos 1% 1% 3% 0% 4% 0% 1% 2%
Oracle/Hyperion 1% 3% 4% 6% 14% 29% 3% 3%
SAP/BPC 1% 1% 3% 6% 2% 19% 2% 3%
Excel 66% 65% 61% 57% 56% 38% 63% 63%
Other 7% 7% 11% 13% 8% 5% 7% 10%
None 17% 11% 7% 9% 4% 5% 14% 9%
Figure 17: Leading Types of Budgeting and Planning Tools Used by Company Size and Location
Less than $25M
$25M– $99M
$100M– $499M
$500M– $999M
$1B– $4.9B
$5B and over
United States Canada
ERP 8% 13% 13% 13% 14% 16% 11% 11%
Legacy 1% 1% 1% 3% 0% 0% 1% 2%
IBM/Cognos 1% 2% 4% 3% 4% 0% 2% 2%
Oracle/Hyperion 1% 2% 7% 8% 16% 32% 4% 3%
SAP/BPC 0% 0% 3% 7% 4% 20% 1% 3%
Excel 75% 64% 56% 48% 53% 32% 63% 69%
Other 10% 16% 14% 18% 8% 0% 14% 9%
None 5% 2% 3% 0% 2% 0% 4% 2%
25 Robert Half | Financial Executives Research Foundation Benchmarking the Accounting & Finance Function 2015
Points of View: Caution About Cloud, Enthusiasm for ExcelAlthough cloud-based solutions are being used more widely for many aspects of business, a number of financial executives interviewed for this year’s report said they aren’t ready to transition fully to cloud solutions, citing concerns about security, service availability and cost. One financial executive said, “I’m not 100 percent comfortable with having my company’s information up in the cloud just yet.”
Noting concerns about recent high-profile data breaches, another executive in the financial services industry said, “If anything were to hold us back from moving more toward cloud technology, privacy and security would probably be at the top of the list — particularly concerns about customer information and reputational risk.”
That’s not to say that executives don’t acknowledge many of the benefits of cloud technology, such as scalability and potential cost savings. Some said their companies have migrated certain types of business information or functions to the cloud, although there are lingering concerns about moving core financial data to the cloud. Some are slowly embracing cloud technology by using an internal or on-premise model, or a “hybrid” model that may include some storage or other services provided by an external third party.
Executives at companies still evaluating the extent of their cloud usage said they might initially move less-sensitive finance activities to the cloud while they continue to weigh costs, benefits and their comfort level with the technology.
Meanwhile, one technology that financial executives at companies of all sizes continue to embrace is Excel, which garners wide praise for its flexibility, functionality, low cost and ease of use. “For anything that is innovative or creative or requires that you bring some gray matter to the table, the spreadsheet cannot be beaten,” said one CFO from an international technology firm. “There will always be a place for some type of worksheet tool to capture data and convert it into actionable information.”
Although Excel remains a perennial favorite of financial professionals, especially for ad hoc analysis, one executive whose department has replaced some Excel tasks with Microsoft SharePoint said the latter solution has proven useful as a complement to Excel for doing certain types of recurring and consistent reporting, such as month-end sales analysis.
KEY FINDINGS
POINTS OF VIEW TAKEAWAYS
DISCUSSION AND ANALYSIS
QUESTIONS TO CONSIDER

26 Robert Half | Financial Executives Research Foundation Benchmarking the Accounting & Finance Function 2015
Takeaways• Many companies continue to take a cautious
attitude toward adopting cloud-based solutions, especially when it comes to moving sensitive financial data or customer information to the cloud.
• Excel remains perhaps the most popular tool for budgeting, planning and analysis among finance departments. Financial executives report that they appreciate its flexibility and ease of use.
Questions to Consider• How would you characterize your company’s
stance on cloud-based technology? Is finance already using or looking to expand use of the cloud? Why or why not?
• What reservations, if any, do you have regarding cloud technology? What do you see as its advantages?
• To the extent your company uses cloud technology, what steps have you taken to protect the integrity of your cloud-based data?
• How is Excel used in your firm? Does it continue to meet your needs?
• Considering how widely spreadsheets are used to support operational and financial reporting processes, has your finance function taken steps to mitigate risks related to lack of controls around your financial reporting spreadsheets?
KEY FINDINGS
POINTS OF VIEW TAKEAWAYS
DISCUSSION AND ANALYSIS
QUESTIONS TO CONSIDER
KEY FINDINGS
POINTS OF VIEW TAKEAWAYS
DISCUSSION AND ANALYSIS
QUESTIONS TO CONSIDER
201
KEY FINDINGS
POINTS OF VIEW TAKEAWAYS
DISCUSSION AND ANALYSIS
QUESTIONS TO CONSIDER
201
KEY FINDINGS
POINTS OF VIEW TAKEAWAYS
DISCUSSION AND ANALYSIS
QUESTIONS TO CONSIDER
KEY FINDINGS
POINTS OF VIEW TAKEAWAYS
DISCUSSION AND ANALYSIS
QUESTIONS TO CONSIDER
201
KEY FINDINGS
POINTS OF VIEW TAKEAWAYS
DISCUSSION AND ANALYSIS
QUESTIONS TO CONSIDER
201
KEY FINDINGS
POINTS OF VIEW TAKEAWAYS
DISCUSSION AND ANALYSIS
QUESTIONS TO CONSIDER
201
KEY FINDINGS
POINTS OF VIEW TAKEAWAYS
DISCUSSION AND ANALYSIS
QUESTIONS TO CONSIDER
201
KEY FINDINGS
POINTS OF VIEW TAKEAWAYS
DISCUSSION AND ANALYSIS
QUESTIONS TO CONSIDER
201
Many companies continue to take a cautious attitude toward adopting cloud-based solutions, especially when it comes to moving sensitive financial data or customer information to the cloud.

27 Robert Half | Financial Executives Research Foundation Benchmarking the Accounting & Finance Function 2015
“ As a small company, you can’t
hire the tactical resources
internally to handle everything.
It’s just easier to maintain an
outsourced solution than to bring
it in-house.” — Susan Fisher, vice president, finance and
human resources, SecureKey Technologies
Key Findings• Payroll and tax are the most commonly
outsourced functions among U.S. and Canadian companies.
• Companies of all sizes see benefits to outsourcing payroll. For smaller companies, lack of internal staff or expertise is often the driver. For larger companies, the presence of workers in multiple countries is often a key factor in the decision to outsource payroll.
• Other areas cited that may be outsourced to a lesser degree include various types of payment processing and compliance activities. Survey results indicate the largest companies are the most likely to outsource the accounts payable function.
Discussion and AnalysisOnce again this year, payroll and tax are the two leading outsourced functions for U.S. companies, garnering 43 percent and 42 percent of total responses, respectively (see Fig. 19). This pattern is slightly reversed among Canadian companies, with more outsourcing tax (45 percent) than payroll (39 percent). Although payroll is a popular function to outsource among businesses of all sizes, half of companies with revenue of $1 billion or more outsource payroll (see Fig. 19).
The tax function is another common area for outsourcing by U.S. and Canadian companies. However, the larger the organization, the less likely it is to outsource tax, generally speaking (see Fig. 19). This suggests the largest companies, in terms of revenue, are more likely to have internal resources available to perform this function. The largest companies ($5 billion and over) are also more likely to outsource the A/P function (see Fig. 19).
Sourcing KEY FINDINGS
POINTS OF VIEW TAKEAWAYS
DISCUSSION AND ANALYSIS
QUESTIONS TO CONSIDER
KEY FINDINGS
POINTS OF VIEW TAKEAWAYS
DISCUSSION AND ANALYSIS
QUESTIONS TO CONSIDER
KEY FINDINGS
POINTS OF VIEW TAKEAWAYS
DISCUSSION AND ANALYSIS
QUESTIONS TO CONSIDER
201
KEY FINDINGS
POINTS OF VIEW TAKEAWAYS
DISCUSSION AND ANALYSIS
QUESTIONS TO CONSIDER
201
KEY FINDINGS
POINTS OF VIEW TAKEAWAYS
DISCUSSION AND ANALYSIS
QUESTIONS TO CONSIDER
201

28 Robert Half | Financial Executives Research Foundation Benchmarking the Accounting & Finance Function 2015
Figure 19: Outsourced Functions by Company Size and Location
Less than $25M
$25M– $99M
$100M– $499M
$500M– $999M
$1B– $4.9B
$5B and over
United States Canada
A/P 2% 4% 3% 4% 4% 20% 3% 3%
A/R 1% 2% 1% 4% 4% 0% 1% 1%
General accounting 3% 1% 1% 4% 0% 10% 2% 2%
Payroll 46% 39% 37% 33% 50% 50% 43% 39%
Internal audit 0% 2% 3% 4% 4% 10% 1% 4%
Tax 40% 46% 47% 44% 25% 10% 42% 45%
Treasury 2% 2% 1% 0% 0% 0% 2% 1%
Other 5% 5% 7% 7% 13% 0% 6% 6%
The majority (82 percent) of U.S. companies surveyed that use a shared services center report that the center is located in the United States (see Fig. 20). This percentage decreased from 90 percent in last year’s survey. Seventy-nine percent of Canadian companies with shared services centers maintain them in their home country, down from 86 percent last year, with another 9 percent located in the United States, down slightly from 10 percent last year (see Fig. 20).
This year’s survey also showed an increase in the use of shared services centers in Europe, the Middle East and Africa (the EMEA region). Seven percent of Canadian firms and 6 percent of U.S. firms said they have centers in EMEA this year, compared to 0 percent last year for Canadian respondents and 2 percent last year for U.S. respondents.
Figure 20: Locations of Internal Shared Services Centers by Company Size and Location
Less than $25M
$25M– $99M
$100M– $499M
$500M– $999M
$1B– $4.9B
$5B and over
United States Canada
United States 63% 71% 59% 31% 54% 45% 82% 9%
Canada 29% 20% 28% 40% 14% 10% 2% 79%
South America 1% 0% 1% 3% 3% 0% 1% 1%
Europe, Middle East, Africa 5% 6% 7% 9% 14% 21% 6% 7%
Asia-Pacific 0% 1% 6% 6% 3% 10% 3% 1%
India 1% 3% 0% 3% 8% 10% 2% 3%
Mexico 2% 0% 0% 9% 5% 3% 2% 1%
29 Robert Half | Financial Executives Research Foundation Benchmarking the Accounting & Finance Function 2015
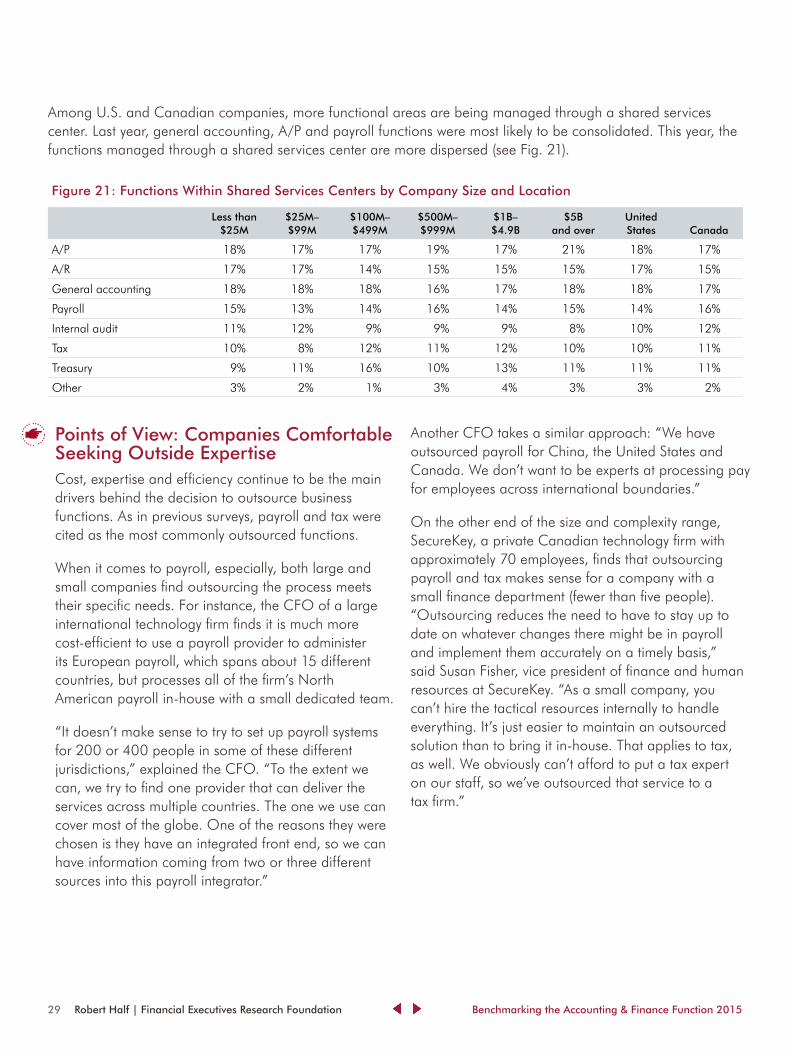
Figure 21: Functions Within Shared Services Centers by Company Size and Location
Less than $25M
$25M– $99M
$100M– $499M
$500M– $999M
$1B– $4.9B
$5B and over
United States Canada
A/P 18% 17% 17% 19% 17% 21% 18% 17%
A/R 17% 17% 14% 15% 15% 15% 17% 15%
General accounting 18% 18% 18% 16% 17% 18% 18% 17%
Payroll 15% 13% 14% 16% 14% 15% 14% 16%
Internal audit 11% 12% 9% 9% 9% 8% 10% 12%
Tax 10% 8% 12% 11% 12% 10% 10% 11%
Treasury 9% 11% 16% 10% 13% 11% 11% 11%
Other 3% 2% 1% 3% 4% 3% 3% 2%
Points of View: Companies Comfortable Seeking Outside ExpertiseCost, expertise and efficiency continue to be the main drivers behind the decision to outsource business functions. As in previous surveys, payroll and tax were cited as the most commonly outsourced functions.
When it comes to payroll, especially, both large and small companies find outsourcing the process meets their specific needs. For instance, the CFO of a large international technology firm finds it is much more cost-efficient to use a payroll provider to administer its European payroll, which spans about 15 different countries, but processes all of the firm’s North American payroll in-house with a small dedicated team.
“It doesn’t make sense to try to set up payroll systems for 200 or 400 people in some of these different jurisdictions,” explained the CFO. “To the extent we can, we try to find one provider that can deliver the services across multiple countries. The one we use can cover most of the globe. One of the reasons they were chosen is they have an integrated front end, so we can have information coming from two or three different sources into this payroll integrator.”
Another CFO takes a similar approach: “We have outsourced payroll for China, the United States and Canada. We don’t want to be experts at processing pay for employees across international boundaries.”
On the other end of the size and complexity range, SecureKey, a private Canadian technology firm with approximately 70 employees, finds that outsourcing payroll and tax makes sense for a company with a small finance department (fewer than five people). “Outsourcing reduces the need to have to stay up to date on whatever changes there might be in payroll and implement them accurately on a timely basis,” said Susan Fisher, vice president of finance and human resources at SecureKey. “As a small company, you can’t hire the tactical resources internally to handle everything. It’s just easier to maintain an outsourced solution than to bring it in-house. That applies to tax, as well. We obviously can’t afford to put a tax expert on our staff, so we’ve outsourced that service to a tax firm.”
KEY FINDINGS
POINTS OF VIEW TAKEAWAYS
DISCUSSION AND ANALYSIS
QUESTIONS TO CONSIDER
Among U.S. and Canadian companies, more functional areas are being managed through a shared services center. Last year, general accounting, A/P and payroll functions were most likely to be consolidated. This year, the functions managed through a shared services center are more dispersed (see Fig. 21).
30 Robert Half | Financial Executives Research Foundation Benchmarking the Accounting & Finance Function 2015
Some companies choose to outsource or co-source compliance activities to some degree. One CFO of a midsize medical technology firm ($100 million to $499 million) in the United States said his company uses an outside firm to supplement its two-person Sarbanes-Oxley Act (SOX) compliance team with additional internal control expertise. Similarly, in Canada, some companies outsource certification requirements for Bill 198, which are comparable to U.S. SOX requirements.
Takeaways• Business functions that require staying abreast
of highly specialized knowledge and frequently changing regulations, such as payroll and taxes, are the most likely to be outsourced.
• Activities that involve repetitive processes with frequent cycles, such as recurring payments that may be specific to an industry, may also be good candidates for outsourcing.
• Compliance activity related to internal controls is another area that more businesses are considering for partial outsourcing or co-sourcing.
• Generally speaking, businesses indicated they’re comfortable and satisfied with the service quality they receive from their outsourcing providers.
Questions to Consider• Are there other financial-related activities that
might be good candidates for outsourcing?
• Are there any outsourced activities you might consider bringing back in-house? If so, why?
• Have you recently evaluated your outsourcing providers to ensure all expectations are being met?
KEY FINDINGS
POINTS OF VIEW TAKEAWAYS
DISCUSSION AND ANALYSIS
QUESTIONS TO CONSIDER
KEY FINDINGS
POINTS OF VIEW TAKEAWAYS
DISCUSSION AND ANALYSIS
QUESTIONS TO CONSIDER
201
KEY FINDINGS
POINTS OF VIEW TAKEAWAYS
DISCUSSION AND ANALYSIS
QUESTIONS TO CONSIDER
201
KEY FINDINGS
POINTS OF VIEW TAKEAWAYS
DISCUSSION AND ANALYSIS
QUESTIONS TO CONSIDER
201
KEY FINDINGS
POINTS OF VIEW TAKEAWAYS
DISCUSSION AND ANALYSIS
QUESTIONS TO CONSIDER
201KEY FINDINGS
POINTS OF VIEW TAKEAWAYS
DISCUSSION AND ANALYSIS
QUESTIONS TO CONSIDER
KEY FINDINGS
POINTS OF VIEW TAKEAWAYS
DISCUSSION AND ANALYSIS
QUESTIONS TO CONSIDER
201
KEY FINDINGS
POINTS OF VIEW TAKEAWAYS
DISCUSSION AND ANALYSIS
QUESTIONS TO CONSIDER
201
KEY FINDINGS
POINTS OF VIEW TAKEAWAYS
DISCUSSION AND ANALYSIS
QUESTIONS TO CONSIDER
201
Business functions that require staying abreast of highly specialized knowledge and frequently changing regulations, such as payroll and taxes, are the most likely to be outsourced.
31 Robert Half | Financial Executives Research Foundation Benchmarking the Accounting & Finance Function 2015
Key Findings• General accounting, financial reporting
and internal audit are the departments most likely to have ownership for SOX compliance management (or responsibility for key internal controls).
• Among companies of all sizes, most had up to 100 key controls — 79 percent of U.S. firms and 80 percent of Canadian companies.
• Companies of all sizes seem to be achieving greater efficiencies with their compliance efforts by reducing the number of key controls they use for internal control over financial reporting.
• For the second year in a row, more companies report that compliance costs remained steady, rather than rising.
• Companies expect their overall compliance burden will increase over time but say that more streamlined regulations might help ease the burden.
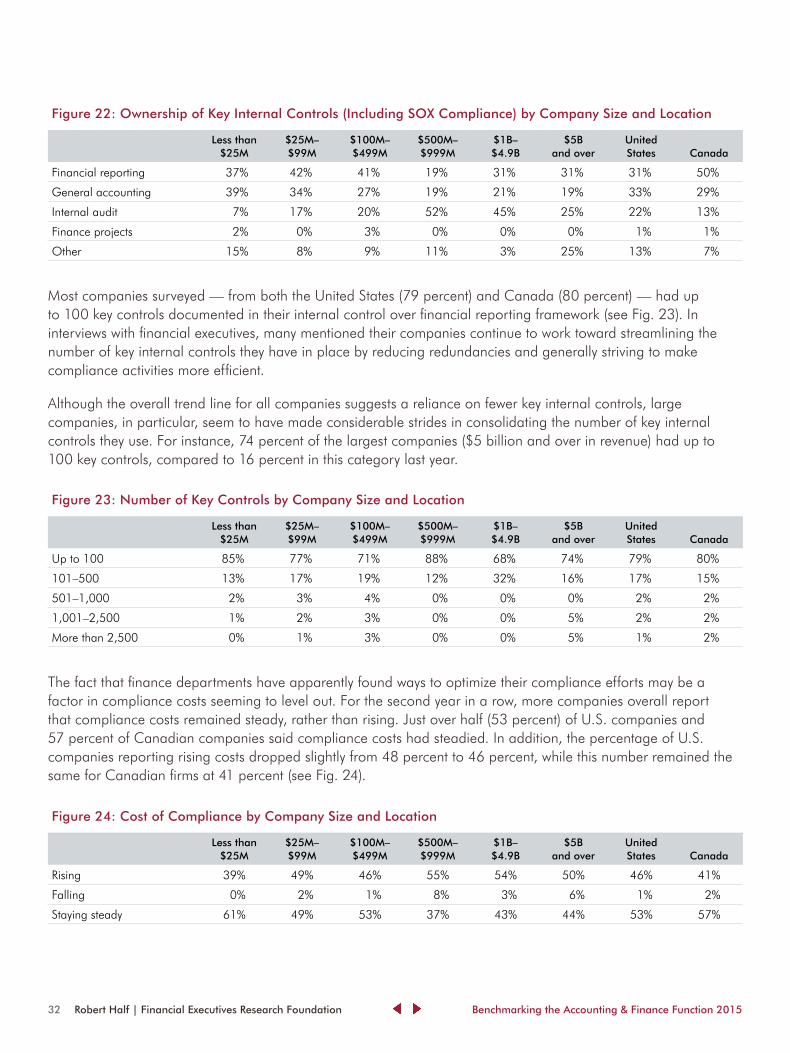
Discussion and AnalysisU.S. executives surveyed cited various functional areas as having ownership of their key internal controls as they relate to accounting and finance (including SOX compliance), suggesting that companies do not take a uniform approach to managing this process. The largest percentage of U.S. companies (33 percent) indicated that general accounting had ownership of key internal controls, followed closely by financial reporting and internal audit, at 31 percent and 22 percent, respectively (see Fig. 22).
Internal Controls & Compliance
Assignment of ownership varies somewhat, based on company size. “Ownership” can mean different things to different people — e.g., ownership over design, execution and monitoring (or evaluation). At larger companies, not surprisingly, the evaluation of internal controls tends to be the responsibility of internal audit or, alternatively, financial reporting. Smaller companies, on the other hand, often lack an internal audit department, and internal control responsibilities are usually covered by general accounting or financial reporting.
In Canada, where public companies must comply with Bill 198, the equivalent of SOX in the United States, ownership of key internal controls resides mostly with financial reporting or general accounting — 50 percent and 29 percent, respectively (see Fig. 22).
KEY FINDINGS
POINTS OF VIEW TAKEAWAYS
DISCUSSION AND ANALYSIS
QUESTIONS TO CONSIDER
KEY FINDINGS
POINTS OF VIEW TAKEAWAYS
DISCUSSION AND ANALYSIS
QUESTIONS TO CONSIDER
201
KEY FINDINGS
POINTS OF VIEW TAKEAWAYS
DISCUSSION AND ANALYSIS
QUESTIONS TO CONSIDER
201
KEY FINDINGS
POINTS OF VIEW TAKEAWAYS
DISCUSSION AND ANALYSIS
QUESTIONS TO CONSIDER
201
KEY FINDINGS
POINTS OF VIEW TAKEAWAYS
DISCUSSION AND ANALYSIS
QUESTIONS TO CONSIDER
201
KEY FINDINGS
POINTS OF VIEW TAKEAWAYS
DISCUSSION AND ANALYSIS
QUESTIONS TO CONSIDER
201
KEY FINDINGS
POINTS OF VIEW TAKEAWAYS
DISCUSSION AND ANALYSIS
QUESTIONS TO CONSIDER
“ Those who have fought
requirements and looked
at compliance as a purely
financial-imposed activity are
still trying to just ‘pass’ the tests,
and have gained very little.” — Hans Gundersen, former controller of several
small to midsize firms
32 Robert Half | Financial Executives Research Foundation Benchmarking the Accounting & Finance Function 2015
Most companies surveyed — from both the United States (79 percent) and Canada (80 percent) — had up to 100 key controls documented in their internal control over financial reporting framework (see Fig. 23). In interviews with financial executives, many mentioned their companies continue to work toward streamlining the number of key internal controls they have in place by reducing redundancies and generally striving to make compliance activities more efficient.
Although the overall trend line for all companies suggests a reliance on fewer key internal controls, large companies, in particular, seem to have made considerable strides in consolidating the number of key internal controls they use. For instance, 74 percent of the largest companies ($5 billion and over in revenue) had up to 100 key controls, compared to 16 percent in this category last year.
The fact that finance departments have apparently found ways to optimize their compliance efforts may be a factor in compliance costs seeming to level out. For the second year in a row, more companies overall report that compliance costs remained steady, rather than rising. Just over half (53 percent) of U.S. companies and 57 percent of Canadian companies said compliance costs had steadied. In addition, the percentage of U.S. companies reporting rising costs dropped slightly from 48 percent to 46 percent, while this number remained the same for Canadian firms at 41 percent (see Fig. 24).
Figure 22: Ownership of Key Internal Controls (Including SOX Compliance) by Company Size and Location
Less than $25M
$25M– $99M
$100M– $499M
$500M– $999M
$1B– $4.9B
$5B and over
United States Canada
Financial reporting 37% 42% 41% 19% 31% 31% 31% 50%
General accounting 39% 34% 27% 19% 21% 19% 33% 29%
Internal audit 7% 17% 20% 52% 45% 25% 22% 13%
Finance projects 2% 0% 3% 0% 0% 0% 1% 1%
Other 15% 8% 9% 11% 3% 25% 13% 7%
Figure 23: Number of Key Controls by Company Size and Location
Less than $25M
$25M– $99M
$100M– $499M
$500M– $999M
$1B– $4.9B
$5B and over
United States Canada
Up to 100 85% 77% 71% 88% 68% 74% 79% 80%
101–500 13% 17% 19% 12% 32% 16% 17% 15%
501–1,000 2% 3% 4% 0% 0% 0% 2% 2%
1,001–2,500 1% 2% 3% 0% 0% 5% 2% 2%
More than 2,500 0% 1% 3% 0% 0% 5% 1% 2%
Figure 24: Cost of Compliance by Company Size and Location
Less than $25M
$25M– $99M
$100M– $499M
$500M– $999M
$1B– $4.9B
$5B and over
United States Canada
Rising 39% 49% 46% 55% 54% 50% 46% 41%
Falling 0% 2% 1% 8% 3% 6% 1% 2%
Staying steady 61% 49% 53% 37% 43% 44% 53% 57%

33 Robert Half | Financial Executives Research Foundation Benchmarking the Accounting & Finance Function 2015
Nonetheless, over the longer term, most companies expect the compliance burden to increase over time. Seventy-two percent of U.S. and 66 percent of Canadian businesses anticipate this scenario (see Fig. 25), but these percentages are down slightly from last year. Moreover, slightly more respondents this year than last said they expect the compliance burden to stay the same — 26 percent of U.S. firms and 31 percent of Canadian respondents, compared to 24 percent and 29 percent, respectively, last year (see Fig. 25).
Both U.S. and Canadian firms said the compliance burden might be eased by regulations becoming more streamlined. Roughly three-quarters (73 percent) of U.S. companies and 83 percent of Canadian firms cited this response (see Fig. 26). Some respondents also indicated that strategic sourcing of regulatory resources would help ease the compliance burden. The responses closely paralleled those from last year’s survey.
Figure 25: Compliance Burden Over Time by Company Size and Location
Less than $25M
$25M– $99M
$100M– $499M
$500M– $999M
$1B– $4.9B
$5B and over
United States Canada
Increase 70% 72% 69% 68% 73% 69% 72% 66%
Decrease 2% 1% 3% 8% 5% 13% 2% 3%
Stay the same 28% 27% 27% 25% 22% 19% 26% 31%
Figure 26: Factors That Might Ease Compliance Burden by Company Size and Location
Less than $25M
$25M– $99M
$100M– $499M
$500M– $999M
$1B– $4.9B
$5B and over
United States Canada
Regulations becoming more streamlined
74% 75% 76% 79% 64% 72% 73% 83%
Strategic sourcing of regulatory resources
16% 17% 17% 15% 15% 22% 18% 9%
Other 10% 8% 8% 5% 21% 6% 9% 8%
Points of View: Greater Comfort With Compliance?Although maintaining internal control over financial reporting is not without its challenges, our survey suggests companies have become more proficient at meeting various requirements.
“We’re getting more comfortable with internal controls,” said Tyrone Cotie, treasurer of Canadian company Clearwater Seafoods, which has to comply with the certification requirements of Bill 198. “The amount of work that went into certification was exhaustive, but now we’re seeing people starting to use better judgment. People are reverting to sampling, to traditional audit techniques, and looking at one control that covers a particular risk. There’s no need to have four or five controls. So, I think people are getting better at understanding and testing controls again and becoming a lot more efficient.”
Other Canadian executives noted that while they don’t necessarily expect their country’s regulatory requirements to ease anytime soon, they also don’t see anything major on the horizon that would significantly increase the compliance burden. Some noted, however, that they’re facing more questions, scrutiny and documentation requests from external auditors.
KEY FINDINGS
POINTS OF VIEW TAKEAWAYS
DISCUSSION AND ANALYSIS
QUESTIONS TO CONSIDER

34 Robert Half | Financial Executives Research Foundation Benchmarking the Accounting & Finance Function 2015
In addition to meeting the usual compliance mandates, several executives mentioned that their companies had spent time and effort over the past year implementing the updated Internal Control Integrated Framework from the Committee of Sponsoring Organizations of the Treadway Commission (known as COSO 2013). Another executive mentioned that her firm had been busy implementing International Financial Reporting Standards (IFRS), which had added rigor to the company’s financial reporting and business processes.
When it comes to compliance burdens, executives pointed out that an individual company’s requirements are often tied more to complexity and growth than to expanding regulations. Companies with multi-country operations, for instance, have to comply with mandates from numerous jurisdictions and regulatory authorities. Depending on the nature of their business, companies may have compliance requirements relating to the following: the Dodd-Frank Wall Street Reform and Consumer Protection Act, the Consumer Financial Protection Bureau, securities bureaus and stock exchanges, anti-money laundering, internal controls and revenue recognition, among others.
How companies address compliance from an internal perspective is also highly individualized. Most executives interviewed described compliance responsibilities as being fairly dispersed; few said they had a dedicated compliance team or officer. They also noted that although compliance responsibilities often rest with controllers or finance managers, the CFO is ultimately responsible.
As compliance requirements settle in, companies seem increasingly focused on how they can comply in the most efficient and effective way. This often involves trying to streamline internal controls and compliance activities, where possible, by reducing redundant efforts. Many also described trying to
translate internal controls into business controls by pushing ownership of control activities to the operating managers in an effort to emphasize that internal controls are not just the responsibility of the finance function.
“If you can convey why it’s important for the business people to be recognizing and helping to take care of these things, it takes a lot of the load off of finance,” said a CFO for an international technology firm. “You’re no longer sitting at the front of the curve, preaching and trying to push and cajole people into doing the right thing. You have operations telling their people, ‘Go off and do this, and do it right. And if you don’t, it’s going to have a consequence.’”

35 Robert Half | Financial Executives Research Foundation Benchmarking the Accounting & Finance Function 2015
Questions to Consider• Have you found ways to streamline your
company’s approach to compliance activities?
• Have you been able to reduce the number of key internal controls through a top-down, risk-based assessment of the control structure?
• Is your company being proactive about acting on — or at least considering — industry recommendations and trends, such as the adoption of COSO 2013 and the transition to International Financial Reporting Standards (IFRS)?
• Which compliance mandates are currently dominating your finance department’s time and attention? Are there others on the horizon that you need to be marshaling resources for?
Hans Gundersen, who has served as a controller of several small to midsize businesses, agreed that companies that have pushed ownership of control activities to the operating managers have gained significant efficiencies. But he also noted that “those who have fought requirements and looked at compliance as a purely financial-imposed activity are still trying to just ‘pass’ the tests, and have gained very little.”
Takeaways
• Companies seem to be growing more comfortable and confident with their approach to compliance, especially when it comes to establishing and testing internal controls.
• Businesses take varied approaches to assigning responsibility for compliance activities, but finance is always integral to the process.
• Although executives don’t expect compliance requirements to subside, they also recognize that their compliance burden is tied closely to business growth and complexity.
KEY FINDINGS
POINTS OF VIEW TAKEAWAYS
DISCUSSION AND ANALYSIS
QUESTIONS TO CONSIDER
KEY FINDINGS
POINTS OF VIEW TAKEAWAYS
DISCUSSION AND ANALYSIS
QUESTIONS TO CONSIDER
201
KEY FINDINGS
POINTS OF VIEW TAKEAWAYS
DISCUSSION AND ANALYSIS
QUESTIONS TO CONSIDER
201
KEY FINDINGS
POINTS OF VIEW TAKEAWAYS
DISCUSSION AND ANALYSIS
QUESTIONS TO CONSIDER
201
KEY FINDINGS
POINTS OF VIEW TAKEAWAYS
DISCUSSION AND ANALYSIS
QUESTIONS TO CONSIDER
KEY FINDINGS
POINTS OF VIEW TAKEAWAYS
DISCUSSION AND ANALYSIS
QUESTIONS TO CONSIDER
201
KEY FINDINGS
POINTS OF VIEW TAKEAWAYS
DISCUSSION AND ANALYSIS
QUESTIONS TO CONSIDER
201
KEY FINDINGS
POINTS OF VIEW TAKEAWAYS
DISCUSSION AND ANALYSIS
QUESTIONS TO CONSIDER
201
KEY FINDINGS
POINTS OF VIEW TAKEAWAYS
DISCUSSION AND ANALYSIS
QUESTIONS TO CONSIDER
201
Some finance departments are encouraging operating managers to also take ownership of control activities in an effort to close the accountability loop.

36 Robert Half | Financial Executives Research Foundation Benchmarking the Accounting & Finance Function 2015
Summary: Putting the Data to Work
It’s not easy to understand how well your accounting and finance function is performing without some form of measurement and comparison. Benchmarking the Accounting & Finance Function 2015 from FERF and Robert Half is intended to provide financial executives with such a point of reference.
Benchmarking is especially important as the finance function continues to evolve from a transaction-oriented business function to a value-added information source and business partner to the rest of the organization.
Applying benchmarks and standards also helps financial executives learn more about how peer organizations use resources. Financial departments of all sizes face ongoing resource challenges
in terms of having the people, knowledge, technological capabilities and funding to meet the ever-expanding regulatory requirements and internal requests that come through finance.
As one financial executive noted, his department has to compete for resources like every other department in the organization. And despite its critical importance to the business, the finance function is not necessarily at the top of the list for resource allocation. This is where benchmarking can be invaluable: It helps financial executives see how their departments measure up — against their own goals, as well as the external environment. In this way, finance and accounting departments can glean insights into how they might make better use of resources, improve their effectiveness and add ever-greater value.

37 Robert Half | Financial Executives Research Foundation Benchmarking the Accounting & Finance Function 2015
Paul McDonaldPaul McDonald is senior executive director with Robert Half. Robert Half’s divisions place professionals on a temporary, temporary-to-hire and full-time basis in the accounting and finance; technology; office administration; legal; and creative, marketing and design fields. McDonald joined the company in 1984 as a recruiter in Boston, following a public accounting career with Price Waterhouse. In the 1990s, he became president of the western United States, overseeing the company’s regional operations, and most recently served as senior executive director of Robert Half Management Resources. Over the course of his nearly 30-year career with the company, McDonald has spoken and written extensively on employment and management issues based on his work with thousands of client companies and job seekers.
Thomas Thompson, Jr.
Thomas Thompson, Jr., is a Senior Associate, Research, at Financial Executives Research Foundation, Inc., and the author of more than 50 published research reports and white papers. He received a Bachelor of Arts degree in Economics from Rutgers University and a Bachelor of Arts degree in Psychology from Montclair State University. Prior to joining FERF, Thompson held positions in business operations and client relations at NCG Energy Solutions, AXA-Equitable and Morgan Stanley Dean Witter.
Tom can be reached at [email protected] or (973) 765-1007.
About theAuthors
38 Robert Half | Financial Executives Research Foundation Benchmarking the Accounting & Finance Function 2015
About Robert Half & Financial Executives Research Foundation
About Financial Executives Research Foundation, Inc.Financial Executives Research Foundation (FERF) is the nonprofit 501(c)(3) research affiliate of Financial Executives International (FEI). FERF researchers identify key financial issues and develop impartial, timely research reports for FEI members and nonmembers alike, in a variety of publication formats. FERF relies primarily on voluntary tax-deductible contributions from corporations and individuals, and publications can be ordered by logging on to www.ferf.org.
The views set forth in this publication are those of the author(s) and do not necessarily represent those of the FERF Board as a whole, individual trustees, employees, or the members of the Advisory Committee. FERF shall be held harmless against any claims, demands, suits, damages, injuries, costs, or expenses of any kind or nature whatsoever except such liabilities as may result solely from misconduct or improper performance by FERF or any of its representatives.
About Robert HalfFounded in 1948, Robert Half is the world’s first and largest specialized staffing firm, and has more than 400 staffing and consulting locations worldwide. The company’s professional staffing divisions include Accountemps®, Robert Half® Finance & Accounting, and Robert Half® Management Resources, for temporary, full-time and senior-level project professionals, respectively, in the fields of accounting and finance. For more information about the specialized staffing and recruitment divisions of Robert Half, visit www.roberthalf.com.
Robert Half also is the parent company of Protiviti, a global consulting firm that helps companies solve problems in finance, technology, operations, governance, risk and internal audit.
Robert Half is an Equal Opportunity Employer M/F/Disability/Vet.

39 Robert Half | Financial Executives Research Foundation Benchmarking the Accounting & Finance Function 2015
Acknowledgments
Financial Executives Research Foundation (FERF) gratefully acknowledges these companies for their longstanding support and generosity:
Exxon Mobil Corp. Microsoft Corp.
PLATINUM MAJOR GIFT | $50,000 +
Cisco Systems Inc. Cummins Inc. Dow Chemical Co.
General Electric Co. Wells Fargo & Company
GOLD PRESIDENT’S CIRCLE | $10,000–$14,999
Apple, Inc. The Boeing Company Comcast Corporation Corning Incorporated Credit Suisse AG Dell, Inc. DuPont Eli Lilly and Company GM Foundation Halliburton Company The Hershey Company IBM Corporation
Johnson & Johnson Lockheed Martin, Inc. McDonald’s Corporation Medtronic, Inc. Motorola Solutions, Inc. PepsiCo, Inc. Pfizer Inc. Procter & Gamble Co. Tenneco Tyco International Mgmnt Co. Wal-Mart Stores, Inc.
SILVER PRESIDENT’S CIRCLE | $5,000–$9,999

40 Robert Half | Financial Executives Research Foundation Benchmarking the Accounting & Finance Function 2015
Copyright © 2015 by Financial Executives Research Foundation, Inc.
All rights reserved. No part of this publication may be reproduced in any form or by any means without written permission from the publisher.
International Standard Book Number 978-1-61509-185-0 Printed in the United States of America First Printing
Authorization to photocopy items for internal or personal use, or the internal or personal use of specific clients, is granted by FERF provided that an appropriate fee is paid to Copyright Clearance Center, 222 Rosewood Drive, Danvers, MA 01923. Fee inquiries can be directed to Copyright Clearance Center at 978-750-8400. For further information please check Copyright Clearance Center online at www.copyright.com.

Call us today at 1.800.803.8367
roberthalf.com
© 2015 Robert Half International Inc. An Equal Opportunity Employer M/F/Disability/Vet. RH-0515.


