36
data s Best-Timed Shorts January – June 2008 Copyright Data Explorers Limited June 2008 Email: [email protected] Website: www.dataexplorers.com

data s
�
Best-Timed ShortsJanuary – June 2008
Copyright Data Explorers LimitedJune 2008
Email: [email protected] Website: www.dataexplorers.com
data s
2
A Word from Mark Faulkner, Founder of Data ExplorersShort-selling has been the focus of unprecedented media and investor attention during the first six months of 2008. Data Explorers is a non-advisory, non-transactional data company which collects stock loan data between the lending community and the borrowing community. Our data suggests that housebuilders, global financials and consumer retail have been the focus of shortsellers’ attention during 2008.
Factors which have affected shorting this year include:
• Increased demand to borrow stock, particularly in US midcaps, as evidenced by the rising cost to borrowing the Russell 2000 (Jan 1st: 69bps average cost to borrow compared with 118bps on July 2nd)
• Sector focus: The total value of short positions globally has not increased during this period, but traders have focussed on specific sectors which we look at on pp. 27-32.
• Momentum on the downside caused some commentators to talk about an anti-bubble – the opposite of a speculative bubble in some stocks.
• New Regulation: The FSA shocked the market on June 13th by introducing temporary disclosure regulations regarding stocks which have announced rights issues.
Yours etc,
Mark
data s
�
Company Description
Data Explorers is an independent specialist provider of services to the securities lending and asset management industry.
Our objective is to encourage a broader understanding and debate about the impact of the stock lending on capital markets.
We believe that stock lending levels can act as a proxy for short interest but we do not offer investment advice or research.
Our clients use the data to benchmark their stock lending/borrowing activity and to make better-timed trades.
For further information, please contact:
[email protected] or call +44 20 7264 7600 or +1 212 710 2210 and ask to speak to the Sales team.

data s
�
Index of Companies and Sectors
North AmericaWachovia .............................6
Bear Stearns ..........................7
R.H Donnelly .......................8
Capital One Financial Corp ..9
Qwest Communications International ....................10
Lehman ..............................11
American International Group ..............................12
Downey ..............................13
Gildan Activewear ..............14
EuropeCattles ................................15
Carphone Warehouse ..........16
DSG ...................................17
Vanco .................................18
Banco de Sabadell ...............19
Yell ....................................20
Heidelberger Druckmaschinen AG .......21
Portugal Telecom ...............22
AsiaJoint Corp ..........................23
Air China ...........................24
China Southern Airlines .....25
Honeys ...............................26
Sinopec ...............................27
Babcock & Brown ...............28
SectorsAsian and Emerging Market
Sector Highlights ............30
Sectors where short interest is low ..................................31
Asian and American Food, Beverage and Tobacco Sectors ..32
Airlines ..............................33
Best-Timed Shorts of 2007, six months on ..................34
Performance Analysis of the Best-Timed Shorts of 2007 ............................35

data s
�
Definitions of our graphsOur left hand graphs document Utilisation, which is defined as the amount of stock which has been borrowed, as a percentage of the amount which is available to borrow from the majority of the world’s major custodians and beneficial owners.
Our right hand graphs* document the percentage of a stock’s entire Market Cap that is on loan at any given time.
*Where there is only one graph, the percentage of the Market Cap on loan figures will appear.
How the stocks were selected• We used internal Data Explorers systems to screen for when the borrow began to rise in global equities. We then
analysed each potential candidate to assess whether the short was well-timed or was ‘late’ in coming to the trade.
• We have selected large-cap names wherever possible.

data s
�
Wachovia (WB)
December 12th: The fifth-largest US bank by market value issues a negative forecast for this quarter’s performance, and falls 16% in a month
20th February: Goldman Sachs forecast that Wachovia was likely to take a first quarter write-down in excess of $1bn
Wachovia Corp (North America Banks)
North AmericA

data s
�
Bear Stearns (BSC)
December 20th: Bear Stearns reports a quarterly loss for the first time in 84 years as a public company – four times the size of analysts’ forecasts
Bear Stearns
data s
8
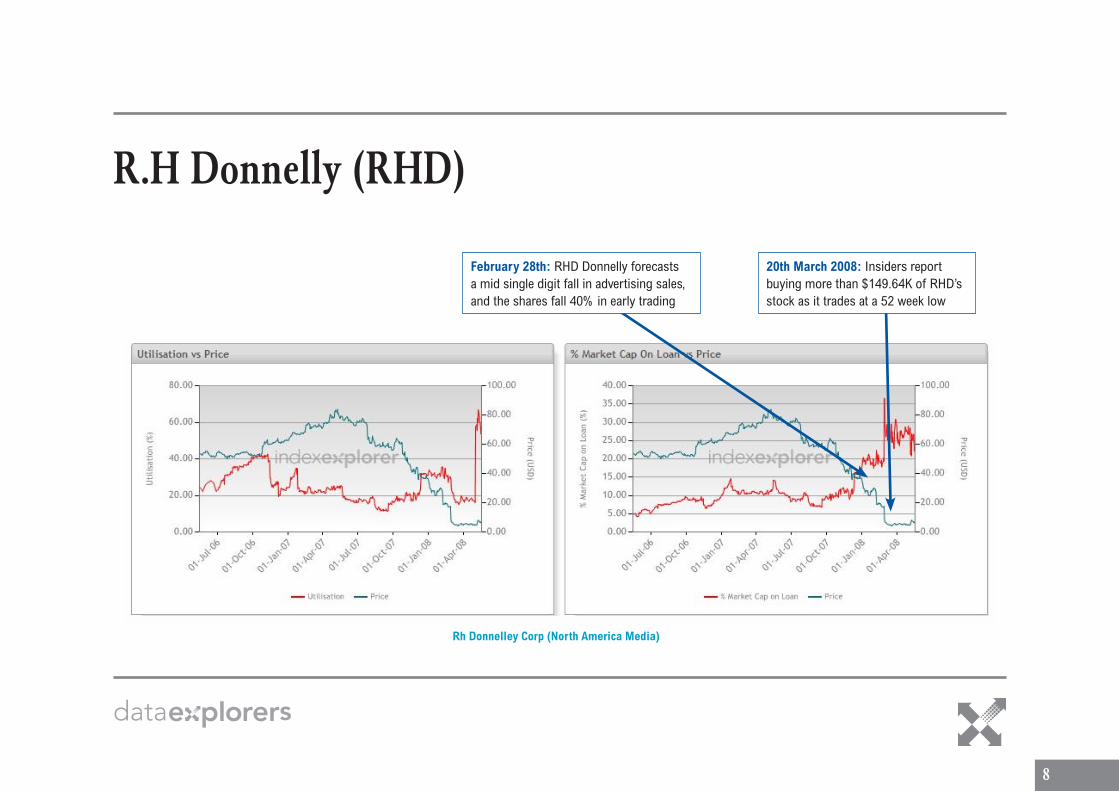
R.H Donnelly (RHD)
February 28th: RHD Donnelly forecasts a mid single digit fall in advertising sales, and the shares fall 40% in early trading
20th March 2008: Insiders report buying more than $149.64K of RHD’s stock as it trades at a 52 week low
Rh Donnelley Corp (North America Media)
data s
�
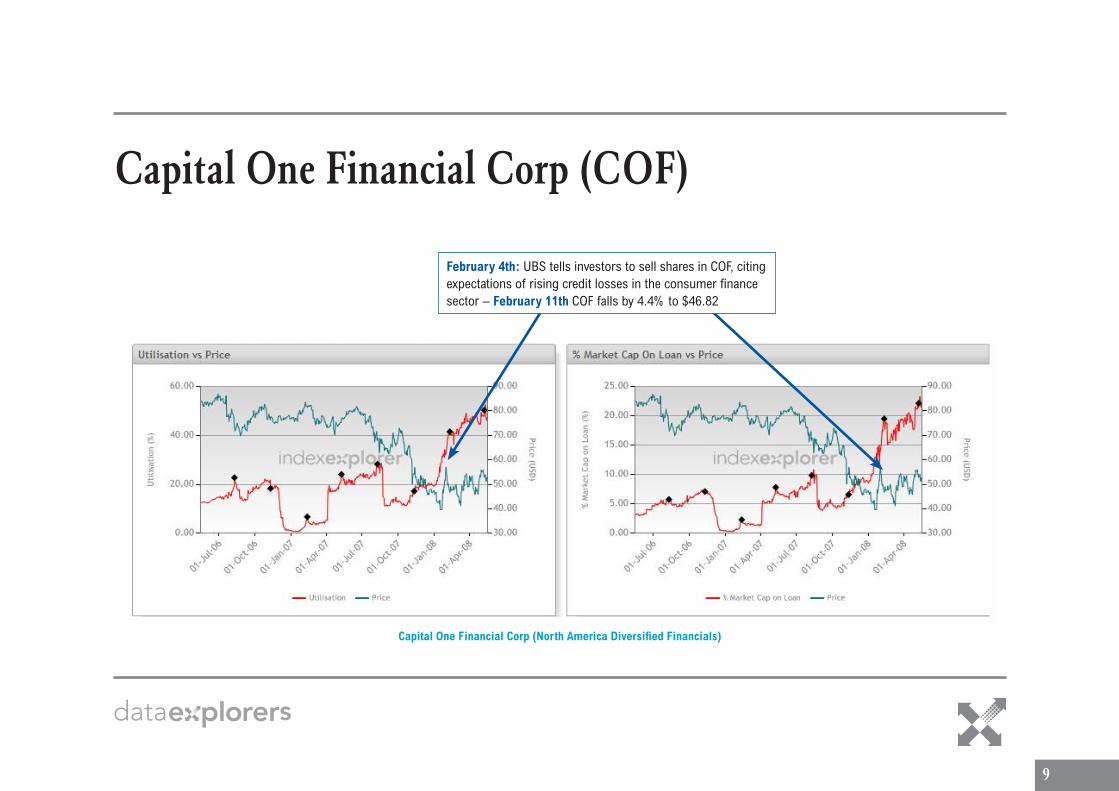
Capital One Financial Corp (COF)
February 4th: UBS tells investors to sell shares in COF, citing expectations of rising credit losses in the consumer finance sector – February 11th COF falls by 4.4% to $46.82
Capital One Financial Corp (North America Diversified Financials)
data s
�0
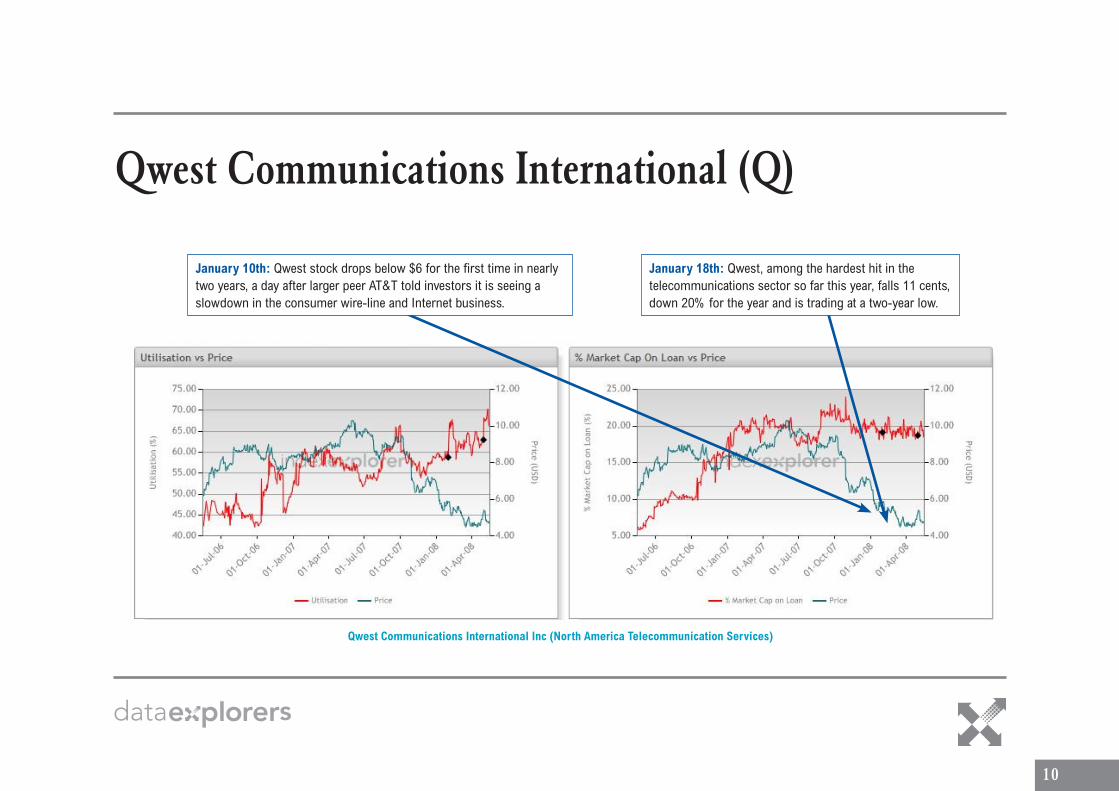
Qwest Communications International (Q)
January 10th: Qwest stock drops below $6 for the first time in nearly two years, a day after larger peer AT&T told investors it is seeing a slowdown in the consumer wire-line and Internet business.
January 18th: Qwest, among the hardest hit in the telecommunications sector so far this year, falls 11 cents, down 20% for the year and is trading at a two-year low.
Qwest Communications International Inc (North America Telecommunication Services)

data s
��
Lehman (LEH)
June 4th: Investors continue to bet heavily against Lehman, lifting the banks shares sold short to record levels
9th June: Lehman projects a $2.8bn loss for its second quarter. The bank’s CEO Richard Fuld is forced to part company with his life long friend and number two Joseph Gregory
Lehman Brothers Holdings Inc (US Equity (S&P500))
data s
�2
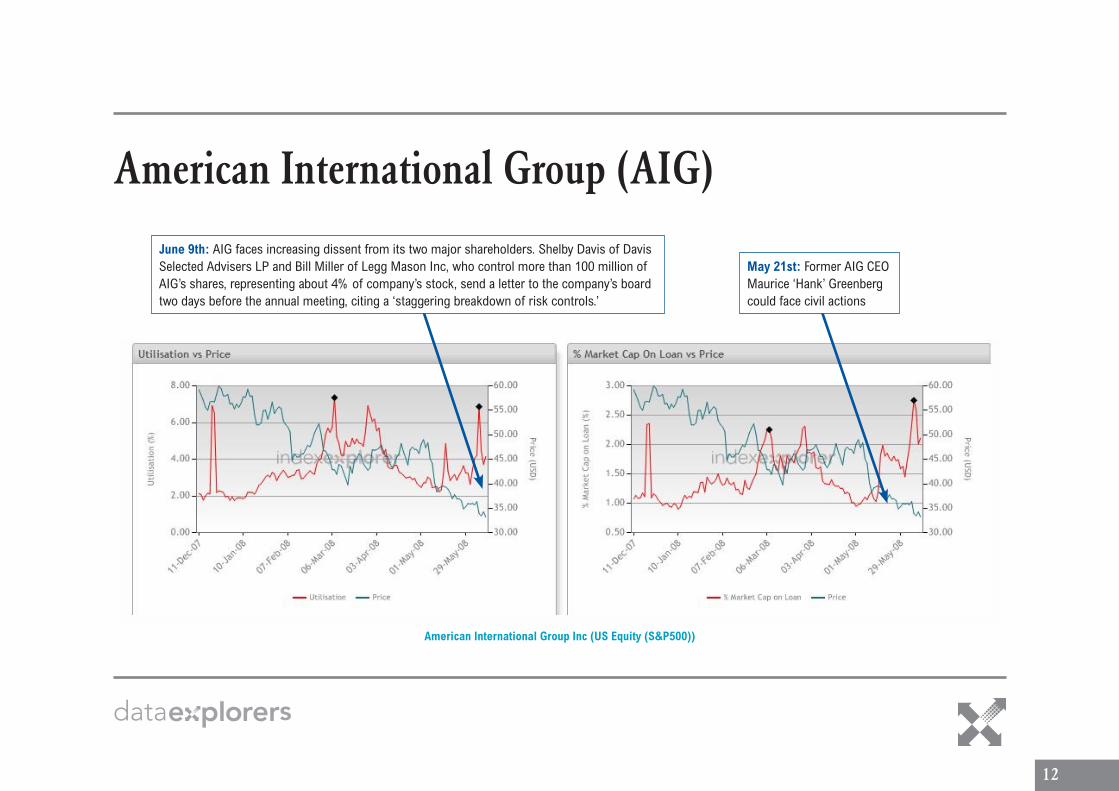
American International Group (AIG)
June 9th: AIG faces increasing dissent from its two major shareholders. Shelby Davis of Davis Selected Advisers LP and Bill Miller of Legg Mason Inc, who control more than 100 million of AIG’s shares, representing about 4% of company’s stock, send a letter to the company’s board two days before the annual meeting, citing a ‘staggering breakdown of risk controls.’
May 21st: Former AIG CEO Maurice ‘Hank’ Greenberg could face civil actions
American International Group Inc (US Equity (S&P500))
data s
��
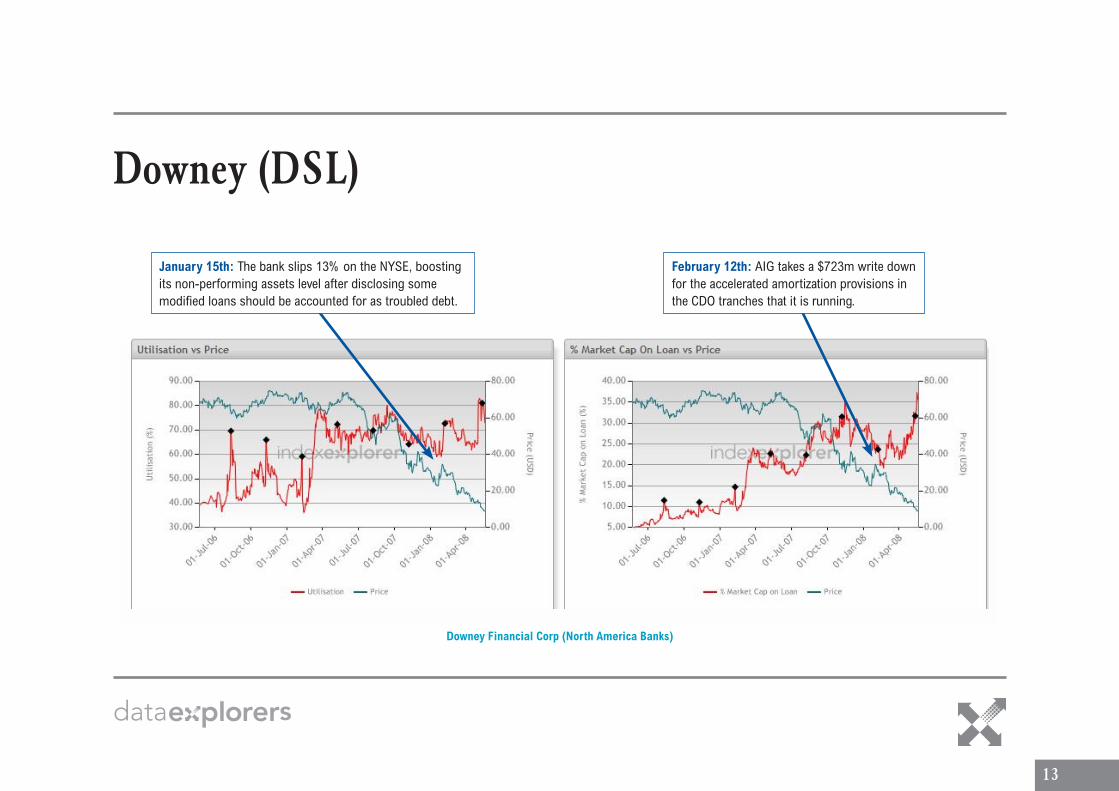
Downey (DSL)
January 15th: The bank slips 13% on the NYSE, boosting its non-performing assets level after disclosing some modified loans should be accounted for as troubled debt.
February 12th: AIG takes a $723m write down for the accelerated amortization provisions in the CDO tranches that it is running.
Downey Financial Corp (North America Banks)
data s
��
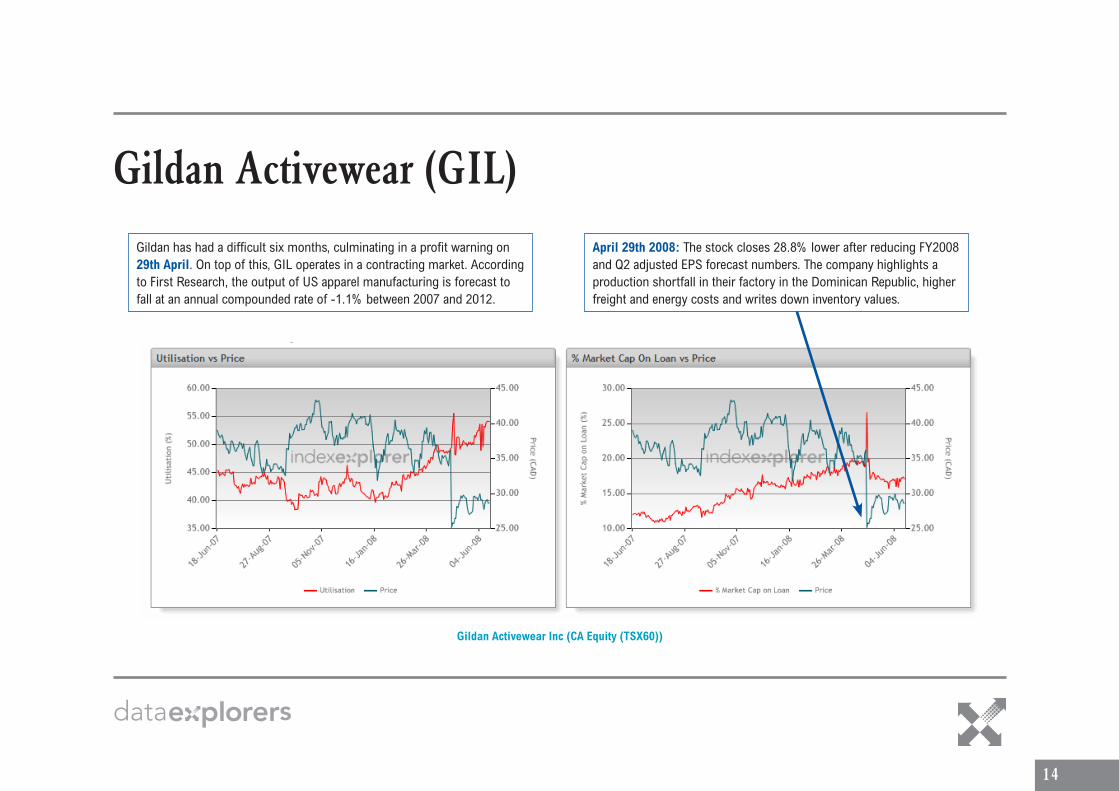
Gildan Activewear (GIL)
down inventory values.
Gildan has had a difficult six months, culminating in a profit warning on 29th April. On top of this, GIL operates in a contracting market. According to First Research, the output of US apparel manufacturing is forecast to fall at an annual compounded rate of -1.1% between 2007 and 2012.
April 29th 2008: The stock closes 28.8% lower after reducing FY2008 and Q2 adjusted EPS forecast numbers. The company highlights a production shortfall in their factory in the Dominican Republic, higher freight and energy costs and writes down inventory values.
Gildan Activewear Inc (CA Equity (TSX60))
data s
��
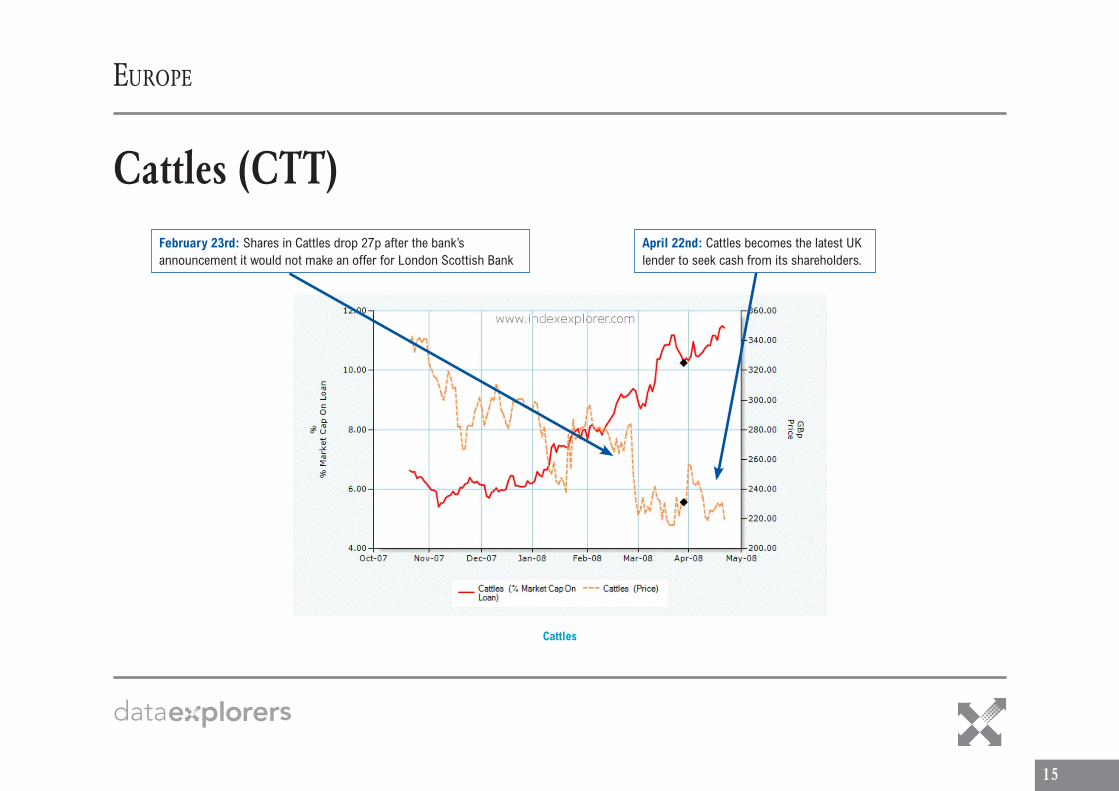
Cattles (CTT)February 23rd: Shares in Cattles drop 27p after the bank’s announcement it would not make an offer for London Scottish Bank
April 22nd: Cattles becomes the latest UK lender to seek cash from its shareholders.
Cattles
europe

data s
��
Carphone Warehouse (CPW)January 9th: CPW comes under heavy selling pressure as hedge funds bet that a forthcoming trading update would disappoint.
April 15th: CPW drops 13% after surprising the market with news that year-end debt levels would be higher than market expectations due to adverse currency movements and increased capital investments.
Carphone Warehouse

data s
��
DSG (DSGI)January 11th: DSG issues the sector’s first post-Christmas profit warning.
April 12th: DSG’s shares fall 11% after the retailer delivered another profits warning as cash-strapped customers avoided full priced goods and sought out bargains instead.
DSG
data s
�8
Vanco (VAN)
26 to Reliance Comms for $77m - it was once worth 400million USD
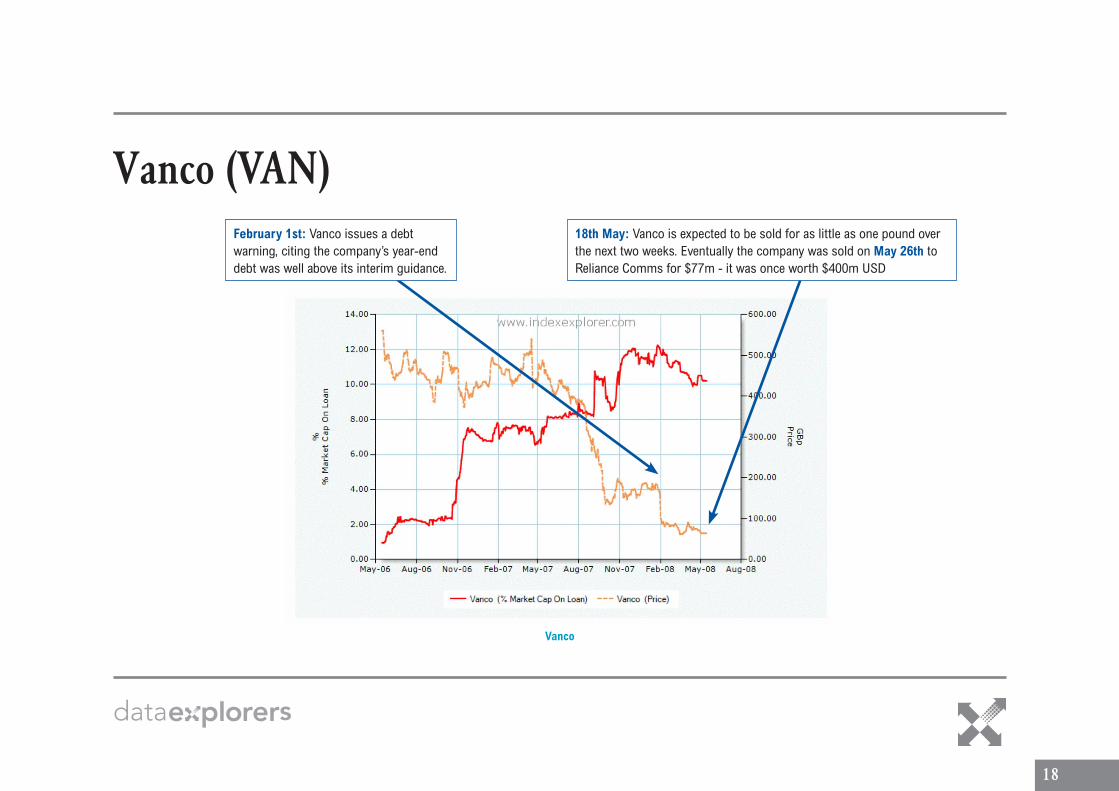
February 1st: Vanco issues a debt warning, citing the company’s year-end debt was well above its interim guidance.
Vanco
18th May: Vanco is expected to be sold for as little as one pound over the next two weeks. Eventually the company was sold on May 26th to Reliance Comms for $77m - it was once worth $400m USD

data s
��
Banco de Sabadell (SAB)
June 3rd: French insurers Axa and Groupama submit offers to acquire 50 per cent of the insurance arm of SAB in a sale process organised by the Spanish Bank. Sources close to the matter value SAB’s insurance business at 1.2 to 1.5 billion euros.
Banco de Sabadell Sa (ES Equity (IBEX))

data s
20
Yell (YELL)January 9th: UBS downgrades Yell to ‘Sell’ and the share price drops 6.2%.
March 18th: Yell drops 12.1% to a record low of 147p, taking its losses since the turn of the year to 63%, as investors continue to steer clear of media companies.
Yell Group

data s
2�
Heidelberger Druckmaschinen AG (HDD)
April 1st: Heidelberger has its steepest profit drop in two months after failing to meet its annual profit and sales targets.
Heidelberger Druckmaschinen Ag (DE Equity (MDAX))
January 1st: JP Morgan gives a ‘neutral’ recommendation to HDD, projecting a significant decrease in earnings over the next six to 12 months
data s
22
Portugal Telecom (PTC)
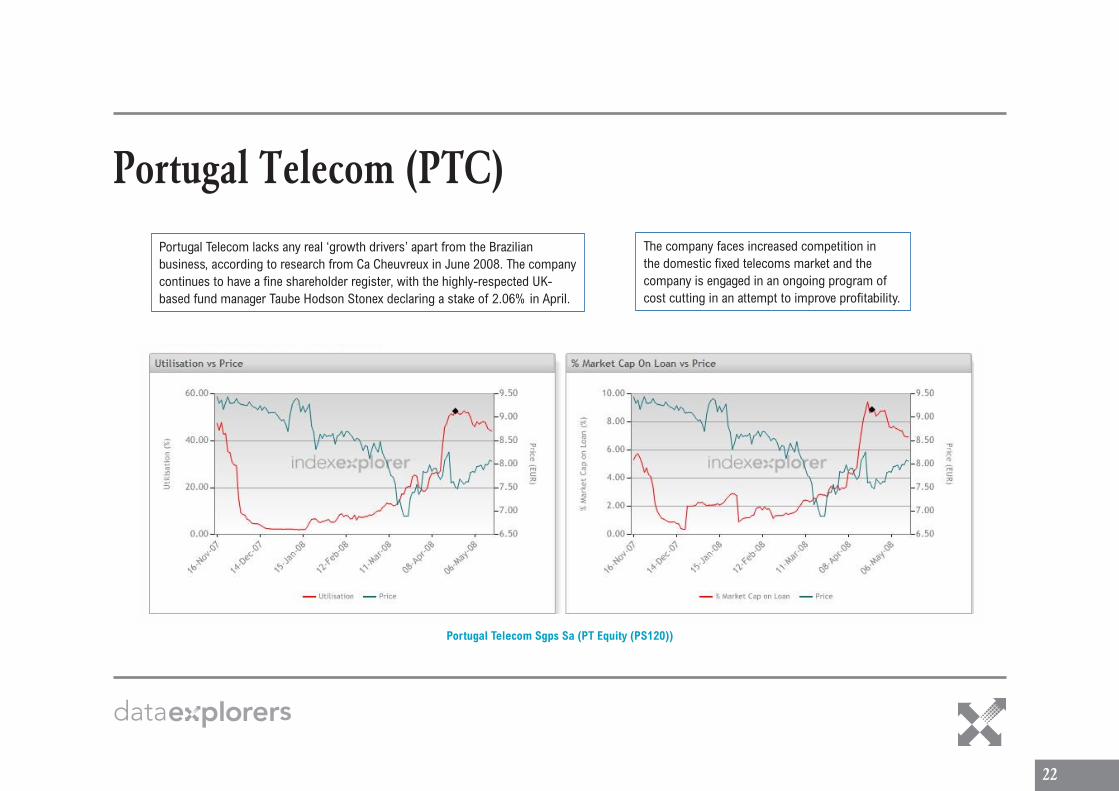
The company faces increased competition in the domestic fixed telecoms market and the company is engaged in an ongoing program of cost cutting in an attempt to improve profitability.
Portugal Telecom Sgps Sa (PT Equity (PS120))
Portugal Telecom lacks any real ‘growth drivers’ apart from the Brazilian business, according to research from Ca Cheuvreux in June 2008. The company continues to have a fine shareholder register, with the highly-respected UK-based fund manager Taube Hodson Stonex declaring a stake of 2.06% in April.

data s
2�
Joint Corp (88��)
Trading volume in the underlying equity has risen over the last six months, as has the amount of stock on loan.
Joint Corp (Japan Real Estate)
Joint Corporation has been hit by the slow-down in the domestic property market and tighter government building regulations
AsiA
data s
2�
Air China (0���)
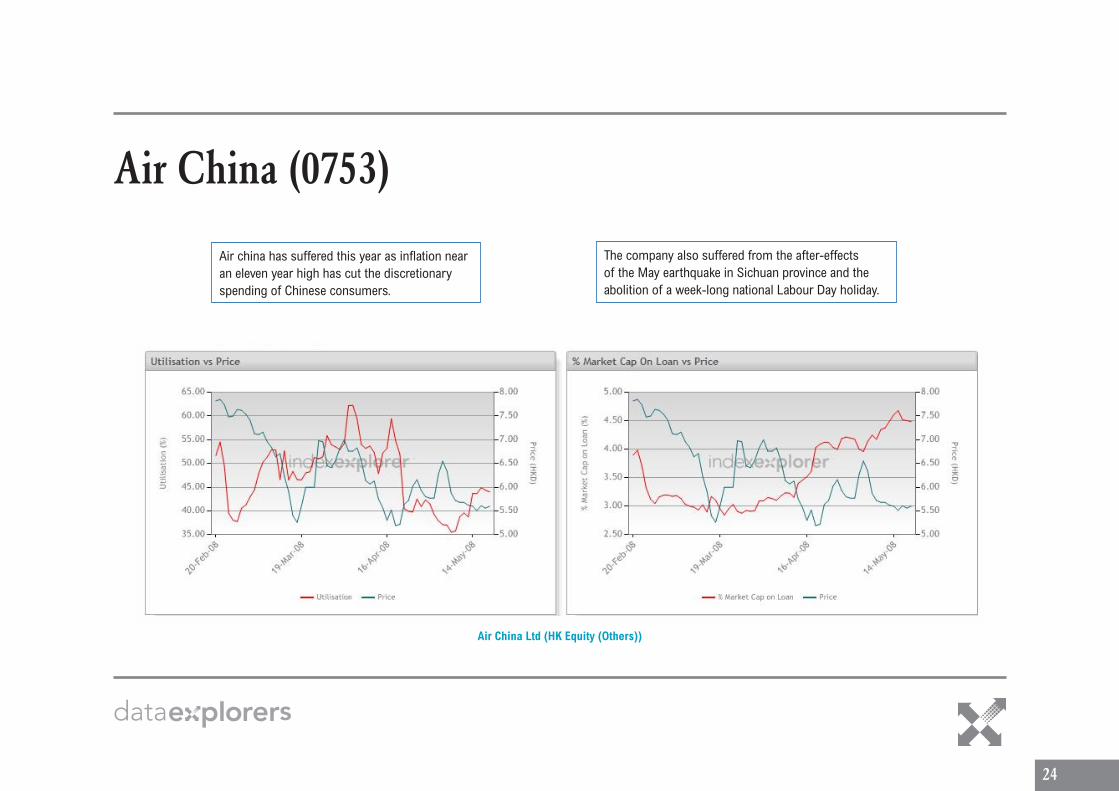
The company also suffered from the after-effects of the May earthquake in Sichuan province and the abolition of a week-long national Labour Day holiday.
Air China Ltd (HK Equity (Others))
Air china has suffered this year as inflation near an eleven year high has cut the discretionary spending of Chinese consumers.
data s
2�
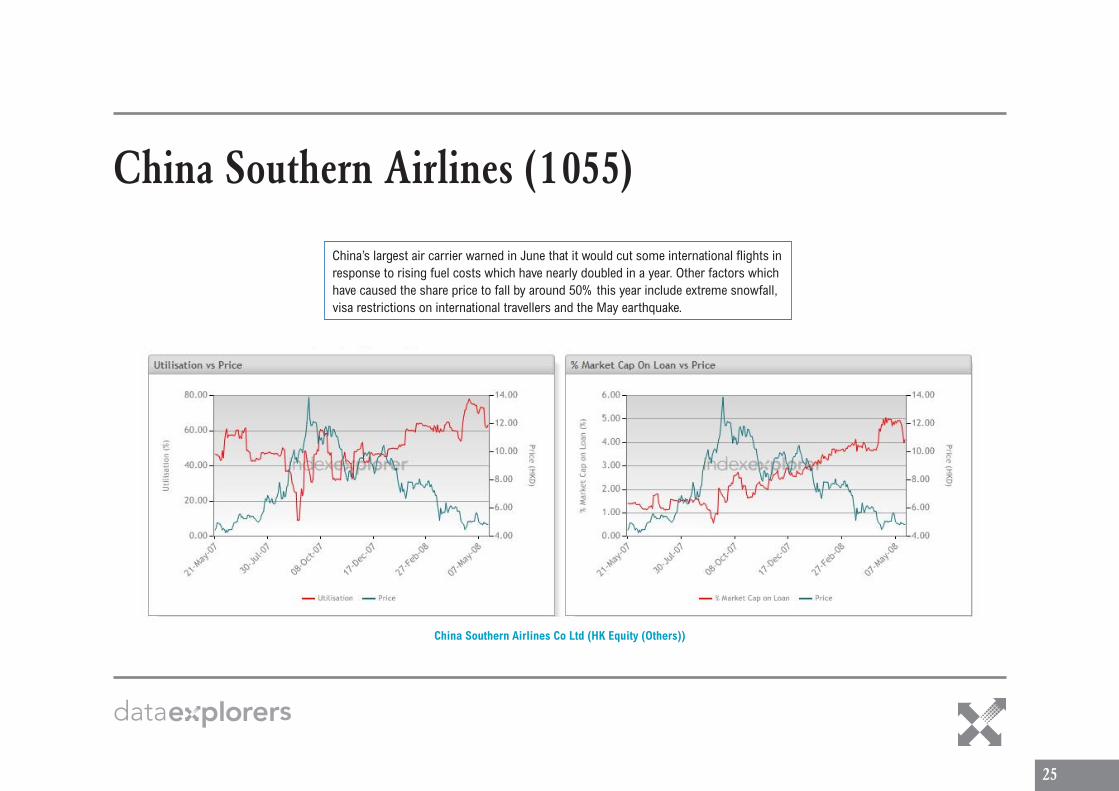
China Southern Airlines (�0��)
China Southern Airlines Co Ltd (HK Equity (Others))
China’s largest air carrier warned in June that it would cut some international flights in response to rising fuel costs which have nearly doubled in a year. Other factors which have caused the share price to fall by around 50% this year include extreme snowfall, visa restrictions on international travellers and the May earthquake.

data s
2�
Honeys (2��2)
18th June 2008: The stock was the third most heavily borrowed in the Japan Retailing sector, behind only Daiei and Don Quijote.
Honeys Co Ltd (JP Equity (Others))
Japanese retail spending has fallen this year, and Honeys has suffered, along with the rest of the consumer discretionary sector. The stock has been heavily borrowed throughout the year, with Utilisation oscillating between 55% and 85% of available stock.

data s
2�
Sinopec (0��8)
Absolute shorting levels are not high, however supply is fairly constrained with only 9.34% of the market cap available to lend.
Sinopec Shanghai Petrochemical Co Ltd (HK Equity (Others))
Sinopec admitted to facing an increasingly difficult operating climate in 2008 when it announced its FY 2007 results in April. Factors cited include: high oil prices, accelerating RMB appreciation, export tax rebates, State control over domestic petroleum products and tightening monetary policy.
data s
28
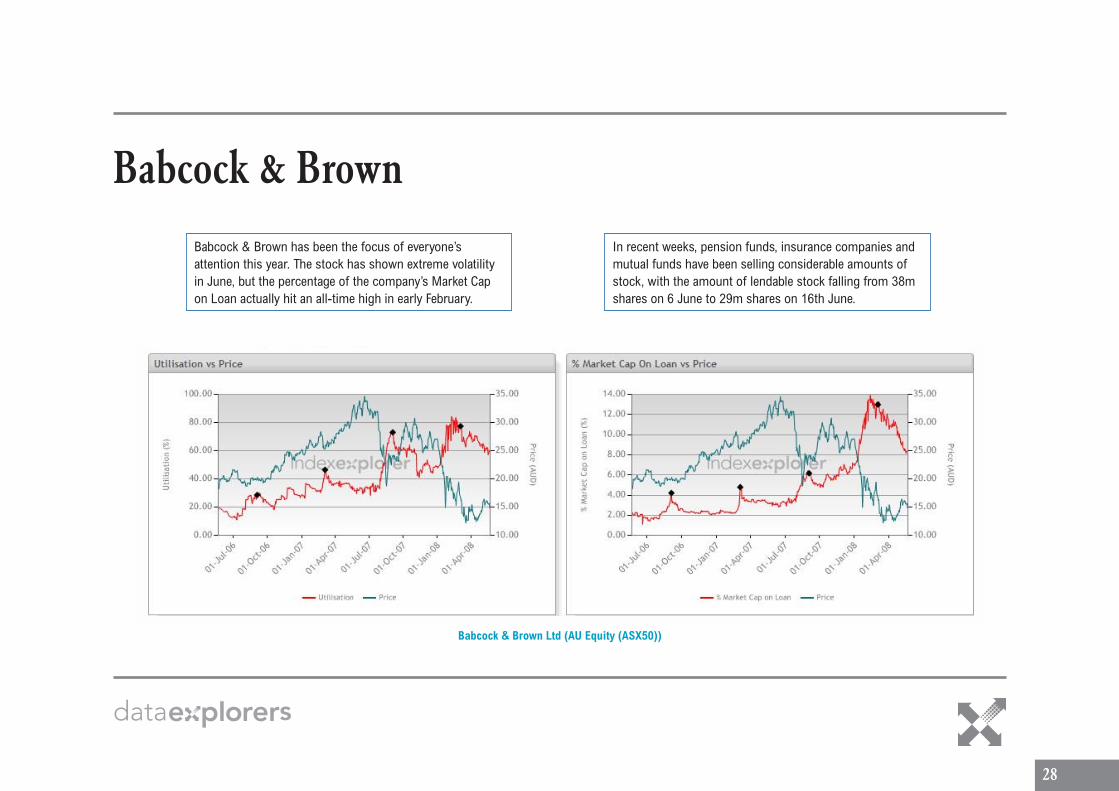
Babcock & Brown
In recent weeks, pension funds, insurance companies and mutual funds have been selling considerable amounts of stock, with the amount of lendable stock falling from 38m shares on 6 June to 29m shares on 16th June.
Babcock & Brown Ltd (AU Equity (ASX50))
Babcock & Brown has been the focus of everyone’s attention this year. The stock has shown extreme volatility in June, but the percentage of the company’s Market Cap on Loan actually hit an all-time high in early February.

data s
2�
SectorsPredictably, given the present financial climate, it is the Banking, Retail and Consumer Services sectors where short interest has risen this year, particularly in North America. The Banking sector has been heavily borrowed, with North American Banks seeing the most activity. October 2007 appears to have been the time when investors increased their banking short positions and they stayed high throughout H1 2008.
Below – North America’s banks, consumer, and retail sectors
25.00
20.00
15.00
10.00
5.00
0.00
Util
isa
tion
(%)
01-D
ec-0
7
01-J
an-0
8
01-F
eb-0
8
01-M
ar-0
8
01-A
pr-0
8
01-M
ay-0
8
index
Utilisation – North American Banks
24.00
22.00
20.00
18.00
16.00
14.00
Util
isa
tion
(%)
01-D
ec-0
7
01-J
an-0
8
01-F
eb-0
8
01-M
ar-0
8
01-A
pr-0
8
01-M
ay-0
8
index
Utilisation – North American Consumer Services
30.00
25.00
20.00
15.00
10.00
0.00
Util
isa
tion
(%)
01-D
ec-0
7
01-J
an-0
8
01-F
eb-0
8
01-M
ar-0
8
01-A
pr-0
8
01-M
ay-0
8
index
Utilisation – North American Retailing
5.00
data s
�0
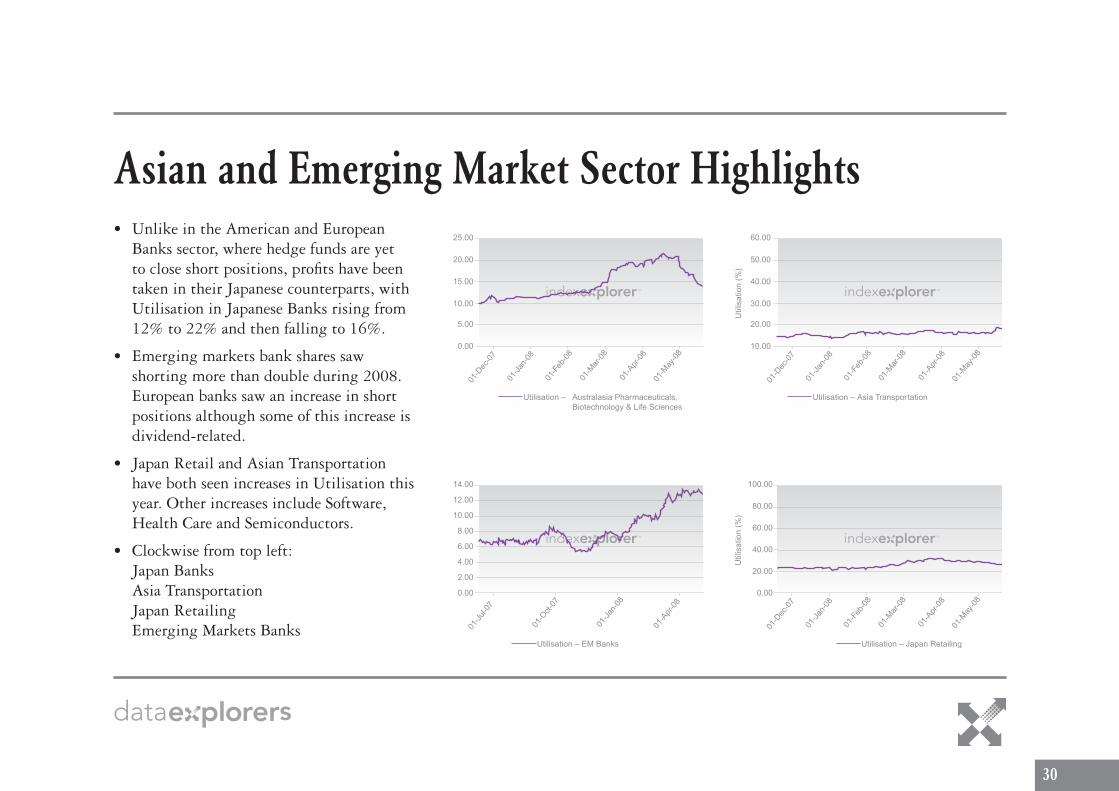
Asian and Emerging Market Sector Highlights• Unlike in the American and European
Banks sector, where hedge funds are yet to close short positions, profits have been taken in their Japanese counterparts, with Utilisation in Japanese Banks rising from 12% to 22% and then falling to 16%.
• Emerging markets bank shares saw shorting more than double during 2008. European banks saw an increase in short positions although some of this increase is dividend-related.
• Japan Retail and Asian Transportation have both seen increases in Utilisation this year. Other increases include Software, Health Care and Semiconductors.
• Clockwise from top left: Japan Banks Asia Transportation Japan Retailing Emerging Markets Banks
25.00
20.00
15.00
10.00
5.00
0.00
Util
isa
tion
(%)
01-D
ec-0
7
01-J
an-0
8
01-F
eb-0
8
01-M
ar-0
8
01-A
pr-0
8
01-M
ay-0
8
index
Utilisation – Australasia Pharmaceuticals,Biotechnology & Life Sciences
60.00
50.00
40.00
30.00
20.00
10.00
Util
isa
tion
(%)
01-D
ec-0
7
01-J
an-0
8
01-F
eb-0
8
01-M
ar-0
8
01-A
pr-0
8
01-M
ay-0
8
index
Utilisation – Asia Transportation
100.00
80.00
60.00
40.00
0.00
Util
isa
tion
(%)
01-D
ec-0
7
01-J
an-0
8
01-F
eb-0
8
01-M
ar-0
8
01-A
pr-0
8
01-M
ay-0
8
index
Utilisation – Japan Retailing
20.00
14.00
12.00
10.00
8.00
2.00
0.00
Util
isa
tion
(%)
01-J
ul-0
7
01-O
ct-0
7
01-J
an-0
8
01-A
pr-0
8
index
Utilisation – EM Banks
6.00
4.00
data s
��
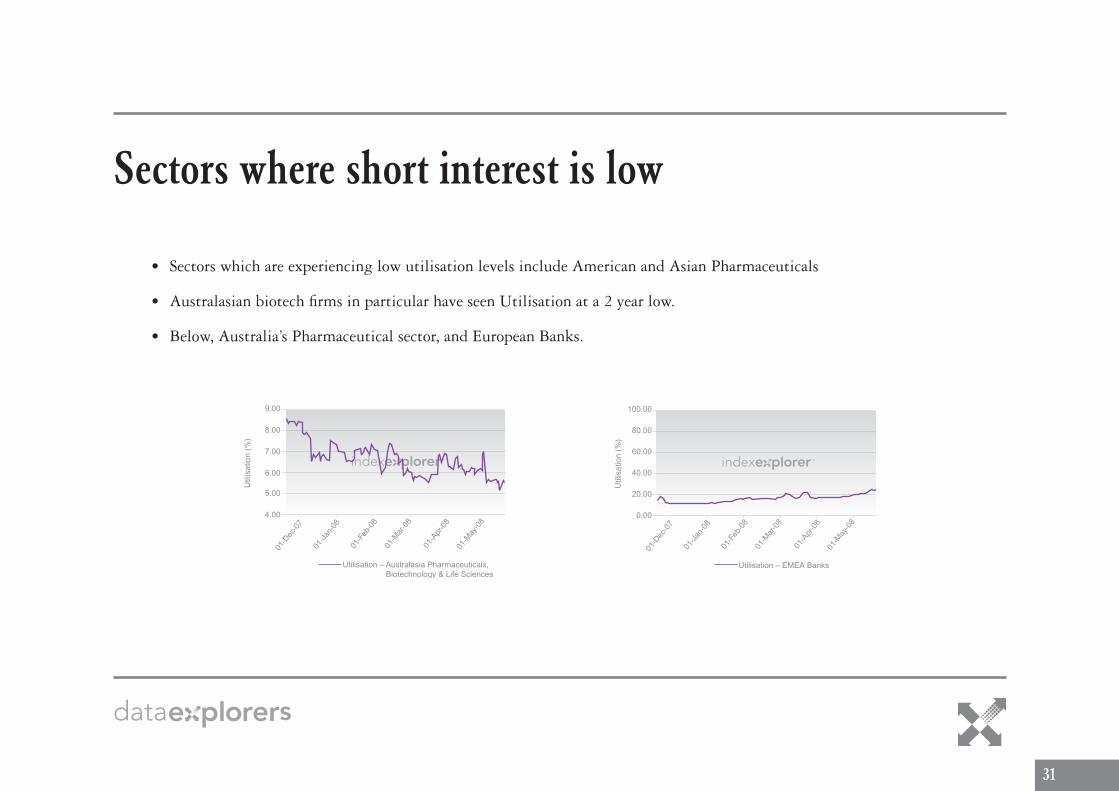
Sectors where short interest is low
• Sectors which are experiencing low utilisation levels include American and Asian Pharmaceuticals
• Australasian biotech firms in particular have seen Utilisation at a 2 year low.
• Below, Australia’s Pharmaceutical sector, and European Banks.
9.00
8.00
7.00
6.00
5.00
4.00
Util
isa
tion
(%)
01-D
ec-0
7
01-J
an-0
8
01-F
eb-0
8
01-M
ar-0
8
01-A
pr-0
8
01-M
ay-0
8
index
Utilisation – Australasia Pharmaceuticals,Biotechnology & Life Sciences
100.00
80.00
60.00
40.00
0.00
Util
isa
tion
(%)
01-D
ec-0
7
01-J
an-0
8
01-F
eb-0
8
01-M
ar-0
8
01-A
pr-0
8
01-M
ay-0
8
index
Utilisation – EMEA Banks
20.00

data s
�2
Asian and American Food, Beverage and Tobacco Sectors
• In North America and Europe, the Food & Staples Retailing sector saw a significant decrease in Utilisation, which is understandable given rising global food prices. Below, North America Food & Staples Retailing, Asia Food, Beverage & Tobacco.
• Asian Food, Beverage and Tobacco has seen a small rise in utilisation during the period, from 8% to 10%, in contrast with the US and Europe.
• Below, North America Food & Staples Retailing and Asia Food, Beverage & Tobacco
9.50
8.50
8.00
7.50
7.00
6.50
Util
isa
tion
(%)
01-D
ec-0
7
01-J
an-0
8
01-F
eb-0
8
01-M
ar-0
8
01-A
pr-0
8
01-M
ay-0
8
index
Utilisation – North America Food & Staples Retailing
9.00 16.00
14.00
12.00
10.00
8.00
6.00
Util
isa
tion
(%)
01-J
ul-0
7
01-O
ct-0
7
01-J
an-0
8
01-A
pr-0
8
index
Utilisation – Asia FoodBeverage & Tobacco
18.00
data s
��
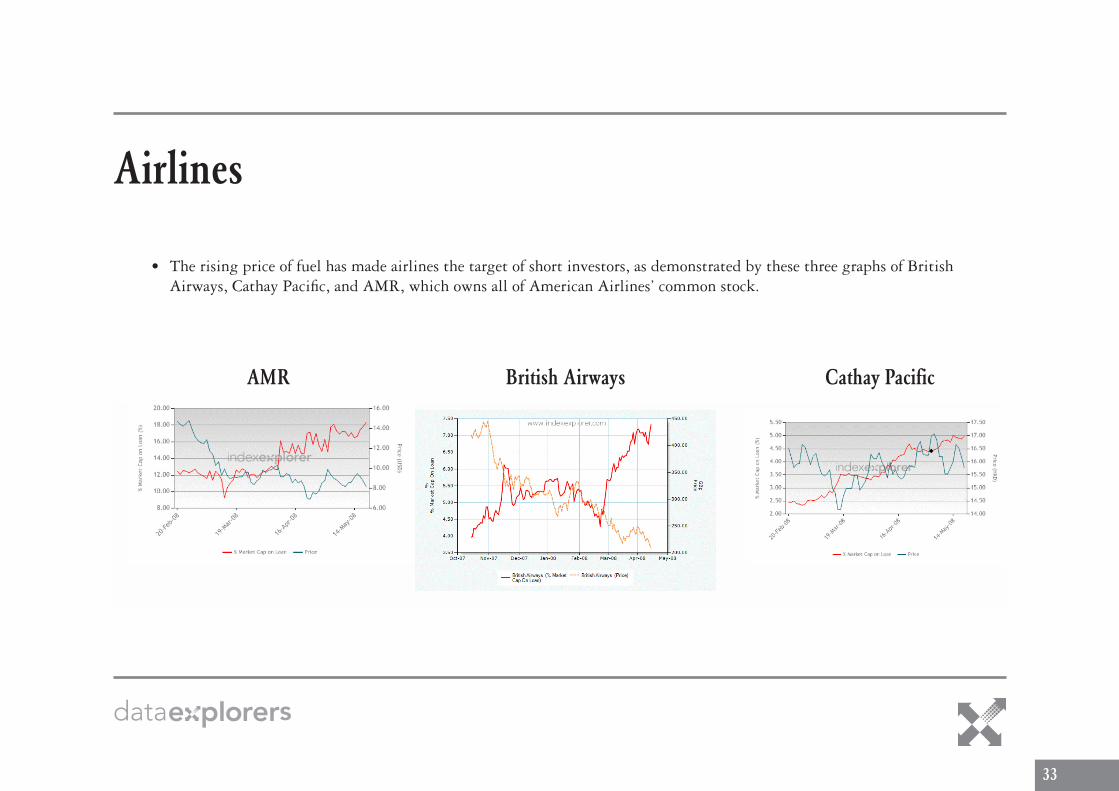
Airlines
• The rising price of fuel has made airlines the target of short investors, as demonstrated by these three graphs of British Airways, Cathay Pacific, and AMR, which owns all of American Airlines’ common stock.
AMR British Airways Cathay Pacific

data s
��
Best-Timed Shorts of 200�, six months on
Summary:
• When we produced our report entitled ‘Best-Timed Shorts of 2007’, we commented that ‘Many investors are still short of the securities listed in this document, as witnessed by high Utilisation* numbers.’
• We have revisited all of the stocks in this document and the highlights are as follows.
• Average price percentage fall between 2nd January 2008 and 12th June 2008 in the USA: -24.64%
• In Asia, the average change was -8.63% and in Europe, -25.41%.
• This does not include AHM and NRK which delisted. The worst performer in the US was Ambak which has fallen 92% so far this year. In Europe, Johnston Press was the worst performing stock while in Asia it was China Citic. Asia showed the greatest dispersion of results, while European and US results were much more closely grouped. Only one US stock rose during the period, namely Moodys.
• With regard to the Best-Timed Shorts of H1 2008, most of these stocks are still heavily utilised, so we will be watching their progress closely and will report on these in December 2008.

data s
��
Despite the fact that utilisation was high in most of the names which we selected in December 2007, many of these stocks continued to underperform during the first six months of 2008. The negative momentum behind many of these stocks and their sectors continued through H1 2008.
Performance Analysis of the Best-Timed Shorts of 200�
% Change in Share Price between 2nd January and 12th June 2008
USA
American Home Mortgage Delisted
D.R. Horton Inc. DHI -7.43
MBIA MBI -73.21
Moodys MDY 8.12
Liz Claiborne LIZ -20.17
Woolworths WLW -23.04
Sears Holdings SHLD -19.81
Ambac ABK -92.64
MGIC MTG -13.23
New York Times NYT -4.97
Bear Stearns BSC 0.00
Average % Change -24.64
% Change in Share Price between 2nd January and 12th June 2008
Europe
IKB Deutsche IKB -42.93
SportsDirect SPD -24.02
Johnston Press JPR -74.43
Fimalac FIM 1.95
Sacyr Vallehermoso SYV -22.48
Storebrand STB -20.00
Micronas Semiconductor MNAS -23.24
Ebro Puleva EVA 1.88
Northern Rock NRK n/a
Average % Change -25.41
% Change in Share Price between 2nd January and 12th June 2008
Asia
Sims Group SGM 37.46
Sumitomo Osaka Cement 5232 9.52
Techtronic Industries 0669 -10.05
Kokuyo 7984 1.80
James Hardie JHX -22.17
Casio 6952 3.03
Toto 5332 -10.15
Sega 6460 -26.64
China Citic 1998 -44.20
Sinofert 0297 -24.93
Average % Change -8.63

data s
��
• Many investors are still short of the securities listed in this document, as evidenced by high Utilisation* numbers.
• In many of these cases institutional investors were short long before the share price began to fall.
• *Utilisation is a proprietary calculation which refers to how much demand there is to borrow a stock.
For further information about Data Explorers, please call the Sales team on +44 (0) 20 7264 7600 or +1 212 710 2210, or Email: [email protected]
Disclaimer: The information and analysis in this document is provided for informational purposes only and is intended solely for institutional investors. Nothing herein should be interpreted as personalized investment advice. Under no circumstances does this information represent a recommendation to buy, sell or hold any security. None of the information in this document is guaranteed to be correct, and anything written here should be considered subject to independent verification. You, and you alone, are solely responsible for any investment decisions you make. Data Explorers Limited is not regulated by the Financial Services Authority (FSA).
Summary and Disclaimer


