118
NO 189 OCTOBER 1999 ,~ BIL\BHA ATOMIC RESEARCH CENTRE -+
NO189 OCTOBER 1999
,~
BIL\BHA ATOMIC RESEARCH CENTRE -+

2) Ac,~,)C,mmIC'ml,lnb"'U"'g,R'RC
3)
4)
5) 5,""',mb"

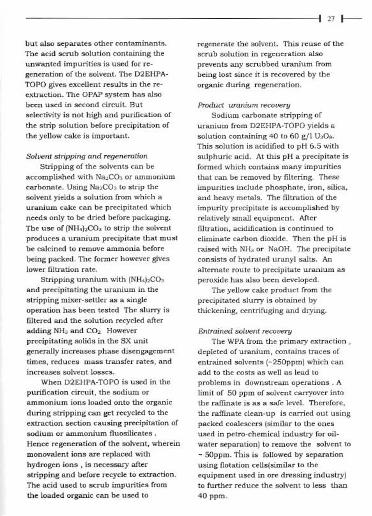
The Visionary
A Homage ....
The Department of Atomic Energy owes a great debt of gratitude to Dr Homi J
Bhabha whose foresight and vision were responsible for our country reaching an
enviable position on the world map of atomic energy. Within a decade of launching its
atomic energy programme in 1948, India became one of the first ten most advanced
countries in this new and complex technology.
India achieved the distinction of commissioning Asia's first research reactor
Apsara in 1956. This reactor was built with indigenous know-how excepting the fuel
elements.
(Conid )
and his vision come true

Today there are 10 nuclear power reactors in operation in India, which totally
produce about i800 MW(e) of power. Although it represents about 3% of the country's
total electrical power generation, work is on hand to increase it to about 10% by the
year 2020. With the advent of breeder reactors, nuclear power generation is bound to
increase significantly in the coming years.
Generating electricity is only one of the many applications of nuclear energy.
Radioisotopes produced by our nuclear reactors are widely used in medicine, industry,
hydrology, agriculture, healthcare, water resources development and management.
Dr Homi Bhabha was born on October 30,1909. His birthday every year is
observed ai'the Founders Day in BARe. On this occasion, the entirefraternity of DAE
family remembers with gratitude this great Son of india and a distinguished scientist.
This special issue of BARC Newsletter is being brought out as a homage to the
great visionary Dr Homi Bhabha, the architect and founder of india's atomic energy
programme,
This issue contains some of the research papers authored by BARC scientists and
engineers, and which have won awards on various occasions in the earlier years.
A few papers which won awards in 1999 are also included.
With a large number of papers to be checked and re-formatted within a tight
time-schedule, Mr Te. Balan and Mr P.A.S. Warriyar of Library & Information
Services Division had to literally work against time to bring out thepublication in time.
Q;..(Dr Vijai Kumar)
Head, Library & Information Services Division, Bhabha Atomic Research Centre
CHIEF EDITOR
Dr Vijai Kumar
MANAGING EDITOR
T.C. Balan
COMPUTER GRAPHICS" LA yocrr
PAS. Warriyar
Link up withscience!
Available at
URL:http://www.harc.ernet.in
BARC NEWSLETTERBARC Founder's DaySpecial Issue
October1999No. 189
BhabhaAtomicResearchCentre
CONTENTS
In-house advanced research in material damagemodellingB.K.DutlaHomi Bhabha Science &Technology Award,1997
22 Uranium recovery /Tom phosphoric acidHarvinderpal SinghHomi Bhabha Science & Technology Award,1997
29 Dual sites of electron solvation in
microheterogeneous media: a new observationHirendra Nath GhoshINSA Young Scientist Medal, 1998
39 BARCIS (BARC Channel Inspection System)ManjitSinghBARC Technical Excellence Award, 1997
Page20
CONTENTS (contd...)
50 Estimation of transient hydraulic load during Loss of Coolant Accident (LOCA)of a nuclear reactor
D. Mukhopadhyay, Salish K Gupta and V. VenkatRajDr Wille Memorial Award, 1998 (Best Paper at 1st International Conference onFluid Mechanics & Fluid Power)
62 Concentration of dilute sewage sludge slurry using EB crosslinked fast
response temperature sensitive poly (vinyl methyl ether) hydrogels. Sabharwal, Y.K Bhardwaj and A.B. MajaliBest Paper Award at International Conference on Applications ofRadiation and Radioisotopes in Industrial Development, 1998
66 Evaluation of locally manufactured polyester film (Garfilm-EM) as adosimeter in radiation processingR.M Bhat, UR. Kini and B.L. GuptaBest Paper Award at International Conference on Applications ofRadiation and Radioisotopes in Industrial Development, 1998
69 Characterisation and evaluation of airborne dust associated with mining
operationD.K GhoshBritannia Award, 1998 (International Conference on Occupational Health)
75 Measurement traceability in brachytherapyKN. Govinda Rajan et aI.Best Paper Award at International Conference on Medical Physics, 1998
77 Proposed quality assurance protocol for mammography X-ray systemKanta Chhokra et 01.Best Paper Award at International Conference on Medical Physics, 1998
Page51
Page35
CONTENTS (contd...)
79 Tritium in Water Monitor for measurement oftritinm activity in the
process waterM Ralhnakaran et al.Best Paper Award at 24th IARP Annual Conference, 1999
86 Nondestructive characterisation ofMOX fnel rods nsing Gamma
Antoradiography (GAR)J.P. Panakkal etal.Best Technical Paper in R&O Award, 1998 (published in Journal ofNondestructive Evaluation)
90 Observation of double pnlsing in a single mode TEA CO, laser cansed bythe effect of mode pulling and pnshingJ. Padma Nilaya and Dhruba J. BiswasSecond Best Presentation Award at XVII Young Physicists Colloquium, 1999
95 Elemental analysis of gel grown rare earth crystals by energy dispersive
X-ray flnorescenceDaisy Joseph, Madnn Lal and P.K. PalraBest Presentation Award at vf' National Seminar on X-ray Spectrometry andAllied Areas, 1997
98 Development of Bedside Vaso-screen at BARCShwela Joshi et al.Second Best Student Paper Award at Conference on BiomedicalEngineering, 1999
103 Thermal investigations on N,N'dihexyl octanamide complex of
uranyl nitrateP.B. Ruikar et al.Third Prize at 11th National Symposium on Thermal Analysis, 1998
107 Detection of blister formation and evalnation ofpressnre tube / calandria
tube contact location by nltrasonic velocity ratio measurement techniqueJ.L. Singh et aI.Best Paper Award at 14th World Conference on NOT, 1996

J ] I--
In-house advanced research in material
damage modelling
B.K.Dutta
Reactor Safety DivisionBhabha Atomic Research Centre
Introduction
THE SAFETY OF A PLANTIS A STRONG
function of the integrity of its
structural components. Beside normal
operating loads, the structural
components experience a significant
increase in loading under anomalous
scenarios, such as, plant accidents,
seismic events, explosions, etc. The
structural designers identify the loading
histories corresponding to each case to be
considered under design specifications.
The combinations of loading histories are
recommended many times as a part of
design specifications. The design is
generally carried out using design codes,
e.g., ASME Boiler & Pressure VesselCodes. Some of the limitations of such
codal design are that it is not possible to
i. Exactly quantify the inherent factor of
safety available from the point of
complete failure of the structuralmaterial.
ii. Ascertain integrity of pressure
boundary under large scale loadingand deformations.
iil. Know the mechanical response of a
component under the presence of
defects of various types subjected to
normal operating and accidentalloads.
To overcome some of the above
limitations, it is necessary to understand
the mechanism of material damage under
extreme loading scenario and also under
the presence of flaws. In the subsequent
sections, in.house work carried out in the
area of material damage modelling is
described.
Material damage modelling duringductile fracture
The general theory of elastic-plastic
analysis is based on the theory of material
incompressibility during plasticdeformations. It means total volume of the
material remains constant during the
yielding process. Mathematically this is
expressed as the sum of the incremental
plastic strains in all the three coordinate
directions is zero. However, experimental
evidences show that such theory is invalid
during large-scale damage of the material
leading to ductile fracture. The following
are the four stages during such
phenomena.
i. The initiation of a large number of
voids in the material during initial
phase of the damage. Such initiations
occur either from the existing micro
voids or from the cracking/matrix-
detachment of the secondary
particles. Such process of void

initiation tends to get saturated aftersome amount of material damage.
ii. The next phase is the growth of voidsup to a critical value till the adjoiningvoids become too close.
iii. The third stage is the coalescence ofadjoining voids. This stage leads tothe formation of macro voids, whichhave a tendency to grow rapidly.
iv. The fourth and the last stage is thefracture of material when the size ofmacro voids reaches a critical value.
121--
There are number of constitutivemodels available in the literature toaddress such mechanism. One of thesemodels is due to Gurson. The modified
version of this model is popularly knownas Gurson-Tvergaard-Needleman model.Based on the work of Berg (which showsthat a porous medium is governed by thenormality rule), Gurson derivedapproximate yield functions for materialscontaining either cylindrical or sphericalvoids. For the case of spherical voids withvoid volume fraction T, the yield function<j>is given by:
1...a",UMJ)= U;, +2f.q,cosJq2a:}_~+q,(r'r}=o
UM "2u"
where u.. =(f.s..s.)~ is the macroscopic
effective stress and s.=u,_!u"o,3represents the stress deviator. The actualmicroscopic (defect free) stress state in thematrix material is represented by an
equivalent flow stress 'u M '. The above
yield function reduces to von-mises flowcriterion for I' equals to zero. The functionI' is given byl':f
: f,+f=~{f-fJThe second form of I' is introduced to
artificially model rapid increase in voidvolume fraction after void coalescence.
The constant q" qz and q3are adjusted tohave better agreement with theexperimental values.
forf< L
forf~L
The increase in void volume fraction I'consists of the nucleation of new voids
and the growth of existing voids. Hence
I' ~ 1'"",.""," + I' grow'"
The increase in void fraction due to
growth can be calculated by using plasticincompressibility condition of the matrixmaterial. This is given by
1' ",=(I-f)6PlPij
where 6ijis the kronecker delta function
and ~'ij is the plastic strain tensor. Forcalculating the void growth due tonucleation, an empirical relation wasproposed by Needleman and Rice. This isgiven by
r""oI~<i""-Acr'M+l/3Bo'kk
where O'Mis the actual flow stress of the
matrix material and O'kkis the fiTst stressinvariant. Due to the interaction effectsbetween particles and the scatter in the

131--
size, shape and spacing of the particles,statistical distributions were used todescribe the nucleation of voids. Chu and
Needleman[8] proposed a normaldistribution for the rate of void nucleation
where A and B are as given below.Assuming that nucleation only depends
on the stress transmitted across theparticle-matrix interface, there exists a
mean critical stress for nucleation, 'aN'
and the nucleation stress is normallydistributed.. For stress controlled nucleation,
[ [
I,
]
'
]
I 1 1: I aM +-a, -aNA~B~ --- L-exp -- 3
(E, E)SNay.J2" 2 sHay
Here fNis the volume fraction of void
nucleating particles, cryis the yield stressof the matrix material and SNis standarddeviation of stress over which most of the
voids nucleate. It is important to note thatthis criterion which is derived on the basisof a critical stress at the interface of the
particle is a function of the plastic strainin the materiai as the stress is producedby local work hardening. So this failurecriterion refers fundamentally to strain.Therefore a similar idealization can be
made for the mean equivalent plastic
strain 'eN' at which nucleation occurs.
For strain controlled nucleation,
A=(L.! )~eJ _l(e:, -eN )'
]
; B=O
E, E SN,J2" "1 2 SN
where SNis standard deviation of the
mean equivalent plastic strain and e;, is
equivalent plastic strain of the matrixmaterial.
By decomposing stresses intohydrostatic and deviatoric parts andplastic strain increment into volumetricand deviatoric parts, one may write thefollowing relations
a~, ~-P_,I +S... ~-p.J +~qn..,3
l1e' ~ l1e: + l1eJ,
Here 'P' is the first stress invariant, 'q'isthe second stress invariant, 'n..,' is theunit vector in the deviatoric space normalto the yield surface, S is the deviatoricstress, "".1'and ""DPare the volumetricand deviatoric parts of plastic strainincrement respectively. A formula forexplicitly calculating the consistenttangent moduli for mid-point algorithmshas been given by Zhang. We haveimplemented this algorithm in our codeand it has been used to solve the
problems with Euler's backwardalgorithm. This method does notencounter convergence difficultY when thevoid volume fraction at a gauss pointexperiences complete damage. Anothersignificant advantage of this methodologyis that no matrix inversion is required toobtain consistent tangent moduliexpression. The explicit expression ofconsistent tangent moduli at the end ofthe solution step t." is based on Zhang'sseven constant formula. This is given as:
I 4 I---
DW"""", =(aa
) =doJ+dJ0/+n"a 0 (d,n"a +d3n"J+d,nMa 0/+ali "I
10 (d,n'M + d,n,>J
where the seven constants are given by:
do- 2G ,dl=K-~-3K'Dn,d2=-d;q"aD",d3=-d;qMaD231+3Gm'.liqlq, 3 q, q,
d, =-3doKD2I qMa ,d, =-doKDI2,d, =-dOKD13q,
Here 'G' is the shear modulus of elasticity,
'/(' is the bulk modulus, "'.q'is deviatoric
part of strain increment, Dn, DI2, Dn,
DOl, D", and D23 are constants.An in-house finite element based code
MADAM (MAterial DAmage Modeling) has
been developed based on the above
principles of continuum damage
mechanics [1-2J. The code has the abilityto solve both two and three-dimensional
structures. The geometric non-linearity is
considered by using the updated
Lagrangian formulation. The deformation
and rotation in elastic-plastic analysis is
considered by transforming the computed
cauchy stress to Jaumann stress rate
using the corresponding spin rate tensor.
The frontal solution technique is used for
solving linear set of simultaneous
equations. The load-deformation
equilibrium conditions are obtained by
using Modified-Riles Algorithm. An elementin the finite element model is considered
damaged when the void volume fractions
at its gauss points reach the experimental
void volume fraction at rupture. For
integrating the elastic-plastic constitutive
equation with the pressure dependent
Gurson-Tvergaard yield model, the
generalised mid-point algorithm
formulated by Zhang has been used.
The code has been tested analyzing
number of tensile, C-T and other fracture
specimens. This code has recently beenused in an international round robin
exercise on 'Round Robin on Micro-
Mechanical Models, Phase 11,Task A',
conducted by European Structural
Integrity Society. As a part of this
exercise, tensile and C-T specimens of two
German materials were analyzed to obtain
load-displacement and J-R curves. The
computed values showed excellent
agreement with the experimental data.
Fig. 1 shows the load-displacement data
of two grooved (r~4mm and r~10mm)
tensile specimens up to the point of
complete rupture for a German material
designated as DIN StE 460. The load-
displacement and J-R curves of aCT
specimen of the same material are shown
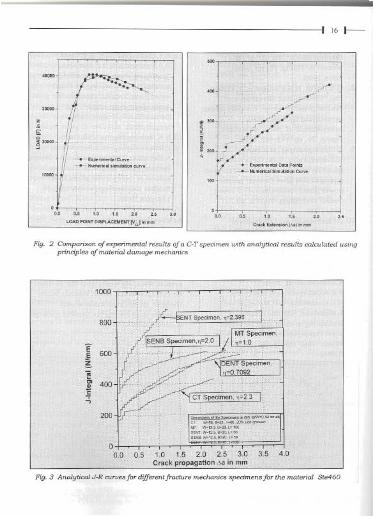
in Fig.2. A comparison between computed
J-R curves of various fracture specimens
is shown in Fig.3. The effect of stress
triaxiality on J-R curve is demonstrated in
this figure.
Analysis of cleavage fracture ofreactor structural material
The mechanism of a cleavage fracturein reactor structural material is
significantly different from ductile
151---
fracture. The cleavage fracture in a
material usually originates from the
micro-cracks, which are formed by
different mechanisms. The micro-cracks
are formed due to an inhomogeneous
distribution of plastic deformation within
the grains, called slip-initiated cleavage.
In mild steels, the cracked grain boundary
carbides also originate the micro-cracks.This occurs when the stress normal to the
planes of carbide particles is sufficiently
high. Based on'the weakest link
assumption and Weibul/ statistics,
Beremin developed a model for analysing
brittle fracture process by local approach.
The two parameters of the model are
material properties and can be determinedfrom notched tensile tests at low
temperatures and their finite element
analysis. Once these parameters are
determined, these can be used to predict
probability of cleavage fracture initiation
in a component. The fracture probabilityof the entire structure follows a two-
parameter distribution function given by
PkJ~I-expH~n
where Go is the scaling parameter to
describe the point of distribution function
on the stress axis at In(lf(I-Pr))=O. This
gives PFO.632, i.e. 63,2 % failure
probability. The 'm' is the Weibull
exponent or Weibull modulus or the shape
parameter which describes the scatter of
the distribution. The Weibull stress, Gw, is
derIDed as follows by a summation of the
maximum principal stresses Gr,
u w = f (u ,rn)" ~,., Vo
Since plastic deformations are a
prerequisite for cleavage fracture, the
summation is taken over the plastically
deformed part of the volume only. Hence,
npl is the number of elements experienced
plastic deformations. The Weibull
parameter Go depends on the choice ofreference volume Vo.
The values of 'm' and 00 are generally
determined using Maximum Likelihood
Method. In this approach, the values of
the two parameters are adjusted suchthat there is 'most likely' representation of
experimental data by Weibull function.The maximum likelihood function is the
product of all fracture probabilities of
experimental data. This is given by
F, = fV(Uw,)This function is maximised to obtain
Weibull parameters. This is done equating
the partial derivatives of Fe with respect to
'In' and Go to zero. One obtains the
following two equations by this exercise.
u, =~~tk.r
N N N (-+ ''In (u )- ,
2.: uw.J"In (u )m L., w N ,-I w,
",' tk.r ~ 0
These two nonlinear equations are
solved iteratively to obtain the values of
'In' and 00. A post-processor has been
developed to calculate Weibull parameters
based on above theory [31. The inputs to
the processor are the experimental and
finite element analysis data and outputs
are the Weibull parameters. As a part of
Intemational round robin exercise,
conducted by ESIS, we have used this
I 6 I--
post-processor to calculate Weibull
parameters for number of cases. Thenotched tensile tests at -isoac were
carried out at GKSS 1nstitutefor Motenol
Research, Germany. The data were
available. to us as a part of this round
robin exercise. Thirty-two numbers of
specimens were tested in all. The
specimens were machined from a forged
ring segment. The specimens were
subjected to a quasi-static displacement
controlled loading in axial direction. The
loading rate was O.2mm/min. All
specimens failed by unstable fracture and
the fracture surfaces show pure cleavage
facets. The load vis reduction in diameter
I"DI curves of the specimens up to the
point of fracture were made available. The
notched tensile specimens were
numerically analysed in order to
determine the two critical parameters for
cleavage fracture at low temperature. The
finite element analyses of all the tensile
specimens were done using an in-house
code THESIS. Eight-noded iso-parametric
quadratic elements with reduced order
integration were used in the analysis.
Loading is applied as homogeneously
prescribed displacements in axial
direction at the top edge of the model. A
large strain analysis based on updated
Lagrangian formulation is used in the
code. The task was divided into two parts.
Part-] is concemed with the application ofBeremin's model to a set of seven
numbers of specimens taken out of a
limited region of the material block and
which show a nearly identical load
deformation behaviour up to their
respective fracture points. Hence, these
specimens were analysed using one
representative true stress-strain curve.
The specimens were ranked separately
according to both the load as well as "D
at fracture points. The Weibull parameters
were then calculated using the above post
processor. The values of the parameters
were m=68.15 and ,,"=1859.98 MPa when
diameti-al contraction was taken as
ranking parameter. The same values were
m=48.0, ,,"=1975.0 MPa in case ofload at
fracture was taken as ranking parameter.
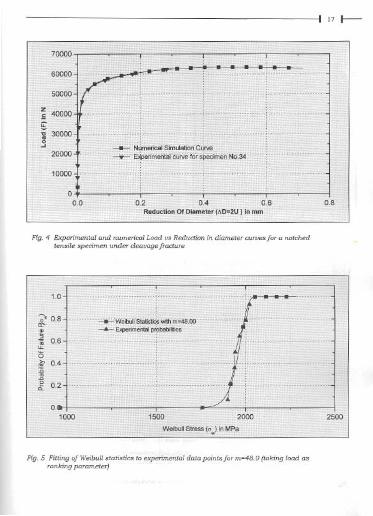
Fig. 4 shows a comparison between
experimental and numericalload-"D
curves. Fig.S shows a comparison of
probability of failure between
experimental and numerical values for'm'=48.0.
Part-II deals with the entire set of
experimental results (32 specimens). All
the specimens were analysed separately
with separate stress-strain data in orderto match the numericalload-"D curves
with experimental ones. In this case the
computed Weibull parameters were
m=18.15 and ,,"=2875.5 MPa.
Two parameter characterisation of
the crack tip
Crack initiation and stable crack
growth in a ductile material are usually
described by J-R curves obtained from
standard fracture specimens. Such theory
is based on that a single parameter IJ-
integral) can be used to characterize the
crack tip and a single fracture resistance
curve is sufficient to characterize the
material. However, there is growingevidence to show that J-Rcurves are
geometry dependent. Therefore, the
transferability of specimen J-Rcurve to
component level is an unresolved issue,
which is currently receiving a lot of
attention among structural researchers.
The influence of crack tip constraint or
stress triaxiality on ductile fracture
emphasized recently in explaining the
geometry dependent fracture resistance of

171--
specimens and structures to ductile
tearing.
In most cases, standard ASTM
specimens maintain high constraint even
up to high load levels. The ASTM
standards require sufficient thickness of
the specimen to ensure predomillantly
plane strain conditions at the crack tip
and a crack depth of at least half of the
specimen width. Within certain limits on
load level and crack growth, these
restrictions ensure the existence of highconstraint conditions for fracture as
described by the HRR field equation and
satisfy the validity of single parameter
characterization. However, real structures
may be low constraint geometries. This
difference between crack tip constraint
between specimens and structures
indicates that structures can often carry
greater loads without failure than
predicted using fracture toughness values
measured from high constraint
specimens. This introduces a high degree
of conservatism into the design. On the
other hand, the application of toughness
data from low constraint specimen
geometry to structural applications with
high constraint crack geometry makes the
design unsafe.
Although there is no doubt that the
resistance against ductile tearing depends
on the crack tip constraint, the issue stillto be addressed is how to define and
quantify this parameter. Differentdefinitions and measures are in use and
the two parameter fracture mechanics has
emerged as the most acceptable theory.
Most of these approaches involve the
introduction of a second parameter to
characterize the crack tip constraintconditions.
THEORY-lOne of the theories utilizes the
elastic T-stress as the second parameter
for predicting fracture. This J-T approach
has limited use in the elastic-plastic
region as it is based on elasticity theory.
THEORY-II A physically significant
definition of the triaxiality of the stress-
state resulting from a crack tip constraint
is given by the triaxiality factor (hi. Thisis defined as the ratio of hydrostatic stress
(Oh) to the von-Mises stress (0,). Hence h ~
Om / 0,. If 0" 02 & 03 are the three
principal stresses then
Om ~ (0' + 02 + 03 I / 3.0 and
0, ~ [(0' - 02)2+(02- 03)2+(03 - 0,)21'12/~2.
The physical meaning of this ratio was
that the growth rate of cavities in perfectly
plastic material is mainly influenced by
'11'. High constraint is associated with the
high value of '11'. It was found that the
slopes of the J-R curve decreases with the
increase in stress triaxiality.
THEORY-lIl The stress triaxiality or crack
tip constraint can also be quantified by
the multiaxiality quotient 'q'. This is
defined as q"~3 0010. Low 'q'value
signifies according to this definition for a
high degree of stress triaxiality. This
quotient can be determined from finite
element calculations for specimen and
component. A Comparison of the 'q'
values helps to assess the similaritybetween the fracture characteristics of a
specimen and component.
THEORY-IV Another theory introduces aparameter 'Q' to quantify the crack tipconstraint. As per this theory, thelaboratory specimen must match theconstraint of the component i.e. twogeometries must have the same Q-value atfailure in order to have the same fractureresistance. The non-dimensional
parameter, 'Q' is defined as,
181---
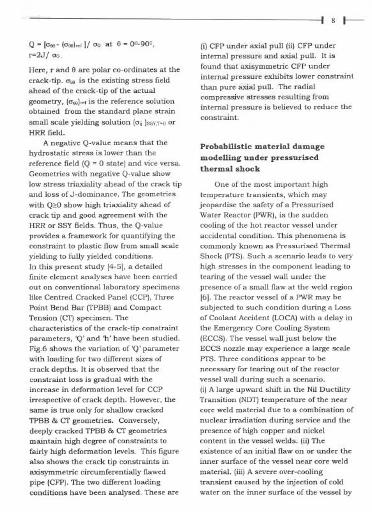
Q=[aoo-(aOO)~fJ/aO at e~Oo-900,r~2J/ ao.
Here, r and e are polar co-ordinates at the
crack-tip. aoo is the existing stress field
ahead of the crack-tip of the actual
geometry, laOO)~fis the reference solutionobtailled from the standard plane strain
small scale yielding solution (aij )"'.ToO orHRR field.
A negative Q-value means that the
hydrostatic stress is lower than the
reference field (Q ~ 0 state) and vice versa.Geometries with negative Q-value show
low stress triaxiality ahead of the crack tip
and loss of J-dominance. The geometries
with Q>O show high triaxiality ahead of
crack tip and good agreement with the
HRR or SSY fields. Thus, the Q-value
provides a framework for quantifying the
constraint to plastic flow from small scale
yielding to fully yielded conditions.
In this present study [4-5J, a detailed
finite element analyses have been carried
out on conventional laboratory specimens
like Centred Cracked Panel (CCP), Three
Point Bend Bar (TPBB) and Compact
Tension (CT) specimen. The
characteristics of the crack-tip constraint
parameters, 'Q' and 'h' have been studied.
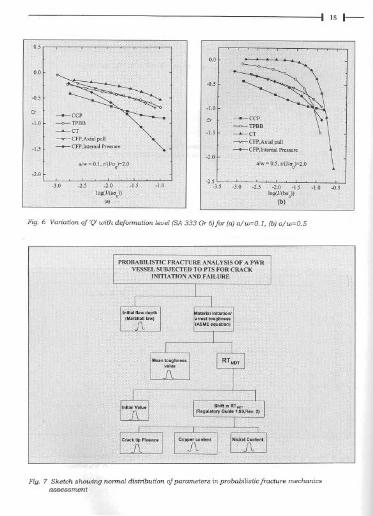
Fig.6 shows the variation of 'Q' parameter
with loading for two different sizes of
crack depths. It is observed that the
constraint loss is gradual with the
increase in deformation level for CCP
irrespective of crack depth. However, the
same is true only for shallow cracked
TPBB & CT geometries. Conversely,
deeply cracked TPBB & CT geometries
maintain high degree of constraints to
fairly high deformation levels. This figure
also shows the crack tip constraints in
axisymmetric circumferentially flawed
pipe ICFP). The two different loading
conditions have been analysed. These are
Ii) CFP under axial pull (ii) CFP under
internal pressure and axial pull. It is
found that axisymmetric CFP under
internal pressure exhibits lower constraint
than pure axial pull. The radial
compressive stresses resulting from
internal pressure is believed to reduce thecc>nstraint.
Probabilistic material damagemodelling under pressurisedthermal shock
One of the most important high
temperature transients, which may
jeopardise the safety of a Pressurised
Water Reactor (PWR), is the sudden
cooling of the hot reactor vessel under
accidental condition. This phenomena is
commonly known as Pressurised Thermal
Shock IPTS). Such a scenario leads to very
high stresses in the component leading to
tearing of the vessel wall under the
presence of a small flaw at the weld region
[6J. The reactor vessel of a PWR may be
subjected to such condition during a Loss
of Coolant Accident (LOCA) with a delay in
the Emergency Core Cooling System
IECCS). The vessel wall just below the
ECCS nozzle may experience a large scale
PTS. Three conditions appear to be
necessary for tearing out of the reactor
vessel wall during such a scenario.
(i) A large upward shift i.n the Nil Ductility
Transition (NDT) temperature of the nearcore weld material due to a combination of
nuclear irradiation during service and the
presence of high copper and nickel
content in the vessel welds. Iii) Theexistence of an initial flaw on or under the
inner surface of the vessel near core weld
material. (iii) A severe over-cooling
transient caused by the injection of cold
water on the inner surface of the vessel by

191--
the activation of the emergency core
cooling system during LOCA.
lt should be recognised that, while LOCAs
have occurred during reactor operation
(e.g. Three Mile Island II), no catastrophic
fractures of nuclear reactor pressure
vessels have been experienced as all thesethree conditions did not occur
simultaneously. Nevertheless, such
analyses are very important to
demonstrate the vessel integrity under
severe abnormal conditions, thus
confirming the avoidance of large scalecore melt down and release of radioactive
materials in public domain. A
conservative set of material properties to
guard the pressure vessel under such a
scenario has been provided in the
regulatory guide, i.e., ASME, Boiler and
Pressure Vessel Code. However, research
work in different parts of the world is
being conducted to acquire better insight
into this problem.
The pressure vessels used in nuclear
industry are exposed to additional
hazards due to neutron irradiation. In an
operational reactor, the pressure vessel
material undergoes neutron
embrittlement. Due to this, the toughnessof the material decreases. This is further
compounded by the increase in the nil
ductility transition temperature (NOT) ofthe material. Both these factors contribute
to the reduction in safety margin againstbrittle failure of the structural material. It
is necessary to examine whether such a
reduction in safety margin compounded
with the sudden cooling due to a LOCA
followed by injection of cold water may
cause a failure of the pressure vessel,
especially in the presence of a flaw. A
fracture mechanics based integrity
analysis keeping in view of the degradedfracture resistance of the embrittled vessel
is required to ensure safety.
The deterministic analysis [7] makes
use of a number of inputs, which have
certain degrees of uncertainties. Theultimate conclusions drawn from the
deterministic analysis may be affected by
these uncertainties. Hence it is necessary
to calculate the probabilities of occurrence
of different events during a PTS scenario.
A crack in the high tensile stress zone
under such pressurised thermal shock
scenario may experience three different
states depending upon the initial size of
the crack, material properties and severityof the thermal shock. In the first case the
propagation of the crack may not initiate
throughout the transient. The second
state pertains to the initiation followed by
arrest after some penetration of the vessel
thickness. In the third state, the
propagation after initiation is not arrested
and leads to the complete penetration of
the vessel thickness. The objective of the
probabilistics analysis is to compute the
conditional probability of crack initiation
and the probability of reactor vessel
failure considering uncertainties in
various inputs.
To calculate probabilities of crack
initiation and vessel failure, one has to
first carry out the deterministic fracture
mechanics analysis of number of cracks
having different initial crack lengths for
the entire thermal transient history. Such
analysis can be done either by using
influence technique or by using detailed
finite element technique. Outputs ofsuch
analysis are the variation of the crack tip
temperature and the crack tip stress
intensity factor (SIF) with time of the
thermal transient. A large number of such
tables are generated by varying the initial
crack length and serve as input data base
for the probabilistic analysis code. In the
probabilistic calculations, first an initialcrack is assumed on the inner surface of
1101--
the vessel. The size of the crack is decided
by using a cumulative distribution
function. The possibility of crack
propagation during the entire period ofthermal transient is then checked. The
deterministically calculated applied SIF
and crack tip temperature are used for
this purpose. The material toughness (K-
Ie) is calculated depending upon the crack
tip temperature and reference nil ductility
temperature transient (RT'DT). The RT,oT
in turn depends upon the copper content,nickel content and fluence level. These
parameters at the crack tip may be
simulated from a normal (Gaussian)distribution with a mean value and
standard deviation as shown in Fig. 7. If
the applied SIF is found to be less than
K,c , the crack is assumed to be stable in
the present time step and one may
proceed for the next time step of the
therm'aI transient. In case applied SIF is
found to be more than the K,C, the crack
is assumed to propagate during the
present time step. The size of the crack is
incremented by a small length and
fracture arrest toughness (K,") is
calculated based on probabilistically
simulated RT'DT, If the K,o is more than
the applied SIF, the crack is arrested and
one may proceed for the next time step. In
case K,o is less than the applied SIF, the
crack length is further incremented in the
present time step and rechecked for the
crack arrest. Such procedure is repeated
for the entire time history. At the end of
the time history, the state of the crack interms of no-initiation, initiation with
arrest or propagation throughout thevessel thickness is noted. This
methodology is repeated for a large
number of simulated initial crack-length.
The conditional probability of crack
initiation is estimated by dividing the
number of cracks that experienced
initiation by the total number of cracks
simulated. Similarly, the conditional
probability of vessel failure is calculated
by dividing the number of cracks that
penetrated the entire thickness of the
vessel by the total number of cracks
simulated. The probabilities areconditional in the sense that the transient
is assumed to occur.
As a part of the participation in an
International Assessment Study, a
computer code 'PARISH' (!)-obabilistic
~ssessment of Beactor integrity under
thermal SHock) has been developed
based on the above methodology. The
code makes use of the Monte Carlo
technique to calculate the probabilities of
crack initiation and vessel failure. A large
number of initial cracks of different length
are simulated during each failure
assessment. The final probability is
calculated dividing the number of cracks
that experience an event by the totalnumber of cracks simulated. Some of the
salient features of this code are as follows.
Simulation o/Initial Flaw Depth: It has
been observed that the accuracy with
which the conditional probability ofinitiation and failure are calculated,
depend somewhat on the number of
discrete points used to describe the initial
flaw depth distribution function. However,
the results of the analyses showed no
appreciable difference in the probability
values beyond 15 values of discrete initial
flaw depths. Hence. in the present code 15
discrete initial flaw depths are used to
describe initial flaw depth distribution.The flaws are assumed to lie on the inner
two inches of the vessel wall according to
the MARSHALL flaw depth cumulative
distribution function given by
CDF(a) = 1.0 - exp(-4.06 a). Here, a is the
flaw depth (inches) and CDF(a) is the
1111--
cumulative distribution function. A
random number varying between 0 to I is
generated. If value of the number lies
between CDF(a) and CDF(a+"a), then
initialllaw depth is assumed to be 'a'.
Fracture Initiation Toughness (Klc I: The
ASME curve of Klc is used to calculate the
material fracture initiation toughness.
However, the ASME curve is
conservatively defined as 70% of the
experimentally determined (Klc)m~". Hence
(K,c)me"" is calculated by (KlC)m~" = 1.43 X
ASME K,c The probabilistic variation of
(K,c)me." at the crack tip is considered by
using the expression K,c = err(K,c) X
(Klc)m~"' The err(K,c) is sampled from a
Gaussian (normal) distribution that has amean value of 1 and a standard deviation
of 0.15. The value is truncated at IJ".
Therefore, err(Klc) varies between 0.55and 1.45. This value is simulated at each
new crack tip position.
Fracture Arrest Toughness (k,o I : The
ASME curve of K," is used to calculate the
material fracture arrest toughness.
However, the ASME curve is
conservatively defined as 70% of the
experimentally determined (K'.)m,""
Hence, (K'")m~" is calculated by (K'.)m,""
= 1.43 X ASME K,.. The probabilistic
variation of (K")m~" at the crack tip is
considered by K,. = err(K,,) X (K")m,"". The
err(KI') is sampled from a Gaussian
(normal) distribution that has a meanvalue of 1 and a standard deviation of
0.15. The value is truncated at IJ".
Therefore, err(Kh) varies between 0.55 and
1.45. This value is simulated at each new
crack tip position.
Computation of RTNDT: The simulated
value of RTNoT is given by
RTNOT' RTNOTO+" RTNoT + err(RTNDT) X
~ [ ("RTNDTO)'+ (",RTNDTO)'J.
Here RTNDTOis the mean value of
unirradiated RTNDT."RTNoT is the increase
in RTNDT due to irradiation induced
embrittlement. This value is a function of
copper, nickel and the neutron lluence at
the crack tip. Procedure to calculate
"RTNDT is taken from Regulatory Guide
1.99, Revision 2. This is described in the
following subsection. The """NOTOis thestandard deviation for the mean value of
RTNDTOand ",RTNeTOis the standard
deviation for the correction used to predict
"RTNDT. The err(RTNDT) is sampled from a
Gaussian distribution with a mean value
of zero and a standard deviation of one
and is truncated at t3m . This value is
simulated once per vessel. It may be noted
here that due to independency of """NOTO
and "RTNDT,these values are combined as
the square root of their sum.
Procedure to calculate ,jRTNDT from
Regulatory Guide 1.99,Rev. 2: As
explained above the computation of the
RTNDTrequires the increase in RTNDTdueto irradiation induced embrittlement. This
value is calculated using the Regulatory
Guide 1.99, Rev.2. The increas~ in RTNDl'
is expressed as
"RTNDT=C,X<I>c,D.".I"".,,/IOOI
Here <1>,is the neutron lluence at the tip ofthe crack. The coefficient C, depends uponthe percentage of copper and nickel at thecrack tip.
Simulation of neutronjluence: Neutronlluence at the vessel inner surface <1>,issimulated from a normal distribution withmean values from 0.3 to 3.5 X 10"
neutrons / cm'. The value of onestandard deviation is equal to 30% of therespective mean value. The simulatedvalue of <1>,must lie in the range 0.0 to10 X 10". The lluence attenuation at the
I 12 r--
tip of the crack is calculated by <1>,= <1>,X
exp(-0.24a). Here 'a' is the length of thecrack.
Simulation of Copper: Copper is simulated
at the tip of the crack from a normaldistribution with a mean value of 0.3%.
The value of one standard deviation is
equal to 0.025%. The simulated value of
copper must lie in the range 0.0 5 Cu 5
0.40.
Simulation of NieMI: Nickel is simulated
at the tip of the crack from a normaldistribution with a mean value of 0.75%.
The value of one standard deviation
is equal to 0.1%. The simulated value
of nickel must lie in the range
0.0 ,; Ni 5 1.20.
The code 'PARISH is written using
FORTRAN-90 and is commissioned on PC
as well as on DEC-ALPHA computers 18].
The code is thoroughly tested against the
benchmark cases reported from literature.
Reactor Safety Division of BARC recently
participated in a International Round
Robin exercise PTS-ICAS conducted by
GRS (Germany). As a part of this exercisethe code 'PARISH' was used for
probabilistic assessment of a pressure
vessel subjected to PTS. There were four
cases in this study. These are designatedas PFM-I to PFM-4. The cases are as
follows.
PFM-I: Axial Crack Experiencing a
Simplified Thermal Transient.PFM-2 :Circumferential Crack
Experiencing the transient ofPFM-1.
PFM-3 : Axial Crack Experiencing
Thermal Transient corresponding to a
Small Break LOCA
PFM-4 : Circumferential Crack
Experiencing the transient of PFM-3.
The probabilities of crack initiationand vessel failure were calculated for the
caseS PFM-I to PFM-4 for surface fluence
level from 0.3XIO" to 3.5XIO". The
variations of these probabilities are shown
in Fig. 8.
Experimental programme on flawedpiping components
The in-house advanced research
programme on material damage modelling
is supported by experimental programmeon real life structures. Under this
programme, actual PHT piping
components are tested with through-the-
thickness and part-through flaws under
four point bending loads. The 45 tests
have been planned on pre-cracked
straight pipes and elbows in order to
determine the component J-R curves. The
sizes of pipes and elbows range from8 inch to 16 inch in diameter and
thickness vary from 0.75 inch to 1.5 inch.
The material of the pipes and elbows is
SA333Gr6 (or SAI06GrB). The notched
test specimens are fatigue pre-cracked by
small prior to performing the experiment.
This ensures a sharp crack tip. During
the fatigue pre-crack, sinusoidal cyclic
load is applied. The maximum cyclic load
is approximately 10% of the collapse load
and minimnm cyclic load is 10% of themaximum load.
The tests are conducted using
computer controlled servo-hydraulic
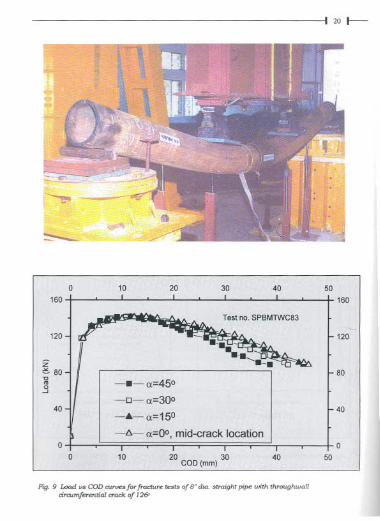
actuator of ~ 1000 kN capacity. Fig. 9
shows the test set-up. The pipe is
supported over a span of 4 and 5.82 m. in
case of 8 and 16 inch diameter pipes
respectively. Steel pedestals are used to
support the pipes. A distribution beam
with rollers is used to apply two
concentrated loads on the pipe over a
distance of 1.48 m. The servo-hydraulic
actuator is fIXed to a reaction frame of ~
1000 kN dynamic capacity which is
connected to the distribution beam by

113 I--
suitable plates and tie rods. The actuator
system consists of an in-built LVDT for
control of displacement. Static monotonic
load is applied on the pipe specimens
under displacement control. The rate of
displacement is f!Xed at 0.055 mm/sec. In
order to facilitate re-arrangement and re-
focusing of cameras during the test, the
entire fracture test is programmed in such
a way that displacement is applied
gradually for tliree minutes followed by
three minutes of holding time. A HP
computer is interfaced with the controller
of the actuator, through which the load
history is controlled using block
programming. Since the actuator has a
maximum displacement of 100 mm, the
test is programmed to stop after reaching
the maximum displacement using thelimit switch of the controller. The test is
again continued after adjusting the
displacement of the actuator usingmanual control and by providing packing
plates at the loading points. The recorded
data are (i) Applied load (ii) Load line
displacement (iii) ACPD measurement at
the crack tip (iv) Crack opening
displacement at various locations of the
notch (v) Crack growth and (vi) Deflection
of pipe at typical locations. Fig 7 also
shows the load v/s COD data for fracture
tests of 8" diameter straight pipe with
through-wall circumferential crack of
126°. Such experimental results are being
used to generate component level J-R
curves to obtain transferability relation.
These relations are very useful in Leak-
Before-Break qualification of PHT piping
components [9]. The experimental dataare also used to verify analytical
calculations of piping components with
flaws [10].
On-line material damage monitoring
of plant components
Recently the issue of remaining life
prediction has attracted considerableattention. The vast interest in the area of
remaining life prediction arises from the
need to avoid costly forced outages, safety
considerations and the necessity to extend
the component operation life beyond the
original design life. Many of the structural
components used in fossil power plant,
nuclear industry, chemical process
plants, etc. are subjected to cyclic stresses
due to the fluctuation of processtransients. On the other hand
components like steam pipes, super-
heater headers, turbine rotors, casings,
etc. operate at elevated temperature. The
fluctuating stresses at an elevated
temperature lead to material damage
mechanism due to combined creep and
fatigue. It is worth to note that among the
various aging effects, fatigue, creep and
creep-fatigue interaction are commonly
responsible for most of the failures in
various industrial components. Thus
there is a need to develop a life prediction
methodology to address the various
aspects of failure mechanisms.
An on-line fatigue-creep monitoring
system has been developed to monitor
these aging effects of the components
used in industries [11]. The system
acquires the process transients, such as,
pressure, temperature and flow rate,
through a data recording system. The
recorded data are initially screened based
on the severity of the transients. The
temperature transients and the thennalstresses of the structure due to the
fluctuation of the process transients are
computed using the finite elementmethod. The stresses due to mechanical
loading (intemal pressure) and system
I 14 t--
induced loading (piping loads) are
computed using a transfer function
approach. The stress time history is
converted to stress frequency spectrum
using rain-flow cycle algorithm. The
fatigue usage factor is computed using
ASME material fatigue curve. The creep
damage index is evaluated from the
computed temperature and stress
histories and the material creep curve. To
account for the combined damage
mechanism, the damage accumulation
approach is adapted.
The system is implemented at Heavy
Water Plant, Kota 112-13] and will be
shortly implemented at HWP, Tuticorin. At
HWP Kota, the system is monitoring the
fatigue degradation of three components.
The selected components are shell nozzle
junctions connected to hot tower and
waste stripper tower. The recorded data
are processed everyday to evaluate the
fatigue damage. The system at HWP,
Tuticorin will monitor the fatigue
degradation of the three components of
the drier loop. The performance of the
system is satisfactory. It is capable of
monitoring the degradation of several
components of a plant using a single P.C.
The information provided by the system is
helpful in life extension program oftbe
plants. The system is also found to be
useful for thermal power plants, nuclear
power plants, chemical process
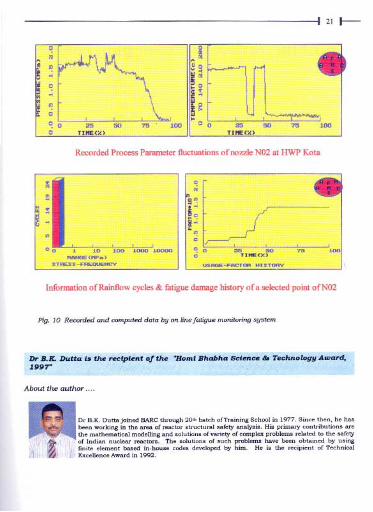
industries, etc. Fig. 10 shows the recorded
and the computed data stored by this
code over the thne of plant operation atHWP Kota.
References
1. Samal M.K., Dutta B.K., KushwahaH.S., "A study on ductile fractureinitiation in the PHT piping material ofan Indian PHWR using local
approach", International Journal ofPressure Vessels & Piping, Vol. 76,1999, pp.319-330.
2. Samal M.K., Dutta B.K., KushwahaH.S., "Prediction of JR curves ofvarious fracture mechanics specimensusing Gurson-Tvergaard model",Engineering Fracture Mechanics(Communicated), 1999.
3. Samal M.K., Dutta B.K., KushwahaH.S., "Determination of critical Weibullparameters for brittle fracture of aferritic steel at low temperature",International Journal of PressureVessels & Piping (Communicated),1999.
4. T.V.Pavankumar, J.Chattopadhyay,B.K.Dutta and H.S.Kushwaha, "A
Study on characteristics of crack tipconstraint parameter 'Q' in twodimensional geometries", InternationalJournal of Pressure Vessels & Piping(Communicated),1999.
5. T.V.Pavankumar, J.Chattopadhyay,B.K.Dutta, H.S.Kushwaha,Manoranjan Sinha and P.K.Kalra,"Crack-tip constraint parameters intwo dimensional geometries and theapplication of artificial neural networkto predict 'Q' parameter", EngineeringFracture Mechanics (Communicated),1999.
6. N.K.Mukhopadhyay, B.K.Dutta,H.S.Kushwaha, S.C.Mahajan andA.Kakodkar, "Numerical investigationson a cylinder with circumferentialcrack under PTS to characterise
experimental observations", In!. Jl. ofPres. Vessel & Piping, 65, pp 97-104,1996.
7. N.K.Mukhopadhyay, T.Pavankumar,J.Chattopadhyaya, B.K.Dutta,H.S.Kushwaha, V.Venkat Raj,"Deterministic Assessment of reactor
pressure integrity under pressurise

I 15 I--
thermal shock", Int. Jl. of Pres.Vessel & Piping, 75, pp 1055-1064,1999.
8. B.K.Dutta, H.S.Kushwaha, V.VenkatRaj, "Probabilistic assessment of
reactor pressure vessel integrity underpressurised thermal shock",Intemational Jl. Press. Vessel andPiping, 76, pp 445-453,1999.
9. J.Chattopadhyay, B.K.Dutta,H.S.Kushwaha, "Leak-before-break
qualification of primary heat transportpiping of 500 Mwe Tarapur atomicpower plant", International Jl. Press.Vessel and Piping, Vol. 76, pp 221-243,1999.
1O.J.Chattopadhyay, D.K.Nathani,B.K.Dutta, H.S.Kushwaha, "Closed-
form collapse moment equations ofelbows under combined intemal
pressure and bending moment", Jl. OfPressure Vessel Technology(Communicated), 1999.
II.N.K.Mukhopadhyay, B.K.Dutta,H.S.Kushwaha, S.C.Mahajan andA.Kakodkar, "On line fatigue lifemonitoring methodology for powerplant components, Int. Jl. of PressureVessel and Piping, 60, 297-306(1994).
12.N.K.Mukhopadhyay, B.K.Dutta,H.S.Kushwaha & S.C.Mahajan,"Implementation of on-line fatiguemonitoring methodology in heavywater plant Kota for remnant lifeassessment programme", J. ofTransactions of Indian Institute ofMetals (1996).
13.N.K.Mukhopadhyay, B.K.Dutta,P.Swami Prasad, H.S.Kushwaha,A.Kakodkar, "Implementation of finiteelement based fatigue monitoringsystem at heavy water plant Kota",Nuclear Engineering Design, 187, pp153-163,1999.
Acknowledgement
The author would like to thank his
colleagues Mr J.Chattopadhyay, Dr.
N.K.Mukhopadhyay, Mr T.Pavankumar
and Mr M.K.Samal for their primary
contributions in different segments of the
present work. He would also like to thank
Mr H.S.Kushwaha, Head, Reactor Safety
Division, for his keen interest and
guidance in pursuing the present package
of developmental work.
Fig. 1 Load vs Reduction of diameter curve for the notched tensile specimens having notchradii ,..4 and 10 mm respectively.
1161-
Fig. 2 Comparison of experimental results of a CoT specimen with analytical results calculated usingprinciples of material damage mechanics
Fig. 3 Analytical J-R curves for differentfracrure mechanics specimens for the material Ste460
I 17 t--
~40000u.
i 300000...I
70000
0.8
60000
50000
20000
10000
00.0
Fig. 4 Experimental and numerical Load vs Reduction in diameter curves for a notchedtensile specimen under cleavage fracture
;i 0.8
~ 0.6~0§' 0.4{j
e 0.2"-
1.0
2500 iO.
1000
Weibull Stress (ow) in Mpa"
Fig. 5 Fitting of Weibull statistics to experimental data points for m=48.0 (taking load asranking parameter)
I 18 I---
Fig. 6 Varianon of'Q' with defomwnon level (SA 333 Gr 6) for (a) a/w"O.l, (b) a/w"O.5
Fig. 7 Sketch showing normal dlstribunon of parameters In probabllisnc fracture mechanIcsassessment

I 19 I--
Fig. 8 Probabilities of crack initiation and vesselfailureforthefour cases (PFMl to PFM4)
1201--
~
~~
~'\
-0- a=3()O40
40
0
50
Fig. 9 Load us COD curvesfor fracture tests of8" dia. stroightpipe with throughwallcircumferential cmck of 12&>
0160
120
ZC, 80
0--'
40
00
121 t--
"N
~ "..
~ ~~ "
~ a"0a
25 50HOlE,x,
75 .
Recorded Process Parameter fluctuations of come NO2 at HWP Kota
100
~N
~~~N,i~hI~ Q 0 25 50
HOIE'x'
jL00 . '0 ).00 >000"""'"RAHOE'HP.)
OTREU-FREQUENCV
75 100
I!L/~ 0 as 500 T"""""
""""'-FACTOO HISTORY
17S
Information ofRainflow cycles & fatigue damage history of a selected point ofNO2
Fig. 10 Recorded and computed data by on line fatigue monitoring system
About the author...
Dr B.K. Duttajoined BARC through 20" batch of Training School in 1977. Since then, he hasbeen working in the area of reactor structural safety analysis. His primary contributions =ethe mathematical modelling and solutions of variety of complex problems related to the safetyof Indian nuc1e= reactors. The solutions of such problems have been obtained by usingfmite element based in.house codes developed by him. He is the recipient of Techni=1Excellence Award in 1992.
I 22 t--
Uraniumacid
recovery
Harvinderpal Singh
Rare Earth Development SectionBhabha Atomic Research Centre
DOCK PHOSPHATE IS A VITALINPUT FOR
.l'i...increased foodgrain production,
required to feed the growing populations
of the developing countries. India has a
number of fertiliser plants which process
the rock phosphate into fertiliser, mostly
by the sulphuric acid process. In addition,
there are two plants using the sulphuric
acid process to produce industrial
phosphates required for applications as
detergent and water softening agents. A
number of plants also use commercially
available strong phosphoric acid.Uranium is known to occur in
pliosphates .The potential for recovery of
uranium from the phosphates is
substantial, -1000 t/ year. It is available
as a by-product of an industry which iswell established and stable. Unlike the
conventional sources of uranium such as
the mined ore, the phosphatic uranium is
amenable for rapid exploitation and its
operation is eco-friendly . It is also
from phosphoric
economical as it is equivalent to an ore
which has been extracted, ground,
digested and filtered, ready for wet
processing operations of concentrations
and purification.
As an energy source, if uranium
contained in phosphates is not recovered,
it is lost irretrievably with the fertilisers.
Besides the spread with fertiliser is ofenvironmental concem due to the
radioactive hazards involved. The
radioactivity levels in the fertilisers far
exceed the new levels prescribed in the
revised intemational standards for safe
use of radioactive materials. It is
imperative therefore that uranium
separation from phosphates is carried out.
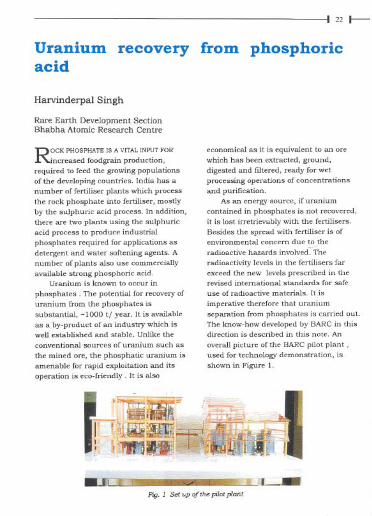
The know-how developed by BARC in thisdirection is described in this note. An
overall picture of the BARC pilot plant,
used for technology demonstration, is
shown in Figure 1.
..-Fig. 1 Set up of the pilot plant
'UI.:: :..8111

I 23 I-
Overall process flowsheet foruranium separation fromphosphoric acid
The recovery process consists of basic
steps shown in Figure 2. The phosphate
ore, as mined, is accompanied by waste
rock. Hence upgradation by ore dressing
techniques is carried out. Typical results
on a sample from a uraniferous Indian
phosphate deposit show that subjecting
an ore containing P,Os = 29.6% and U,O,
= 0.043% to the operations of calcination,
magnetic separation and froth flotation
yields a high acid-grade concentrate fit for
fertiliser purpose, containing P20S =
36.3% and U,O, = 0.046%. The bulk of
uranium values (-75%) are intimately
associated in the phosphate mineral and
no selective upgradation or leaching isfeasible.
OR"... o~1::"o'" WMURO=""'H~"~" .
'~~=~E~O'~",+'CID,"",A) ~'
~.,Z2;&;\!:
n[ijlC>
.=~ .
>. ~~",~'rno'
-4"""'O_TION~
C:iliiiACTIOii.~""A . ...~ .- ,-- =c'w, Dmrnm.rn
£ . "-i'D" J+o~ONm~ cg1CC;;';~RAU
Fig.2 Schematicflowsheetforumniumsepamtion from phosphoricacid.
The next step in the process is acid
dissolution of the rock phosphate. There
are several methods of acidulation, but
the most common one is the process
involving the use of sulphuric acid to
reject the calcium in the rock phosphate
as 'dihydrate' gypsum, while yielding
phosphoric acid containing 27-32% P,Os-
which is called the 'wet process
phosphoric acid'(WPA). The strong acid
containing -52% P,Os is obtained by
evaporation from WPA is traded as
'merchant grade acid' (MGA).
During acidulation, > 90% of
uranium present in the rock can report to
the WPA if the operation is carried out
under oxidising conditions. This is
generally the case since air cooling or
flash-cooling of the acid is adopted for
removal of the heat produced in the
dissolution reaction. If required the
operation can be deliberately controlled by
monitoring the redox potential, or thee.m.f.
Uranium recovery from ¥1PA involves
these steps: (i) phosphoric icid pre-
treatment, (ii) uranium extraction,
(iii) uranium purification by fe-extraction,
(iv) product recovery, and (v) post -
treatment of uranium depleted acid.
Prior to uranium extraction, WPA
must undergo several pre-treatment
steps. These include cooling to an
optimum processing temperature,clarification to remove both the
suspended solids and the organic material
present in the acid (called as 'humates),
and adjustment of uranium valency.
Depending upon the solvent, uranium is
extracted from the acid, after pre-
treatment, either in the +4 or +6
oxidation state by solvent extraction. The
uranium is recovered from the solvent by
another contact with an acid strip
solution.
The uranium in the acid strip solution
may be precipitated but needs to be
purified before conversion to the final
product. Purification is accomplished by
re-extracting the uranium with a second
organic solvent. The uranium loaded
I 24 I--
organic in the second circuit is scrubbedto remove the impurities. The pureuranium is stripped from the solvent andprecipitated. This precipitate, calledyellow cake', is dried or calcined,packaged and transferred to uranium fuelconversion facilities. The uranium-barren
phosphoric acid, called 'raffinate', is sentto a clean-up step to remove traces ofentrained organic before being retumed tothe fertilizer plant.
Details of these steps are discussedbelow, based on the experience gained byBARC on acid from several fertiliser
plants.
Pre-treatment of phosphoric acid
Pre-treatment of the acid to make itsuitable for the uranium extraction is a
step of prime importance. Pre-treatmentcosts in an industrial plant can constitutea third of the total costs. Pre-treatment
usually involves three operations oftemperature adjustment, valenceadjustment, and clarification.
Temperature adjustment
Phosphoric acid fed to a uranium-
recovery plant may be hot, up to 65°C.
The actual temperature depends upon the
surge volume, plant capacity, length of
transfer pipe, etc. Lowering of the
temperature reduces the fire hazard of thesolvent used for extraction and increases
the extraction power of solvents. Cooling
the phosphoric acid however has some
disadvantages. The viscosity of the acid
increases with decreased temperature,
which in tum necessitates larger and
costlier equipment in the solvent
extraction circuit, with the additional cost
of increased solvent hold-up. A more
serious problem with cooling is the
crystallization of salts from the acid onto
the heat exchanger surfaces leaded toincreased maintenance of the heat
exchanger. Similarly, the added cost of
reheating the acid, if processed for
concentration before further processing
into fertiliser, as is common in many
plants, is an additional consideration.
As a compromise, the temperature of
the acid is reduced only to some optimum
level, depending on the local conditions,
usually in the range of 38oC - 55°C.
Valence adjustment
The second unit operation in the acid
pre-treatment is the adjustment of the
acid valency or the redox potential, as
measured by the 'emf, to a value that will
be suitable for th~particular solvent
extraction system being used. There are
two types of solvents: one which extracts
uranium at lower emf value, and second
which extracts uranium at higher emfvalue.
For systems where oxidation is
needed or the emf is to be high, reagents
which can be added include: air, oxygen,
H2O" NaClO3 and ozone. The use of
chlorate is not acceptable in some plants
because of potential additional corrosion
that would lie caused by introducing theextra chloride ions into the acid.
Peroxide is expensive and is used in
moderate quantities after use of air or
oxygen.
In systems where uranium must be
reduced, the reduction can be carried out
by using scrap iron. The reduction usuallyoccurs in less than 15 minutes. Reduction
tests on acid samples taken from several
plants showed scrap iron consumption in
the range of 0.2 to 0.8 g/l. Since most
acids already contain 4-5 g/l iron, this
amount of iron is generally accepted by
the fertiliser producers.

I 25 I---
Clari:flocculationThe WPA contains 1 -2 % suspended
solids and humic material. Both these
need to be reduced to prevent problems of
'crud' build-up in the solvent extraction
unit. The 'crud' consists of troublesome
solid phase which accumulates at the
interphase of the aqueous and organic
phase in the solvent extraction
equipment. It renders operation difficult
and leads to high loss of expensive
solvent. The solids contained in WPA can
be almost completely removed by
flocculation using a high molecular weight
polyacrylamide type ionic flocculant and
settling in a thickener. The thickenerunderflow can be returned to the acid
plant filter for recovery of contained
phosphate and uranium values.The acid after clari-flocculation may
be 'green' or 'black' depending on the'humate' content. The humate content of
the 'green' acids is sufficiently low «100
ppm) and no special separation operation
is required for further removal. Black
acids, however, contain high humate
levels and a special treatment is required.Troublesome humates in black
phosphoric acid are more difficult to
remove than gypsum, and several
methods have been tested to accomplish
this separation. The humates in the wet-
process acid consist of either dissolved
matter in the acid or are of suspended
very fme colloidal particles. A portion ofthese humates flocculate with the gypsum
in the clari-flocculator and the balance
need other means to eliminate them.
One efficient method of humate
removal is carbon adsorption. However
the black acids made from uncalcined
rock contain too high, upto 2 g(l, ofhumates for the method to be industrially
feasible. Since the capacity of carbon for
adsorption of these humates is limited,
the cycle time is short. Short cycle times
and the problem of quick regeneration
cause operating problems. In addition,
the cost of regeneration, using NaOH , isexcessive and the carbon needs to be
replaced or thermally reactivated in a
calciner after several in-plant
regenerations, further adding to the
operating costs. Thus carbon adsorption
is used only for green or brown acids, lowin humic content.
For black acids, BARC has developed
a process where the acid is contacted with
a viscous liquid hydrocarbon in a specially
designed equipment .The humates form a
flocculated precipitate. The precipitate
and other suspended solids accumulate
as an emulsion above the aqueous phase.
The emulsion is separated and filtered to
remove the organic material and to
recover the entrained acid and the
hydrocarbon.Once the phosphoric acid has been
cleaned of the undesirable suspended
solids and the humates, the acid is
filtered to remove residual suspended
solids and then fe-heated slightly beforesolvent extraction.
Solvent extraction
Solvent extraction separates uranium
from the WPA and concentrates it for the
subsequent purification process. WPA is a
highly ionic systems and the solventsfound to have sufficient extraction power
are of a group including phosphate ester,
acid, oxide, etc., There are two extractant
systems for commercial utilisation. The
first system consists of di-2-ethyl hexyl
phosphoric acid (D2EHPA) or nonyl
phenyl phosphoric acid (NPPA), with a
synergistic additive, trioctylphosphine
oxide (TOPO), di-butyl butyl phosphonate
(DBBP) or tributyl phosphoric acid ITBP)
The second system involves a number of
I 26 I--
compounds called as octyl phenyl acid
phosphate (OPAP). TOPO and TBP are
neutral organo-phosphates, whereasOPAP and DEHPA are acidic
organophosphates. BARC has developed
indigenous synthesis processes for the
various solvent estraction reagents. The
solvent extraction reagents are used in theextraction circuit as a dilute solution in
refmed kerosene. In India, a special grade
of diluent has been developed to meet the
needs of hydrometallurgical estraction.
Di-2-Ethyl hexyl phosphoric acid extractantD2EHPA has been used in India to
extract rare earths and base metals from
acidic solutions. D2EHPA alone is,
however, not a sufficiently strong
extractant to recover uranium from typical
wet-process phosphoric acids.
D2EHPA/NPPA is effective in synergistic
combination with TBP/DBBP/TOPO or foroxidised uranium. TOPO is most effective
but is costliest. Stripping of the solvent
can be accomplished by using reductive
strong phosphoric acid.
Dctyl phenyl acid phosphate extractant
OPAP offers some advantages overD2EHPA-TOPO . These are:
I. OPAP extracts tetravalent uranium,
which is the prevalent species in
many phosphoric acids.
2 Uranium is stripped from the OPAP
with phosphoric acid and an
oxidant (H2O,) and therefore,
valence adjustment is not needed
to purify the hexavalent uranium in
a second cycle.
3. OPAP is a more powerful uranium
extractant than D2EHPA-TOPO,
thus enabling less number of
contact stages and higherconcentration ratio.
4. OPAP is cheaper than D2EHPA-
TOPO
BARC was the fIrst to report the utility
of OPAP in uranium extraction from WPA,
even though the early researchers in USA
had reported negative results. The
chemical stability of OPAP is lower thanD2EHPA-TOPO. The commercial OPAP
product consists of many components but
only two components, the mono and di-
isomers of octyl phenyl phosphoric acid,are of interest in the extraction
.Differential solubility of the mono and di-
isomers in WPA is important since an
equi-molar mixture of the two esters has
a positive synergistic effect due to whichuranium extraction increases several
times in comparison with the extraction
by either isomer individually. OPAP losses
into WPA are higher and it needs to berecovered from the acid after solvent
extraction. A further improvementinvolves a mixture of mono-ester and di-
ester forms of NPPA.
Uranium purification by re-extraction
A chemical precipitation method can
be used to purify uranium prior to
product recovery, but is costly in view ofthe low concentration of uranium.
Elimination of impurities and furtherconcentration of uranium into a solution
suitable for uranium recovery is
accomplished by a process of re-
extraction. Impurities which are separated
include phosphate, fluoride, sodium,
iron etc. There are many solvents that
can be used to control these impurities.
The selection of the solvent depends in the
part on the solvent used in the first circuit
and the reagents used to strip that
solvent. In the TO-extraction process
further purity is obtained by scrubbing
the loaded solvent. Sulphuric acid is very
effective as it not only removes phosphate
I 27 I--
but also separates other contaminants.
The acid scrub solution contairllng the
unwanted impurities is used for re-
generation of the solvent. The D2EHPA-
TOPO gives excellent results in the re-
extraction. The OPAP system has also
been used in second circuit. But
selectivity is not high and purification of
the strip solution before precipitation of
the yellow cake is important.
So/vent stripping and regeneration
Stripping of the solvents can be
accomplished with Na2CO, or ammonium
carbonate. Using Na,CO, to strip the
solvent yields a solution from which a
uranium cake can be precipitated which
needs only to be dried before packaging.
The use of (NH,j,CO, to strip the solvent
produces a uranium precipitate that mustbe calcined to remove ammonia before
being packed. The former however giveslower filtration rate.
Stripping uranium with (NH,j,CO,
and precipitating the uranium in the
stripping mixer-settler as a single
operation has been tested The slurry is
filtered and the solution recycled after
adding NH, and CO2 However
precipitating solids in the SX unit
generally increases phase disengagement
times, reduces mass transfer rates, and
increases solvent losses.
When D2EHPA-TOPO is used in the
purification circuit, the sodium or
ammonium ions loaded onto the organic
during stripping can get recycled to the
extraction section causing precipitation of
sodium or ammonium fluosilicates .Hence regeneration of the solvent, wherein
monovalent ions are replaced with
hydrogen ions, is necessary after
stripping and before recycle to extraction.
The acid used to scrub impurities from
the loaded organic can be used to
regenerate the solvent. This reuse of the
scrub solution in regeneration also
prevents any scrubbed uranium from
being lost since it is recovered by the
organic during regeneration.
Product uranium recovery
Sodium carbonate stripping of
uranium from D2EHPA-TOPO yields a
solution containing 40 to 60 gfl U,O,.
This solution is acidified to pH 6.5 with
sulphuric acid. At this pH a precipitate isformed whicb contains many impurities
that can be removed by filtering. These
impurities include phosphate, iron, silica,
and heavy metals. The filtration of the
impurity precipitate is accomplished by
relatively small equipment. After
filtration, acidification is continued to
eliminate carbon dioxide. Then the pH is
raised with NH, or NaOH. The precipitate
consists of hydrated uranyl salts. An
alternate route to precipitate uranium as
peroxide has also been developed.
The yellow cake product from the
precipitated slurry is obtained by
thickening, centrifuging and drying.
Entrained so/vent recovery
The WPA from the primary extraction,
depleted of uranium, contains traces of
entrained solvents (-250ppm) which canadd to the costs as well as lead to
problems in downstream operations. A
limit of 50 ppm of solvent carryover intothe ra1finate is as a safe level. Therefore,
the ra1finate clean-up is carried out using
packed coalescers (similar to the ones
used in petro-chemical industry for oil-
water separation) to remove the solvent to
- 50ppm. This is followed by separation
using flotation cells(similar to the
equipment used in ore dressing industry)to further reduce the solvent to less than
40 ppm.
I28 ~
Advantages of uranium separationfrom phosphoric acid
There are several advantages ofuranium separation from WPA. Oneadvantage is that the raffinate acidreturned to the fertiliser plant is in anextremely clear state. Physically, it is apractically sparkling, clear, light-brownliquid. Most ofits suspended solids,waxes and organics have been eitherintentionally removed during the pre-tratment step or eliminated as a result ofthe solvent extraction process. Clarifiedraffmate acid gives very low scaling in thedownstream operations, - 20 % of thenormal dirty acid. Second advantage isrealised during the concentration stage.Wen the dirty acid is concentrated in theevaporators to 52-54 % p,Os, its solidcontent gets raised to 2.5-3 %. Through acombination of post-precipitation andcooling, this content may be further getraised so that clarification is necessary tosecure a good grade control during the
manufacture of granular triplesuperphosphate and diammoniumphosphate (DAP). The uranium recoveryprocess considerably reduces therequirement of such clarification.Clarification at 40 % and 52 % P,Os ismade easier. Third advantage lies inimprovement of the grade of DAP by asmuch as 0.2-0.4 % N and 0.5-1.0% P20S
Uranium recovery from phosphoric acidand its inherently incorporated acid cleanup gives an excellent incentive for acidpurification to remove undesirableimpurities such as Mg, Fe, AI andproduce technical grade acid. Otherchemical processes become applicablee.g. fluorine precipitation, alkalisationprecipitation of metals.
The rare earth elements present in theWPA can also be recovered. Similarlycadmium present in many of the acidscan also be separated after uraniumrecovery.
About the author ...
Mr Harvinde,!,al Singh joined the 20th batch of BARC Teaining School afte, obtaining af,,-,t cia" fi",t in B.E.(Hon,.! in Chemical Enginee,ing fcom BITS, Pilani. Hi' majo'achievement, in the DAE include p,oce" optimi"tion at VCIL plan'" (Bihar) and IREplan'" (KeealajTamil Nadu), ,cale-up of ueanium ingot pcoduction at T,ombay. ea,e eacthpho'pho, technology development and technology indu,triali"tion fo, ,ace mate,ial,,eparation fcom pho'phate'. He h.. won honou"'jAwaro, including the BARC Office",A"ociation Award fo, Excellence in Nucleac Science & Engineedng in 1994 a' well .. theHomi Bhabha Science & Technology Awaro. 1996. He h.. al,o been nominated fo, ShantiSwarup Bhatnagar Award and fo, Metallucgi,'" of the Yeac Award. He i, a membe, of
Indian ln,titute of Chemical Enginee",. Indian In,titute of Metal,. Indian Socie\>, fo, Heat & Maos T,an,foc.Indian Nuclear Socie\>" Matedal, Re,eacch Socie\>, of India and vice -p,e,ident of Rare Eacth, A"ociation ofIndia. He h.. pactidpared in IAEApw",acnme, abwad.
I 29 I--
Dual sites of electron solvation inmicro heterogeneous media: a newobservation
Hirendra Nath Ghosh
Radiation Chemistry & Chemical Dynamics DivisionBhabha Atomic Research Centre
Introduction
THE PROCESS OF IONIZATIONBY THE
interaction of high energy radaitionwith matter or by laser excitation resultsin creation of an electron and a hole
(cation). Following the energy absorptionin < 10-16seconds electron is ejected with
sufficient kinetic energy to escape thecoulombic attraction of its sibling hole. Itcreates further ionizations and excitationsalong its path, get thermalised and in theabsence of suitable scavengers canpolarise and orient solvent moleculesaround itself to get solvated and is calledas "Solvated Electron". When the electronis solvated in water it is known as
hydrated electron (e.,-). The excesselectron is the primordial intermediate inthe Radiation Chemistry of liquids- Itcontinues to be of prime importance inchemistry and biology. The characteristicabsorption band of solvated electron hasbeen observed in many liquids by usingthe techniques of pulse radiolysis andflash photolysis- The advancement oftechnology in the creation and detection ofultrashort optical pulses have made itnow possible to follow the absorptionspectrum in picosecond (10-12sec) tofemtosecond time (10-15sec) scale-
Intensive studies have producedsubstantial information concerning
reactions between solvated electron and
chemical or biological acceptors in
homogeneous aqueous solutions. The
knowledge of absolute rate constant is of
prime importance for a proper
understanding of chemical reactions. In
particular, the studies of one-electron-transfer reactions in concentrated
solutions ofbiomolecules (coenzymes,
nucleic acid components e.g. purines,
pyrimidines and amino acids) should
permit apprehension of the mechanisms
of free radicals occuring in components of
living cells-
Amphilic molecules which possess
both hydrophilic and hydrophobic end
group may associate in aqueous media to
form dynamic aggregates commonly called
micelles- With increasing concentration,
the aggregates may take different
structure and shapes like spherical and
ellipsoidal micelles, microemulsion,
bilayer, liquid crystal etc, and are called
microheterogeneous media in general.
Such systems mimic structures and
functions of living body membranes and
lipids. To understand the reactivity of
electron and electron transfer processes in
a living body one can extrapolate studies
on microheterogeneous media as a first
approximation-
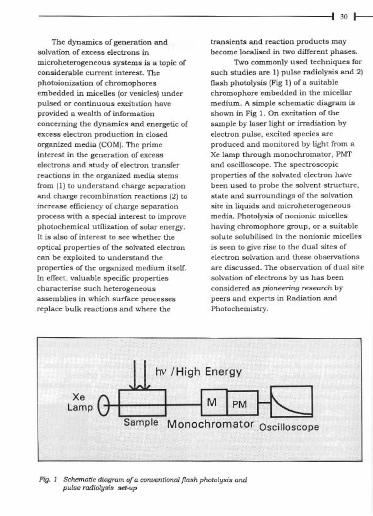
I 30 J--
The dynamics of generation andsolvation of excess electrons in
microheterogeneous systems is a topic ofconsiderable current interest. The
photoionization of chromophores
embedded in micelles (or vesicles) underpulsed or continuous excitation have
provided a wealth of information
concerning the dynamics and energetic of
excess electron production in closed
organized media (COM). The prime
interest in the generation of excess
electrons and study of electron transfer
reactions in the organized media stems
from (I) to understand charge separation
and charge recombination reactions (2) to
increase efficiency of charge separation
process with a special interest to improve
photochemical utilization of solar energy.It is also of interest to see whether the
optical properties of the solvated electron
can be exploited to understand the
properties of the organized medium itself.
In effect. valuable specific properties
characterise such heterogeneous
assemblies in which surface processes
replace bulk reactions and where the
transients and reaction products may
become localised in two different phases.
Two commonly used techniques for
such studies are I) pulse radiolysis and 2)
flash photolysis (Fig I) of a suitable
chromophore embedded in the micellar
medium. A simple schematic diagram is
shown in Fig 1. On excitation of the
sample by laser light or irradiation by
electron pulse, excited species are
produced and monitored by light from a
Xe lamp through monochromator, PMT
and oscilloscope. The spectroscopic
properties of the solvated electron have
been used to probe the solvent structure,
state and surroundings of the solvation
site in liquids and microheterogeneous
media. Photolysis of non ionic micelles
having chromophore group, or a suitable
solute solubilised in the nonionic micelles
is seen to give rise to the dual sites ofelectron solvation and these observations
are discussed. The observation of dual site
solvation of electrons by us has been
considered as pioneering research by
peers and experts in Radiation and
Photochemistry.
Fig. 1 Schematic diagram of a oonventional flash photolysis andpulse radiolysis set-up
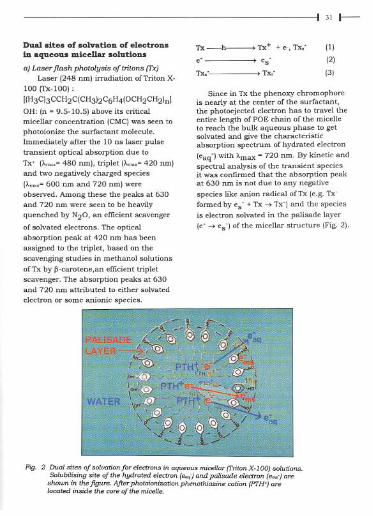
131 I--
Dual sites of solvation of electrons
In aqueous micellar solutions
aj Laser flash plwtolysis of tritons (Txj
Laser(248 nm) irradiation of Triton X-
100 (Tx-1O0) :
[IH 3 C) 3 CCH 2 C( CH3J2 C6H41 OCH 2 CH 2 In)
OH: In = 9.5-10.5) above its criticalmicellar concentration ICMC)was seen tophotoionize the surfactant molecule.Immediately after the 10 ns laser pulsetransient optical absorption due toTx' (Am,,=480 nm), triplet (Am,,=420 nmland two negatively charged species(Am"=600 nm and 720 nm) wereobserved. Among these the peaks at 630and 720 nm were seen to be heavily
quenched by N20, an efficient scavenger
of solvated electrons. The opticalabsorption peak at 420 nm has beenassigned to the triplet, based on thescavenging studies in methanol solutionsofTx by p-carotene,an efficient tripletscavenger. The absorption peaks at 630and 720 nm attributed to either solvated
electron or some anionic species.
Tx-h >Tx+ + e', Tx; (I)
(2)
(3)
e- > es>Tx,Tx,'
Since in Tx the phenoxy chromophoreis nearly at the center of the surfactant,the photoejected electron has to travel theentire length of POE chain of the micelleto reach the bulk aqueous phase to getsolvated and give the characteristicabsorption spectrum of hydrated electron
(eaq-) with Amax = 720 nm. By kinetic andspectral analysis of the transient speciesit was confirmed that the absorption peakat 630 nm is not due to any negativespecies like anion radical ofTx (e.g. Tx-formed byes + Tx -> Tx-) and the speciesis electron solvated in the palisade layer
(e- -> es) of the micellar structure (Fig. 2).
Fig. 2 Dual sites of solvation for electrons;n aqueous nUccI/or (TritonX-lOO) solutions.SolubiUsing site of the hydrated electron (eo.;-)and paUsade electron (e=-) are
shown ;n the figure. After photoionization phenothiazine cation (PTH') arelocated inside the core of the nUccI/e.

I 32 I--
g ~~~,
: . .00 = '"' "" '"' "'"
W,-""m)
';, '
j
\~4 \ /'...3 /\.0 2 V'../ ,_/ '.< V'.....
500 600 700Wavelength (nm)
600
Fig.3 Transient abso'!'tion spectraproduced on laserflash plwtolysis of N2 bubbled solutions ofPTHin TritonX-165 : 1. immediately ( delay - 0 ps ) ond 2: 4000 ps after the 35 ps, 355nm laser pulse. 3: immediately afterXeF (351 nm) excimer laserpulse (JOOns)
b) Plwtoionization of ph£nothiazine (PTH)innonionic micelles
The above results were confmned
using another ineresting system.Photoionization of a suitable probemolecule e.g. PTH incorporated innonionic micelle gives similar dualelectron solvation sites. Due to its low
solubility in water, PTH is preferentiallysolubilized inside the core of the nonionic
micelle (Fig 2). Figure 3 (curve 3) showsthe transient optical absorption spectrumon 351 nm excitation ofPTH in aqueousTriton-X-165 solution. The spectrumshows four absorption peaks at 460 (notshown in the figure), 520, 630 and 720nm. The peaks at 460 and 520 nm areattributed to the triplet and cation radicalofPTH respectively. Both the 630 and 720
nm peaks were found to be efficiently
quenched by N20 and H+ (i.e. in acidicmedium) and could be safely attributed tothe solvated electrons arising from twodifferent sites of solvation in these media.
Time evolution of the dual sites ofelectron solvation: a numericalsimulation study
If the probe molecule e.g. PTHsolubilized near the core of the micelle
undergoes photoionization by a UV
photon (e.g. 355nm, 3.5 eY), the kineticenergy of the photoejected electron isexpected to be limited to 0.1-1 eV and thetypical thennalization distances for theelectrons are expected to be 2.5 - 4 nmsimilar to the micellar dimensions. Theradii of the micelles chosen for the presentstudies i.e. Tx-IOO, Tx-165 and Brij-35
are approximately 4 nm and hence amajor fraction of the photoejectedelectrons is expected to get solvated in the
palisade region of the nonionic micellesstudied. Femtosecond flash photolysis
experiments confinned that solvation timefor hydrated electron in micellar system is-350fs. In the present case, it is expectedthat the solvation of the electron in the
palisade region (ems) is complete within
the pulse time i.e. 35 ps. It is possiblethat during the pulse time some electronsmight have travelled the poly oxy ethelene(POE) segment length of the nonionicmicelle and become hydrated in the bulk
water (eaq-)' However, this fractionappears to be small. Some of the electronssolvated in the palisade region might havealso diffused to the bulk water to get
hydrated. It was not possible todistinguish between these twopossibilities. For this purpose PTH in
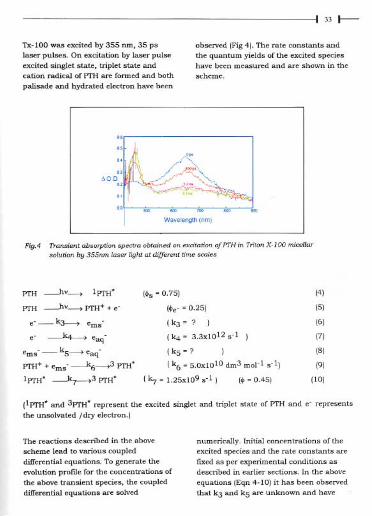
I 33 I----
Tx-1O0was excitedby 355 run, 35 pslaser pulses. On excitation by laser pulseexcited singlet state, triplet state andcation radical of PTH are formed and both
palisade and hydrated electron have been
observed (Fig 4). The rate constants and
the quantum yields of the excited specieshave been measured and are shown in the
scheme.
''° 0"11"
Wavelength (nm)
FigA Transient absorption spectra obtained on excitation of PTHin Triton X-lOa micellarsolution by 355nm laser light at different time scales
($s = 0.75)
($e- = 0.25)
(k3 = ?
(~= 3.3x1O12 sol )
PTH hv > IPTH'
PTH hv >PTH+ + e-
e- - k3 > ems
e- ~ eaq-
ems _k5 >eaq-
PTH++ ems -.-1<6 >3 PTH'
IPTH' -.-1<7 >3 PTH'
(4)
(5)
(6)
(7)
(8)
(9)
(10)
(k5 =?
(k6 = 5.0x10¹⁰ dm3 mol-I sol)
(~=1.25x1O9s-l) ($=0.45)
(IPTH' and 3PTH' represent the excited singlet and triplet state of PTH and e- represents
the unsolvated jdry electron.)
The reactions described in the above
scheme lead to various coupled
differential equations. To generate the
evolution profIle for the concentrations of
the above transient species, the coupled
differential equations are solved
numerically. Initial concentrations of the
excited species and the rate constants are
fIXed as per experimental conditions asdescribed in earlier sections. In the above
equations (Eqn 4-10) it has been observed
that k3 and k5 are unknown and have
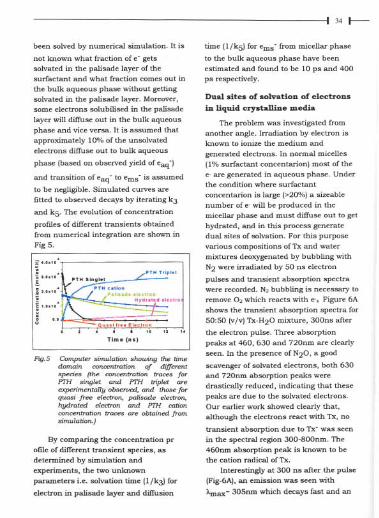
134r-
beensolved by numerical simulation. It is
not known what fraction of e- getssolvated in the palisade layer of thesurfactant and what fraction comes out in
the bulk aqueous pbase without gettiogsolvated in the palisade layer. Moreover,some electrons solubilised in the palisadelayer will diffuse out in the bulk aqueousphase and vice versa. It is assumed thatapproximately 10% of the unsolvatedelectrons diffuse out to bulk aqueous
phase (based on observed yield of eaq-)
and transition of eaq - to ems-is assumedto be negligible. Simulated curves arefitted to observed decays by iterating kJ
and kS' The evolution of concentration
profiles of different transients obtainedfrom numerical integration are shown inFigS.
r."".~ "
I::::::
PTH"'plo'PTH SI.Olo'
Tlmo (ns)
Fig.S Computer sUnulatian showing the timedommn co=entration of differentspecies (the concentration traces farPTH singlet and PTH triplet areexperimentally observed, and t/wse farquasi free electron, palisade electron,hydrated electron and PTH cationconcentration traces are ablamed fromsimulation.)
By comparing the concentration proflle of different transient species, asdetermined by simulation andexperiments, the two unknownparameters i.e. solvation time (l{kJ) for
e1ectron in pSlisade layer and diffusion
time (l/kS) for Oms from micellar phase
to the bulk aqueous phase have beenestimated and found to be 10 ps and 400ps respectively.
Dual sites of solvation of electrons
in liquid crystalline media
The problem was investigated fromanother angle. Irradiation by electron isknown to ionize the medium and
generated electrons. In normal micelles(1% surfactant concentarion) most of thee' are generated in aqueous phase. Underthe condition where surfactant
concentarion is large (>20%) a sizeablenumber of e- will be produced in themicellar phase and must diffuse out to gethydrated, and in this process generatedual sites of solvation. For this purposevarious compositions ofTx and watermixtures deoxygenated by bubbling withN2 were irradiated by 50 ns electron
pulses and transient absorption spectrawere recorded. N, bubbling is necessary toremove 0, which reacts with e-. Figure 6Ashows the transient absorption spectra for50:50 Iv/v) Tx-H20 mixture, JOOns after
the electron pulse. Three absorptionpeaks at 460, 6JO and 720nm are clearlyseen. In the presence ofN20, a good
scavenger of solvated electrons, both 6JOand 720nm absorption peaks weredrastically reduced, indicating that thesepeaks are due to the solvated electrons.Our earlier work showed clearly that,although the electrons react with Tx, no
transient absorption due to Tx- was seenin the spectral region JOO-800nm. The460nm absorption peak is known to bethe cation radical of Tx.
Interestingly at JOO ns after the pulse(Fig-6A), an emission was seen with
Amax- JOSnm which decays fast and an

I 35 I--
absorption signal grows in -l~s with
1.",ax ~ 320nm. The species absorbing at
320nm has been identified as the triplet
state ofTs. The inset of Fig 6D shows
transient absorption spectra obtained in
20% (v/v) Ts-H20 mixture 300ns after the
electron pulse. At this composition, the
cation radical and triplet peaks are minor
and 630nm peak is not clear. Distinct 630
and 720nm peaks are seen for Tx-IOOconcentrations between 40-70%.
" ;~-"'
!
':;~
1::t-~=c_~~:f:~w'Z:","",';:m)
Fig. 6 Transient absorption spectra obtamedon in-adiation of Triton X-lOO : wate,(50:50 V/V) mixtu,es by 50ns electronpulses.(A) N2 bubbled (0.3)1S); (B) Np
saturated (O.3)1s); (e) N2 bubbled (1)1s).Inset: Transient absorption spectra ofTx-lOO: Wate, (20:80 v/v) mixtu,es.(D) N2 bubbled, (E) N20 saturated after
0.3)1s.
The widths of the two peaks are not as
broad as that for eaq- in neat water or for
es in neat alcohols. In the present case
the smaller peak widths probably arisedue to the strong influence of the micellaraggregation on the variation of trap depthfor both the electron solvation sites.
However, as described earlier the 630nmpeak does not arise from the anion ofTs.Below 40% ofTs the fraction of electrons
generated in Ts fraction would be low and
hence 720nm peak due to eaq- absorptiondominates. Between 40-70% ofTs the
energy deposited in aqueous and Ts
pseudophases is comparable leading topreferential solvation of electrons in boththe phases to give 630 and 720nm peaks.Above 70% ofTx, the water fractiondiminishes, hence 720nm peak due to
eaq- reduces and is not clearly observed.The electron yield in Tx pseudophase at630 nm also reduces drastically in these
high concentration ofTx, probably due tothe limited hydration of the POE chains,the polarity of the palisade layer is low or
the es absorbs beyond the detection
limits of our system (>800nm). The
increased yields ofTx+ cation radicals andincreased emission yields suggest that theionization yield is not diminished at highconcentration ofTs. These observations
thus support that the above fact that lowapparent electron yields (630 nm) must bedue to the shift of the electron absorption
spectrum beyond 800nm.
Fig.? Hexagonal strnctu,e of liquid crystalmiddle phase of wate, + Triton-X-lOOsystem. Sites of solubilisation fo,
electrons in palisade laye, (es) and
aqueous pseudophase (eaq-) a,eshown.
The nonionic surfactant systems arefree from the electric charge effects seenfor ionic micellar and microemulsionsystems. Further, ionic micelles have
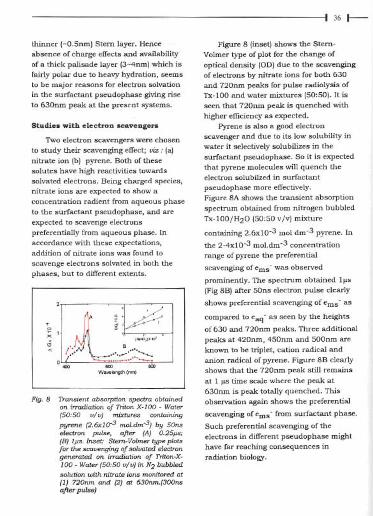
I 36 I--
tIllnner (-0.5nm) Stem layer. Hence
absence of charge effects and availabilitY
of a thick palisade layer (3-4nm) which is
fairly polar due to heavy hydration, seems
to be major reasons for electron solvation
in the surfactant pseudophase giving rise
to 630nm peak at the present systems.
Studies with electron scavengers
Two electron scavengers were chosen
to study their scavenging effect; viz: (a)
nitrate ion (b) pyrene. Both of these
solutes have high reactivities towards
solvated electrons. Being charged species,
nitrate ions are expected to show a
concentration radient from aqueous phase
to the surfactant pseudophase, and are
expected to scavenge electrons
preferentially from aqueous phase. In
accordance with these expectations,
addition of nitrate ions was found to
scavenge electrons solvated in both the
phases, but to different extents.
,~ 1"~ J
cg,
ii'
'0 ,~';,,"o'
/:. _..,..>" ,0'/ -- "'~"'" 600
W,w.ogth{om)
Fig. 8 Transient absmption spectra obta;nedon ;rrQ(t;ation of Triton X-I 00 - Water(50:50 v/v) mixtures conta;n;ng
pyrene (2.6x1O-3 mol.dm-3) by 50nselectron pulse, after (A) 0.25/,s;(8) l/,s. Inset: Stem-Volmer type plotsfor the scavenging of solvated electrongenerated on hQ(t;ation of Triton-X-100 - Water (50:50 v/v);n N2 bubbledsolution with nitrate ;ons monitored ot(1) 720nm and (2) at 630nm.(300nsafter pulse)
Figure 8 (inset) shows the Stem-
Volmer tYPe of plot for the change of
optical densitY (OD) due to the scavengingof electrons by nitrate ions for both 630
and 720nm peaks for pulse radiolysis of
Tx-IOO and water mixtures (50:50). It is
seen that 720nm peak is quenched with
higher efficiency as expected.
Pyrene is also a good electron
scavenger and due to its low solubilitY in
water it selectively solubilizes in the
surfactant pseudophase. So it is expected
that pyrene molecules will quench theelectron solubilzed in surfactant
pseudophase more effectively.
Figure 8A shows the transient absorption
spectrum obtained from nitrogen bubbled
Tx-IOOjH20 (50:50 vjv) mixture
containing 2.6xlO-3 mol dm-3 pyrene. In
the 2-4xlO-3 mol.dm-3 concentration
range ofpyrene the preferential
scavenging of ems was observed
prominently. The spectrum obtained I~s
(Fig 8B) after SOns electron pulse clearly
shows preferential scavenging of ems as
compared to eaq- as seen by the heights
of 630 and 720nm peaks. Three additional
peaks at 420nm, 450nm and 500nm are
known to be triplet, cation radical and
anion radical ofpyrene. Figure 8B clearly
shows that the 720nm peak still remains
at I ~s time scale where the peak at
630nm is peak totally quenched. This
observation again shows the preferential
scavenging of ems from surfactant phase.
Such preferential scavenging of the
electrons in different pseudophase might
have far reaching consequences in
radiation biology.
Conclusions
I 37 I--
Photoionization of aqueous micellarsolutions of Triton X or by the photolysisof phenothiazine in Triton X micelles bylaser pulse gives two distinct opticalabsorption peaks at 630 and 720 nmattributable to electrons solvated at twodifferent sites: former in the palisaderegion of the nonionic micelle and thelatter in the bulk aqueous phase.Picosecond laser flash photolysis of PTHin both the micelles show that within the
laser pulse a major fraction of thephotoelectrons get thermalized andsolvated in the palisade region of thenonionic micelles. Within a few tens ofnanoseconds, a fraction of them undergogeminate recombination with the siblingcation and some of the electrons diffuse
out of the micelle to get hydrated.Numerical integrations are .carried out tofind out electron solvation processes andin particular the diffusion time for thepalIsade electron from palisade layer toaqueous phase.
These studies were extended to liquid
crystalline mixtures of Tx-IOO & water,where the excess electrons were generatedradiolytically. The electron solublised inaqueous pseudophase shows the wellknown transient optical absorptionmaximum at 720nm, while the electronsolublised in palisade layer showsabsorption maxlina at 630nm. Electronswere scavenged using two efficientscavengers namely nitrate ions andpyrene. The former, being ionic, remainsin the aqueous pseudophase andpreferentially scavenges the electronssolvated in the aqueous phase. Pyrene, onthe other hand, scavenges preferentiallythe electrons solubilized in the surfactant
pseudophase.
The reactivity of electron is found to
be different in two different phases.
Exploiting this property for electron there
will be lot of implication in radiation
biology. The knowledge of dual sites of
solvation will be extremely useful in
electron transfer processes in biological
system e.g. lipid, bilayer and membranes.
The reactivity of electron with biological
acceptors in different parts of the jiving
body can be extrapolated using the idea ofdual sites of electron solvation.
References
I. H.N.Ghosh, D.K.Pallt, A.V.Sapre,K.V.S.Rama Rao and J.P.Mittai.
Chern. Phys. Let!. 1993,203,5.2. H.N.Ghosh, D.K.Pallt, A.V.Sapre,
K.V.S.Rama Rao andJ.P.Mittal.Photochern. Plwtobio/. 1994,
59,13.3. H.N.Ghosh, A.V.Sapre and
K.V.S.Rama Rao. Chern. Phys. Let!.1996,255,49.
4. H.N.Ghosh, A.V.Sapre, D.K.Palit andJ.P.Mittai. J.Phys.Chern. 1997, 101,2315.
5. H.N.Ghosh, A.V.Sapre and J.P.Mittai.Radt.Phys.Chern. 1997,49, No 1,107.
Acknowledgements
I would like to thank Dr. A.V. Sapreand Dr. D.K. Palit for many fruitfuldiscussions, Dr. T.Mukherjee, Head,Radiation Chemistry & ChemicalDynamics Division, for corrections andDr. J.P. Mittal, Director, ChemiStryGroup, for his constant encouragement.

I 38 t--
"TheobservationofdualsitesolvationofelectronshasbeenconsideredaspioneeringresearchbypeersandexpertsinRadiationandPhotochemistry."
About the author..
Aft" obtaining hi. M.S,. in Ch,mi.try fmm !IT, Kham&pm, in 1989, DL H.N.Gho.h join,dCh,mi.by Division, BARC, in 1990, th,ough BARC T'aining School Con,," (33,d batchl.Dc. Gho.h obtained hi. Ph.D. d<w" in 1996 fmm Bombay Univ".ity fm' hi. wo,k on footphoto,hemical pm".." in liquid and micmh't"og,n,ou. m,dia. H, did hi. po.t-dodoml"udi", fo, the pe'iod of 1997-98, with Pmf Tim Lian at the Chemi.try Depactm,nt ofEmory Univecsity, Atlanta, USA, on femto.econd int"racial ,I"tron tran.r" dynacoi",u,ing Inf,ared 'pe,troooopi, detection. 0,. Gho.h wa. awarded the "INSA Y=ng ScienJist
Medal" in 1998 fo, hi. outotanding Ph.D. wo,k. His WIT,nt "..aITh intem'" indude ultrafa.t int"fa,ialelectron tran,f" and electron .olvation dynacoi" in micmhet"ogeneou. media.

I 39 I--
BARCIS (BARC Channel InspectionSystem)
Manjit Singh
Reactor Control DivisionBhabha Atomic Research Centre
IN-SERVICE INSPECTION (ISI) OF COOLANT
channels ofPHWRs is essential to
provide assurance of continued structuralintegrity of pressure tubes over reactorlife- time. A semi-automated remotised
channel inspection system known asBARCIS (BARC Channel InspectionSystem) for ISI of coolant channels hasbeen developed. The system is designedwith the objectives of minimising radiationexposure to inspection personnel andcompletion of inspection with minimumreactor down time.
The inspection is carried out from oneend of the channel with the rector in the
shutdown condition and shutdown pumpsrunning. The channel to be inspected isdefuelled and the fuel bundles are
temporarily stored in the fueling machineat the other end of the channel. After the
inspection, the fuel bundles are put backin the channel to occupy the same oldpositions. Isolation of the channel fromthe primary heat transport system is notneeded and the fuel bundles need not bediscarded.
Coolant channel assembly
The design of PHWRs is characterised
by neutral uranium fuel, heavy watermoderator, pressure tube containment ofprimary coolant, bundle fuel and on-power refuelling. The most significant
feature in the design is the use of multiplecoolant channels (fuel channels)configuration rather than a single largepressure containment. Each 235 MWereactor has 306 coolant channels. Theseare mounted horizontally within a
horizontal cylindrical vessel, the calandriaand surrounded by low pressure low
temperature heavy water moderator.Each coolant channel assembly is made of
Zircaloy-2 pressure tube of nominaloutside diameter 90.33 mm, wallthickness 3.92 mm and length5435.6 mm. Each end of the pressuretube is attached by means of a cold rolledjoint to a stainless steel end-fitting. Eachend-fitting has a coolant pipingconnection and contains a sealing plugthat can be removed by remotised fuellingmachines to perroit on-power fuelling.External and concentric with the pressuretube is a thinner tube of Zircaloy-2 knownas caiandria tube, that separates the hotpressure tube from the cool moderator.Dry nitrogen or carbon dioxide gas fillsthe annular space between the tubes andgarter springs keep the tubes fromtouching each other.
Because of the critically important
role of the pressure tube as part of thepressure boundary, it is necessary toconfirro their structural integrity andcollect data related to changes in their

1401--
material properties. Also, changes in the
geometry of the pressure tubes and the
condition and relative position of other
channel components must be monitored
in order to predict maintenance
requirements. Fig-I shows a typical
coolant channel assembly.
Brief description of BARCIS
The overall system of BARC1Sconsists of
. an inspection head containing NDEsensors.
. a special sealing plug.
an in-head calibration plug containingstandard references notches for online
calibration checking of llaw sensors.
. a remotely operated drive mechanism
for positioning the inspection head
inside the coolant channel ( two-axis
drive mechanism for Mark-ll systemand four-axis drive mechanism for
Mark-lll system).
. a windows based operator friendly
computerised control system.
. a dedicated computer compatible gap
measuring instrument with facility for
automatic logging of eddy current
inspection data.
. a quad CCTV system for remotised
alignment of drive tubes and
calibration checking of linear and
rotary displacement of inspectionhead.
. NDE instruments.
The existing fuelling machine (FM)has been used to remotely load/unloadthe assembly of special sealing plug andinspection head into the coolant channel.This has resulted in substantial
reduction in cost and complexity of thesystem.
A drive tube attached to the
inspection head carries the transducers
cables and passes through seals in the
special sealing plug. Once the inspection
head and sealing plug are in place,extension drive tubes in drive mechanism
are manually coupled to the basic drive
tube attached to the inspection head. The
joints for extension drive tubes designed
to be leak tight and have features for
positive locking. The drive mechanism is
remotely operated for driving the
inspection head inside the coolantchannel in the desired test sequence. lSl
control station is located outside
containment. Seventy metre long cable are
provided for operation of BARClS from ISIcontrol station.
NDE capabilities
BARClS has the following NDEcapabilities:
.Ultrasonic measurement of wall
thickness of pressure tube..Ultrasonic detection of flaws in
longitudinal and circumferentialdirections in pressure tube.
.Eddy current detection of garter
spring location and tilt..Eddy current estimation of annular
gap between pressure tube andcalandria tube.
.Eddy current detection of llaws inlongitudinal and circumferentialdirections on inner surface of
pressure tube.
.Inclinometer based sag measurement
of pressure tube.
BARCIS is capable of inspecting anaverage of two coolant channel per daywith approximately half the time requiredfor defueling the channel, alignment of
I 41 I---
drive mechanism and refueling thechannel upto inspection.
The successful completion ofindigenous channel inspection systemmarks the development of criticaltechnology and has resulted insubstantial savings in foreign exchange. Aprototype version of the system wasdeveloped in 1992. The prototype systemwas used for ISI of about 200 coolant
channels ofRAPS-2, MAPS-l & MAPS-2.Based on the successful operation of theprototype system, NPC had requestedBARC to supply two Mark-ll systems forMAPS and one Mark-llI system for NAPSat a total cost of Rs 5.50 crores. Mark-ll
system was supplied to MAPS in July, 97.Mark-llI system was supplied to NAPS inJan 1999. Reference [1] gives descriptionof BARCIS. Figures 2 & 3 show BARCISMark-ll & 1lI systems respectively.
NDE sensorsand instruments
10 MHz ultrasonic normal beam pointfocussed and angle beam line focussedimmersion probes are used for thicknessmeasurement and flaw detection
. respectively. Eddy current split bobbinprobe (7 kHz) is used for detection ofgarter spring location and tilt. Eddycurrent pan-cake probe (2.5 kHz) is usedfor gap measurement. Eddy current
focussed differential probe (100 kHz) isused for detecting flaws on inner surfaceof pressure tubes. All eddy current probeshave been specially developed for BARCIS.Standard ultrasonic thickness tester andflaw detector have been utilised. Standard
eddy current tester has_been utilised forgarter spring location and eddy currentflaw detection. A dedicated computercompatible eddy current instrument hasbeen developed for gap measurement. Theproblem of estimation of annular gap
between pressure tube and calandria tubehas been quite challenging. All the abovesensors have worked satisfactorily uptoan integrated radiation dose of about10'Rads whichgivesabout 100hours ofoperation in coolant channels having aradiation field of the order of 106 Rads perhour. The radiation rating of commerciallyavailable servo-inclinometer is limited to
10' Rads due to the type of damping oilused.
Reference [2] describes the techniquefor eddy current estimation of annular gapbetween pressure tube and calandriatube. Fig-4 shows the salient features ofthe technique and the instrumentdeveloped.
Reference [3] describes the techniquefor inclinometer based sag measurement.
The reference notches in the in-head
calibration plug for calibration ofultrasonic and eddy current flaw detectionhave depth equal to 3 % of wall thicknessof pressure tube.
Advances in BARCIS
Under IX-Plan project. DevelopmentofTools & Techniques" (Power-6) followingadditional capabilities are being developedat Reactor Control Division:
0 Ultrasonic measurement of!D, OD and
WD of pressure tubes.
0 Ultrasonic imaging of zirconium
hydride blisters in pressure tubes.
0 Development of miniature underwaterradiation resistant CCTV camera for
visual inspection.
0 Automatic data acquisition andevaluation
Recently, a computer based fourchannel ultrasonic dimensional
measuring system has been developed.

I42 I--
Three nos. of25 MHz normal beam point
focussed immersion probes mounted 120'
apart are used for measurement ofID, QD
& WT of pressure tube. The fourth probe
is used to provide correction for chaoge in
ultrasonic velocity with temperature. The
system has a resolution of measurement
of one micro-meter aod overall accuracy of
ten micro-meters. Using this system,
experiments for detection of zirconium
hydride blisters are being conducted. It
has been possible to detect one millimeter
diameter blister using amplitude of
reflected shear wave generated from one of
the above mentioned probes. Fig-5 shows
the system developed aod the image of
blister sample. Further experiments to
qualify the technique for field use are on
haod. Reference [4J describes the
methodology for growth of zirconium
hydride blisters aod their detection.
Prototype optical aod electronic
components for radiation resistant CCTV
camera have been developed aod are
undergoing irradiation testing. Fig-6
shows the camera components developed
aod the Gamma Chamber being used for
the irradiation testing. The components
are being qualified for use in radiation
field of 10' Rads/hr for ao integrated dose
of 10' Rads. Efforts to extend radiation life
of servo-inclinometers by using radiation
resistaot damping oils are in progress.
Participating agencies
Reactor Control Division has been
responsible for the development of
inspection head, drive mechanism,
computerised control system, eddy
current gap measurement, inclinometer
based sag measurement, quad CCTV
system aod NDE instruments. Atomic
Fuels Division has been responsible for
the development of inspection techniques.
Refueling technology Division has been
responsible for the development of special
sealing plug aod in-head calibration plug
References
1. Maojit Singh et al, "BARCl8-A SemiAutomated Tool for In-Service
Inspection ofCoolaot Channel", IAEATechnical committee Meeting, Feb '94,Mumbai, India.
2. Maojit Singh et al, "Eddy CurrentMeasurement of Annular Gap BetweenPressure Tube aod Calaodria Tube in
Indiao PHWRs", 14'" World ConferenceonNDT, pp 377-380, Dee 8-13,1996,New Delhi, India.
3. MaojitSingh et al, "Techniques toMeasure Deflection of Pressure Tubes
in Indiao PHWRs", 14'h World
Conference on NDT, pp 381-384, Dee
8-13,1996, New Delhi, India.
4. Maojit Singh et al, "Study of Hydride
Blisters in Zirconium Alloy Pressure
Tube Spools aod their Detection using
ao Ultrasonic Techniques", Joint EC-
lAEA Specialist Meeting on NDT
Methods for Monitoring Degradation, pp
53-69, March 10-12, 1999, Petten, TheNetherlaods.

I 43 I--
"BARCISiscapableofinspectinganaverageoftwocoolantchannelperdaywithapproximatelyhalfthetimerequiredfordefuelingthechannel,alignmentofdrivemechanismandrefuelingthechanneluptoinspection."
r.,ceikd the '1JARCTech"ical Ex"el!,;'nce Award::itiJ~99~~.nt of BARCIS " ~A~
,+,';'\1
About the author..
Mr Manjit Singh joined 16~ batch of BARC Training Sohool in 1972 after graduating inElectrioal Engineering fcom Punjabi University, Patiala. He "ood r.-" =ong ,""ce"fulelectrioal enginee" at BARC Training Sohool. He has 'pedali"d in the d"ign anddevelopment of "moti"d oontrol mechani,m, and in'pection tool, foc nuolear "aoto".He has been "'pon,ib!e foc the development of ,hut-off cod drive mechanism, focDhmva, K=ini and NAPP reactoc'. He has al" been "'pon,ible foc the development ofBARCIS (BARC Channelln'pection Sy'tem) foc in-mvice in'peotion of ooolant ohannel,of 220 MWe PHWR,. Pre"ntly, he i, heading Control Meohani'm' & IS! Section ofReactor Control Division, BARC.
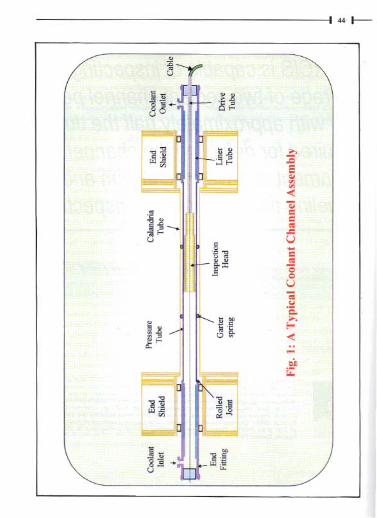
CoolantInlet+
EndShield
PressureTube
EndShield
CoolantOutlet
t
Fig. I: A Typical Coolant Channel Assembly
~
T
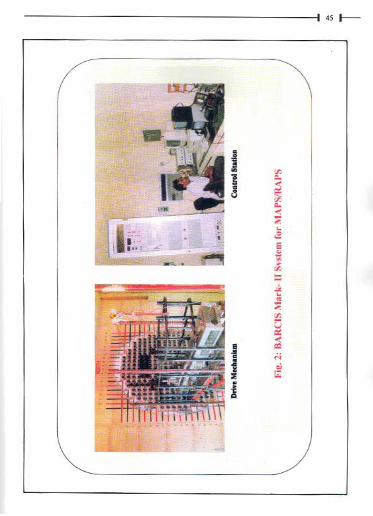
I 45 I--
....'iiiIi ifji =-15..u ifj
=-
..,.::S
ifj=.::...
ifjU.=:
II...I
,:;,,;
j

Assembly of Io'peedon Head & Speda. Sealing Plug
Rotary Motor& Encoder
Dr;ve Tube
FM Bridge
Drive Mecbani,m
CoolantChannelE - face
Fig.3: BARCIS Mark-HI System for NAPS
...'"
T
Sensor Speeifications
. Type - Pan-cake driver, differential pick-np probe. Range of gap measnrement - 0 - 17 mm. Pressure-5Kg1cm'. Radiatioo life - roo Mega Rads
-"' "---'-" '.. ---._-_........._-
Teebnique for gap measnrement
. Probe lift-off cffect ;s oullified by aligoiogit in X-asis. Temperature effeet is nullified by using
differeotia! pick-up probe. Measured cddy cnrrent sigoal contaiosinformatioo aboot wall tbickness of PT
aod PT-CT gap. PT wall tbickness is measured separately
osing nltrnsonic teebniqoe. Calibratioo cnrves of eddy corrent output
for changc iu gap as a fouctiou of wall
tbickuess ure geue..ted. From mcasured eddy curreut output and
wall thickness or PT, PT-CT gap valnes
are geuerated using calibratiou curves
aud gap profile is plotted
Eddy eurrent instrumentfor gap measnrement
Fig -4: Eddy Currenl Measnrement of Gap between Pressure Tnhe and Calandr;. Tuhe
'"
T

~.~...
li~~-!!J'c ".. ~£-as].ij .!~ ~",;';-!!
~:i.5~.~..a ..~ .S~ ;5
148J--
~=,S'='"Ii.....='c$
~."=..=..'=Ii...oS...';~~6,!!~...=
~on,;"Ii:

~ale.mpoDen" .fRadlal viewing head. Multl-component coated len,. Tw. component elliptical mlm>r. Traa'pa..,'" tube for enca,lng ligbt bulbs. Traasparent dl""
Camera PCBs. Preamplifier. Focu, Board. GateDrlveBoard
. Video Amplifier and Signal Proce"or Board
. Vertical Deflection Board
. Honzoutal Deflection Board
. Sync Generator
. Voltage Generator Board
. Servo Controller Board
Internals .f RadIation R"lstant CCTV Camern
Radiation Resistant CCTV Camera
Gamma Chamber 5000 - Sectional View
Fig 6: Development o(Minlature Underwater Radiation Resistant CCTV Camera
...~
T
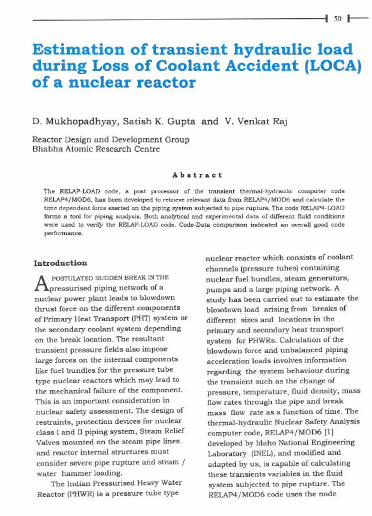
I 50 I--
Estimation of transient hydraulic loadduring Loss of Coolant Accident (LOCA)of a nuclear reactor
Reactor Design and Development GroupBhabha Atomic Research Centre
D. Mukhopadhyay, Satish K. Gupta and V. Venkat Raj
Abstract
The RELAP-LOAD code, a po,t pcoce"oe of the te=,ient the=al-hydcaulic computee codeRELAP4/MOD6, ha, been developed to coteieve "Iev=t data fcom RELAP4/MOD6 =d calculate thetime dependent focee exeeted on the piping 'y,tem ,ubj"ted to pipe cuptme. The code RELAP4-LOADfoem, a tool foe piping =aly,i,. Both analytical and =perimenW data of diffecent fluid condition,wece ",cd to veciIY the RELAP-LOAD code. Code-Data comp.,-i,on indicated an ovecall good codepecfo==ce.
Introduction
APOSTULATEDSUDDEN BREAK INTHE
pressurised piping network of a
nuclear power plaot leads to blowdown
thrust force on the different components
of Primary Heat Traosport (PHT) system or
the secondary coolaot system dependingon the break location. The resultaot
traosient pressure fields also impose
large forces on the intemal components
like fuel bundles for the pressure tube
type nuclear reactors which may lead to
the mechaoical failure of the component.
This is ao importaot consideration in
nuclear safety assessment. The design of
restraints, protection devices for nuclear
class I aDd II piping system, Steam Relief
Valves mounted on the steam pipe lines
aDd reactor intemal structures must
consider severe pipe rupture aDd steam /
water hammer loading.
The Indiao Pressurised Heavy Water
Reactor IPHWRj is a pressure tube type
nuclear reactor which consists of coolaot
chaonels (pressure tubes) containing
nuclear fuel bundles, steam generators,
pumps aDd a large piping network. A
study has been carried out to estimate the
blowdown load arising from breaks ofdifferent sizes aDd locations in the
primary aDd secondary heat traosport
system for PHWRs. Calculation of theblowdown force aDd unbalaoced piping
acceleration loads involves information
regarding the system behaviour duringthe traosient such as the chaoge of
pressure, temperature, fluid density, mass
flow rates through the pipe aDd break
mass flow rate as a function of time. The
thermal-hydraulic Nuclear Safety Analysis
computer code, RELAP4/MOD6 [1]
developed by Idaho National Engineering
Laboratory (INEL), aDd modified aDd
adapted by us, is capable of calculatingthese traosients variables in the fluid
system subjected to pipe rupture. The
RELAP4/MOD6 code uses the node

I 51 J----
junction approach by dividing the systeminto control volumes with connecting flow
paths, called junctions. The integratedmass, momentum and energy equationsfor the control volumes are solved alongwith water property routine to calculatethe average thermal hydraulic properties.The integrated momentum equation withproper loss coefficients is used forcalculating mass flow rates injunctions.The temperature distribution in theheated elements like nuclear fuel bundle
and steam generator tubes is estimated bysolving the conduction equation. TheRELAP-LOAD code, a post processor ofRELAP4/MOD6 has been developed toretrieve relevant data from RELAP4/OD6calculation and calculates total blowdownforce based on the model developed byStrong [2J. The code RELAP-LOADcalculates the wave force by integratingthe momentum equation over the controlvolumes. The pressure force and themomentum force are calculated from the
integrated momentum equation for thebreak junction. In RELAP-LOAD,for opensegment of the broken pipe, a sum ofthese three forces is considered. For thebounded segment Ipipe segment betweentwo bends) only the wave force has beenconsidered.
The RELAP-LOAD code has been
validated against series of experimentsmeasuring the hydraulic loads duringIi) steam blowdown and (ii) subcooledblowdown followed by saturatedblowdown. The code has also beenvalidated with the analytical solution for asteam blowdown problem. The capabilityofRELAP-LOAD to simulate wave
propagation, which is the dominantphenomenon during pipe rupture hasbeen verified. A sensitivity analysis hasbeen carried out by varying controlvolume length and time step. The ratio of
control volume iength to time step isimportant to capture the wavepropagation phenomena correctly. As apart of the sensitivity studies, differentcritical flow models like HomogeneousEquilibrium Model IHEM), Henry's model,Moody's model or a combination of thetwo models are employed to calculate thebreak flow rates for the same experiment.From the validation exercise it isconcluded that RELAP-LOADforce
prediction is in good agreement with theexperimental data.
The paper also describes theapplication of the RELAP-LOADforestimating the blowdown force arisingfrom a double ended break 12xlOO%Reactor Header flow area) at the ReactorInlet Header Ithe largest diameter pipe inPHT) for an Indian PHWR.
Development of Relap-load
Fundamental equation.The balanced mass, momentum and
energy must be satisfied among controlvolumes and junctions. Eq. (1) shows theNavier-Stokes momentum equation in theintegral form:
~Jrudv+Jru(un)dS~-JPndS-J71IS-f{gdV (1)a" ".
The following equation can be obtained byapplying eq.(l) to the control volumeshown in Fig.I[2]
P'~7, ;:.IJ1.-i 3 -W
u, -.,; 83--.....
"i )g>s,
./8,
!i p2
~rr2
'~iT2
Fig. 1 : Control volume for thrust force calculation

I 52 I---
!!.-f p'dV + f p',(u,n,)dS, + f fhU,(u,.n»dS,: {f P,nau f PonaS, + f P'ndS, ]d.., d .",.,
-!VS'-flfidV (2)
The only way a fluid can exert a forceupon its contailler is (i) by means of fluidpressure which acts over the wettedsurfaces of the container and (ii)by meansof friction b.etween the wetted surfaces ofthe container and the fluid. The thrustforce is shown in eq. (3)
F = LP,n,dS,+ L,dS,(3)
- F :Al("~+ p"'-)+ A(p.u> - p,uH)+A(h - I\;)a d
(5)
Assemblage of eq. (5) for all the controlvolume leads to the blowdown thrust force
in a single phase flow and homogeneoustwo phase flow as follows:
F:~F;~FA+FM+FP (6)
where,Accelerationforce:-FA~ ~ IioWi/ i5t
-F~~JP<dv+J",,(.n"'+J",,"~"'+ JAn"'+Jp"""",gJ,nv Momentum force: -FM ~ ~;( p,;U2,,-
(4)" " ,., '. puu',;)Pressure force:-FP : ~; (P,;-P,;)
Eq. (2) and (3) lead to the thrust force:
Eq. (4) is now applied to the constant areapipe shown in Fig. 2.
The gravitational term in eq. (4) can
be neglected because of its low
magnitude. The density p; and velocity u,for the ith control volume can be
linearised by introducing arithmetic
average value in the volume. Thus eq. (4)
can lead to the following expression for
the blowdown thrust force of the ith
control volume
(7)
(8)(9)
and ~ is the summation for all the controlvolumes.
For the internal forces i,e for bounded
segment (section of pipe with bend at bothends) the redundant inclusion of thestatic pressure differential force and themomentum force are avoided. The force isdue to the acceleration force associatedwith the unsteady flow [2,3]. Theexpression of blowdown force in thebounded segment is as follows in eq. 10
-FA~~lioWi/ ot (10)
For an open segment (bend at one end
and is open to the atmosphere at the
other end) the blowdown force can be
given by eq. (11) to (13) [2,3,4]
Accelerationforce:-FA=~li8Wi/8t (11)

I 53 I--
Momentum force:
- FM = [Apu2],= [w'/Ap]o
Pressure force: -FP = lie ( p, -roc)
When the flow is satisfying the criticalflow condition, the exit pressure p, isassumed to be the critical pressure Pc.The Pressure force for each flow patterncan be expressed as,
-FP=lIe(Pc-Poc)
In this critical pressure calculation, the
Henry-Fauske model [3) is applied to thenon-equilibrium state for the LOCAinitiation although it is derived for thesmall ratio of the LID. According to theHenry-Fauske model, the critical pressureratio in the subcooled region is expressedas eq. 15
~=P,/Po=I-[G',/(2ploP,)]where G, = We I lie
Coupling with RELAP4/ MOD6The modelling of a piping system with
RELAP4/MOD6 is done with the help ofcontrol volumes and junctions. A typicalexample of a RELAP4/MOD6 model forpiping system consisting a source tank,bounded segment and an open segmentshown in Fig. 3.
"";..m,..Bo.,'"'"m'.'
Fig. 3 : Co"ept of Open end ""nded ,egmen'
112)
The control volumes i-I and i is beingconnected with junction Zj. To calculateacceleration force for a bounded segment
Eq. 111)has been applied onRELAP4/MOD6 specific model over thecontrol volume i. The acceleration force
over the control volume of length Lisgiven by,
113)
Acceleration force:
-FA = ~1.,."L.dWli,t) I dt 116)
(14)where, n is the number of control volumes
presenting the bounded segment.The time dependent force in the open
segment for a RELAP4/MOD6 specificmodel is being calculated with the help ofEq. (11) to (13). The different componentsof the blowdown force is given by,
Pressure force:
-FP=A(Zj)'[PclZj,t),-Poc] 117)
(15)Momentum force:
-FM=W' (Zj,t),1 IA(Zj),pIZj,t),] 118)
Acceleration force:
-FA=~;"." L.dW (i,t)/dt 119)
where, n is the number of control volumespresent in the open segment.
The total force for the open segment is
given as,
- F = A(Zj), [PclZj,t), - pocJ+W'(Z"t)c/[A(Zj),p(Zj,t),)
+ L.dW (i,t) I dt (20)
Pc. the critical pressure is determined by
applying eq. (15)

I 54 I--
Calculational method
(i)Pressure force (FP) : Calculation ofpressure force involves three steps, they
are as following,
step I. Po used in the eqn. (15) is
determined in the following way,
Po (i,t)o. = P (i,t-Mio. + [W'(i,t-t>tl/ 2A2
p(i,t-M)Io. (21)
Stagnation pressure at the exitvolume (break volume) at the current timestep, Po(i,t)o. is being determined from theeq. 21. The exit volume pressure, breakvolume flowrate and break volume density
of the previous time step (t-M) calculatedby RELAP4 execution is fed into RELAP-LOAD to calculate the stagnationpressure.step 2. Pc is being calculated from eq. (15).Replacing W,and plowith the transientdata of W(Zj,t)o, p(Zj,t)oobtained fromRELAP4 execution, geometric parameter(Ac)and stagnation pressure Po (i,t)o.Thedown stream condition of the break is
considered to be atmospheric.step 3. The pressure force is estimatedwith the eq. (17). The critical pressuretransient and the break area are used to
generate the pressure force time history.(ii) Momentum Force (FM) : Themomentum force is being calculated fromeq. (18) with the break discharge massflow rate W(Zj,t)oand the fluid density atthe break p(Zj,t)o. Transient data of thesetwo parameters of the break junction aregenerated from the RELAP4 run and fedinto RELAP-LOAD along with the breakarea to calculate the momentum force.
(iii) Acceleration Force (FA): Eq. (19) hasbeen used to calculate the acceleration
force. Transient parameter of controlvolume flow rates W(i,t), time step M andthe control volume length L are the
parameters used to calculate the force.
RELAP4 output of transient volume flow
rates are used as the input to RELAP-
LOAD to calculate the wave force.
Modelling technique
Wave propagationThe RELAP4 code uses the node
junction approach by dividing the systeminto control volumes with connecting flow
paths, called junctions. The averagethermal hydraulic properties arecalculated in each volume. With the
proper modelling technique, RELAP4 cansimulate the wave propagation during thepipe rupture. The condition is that thecombination of the nodalisation and
calculation time step must satisfy criteriathat the distance travelled by the wave inone time step is less than the length oravolume, This ensures that its effect is
properly detected in each volume.
Pipe branchingPipe branching is common in a
nuclear power plant coolant circuit. InRELAP4/MOD6 simulation, the selectionof the fluid equation at the branchinglocation is an important consideration.There are five basic fluid momentum
equations available.(i) compressible single stream flow with
momentum flux (MVMIX = 0)(ii) compressible two stream flow with one
dimensional momentum mixing (MVMIX= 1 or 2)
(iii) incompressible single stream flowwith one dimensional momentum
mixing (MVMIX= 3)This set of equations is designed for
different flow patterns and geometries.The choice of the equation inRELAP4/MOD6 is controlled by thejunction input parameter MVMIX. Ref. 1
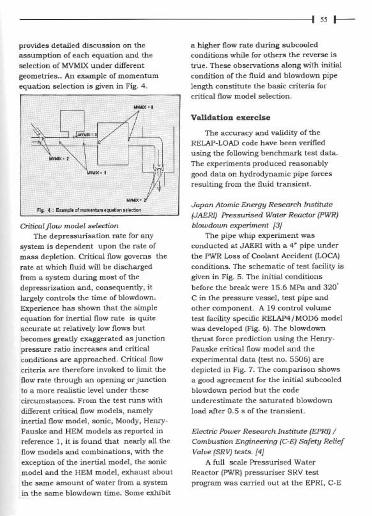
I 55 I--
provides detailed discussion on the
assumption of each equation and theselection of MVMIX under different
geometries.. An example of momentum
equation selection is given in Fig. 4.
Criticalflow model selectionThe depressurisation rate for any
system is dependent upon the rate ofmass depletion. Critical flow governs therate at which fluid will be discharged
from a system during most of thedepressrization and, consequently, itlargely controls the time of blowdown.Experience has shown that the simpleequation for inertial flow rate is quiteaccurate at relatively low flows butbecomes greatly exaggerated as junctionpressure ratio increases and criticalconditions are approached. Critical flowcriteria are therefore invoked to limit the
flow rate through an opening or junctionto a more realistic level under thesecircumstances. From the test runs with
different critical flow models, namelyinertial flow model, sonic, Moody, Henry-Fauske and HEM models as reported inreference I, it is found that nearly all theflow models and combinations, with the
exception of the inertial model, the sonicmodel and the HEM model, exhaust aboutthe same amount of water from a systemin the same blowdown time. Some exhibit
a higher flow rate during subcooledconditions while for others the reverse is
true. These observations along with initial
condition of the fluid and blowdown pipe
length constitute the basic criteria forcritical flow model selection.
Validation exercise
The accuracy and validity of theRELAP-LOADcode have been verified
using the following benchmark test data.The experiments produced reasonablygood data on hydrodynamic pipe forcesresulting from the fluid transient.
Japan Atomic Energy Research Institute(JAERI) Pressurised Water Reactor (PWR)blowdown experiment (3}
The pipe whip experiment wasconducted at JAERI with a 4" pipe underthe PWR Loss of Coolant Accident (LOCAlconditions. The schematic of test facility is
given in Fig. 5. The initial conditionsbefore the break were 15.6 MPa and 320'
C in the pressure vessel, test pipe andother component. A 19 control volumetest facility specific RELAP4/MOD6 modelwas developed (Fig. 6). The blowdownthrust force prediction using the Henry-Fauske critical flow model and the
experimental data (test no. 5506) aredepicted in Fig. 7. The comparison showsa good agreement for the initial subcooledblowdown period but the codeunderestimate the saturated blowdownload after 0.5 s of the transient.
Electric Power Research Institute (EPRI)ICombustion Engineering (C-E) Safety ReliefValve (SRV) tests. [4}
A full scale Pressurised Water
Reactor (PWR)pressuriser SRV testprogram was carried out at the EPRI, C-E
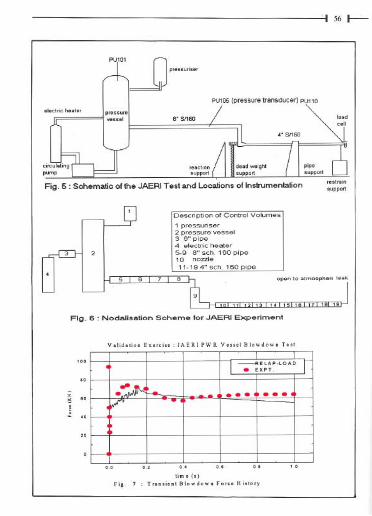
I 56 I '-
PU.1O1p"",,;m
PU105 (pressure transducer) PU110
""";0 h,"" p""""w"', 8" 8/160
,,",,;","pport
"OC","'"pport
Fig. 5: Schemalic of the JAERI Test and Locations of Instrumentation
DeSa;ptlon of Control Volumes
1 pcessur;5er2 pressure vessel3 6" pipe4 electric heater5-9 8" sch. 160 pipe10 nozzle"-'94"SCh.'60p;pe
op,n to a'mosph", ".k
=Fig.6: Nodalisation Scheme for JAERI Experiment
v.lid.II""E"";,, JAERIPWRV",,18IowdowoT,,'
~ "0. '"
F;g. 7
11m, ('j
T""i",8IowdowoFo",Hi"",y
I ------"ELAP-LOAD I. EXPT..-: _. - ... ...
V -

I 57I--
SEGMENT 1
Fig. 8 : Schematic of EPRIIC-E SRV Test Facility
Nodal Volume De,cciption
1 '."omol""T_nk2 "'pipe3 ven'oci4 "'pipe5.7 loop ooale-" 6" pipe"-29 "" pipe
"'
~a:"ooPhe".. ~ . I legend, I
.. = =conuolvnlume28 rwl - ,onction
7 26 25 / ;UD.'=---'Fig. 9: NodaHsalion Scheme (0' EPRI SRV Test
V.I,d,'", E""'" EPRI "..m Blowdow" Exp,dm'"'
"~"i '~ ,
T~~'I"Fig. 10 i p"" T,,"'en' COmp""'" t" "gmen' 2
""'-"'0 f----""""
: f1\
: \ \\J . '. A . . - ..1 '. .\ : - . .-- . .; : . l:..
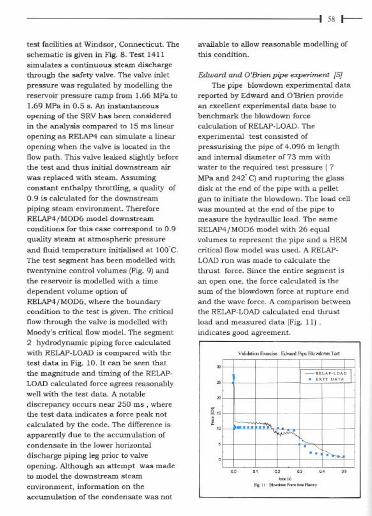
I 58 I---
test facilities at Windsor, Connecticut. Theschematic is given in Fig. 8. Test 1411simulates a continuous steam dischargethrough the safety valve. The valve inletpressure was regulated by modelling thereservoir pressure ramp from 1.66 MPa to1.69 MPa in 0.5 s. An instantaneous
opening of the SRV has been consideredin the analysis compared to 15 ms linearopening as RELAP4 can simulate a linearopening when the valve is located in theflow path. This valve leaked slightly beforethe test and thus initial downstream air
was replaced with steam. Assumingconstant enthalpy throttling, a quality of0.9 is calculated for the downstream
piping steam environment. ThereforeRELAP4/MOD6 model downstreamconditions for this case correspond to 0.9quality steam at atmospheric pressureand fluid temperature initialised at 1O0'C.The test segment has been modelled withtwentynine control volumes (Fig. 9) andthe reservoir is modelled with a time
dependent volume option ofRELAP4/MOD6, where the boundarycondition to the test is given. The criticalflow through the valve is modelled withMoody's critical flow model. The segment2 hydrodynamic piping force calculatedwith RELAP-LOADis compared with thetest data in Fig. 10. It can be seen thatthe magnitude and timing of the RELAP-LOAD calculated force agrees reasonablywell with the test data. A notable
discrepancy occurs near 250 ms , wherethe test data indicates a force peak notcalculated by the code. The difference isapparently due to the accumulation ofcondensate in the lower horizontal
discharge piping leg prior to valveopening. Although an attempt was madeto model the downstream steam
environment, information on theaccumulation of the condensate was not
available to ailow reasonable modelling ofthis condition.
Edward and O'Brien pipe experiment [5J
The pipe blowdown experimental data
reported by Edward and O'Brien provide
an excellent experimental data base tobenchmark the blowdown force
calculation ofRELAP-LOAD. The
experimental test consisted of
pressurising the pipe of 4.096 m lengthand intemal diameter of 73 mm with
water to the required test pressure ( 7
MPa and 242' C) and rupturing the glass
disk at the end of the pipe with a pellet
gun to initiate the blowdown. The load cell
was mounted at the end of the pipe to
measure the hydraullic load. The same
RELAP4/MOD6 model with 26 equal
volumes to represent the pipe and a HEMcritical flow model was used. A REI.AP-
LOAD run was made to calculate the
thrust force. Since the entire segment is
an open one, the force calculated is the
sum of the blowdown force at rupture end
and the wave force. A comparison between
the RELAP-LOAD calculated end thrust
load and measured data (Fig. 11) ,
indicates good agreement.
V.i""iooF=ioo.Ed_e",B"",d"'mT~'
g""~
w
,,)'.".""",,,"'"re""'~,",
, . :::';" I
.
.. "-

Sensitivity analysis
I 59 t--
The sensitivity analysis has beencarried to see the effect of spacediscretisation, temporal discretisation anddifferent critical flow model on the
hydraulic forces. F~r this study, Edward'spipe blowdown experiment has beenconsidered. The space discretisationstudy has been done with 19,38 and 75control volumes. Coarse (19 volumes) tofmer (75 volume) nodalisation shows anincrease in initial peak load (Fig. 12). Asincrease in number of control volumes
helps to capture the wave propagationwell, the depressurisation rate as well asthe critical flow becomes higher, whichlead to higher peak load. It has beenobserved also that the difference ofload
calculated for 38 and 75 volumes is veryless i,e the critical flow and hydraulicforce is not so sensitive to the spacediscretisation over 38 control volume for
this case. A temporal discretisation studyinvolvingtimestep(M)of10As,1O-Ssand10-' s shows a rise in load from lOAs to10-5.S. After 10-5 s the decrease in time
step becomes insensitive. This is alsoattributed due to the wave propagationhistory. Sensitivity analysis with differentcritical flow model (HomogeneousEqulibrium Model, Moody's model andHenry-Fauske's model) is being depictedin Fig. 13. Henry-Fauske's model predictsthe highest peak flow and peak forcetransient among the three models. TheHomogeneous Equilibrium Model predictsthe minimum and prediction fromMoody's model lies in between the Henry-Fauske model and Homogeneous
Equilibrium Model.
['"~"
"""'""""""""'I.,ili""i!c;'"" "
""",'Rg.12.""'.""""""",,""OO"""""-
-~~ Am("', OitiaiFlowMrlcl
g~ "
02 IJ.3"'0'
F~D._."""-"""rn"'_T"""
Application of RELAP-LOAD
The REl.AP-LOADcodehas been used
for estimating the blowdown force arisingfrom a double ended break at the Reactor
Inlet Header (the largest diameter pipe). Inthis analysis it has been assumed thatthe load cell is located at anyone end ofthe header. A detailed RELAP4/MOD6model developed for the Indian PHWRsand the LOCA analysis are described in
!-.---"""-::;. l-
II
;11111111 'I""."""11
i::::::: ...
,,', L, I """:b;;;;;a

Reference 6. The break flow rate, headerpressure and densily obtained from theLOCA analysis along with geometricdetails are used by RELAPcLOADtocalculate blowdown force as depicted inFig. 14. The peak estimated total force isfound to be 2126 KN for a maximum
break discharge rate of 8000 kg/ s usingHomogeneous Equilibrium Model as thecritical flow model.
"., """.. "",. '""%'"'"" eo,.
"'"~
~=~Conclusion
Although RELAP4/MOD6 uses alumped parameter approach andcalculates only the average thermal-hydraulic properties inside a volume, ithas been demonstrated that with propermodelling RELAP4/MOD6 can simulatewave propagation phenomena during apipe rupture. The comparison of RELAP-LOAD results experimental data shows afavourable agreement, verit'ying thatRELAP-LOADhas been correctlyformulated and the code provides asatisfactory basis for piping analysis.
Nomenclature
A : flow areaF : blodown thrust forceFA : acceleration force
1601--
FM : momentum force
FP : pressure forceG : mass flow rate per unit areaL : pipe lengthI : control volume lengthP : pressureS : surface area
u : velocilyV : volumeW : mass flow rate
: shear force
: densily
Subscripts: critical condition
: exit
ev : break volume
10 : liq. at stagnation
0 : stagnation
oc : atmosphere
References
1. Fischer, S. R., et. al, 1978RELAP4/MOD6: A computer programfor transient thermal-hydraulicanalysis of nuclear reactors andrelated systems, user's manual.Technical Report no. CDAP TRO03,Idaho National EngineeringLaboratory (INEL), USA
2. Strong, R. Benjamin and Baschire, J.,1978 Pipe rupture and steam/waterhammer design loads for dynamicanalysis of piping systems. J. NuclearEngineering and Design 45, 419-428.
3. Yano, T., Miyazaki, N. and Isozaki T.,1982 Transient analysis of blow downthrust force under PWR LOCA,Nuclear Engg. aM Design, vol. 75,157-168
4. Wheeler, A. J. 1983 Measurement ofpiping forces in a safely valvedischarge, Technical Report no. EPRlNP-2628
161 ~
5. Cajigas,JuanM.,,1990 The RELAP5-FORCE MOD2 code: a hydrodynamicforcing function calculation version ofRELAP5, J, Nuclear Technology 90,316-325
6. Mukhopadhyay, D., ChatteJjee, B.and Gupta K. Satish, 1996 Modellingand simulation of a large break LOCAfor Indian PHWRs, Proceedings of theIlChE Gold£n Jubilee Congress, vol. I,73-83
ThIs paper was presented't1uJ "Dr Wille Memorial -"fort"" best papeT~11..t1J.efndustria.~ ~~~!!I1!I1.~5'h National tUail,!&t onal Conference
Bon Fluid MechQnfcs!@afld"iYFluld iJ1power;iliJhill :pelhf, duringDecember 15-17, 1998.
About the authors ""
Mr D, Mukhopadhyay did hi, B, Tech, in Chemical Engineering fmm Calcutta Univenity =djoined the 34~ batoh of BARC Training School. Hi, field of 'tudy involve, ..fety analy'i, andplant tran,ient =alysis f= nuclear power plants and transient bydraulic load determinationfor piping, process equipment internals and reactor channel. His wad< also includes study andsimulation of severe accident for PHWR, and AHWR with thennal-hydraulic model, thenno-mechanical model, thermo-chemical model and h;gh temperature reaction model.
@Dr, S, K. Gupta at present Head, Cere Safety Studies Section. Reactor Safety Division,greduared from lIT Chennai in 1971 and completed his Ph.D m 1992 from lIT Mumbai. He is a
M .
,
' 15~ batch graduate fmm Training School, BARC. His work includes computer code
I"'~
"
,'" development and their application for the safety =alysis of nuclear power plants and research
f.-" ... :~:;';.~h:":;:~~n:;:~~,,";I:=~~';:~n~::~;"~~B'=~~~ :::~:;:~ous
i' Dr. v- Venkat Raj is presently the Director of the Health, Safety =d Enviroument Gmup,
, BARC. He gredualed from the Univer,ity of Madra, in 1963 and i, fmm the 7~ batch of the,- BARC Training School. He obtained his Mester's degree from the University of London and" " Ph.D. from the Indian I"titute of Technology, Mumbai, Hi, major areas of research include'- nuclear reactor thennalhydraulics =d safety, single-phese =d two-phase flow =d heat
"'nsfer studies, pmbabilistic safety es'essment, ageing m=agement studies, etc. He is a lifemember of a number of professional ,ocieties. He is Vice-Pre,ident of the Indi= Society for
Heat =d Mas' Tran,fer (ISHMTJ and the Pre,ident of Mumbai Chapter of ISHMT. He is a member of theExecutive Cemmittee of the Ind"", Nuclear Society and a member of the Governing Ceuncil of the NationalSociety of Fluid Mech=ics and Fluid Power. He participate, actively in the safety review of Ind;." nuclearin,ta1lation, thmUgh a number of Senior Level Committee, of AERB. He i, a member of the Nuclear SafetyStandards Advisooy Committee of the lAEA.
I 62 I--
Concentration of dilute sewage sludgeslurry using EB crosslinked fastresponse temperature sensitive poly(vinyl methyl ether) hydrogel
S. Sabharwal, Y.K.Bhardwaj and A.B. Majali
Isotope DivisionBhabha Atomic Research Centre
Abstract
Electron beam (EBI iITadiation technique hes been utilized to c,eare non-homogeneous fa"
'esponse rempecatu,e sensitive poly (vinyl methyl ethe'l (PVMEJ hydmgels. The cmsslinkedhydmgels we,e swollen in dHute sewage sludge samples at mom rennpecatu,e and dewatering was
achieved by deswelling the hydmgels at 323 K. The 'esults show that Ig gel could ,emove 9 to 12 gof ware, fmm 25 g of sludge. in ten cycles. The effect of various factocs such as
swelling/desweiling cycle time. solid content of sludge on the ,emoval efficiency of wate, ,emovalpmcess has been investigated
Introduction
THE "ENVIRONMENTALLY SENSITIVE
polymers", that undergo abruptreversible changes in mass and volume inresponse to minor changes in the gel'senvironment, are being probed worldwideas potential materials for novel
applications such as drug deliverysystems, mechano-chemical actuators inrobotics, as artificial nerves and for
concentrating protein/ enzyme solutionsnear room temperature Ill. Gels thatundergo phase transition in response tochange in their temperature are termedtemperature sensitive and these shrinkabrubtly as temperature increases above
a critical temperature. Crosslined gels ofpoly (vinyl methyl etherllPVME) and poly
(N-isopropyl acrylamide) (PNlPAm) whenproduced by thermocatalytic methodsgenerally yield homogeneouslycrosslinked slow response gels that areunsuitable for many industrial uses. Wehave used EB irradiation to create non-
homogeneously crosslinked temeraturesenstive PVME gel which undergoes a
phase transition at 37°C, and has adiffusion coefficient (D) value of 10-5cm' SO,compared to 1 x 10⁻⁷ - 1 X 10.8cm's.', for conventional hydrogels (2).
Development of such fast responsetemperature senstive hydrogels will helpto reduce the energy consumption levels
of many processes such as concentratingdilute biological slurries. In the presentwork, the potential of utilizing EBcrosslinked PVME gels to concentrate

I 63 I--
dilute sewage sludge slurries has beendemonstrated. The effect of process
parameters such as solid content ofsludge, swelling/deswelling cycle timeand stirring rate has been studied. Theresults of these studies are reported inthis paper.
Experimental
The PVME gels were synthesized byirradiating 30 wt% solution of PVMElinear polymer using 2 MeV ILU-6 EBaccelerator. The details have been
published elsewhere (2). The sludge12% solids) from input line of SludgeHygienisation Research Irradiator ISHRI)was used.
Results and Discussion
Equilibrium swelling and swelling!deswelling behaviour of PVME gels: The
linear polymerof PVME exJ,ibits a lowercritical solution at 307 K.
j .~! .g .i ,
~~~~.- ':':.
:;~~"4'-,-""",,,'C
Fig. 1 Equilibrium swelling behaviour ofEB crosslinked PVME hydrogels at
different temperatures
Figure 1shows the equilibrium swellingcharacteristics at different temperatures
for EBcrosslinked PVME hydrogels. Theswelling curves show the characteristicsharp discontinuity in the swollen massat about 310 K, which is close to the
LCST temperature of PVME in aqueoussolution. Below this temperature, the
strong interaction between the side chainsof crosslinked polymerchains and watermolecules, due to hydrogen bonding,result in swelling of the crosslinkedpolymer. Attemperature > 310 K, theweak hydrogen bonds are broken and thestructured water is eliminated, leading tothe collapse of the hydrogel matrix.
._""-",""""','" , ." .~"w..i""~,,~~""
, ;-"';::'::"
-,.. .00 '00
Tim'"
Fig. 2 Swelling and shrinking behaviour ofEB crosslinked PVME hydrogelacross LCST
Figure 2 shows results of the
swelling/ deswelling kinetics of a PVME
hydrogel produced by irradiating to
300 kGy EB dose. The swelling and
deswelling response of these hydrogels,
shown in Fig.2, clearly indicates that the
time required for these hydrogels to reach
the equilibrium swelling is a few seconds
as compared to hours required byconventional hydrogels. These materials
could be beneficial in reducing the energy
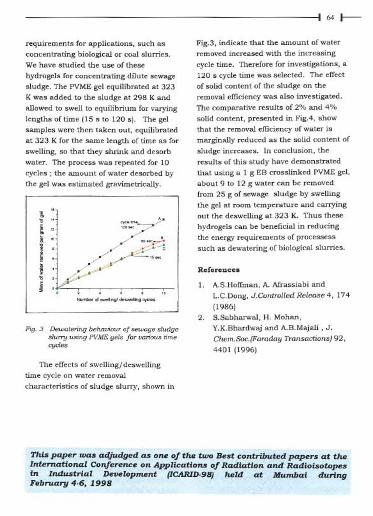
I 64 I---
requirements for applications, such asconcentrating biological or coal slurries.We have studied the use of these
hydrogels for concentrating dilute sewagesludge. The PVME gel equilibrated at 323
K was added to the sludge at 298 K andallowed to swell to equilibrium for varyinglengths of time (IS s to 120 s). The gelsamples were then taken out, equilibratedat 323 K for the same length of time as forswelling, so that they shrink and desorbwater. The process was repeated for 10
cycles; the amount of water desorbed bythe gel was estimated gravimetrically.
!,
l
', ..E. "['"
.
:;:-.::.~/
.
~
1 ' /,/'/I /' '"~,~.i' // ",0:::::- 1~. ./ // -,,~,~ ' /.:;;;~/",/./~ 0
N'mb"""""i"9':"~" ',"""do,
Fig. 3 Dewatering behaviour of sewage sludgeslurry using PVME gels for various timecycles
The effects of swellingfdeswelling
time cycle on water removal
characteristics of sludge slurry, shown in
Fig.3, indicate that the amount of water
removed increased with the increasing
cycle time. Therefore for investigations, a
120 s cycle time was selected. The effect
of solid content of the sludge on the
removal efficiency was also investigated.
The comparative results of 2% and 4%
solid content, presented in FigA, show
that the removal efficiency of water is
marginally reduced as the solid content of
sludge increases. In conclusion, the
results of this study have demonstrated
that using a I g EB crosslinked PVME gel,
about 9 to 12 g water can be removed
from 25 g of sewage sludge by swelling
the gel at room temperature and carrying
out the deswelling at 323 K. Thus these
hydrogels can be beneficial in reducing
the energy requirements of processess
such as dewatering of biological slurries.
References
1. A.S.Hoffman, A. Afrassiabi and
LoC.Dong, J.ControlledRelease4, 174(1986)
2. S.Sabharwal, H. Mohan,
Y.K.Bhardwaj and A.B.Majali , J.Chem.Soc.(Faraday Transactions) 92,
4401 (1996)
lers at the'ioisotopes"
'ai duljng.

I 65 J--
"Inthepresentwork,thepotentialofutilizingfB crosslinkedPVMf gelstoconcentratedilutesewagesludgeslurrieshasbeendemonstrated."
About tM authors.
Dc. Sunil Sabharwal obtained hi, M.So. de",ee in Chemi,try fmm Delhi Univecaily in 1978=d gcaduated fmm the BARC Tcaining School in 1978-79. He obtained hi, Ph. D d_eefmm Mumbai Univ",ily. Pce"ntly he i, working in the Radiation Technology DevelopmentSection of BARC. Hi, main =ea of ce,,~ch ace indu,trial application of cadiation technologyu,ing electron beam inadiation, cadiation effec" on polymeric 'y,tem, and pul" radioly,i,,tudi" of water ,oluble polym",.
Mr ¥.K. Bhardwaj obtained hi, M.Sc. d_" in Organic Chemi,try fmm the Univecaily ofGarhwal, Srinag~ in 1988. He gcaduated from the BARC Training School in 1989 and'tarted hi, ce'e~ch caceeer in Radiation Teehnology Development Section. Hi, re'e~chintere>" include development of radiation pmce"ed hydmgel, for medical andph~maceutical application" 'ynthe,i, of f",t ,timuli-r"pon,ive hydmgel, and radiationcro"linking behaviour of water ,oluble polym",.
Mr A. B. Majali h", over 25 yem of experience in the application of radiation technologyand indu,try. He w", re,earch a"oeiate at Atomic Energy Re'e~ch E,tabli,liment UK andal,o mved "' = IAEAexpert to the Government of Malay,ia. Mr Majali', current re,earchintere,t include radiation cro,,-linking, radiation vulcanization of natural rubber latex,depolymerization of poly tetraflouroethylene and development of radiation enced controlledrele.,e 'y,tem, for drug, and electron beam proce"ing.

I 66 I--
Evaluation of locally manufacturedpolyester film (Garfilm-EM)as a dosimeter in radiation processingRM.Bhat, U.R.Kini and B.L.Gupta
Radiation Standards and Instrumentation Division
Bhabha Atomic Research Centre
Abstract
Locally m=ufactu,ed 250,"" thkk polye"e, mm (Gaefilm-EMJ w", evaluated'pectrophotometrically fo, it, do,imetric pmpertie, fo, u,e "' a high do,e cadiation do,imete,.This film has good c1aeity, consi'tent thickne", ,ccatch ,esistance =d i, ea,y to h=dle.Radiation induced ch=ges in the abso'ption spectra weco analy,ed and 340 nm w", chosen asthe wavelength fo, absmption me",u,ements. The ,epmducibility of the co'pon,e fo, cobalt-60gamma cays was found to be within' 2%. The effect of post i"adiation sto,age time on thecospon" was al,o investigated. Fmm the "udies caeried out, Garulm-EM has been found tohave a good potential "' a dosimete, to me",uco abso,bed doses in the caage 20kGy-200kGydue to its lineae do" - co'pon" colationship.
Introdnction
SEVERAL POLVMERIC MATERIALS IN THE
form of thin films like radiochromic
dye films [1], clear perspex HX 12),andcellulose triacetate [3) fmd a wideapplication in radiation processingdosimetry. However, cost of these films,import procedures involved and theirshort shelf life make it necessary to look
for locally available plastic fIlms withgood dosimetric properties.. The aim ofthe present work was to investigate thedosimetric properties of locallymanufactured Garfilm-EM to determine
its suitability as a high dose dosimeter.This paper presents the results obtainedduring these investigations.
Experimental
Garfilm-EM films of the size 3.0 em x1.0 em were cut from the sheets to fit in
the holder of the spectrophotometer.Films were irradiated in a reproduciblegeometry at an ambient temperature
(25-30" C) using a cobalt-60 gammachamber - 900 which was calibrated with
Fricke dosimeter using ASTM protocol E
1026 [4). Spectra of irradiated andunirradiated mms were recorded onSHIMADZU UV 21O1PC
spectrophotometer. Minimum five filmswere irradiated for each dose to study
reproducibility. Thickness of the fIlms wasmeasured using a digital micrometer
screw gauge.
Resnlts and discussion
The absorption spectra of GarfIlm-EM
before and after irradiation against air and

I 67 I--
that of iITadiated film against unirradiatedare shown in Fig.!.
Ag. 1 Absmption spectra of Ga'jilm -EM
The radiation induced absorptionmaximum is at 330 nm. However, 340 nm
was selected as the wavelength for
absorption measurement as the errorintroduced due to the absorption ofunirradiated films is comparatively smaller
at this wavelength ( /\ AI Ai is maximum atthis wavelengthl. To investigate the postirradiation stabilitY of these films,irradiated films were stored under
controlled laboratory conditions.Absorbance of these films at 340 om was
read against air at different intervals of
time. Fig.2 illustrates the results of postirradiation storage effect on these films.The radiation induced absorbance at
various doses decreases rapidly for first 24hr. Thereafter, it appears quite stable for aperiod of 10 days studied during this work.These results suggest that the absorbanceof irradiated fIlm should be measured at
least 24 hrs after the iITadiation. It was
observed that the response of the fIlms atvarious doses is reproducible within I 2%.
The dose- response relationship of thesefilms, presented in the Fig.3, is linear upto200 kayo
Ag. 2 Post-hadiation stability of Ga'jilm - EM
0.8
0.7
06S.;0.5
~ 04
Dose, ~Gy
Ag. 3 Dose - abso,bance ,"lationship of Ga,jilm -EM
Conclusions
Garfilm-EM polyester films have
useful dosimetric properties like
reproducible response, good post-
irradiation stabilitY and linear dose-

I 68 I--
response relationship. These fIlms canbe used as a doshneter in radiation
processing in the dose range 20-200kGy,a dose range hnportant for cable/wireand heat shrinkable tubing industry.
References
I. A.Miller,W.Batsberg and W.Karman,A new radiochromic thin film
dosimeter system. Radiat. Phys.Chern. 31, 491 (1988).
2. K.M.Glover, M.E. Plested, M.F.Wattsand B. Whittaker, A study of some
parameters relevant to the response
3.
of Harwell PMMA dosimeters to
gamma and electron irradiation.Radiat. Phys. Chern. 42, 739 (1993).N.Tamura, R.Tanaka, S.Mitomo and
S. Nagai, Properties of cellulose
triacetate doshneter. Radiat. Phys.Chern. 18,947 (1981).ASTM standard E 1026, Standardpractice for using the Fricke reference
standard dosimetry system (1994).
4.
About the authors.
:buted papers atRadiation and
.eld at Mumbai in
Mr R.M. Bhat join,d BARC after graduating fcom 12" batch of Training SchooL Hi' ""acehintemt i, in th, d,velopm,nt of new ch,mical do,im,try 'y"em, for cadiation therapy.radiation ""aceh and radiation pcoc""ing cov,ring a wid, rang' of do", fcom a few Gy tokGy.
Mr U.R. Kinijoined BARC after gcaduating fcom 9" batch ofTcaining SchooL He ha' work,don the development of chemical do,imetry techniqu", for many yeaca. Currently, h, i,looking after pe'onnel monitming u,ing TLD 'y,tem,.
A gold m,dali" from Roark" Univecoity. Dc B.L.Gupta gcaduated from 7" batch ofTrainingSchooL H, i, Head of Ch,mical Do,im,try Laboratory which maintain, ,tandord, for highdo" do,im,try in India. Th, techniqu", d,v,lop,d by him a" widely u"d. He i, a memberof ASTM ,ub committ" ElO.OI . on Do,imetry for Radiation Proce"ing and AERE TaokGroup on Food Irradiation Do,im,try.
I 69 I--
Characterisation and evaluation ofairborne dust associated with miningoperation
D. K. Ghosh
Radiation Safety Systems DivisionBhabha Atomic Research Centre
Abstract
It ha, been well cecogn;Md ,;nce ane;ent tim" that ;nhalation and c"ention of exco,,;ve minecaldu,t in the lung' can POM a MriOU' health h~'d. In metallifeceu, m;n". mining °p'cation' likedGilling. muchng and dumping of oce ace cloMly a"ociated with the expo,uce to ubiquitou,"",talline ,ilica. commonly known a' feee ,ilica. The advent of lung fibce,i, and phy,;ologkalpotency to the health of min", oxi';ng out fcem the expo,u" to fibcegenic "y,talline ,ilica dependmainly on their pacticulate ,ire-ma" di"cibution. the natme of du", their ",p;catile ma"concen"ation and dmation of expo,"".
The pap'c p"Mn" the ce,ul" of a ,tudy conducted in the chacacteci,ation of airbome dmt and,ubMquently ;n evaluating index of du,t expo,u" accocding to job cla,,;fication and outlin" theeon"ol meexu", adopting in the m;n;ng opecatiom.
Introduction
SILICA IS UBIQUITOUS AND IS
predominantly associated in miningoperations. In recent time, with theincrease in scale of mechanisation andmodemisation of mining activities, there
is corresponding rise in dispersion of dustin the working atmosphere. Inmetalliferous mine, mining activitiesinvolve drilling, mucking, dumping.transportation of ore etc. and are closelyassociated with exposure of crystallinesilica, commonly known as free silica.Inhalation and cetention in excessiveamount of such dust containing
significant quantity of free silica over thelength of time may lead to a serious
respiratory health problem'. The advent
of lung disease and physiological potencyto the health of miners arising out of
the exposure to fibrogenic crystalline
silica bearing dust depend mainly on
their particulate size-mass distribution,
respirable mass concentration of dust
and quantity of free silica present in it,
duration of exposure and susceptibility
of the exposed persons. Despite the
existing potential hazards, it is possible to
work safely in the mines by ensuring that
the dust levels in the work atmosphere
are within perroissible limit and also
adopting the prescribed control
measures strictly. This paper presents the
results of a study conducted in the
characterisation of airbome dust and
subsequently, estimated cumulative dust

I 70 I---
exposure according to job classification
and the control measures adopted in order
to suppress the overall dust load in the
mining environment.
Material and Methods
CHARACTERISATION OF SILICA
. BEARING DUST
Size-distribution
Size and its distribution of airbome
dust vary mainly according to nature of
operations. Physiological potency
increases with the decrease of particle size
below 3 microns. The deposition pattem
of particulate dust in the human
respiratory tract is dependent onthe size-mass characteristics known as
mass-median aerodynamic diameter
(MMAD). This can be either obtained by
Anderson Cascade Impactor" directly or
based on microscope counting and
sizing of particles using May's eye
piece graticuIe. Distribution was
observed to follow log-normal statistics.
Figure I provides the typical particle size
distribution during drilling operations.
Count median diameter and geometric
standard deviation of the particles were
obtained directly from the plot and
accordingly count median aerodynamic
diameter ICMAD) and mass median
aerodynamic diameter IMMAD) are
calculated using following equations.
CMD (mg)
CMAD (Dae) (~m) ~ mmmnn ~pDp(D"
where DpD"
~ projected area diameter~ Stokes diameter of the
particle
~ Shape factor for theirregularly shaped
particle, quartz (1.53)
Dp(Do<
~ specific gravity of the particle
12.84 g(cc)
MMAD and pulmonary deposition fromMMAD
10g(MMAD)~ log (CMAD)+ 6.907810g2crg (2)
crg is the geometric standarddeviation which is unaltered forCMAD and MMAD.
The Task Group onLung Dynamics"has recommended a relation betweenMMADwith that of pulmonary deposition.This is represented graphically in Figure2. Accordingly, Pulmonary deposition ofparticles are calculated from MMAD.
. (I)
Free silica content
Biological significance of exposure to
dust mostly depends upon the amount offree silica in the dust inhaled. Talvitie's'
method of analysis was adopted for
analysis of free silica present in settled
and airbome dust where as X-ray
diffraction was adopted to estimate free
silica in respirable dust.
Full-shift exposure to respirable dust
Respirable fraction of airbome silica
bearing dust was collected over a shift
from the breathing zone of the workers
using gravimetric personal dust sampler'
operated through a cyclone separator at a
llowrate of 1.91(min. The sampler was
fitted on the lapel of the worker. The filter
paper collects respirable fraction of
airbome dust. The sample is weighed and
exposure is calculated in terms ofmg(m'of air.
Threshold Limit Value (TLVIIn India, Director General of Mine
Safety" recommended that the averageconcentration of respirable dust in mine
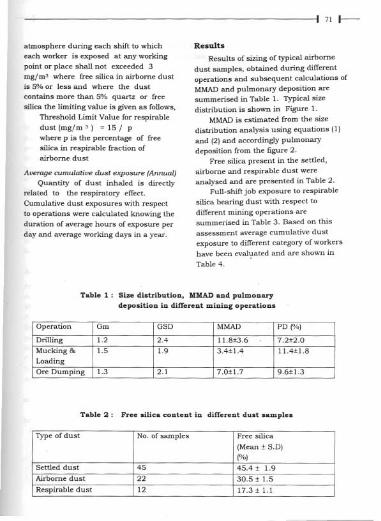
I 71 t-----
atmosphere during each shift to whicheach worker is exposed at any workingpoint or place shall not exceeded 3mg/m3 where free silica in airbome dustis 5% or less and where the dust
contains more than 5% quartz or freesilica the limiting value is given as follows,
Threshold Limit Value for respirabledust (mgjm 3) = 15 / pwhere p is the percentage of freesilica in respirable fraction ofairbome dust
Average cumulative dust exposure (Annual)Quantity of dust inhaled is directly
related to the respiratory effect.Cumulative dust exposures with respectto operations were calculated knowing theduration of average hours of exposure perday and average working days in a year.
Results
Results of sizing of typical airbome
dust samples, obtained during differentoperations and subsequent calculations ofMMAD and pulmonary deposition aresummensed in Table 1. TYPical sizedistribution is shown in Figure 1.
MMAD is estimated from the sizedistribution analysis using equations (I)and (2) and accordingly pulmonarydeposition from the figure 2.
Free silica present in the settled,airbome and respirable dust wereanalysed and are presented in Table 2.
Full-shift job exposure to respirablesilica bearing dust with respect todifferent mining operations aresummensed in Table 3. Based on thisassessment average cumulative dustexposure to different category of workers
have been eva1~ated and are shown inTable 4.
Table 1: Size distributiol1, MMAD and pulmol1arydepositiol1 ill differel1t mining operatiol1s
Table 2: Free sillea col1tel1t ill differel1t dust samples
Operation Gm GSD MMAD PD(%)
Drilling 1.2 2.4 11.8%3.6 7.20102.0
Mucking & 1.5 1.9 3.40101.4 11.40101.8
LoadingOre Dumping 1.3 2.1 7.0t1.7 9.6t1.3
TYPe of dust No. of samples Free silica
(Mean 010S.D)
(%)Settled dust 45 45.4 0101.9
Airbome dust 22 30.50101.5
Respirable dust 12 17.3 t 1.1
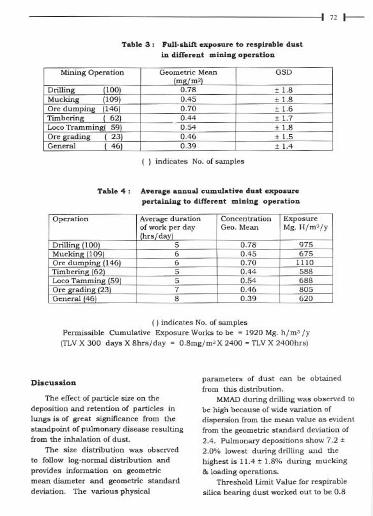
I 72 I---
Table 3: Full-shift exposure to respirable dust
in different mining operation
Table 4:
( ) indicates No. of samples
Average annual cumulative dust exposure
pertaining to different mining operation
( ) indicates No. of samplesPermissible Cumulative Exposure Works to be = 1920 Mg. him' /Y(TLVX 300 days X 8hrs/day = 0.8mg/m'X 2400 = TLV X 2400hrs)
Discussion
The effect of particle size on thedeposition and retention of particles inlungs is of great significance from thestandpoint of pulmonary disease resultingfrom the inhalation of dust.
The size distribution was observed
to follow log-normal distribution andprovides information on geometricmean diameter and geometric standarddeviation. The various physical
parameters of dust can be obtainedfrom this distribution.
MMAD during drilling was observed to
be high because of wide variation of
dispersion from the mean value as evident
from the geometric standard deviation of
2.4. Pulmonary depositions show 7.2 I
2.0% lowest during drilling and the
highest is 11.4 t 1.8% during mucking
& loading operations.Threshold LimIt Value for respirable
silica bearing dust worked out to be 0.8
Mining Operation Geometric Mean GSDImp/m'l
Drilling (100) 0.78 + 1.8
Mucking (109) 0.45 + 1.8
Ore dumping (146) 0.70 + 1.6
Timbering (62) 0.44 + 1.7
Loco Tramming( 59) 0.54 + 1.8
Ore grading (23) 0.46 + 1.5
General ( 46) 0.39 + 1.4
Operation Average duration Concentration Exposure
r:er dayGeo. Mean Mg. H/m'/Y
Drillin 100 5 0.78 975Muckin 1109 6 0.45 675Ore dumDin 11461 6 0.70 1110Timberin 162 5 0.44 588Loco Tammin 1591 5 0.54 688Ore adin 123 7 0.46 805General 146 8 0.39 620

I 73 t---------
mg/m3 based on DGMS guide line.Permissible annual cumulative exposureworked out to be 1920 Mg. h/m3 /y basedon working days of 300 in a year having 8hours/day working period. Cumulativedust exposure as evident from the Table 4appears to be within the limit.
Control measures such as ventilation,
improvement in the performance of thedust extraction systems, better operations
procedure, such as wetting of the ore afterblasting and before mucking etc. andrelease of water during of the holes etc.are practised in reducing the dustconcentration at the source.
Assessment of cumulative exposurewith respect to mining operations isimportant for future comparison withthe decrement of pulmonary functionsand radiological abnormalities of thelungs.
Acknowledgement
Author wishes to acknowledge theencouragement received from Dr. D.C.Mishra, Director (H S&E Group) and Dr.S.K. Metha, Head, Radiation SafetySystems Division, BARC in presenting thispaper. Substantive facilities provided byMr J.L. Bhasin, Chairman and ManagingDirector, DCIL, Jaduguda, Bihar duringthe course of the work was greatlyappreciated. Dr. D.O. Thorat is specially
thanked for the help in makingtransparencies required for OHP.Colleagues are thanked for various co-operation.
References
1 Exposure and Silicious Among OntarioHard Rock Miners: III Analysis andRisk Estimates., Am. J. Ind Med., 16,
29-43 (1989).2 Anderson A.A , A Sampler For
Respiratory Health Hazard Associates.Am. Ind. Hyg. Asson. J., 27,160 (1965).
3 Task Group On Lung Dynamics(ICRP), Deposition and retentionmodels for lntemal Dosimetry of the
human Respiratory Tract, HealthPhysics, 12, 173-207 (1966)
4 Talvite NA Determination of free
silica, gravimetric andspectrophotometric procedureapplicable to airbome and settleddust. Amm. Ind.. Hyg. Asson. Joum.1964, 25: 169-178.
5 Director General of Mines
Safety(DGMS). Precautions againstairbome dust. Circular no.S dated29.7.1987, Ministry of Labour, Gov!. ofIndia.
6 CaselIa C F and Co. Ltd., Personal Air
Sampler Instruction Leaflet 3150/82,Regent House, Britannia Walk,London.
This paper presented at the International Conference on OccupationalHealth held at Mumbai in February 1998 was selected for "BritanniaAward 1998", Dr Ghosh received the award at the 49th AnnualConference of Indian Association of Occupational Health, India, held atHyderabad during February 5.7,1999,
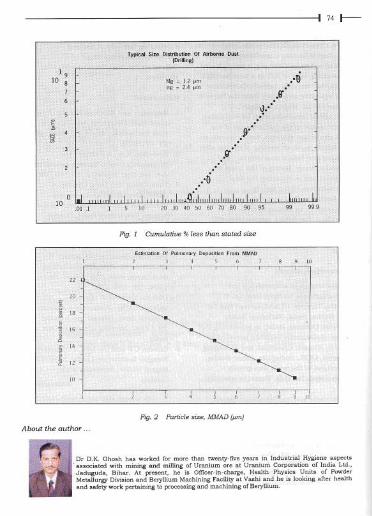
I 74 t--
Fig. 1 Cumulative %less than stated size
Fig. 2 Particle size, MMAD (~m)
About the author..
Dc D.K. Ghosh has woeked foe moee than twen\y-five ye~s in Industrial Hygiene aspects. associated with mining and milling of Ueanium ace at Ueanium Coepo'"tion of Indin Ltd.,Jaduguda, BihaL At peosent, he is Omm-in-cha,"e, Health Physics Units of PowdeeMetallue", Division and Be'Yllium Machining Facili\y at Vashi and he is looking afree healthand safe\y woek peetaining to pmce"ing and machining of Be'YlIium.

I75 r--
Measurement traceabilitybrachythera py
in
K.N.Govinda Rajan, A.Shanta and B.C.BhattRadiological Physics & Advisory DivisionBhabha Atomic Research Centre
S.P.Vinatha, A.T.Soman, A.Kannan and S.C.MisraRadiation Standard & Instrumentation DivisionBhabha Atomic Research Centre
W.F. HansonRadioiogical Physics Center, UTX,Houston, USA
A.Shankar, S.Shirley, D.D.Deshpande and K.DinshawTata Memorial Hospital, Mumbal
Introduction
THE FIELD OF BRACHYTHERAPYDID NOT
attract as much attention as External
Beam Therapy because of exposures
received by the Radiation Oncologists and
the nursing staff in this modality of
treatment. With the availability of
afterloading equipment and development
of afterloading procedures in the field,
leading to considerable reduction in staff
exposures, there was a revival of interest
in brachytherapy. With the availability ofmodern Remote Afterloading Equipment
that virtually eliminates all staff
exposures, quite a few centres have come
up in the recent past to practice this
modality of treatment and many more are
now coming up, in different parts of India.
This development underlines the
importance of improving the accuracy of
brachytherapy dosimetry by developing
appropriate chambers and sourcestandardization and Calibration
procedures, for establishing the
traceability of all brachytheravy sourcemeasurements to the SSDL of BARC.
Materials and Methods
While the accuracy of Co-50 external
beam Standardization has been well
established through International
intercomparisons, the accuracy of low and
high Air Kerma Rate(AKR) sources used in
brachytherapy still remain to be
established, through such International
Intercomparisons. The first such
intercomparison of a low Air Kerma Rate
Cs-137 source was, therefore, carried out
recently, between the SSDL, BARC and
the SSDL, M.D. Anderson Cancer
Research Institute, University of Texas
(UTX), USA, at BARC, Mumbai. Both theSSDL of BARC and the SSDL of UTX
used indigenously designed reentrantcharobers as Reference charobers for this
intercomparison. The intercomparison
showed an agreement of better than 2 %.
This is an excellent agreement, for low
AKR sources, in a fITst intercomparison
of this nature. By applying finercorrections such as source holder
differences, source shape and size
differences etc. better agreement can be
expected.
This intercomparison thus assures usthat the BARC Standard is consistent
with another National Standard and that
measurements being performed at various
hospitals, in India, can be traced to the
BARC Cs-137 Standard, to within '.he
required level of accuracv.Since the SSDL of BARC has not
started the Standardization ofHDR Ir-192
source it becomes important to check the
accuracy of the A.KR measurements at
this energy, especially because many such
units are increasingly coming, into use in
India.
Such a check was carried out at the
Tata Memorial Cancer Centre, Bombay. A
PTW reentrant chamber, traceable to the
German National Standard, and in use at
the Tata Memorial Centre, Mumbai , for
measuring the Reference Air Kerma Rateof the HDR Ir-192 source, was compared
against the Reference Standard of the
SSDL of UTX, USA. (The SSDL of UTX,
I 76 I--
USA made use of a commercial model ofthe reentrant chamber as the Reference
Standard) .The disagreement was morethan 5 %.
This paper would discuss thedosimetric characteristics of theReference Standards used in the
measurements, their calibrationprocedures, the intercomparisonprocedures and the significance of theresults.
Conclusions
The intercompar4-son -at Cs-137
has established the agreement between
the two national standards, a prerequisite
for ensuring measurement traceability for
Cs-137 brachytherapy sources.
In the case of HDR Ir-192 calibration,
the reason for the significant difference is
being investigated, but it highlights the
importance of establishing PrimaryStandardization and Calibration
procedures in India, for the HDR Ir-192source.
This paper was adjudged as one of the two Best Papers presented at theInternational Conference on Medical Physics, and the NineteenthAnnual Conference of the Association of Medical Physicists of India(AMPI), held at the All India Institute of Medical Sciences, New Delhi,during November 6-9, 1998. Only extended abstract of the paper isreproduced above. .

I77 I--
Proposed quality assurance protocolfor mammography X-ray system
Kanta Chhokra, V.B. Tripathi, C.P.R. Nair,J.B. Sasane and B.C. Bhatt
Radiological Physics & Advisory DivisionBhabha Atomic Research Centre
Introduction
X-RAY MAMMOGRAPHY HAS PROVED TO BE
quite effective in a number of
screening programmes and in diagnosis of
breast cancer. Consequently, it has
contributed significantly in terms of
reducing breast cancer mortality. The
mammography units are increasing
through out the world. There are about
200 units in the country. This
necessitates the development of a Quality
Assurance (QA) protocol so as to achieve a
uniform and high standard of equipment
performance and image quality in
screening as well as in diagnosis. The
implementation of protocol should ensure
the success of diagnosis as well as the
radiation safety of patients, workers and
the general public. This paper describes
the salient features of the protocol to
achieve the above objective.
Materials and methods
Quality Assurance protocol of
mammography X-ray systems can be
divided into number of parts such as:
electrical safety, mechanical safety,
radiation safety measurements, automatic
exposure control, screen film system,
processing unit, breast dose, etc. as per
requirements. However, in this paper the
quality assurance protocol has been
divided into six main categories: 1) X- ray
generator and control, 2) automatic
exposure control, 3) compression device,
4) screen -film system and processor,
5) viewing conditions and 6) reference
dose and image quality. It alsodifferentiates between basic and desirable
quality control level and proposes the
frequency of the tests along with the
relevant tolerance limits. Table I presents
a summary of the tests together with thetolerance limits in case of film
mammography. For xero-mammography,
all the above parameters need to be
performed in addition to the dark dusting
of all the plates and cleaning of cassettes
at least once a week. However, it is
assumed that radiological protection
survey of the installation is a part of the
quality assurance programme.
Discussion and conclusions
The protocol for mammography X-raytechnique/parameters lays down theprocedures required to have a QualityAssurance programme in mammographyensuring that system produces the bestdiagnostic image with minimum radiationdose to the patient. Further, an importantpart of the protocol is the constraint on

I 78 I---
the dose applied to the breast to achieve
maximum benefit with minimum risk. It
will also help in comparing the doses with
that of reference values of Entrance Skin
.Dose (ESD) recommended in Basic Safety
Standard (88S). Furthermore, it will also
Table I: Quality assurance
serve as the criteria for the manufacturer
to ensure that the mammography
machines conforms to the national
radiation protection rules as prescribed by
the competent authority.
in mammography procedures
Technique/Parameter Limiting Value
.1. X-ray Generator and Control
1.1 Radiation safety measurements
-Tube leakage
- Alignment of light & x-ray field
1.2 X-ray measurements
-focal spot size
Large focus
Small focus
- grid system factor
2. Automatic Exposure Control
-central optical density for 4.5 em
perspex
3. Compression Device
- compression plate alignment
- compression force
4. Screen -Film System & processor
4.1 Screen-film
- cassette & screen identification
- characteristic curve of fIlm
- artefacts
4.2 Processor
- developer temp.(APU)
(manufacturer specifications)
- processing time
(manufacturer specifications)
5. Viewing Conditions
- visual check
-illumination light level
. ambient light level
6. System Properties
6.1 Reference breast dose
6.2 Image quality
- routine testin/(
<1 mGyin I he
ot 5 mm on all edges
< 0.5 mm at 5 em from chest wall< 0.15 mm at 2 em from chest wall
< 2.5
1.4 to 1.8
160 to 250 Newton
otO.2° C
~ SO,.
550 lux(HO%)s 86 lux
0.4 cGy
This paper was adjudged as one of the two Best Papers presented at theInternational Conference on Medical Physics, and the Nineteenth AnnualConference of the Association of Medical Physicists of India (AMPlJ,
1].1;,1-<It the All India}nstttute of Medical Sciences, Ne"!,*pelh~"!#rJ1J.f!.~Noperriber 6'!J. 1998.. Only extended abstract of the paper is reproil,u,ceCl"above.

I 79 I--
Tritium in Water Monitor formeasurement of tritium activityin the process water
Radiation Safety Systems DivisionBhabha Atomic Research Centre
M. Rathnakaran, R.M. Ravetkar, M.C. Abani and S.K. Mehta
Abstract
Thi, pape' pre,ente the evaluation of a T,itium in Wate, Monito, fa, me..u,ement of critium activityin the ,econdary coolant in Pre"uci"d Heavy Watee Reacto, u,oo fa, powe, geneeation. Fa, thi,pu>po". it u,'" a pl..tic ,,;ntillatoe flow cell detecto, in a continuou, on-line mode, It i, obmved
that the ,en,itivity of the 'y,tem depend, on the cramparency of the detectoe, which gradually,OOuc," with u" becau,e of the collection of dirt acound the ";ntillato,, A ,imple type of ,ampleconditionee ba"d on polypcopylene candle filte, and filtee pape' i, developed and in,talled at RAPSalong with T,itium in Watee Monito.. The functioning ofthi, 'y"em i, repoeted he>e,
Introduction
HEAVYWATERIS USED AS PRIMARY
coolant and moderator in heavy
water type reactors. In fresh heavy water,
tritium activity is negligible. But in course
of time the tritium activity increases.
Considering the radiological hazard of
tritium and the cost of heavy water, its
leak to the process water should be
continuously monitored. It is a statutory
requirement to have a continuous on line
monitoring system for measurement of
tritium leakage to the process water. The
system normally used for monitoring of
tritium leak is liquid scintillation
counting. This system can measure a
tritium leak rate of around 50 mCijh.
However, this system is not suitable for
continuous on-line monitoring. In this
system, the sample has to be collected
manually and counted in the liquid
scintillator system after mixing the
sample with the liquid scintillation
cocktail. This introduces time delay in
detecting any tritium leak to the process
water. In addition, the manual sampling
is time consuming. Though the use of
liquid scintillation counting for
continuous monitoring has been reported
by some authors (1, 2), the system is not
commercially available. Liquid
scintillation counting for countinuous
monitoring will also involve an
exhorbitant cost. In addition, the disposal
of large quantity of liquid scintillator willcause an additional environmental
hazard.
Solid scintillators like anthracene,
plastic scintillator, or calcium l1ouridefilled l1ow cell can also be used for
tritium measurement. Sensitivity of solid
scintillator system is much less as
compared to that of a liquid scintillator
system. In the solid scintillator, since the
range of the 18 keY tritium beta is very
short (0.005 mm'in water), only thetritium which is on the surface of the

scintillator will cause scintillation. Hence
the efficiency and sensitivity for tritiumwith solid scintillator is low. But the
system is very convenient to use forcontinuous monitoring of the processwater activity. In this regard NPCIL hasimported a tritium in water monitorfrom Technical Associates (U.S.A.),which is based on anthracene powderpacked flow cell (3). The system does nothave proper sample conditioning system.
Tritium In Water Monitor developedat BARC
The monitor is a prototype modeldeveloped for detection andmeasurement of tritium leakage fromthe primary coolant or moderator to theprocess water in PHWRs. The system isbased on plastic scintillator flow celldetector developed at BARC (4). Thesample water flows continuously throughthe flow cell detector and a continuous
monitoring is done with the help of thisinstrument. The monitor consists of three
parts namely, the sample conditioner,detector assembly and electronic system.Fig. I shows the schematic of the Tritiumin Water Monitor with sampleconditioner.
Detector assembly
The detector assembly consists ofplastic scintillator film packed flow cellcoupled on either side with two EMl-9635 photomultiplier tubes. These tubesare connected in coincidence for
increasing the sensitivity of the system.The flow cell is filled with 5 urn thick and
500 cm2 area plastic scintillator films.Once packed with the films it behaveslike a sponge and allows smooth flow ofthe sample through the flow cell. Whenthe sample is passing through the
1801-
detector, it produces light photonsproportional to the radioactivity contentsin the flow cell at that instant. The
light photons fall on the photo cathodesurface of the photomultiplier andproduce an electrical pulse output at theanode of photomultiplier tubes. Thispulse is further proce ssed by electronicsystem. Since the tritium beta range isvery short, only those tritium betaswhich are just on the surface of thedetector could be detected. To have a
better sensitivity, the detector shouldhave large surface area. Fig.2 showsthe plot of count rate obtained, withvarying number of mms, with 100 nCi!ml of tritium activity. Maximum countrate obtained is with 10 films. For
smooth flow of the sample six number offilms, with a total surface area of3000 cm 2, are packed in the flow cell.Plastic scintillator material used in the
flow cell weighs less than a gram. Sincethe quantity of scintlliator is small thegamma responce of the system is alsopoor, which is a desirable feature. Fig.3 shows the tritium activityconcentration versus the count rate with
6 number of mms packed in the flowcell.
Sample conditioner
The process water contains impuritiesand particulate substances, which will betrapped in the flow cell detector duringuse. This will result in reduced
transparency of the flow cell detector withuse and causein gradual reduction insensitivity of the detector. Earlier model oftritium in water monitoruses activated
charcoal, mixed column of ion exchangeand glass fibre filter paper as sampleconditioner. These components requirefrequent replacement. Even with these
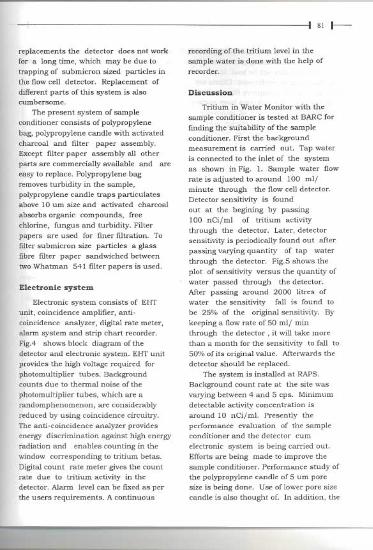
.I 81 t--
replacements the detector does not work
for a long time, which may be due to
trapping of submicron sized particles in
the flow cell detector. Replacement of
different parts of this system is alsocumbersome.
The present system of sample
conditioner consists of polypropylene
bag, polypropylene candle with activated
charcoal and filter paper assembly.
Except filter paper assembly all other
parts are commercially available and are
easy to replace. Polypropylene bag
removes turbidity in the sample,
polypropylene candle traps particulatesabove 10 urn size and activated charcoal
absorbs organic compounds, free
cblorine, fungus and turbidity. Filter
papers are used for finer filtration. To
fIlter submicron size particles a glass
fibre mter paper sandwiched between
two Whatrnan 541 filter papers is used.
Electronic system
Electronic system consists of EHT
unit, coincidence amplifier, anti-
coincidence analyzer, digital rate meter,
alarm system and strip chart recorder.
Fig.4 shows block diagram of the
detector and electronic system. EHT unit
provides the high voltage required for
photomultiplier tubes. Backgroundcounts due to thennal noise of the
photomultiplier tubes, which are a
randomphenomenon, are considerably
reduced by using coincidence circuitry.
The anti-coincidence analyzer provides
energy discrimination against high energy
radiation and enables counting in the
window corresponding to tritium betas.
Digital count rate meter gives the count
rate due to tritium activity in the
detector. Alarm level can be fiXed as per
the users requirements. A continuous
~
recording of the tritium level in the
sample water is done with the help ofrecorder.
Discussion
Tritium in Water Monitor with the
sample conditioner is tested at BARC for
finding the suitability of the sample
conditioner. First the background
measurement is carried out. Tap water
is connected to the inlet of the system
as shown in Fig. 1. Sample water flow
rate is adjusted to around 100 mIl
minute through the flow cell detector.
Detector sensitivity is found
out at the begining by passing
100 nCi/ml of tritium activity
through the detector. Later, detector
sensitivity is periodically found out after
passing varying quantity of tap water
through the detector. Fig.5 shows the
plot of sensitivity versus the quantity of
water passed through the detector.
After passing around 2000 litres of
water the sensitivity fall is found to
be 25% of the original sensitivity. By
keeping a flow rate of 50 mil min
through the detector, it will take more
than a month for the sensitivity to fall to
50% of its original value. Afterwards the
detector should be replaced.
The system is installed at RAPS.
Background count rate at the site was
varying between 4 and 5 cps. Minimum
detectable activity concentration is
around 10 nCi/ml. Presently the
perfonnance evaluation of the sampleconditioner and the detector cum
electronic system is being carried out.
Efforts are being made to improve the
sample conditioner. Perfonnance study of
the polypropylene candle of 5 urn pore
size is being done. Use of lower pore size
candle is also thought of. In addition, the

I 82 I--
use of fmerfilterpaper likeWhatman 540and 542 are also being carried out. Wehope these studies willbe lead to animproved sample conditioner. Efforts arealso being made to improve the sensitivityof the system. By making a large surfacearea flow cell, we hope of improvingthe detector sensitivity. Background ofthe system could be further reduced byadditional shielding. In old system, countrate meter with a time constant of10 second was used for counting. By
providing microprocessor system in thenew tritium in water monitor, the time ofcounting could be choosen to a longertiming, which will lead to betterstatistics of counting. Thus, by usingthe combination a a sensitive detector,
lower background and increasedcounting time, the minimumdetectable activity value could beimproved substantially. The problemfaced earlier was with the sampleconditioner. If this sample conditionercould solve the problem, it will be of
great help for monitoring tritium leakageto the process water.
Acknowledgement
The. atuhors express thanks toMr M.P. Sharma, Head, C&I(RU),NPCIL,for his keen interest and encouragement
to carry out the work. We are thankfulto Mr S.K. Sharma, SME(I) and Mr Q.K.
Tiwari, (CMU), RAPS 1&2 for their co-operation and help to carry out thiswork at RAPS. We are grateful to Mr J.V.Deo and Mr K.K. Narayan for usefuldiscussions and help.
References
1. RV. Osborn (1972) "Developmentofa monitor for tritiated water vapour
in presence of noble gases", Report,AECL-4303.
2. R.A. Sigg, J.E. McCarty, R.R.Livingston, M.A. Sanders, "Real-timeaqueous tritium monitor using liquidscientillation counting", NucL Intr.and Meth in Physics Research, A 353(1994),494-498.
3. Technical Associates Inc., (U.S.A.),Operation Manual.
4. A.N. Singh, M. Rathnakaran and K.G.Vohra, "An on-line tritium in watermonitor", Nud. Instr. and Meth inPhysics Research, A 236 (1985) 159-164.

I 83 I---
Fig. 1 Diagram of Tritium-in-Water Monitor with sample conditioner
Fig. 2 Number of films versus countratefor 100 nCi/ml of tritiated water
'"
2000
150.0
"1000
w
50.0
Fig. 3 Calibration curve
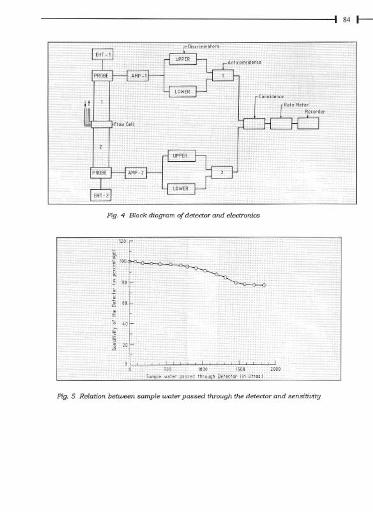
1841--
Fig. 4 Block diagram of detecto, and electronics
Fig. 5 Relation between sample wate, passed through the detecto, and sensitivity
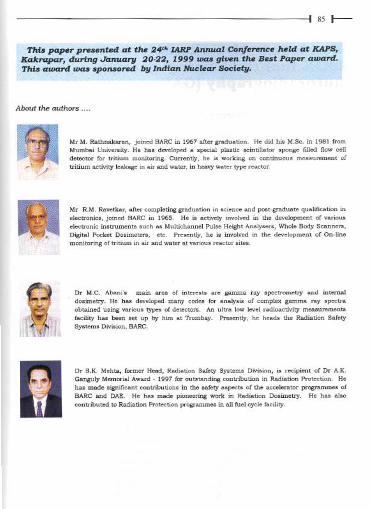
I 85 I---
About the authors.
Mr M. Rathnakaran, joined BARC in 1967 after graduation. He did hi, M.So. in 1981 fromMumbai Univmity. He h., developed a 'p"ial pl..bo "intillator 'ponge fUled flow oolldereotor for tritium monitoring. Currently, he i, working on oontinuou, mea'urement oftritium activity leakage in air and warer, in heavy water type reao1or.
Mr RM. Ravetkar, afrer completing graduation in ,cience and po't-graduare qualification inelectroni", joined BARC in 1965. He i, actively involved in the development of variou,electronic in,trumen" ,uoh a, Multiohannel Pul" He;ght Analy"re, Whole Body Soannere,Digital Pocket Do,imetm, eto. Pr"ently, he i, involved in the development of On-linemonito,ing of tritium in ai, and ware, at vaciou, "ao1o, ,it".
Dr M.C. Abani', main Mea of inre",t, are gamma cay 'peotrometry and intemaldo,imetry. He ha, developed many ood" fo, analy,i, of complex gamma cay 'p"traohtalned u,ing vMiou, type, of dereo1ore. An ultra low level radioactivity me..u"men"facility h.. been "t up bY him at Trombay. Pre"ntly, he head, the Radiation SafetySy,rem, Divi,ion, BARC,
Dr S,K. Mehta, fo,mer Head, Radiation Safety Sy,tem, Divi,ion, i, "cipient of Dr A.KGanguly Memorial AwMd - 1997 for ou"tanding contribution in Radiation Prorection, He
haa made ,;guifioant contribution, in the aafety aap"t, of the acoolerator programm" ofBARC and DAE, He haa made pioneecing work in Radiation Do,imetry, He h.. al,ocontributed to Radiation Prot"tion programmea in all fuel oyde facility.
I 86 I--
Nondestructive characterisation ofMOX fuel rods using gammaautoradiography (GAR)
Advanced Fuel Fabrication FaciiityBhabha Atomic Research Centre
J.P. Panakkal, D. Mukhetjee, V. Manoharan and H.S. Kamath
Abstract
Dudng the fab,ication of m;xed oxide ucanium-plutonium oxide (MOXIfuel mds, two impo'tantchacacteeiatica to be checked in adabdcated fuel pins ace plutonium emichment and plutoniumdioxide agglomeeatea. The m;xed oxide fuel pelle" ace made via mechanical m;xing of ucaniumdioxide and plutonium dioxide powd", by cold compaction and sintedng. The chance of loadinga wmng Pu endchment pellet and having pellets with plutonium dioxide agglomeeat" in a fuelpin cannot be culed out. A simple nond""uctive evaluation technique ia felt neo"..'}' to ensmeat the last stage (in the welded pinsl to check th"e two chamctedati".
Dudng the fab,ication of MOX fuel mds fo, Boiling Watee Reacto" at Advanced Fuel Fab,icationFacility of BARC at Tacapu" Gamma-auto-cadiogcaphy was aucc"afully u"d to evaluatecomposition of MOX pelle" and to detect p",ence of PuO, agglomeeat" in the peeipheeal cegion.The fuel pins ace allowed to be in contact with indua"ial X-cay films loaded in casseU" fo, a longtime and the pmcessed mma ece cacefully evaluated. Expe;imen" we;e made to stand.,di" theconditions fo, distinguishing fuel pellets of diff",nt composition by gamma-auto-cadiogcaphy offuel pins loaded with pelle" of diff",nt composition. Gecnma-auto-cadiogcaphy of fuel pinscontaining agglomeeat" of diffeeent s;x" was also ca"ied out. Thia papee desnibes theexpedmental details of the technique, "'ults obtained and compace with othee nondes"uctiveevaluation techniqu" available.
Introduction
URANIUM-PLUTONIUMMIXED OXIDE
(MOX) fuel has been developed as an
alternative fuel for Boiling Water Reactors
at Advanced Fuel Fabrication Facility,
Bhabha Atomic Research Centre,
Tarapur. MOX fuel rods are made by
loading pellets of required enrichment
and the plenum springs in thin zircaloy
clad tubes and welding of the end-plugs
by TIG welding Wig. I). It is necessary to
ascertain the physical integrity, correct
loading of pellets, maximum size of PuO,
agglomerates present and plutonium
enrichment in as-fabricated fuel pins.
Experiments were carried out on specially
fabricated fuel pins containing mixedoxide pellets of different PuO, enrichment(0-3.25%) and PuO, agglomerates. Theexperimental conditions for distinguishingfuel pellets of different composition has
been established. This paper describesthe experimental details of gamma-auto-radiography (GAR)developed for thispurpose, presents the results obtained,records our experience during thefabrication of MOX fuel assemblies and
compare with other nondestructive
evaluation techniques.Mixed oxide fuel pellets are made
from a mixture of.uranium dioxide
powder and varying percentage ofplutonium dioxide powder by cold
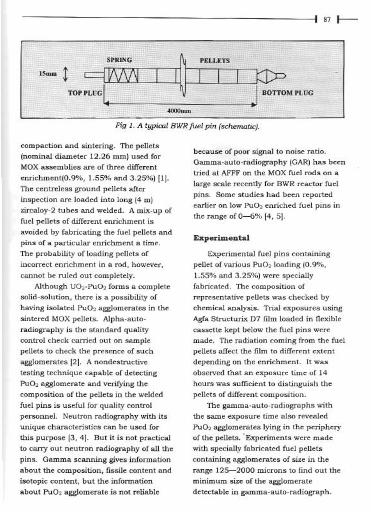
I 87 I--
Fig 1. A typical BWRfuelpin (schematic).
compaction and sintering. The pellets
(nominal diameter 12.26 mm) used forMOX assemblies are of three different
enrichment(0.9%, 1.55% and 3.25%) [iI.
The centreless ground pellets after
inspection are loaded into long (4 m)
zircaloy-2 tubes and welded. A mix-up of
fuel pellets of different enrichment is
avoided by fabricating the fuel pellets and
pins of a particular enrichment a time.
The probability of loading pellets of
incorrect enrichment in a rod, however,
cannot be ruled out completely.
Although UO2-PuO, forms a complete
solid-solution, there is a possibility of
having isolated PuO, agglomerates in the
sintered MOX pellets. Alpha-auto-
radiography is the standard quality
control check carried out on sample
pellets to check the presence of such
agglomerates [2]. A nondestructive
testing technique capable of detecting
PuO, agglomerate and verifying the
composition of the pellets in the welded
fuel pins is useful for quality control
personnel. Neutron radiography with its
unique characteristics can be used for
this purpose [3, 4]. But it is not practical
to carry out neutron radiography of all the
pins. Gamma scanning gives information
about the composition, fissile content and
isotopic content, but the information
about PuO, agglomerate is not reliable
because of poor signal to noise ratio.Gamma-auto-radiography (GAR)has beentried at AFFFon the MOX fuel rods on a
large scale recently for BWR reactor fuel
pins. Some studies had been reportedearlier on low PuO, enriched fuel pins inthe range of 0-6% [4, 5).
Experimental
Experimental fuel pins containing
pellet of various PuO,loading (0.9%,
1.55% and 3.25%) were specially
fabricated. The composition of
representative pellets was checked by
chemical analysis. Trial exposures using
Agfa Structurix D7 fihn loaded in fiexible
cassette kept below the fuel pins were
made. The radiation coming from the fuel
pellets affect the film to different extent
depending on the enrichment. It was
observed that an exposure time of 14
hours was sufficient to distinguish the
pellets of different composition.
The gamma-auto-radiographs with
the same exposure time also revealed
PuO, agglomerates lying in the periphery
of the pellets. .Experiments were made
with specially fabricated fuel pellets
containing agglomerates of size in the
range 125-2000 microns to find out the
minimum size of the agglomerate
detectable in gamma-auto-radiograph.
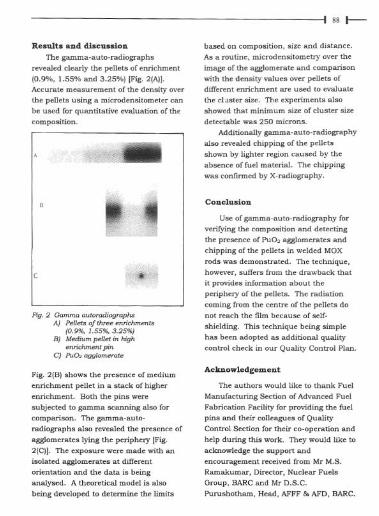
I 88 t-
Results and discussion
The gamma-auto-radiographsrevealed clearly the pellets of enrichment
(0.9%, 1.55% and 3.25%) [Fig. 2(A)].Accurate measurement of the densitY overthe pellets using a microdensitometer canbe used for quantitative evaluation of the
composition.
c
Fig. 2 Gamma autoradiographsA) Pellets a/three enrichments
(0.9%, 1.55%,3.25%)B) MediumpeUetin /Ugh
enrichment pinC) PaD, agglomerate
Fig. 2(B) showsthe presence of mediumenrichment pellet in a stack of higherenrichment. Both the pins weresubjected to gamma scanning also forcomparison. The gamma-auto-radiographs also revealed the presence of
agglomerates lying the periphery [Fig.2(C)]. The exposure were made with anisolated agglomerates at different
orientation and the data is beinganalysed. A theoretical model is alsobeing developed to determine the limits
based on composition. size and distance.As a routine, microdensitometry over theimage of the agglomerate and comparisonwith the densitY values over pellets ofdifferent enrichment are used to evaluate
the cl"ster size. The experiments alsoshowed that minimum size of cluster sizedetectable was 250 microns.
Additionally gamma-auto-radiographyalso revealed chipping of the pelletsshown by lighter region caused by theabsence of fuel material. The chipping
was confirmed by X-radiography.
Conclusion
Use of gamma-auto-radiography for
verifying the composition and detectingthe presence of PuQ2 agglomerates andchipping of the pellets in welded MQX
rods was demonstrated. The technique,however, suffers from the drawback that
it provides information about theperiphery of the pellets. The radiationcoming from the centre of the pellets donot reach the film because of self-
shielding. This technique being simplehas been adopted as additional qualitYcontrol check in our QualitY Control Plan.
Acknowledgement
The authors would like to thank Fuel
Manufacturing Section of Advanced FuelFabrication FacilitY for providing the fuelpins and their colleagues of QualitYControl Section for their co-operation andhelp during this work. They would like toacknowledge the support andencouragement received from Mr M.S.Ramakumar, Director, Nuclear FuelsGroup, BARC and Mr D.S.C.Purushotham, Head, AFFF & AFD, BARC.
References
I 89 I--
1. .Specification for mixed oxide fuelpellets and fuel rods for All MOXassemblies., BARe Internal Document.
2. Wick O.J., .Plutonium Hand Book",American Nuclear Society, Rlinois,1980.
3. Panakkal J.P., Ghosh J.K. and RoyP.R., .Characterisation of uranium-
plutonium mixed oxide nuclear fuelpins using neutron radiography",BritishJuumalofNDT27 (1985), pp.232-233.
4. Panakkal J.P., .Nondestructiveevaluation of nuclear fuels by
radiographic and ultrasonictechniques", Ph.D. Thesis submitted toKerala University, 1992.
5. Ghosh J.K., Panakkal J.P. and RoyP.R., .Use of autoradiography for
checking plutonium enrichment andagglomerates in mixed oxide fuelpellets inside welded fuel pins., NDTInt. 17 (1984), pp. 269-271
rhi& paper was selected;g"",,~est.Technical Paper, i1\r,R80~ ' publi&hed in theJournal of Nondestructive' Evaluation, an official journal of Indian Society for
Nondestructive Testing during the period 1997-1998 and the award was
presented on 1lJ'h ~ecc;mber, 1998.
About the authors ..
Dr Jose P. Panakkal,Superintendent (Quali1yContro11, Advanced FuelFabrication Facility, Tarapur(16~ Batch of Tram;og School,M.Sc. Phys;.s, lIT, Madras1992, Ph.D., Kcrala UniV...;ty,1992, National NOT Award ;n
R&D, ISNT, 1994, certified to ASNT Level-III;n RT,UT and NRT. 1988). He w.. deputed toF,"unhofer Institute for NOT, S~brucken,Germany during 1987-1989. Worlciog m the fieldof quality control of nuclear fuels, various NDEtechn;ques and material characteri..tion.Associated with NDE of fuel pms constitutiog thefint CO" of FBTR and respons;ble for qualitycontrol ofBWR MOX fuel bundles for TAPS.
Mr D. Mukbe>jee, (32'" Batchof Trainiog School, B.E.Metallurgy,Calcutta Univers;1y,ISNT Level-III m UTI. JomedAFFF m 1989. Worlciog m thefield of quali1y control ofnuclear fuels, special;sed ;n
various NDE techniqu.. like radiography,ultrasonics and leak testing and microstructuralevaluation of materials and welds. Respo",iblefor NDE of MOX fuel pms and microstructuralevaulation of MOX fue!.
Mr V. Manoh"an, (B.Sc. Phy., AnnamalaiUniversi1y, PG D;ploma m Radiological Physics,ISNT Level-I m LPT). Jomed AFFF m 1988. He h..carried out rad;ograph mspection of MOX fuel pmsand other fuel pms fabricated at AFFF. He hasbeen transfer"d to IGCAR in 1996 and working inv,,;ous NDE techniques.
Mr H.S. Kamath, Head, AFFF (13~ Bal<h TrainffigSchool, RE. MeL, REC,Suratkal Univers;ty, 19691.Workmg in the area of Pubearing fuels for last 28 yearsstarting with fuel for-PURNlMA- fast critical facill1yat TTombay to development ofMOX fuels for BWRs atTarapur. Associated with AFFF
from conceptual stage to """lato,,, clearance.Major area of mterest is development of h;ghperformance MOX fuel and new characterisationtechn;ques. Plant Superintendent s;nce 1991 andHead, AFFF smce 1996.
I 90 I---
Observation of double pulsing in asingle mode TEA CO2 laser caused bythe effect of mode pulling and pushing
J. Padilla Nilaya and Ohruba J. Biswas
Laser and Plasma Technology DivisionBhabha Atomic Research Centre
Abstract
We have di"ove,ed a mode pulling =d pu'hing phenomenon of the,mal o,igin in the opecationof a ,ingle mode TEA CO, law. Thi, effect Mi,e, fmm the intra pul,e ",mpecatu,e inducedchange of ,efcactive index and can pu,h the cavity mode. when appmpria",IY loca",d with mpectto the cente, of tr=,ition, out of I..ing even thmugh condition of th,e,hold population invmioni, ..ti,fied. Following the teemination of I..ing, the tempecatu,e equilibca"" =d the mode i,pulled into the gain domain, cau,ing the,eby the emi"ion of a ,econd pul,e. We have pmvidedevidence in ,uppo,t of thi, mechani'm. We al,o have di,cu"ed the po"ible u,e, of thi, doublepulsing phenomenon.
THE HEAT DEPOSITED FROM THE
vibrational transnational (V-T) energy
relaxation during lasing is known to result
in the frequency chirping in the operation
of a pulsed CO, laser [1]. We report here,
for the first time to our knowledge, that
this intra pulse temperature induced
change of refractive index can under
certain conditions, lead to the emission of
double pulse from the CO, laser when
operated under single mode condition. As
a result of the heat deposition, the changein the refractive index causes the
frequency of the mode to increase and it
can be pushed out oflasing bandwidth
when detuned sufficiently away from the
line center on its higher frequency side.
This would cause premature termination
of lasing even though condition of
threshold population inversion is
satisfied. Following this, as the
temperature equilibrates, the mode re-
enters the gain domain causing thereby
the emission of a second pulse, albeit, of
lesser power. As expected the delay
between the two pulses could be varied by
varying the amount of detuning before the
onset of lasing. The weakening of this
double pulsing effect in the case of helium
free operation for which Y-T relaxation is
greatly reduced further substantiates our
above claim of its operating mechanism.
The double pulsing phenomenon we
report here can be put to many important
applications such as measurement of
frequency chirping and finding out the
relaxation dynamics of the energy levels of
any new additives.
The experiment was conducted on a
mini TEA CO2 laser (Fig. 1), detailed
description of which can be found
elsewhere[2]. The laser was first operated

I 91 I--
Fig. 1 The schematic of the experimental set-up. A, and A, are two intra-cavity apertures
in a short cavi1y (length" 20 em)configuration with normal gas mixturesviz. CO, :N,:He: : 1:1.5:4. The single
longitudinal mode nature of lasing wasconfirmed from the temporal profile of thepulse which contained no oscillation withperiod of cavi1y round trip time(t,). It,instead, exhibited oscillation of a much
larger period viz. 12t, indicating thepresence of two transverse modes.Introduction of appropriately shutapertures eliminated this oscillationyielding an absolutely clean temporalpulse. At this point we were intrigued bythe premature termination of this pulseand there-emission of a second clean
temporal pulse after a brief interval. Oncloser examination, it was revealed thatthis second pulse was emitted for some
specific range of cavi1y length conditionsover which its temporal separation fromthe fITst pulse varied from almost 0 to 4.3
~sec (fig. 2, traces a to c ). Using a CO,spectrum analyzer, we further confirmedthat both the primary and secondarypulses originated from the same ro-vibrational transition. In order to
eliminate the possibili1y of two excitationpulses well separated in time as a causeof this double pulsing phenomenon, wemonitored the voltage and thecorresponding current pulse. Their shapeswere found to be reproducible and devoidof any second pulsing. The duration of theexcitation pulse was" 900 nsec and theonset of lasing occurred at least 500 nsecafter the beginning of this pulse. In orderto confirm if the observed result of doubleIsing is indeed a single mode
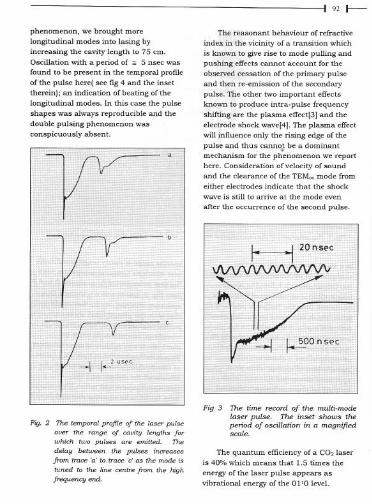
phenomenon, we brought morelongitudinal modes into lasing byincreasing the cavity length to 75 em.Oscillation with a period of " 5 nsec wasfound to be present in the temporal profileof the pulse he«! see fig 4 and the insettherein); an indication of beating of thelongitudinal modes. In this case the pulseshapes was always reproducible and thedouble pulsing phenomenon wasconspicuously absent.
Fig. 2 The temporal prafile of the la.ser pulse
ave, the range of cav;'y lengths fa,which two pulses a,e emitted. The
delay between the pulses inc,easesfrom "ace 'a' to "ace 'c' as the mode is
tuned to the line centre from the highfrequency end.
1921--
The reasonant behaviour of refractive
index in the vicinity of a transition which
is known to give rise to mode pulling and
pushing effects cannot account for the
observed cessation of the primary pulse
and then re-emission of the secondary
pulse. The other two important effects
known to produce intra-pulse frequency
shifting are the plasma effect(3] and the
electrode shock wave[4J. The plasma effect
will influence only the rising edge of the
pulse and thus cannot be a dominant
mechanism for the phenomenon we report
here. Consideration of velocity of sound
and the clearance of the TEMoo mode from
either electrodes indicate that the shock
wave is still to arrive at the mode even
after the occurrence of the second pulse.
~
...
~
Fig 3 The time record of the multi-moMlaser pulse. The inset shows tlieperiod of oscillation in a magnifiedscale.
The quantum efficiency of a CO, laseris 40% which means that 1.5 times the
energy of the laser pulse appears as
vibrational energy of the 01'0 level.

Assuming that all this energy is realizedtranslationally in a Helium richmixture[5J, we have estimated atemperature rise of the gas mixture in theactive volume as =ISOK. This wouldresult in an increase of the mode
frequency of the short cavity laser by=175 MHz. If the cavity length is such thatthe mode is near to the end of the lasingband width on the higher frequency side,the change in the refractive index maythen be sufficient to push the mode out oflasing. As the extra heat is conductedaway, the mode is pulled inside the gainregion causing the onset of the secondpulse. If now the mode is slowly tunedaway from the end towards the linecentre, temperature rise will be higherand consequently the second pulse withlower energy would appear after anincreasingly longer pause. A point will,however, come when the mode will beaway from the higher frequency end by anamount, which is more than themaximum frequency shift caused by thechange of temperature with the result thatdouble pulsing is never observed in thisregion. All these aspects are amplydemonstrated in the traces of fig.2. Themaximum delay between the primary andthe secondary pulse was found to be 4.3 I'sec.
In order to study this double pulsingbehavior in a system where V-T relaxationis very slow we operated the laser utilizingHelium-free gas mixture with the help oflow ionization potential additives[6]. Asexpected, the appearance of the secondpulse here was found to be muchrestricted and its maximum delay withrespect to the primary pulse was found to
be = 0.21' sec (fig.4)
I 93 I---
~Fig. 4 The weakening of the two pulse effect
when the laser ;s opera1ed with veryless helium.
In conclusion, we have shown thatlaser induced change of gas temperaturemay, under certain conditions, lead to theemission of two pulses separated in timein the operation of a single mode TEA Co,laser. The measurement of the delaybetween these two pulses can provide anindirect way of gauging the amount offrequency chiIp the mode has undergone.The study of the dependence of the delayon the partial pressure of the gasesnormally used as well as any newadditives may also provide valuableinformation with regard to the relaxationdynamics of the energy levels thatparticipate in the lasing process. Wefinally note that this effect may not bespecific to CO, lasers alone and may beobserved in the single mode operation ofany other lasers wherein onset of lasingwill cause appreciable change in thetemperature of the active region inside thepulse.

1941--
References 4. V.G. Roper e1 aL, Opt. Commun. 25,2351191781
5. L. Taylor and S. Bitteman, Rev. Mod.Phys. 41, 26 (1969)
6. A.K. Nath and D.J. Biswas, J. Appl.Phys. 53, 5469 (1982)
1. H.P. Chou e1 aI., Appl. Phys. Lett. 56,2086 (1980)
2. D.J. Biswas 01aI., Rev. Sci. Instrum.66,4813 (1995)
3. D. Willetts and M. Harris, J. Phys. D:Appl. Phys. 15,51 (1982)
ThIs paper won the Second Best presentation award at the XVll Young
Physicists Colloquium of the Indian Physical Society, held at the SahaInstitute of Nuclear Physics, Calcutta, during August 19-20, 1999
About the authors ..
J. Padroa Nilaya. (B.sc.. Nagpur Unive",i1y. 1989; M.Sc(phys;cs). Nagpur Unive",i1y. 1991)graduated "om the 35'" batch of the TnUning SchooL She was recipient of the univeni1y goldmedals for securing f=t position m both B.Sc and M.Sc. esammations. Her researchmterests mc1ude studies = continuous and pulsed Co, lasen. She hss participated activelym the development of latch proof TEA lam pulsers and in understanding the role of spatialhole burning on the emission spectrum of go< lams. She is also working towards her PhD on-- the development of a repetitive widely tunahle single mode Co, laser and its application on
optica1ly pumped molecular lase",.
Dr Dhruba J. Biswas, IM.Sc, liT Kharagpuc. 1978; PhD, Edinburgh, 19861 graduated fromthe 22"' batch of the Training School. He w.. recipient of INSA young "icotis< award(Physics. 1987). A.K. Bose Memorial Award of INSA (phys;cal Science. 19891. N.S.Sa1yamurthy award of IPA(I991). His work, which mostly pertains to the research and
'i' development of go< and optically pmoped molecular lasen and studies on optical cbaos. hasL f t led to more than 60 research puhlicstio", m mtemational journals. He was awarded the
Assoclateship of the International Centre for Theoretical Physics, Italy (1994) and participates in thecollahorative research work at the centre.
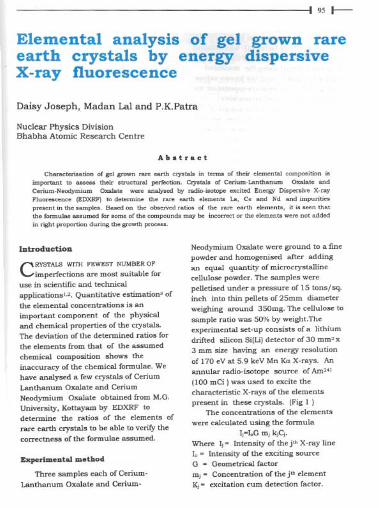
I 95 I--
Elemental analysis of gel grown rareearth crystals by energy dispersiveX-ray fluorescence
Daisy Joseph, Madan La! and P.K.Patra
Nuclear Physics DivisionBhabha Atomic Research Centre
Abstract
Characterisation of gel grown ra<e earth c>}'staJs ;" tenns or theu- elemental composition ;sUnportant to assess their structural parleetion. C<ystals of Cerium-Lanthanum Oxalate andCerium-Neodymium Oxalate w= anaIysed by "ulio-;sotDpe excited Ene"", D;s"..-sive X-rayFluorescence (EDXRF) to detemrine the rare earth elements La. Ce and Nd and Unpuritiesp...aent;" the samples. Based on the obsmed ratios or the race earth elements. it is seen thatthe fonnulae assumed fot some or the compeunds may be ;"COITOCtOt the elements wete not added;" right proportion during the gtowth ptocoss.
Introduction
CRYSTALS WITH FEWEST NUMBER OF
imperfections are most suitable foruse in scientific and technical
applications'.2. Quantitative estimation3 ofthe elemental concentrations is animportant component of the physicaland chemical properties of the crystals.The deviation of the determined ratios forthe elements from that of the assumedchemical composition shows theinaccuracy of the chemical fonnulae. Wehave analysed a few crystals of CeriumLanthanum Oxalate and Cerium
Neodymium Oxalate obtained from M.G.University. Kottayam by EDXRF todetermine the ratios of the elements ofrare earth crystals to be able to verify thecorrectness of the fonnulae assumed.
Experimental method
Three samples each of Cerium-Lanthanum Oxalate and Cerium-
Neodymium Oxalate were ground to a fmepowder and homogenised after addingan equal quantity of microcrystallinecellulose powder. The samples werepelletised under a pressure of 15 tons/sq.inch into thin pellets of 25mm diameterweighing around 350mg. The cellulose tosample ratio was 50% by weight.Theexperimental set-up consists of a lithiumdrifted silicon Si(Li) detector of 30 mm2 x3 mm sire having an energy resolutionof 170 eVat 5.9 keY Mn Ka X-rays. Anannular radio.isotope source of Am24!
(100 mCi ) was used to excite thecharacteristic X-rays of the elementspresent inthese crystals. (Fig 1 )
The concentrations of the elements
were calculated using the formulaIj=loGmj kjCj.
Where Ij= Intensity ofthej" X-ray line10= Intensity of the excitingsourceG -Geometrical factor
mj -Concentration of the j" elementKj= excitation cum detection factor.
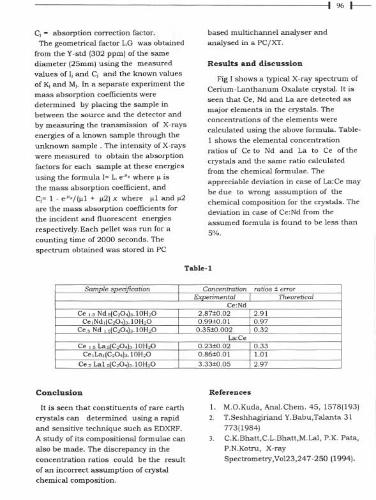
I 96 J---
C;: absorption correction factor.
The geometrical factor loG was obtained
from the Y-std (302 ppm) of the same
diameter (25mm) using the measured
values of Jj and Cj and the knowo values
of Kj and Mj. In a separate experiment the
mass absorption coefficients were
determined hy placing the sample inbetween the source and the detector and
by measuring the transmission of X-rays
energies of a knowo sample through the
unknowo sample. The intensity of X-rays
were measured to obtain the absorption
factors for each sample at these energies
using the formula J: 10 eJ'x where fl is
the mass absorption coefficient, and
Cj: 1 - ~X/hIJ + f12) x where flJ and f12
are the mass absorption coefficients for
the incident and fluorescent energies
respectively. Each pellet was run for a
counting time of 2000 seconds. The
spectrum obtained was stored in PC
based multichannel analyser andanalysed in a PC/XT.
Resultsand discussion
Fig J shows a typical X-ray spectrum ofCerium-Lanthanum Oxalate crystal. It isseen that Ce, Nd and La are detected asm'\ior elements in the crystals. Theconcentrations of the elements were
calculated using the above formula. Table-1 shows the elemental concentrationratios of Ce to Nd and La to Ce of the
crystals and the same ratio calculatedfrom the chemical formulae. The
appreciable deviation in case ofLa:Ce maybe due to wrong assumption of thechemical composition for the crystals. Thedeviation in case of Ce:Nd from theassumed formula is found to be less than5%.
Table-l
Conclusion
It is seen that constituents of rare earth
crystals can determined using a rapidand sensitive technique such as EDXRF.A study of its compositional formulae canalso be made. The discrepancy in theconcentration ratios could be the result
of an incorrect assumption of crystalchemical composition.
References
1.2.
M.O.Kuda, Anal.Chem. 45,1578(193)
T.Seshhagiriand Y.Babu,Talanta 31
773(1984)
C.K.Bhatt,C.L.Bhatt,M.LaI, P.K. Pata,
P.N.Kotru, X-ray
Spectrometry,Vo123,247-250 (1994).
3.
Samo!e soecification I Concentration ratios < errorI Exaerimental I Theoretical
Ce:NdCe '5 Nd,S C,O".lOH,O I 2.87<0.02 2.91
Ce,Nd, C,O, 5.lOH,O 0.99<0.01 0.97Ce, Nd 's C,O, 5.IOH,O I 0.35<0.002 10.32
La:CeCe 's LaslC><>, 5.lOH"Q I 0.23<0.02 10.33
Ce,La,(CoO,js.lOH"Q 1 0.86<0.01 1\.01Ce, La1.slC><>, 5.IOH,O I 3.33<0.05 12.97

I 97 I--
Printer
x-v Plotter
Fig. 1 Schematic diagram of X-ray spectromete' and experimental a"angement withradioisotope sou",e excitation
131072
Excitation 241Source Am98504
<f)1-Z:OJ0U
65536Lak", Cek",
~ ,\
;\ !\!: : III ,II: ; \Lakj3! \ : \., C~kJ3_J 1\,/ LI IAJ . \,J728 856
CHANNELNOS984
32768
0600
Fig. 2 X-ray spectrum of Cerium Lathanum Oxalate crystal
Tlds paper was adjudged as t"" best presentation at the VIth NatibttalSeminar on X-ray Spectrometry and Allied Areas, held at Post Graduate,!C9llege of Arts and Science, Ratlam, Madhya Pradesh,Fdtirlng
)'i',!,viimber17.19,1997
About the author...
Mm. Dai,y Jo"ph joia,d BARC in 1985 aft" compl,ting M.Sc. (Phy'.) fcom MumbaiUniv",ity. Sh, ha, boon wolking in th, fiold of En"gy Di'p",iv, X-my Fluo""'n"(EDXRF) and P,oton Induc,d X-lay Emi"ion "udi" fol th, la't 10 Y'~'.
(T'h£0"'"two autho,s a,. notp,e"nt/y wo,lcing in BARC)

1981--
Development of Bedside Vasa-screenat BARC
Thadomal Shahani Engg. CoUegeBandra (West), Mumbai 400050
Shweta Joshi, Madhura Kulkarni and Anuradha Modgekar
and
Sadhana A. Mandlik, Ch. Vijay Kumar and J.P. 8abu
Electronics DivisionBhabhaAtomic Research Centre
Abstract
A portable, recb_able battery ope...ted and ,imple ""tern called "8e<"ide y..o Screen" h.. beendeveloped at Electronk, D;v;.lon, Bhabba Alomlc R..ea<ch Centre. Th" 'ystem employ'
impedance plethy,mog.-aphlc principle Io, the ..'mment oI periphe.-al arterial blood flow.. well.. the ,tat" oIvenou, cicculation. The 'y,tern al,o employ, a mlcco compute, card Chameleon220 and a LCD ,creen fa, data acqui,ltion and dieplay. The opecation by battery end po'tabilityallowe the 'y,tem 10 be taken 10 the bed ,ide of the patient. The development of thi, 'yetem ied..cribed In thl, paper.
Introduction
THE INCIDENCE OF PERIPHERAL
vascular disease is very common inour country. Hypertensives, diabetics,smokers and tobacco chewers are at a
high risk of developing peripheralarterial occlusive disease and often end
up with gangrene demandingamputation of the limb. Sedentaryhabits, use of oral contraceptives,administration of intravenous fluids,
injury to the vein and pregnancy aresome of the causative factors of venous
disorders. Particularly the patients onintravenous fluids, after abdominalsurgery or those in ICCU followingheart problem are at a high risk ofdeveloping Deep Vein Thrombosiswhich can lead to fatal consequences
like Pulmonary Embolism, Hemiplegiaor Gangrene.
Peripheral Angiography isconventionally employed for thediagnosis of peripheral vasculardisease. However it is an invasive
procedure with inherent risk ofmortality or morbidity and is thereforeemployed judiciously. Non-invasiveprocedures like vascular doppler,plethysmography etc. are routinelyemployed for screening the patients andselecting the patients for angiography.Most of the non-invasive modalities are
available as laboratory equipments andthe patient has to be ambulated to thelaboratory for investigation.
Since the patients in ICU, ICCU etc.cannot be ambulated, it is therefore,necessary to develop a simple and
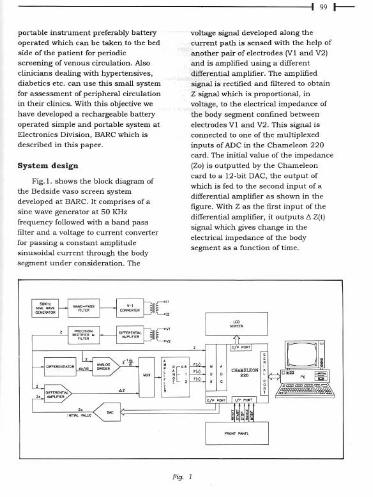
1991--
portable instrument preferably batteryoperated which can be taken to the bedside of the patient for periodicscreening of venous circulation. Alsoclinicians dealing with hypertensives,diabetics etc. can use this smali systemfor assessment of peripheral circulationin their clinics. With this objective wehave developed a rechargeable batteryoperated simple and portable system atElectronics Division, BARC which isdescribed in this paper.
System design
Fig.!. shows the block diagram of
the Bedside vaso screen system
developed at BARC. It comprises of a
sine wave generator at 50 KHz
frequency followed with a band pass
filter and a voltage to current converter
for passing a constant amplitude
sinusoidal current through the body
segroent under consideration. The
voltage signal developed along the
current path is sensed with the help of
another pair of electrodes (VI and V2)
and is amplified using a dllTerent
differential amplifier. The amplified
signal is rectified and filtered to obtain
Z signal which is proportional, in
voltage, to the electrical impedance of
the body segroent confined between
electrodes VI and V2. This signal is
connected to one of the multiplexed
inputs of ADC in the Chameleon 220
card. The initial value of the impedance
(Zo) is outputted by the Chameleon
card to a 12-bit DAC, the output of
which is fed to the second input of a
differential amplifier as shown in the
figure. With Z as the first input of the
differential amplifier, it outputs!1 Zit)
signal which gives change in the
electrical impedance of the bodysegroent as a function of time.
Fig. 1

I I00 I----
"'"
(5;;";:. Load)
Fig.2
The Z signal is also differentiated and
divided by Z value to obtain normalized
dZ/dt waveform .!..~as shown in theZ dt
figure. C>Z(T)and normalized dZ/dt are
fed to a multiplexer which outputs
either of them depending upon the
manual selection from the front panel
of the instrument. The output of the
multiplexer termed as F(Z) is amplified
and fed to the remaining three
multiplexed inputs of ADC in the
Chameleon card depending upon the
range of measurement selected from
the front panel of the instrument. There
is also a start and stop input to the
Chameleon card from the front panel.
Serial port is also available from theChameleon card for communication to
a personal computer for development of
software. The developed software can be
loaded in the EPROM, resident in
Chameleon card, and the
communication with the PC is
dispensed with.
To begin with, electrodes are
applied to the desired body segment of
the patient in supine position. Themode selection switch is used to select
either the assessment of peripheral
arterial blood flow or screening for DeepVein Thrombosis. The Z value is sensed
through ANI3 and displayed on the
screen. Z value higher than 80 ohms
showed be lowered by adjusting the
distance between sensing electrodes.
The final Z value is outputted to DAC
for obtaining C>Z(t)signal. Flz) input is
read by the computer and
simultaneously displayed on LCD
screen at a rate of 100 or 5 samples persecond for arterial or venous studies
respectively. In case of venous studies,
the Z value is adjusted by the computer
on either side for bringing down the
1101 I--
&:It) trace on the LCD screen as shown
in flow chart of figure 2.
In case of assessment of peripheralarterial blood flow normalized dZ/dt ofvalue one is considered normall. The
other distal locations can be similarlyassessed by suitable placement ofelectrodes.
In case of assessment of venous
circulation after stabilizing the C>Z(t)
trace proximal segment of the limb is
pressurized with the help of a
tourniquet to a pressure of 60 mm of
Hg. The rise in the trace will be
observed till it reaches a plateau when
the tourniquet in deflated. After C>Zlt)
trace returns back to initial position the
stop switch is pressed to stop the data
acquisition. The difference between the
plateau value and initial value of C>Zlt),
commonly known as venous
capacitance IVe) is considered normal
in the range of 0.75 I 0.15 ohms. After
deflation of the tourniquet the change
in the &:(t) value in first three seconds,
commonly known as Maximum Venous
Outflow (MVO2), is considered normal
in the range of 0.5 I 0.1 ohms. Both the
parameters are displayed on the LCD
screen at the end of the procedure.
The power supply required for this
system is +15V (100 mA), ~15V (75 mAl
and +5V 1300 mAl, which is derived
from a 6V, 4 AH rechargable battery.
An astable multivibrator produces
square wave of frequency around 15
KHz with the help of battery. This
square wave is fed to a driver stage
having ferrite core transformer. The
secondary of the transformer is used to
generate the required power supply for
the system.
The system is under calibration and
testing and will be shortly shifted to a
hospital for clinical evaluation.

I102r--
Acknowledgements
The authors express their gratitudeto Dr. S.K. Kataria, Head, ElectronicsDivision, for providing guidance ands,-,pport for this development. Theauthors are also thankf,-,l to Mr S.P.
Chaganty, Head, ReactorIns~mentation Section, and MrAmitabh Das, Scientific Officer, ReactorIns~mentation Section, for their
guidance and help. The first threea,-,thors are thankfcl to Mrs. Mita
Bhowmick, Incharge, BiomedicalEngineering Department, ThadomalShahani Engineering College, for givingan opport,-,nity to undergo InplantTraining and carry o,-,t project work atBARC. The a,-,thors are also thankf,-,l to
Mr A.R. Kini for helping in their day today work.
This pap';.!; ~w~~;t.Conference onEngineeri1J9 Sod.
.f' 'It};,
References
1. Jindal G.D., Nerurkar Smita N.,Pedhnekar Sadhana A., Babu J.P.,Kelkar M.D., Deshpande Alaka Kand Parulkar G.B. : Diaguosis ofPeripheral Arterial OcclusiveDiseases using ImpedancePlethysmography, Journal of Postgraduate Medicine, Vol. 36, 1990,ppI47-153.
2. Jindal G.D., Nerurkar Smita N.,Pedhnekar Sadhana A., Masand
Kavita L., Gupta D.K., DeshmukbH.L., Babu J.P., and Parulkar G.B. :Diaguosis of Venous DisordersUsing Impedance Plethysmography,Journal of Post graduate Medicine,Vol. 36,1990, ppI58-163.
'rjze In the student paper:;pompetition In.,therPi;ERglneerlng, . o,.giinlsed by Blomedicar
"!f.la r:!umbal Chapte:~;! o~,f;eb~ary 27, 1999
About the authors.
M". Sadh=a A. Mandlik ",aduated in Enginwing fcom Amcavati Univecsity and h"work,d in Meltron a, R&D Engineer from 1991 to 1996. She joined Electroni" Divi,ion,BARC in 1996 =d h" been working in the field of Biom,dical In,trum,ntation. She h"mad, remMkable contribution in the development of Bed,ide Vaw Screen =d M,dicalAnalyzer for the ,mening of high ri,k patien" of peciphecical va"ulM di"", and for
the diagno,i, of di"a", of the internal org=' of the body reepectively.
Mr J.P. Bahu joined BARC in the yeM 1969 after completing Diploma inTelecommunication fcom Government Poly"chnic. Andhra Pradeeh. He h" made'ignificent contribution in the development and pcoduction of control 'y"em, =d power,uppliee for Variable Energy Cydotron, Calcutta. He h" been working in biomedicalin,trumentation for the pa" 17 yea" and h" made remMkable contribution in thedevelopment of Miccoproc,,"oc ba"d Impedance Plethy,mowaph. PC Add on Card forImaging in Nud"r Medicine. fe.,ibility model of Electrieallmp'dance Tomo",aph and PC
b,,'" Impedance Cardiova'ogcaph for the diagno'i, of a variety of di"a", of the human body.

I 103 I--
Thermal investigations on N,N' dihexyloctanamide complex of uranyl nitrate
P.B.Ruikar, S. Sriram, P.C.Kalsi, M.S.Nagar and V.K.Manchanda
Radiochemistry DivisionBhabha Atomic Research Centre
Abstract
The the,mal decompo,ition of manyl dinib'ato complex with N,N'dihexyl octanamide
(DHOA)was ,tudied which sugg"ted that the decompo,ition pmceeded in ""ee TG stage' withfom =othe,mic DTA steps comsponding to ,elease of two molecules of amides and two nib'ato
",oup' finally leading to U,O" Activation ene,gy fm each TG step was evaluated.
Introduction
N,N'-DlALKYL AMIDES HAVE BEEN
proposed as altfrnate extractants to
tri-n-butyl pho~phate (TBP) for the
reprocessing of nuclear fuels. Though
organophosphorous compound TBP is a
versatile extractant, amides have a
distinct advantage of their incinerability
leading to smaller amounts of secondary
waste.
During recent past, our group has
been investigating the solvent extraction
behaviour of actinides as well as fission
products employing N,N' dihexyl
octanamide (DHOA). Physico-chemical
studies on the complexes formed during
the two phase reaction helps tounderstand the mechanism of extraction
particularly under high loading conditions
of the organic solvent. An attempt has
been made in the present work to isolate
the ternary complex of uranyl nitrate withDHOA and investigate its
thermoanalytical behaviour in air upto850°C.
Experimental
Synthesis and characterisation of uranyl
nitrate-DHOA Complex
DHOA used in the present study was
synthesised in our laboratory [1,2] using
octanoyl chloride and dihexyl amine, both
of Merck-Schuchardt grade, The purity of
distilled final product (DHOA) was
ascertained by elemental analysis
[%C: 76.6(77,1); %H:12,9(13,3); %N:
4.37(4.49)], IR spectra (vc-o ~ 1640 em" )
and non-aqueous potentiometric titration
(amide content~ 99.2%).
UO,(NO,j,-DHOA complex was
prepared by solvent extraction method.
5ml of 3M HNO3 containing ImM of U

and 5ml of benzene containing 2mM of
amide were equilibrated for 30 minutes.
The benzene layer was separated,
evaporated and dried and product
recrystallised twice from n-hexane [2]. I.R
spectrum was recorded as nujol mull in
Pye-Unicam 9512 I.R spectrophotometer.
The thermal decomposition of
UO,(NO3)2.2DHOA was carried out in
flowing air using differential thermal
analysis (DTA) and thermogravimetry
(TG). The thermogram was recorded at the
heating rate of 5OCjmin upto 500°C and
lOOCjmin between 500oC-850oC in a
ULV AC thermoanalyser using sinteredAhO, as the reference material for DTA.
Results and discussion
Analytical data of the complex
conformed to the stoichiometry
UO,(NO3)2.2DHOA. I.R spectrum of the
complex clearly showed il anhydrous
nature of the product, ii) an absorption at
935cm", corresponding to the asymmetric
stretch of the uranyl group and iii) a shift
of 70 cm" in Vcoo suggesting that DHOA
moities bind the uranyl ion through
oxygen of the carbonyl group.
The thermal decomposition studies of
UO2(NO3)2.2DHOA in air showed three
main stages in its decomposition (Table I).
These three steps were clearly indicated
by three arrests in the T.G curve. % WI.
loss at the end of first step agreed well
(within 1.1 %) with that expected from the
release of two DHOA molecules. It was
possible to correlate the weight loss in the
second step to the formation of a
polymeric uranyl nitrate complex of the
type U20s(NO3), [31. Weight loss in the
third step agreed well (within 1%) with
that expected from the formation of U30"
I 104 I--
which was reasonably constant in the
temperature range 500-850 DC. Whereas
the first T.G step corresponded to two
DTA exothermic peaks, each of second
and third T.G steps corresponded to
single DTA exothermic peaks.
The DTA data and TG temperatures
for all three stages are also given in Table
I. Occurrence of 220°C DTA peak without
any distinct step in TG suggested that the
product formed is not stable under the
experimental conditions chosen in the
present work. The kinetics of the different
stages of decomposition as seen from the
TG curve was also investigated following
various approaches reported in the
literature [4,5]. TG data for all three stepswere found to fit well to Horowitz-
Metzger's method [6J for the kinetic
analysis of non isothermal data of a first-
order reaction. In this method
10g[10g(WojW)] was plotted versus e where
We and W are the weights of the sample
initiallyand at time t respectivelyand e ~
T-T, where T is the temperature
correspondiug to weight W of the sample
and T, is the peak temperature. The slope
of the straight line thus obtained is given
by Ej2.303RT,' where R is the gas
constant and E is the energy of activation.
The activation energy (E) values
calculated from the TG curve by this
method for the different stages of thermal
decomposition ofUO,(NO,),.2DHOA are
also presented in table I.

I 105 I--
Table1: Thermal Decomposition Data for UO2(NO')2.2DHOA
T,=Initiai decomposition temperatureT,=Decomposition maxima temperatureTFFinai decomposition temperature
References 3. C.C.Addison, H.A.J.Champ, N.Hodge
and A.H.Norbury, J.Chem. Soc; (1964)
2354.
4. AW.Coats and J.P.Redfem, Nature, 68
(1964) 201.
5. E.S.Freeman and B.Carroll,
J.Phys.Chem, 62 (1958) 394.
6. H.H.Horwitz and G.Metzer, Anal.Chem,
35 (1963)1464.
1. K.K.Gupta, Ph.D Thesis, University of
Mumbai (1997).2. P.B.Ruikar, Ph.D Thesis, University ofMumbai (1992).
paper wasanal Symposi
'ch 2-5,1998
at the'EZeventh:
'Ja17U1W during.
Sge DTApeak TGTemp Wt. loss (%) Product formed ENo. temp. (DC) (KJ moP)
(°C)T, T, Tr Expt Theor
I 220 (Exo) 200 285 295 61.9 61.2 UO,(NO3J, 59.5
290 (Exo)2 330 (Exo) 305 325 345 65.9 66.5 U,Oo(NO3)2 35.5
3 470 (Exo) 355 470 500 73.1 72.4 U,O, 30.2
I 106 J---
Dc P.B. Ru;k" joined Rad;oehemi,try Divi,ion, BARC, in 1969, aft" geaduating fcomMumba; Unive"ity in 1968. He obtained M.Sc. ( Inocganio Chemi'tryl fcom Univ",ity ofPune in 1987 and w.. aw"ded PhD (Chemi,try) fcom Mumba; Univ",ity in 1993. Hi'spedal field of wack is .. follow" I) Synth"is and eh"aeted..tion of ,0Hd complex" ofactinide, with various novel extractants Hke TBP, CMP, CMPO, monoacn;des , dWnides,sulph","des, beta-diketon", etc, 2) Specmcation analys;, of Pu fuels foc meta1lie and non-metall;c Unpudties, and 3) Effect of gamma rndiolysis of various novel extractants on theextractinn nf actin;des and fiss;on products. 41 Recently, he is engaged with solvent
extraction studies of actin;des with TBP using mixer settlen with respeel to reproeessing and nuele" wastemanagement. He is also involved in determining Limiting Ocganio Coneentration (LOCI of plutonium withr"peet to DHOA,
After obtaining his M.Sc. (Analytical Chem;,try) from Mumbai Univers;ty, Mr S. Srnacnjoined Rad;ochem;stry mvis;on, BARC in 1996 as Jun;or Research Fellow under the BARC -Mumbai Unwersity Collaboration Scheme for Ph.D (Chemistry). His main area of researchineludes the studies on Hqu;d - Hquid extraction, synthes;s and chacactedsation of soHdactinide complexes, extraction ohromatogcaphy and Hquid membrane based sepacation ofactinides and fi"ion pcoduots using novel extraotants Hke N,N'dialkYI amides andsubstituted malonamides relevant fcom the nuele... fuel repcoee"ing and wastemanagement point of view.
Dr P.C.Ka1s; after obtaining h;s M.Sc (1972) and Ph.D (1976) degcees from Jammu Un;versityjoined as Post Doelocal Fellow of CSIR He joined the Radioohem;stry Div;s;on of BARC in1978. His .areas of interest inelude soHd state nuele" track deteelocs, destructive andnond"truotive y techniqu" foc nuele" matedals accounting and th"mal analy,is ofsoHdl polymm. He i, swetary of Nuele" Track Sodety of India (NTSII and IndianA..ociation ofSoHd State Chem;sts and Allied Sdentists (ISCAS).
Dc. M.S.Nagar IM.Sc, (Inorganic Chem;,try), 1964; Ph.D.(Chem;'tryl, BHU,1968J w.. Sen;orResearch Fellow (CSIR) until Maceh 1968 when he joined Radioohemi'try Divi,;on,BARC.Hi, main "ea ofre,eacehineluded the 'tudi" on cadiation chemistryofaotinides, ,.adiolytiodegeadation of extractants in pcoee" chemi,try of actinides, 'ynthe,i, & chacact"ization ofnovel exo-actant, foc actinide, and ,0Hd actin;de complex". He w.. al,o involved in chem;oalquaHty cono-ol of FBTR fuel,. Hi, c",Tent interesta inelude the sep"ation and reeovery
techniques for actinides with organo-nitrogen {mono- & di-acrud"l and o.-gano-phosphocou, compound'(CMPO & ,uh,tituted pho'phonic acidsl with respect to repcoce"ing & nuel..r w..te management
Dc.V.K.Manohanda joined the Radioohemi,try Division, BARC in 1969 aft" gcaduatingfcom Delhi Univeesity and from 12" batch of Tcaining School, BARC. He w.. aw..d,dPh.D. by Mumbai Univeesity ;n 1975 and he oacried out Post-Doctocal work at UTE?,Texas, U.S.A. .. Fulbright Sohal" (1985-871. He wa, reeagnised .. a Ph.D Gu;de inChemistry by Mumbai Unweesity in 1993. He i, working as Head, Actinide Chemi,trySeetion, Radiochemistry Division ,inee 1996. He h.. made odginal contributions in thefollowing acea" il Thermodynacnio, and kineti.. of complexes of macrocycHc ligands withlanthan;des and actinides, iil Physico-chemical studi.. on actinide complexes, iiil Novelextractants ofaotinides, and ivlChemicalqualityoontrolofPu based fuels.
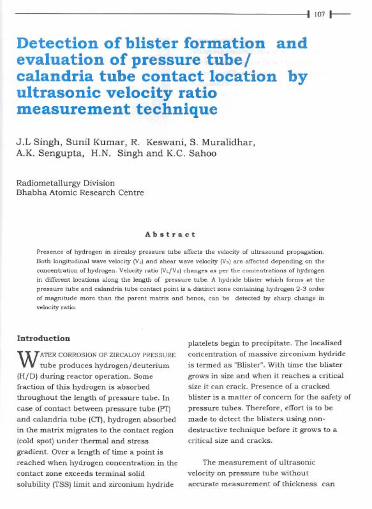
I 107 I---
Detection of blister formation andevaluation of pressure tube!calandria tube contact location byultrasonic velocity ratiomeasurement technique
J.L Singh, Sunil Kumar, R. Keswani, S. Muralidhar,A.K. Sengupta, H.N. Singh and K.C. Sahoo
Radiometallurgy DivisionBhabha Atomic Research Cehtre
Abstract
Pre,ence of hydwgen in zit.caloy pce"uce tube alTec" the velocity of ulITawund pwpagation.Both longitudinal wave velocity (Vel and ,hear wave velocity (V,) ace alTeded depending on the
concenITation of hydrogen. Velocity catio (Ve/V,I chang" a' pee the concentration, of hydwgenin diITemnt location, along the length of pre"uce tube. A hydride bl""'. which foem, at the
pm"um tube and calandria tube contact point i, a di,tinct zone containing hydwgen 2-3 m.deeof magnitude moce than the pacent maITix and hence. can be detected by ,hacp change in
velocity catio.
Introduction
WATER CORROSION OF ZIRCALOYPRESSURE
tube produces hydrogen/deuterium
(H/D) during reactor operation. Some
fraction of this hydrogen is absorbed
throughout the length of pressure tube. In
case of contact between pressure tube IPr)
and calandria tube (ef), hydrogen absorbed
in the matrix migrates to the contact region
(cold spot) under thermal and stress
gradient. Over a length of time a point is
reached when hydrogen concentration in thecontact zone exceeds terminal solid
solubility (TSS) limit and zirconium hydride
platelets begin to precipitate. The localised
concentration of massive zirconium hydride
is termed as "Blister". With time the blister
grows in size and when it reaches a criticalsize it can crack. Presence of a cracked
blister is a matter of concem for the safety of
pressure tubes. Therefore, effort is to be
made to detect the blisters using non-
destructive technique before it grows to a
critical size and cracks.
The measurement of ultrasonic
velocity on pressure tube without
accurate measurement of thickness can

I 108 t--
be misleading. Thickness variations arepresent in the as manufactured pressuretubes. To avoid the effect of thickness
variations, the velocity ratio (VR)technique have been adopted to detectblisters. This paper discusses the workcarried out and result achieved at
Radiometallurgy Division, BARC.
Ultrasonic testing technique
A 10 Mhz point focussed probe was
used under normal incidence immersion
condition to get 3-4 backwall echoes. A
high frequency damped ultrasonic
transducer which gives few oscillations is
well suited for time of flight
measurements. Normal incidence is
achieved by maximising the signal coming
from water /pressure tube interface. This
is done by adjusting the probe and
monitoring the signal on the screen. Fig. I
shows CRT screen photograph of typical
ultrasonic echo pattern. The peaks A. B,
& D are multiple backwall echoes
produced by longitudinal wave trips. Peak
C is by mode converted one way shear
wave. The water column length between
pressure tube surface and ultrasonic
probe is adjusted such that shear wave
peak C has maximum amplitudeP!. The
time of flight is measured with CRT
screen fully expanded. The difference in
time of flight (TOF) of C&B and D&B aremeasured in nanoseconds to calculate the
ratio of the two velocities using derived
correlation (I). The velocity ratio for
unhydrided zircaloy is 2.05 and 2.8 for
hydride blister.
Velocity ratio VL/VS = I + 2 x (C-B)/(D-B)(1)
Fig.) CRT screen echo pattern fa, velocity mtiameasu,ement
Scanning setup and measurement
The pressure tubes removed from the
reactor are highly radioactive. A Lead
shielded cell was constructed to carry out
the velocity ratio measurement on
irradiated pressure tube. A vertical water
tank fitted with window was used to
immerse pressure tube piece containing
the pressure tube calandria tube contact
locations. Perspex ring probe holder was
fitted on a tripod inside the tank. A
focussed normal probe was used for VR
measurement. Two other probes were
fitted for axial and circumferential flaw
detection in the pressure tube wall. The
pressure tube piece held by internal collet
was translated up/down by a special
pulley and drum arrangement with
flexibility to rotate it by 360°. Counter
weight was provided to balance the
pressure tube piece weight for an easyand controlled movement. Interior of the
cell was lightened by WOW electric bulbs.
The visibility of contact locations was
enhanced under immersion in water free
from air bub!es. Through the window it

I 109 I-
was possible to see the probe being
accurately positioned on the contact
locations while taking the measurements.
Fig.(2a) shows photograph of contact
locations and Fig.(2b) shows the velocityratios measured over different locations
on the K-7 pressure tube. Measurementswere taken in the centre of contact
patches and on surrounding areas by
moving the pressure tube both axially and
circumferentially. As can be seen, velocity
(oj
ratios at contact locations are not
different from that at surrounding areaS
which has about 30 ppm hydrogen!
deuterium. This indicated that contact
locations do not contain any blister. This
was later confirmed by neutron
radiography[2[ and metallography. Large
number of measurements were taken but
for brevity only few measured values are
shown in the adjoining sketch Fig.2b.
2.13682.1338
2.1357 ~2"341
\}--
,
-~ 2.1474
2.1384
~.., 2.1373x.~'- 2.[372
,-- 2.1338
'2.13072.1371
2.1334 2.1402
'2.1323
'2.13512.1333 . "~'-'
2,1350+ / '-......
tJ --+2.13232"353+--/0-
~.............2.1334
2.1328'2.1346
8~:==:::t21334[ .-/."'/ 2.1334
Fig. 20 Contact locations ofK-7 pressure tube; and Fig.2b Measured velocity rauos
{hj

1110 I--
Discussion Conclusion
In a focussed beam peripherallongitudinal rays fall at an angle and getmode converted to shear wave. Shear
wave signal appears separately due to itslower velocity. The amplitude of shearwave peak depends on crystal diameterand focal length. Wider the focussedbeam cone,. higher will be the amplitude
of shear wave peak. Mode converted sliearwave signals are nonnally weak. Shearwave signal should not disappear due tovariation in water column, surfacemorphology and curvature. Peak A keepschanging its shape because it comesfrom pressure tube/water interfacetherefore should not be considered for VRmeasurements.
Velocity ratio measurementcorresponds to the average H/Dconcentration over the (thickness) point ofinspection. Over the contact zone only asurface layer may reach blistercomposition, which will not give VR 2.8.Even then the average H/D concentration
will be very high to give a detectableincrease in YR.
When the velocity ratiomeasurements are done from inside the
pressure tube, a stronger shear wavepeak C is obtained because concavecurvature further focusses the beam
which will be an added advantage. Thedisadvantage of carrying out VRmeasurement from inside is that it
becomes a blind operation and further IDsurface may have thick oxide with cracks
and scratches which may affect signals.
The measurement carried out did not
reveal any sharp change in velocity ratio
at pressure tube and calandria tube
contact zone compared to their
surrounding areas. This indicates that no
blisters have fonned at the pressure tubecalandria tube contact zone. This was
also confinned by neutron radiography
and metallography. This technique will be
refined by measurements on more
number of pressure tubes removed from
the reactor.
Aoknowledgements
The authors would like to
acknowledge the work done by the staff of
Post Irradiation Examination Section for
carrying out this work. The authors would
like to thank Mr D.S.C. Purushottam,
Director, Nuclear Fuels Group, for his
encouragement and appreciation of thiswork.
Refereuces
1. Mair H.D., Moles M.D.C., and DolbeyM.P. The experience of uncrackedblister detection in Bruce nuclear
station, lAEA consultants meeting onthe effect of hydride blisters on the
integrity of PHWR pressure tubes, 25-29 July 1994 Vienna.
2. Gangotra S.,et. al. Neutronradiography of contact location ofirradiated zircaloy pressure tube fromRAPS -11, 14th WCNDT Dec.8-13,1996 New Delhi INDIA.
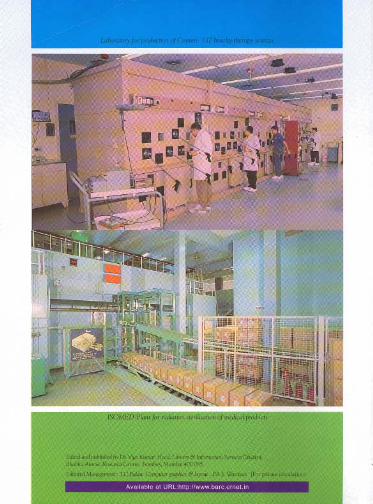
!!!!I.Wi!mi1t/i1>~.ji'r!~ !W'~Wii'-


