Bibliography Abdulla, S. (1998) : Chemical key to TB genes, in: Financial Times, Survey Bio- technology, 23. October, p. 19. Allen, T. J. (1986), Managing the Flow of Technology: Technology transfer and the dissemination of technological information within the R&D organiza- tion, Cambridge, MA: MIT Press. Allen, T. J. and R Katz, (1980), An Empirical Test of the Not Invented Here (NIH) Syndrome, Working Paper, MIT Sloan School of Management, April 1980, WP 1114-80. Althaus S. (1997), A fledgling decides to fl.'!, in: Financial Times, Survey Biotech- nology, 23. October, p. V. Arrow, K. (1962), The Economic Implications of Learning by Doing, in: Review of Economic Studies, Vol. 29, pp. 155-175. Arthur Andersen & Co. (1994 ), UK biotech '94 - the way ahead. Auterhoff, H., J. Knabe, and H.-D. Holtje. (1994), Lehrbuch der pharmazeuti- schen Chemie, 13'h edition, Stuttgart: Wissenschaftliche VerJagsgesellschaft. Bakken, B., J. Gould, D. Kim (1994), Experimentation in Learning Organizations: A Management Flight Simulator Approach, in: J. W. Morecroft and 1. D. Sterman (editors), Modeling for Learning Organizations, Portland, OR: Pro- ductivity Press, pp. 243-266. Baldwin, C. Y., and K. B. Clark (1992), Capabilities and Capital Investment: New Perspectives on Capital Budgeting, in: Journal of Applied Corporate Fi- nance, pp. 67-82. BankBoston (1997), MIT: The Impact of Innovation, A BankBoston Economics Department Special Report. Black, F., M. Scholes (1973), The Pricing of Options and Corporate Liabilities, in: Journal of Political Economy, pp. 637-654. Blok, M. W. J (1996), Dynamic Models of the Firm: determining optimal invest- ment, financing, and production policies by computer, Berlin, New York: Springer. Bodie, Z., A. Kane, and A. J. Marcus (1989), Investments, Homewood, IL: Irwin.
Transcript
Bibliography
Abdulla, S. (1998) : Chemical key to TB genes, in: Financial Times, Survey Biotechnology, 23. October, p. 19.
Allen, T. J. (1986), Managing the Flow of Technology: Technology transfer and the dissemination of technological information within the R&D organization, Cambridge, MA: MIT Press.
Allen, T. J. and R Katz, (1980), An Empirical Test of the Not Invented Here (NIH) Syndrome, Working Paper, MIT Sloan School of Management, April 1980, WP 1114-80.
Althaus S. (1997), A fledgling decides to fl.'!, in: Financial Times, Survey Biotechnology, 23. October, p. V.
Arrow, K. (1962), The Economic Implications of Learning by Doing, in: Review of Economic Studies, Vol. 29, pp. 155-175.
Arthur Andersen & Co. (1994 ), UK biotech '94 - the way ahead.
Auterhoff, H., J. Knabe, and H.-D. Holtje. (1994), Lehrbuch der pharmazeutischen Chemie, 13'h edition, Stuttgart: Wissenschaftliche VerJagsgesellschaft.
Bakken, B., J. Gould, D. Kim (1994), Experimentation in Learning Organizations: A Management Flight Simulator Approach, in: J. W. Morecroft and 1. D. Sterman (editors), Modeling for Learning Organizations, Portland, OR: Productivity Press, pp. 243-266.
Baldwin, C. Y., and K. B. Clark (1992), Capabilities and Capital Investment: New Perspectives on Capital Budgeting, in: Journal of Applied Corporate Finance, pp. 67-82.
BankBoston (1997), MIT: The Impact of Innovation, A BankBoston Economics Department Special Report.
Black, F., M. Scholes (1973), The Pricing of Options and Corporate Liabilities, in: Journal of Political Economy, pp. 637-654.
Blok, M. W. J (1996), Dynamic Models of the Firm: determining optimal investment, financing, and production policies by computer, Berlin, New York: Springer.
Bodie, Z., A. Kane, and A. J. Marcus (1989), Investments, Homewood, IL: Irwin.
240 Bibliography
Bohler, H. (1989), Gentechnologie, in: P. Oberender (editor), Marktstruktur und Wettbewerb in ausgewiihlten Branchen der Bundesrepublik Deutschland. Mtinchen: F. Vahlen.
BCihm. H.-J., G. Klebe. and H. Kubinyi (1995). Wirksto.haesigll, Heidelberg: Spektrum.
Boland, V. (1997), Easd(J((s aim is to hreak down the harriers, in: Financial Times. March 24, p. VII.
Bowley. G. (1998), Corporate Germany reaping the rewards of risk-taking, 111: Financial Times, August II, p. 14.
Bowley, G. (1998), StarFo/ll the east, in: Financial Times. August 12, p. 20.
Bowley. G. (1998), Success sto!".\' that shovved the way, in: Financial Times. September 8, p. 15.
Brealey, R. A .. and S. C. Myers, (1996), Principles of Corporate Finance, 5';' edition, New York: McGraw-Hill.
Brockhoff. K. (1992). R&D Cooperation Between Firms - A Perceived Transaction Cost Perspective, in: Management Science, Vol. 38, No.4, pp. 514-524.
Brockhoff. K. (1994). Forschung und Entwicklung. Planung und Kontrolle, 4'" edition, Mtinchen and Wien: R. Olden bourg Verlag.
Brooks, F. P. (1995), The Mythical Man-Month: essays on software engineering, Reading, MA: Addison-Wesley Pub. Co.
Bruno. A. V. (1986), Patterns of" Failure among Silicon Valley High Technology Firms. in: R. Roustadt (editor), Frontiers of Entrepreneurship Research 1986, Wellesley MA: Babson College, pp. 677-694.
Bugg, C. E., W. M. Carson. and J. A. Montgomery (1994), Medikamente vom Reij3brett. in: Spektrum der Wissenschaft, Miirz 1994, pp. 30-36.
Bundesverband der Pharmazeutischen Industrie e. V. (1985). Arzneimittelforschung in Deutschland: Erfolge der Vergangenheit - Stand - Ktinftige Entwicklung, Frankfurt am Main.
Bundesverband der Pharmazeutischen Industrie e. V. (1989). Vom Wirkstoff Z.Unl
Arzneimittel. Frankfurt am Main.
Business Statistics of the United States (1998). C. M. Slater, and C. J. Strawser (editors), Washington D C: Beman Press.
Carol Hall. former stock broker at the NYSE, now with BioVentures Publishing. October 19. 1998.
Bibliography 241
Carroll, J., J. D. Sterman, and A. Markus, (1997), Playing the Maintenance Game: How Mental Models Drive Organization Decisions, in: R. Stern and J. Halpern (editors), Debating Rationality: Nonrational Elements of Organizational Decision Making, Ithaca, N.Y.: ILR Press.
Chi, T. (1994), Trading in Strategic Resources: Necessary conditions, transaction cost problems, and choice of exchange structure, in: Strategic Management Journal, Vol. 15, No.4, pp. 271-290.
Christensen, C. M. (1992), Exploring the limits of the technology S-curve, Part I: Component technologies and Part II: Architectural technologies, in: Production and Operations Management, Vol. I, No.4, Fall 1992.
Cohen, N. (1998), Chanting the mantra of cheap capital, in: Financial Times, September 8, p. 14.
Cohen, W. M., Levinthal, D. A. (1990), Absorptive Capacity: A New Perspective on Learning and Innovation, Administrative Science Quarterly, Vol. 35, No. I, March 1990, pp. 128-152.
Cookson, C. (1998), Combination creates R&D powerhouse, in: Financial Times, February 2, p. 18.
Corrigan T. (1997), NASDAQ's New Regime, in: Financial Times, January 13, p. 12.
Cox, J. S. G., B. V. Millane, and A. E. J. Styles (1975), A planning model of pharmaceutical research and development, in: R&D Management, Vol. 5, No.3, pp. 219-227.
Coyle, R. G. (1992), A system dynamics model of aircraft carrier survivability, in: System Dynamics Review, Vol. 8, No.3, pp. 193-212.
Coyle, R. G. (1996), System Dynamics Modelling: A practical approach, London: Chapman & Hall.
David Good (1988), Individual, Interpersonal Relations, and Trust, in: D. Gambetta (editor), Trust: Making and Breaking Cooperative Relations, pp. 31-48, New York: Basil Blackwell.
De Myer, A. (1989), INSEAD-CEDEP, business case No. 490-0 II-\' Plant Genetic Systems (A), INSEAD, Fontainebleau, France.
Deeds, D. L., and C. W. L. Hill (1999), An Examination of Opportunistic Action Within Research Alliances: Evidence From the Biotechnology Industry, in: Journal of Business Venturing, Vol. 14. No.2, March 1999, pp. 141-162.
242 Bibliography
Deeds, D. L., D. DeCarolis, and 1. Coombs (1996), The Impact of Timing and Firm capabilities on the Amount of Capital Raised in an Initial Public Offering: Evidence from the Biotechnology Industry, in: Academy of Management Proceedings, pp. 97-100.
Denzin, N. K. and Y. S. Lincoln (1994), Handbook ol Qualitative Research, Thousand Oaks: Sage Publications.
Dietrich, S. W. (199S), Chemicallnformatioll Computing Systems ill Drug Discovery, in Burger's Medicinal Chemistry and Drug Discovery, M. E. Wolff (editor), Volume 1: Principles and Practice, pp. 4IS-496.
DiMasi, J. A., R. W. Hansen, H. G. Grabowski, and L. Lasagna (1991), The cost of innovation in the pharmaceutical industry, in: Journal of Health Economics, Vol. 10, No.2, p. 107-142.
Dixit, A. K., and R. S. Pindyck (1994), Investment under Uncertainty, Princeton, NJ: Princeton University Press.
Dixit, A. K., and R. S. Pindyck (199S), The Option Approach to Capital Investment, in: Harvard Business Review, May-June, p. lOS-lIS.
Dosi, G., (1982), Technological paradigms ({nd technological trajectories: A Suggested Interpretation of the Determinants and Direction of Technical Change, in: Research Policy, Vol. I L No.3, pp. 147-162.
Drayer, J. 1. and J. P. Burns (l99S), From discovery to Market: The Development of Pharmaceuticals, Burger's Medicinal Chemistry and Drug Discovery, M. E. Wolff (editor), Volume I: Principles and Practice, New York: John Wiley & Sons.
Drews, 1. (1993), Technikjeindfichkeit in Mitteleuropa - Ursachen, Folgen, und Auswege, Basel: Editiones Roche.
Dukes, M. N. G. (198S), The E.ffects (Il Drug Regulation: a Survey based on the European Studies of Drug Regulation, Lancaster, U.K.: MTP Press.
Eck, S. L. and 1. M. Wilson (1996), Gene-based Therapy, in: Goodman&Gilman' s The Pharmacological Basis of Therapeutics, p. 77-10 I.
Economic Indicators Handbook (1998), A. 1. Darnay (editor), Detroit: Gale Research.
Eisenhardt, K. M. and C. B. Schoonhoven (1990), Organizational Growth: Linking Founding Team, Strategy, Environment, and Growth among U.S. Semiconductor Ventures, 1978-1988, in: Administrative Science Quarterly, Vol. 3S, No.3, September 1990, p. S04-S29.
Bibliography 243
Eisenhardt, K. M. and C. B. Schoonhoven (1995), Failure of Entrepreneurial Firms: Ecological, Upper Echelons and Strategic Explanations in the U.S. Semiconductor Industry, working paper, Stanford University, Department of Industrial Engineering and Engineering Management, January 1995.
Engel, 1., D. Perrissound, and E. Giinther (1995), Technologiemanagement in der pharmazeutischen Industrie, in: E. Zahn (editor), Handbuch Technologiemanagement, Stuttgart: Schaffer-Poeschel, pp. 777-806.
Ernst-Ludwig Winnacker, Das Angebot der Gentechnik in: Buckel, P., E. P. Fischer, and D. Nord (editors), Das Handwerk der Gentechnik, Miinchen: Serie Piper, pp. 11-35.
Fiddaman, T. (1997), Feedback Complexity in Integrated Climate-Economy Models, unpublished Ph.D. dissertation, Sloan School of Management, Massachusetts Institute of Technology, Cambridge, MA.
Fisher L, and J. H. Lorie (1970) Some Studies of the Variability of Returns on Investments in Common Stocks, in: Journal of Business, Vol. 43, No.2, pp. 99-131.
Fontana, A. and J. H. Frey (1994), Interviewing, in: N. K. Denzin and Y. S. Lincoln (editors), Handbook of Qualitative Research, London: SAGE Publications, pp. 361-376.
Forrester, J. W. (1961), Industrial Dynamics, Portland, OR: Productivity Press.
Forrester, J. W. (1968), Market Growth as Influenced by Capital Investment, in: Industrial and Management Review, Vol. 9, No.2, pp. 83-105.
Forrester, J. W. (1969), Urban Dynamics, Cambridge, MA: The MIT Press.
Forrester, J. W. (1971), Counterintuitive Behavior of Social Systems, in Technology Review, Vol. 73, No.3, pp. 52-68.
Forrester, J. W. (1971), Principles of Systems, Cambridge, MA, Productivity Press.
Forrester, J. W. (1971), World Dynamics, Cambridge, MA: Wright-Allen Press.
Forrester, J. W. (1997), System Dynamics as a Vehicle for Teaching Economics, 0-4725-1, manuscript available form the MIT System Dynamics Group, E60-375, 30 Memorial Drive, Cambridge, MA 02139.
Forrester, J. W. and P. M. Senge (1979), Tests for building confidence in system dynamics models, D-2926-7, manuscript available form the MIT System Dynamics Group, E60-375, 30 Memorial Drive, Cambridge, MA 02139.
244 Bibliography
Franke. R. R. (1995). The impact of combinatorial chemistry on the pharmaceutical drug discovery process. unpublished Masters Thesis. Sloan School of Management. Massachusetts Institute of Technology. Cambridge. MA.
Froot, K. A .. D. S. Scharfstein, and J. C. Stein. (1994). A Framework of Risk Manaxement. in: Harvard Business Review, November-December, pp. 92-102.
Ganellin, C. R. (1982). in: Bindra. J. S. and D. Lednicer (editors), Chronicles of Drux Discoven', New York: Wiley.
Garrison. J. C. and E. K. Jackson (1996). Renin and Anxiotensin, in Goodman&Gilman's The Pharmacological Basis of Therapeutics, pp. 733-758.
Gatter, J., and A. Hassan (1993), fnstrumente und Met/wden ::.ur Unterstiitzung des fnnovationsmanaxements in der pharmazeutischen fndustrie, Part II, Pharmazeutische Industrie, Vol. 55. No. 12, pp. 1062-1069.
Glaser B. G. and A. L. Strauss (1967), The Discovery of Grounded Theory: Strategies for Qualitative Research, Chicago: Aldine Pub. Co.
Grabowski. H. G. (1991). Pharmaceutical Research and DCl,e/opment: Returns and Risk, CMR (Centre for Medicines Research) Annual Lecture, July 1991, Woodman sterne Road, Carshalton, Surrey SM5 4DS, Great Britain.
Grabowski. H., and J. Vernon (1983). The rexulation of pharmaceuticals: balancing the benefits and risks, Washington and London: American Enterprise Institute for Public Policy Research.
Grabowski. H., and 1. Vernon, (1990), A new look at the retllm and risks to pharmaceutical R&D, in: Management Science, Vol. 36. No.7, pp. 804-821.
Grabowski. H., and J. Vernon. (1994). Returns to R&D on new drug introductions in the 1980s. in: Journal of Health Economics, Vol. 13.
Graham A. K., J. D. W. Morecroft, P. M. Senge. and J. D. Sterman (1994), Mode/Supported Case Studies For Management Education. in: J. W. Morecroft and 1. D. Sterman (editors), Modeling for Learning Organizations, Portland. OR: Productivity Press, p. 219 - 241.
Graham, A (1980). Parameter Estimatio/1 in System Dynamics Modelinx, in: J. Randers (editor). Elements of the System Dynamics Method, Cambridge. MA: MIT Press.
Graham, A. K. (1977), Principles on the Relationship Between Structure and Behavior of Dynamic Systems, Ph.D. dissertation, Department of Electrical Engineering and Computer Science. Massachusetts Institute of Technology.
Bibliography 245
Graves, S. B., N. S. Langowitz (1993), Innovative productivity and returns to scale in the pharmaceutical industry, in: Strategic Management Journal, Vol. 14, No.8, pp. 593-605.
Green, D. (1996), Biotechnology investors prepare for another leap in the dark, in: Financial Times, May 20,p. 17.
Green, D. (1996), Clinical trials in the marketplace: Biotech companies are wondering whether the recent run of investor confidence is over, in: Financial Times, July 19, p. 15.
Griffith, V. (1998), Too early to party, Financial Times Survey. Biotechnology, in: Financial Times, October 6, p. IV.
GroSmann. M. U. (1995), The Dynamics of Research and Development in the Pharmaceutical Industry, Proceedings of the 1995 International System Dynamics Conference in Tokyo, Volume II, T. Shimada, and K. Saeed (editors), pp. 553-562.
Grossmann. M. U. (1998), Growth Policies for Biopharmaceutical Companies: A Dynamic Problem Definition, Working Paper, 4030-98-MSA, MIT Sloan School of Management.
Gwinner, E. (1994), Wachsende Bedeutung der Bio- und Gentechnologie in der pharmazeutischen und medizinischen Forschung, in: Chimia, Vol. 48, No.4, April, pp. 89-92.
Hall C. (1998), from Bio Ventures Publishing at 2555 Flores Street, Suite 555, San Mateo, CA 94403, phone: (650) 574-7129. Refer also to the newsletter published by BioVentures called "Bioworld." (www.bioworld.com) .
Hall, J., C. W. Hofer (1993), Venture capitalist's decision criteria in new venture evaluation, in: Journal of Business Venturing, Vol. 8, No. I, p. 25-42.
Hamilton, J. (1993), Turbocharging the Race of Miracle Drugs, in: Business Week, 1. March, p. 92.
Hansen, R. W. (1979), The Pharmaceutical Development Process: Estimates of Development Costs and Times and the Effect of Proposed Regulatory Changes, in: R. A. Chien (editior), Issues in Pharmaceutical Economics, Lexington, MA: Lexington Books.
Hau, I., and F. Calhoun (1997), Fast cycle Change in Knowledge-Based Organizations: Building Fundamental Capability for Implementing Strategic Transformation, Report No. 161, Center for Quality and Productivity Improvement, University of Wisconsin.
246 Bibliography
Henderson R. (1994), The Evolution of Integrative Capahility: Innovation in Cardiovascular Drug Discovery, Industrial and Corporate Change, Vol. 3, No.3. p.607-627.
Henderson R. and I. Cockburn (\ 994), Measuring Competence? Exploring Firm Effects in Pharmaceutical Research. in: Strategic Management Journal, Vol. 15, Special Issue (S2) on Competitive Organizational Behavior, D. Schendel (editor), p. 63-84.
Henderson R. and I. Cockburn (1996), Scale. Scope and Spillovers: The Determinants of Research Productivity in Drug Discovery, RAND Journal of Economics, Vol. 27, No. I, pp. 32-59.
Henderson, R. (1993), Underinvestment and incompetence as responses to radical innovatioll~ Evidence from the photolithographic alignment equipment industry, RAND Journal of Economics, Vol. 24, No.2. (Summer 1993), p. 248-270.
Henderson, R. (1994), Managing Innovation in the Information Age, in: Harvard Business Review, Vol. 72, No. I, January-February, pp. 100-105.
Henderson, R. (1997), On the dynamics offorecasting in technologically complex environments: The unexpectedly long old age of optical lithography, in: R. Garud (editor), Technological Innovation: Oversights and Foresights, pp.149-151.
Henderson, R. and I. Cockburn (1998), Absorptive Capacity, Coauthoring Behavior, and the Organization of Research in Drug Discovery, in: The Journal of Industrial Economics, Vol. 46, No.2, pp. 157-182.
Henderson, R., L. Orsenigo, and G. P. Pisano (1998), The Pharmaceutical Industry and the Revolution of Molecular Biology: Exploring the Interactions between Scientific, Institutional and Organizational Change. Forthcoming in a book to be edited by Richard Nelson, Richard Rosenbloom, and David Mowery.
Higgins, R. C. (1998), Analysis F)r Financial Management,S'" edition, Boston: Irwin McGraw-Hill.
Hines, J. (1997), Molecules of Structure: Building Blocks for System Dynamics Models, unpublished manuscript, Sloan School of Management. Massachusetts Institute of Technology, Cambridge, MA.
Hines, J. H. (1987), Essays in Behavioral Economic Modeling, third essay: Present Value Analysis and Behavioral Considerations in Modeling Factor Acquisition. unpublished Ph.D. dissertation, Sloan School of Management, Massachusetts Institute of Technology, Cambridge, MA.
Bibliography 247
Hippel, E. von, and M. Tyre (1995), How learning by doing is done: Problem Identification in Novel Process Equipment, in: Research Policy, Vol. 24, p. 1-24.
Hofstede, G. (1983), The Cultural Relativity of Organizational Practices and Theories, in: Journal of International Business Studies, Vol. 14, No.2, Fall 1983.
Hofstede, G. (1984), Culture's Consequences: International Differences in WorkRelated Values, Sage Publications: London.
Horton, T. R. and P. C. Reid (1991), Beyond the Trust Gap: Forging a New Partnership Between Managers and their Employers, Homewood, Ill: Irwin.
Houlder, V. (1996), Intangible asset: Measuring the benefits ofresearch spending is not an easy task, in: Financial Times, May 21, p. 10.
HPS (1997), An Introduction to Systems Thinking, user guide for the simulation software Stella, High Performance Systems, Inc. 45 Lyme Road, Suite 200, Hanover, NH 03755.
In Vivo (1998), The Business and Medical Report, Vol. 16, No.6, A Publication of Windhover Information Inc., Norwalk, CT.
Initial Public Offerings (1998), DIALOG file #550, Securities Data, Newark, NJ, December 1998.
Iversen, L. L. (1992), Alzheimer's Disease: The Challenge for Drug Discovery, Centre for Medicines Research, booklet from the annual lecture in 1992.
Jane's 1996-]997, All the World's Aircraft, P. Jackson (editor), Surrey: u.K.
Jensen, M. C., and W. H. Meckling (1976), Theory of the Firm: Managerial Behavior, Agency Costs and Ownership Structure, in: Journal of Financial Economics, Vol. 3, No.4, pp. 305-360.
Joglekar, N. R. (1996), The Technology Treadmill: Managing Product Performance and Production Ramp-Up In Fast-Paced Industries, unpublished Ph.D. dissertation, Sloan School of Management, Massachusetts Institute of Techno]ogy, Cambridge, MA.
Jonas H. (1984), The Imperative of Responsibility, Chicago and London: University of Chicago Press.
Jorion, P. (1997), Value at Risk: The New Benchmark for Controlling Market Risk, Chicago: Irwin Professional Pub.
248 Bibliography
Joshua Lerner and Peter Tefano in, ALZ4 and Bio-Electro Systems (AJ : Technological and Financial Innovation, Harvard Business School case study, No. 9-293-124, October 10, 1995.
Kaba, R. A., D. A. Crossman, and J. Tabin (1995), Intellectual Property in Drug Discovery and Biotechnology, in: Burger's Medicinal Chemistry and Drug Discovery, M. E. Wolff (editor), Volume I: Principles and Practice, pp. 37-101.
Kaitin, K. I., A. Melville, and B. Morris (l9S9), FDA Advisory Committees and the New Drug Approval Process, in: Journal of Clinical Pharmacology, Vol. 29, No. 10, p. 886-890.
Kaufer, E. (1976), Die ()konomik der pharma:,eutischen Industrie, Baden-Baden: Nomos.
Kieser, A. and B. PaBmann (1970), Organisatio/l lind Planung von FOr.l'chung und Entwicklung in del' pharma:,eutischen Industrie, in: Die Pharmazeutische Industrie, Vol. 32, pp. 179-182.
Kirst, H. A. (1995), Aminoglycoside, Macrolide, Glycopeptide, and Miscellaneous Antibacterial Antibiotics, in: Burger's Medicinal Chemistry and Drug Discovery, M. E. Wolff (editor), Volume 2: Therapeutic Agents, pp. 251-300.
Klassen, C. C. (1996), Principles of Toxicology and Treatment of Poisoning, in Goodman&Gilman's The Pharmacological Basis of Therapeutics, pp. 63-75.
Kogut, B., and N. Kulatilaka (1994), Options Thinking and Platform Investments: Investing in Opportunity, in: California Management Review, pp. 52-70.
Kortzfleisch, G. von (1969), Zur mikro(jkonomischen Problematik des teclmischen Fortschritts, in: G. von Kortzfleisch (editior), Die Betriebswirtschaftslehre in der zweiten industriellen Evolution.
Kubinyi, H. (1995), Strategies and Recent Technologies in Drug Discover,., in: Die Pharmazie, Vol. 50, No. 10, p. 647-662.
Kubinyi, H. (1995), The Quantitatil'e Analysis (if Structure-Activity Relationships, in: Burger's Medicinal Chemistry and Drug Discovery, M, E. Wolff (editor), Volume I: Principles and Practice, pp. 497-57l.
Law, A. M. and W. D. Kelton (1991), Simulation Modeling and Analysis. 2nd edition, New York: McGraw-HilI.
Lee, Chi-Jen (1993), Development and Evaluation of Drugs: From Laboratory through Licensure to Market. Boca Raton: CRC Press,
Lerner, J. (1994), Venture capitalists and the decision to go public, in: Journal of Financial Economics, Vol. 35, No.3, pp. 293-316.
Bibliography 249
Lerner, J. and R. P. Merges (1997), The Control of Strategic Alliances: An Empirical Analysis of Biotechnology Collaborations, in: National Bureau of Economic Research (NBER), Working Paper No. 6014.
Lilien, G. L, P. Kotler, and K. S. Moorthy (1992), Marketing Models, Englewood Cliffs, NJ: Prentice Hall.
Little, 1. D.C. (1961), A Proof of the Queuing Formula: L=AW, in: Operations Research, Vol. 9, pp. 383-387.
Little, J. D.C. (1992), Tautologies, Models, and Theories: Can We Find "Laws" of Manufacturing? in: lIE Transactions, Vol 24, No 3, pp. 7-13.
Lumpkin, G. T. and G. G. Dess (1996), Clarifying the Entrepreneurial Orientation Construct and Linking it to Peiformance, in: Academy of Management Review, Vol. 21, No. I, p. 135-172.
Lyneis, J. M. (1988), Corporate Planning and Policy Design: A System Dynamics Approach, 3'" ed., Cambridge, MA (PA Pugh-Roberts Associates, 41 William Linskey Way, Cambridge, MA 02142) .
MacDonald, R. H. (1996), Discrete Versus Continuous Formulations: A Case Study Using Coyle's Aircraft Carrier Survivability Model, in: G. P. Richardson and J. D. Sterman (editors), Proceeding of the 1996 International System Dynamics Conference, Volume 2 (M-Z), pp. 321-324.
Macer D. R. J. (1995), Biotechnology and Bioethics, in Biotechnology, Volume 12: Legal, Economic and Ethical Dimensions, Rehm, H.-J., G. Reed, A. Ptihler, and P. Stadler (editors), Weinheim, New York, Basel, Cambridge, and Tokyo: VCH.
MacFarlane, F. G., Z. M. Kunze, A. L. Drasdo, C. E. Lumley, and S. R. Walker (1995), World-wide pharmaceutical research and development expenditure: 1981-1991 and current trends, in: Journal of Pharmaceutical Medicine, Vol. 5, pp.17-3\.
Maier, F. H. (1995), Die Integration wissens- und modellbasierter Konzepte zur Entscheidungsunterstutzung im Innovationsmanagement, Berlin: Duncker & Humblot.
Maier, F. H. (1998), Consequences of Technological Strategies for Competitiveness: Lessons from Statistical Analysis and Dynamic Modeling, MIT Sloan School of Management, Working Paper No. 4033-98-MSA.
Marshall, E. (1995), Gene Therapy's Growing Pains, in: Science, Vol. 269, August 23, pp. 1050-1054.
Mattes, R. (1993), Principles of Genetic Expression, Biotechnology, Rehm, H.-J., G. Reed, A. Ptihler, and P. Stadler (editors), Volume 2: Genetic Fundamentals and Genetic Engineering, pp. 234-256.
250 Bibliography
McClelland, D. C. (1961), The Achieving Society, Princeton: D. Van Nostrand Co.
McKusick, V. A. (1994), Mendelian Inheritance in Man: A Catalog of Human Genes and Genetic Disorders, Vol. I, Baltimore: Johns Hopkins University Press.
Mertens, P. (1982), Simulation, Stuttgart: C. E. Poeschel.
Merton R. K. (1973), The Matthew Effect in science, in: Storer, N. W. (editor), The Sociology of Science. Theoretical and Empirical Investigation, Chicago: University of Chicago Press, p. 439-459.
Merton, R. C. (1973), Theory of Rational Option Pricing, in: Bell Journal of Economics and Management Science, Vol. 41, No. I, pp. 141-183.
Messer, M. (1984), Traditional or Pragmatic Research, in: Drug Design: Facto or Fantasy?, K. R. H. Jolles (editor), Wooldridge, London, Orlando: Academic Press.
Metin Col pan in: Success story that showed the way: On the biotech start-up that broke the mould of German business, Financial Times, September 8, 1998, p.15.
Miles, M. B. and A. M. Huberman (1994), Qualitative Data Analysis: A sourcebook of New Methods, 20d edition, Thousand Oaks: Sage Publications.
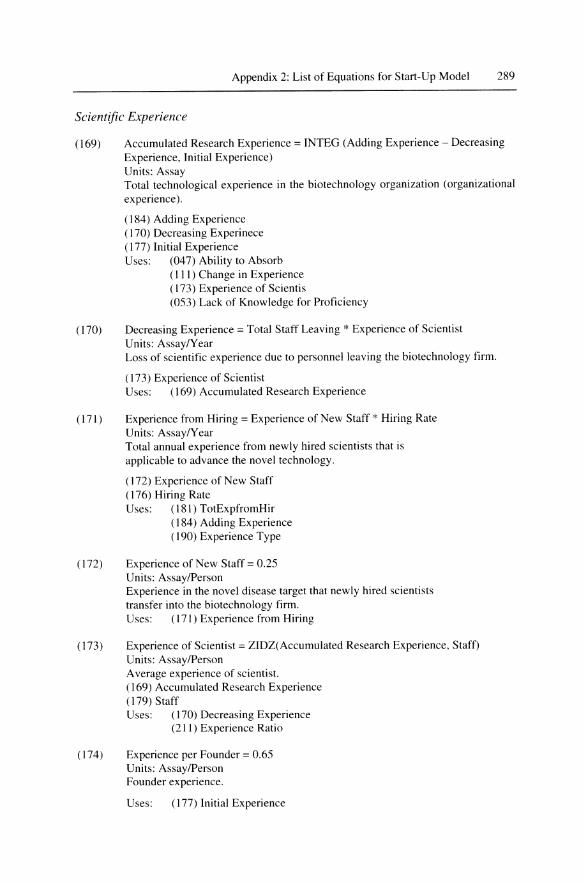
Millenium Pharmaceuticals, Inc. Prospectus, 1996, Bloomberg Information System News Item 7/18/96.
Milling, P. (1974), Der technische Fortschritt heim Produktionsprozej3: Ein dynamisches Modell fijr innovative Industrieunternehmen, Wiesbaden: BetriebswirtschaftIicher Verlag Dr. Th. Gabler.
Milling, P. M. and F. H. Maier (1996), Invention, Innovation und Diffusion: Eine Simulationsanalyse des Managements neuer Produkte, Berlin: Duncker & Humblot.
MIT: The Impact of Innovation (1997), A BankBoston Economics Department Special Report.
Mitchell, G. R., and W. F. Hamilton (1997), Managing R&D as a Strategic Option.
Morecroft, J. D. W. (1983), System dynamics: Portraying bounded rationality, in: Omega, Vol. 11, No.2, pp. 131-142.
Myers S., and L. Shyan-Sunder (1996), Cost of Capital Estimates for Investment in Pharmaceutical Research and Development, in: R. B. Helms (editor), Competitive Strategies in the Pharmaceutical Industry, Washington DC: American Enterprise Institute.
Bibliography 251
Myers, S. (1977), Determinants of Corporate Borrowing, in: Journal of Financial Economics, Vol. 5, No.2, pp. 147-175.
Myers, S. C. (1984), The Capital Structure Puzzle, in: The Journal of Finance, Vol. 39, No.3, pp. 557-591.
Nelson, R. (1982), The role of knowledge in R&D efficiency, in: The Quarterly 10urnal of Economics, Vol. 97, No.3, pp. 453-470.
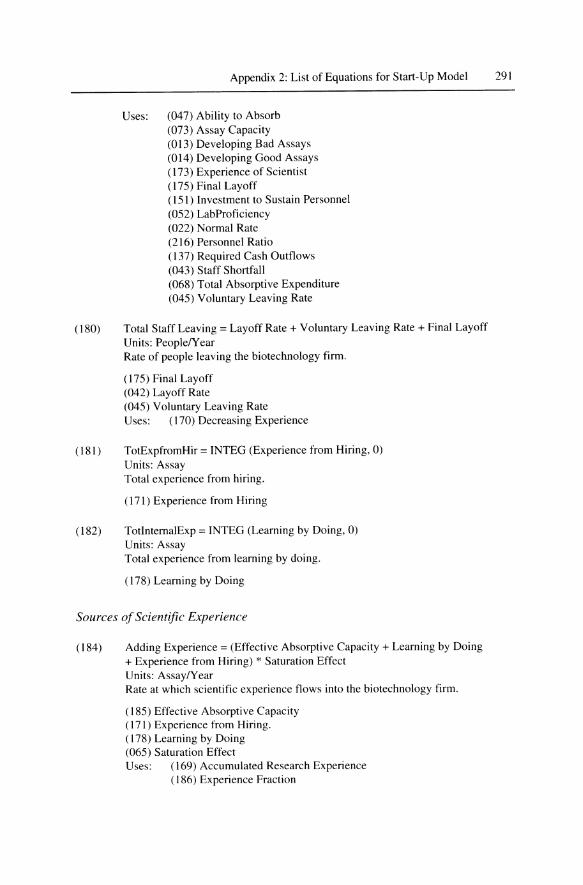
Nichols, N. A. (1994), Scientific Management at Merck in: Harvard Business Review, January-February, pp. 89-99.
Nicholson, W. (1998), Microeconomic Theory: Basic Principals and Extensions, 7'h edition, Fort Worth: Dryden Press.
Oncogene Science, investment bank booklet, Robertson, Stephens & Company, February 14, 1996.
Ondetti, M. A., D. W. Cushman, and B. Rubin (1983), in: Bindra, 1. S., D. Lednicer (editors), Chronicles of Drug Discovery, Volume 2, New York: Willey.
OSI Pharmaceuticals (1997), The drug discovery company, Company booklet, OSI Pharmaceuticals, Inc., 106 Charles Lindbergh Boulevard, Uniondale, NY 11553-3649.
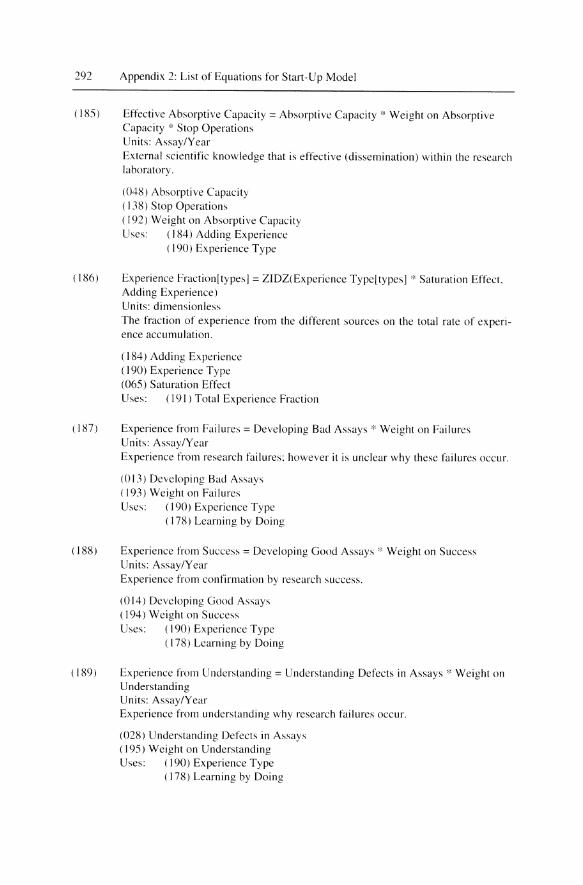
Ozveren, C. M. and 1. D. Sterman (1989), Control theory heuristics for improving the behavior of economic models, in System Dynamics Review, Vol. 5, No. 2, Summer 1989, pp. 130-147.
Pennings, E., and o. Lint (1997), The Option Value of Advanced R&D, in: European 10urnal of Operational Research, Vol. 103, No. I, pp. 83-94.
Peteraf, M. (1993), The cornerstones of competitive advantage: A resource-based view, in Strategic Management 1ournal, Vol. 14, No.3, pp. 179-191.
Peterson, D. W., and R. L. Eberlein (\ 994), Reality Check: a bridge between systems thinking and system dynamics, in: System Dynamics Review, Vol. 10, Nos. 2-3 (Summer-Fall), pp. 159-173, especially pp. 162-163.
Pilling, D. (1998), The price is everything, in: Financial Times, October 6, p. IV.
Pilling, D., Complementary without being complimentary, in: Financial Times, October 6, p. III.
Pindyck, R. S., Rubinfeld, D. L. (1995), Microeconomics, 3'" edition, PrenticeHall, N.Y.
252 Bibliography
Pisano, G. and P. Y. Mang (1993), Collaborative Product Development and the Market for Know-How: Strategies and Structures in the Biotechnology Industry, in: R. A. Burgelman and R. S. Rosenbloom (editors), Research on Technological Innovation, Management and Policy, Volume 5, pp. 109-136.
Pisano, G. P. (1989), Usillf{ Equity Participation to Support Exchanf{e: Evidence from the Biotechnology Industry. in: Journal of Law. Economics. and Organization. Vol. 5, No. I. Spring 1989, pp. 109-126,
Pisano, G. P. (1991), The governance ()l innovation: Vertical integration and collaborative arrangements in the biotechnology industry, in: Research Policy, Vol. 20. No.3, June 1991, pp. 237-249.
Pisano. G. P. (1994). Kllowledf{e. Integration. and the Loclis ol Learning: An empirical analysis of process development, in: Strategic Management Journal. Vol. 15, Special Issue, pp. 85-100.
Pollack, A. (1998). Lilly Pays Bif{ Fee Up Front. in: The New York Times, October 2, p. C5.
Powell, W. W. (1998). Learnillf{ fi'om collaboration: knowledge and networks in the biotechnology and pharmaceutical industries, in: California Management Review, Vol. 40. No.3 (March 22) .
Prognos (1997), Kommerzielle Bio- und Gentechnik ill Nordrhein Wes{lalen: Situation und Entwicklung der kommerziellen Bio- und Gentechnik in den USA - ein Survey.
Prous. J.R. (1995). The Year's New Dnlf{s. in: Drug News & Perspective. Vol. 8. pp.24-37.
Purves. W. K., G. H. Orians, H. C. Heller, and D. Sadava (1998), L(le: The Science of Biology, Sunderland. Massachusetts: Associates, Inc.
Radzicki, M. J. and J. D. Sterman (1993), EvoLutionary Economics LInd System Dynamics, p. 12 and p. 13 (0-4352) in: R. W. England (editor), Evolutionary Concepts in Contemporary Economics: Ann Arbor: University of Michigan Press.
Reger, G .. M. Beise. and H. Belitz, IntemationalisierUllg Technolof{ischer Kompetenzen: Trends und Wirkungen in den SchlUsseltechnologien Pharmazeutik, Halbleiter und Telekommunikation, forthcoming 1999, Schriftenreihe des Frauenhofer-Instituts flir Systemtechnik und Innovationsforschung (lSI), Heidelberg: Physica-Verlag.
Reis-Arndt, E. (1993), Neue pharmazeutische Wi rkstoffe 1961-1990, in: Pharmazeutische Industrie. Vol. 55. No. I, pp. 14-20.
Bibliography 253
Richardson, G. P. (1981), Problems with Causal-Loop Diagrams, 0-3312, manuscript available form the MIT System Dynamics Group, E60-37S, 30 Memorial Drive, Cambridge, MA 02139.
Richardson, G. P. (1991), Feedback Thought in Social Science and Systems Theory, Philadelphia: University of Pennsylvania Press.
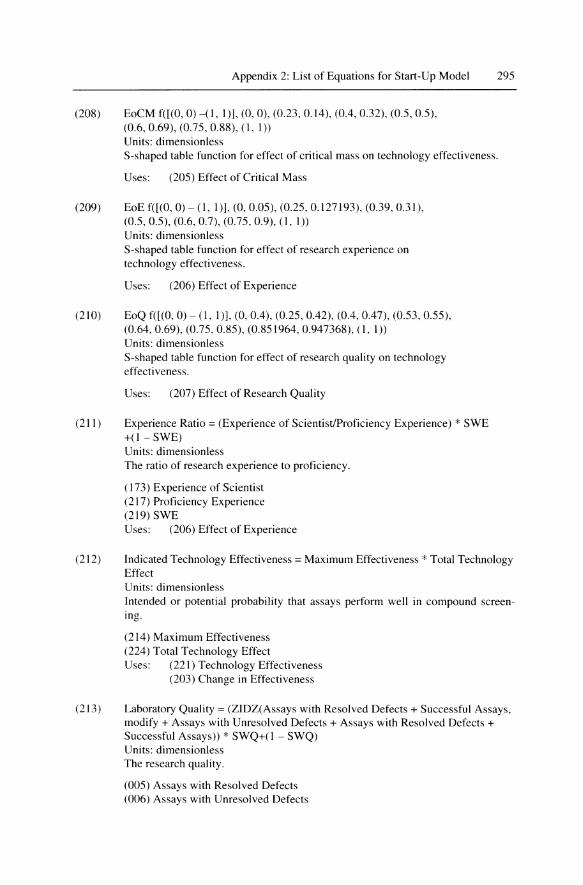
Richardson, G. P. and A. L. Pugh III (1981), Introduction to System Dynamics Modeling with DYNAMO, Portland, OR: Productivity Press.
Roberts E. B. and O. Hauptman (1987), The Financing Threshold Effect on Success and Failure ()f Biomedical and Pharmaceutical Start-Ups, in: Management Science, Vol. 33, No.3, pp. 38\-394.
Roberts, E. B. (1964), The Dynamics of Research and Development, New York: Harper & Row.
Roberts, E. B. (1981), Influences on Innovation: Extrapolations to Biomedical Technology, in: E. B. Roberts (editor), Biomedical Innovation, Cambridge, MA: The MIT Press.
Roberts, E. B. (1991), The technological base ()f the new enterprise, in Research Policy, Vol. 20, No.4, p. 283-298.
Roberts, E. B., (1991), Entrepreneurs in High Technology: Lessons from MIT and Beyond, New York and Oxford: Oxford University Press.
Roberts, R. M. (1989), Serendipity. Accidental Discoveries in Science, New York: John Wiley.
Rosegrant, S. D. and R. Lanpe (1992), Route 128: Lessons from Boston's High Tech Community. New York: Basic Books.
Rosenberg, R. (1996), Biotech failures expected to increase, in: The Boston Globe, August II, p. E4.
Rosenberg, S. A., R. M. Blaese, and W. F. Anderson (1990), The N2-T/L Human Gene Tran~fer Clinical Protocol, in: Human Gene Therapy, Vol. I, pp. 73-92.
Roskam, J. (1990), Airplane Design: Part VIII, Ottawa, Kanada: Roskam Aviation and Engineering Corp.
Ryser, S. and M. Weber (1991), Gentechnik: Was lauft bei Roche? Edition Roche
Sahal, 0 (1981), Patterns of Technological Innovation, Reading, MA: AddisonWesley.
Savage, S. L. (1994), Consumer Stochastics, in: OR/MS Today, December 1994, pp.39-43.
254 Bibliography
Saxenian, A. (1994), Regional Advantage: Culture and Competition in Silikon Valley and Route 128, Cambridge, Massachusetts, and London, England: Harvard University Press.
Scherer, F. M. (1980), Industrial market structure and economic performance, r l
edition, Chicago: Rand McNally, College Publishing Company.
Schnee, 1. E. (1972), Development Cost: Determinants and Overruns, in: Journal of Business, Vol. 45, No.3, pp. 347-374.
Schwartzman, D. (1976), Innovation in the Pharmaceutical Industry, Baltimore: Johns Hopkins University Press.
Sharp, P. A., The History and Future of Biotechnology, in The M.l.T. Report. A publication of the M.l. T. Industrial Liaison Program, April 1998.
Sharpe, P., and T. Keelin (1998), How SmithKline Beecham makes better Resource-Allocation Decisions, in: Harvard Business Review, March-April, pp. 45-57.
Sharpe, W. (1964). Capital Asset Prices: A Theory of Market Equilibrium, In: Journal of Finance, September 1964.
Siegel, D. R., and J. L. Smith, (1987), Valuing Offshore Oil Properties with Option Pricing Models, in: Midland Corporate Finance Journal (Spring), pp. 22-30.
Sneader, W. (1985), Drug Discovery: The Evolution of Modern Medicines, Chichester, New York: Wiley.
Spilker, B. (1994), Multinational Pharmaceutical Companies: Principles and Practices. New York: Raven Press
Steier, L. and R. Greenwood (1995), Venture Capitalist Relatiollships in the Deal Structuring and Post-Investment Stage ()f New Firm Creation, in: Journal of Management Studies, Vol. 32, No.3, pp. 337-357.
Sterman, 1. and D. Ford, Expert Knowledge Elicitation to ImprOl'e Mental and Formal Models, Working Paper, 3953-97-MSA, MIT Sloan School of Management, May 1997.
Sterman, 1. D. (1980), Modeling Mmwgerial Behavior: Misperception of Feedback in a Dynamic Decision Making Expeliment, in: Management Science, Vol. 35, No.3" pp. 322-326.
Sterman, 1. D. (1988), People Er:press Management Flight Simulator, software briefing book. manuscript from 1. D. Sterman, MIT Sloan School of Management. E53-351, 30 Wadsworth Street, Cambridge. MA 02142.
Bibliography 255
Sterman, 1. D. (I 989a), Misperceptions of Feedback in Dynamic Decision Making, in: Organizational Behavior and Human Decision Processes, Vol. 43, No, 3, p.301-335.
Sterman, J. D. (1994), Learning in and about complex systems, in System Dynamics Review, Vol. 10, No. 2-3, Summer-Fall, p. 297-230.
Sterman, J. D. Business Dynamics, forthcoming, manuscript from J. D. Sterman, MIT Sloan School of Management, E53-351, 30 Wadsworth Street, Cambridge, MA 02142.
Sterman, J. D., N. P. Repenning, and F. Kofman (1997), Unanticipated Side Effects of Successful Quality Programs: Exploring a Paradox of Organizational Improvement, in Management Science, Vol. 43, No.4, pp. 503-521.
Stevens, S. S. (1962), Mathematics and Psychophysics, in: Handbook of Experimental Psychology, S. S. Stevens (editor), New York: John Wiley.
Stollmann, lost in: Into the fray with no economy words, as cited by Ralph Atkins and Peter Norman, in: Financial Times, 19 July 1998, Wednesday, p. 2.
Stuart, T. E., Hoang, H., and Hybels, R. c., in: Interorganizational Endorsements and the Performance of Entrepreneurial Ventures, forthcoming in Administrative Science Quarterly, manuscript from 19.07. 1998 is conditionally accepted by Administrative Science Quarterly, T. E. Stuart, University of Chicago, Graduate School of Business, 101 East 58'h Street, Chicago, III 60637.
Summers, N. M. (1993), Commercial Prospects for Gene Therapy and the Newly Emerging Human Gene Estate Industry, unpublished Master of Science in the Management of Technology thesis, Sloan School of Management, Massachusetts Institute of Technology, Cambridge, MA.
Summers, N. M., and C. L. Cooney (1994), Gene Therapy: Biotech's n+l Technology, in: Biorrechnology, Vol 12, January 1994, p. 42-45.
Teece, D. 1. (1988), Technological change and the nature of the firm, in: Technical Change and Economic Theory, G. Dosi (editor), pp. 258-263.
Thayer, A. M. (1995), Technology-Based Firms Define New Business Approach to Drug Discovery, in: C&EN (Chemical and Engineering News, 5 June, p. 25.
The Economist (1994), Panic in the petri dish, July 23'd_29''', pp. 61-62.
The Economist (1998), A Survey of the Pharmaceutical Industry, 21-27 February.
Tirole, J. (1988), The Theory of Industrial Organization, Cambridge, MA, M.LT. Press.
256 Bibliography
Trigeorgis, L. (1996), Real Options: Managerial Flexibility and Strategy in Resource Allocation, Cambridge: MA, The MIT Press.
U.S. Congress (1993). Office of Technology Assessment. Pharmaceutical R&D: Costs, Risks and Rewards, OTA-H-522, Washington D.C.: U.S. Government Printing Office.
U.S. Department of Commerce, Statistical Abstract of the United States 1998. 1181h edition, Economics and Statistical Administration, Bureau of Census, Issued October 1998, Washington, DC.
Utterback, J. M. (1994), Mastering the Dynamics of Innovation: How Companies Can Seize Opportunities in the Face of Technological Change, Boston, MA: Harvard Business School Press.
Vallery-Radot, Rene (1900), La vie de Pasteur, Paris: Hachette.
Vensim® Ventana® Simulation Environment, Reference Manual, Version 1.62, Vensim Product Center, Vent ana Systems. Inc., 149 Waverley Street, Belmont, MA 02178, USA, http://www.vensim.com.
Vensim® Ventana® Simulation Environment, User's Guide, Version 1.62, Vensim Product Center, Ventana Systems, Inc., 149 Waverley Street, Belmont, MA 02178, USA, http://www.vensim.com.
Vesper, K. H. (1990), New Venture Strategies. revised edition, Prentice Hall: Englewood Cliffs.
Voet, D., J. G. Voet (1995), Biochemistry, 2"J edition, New York: John Wiley & Sons.
Watson, J. D" and F. H. C. Crick (1953), Genetical Implications of the Structure o/Deoxyribol1ucleic Acid, in: Nature, Vol. 171, No. 4361, pp. 964-967.
Watson, J. D., and F. H. C. Crick (1953), Molecular Structure of Nucleic Acid, in: Nature, Vol. 171. No. 4356, 25. April, pp. 737-738.
Weber, M. (1992), Gel1lechnik in the Pharmaindustrie, Edition Roche.
Werth. B. (1994), The Billioll-Dol/ar Molecule: One Company's Quest for the Perfect Drug, New York: Simon & Schuster.
Williamson. O. (1975), Markets (lnd Hierarchies: Analysis and Antitrust Implications. A Study in the Economics of Internal Organization, New York: The Free Press.
Bibliography 257
Wilson, S. R., and A. W. Czarnik (1997), Combinatorial Chemistry: Synthesis and Application, New York: John Wiley & Sons.
Windhover Information Inc. (1995), Windhofer's Pharmaceutical Strategic Alliances: A Directory and Analysis of Pharmaceutical Strategic Alliances, 6th
edition, January 1994 - June 1995, A Publication of Windhover Information Inc., Norwalk, CT.
Wolter, H. J. (1994), Die blinde Suche hat ein Ende, in: Chemische Industrie, No. 5, pp. 44-47.
Zahn, E. (1971), Das Wachstum industrieller Unternehmen: Versuch seiner ErkHirung mit Hilfe eines komplexen Dynamischen Modells, Wiesbaden: Betriebswirtschaftlicher Verlag Dr. Th. Gabler.
Zucker, L. G., M. R. Darby, and M. B. Brewer (1994), Intellectual Capital and the Birth of the U.S. Biotechnology Enterprises, in National Bureau of Economic Research (NBER), Working Paper No. 4653.
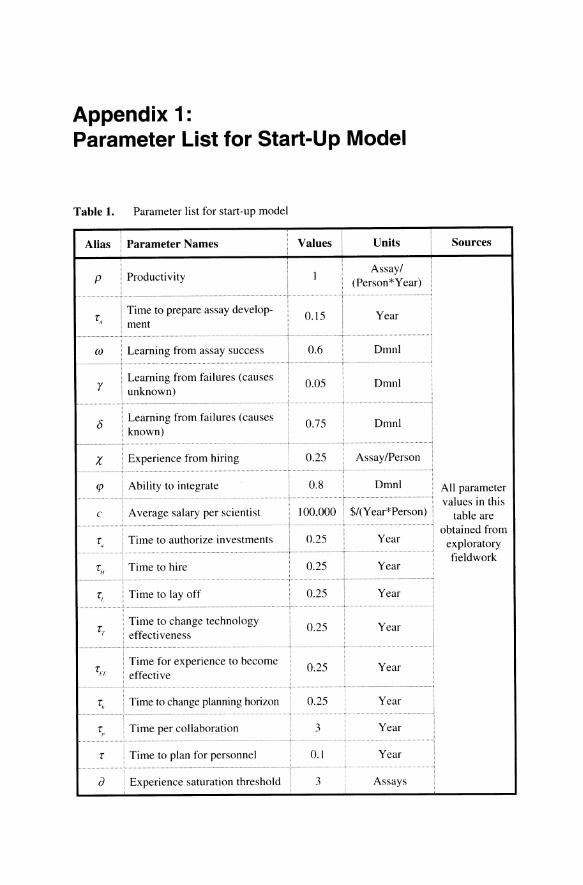
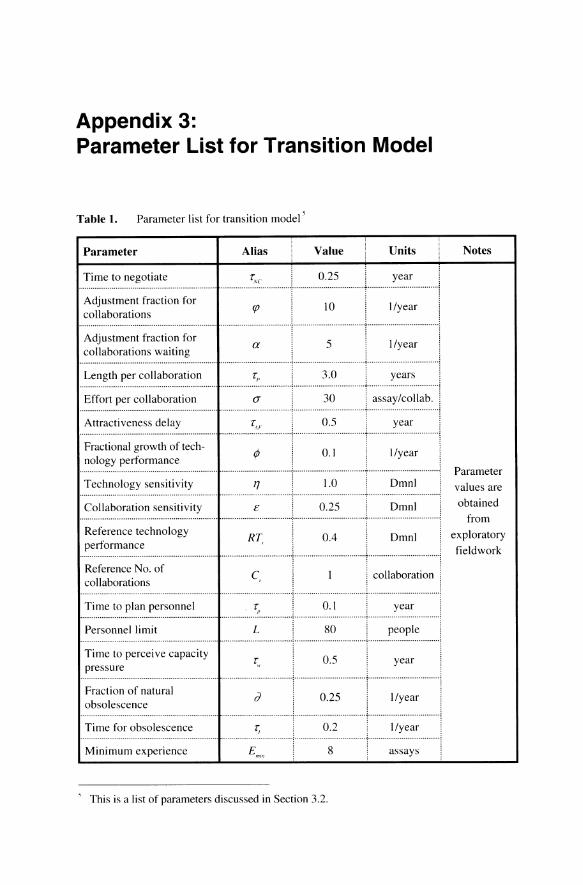
Appendix 1: Parameter List for Start-Up Model
Table 1. Parameter list for start-up model
Alias Parameter Names Values Units Sources
p Productivity Assay/
(Person*Year)
I, Time to prepare assay develop-
0.15 Year ment
OJ Learning from assay success 0.6 Dmnl
y Learning from failures (causes 0.05
unknown)
8 Learning from failures (causes
0.75 known)
X Experience from hiring
qJ Ability to integrate All parameter values in this
c A verage salary per scientist table are obtained from
r;, Time to authorize investments exploratory
Time to hire fieldwork
IH
It Time to layoff
II Time to change technology
Year effecti veness
Ti:I
Time for experience to become Year
effective
Time to change planning horizon Year
Time per collaboration 3
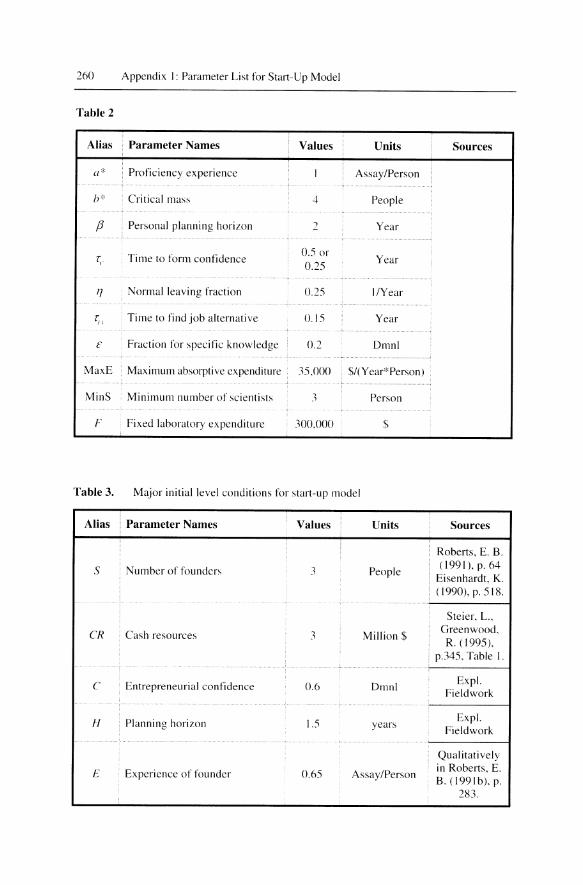
260 Appendix I: Parameter List for Start-Up Model
Table 2
Alias Parameter Names Units Sources
a* , Proficiency experience Assay/Person
17* Critical mass People
fJ Personal planning horizon
r;. Time to form confidence Year
I] Normal leaving fraction 0.25 IlYear
r" Time to find job alternative 0.15 Year
E Fraction for specific knowledge 0.2 Dmnl
MaxE Maximum absorptive expenditure , $/(Year*Person)
MinS Minimum number of scientists Person
F Fixed laboratory expenditure $
Table 3. Major initial level conditions for start-up model
Alias i Parameter Names Units Sources
Roberts, E. B.
S Number of founders People (1991), p. 64
Eisenhardt, K. (1990), p. 518.
Steier, L.,
CR Cash resources 3 Million $ Greenwood, R. (1995),
p.345, Table I.
C Entrepreneurial confidence 0.6 Dmnl Expl.
Fieldwork
H Planning horizon 1.5 years Expl.
Fieldwork
Qualitatively
E Experience of founder 0.65 Assay/Person in Roberts, E. B. (l99Ib). p.
283.
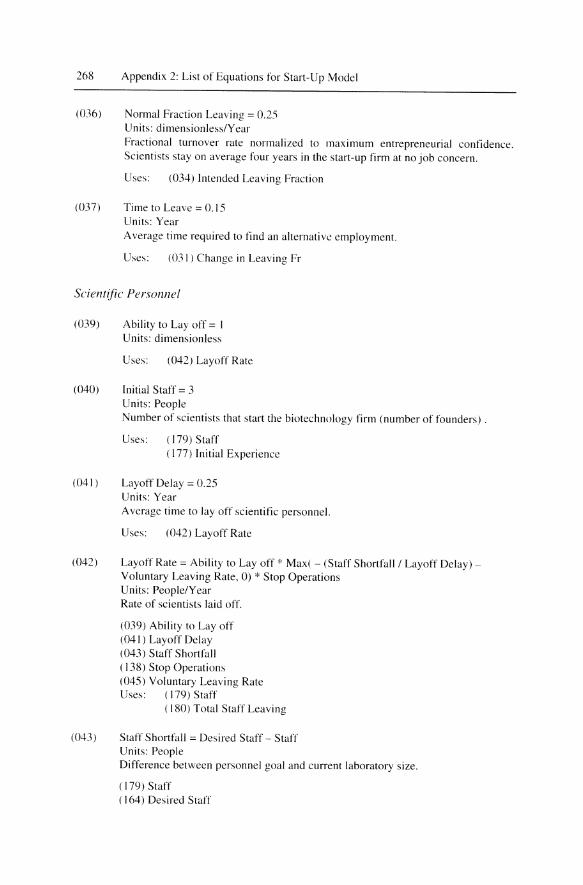
Appendix 2: List of Equations for Start-Up Model
This appendix documents the start-up model presented and analyzed in Chapter 2. The model is simulated using Euler integration. The model listing is crossreferenced for easy perusal of the equations. The list was generated by the documentation tool of the Vensim ® simulation software 4 and has the following format:
Model Sector
(###) Variable = equation Units: Comment
(###) Cause(s), i.e., input(s) to the variable Uses: dependent variable(s)
, For details of the Vensim simulation language. refer to Ventana ® Systems (1994), Vel1sim Referel1ceMal1ual.Versionl.62.Harvard.MA: Ventana Systems.
262 Appendix 2: List of Equations for Start-Up Model
Research
(002) Adding Assays for Development =Max(Assay Capacity + Assay Stock Adjustment, 0) Units: Assay/Year Rate of adding projects to assay development. Stock-adjustment formulation.
(073) Assay Capacity (003) Assay Stock Adjustment Uses: (004) Assays for Development
(003) Assay Stock Adjustment = (Desired Assay Stock - Assays for Development) / Time to Add Assays Units: Assay/Year Rate of new assay projects.
(004) Assays for Development (012) Desired Assay Stock (027) Time to Add Assays Uses: (002) Adding Assays for Development
(004) Assays for Development = INTEG (Adding Assays for Development - Developing Good Assays - Liquidation Pulse - Developing Bad Assays Initial Assays) Units: Assay Disease targets to be constructed.
((l02) Adding Assays for Development (013) Developing Bad Assays (014) Developing Good Assays (016) Initial Assays (() 17) Liquidation Pulse Uses: (003) Assay Stock Adjustment
(013) Developing Bad Assays (014) Developing Good Assays (017) Liquidation Pulse
(OOS) Assays with Resolved Defects = INTEG (Understanding Defects in AssaysLiquidation Pulse IV. 0) Units: Assay Number of disease targets that failed in compound screening for reasons that are known.
(019) Liquidation Pulse IV (028) Understanding Defects in Assays Uses: (213) Laboratory Quality
(019) Liquidation Pulse IV
(006) Assays with Unresolved Defects = INTEG (Developing Bad Assays - Understanding Defects in Assays - Liquidation Pulse III. 0) Units: Assay Number of disease targets that failed in compound screening for reasons that are unknown.
Appendix 2: List of Equations for Start-Up Model 263
(013) Developing Bad Assays (018) Liquidation Pulse III (028) Understanding Defects in Assays Uses: (015) Failure Ratio
(213) Laboratory Quality (018) Liquidation Pulse III
(007) Average Effort = 2 Units: (Person * Year) / Assay Average effort required for understanding why mediocre assays did not perform well in compound screening.
Uses: (022) Normal Rate
(008) Average Productivity = I Units: Assay/(Person * Year) A verage number of diseases targets a scientist can construct per annum.
Uses: (073) Assay Capacity (013) Developing Bad Assays (014) Developing Good Assays
(009) Average Time = 0.75 Units: Year Superfluous constant.
(010) CE f([(O, 0) - (l, I)], (0, 0), (0.15, 0.04), (0.25, 0.15), (0.33, 0.34), (0.4, 0.5), (0.47,0.7), (0.65, 0.9), (\, I)) Units: dimensionless S-shaped relationship that scales down a normal rate of resolving assay failures in dependence on complexity.
Uses: (011) Complexity Effect
(011) Complexity Effect = CE f(Failure Ratio) Units: dimensionless Functional relationship between number of unresolved assays and the ability to resolve their defects.
(015) Failure Ratio (010) CE f Uses: (028) Understanding Defects in Assays
(01 2) Desired Assay Stock = Assay Capacity * Min Time to Prepare Units: Assay Goal for the disease target awaiting development.
(073) Assay Capacity (021) Min Time to Prepare Uses: (003) Assay Stock Adjustment
264 Appendix 2: List of Equations for Start-Up Model
(013) Developing Bad Assays = Stop Operations * Min(Assays for Development / Min Time to Prepare, Staff * Average Productivity) * Technology Ineffectiveness Units: Assay/Year Rate of disease targets that are failures.
(004) Assays for Development (179) Staff (008) Average Productivity (021) Min Time to Prepare (138) Stop Operations (026) Technology Ineffectiveness Uses: (004) Assays for Development
(006) Assays with Unresolved Defects ( 187) Experience from Failures
(014) Developing Good Assays = Min(Assays for Development / Min Time to Prepare, Staff * Average Productivity) * Technology Effectiveness * Stop Operations Units: Assay/Year Rate of successful disease targets.
(004) Assays for Development (179) Staff (221) Technology Effectiveness (008) Average Productivity (021) Min Time to Prepare (138) Stop Operations Uses: (103) Assay Successes
(()04) Assays for Development (024) Successful Assays ( I (2) Actual Cost per Assay Success (188) Experience from Success (088) Reported Good Assays (089) Reported Technology Effectiveness
(015) Failure Ratio = Assays with Unresolved Defects / ReferenceFailures Units: dimensionless Ratio between defective assays and a threshold. (006) Assays with Unresolved Defects (023) ReferenceFaiIures Uses: (0 II) Complexity Effect
(017) Liquidation Pulse = IF THEN ELSE(Stop Operations = 0, Assays for Development / TIME STEP, 0) Units: Assay/Year Pulse that reduces the level of assays for development instantaneously to zero at insolvency.
Appendix 2: List of Equations for Start-Up Model 265
(004) Assays for Development (138) Stop Operations (167) TIME STEP Uses: (004) Assays for Development
(018) Liquidation Pulse III = IF THEN ELSE(Stop Operations = 0, Assays with Unresolved Defects / TIME STEP, 0) Units: Assay/Year Pulse that reduces the level of assays unresolved defects instantaneously to zero at insolvency.
(006) Assays with Unresolved Defects (138) Stop Operations (167) TIME STEP Uses: (006) Assays with Unresolved Defects
(019) Liquidation Pulse IV = IF THEN ELSE(Stop Operations, 0, Assays with Resolved Defects I TIME STEP) Units: Assay/Year Pulse that reduces the level of assays with resolved defects instantaneously to zero at insolvency.
(005) Assays with Resolved Defects (138) Stop Operations (167) TIME STEP Uses: (005) Assays with Resolved Defects
(020) Liquidation Pulse v = IF THEN ELSE(Stop Operations, 0, Successful Assays / TIME STEP) Units: Assay/Year Pulse that reduces the level of successful assays instantaneously to zero at insolvency.
(026) Technology Ineffectiveness = (I - Technology Effectiveness) Units: dimensionless Probability that assays are mediocre and fail in compound screening.
(221) Technology Effectiveness Uses: (013) Developing Bad Assays
(027) Time to Add Assays = 0.1 Units: Year A verage time to decide against what genes targets should be developed.
Uses: (003) Assay Stock Adjustment
(028) Understanding Defects in Assays = Stop Operations * Complexity Effect * Normal Rate Units: Assay/Year Rate of understanding why mediocre disease targets did not perform well in compound screening. (() 11) Complexity Effect (022) Normal Rate ( 138) Stop Operations Uses: (005) Assays with Resolved Defects
(006) Assays with Unresolved Defects ( 189) Experience from Understanding
Voluntary Leaving
(030) Actual Leaving Fraction = INTEG (Change in Leaving Fr. Intended Leaving Fraction) Units: dimensionless/Year Fractional rate of scientists voluntarily leaving the firm per annum.
Appendix 2: List of Equations for Start-Up Model 267
(031) Change in Leaving Fr (034) Intended Leaving Fraction Uses: (031) Change in Leaving Fr
(045) Voluntary Leaving Rate
(031) Change in Leaving Fr = IF THEN ELSE(Stop Operations, (Intended Leaving Fraction - Actual Leaving Fraction) I Time to Leave, - Actual Leaving Fraction I TIME STEP) Units: dimensionless/Y earlY ear Rate of change of the voluntary leaving fraction.
(030) Actual Leaving Fraction (034) Intended Leaving Fraction (138) Stop Operations (167) TIME STEP (037) Time to Leave Uses: (030) Actual Leaving Fraction
(032) Effect of Concern = EoC f(Job Concern) Units: dimensionless Defines functional relationship between job concern and voluntary leaving.
(033) EoC f([(O, 0) - (I, 10)], (0, I), (0.2, 1.27), (0.43, 2.1), (0.61,3.77), (0.73, 5.83), (0.81,7.98), (0.87, 9.16), (1,10» Units: dimensionless S-shaped table function that scales the normal leaving fraction according to job concern.
Uses: (032) Effect of Concern
(034) Intended Leaving Fraction = Normal Fraction Leaving * Effect of Concern Units: dimensionless/Year Rate of scientists as a fraction of total employees that intend to leave the biotechnology firm.
(032) Effect of Concern (036) Normal Fraction Leaving Uses: (030) Actual Leaving Fraction
( 119) Entrepreneurial Confidence Uses: (032) Effect of Concern
268 Appendix 2: List of Equations for Start-Up Model
(036) Normal Fraction Leaving = 0.25 Units: dimensionless/Year Fractional turnover rate normalized to maximum entrepreneurial confidence. Scientists stay on average four years in the start-up firm at no job concern.
Uses: (034) Intended Leaving Fraction
(037) Time to Leave = 0.15 Units: Year Average time required to find an alternative employment.
Uses: (031) Change in Leaving Fr
Scientific Personnel
(039) Ability to Layotl= I Units: dimensionless
Uses: (042) Layoff Rate
(040) Initial Staff = 3 Units: People Number of scientists that start the biotechnology firm (number of founders) .
Uses: (179) Staff ( 177) Initial Experience
(041) Layoff Delay = 0.25 Units: Year A verage time to layoff scientific personnel.
Uses: (042) Layoff Rate
(042) Layoff Rate = Ability to Layoff * Max( - (Staff Shortfall I Layoff Delay)Voluntary Leaving Rate. 0) * Stop Operations Units: People/Year Rate of scientists laid off.
(176) Hiring Rate (042) Layoff Rate (180) Total Staff Leaving
Absorptive Capacity
(047) Ability to Absorb = ZIDZ(Accumulated Research Experience, (Staff * Proficiency Experience» Units: dimensionless The biotechnology firm's ability to absorb external scientific knowledge. This ability is approximated by the ratio of accumulated research experience to the proficiency experience of the entire research laboratory.
(048) Absorptive Capacity = Target AC * Ability to Absorb * SAC Units: Assay/Year The scientific experience that can be absorbed by a biotechnology firm per annum.
(047) Ability to Absorb (054) SAC (055) Target AC Uses: (056) TotalAC
(185) Effective Absorptive Capacity
(049) Cost for Absorptive Capacity = Cost per AC Units: Dollar/Assay The cost of absorptive capacity.
(050) Cost per AC Uses: (055) Target AC
270 Appendix 2: List of Equations for Start-Up Model
(050) Cost per AC = Actual Cost per Assay" Fraction of Specific Knowledge Units: Dollar/Assay Cost for absorptive capacity: the specific knowledge available externally. Internal cost serves as a surrogate measure for external prices.
( I 0 I ) Actual Cost per Assay (051) Fraction of Specific Knowledge Uses: (049) Cost for Absorptive Capacity
(051) Fraction of Specific Knowledge = 0.2 Units: dimensionless The fraction of total cost that has occurred for specific knowledge (and not for integrative knowledge) .
Uses: (050) Cost per AC
(052) LabProficiency = Staff * Proficiency Experience Units: Assay Scientific experience of a research laboratory at the proficiency level.
(053) Lack of Knowledge for Proficiency = LabProficiency - Accumulated Research Experience Units: Assay Absolute difference between proficiency experience and actual laboratory experience.
(169) Accumulated Research Experience (052) LabProficiency Uses: (058) AC Ratio
(054) SAC = I Units: dimensionless Switch for absorptive capacity. Uses: (048) Absorptive Capacity
(055) Target AC = ZIDZ(Total Absorptive Expernditure, Cost for Absorptive Capacity) * Stop Operations Units: Assay/Year The potential external scientific know ledge a biotechnology firm can absorb gi ve financial resources and cost for external networking.
(049) Cost for Absorptive Capacity (138) Stop Operations (()68) Total Absorptive Expenditure Uses: (048) Absorptive Capacity
Appendix 2: List of Equations for Start-Up Model 271
(058) AC Ratio = Lack of Knowledge for Proficiency I Reference Knowledge Units: dimensionless
(053) Lack of Knowledge for Proficiency (064) Reference Knowledge Uses: (065) Saturation Effect
(059) Authorized Expenditure = INTEG (Change in AuthExp, 0) Units: Dollar/(Year * Person) Financial resources authorized for external networking.
(060) Change in AuthExp Uses: (060) Change in AuthExp
(068) Total Absorptive Expernditure (069) Total Expenditure per Person
(060) Change in AuthExp = IF THEN ELSE(Stop Operations, (Intended Absorptive Expenditure - Authorized Expenditure) I Time to Authorize, - Authorized Expenditure I TIME STEP) Units: Dollar/(Year * Person) IYear Change in authorization expenditure.
(059) Authorized Expenditure (062) Intended Absorptive Expenditure (138) Stop Operations (167) TIME STEP (067) Time to Authorize Uses: (059) Authorized Expenditure
(061) Cost per Person = 100000 Units: Dollar/(Year * Person) A verage salary for a scientist.
Uses: (164) Desired Staff (151) Investment to Sustain Personnel (154) MinInvestment (069) Total Expenditure per Person
272 Appendix 2: List of Equations for Start-Up Model
(119) Entrepreneurial Confidence (063) Max Absorptive Expenditure Uses: (060) Change in AuthExp
(063) Max Absorptive Expenditure = 35000 Units: Dollar/(Year * Person) Maximum financial resources per scientist for external scientific networking per annum.
Uses: (062) Intended Absorptive Expenditure
(064) Reference Knowledge = 3 Units: Assay Absolute difference between proficiency experience and actual laboratory experience at which saturation effects emerge.
Uses: (058) AC Ratio
(065) Saturation Effect = SEf(AC Ratio) Units: dimensionless Effect from knowledge saturation on the ability to accumulate scientific experience.
(058) AC Ratio (066) SEt" Uses: (184) Adding Experience
( 186) Experience Fraction
(066) SEf(I(O. 0) - (I. 1)1, (0, 0). (0.25. 0.45), (0.5, 0.75), (0.75,0.9), (I, I). (10. I» U nits: dimensionless Table function in concave shape that represents saturation effects.
Uses: (065) Saturation Effect
(067) Time to AuthoriLe = 0.2 Units: Year Authorization delay. The time required on average to authorize expenditure for external networking such as scientific consulting or conference participation.
Uses: (()60) Change in AuthExp
(068) Total Absorptive Expenditure = Staff'" Authorized Expenditure Units: Dollar/Year Total financial resources authorized for external networking.
(059) Authorized Expenditure (179) Staff Uses: (055) Target AC
(069) Total Expenditure per Person = Cost per Person + Authorized Expenditure Units: Dollar/(Year '" Person) Total expenditure for one scientist.
Appendix 2: List of Equations for Start-Up Model 273
(059) Authorized Expenditure (061) Cost per Person Uses: (137) Required Cash Outflows
Attractiveness for Collaborative Research
(071) Actual Attractiveness Index = AIf(Effectiveness Ratio) Units: dimensionless Functional relationship between effectiveness ratio and index measuring attractiveness for contract research.
(078) Effectiveness Ratio (072) AIf Uses: (074) AttChangeRto
(072) AIf([(O, 0) ~ (I, I)], (0, 0), (0.3, 0.1), (0.5, 0.22), (0.71,0.46), (0.9,0.77), (I, I» Units: dimensionless Table function of an exponential shape. As reported technology effectiveness relative to the reference figure rises, the biotechnology firm becomes increasingly attracti ve for contract research.
Uses: (071) Actual Attractiveness Index
(073) Assay Capacity = Staff * Average Productivity Units: Assay/Year Number of novel disease targets the biotechnology firm can construct.
(179) Statf (008) A verage Productivity Uses: (101) Actual Cost per Assay
(002) Adding Assays for Development (012) Desired Assay Stock (077) Effective Capacity (089) Reported Technology Effectiveness
(074) AttChangeRto = IF THEN ELSE(Stop Operations, (Actual Attractiveness Index ~ Perceived Attractiveness to Collaborators) / CollabTime to Perceive, ~ Perceived Attractiveness to Collaborators / TIME STEP) Units: dimensionless/Year Change in attractiveness perception. In case the biotechnology firm become insolvent, operations stop and attractiveness is lost instantaneously.
(082) Perceived Attractiveness to Collaborators (071) Actual Attractiveness Index (076) CollabTime to Perceive ( 138) Stop Operations (167) TIME STEP Uses: (082) Perceived Attractiveness to Collaborators
274
(075)
(076 )
(077)
(()79 )
(080)
Appendix 2: List of Equations for Start-Up Model
Change = IF THEN ELSE(Perceived Attractiveness to Collaborators> = 0.98:AND:Level = O. Time / TIME STEP. 0) Units: Year/Year Large firms decision to engage in a collahorative contract.
(000) Time (080) Levcl (082) Perceived Attractiveness to Collaborators (167) TIME STEP Uses: (080) Level
(094) Time to Start-Up Success
CollahTime to Perceive = Normal Time'" Reduction Effect f Units: Year Frequency at which the hiotechnology firm updates its large partner on technology progress.
(081) Normal Time (085) Reduction Effect f Uses: (074) AttChangeRto
Effectiveness Ratio = (Reported Technology Effectiveness * Initiation of Contact) / Reference Effecti veness Units: dimensionless Ratio of reported effectiveness to reference technology performance.
(079) Initiation of Contact (086) Reference Effectiveness (089) Reported Technology Effectiveness Uses: (()71) Actual Attractiveness Index
Initiation of Contact = IF THEN ELSE(Reported Technology Effectiveness> = Technology Effectiveness Hurdle. L 0) Units: dimensionless Switch that initiates first contact to potential collaborative research partners.
Level = INTEG (Changc. 0) Units: Year Memory for the time at which the large partner made the decision to engage in contract research.
(075) Change Uses: (075) Change
(081) Normal Time = 0.1 Units: Year
Appendix 2: List of Equations for Start-Up Model 275
Normal time to perceive progress in technology attractiveness by large potential research partners.
Uses: (076) CollabTime to Perceive
(082) Perceived Attractiveness to Collaborators = INTEG (AttChangeRto, 0) Units: dimensionless Attractiveness for collaborative research as perceived by the large potential partner.
(074) AttChangeRto Uses: (074) AttChangeRto
(075) Change
(083) Perfomlance Ratio = Reported Technology EffectivenesslReference Performance Units: dimensionless The ratio of reported to the technology performance that is expected by potential collaborati ve partners.
(084) RE f([(O, 0.4) - (I, I)J, (0,1), (0.25,1), (0.46, 0.94), (0.59,0.87), (0.75, 0.77), (0.9,0.65), (1,0.5» Units: dimensionless Concave downward sloping table function. Scales normal updating frequency down according to progress in the performance of the novel technology.
Uses: (085) Reduction Effect f
(085) Reduction Effect f = RE f(Performance Ratio) * SW A+( I - SW A) Units: dimensionless Functional relationship between performance ratio and an effect that determines updating frequency.
(083) Performance Ratio (090) SW A (084) RE f Scales normal updating frequency down according to progress in the performance of the novel technology. Uses: (076) ColiabTime to Perceive
(086) Reference Effectiveness = 0.3 Units: dimensionless The reference effectiveness at which a large partner is willing to embark a research collaboration with the biotechnology firm.
Uses: (078) Effectiveness Ratio
276
(088)
(089)
(090)
(091 )
(092)
Appendix 2: List of Equations for Start-Up Model
Reference Performance = 0.25 Units: dimensionless Threshold figure at which the biotechnology firm informs very frequently about the progress of its novel technology.
(()83) Performance Ratio
Reported Good Assays = smooth(Developing Good Assays, Time to Report) Units: Assay/Year Rate of assay success know to the management.
(() 14) Developing Good Assays (093) Time to Report Uses: (089) Reported Technology Effectiveness
Reported Technology Effectiveness = ZIDZ(Developing Good Assays ,', 0 + Reported Good Assays, Assay Capacity) Units: dimensionless The technology effectiveness reported to potential collaborators.
(07.3) Assay Capacity (014) Developing Good Assays (()88) Reported Good Assays Uses: (077) Effective Capacity
(078) Effectiveness Ratio (079) Initiation of Contact (083) Performance Ratio
SWA= I Units: dimensionless Switch from constant updating frequency to performance dependent updating frequency.
Uses: (085) Reduction Effect f
Technology Effectiveness Hurdle = 0 Units: dimensionless Technology performance hurdle at which the biotechnology firm initiates communication networks with large potential collaborators.
Uses: (079) Initiation of Contact
Time from Success to Stop Operations = Time to Stop Operations - ··Time to
Start - Up Success" Units: Ye"r Time left to negotiate research contract until biotechnology firm becomes insolvent.
(0<)4) Time to Start - LJ p Success (095) Time (0 Stop Operations
(093) Time to Report = 0.05 Units: Year
Appendix 2: List of Equations for Start-Up Model 277
Average time to report assay successes.
Uses: (088) Reported Good Assays
(094) "Time to Start - Up Success" = Max(Change * TIME STEP, 0) Units: Year Simulation time at which the large partner is willing to engage in contract research.
(075) Change (167) TIME STEP Uses: (092) Time from Success to Stop Operations
(095) Time to Stop Operations
(095) Time to Stop Operations = IF THEN ELSE(Stop Operations = O. Time, "Time to Start-Up Success") Units: Year Time at which biotechnology firm becomes insolvent.
(000) Time (138) Stop Operations (094) Time to Start-Up Success Uses: (092) Time from Success to Stop Operations
Simulation Control
Simulation Control Parameters
(097) FINAL TIME = 3 Units: Year The final time for the simulation.
(098) INITIAL TIME = 0 Units: Year The initial time for the simulation.
Uses: (000) Time
(099) SA VEPER = TIME STEP Units: Year The frequency with which output is stored.
(167) TIME STEP
Cost for Research Results
(10 I) Actual Cost per Assay = ZIDZ(Investment. Assay Capacity) Units: Dollar/Assay Actual cost for successful disease target and failures.
27S Appendix 2: List of Equations for Start-Up Model
(073) Assay Capacity (135) Investment Uses: (050) Cost per AC
(102) Actual Cost per Assay Success = ZIDZ(Investment, Developing Good Assays) Units: Dollar/Assay Actual cost per successful disease target.
(014) Developing Good Assays ( 105) Pulse Assays Out ( lOS) Stop pulse Uses: (\ 05) Pulse Assays Out
(107) Reported Cost per Assay ( lOS) Stop pulse
(104) CumInvestment = INTEG (Investment - Pulse Investment Out, 0) Units: Dollars Reported research investment for both assay success and failure.
( 135) Investment (106) Pulse Investment Out Uses: (106) Pulse Investment Out
(107) Reported Cost per Assay
(105) Pulse Assays Out = IF THEN ELSE(Modulo(Time, Time Intervall) = 0, Assay Successes / TIME STEP, OJ Units: Assay/Y ear Pulse outflow for research results.
(DOO) Time (103) Assay Successes (109) Time Interval! (167) TIME STEP Uses: (103) Assay Successes
(106) Pulse Investment Out = IF THEN ELSE(Modulo(Time, Time Intervall) = 0, CumInvestment / TIME STEP, 0) Units: Dollar/Year Pulse outtlow for investment rates.
((JOO) Time (104) CumInvestment (109) Time Intervall
Appendix 2: List of Equations for Start-Up Model 279
(167) TIME STEP Uses: (104) CumInvestment
(107) Reported Cost per Assay = IF THEN ELSE(Modulo(Time, Time Intervall) = 0, ZIDZ(CumInvestment, Assay Successes), 0) Units: Dollar/Assay Measurement of total cost per assay success.
(000) Time (103) Assay Successes (104) CumInvestment (109) Time Intervall
(108) Stop pulse = IF THEN ELSE(Stop Operations = 0, Assay Successes / TIME STEP, 0) Units: AssaylYear
(109) Time Interval = 0.25 Units: Year Reporting time interval.
Uses: (105) Pulse Assays Out (106) Pulse Investment Out (107) Reported Cost per Assay
Effective Scientific Experience
(III) Change in Experience = IF THEN ELSE(Stop Operations, (Accumulated Research Experience - Effective Research Experience) / Time for Effectiveness,Effective Research Experience / TIME STEP) Units: Assay/Year Change in effective research experience.
(169) Accumulated Research Experience (114) Effective Research Experience (138) Stop Operations (222) Time for Effectiveness (167) TIME STEP Uses: (114) Effective Research Experience
(112) EEoL f([(O, 0) - (I, 1.5)], (0, 0.75), (0.25, I), (0.45, 1.12), (0.68, 1.22), (1, 1.25)) Units: dimensionless Table function of a concave shape that scales the rate of learning by doing according to effectively present research experience.
Uses: (113) Effect of Experience on Learning
280 Appendix 2: List of Equations for Start-Up Model
(113) Effect of Experience on Learning = EEoL f(Experience to Proficiency) " Stop Operations Units: dimensionless Impact of current experience level on the ability to learn.
( 115) Experience to Proficiency (138) Stop Operations (112) EEoL f Uses: (178) Learning by Doing
(114) Effective Research Experience = INTEG (Change in Experience, 0) Units: Assay The research experience that can be used effectively in learning by doing.
( I I I) Change in Experience Uses: ( III) Change in Experience
(115) Experience to Proficiency
(115) Experience to Proficiency = ZlDZ(Effectivc Research Experience. LabProficiency) Units: dimensionless Ratio of effective experience to proficiency knowledge.
(114) Effective Research Experience (052) LabProficiency Uses: (113) Effect of Experience on Learning
Entrepreneurial COlli/dena
(117) CEf([(O, 0)- (3, I)], (0. 0), (0.5. 0.65). (I, 0.9). (2. I). (3. I» Units: dimensionless Table function of a concave shape that determines the entrepreneurial confidence index.
Uses: (120) Indicated Confidence
(118) Change in Confidence = IF THEN ELSE(Stop Operations, IF THEN ELSE(lndicated Confidence> Entrepreneurial Confidence, (Indicated Confidence - Entrepreneurial Confidence) I Time to Increase Confidence, (Indicated Confidence - Entrepreneurial Confidence) ITime to Decrease Confidence)' - Entrepreneurial Confidence/TIME STEP) Units: dimensionlesslY ear Change in entrepreneurial confidence.
(119) Entrepreneurial Confidence ( 120) Indicated Confidence (138) Stop Operations (167) TIME STEP (124) Time to Decrease Confidence ( 125) Time to Increase Confidence Uses: (119) Entrepreneurial Confidence
Appendix 2: List of Equations for Start-Up Model 281
(120) Indicated Confidence = CEf(Security Ratio) Units: dimensionless Indicated confidence index as a function of the security ratio.
(123) Security Ratio (117) CEf Uses: (118) Change in Confidence
(121) Initial Confidence = 0.6 Units: dimensionless The confidence level at corporate foundatin.
Uses: (119) Entrepreneurial Confidence
(122) Personal Planing Horizon = 2 Units: Year The time a scientist intends to stay on average in a high-technology Start-up firm. Uses: (123) Security Ratio
(123) Security Ratio = Years to Survive / Personal Planing Horizon Units: dimensionless The security ratio.
(\ 22) Personal Planing Horizon (139) Years to Survive Uses: (120) Indicated Confidence
(124) Time to Decrease Confidence = 0.25 Units: Year A verage time to lose entrepreneurial confidence.
Uses: (\ 18) Change in Confidence
(125) Time to Increase Confidence = 0.5 Units: Year Average time to build up entrepreneurial confidence. Uses: (118) Change in Confidence
282 Appendix 2: List of Equations for Start-Up Model
(137) Required Cash Outflows = Fixed Expenditure + Staff * Total Expenditure per Person Units: Dollar/Year Financial resources required per annum.
(179) Staff (131) Fixed Expenditure (069) Total Expenditure per Person Uses: (132) Funds Missing
(135) Investment
(138) Stop Operations = IF THEN ELSE(Funds Missing >0, 0, 1) Units: dimensionless Switch that shuts down all activities if company becomes insolvent.
(132) Funds Missing Uses: (074) AttChangeRto
(142) Budget Change (060) Change in AuthExp (118) Change in Confidence (203) Change in Effectiveness (I II) Change in Experience (143) Change in Horizon
284 Appendix 2: List of Equations for Start-Up Model
(031) Change in Leaving Fr ( 164) Desired Staff (013) Developing Bad Assays (014) Developing Good Assays (206) Effect of Experience ( 113) Effect of Experience on Learning (207) Effect of Research Quality (185) Effective Absorptive Capacity (175) Final Layoff (145) Growth Ratio (149) Intended Total Investment (042) Layoff Rate (017) Liquidation Pulse (018) Liquidation Pulse III (019) Liquidation Pulse IV (020) Liquidation Pulse v (l08) Stop pulse (055) Target AC (095) Time to Stop Operations (028) Understanding Defects in Assays (045) Voluntary Leaving Rate
(139) Years to Survive = ZIDZ(Cash Resources, Investment) Units: Year Years to survive given current investment rates and cash resources.
(128) Cash Resources (135) Investment Uses: ( 123) Security Ratio
(142) Budget Change = IF THEN ELSE(Stop Operations, (Intended Total Investment - Budget) / Time to Form Budget, - Budget / TIME STEP) Units: Dollar/Year/Year The change in research budget.
(141) Budget (149) Intended Total Investment (138) Stop Operations (167) TIME STEP
Appendix 2: List of Equations for Start-Up Model 285
(158) Time to Form Budget Uses: (141) Budget
(143) Change in Horizon = IF THEN ELSE(Stop Operations, (Intended Horizon -Effective Planning Horizon) / Time to Change Horizon, - Effective Planning Horizon / TIME STEP) Units: Year/Year Change in investment horizon.
(144) Effective Planning Horizon (148) Intended Horizon (138) Stop Operations (167) TIME STEP ( 157) Time to Change Horizon Uses: (144) Effective Planning Horizon
(144) Effective Planning Horizon = INTEG (Change in Horizon, Initial Planning Horizon) Units: Year The time over which current cash resources should be invested.
(143) Change in Horizon (147) Initial Planning Horizon Uses: (143) Change in Horizon
(150) Investment Based on Resources
(145) Growth Ratio = ZIDZ(Investment Based on Resources, Investment to Sustain Personnel) * Stop Operations Units: dimensionless Ratio of resource-based to needed investment rates.
(150) Investment Based on Resources (lSI) Investment to Sustain Personnel. (138) Stop Operations. Uses: (160) Weight on Resources
(146) Initial Budget = Intended Total Investment * Switch on Intended Investment + (I - Switch on Intended Investment) * Investment to Sustain Personnel Units: Dollar/Year Research budget at corporate foundation.
(149) Intended Total Investment (151) Investment to Sustain Personnel (156) Switch on Intended Investment Uses: (141) Budget
(147) Initial Planning Horizon = 1.5 Units: Year Initial time horizon over which to invest venture capital.
Intended Total Investment = Max(lnvestment Based on Resources *' Weight on Resources + (I - Weight on Resources) * Investment to Sustain Personnel, MinInvestment) * Stop Operations Units: Dollar/Year Budget not yet approved.
(I SO) Investment Based on Resources (15 I) Investment to Sustain Personnel (154) MinInvestment (138) Stop Operations (160) Weight on Resources Uses: (142) Budget Change
(146) Initial Budget
Investment Based on Resources = ZIDZ(Cash Resources, Effective Planning Horizon) Units: Dollar/Year Resource-based investment rate.
Investment to Sustain Personnel = Staff ,. Cost per Person + Fixed Expenditure Units: DollarlY ear Need-based investment rate. Financial resources required to sustain laboratory size.
( 179) Staff (061) Cost per Person ( 13 I) Fixed Expenditure Uses: (145) Growth Ratio
(146) Initial Budget (149) Intended Total Investment
Longest Horizon = 2 Units: Year The longest time horizon over which to invest financial resources. This reflects a very conservative investment policy.
Uses: ( 148) Intended Horizon
Appendix 2: List of Equations for Start-Up Model 287
(153) Minimum Horizon = 0.5 Units: Year The shortest time horizon over which to invest financial resources. This reflects a very liberal investment policy. Management has high confidence that research collaboration can soon be negotiated.
Uses: (148) Intended Horizon
(154) MinInvestment = (MinStaff * Cost per Person) + Fixed Expenditure Units: Dollar/Year Minimum rate of investment to operate research laboratory.
(061) Cost per Person (131) Fixed Expenditure (155) MinStaff Uses: (149) Intended Total Investment
(155) MinStaff = 3 Units: People Minimum number of scientists to operate research laboratory.
Uses: (154) MinInvestment
(156) Switch on Intended Investment = I Units: dimensionless
Uses: (146) Initial Budget
(157) Time to Change Horizon = 0.25 Units: Year Time to change investment horizon.
Uses: (143) Change in Horizon
(158) Time to Form Budget = 0.25 Units: Year
Uses: (142) Budget Change
(159) Tuner = I Units: dimensionless Tuner allows for different table function values without changing its shape.
Uses: (160) Weight on Resources
(160) Weight on Resources = weight on Resources f(Growth Ratio) * Tuner + (I - Tuner) Units: dimensionless Function that converts growth ratio into a weight for the two investment policies: resource-based and need-based investment rate.
(145) Growth Ratio
288 Appendix 2: List of Equations for Start-Up Model
(159) Tuner ( 161 ) weight on Resources f Uses: (149) Intended Total Investment
(161) Weight on Resources f([(0, 0) - (2. I)]. (2. I). (1.75, I), (1.5,0.95). (L25, CL8). (L 0.5). (0.75, 0.2), (0.5, 0.05), (0.25, 0), (0. 0» Units: dmnl S-shaped table function that converts growth ratio into a weight for the two investment policies: resource-based and need-based investment rates. Uses: (160) Weight on Resources
Personnel Goal
(164) Desired Staff = Stop Operations * (Budget - Fixed Expenditure) I Cost per Person Units: People The goal of scientific staff (goal for laboratory size) .
(141) Budget (061) Cost per Person ( 131 ) Fixed Expenditure (138) Stop Operations Uses: (043) Staff Shortfall
(167) TIMESTEP=O.OI5625 Units: Year The time step for the simulation.
Uses: (074) AttChangeRto (142) Budget Change (075) Change (060) Change in AuthExp (118) Change in Confidence (203) Change in Effecti veness ( I I I ) Change in Experience ( 143) Change in Horizon (031) Change in Leaving Fr (175) Final Layoff ( 135) Investment (017) Liquidation Pulse (018) Liquidation Pulse lIT (019) Liquidation Pulse IV (020) Liquidation Pulse v ( 105) Pulse Assays Out (106) Pulse Investment Out (099) SAVEPER ( 1(8) Stop pulse (094) Time to Start - Up Success
Appendix 2: List of Equations for Start-Up Model 289
Scientific Experience
(169) Accumulated Research Experience = INTEG (Adding Experience - Decreasing Experience, Initial Experience) Units: Assay Total technological experience in the biotechnology organization (organizational experience).
(III) Change in Experience (173) Experience of Scientis (053) Lack of Knowledge for Proficiency
(170) Decreasing Experience = Total Staff Leaving * Experience of Scientist Units: Assay/Year Loss of scientific experience due to personnel leaving the biotechnology firm.
(173) Experience of Scientist Uses: (169) Accumulated Research Experience
(171) Experience from Hiring = Experience of New Staff * Hiring Rate Units: Assay/Year Total annual experience from newly hired scientists that is applicable to advance the novel technology.
(172) Experience of New Staff (176) Hiring Rate Uses: (181) TotExpfromHir
(184) Adding Experience (190) Experience Type
(172) Experience of New Staff = 0.25 Units: Assay/Person Experience in the novel disease target that newly hired scientists transfer into the biotechnology firm. Uses: (171) Experience from Hiring
(173) Experience of Scientist = ZIDZ(Accumulated Research Experience, Staff) Units: Assay/Person Average experience of scientist. (169) Accumulated Research Experience (179) Staff Uses: (170) Decreasing Experience
(211) Experience Ratio
(174) Experience per Founder = 0.65 Units: Assay/Person Founder experience.
Uses: (177) Initial Experience
290 Appendix 2: List of Equations for Start-Up Model
(175) Final Layoff = IF THEN ELSE(Stop Operations = 0, Staff / TIME STEP, 0) Units: People/Year Layoff at insolvency.
(176) Hiring Rate = Max(Voluntary Leaving Rate + Staff Shortfall / Time to Hire, 0) Units: People/Year The rate at which scientists are hired.
(043) Staff Shortfall (044) Time to Hire (045) Voluntary Leaving Rate Uses: (179) Staff
(171) Experience from Hiring
(177) Initial Experience = Initial Staff * Experience per Founder Units: Assay Total laboratory experience at corporate foundation.
(174) Experience per Founder (040) Initial Staff Uses: (169) Accumulated Research Experience
(17S) Learning by Doing = (Experience from Failures + Experience from Success + Experience from Understanding) * Effect of Experience on Learning Units: Assay/Year Scientific experience from research activities, i.e., learning by doing.
(113) Effect of Experience on Learning ( IS7) Experience from Failures (ISS) Experience from Success (IS9) Experience from Understanding Uses: (lS2) TotInternalExp
(IS4) Adding Experience (190) Experience Type
(179) Staff = INTEG (Hiring Rate - Layoff Rate - Voluntary Leaving Rate - Final Layoff, Initial Staff) Units: People Number of scientists employed by the biotechnology firm, i.e., laboratory size.
(181) TotExpfromHir = INTEG (Experience from Hiring, 0) Units: Assay Total experience from hiring.
(171) Experience from Hiring
(182) TotInternalExp = INTEG (Learning by Doing, 0) Units: Assay Total experience from learning by doing.
(178) Learning by Doing
Sources of Scientific Experience
(184) Adding Experience = (Effective Absorptive Capacity + Learning by Doing + Experience from Hiring) * Saturation Effect Units: Assay/Year Rate at which scientific experience flows into the biotechnology firm.
(185) Effective Absorptive Capacity (171) Experience from Hiring. (178) Learning by Doing (065) Saturation Effect Uses: (169) Accumulated Research Experience
(186) Experience Fraction
292 Appendix 2: List of Equations for Start-Up Model
(185) Effective Absorptive Capacity = Absorptive Capacity * Weight on Absorptive Capacity * Stop Operations Units: Assay/Year External scientific knowledge that is effective (dissemination) within the research laboratory.
(186) Experience Fractionl types] = ZIDZ(Experience Typeltypes] * Saturation Effect, Adding Experience) Units: dimensionless The fraction of experience from the different sources on the total rate of experience accumulation.
(184) Adding Experience (190) Experience Type (065) Saturation Effect Uses: (191) Total Experience Fraction
(187) Experience from Failures = Developing Bad Assays * Weight on Failures Units: Assay/Year Experience from research failures: however it is unclear why these failures occur.
(013) Developing Bad Assays (193) Weight on Failures Uses: (190) Experience Type
( 178) Learning by Doing
(188) Experience from Success = Developing Good Assays * Weight on Success Units: Assay/Year Experience from confirmation by research success.
(014) Developing Good Assays (194) Weight on Success Uses: (190) Experience Type
(178) Learning by Doing
(189) Experience from Understanding = Understanding Defects in Assays * Weight on Understanding Units: Assay/Year Experience from understanding why research failures occur.
(028) Understanding Defects in Assays (195) Weight on Understanding Uses: (190) Experience Type
( 178) Learning by Doing
Appendix 2: List of Equations for Start-Up Model 293
(190) Experience Type[UnderstandingJ = Experience from Understanding Experience Type[Success] = Experience from Success Experience Type[Failures] = Experience from Failures Experience Type[hiring] = Experience from Hiring Experience Type[Absorption] = Effective Absorptive Capacity Experience Type[Internal] = Learning by Doing Units: Assay/Year Sources of research experience.
(185) Effective Absorptive Capacity (187) Experience from Failures (171) Experience from Hiring. (188) Experience from Success ( 189) Experience from Understanding (178) Learning by Doing Uses: (186) Experience Fraction
(191) Total Experience Fraction = Experience Fraction[lnternalJ + Experience Fraction[hiring] + Experience Fraction[Absorption] Units: dimensionless Sum of all experience fractions.
(186) Experience Fraction
(192) Weight on Absorptive Capacity = 0.8 Units: dimensionless Measures the ability to disseminate external knowledge within the hightechnology organization.
Uses: (185) Effective Absorptive Capacity
(193) Weight on Failures = 0.05 Units: dimensionless Contribution to learning from failures that occur but are not yet investigated and understood.
Uses: (187) Experience from Failures
(194) Weight on Success = 0.6 Units: dimensionless Contribution to learning from research success.
Uses: (188) Experience from Success
(195) Weight on Understanding = 0.75 Units: dimensionless Contribution to learning from understanding failures.
Uses: (189) Experience from Understanding
Equations (196) to (202) are superfluous and therefore excluded.
294 Appendix 2: List of Equations for Start-Up Model
Technology Effectiveness
(203) Change in Effectiveness == IF THEN ELSE(Stop Operations == I, (Indicated Technology Effectiveness ~ Technology Effectiveness) / Time for Technology Effectiveness, ~ Technology Effectiveness / TIME STEP) Units: dimensionless/year Change in technology effectiveness.
(221) Technology Effectiveness (212) Indicated Technology Effectiveness (138) Stop Operations (223) Time for Technology Effectiveness (167) TIME STEP Uses: (221) Technology Effectiveness
(204) Critical Mass == 4 Units: People Minimum number of scientists required in a laboratory to provide the required diversity in scientific disciplines for the advancement of a novel disease target technology.
Uses: (216) Personnel Ratio
(205) Effect of Critical Mass == EoCM f(Personnel Ratio) Units: dimensionless S-shaped function that transforms critical mass effects into technology effectiveness.
(216) Personnel Ratio (208) EoCM f Uses: (224) Total Technology Effect
(206) Effect of Experience == EoE f(Experience Ratio) * Stop Operations Units: dimensionless Function that transforms research experience into technology effectiveness.
(21 I ) Expericnce Ratio (138) Stop Operations (209) EoE f Uses: (224) Total Technology Effect
(207) Effect of Research Quality = EoQ f(Laboratory Quality) * Stop Operations Units: dimensionless Function that transforms research quality into technology effectiveness.
Appendix 2: List of Equations for Start-Up Model 295
(208) EoCM f([(O, 0) -(I, I)), (0, 0), (0.23, 0.14), (0.4, 0.32), (0.5, 0.5), (0.6,0.69), (0.75, 0.88), (I, 1» Units: dimensionless S-shaped table function for effect of critical mass on technology effectiveness.
Uses: (205) Effect of Critical Mass
(209) EoE f([(O, 0) - (I, I»), (0, 0.05), (0.25,0.127193), (0.39,0.31), (0.5,0.5), (0.6, 0.7), (0.75, 0.9), (I, 1)) Units: dimensionless S-shaped table function for effect of research experience on technology effectiveness.
Uses: (206) Effect of Experience
(210) EoQ f([(O, 0) - (1,1»), (0, 0.4), (0.25, 0.42), (0.4, 0.47), (0.53, 0.55), (0.64,0.69), (0.75, 0.85), (0.851964,0.947368), (1, 1)) Units: dimensionless S-shaped table function for effect of research quality on technology effecti veness.
Uses: (207) Effect of Research Quality
(211) Experience Ratio = (Experience of ScientistIProficiency Experience) * SWE +0- SWE) Units: dimensionless The ratio ofresearch experience to proficiency.
( 173) Experience of Scientist (217) Proficiency Experience (219) SWE Uses: (206) Effect of Experience
(212) Indicated Technology Effectiveness = Maximum Effectiveness * Total Technology Effect Units: dimensionless Intended or potential probability that assays perform well in compound screening.
(214) Maximum Effectiveness (224) Total Technology Effect Uses: (221) Technology Effectiveness
(203) Change in Effectiveness
(213) Laboratory Quality = (ZIDZ(Assays with Resolved Defects + Successful Assays, modify + Assays with Unresolved Defects + Assays with Resolved Defects + Successful Assays)) * SWQ+(l - SWQ) Units: dimensionless The research quality.
(005) Assays with Resolved Defects (006) Assays with Unresolved Defects
296 Appendix 2: List of Equations for Start-Up Model
(024) Succcssful Assays (215) modify (220) SWQ Uses: (207) Effect of Research Quality
(214) Maximum Effectiveness = I Units: dimensionless The maximum technology performance. The probability that all disease targets devcloped are successful in compound screening.
Uses: (212) Indicated Technology Effectiveness
(215) modify = 0.1 Units: Assay Modify is a smali number in the denominator of laboratory quality. This is a technical solution that avoids division by very small numbers that result in unrealistically high research quality. Uses: (213) Laboratory Quality
(216) Personnel Ratio = (Staff/Critical Mass) * SQC+( I - SQC) Units: dimensionless The ratio of scientific personnel to the minimum level required as "critical mass."
(179) Staff (204) Critical Mass (218) SQC Uses: (205) Effect of Critical Mass
(217) Proficiency Experience = I Units: AssaylPerson The experience per scientists required for proficiency in the construction of novel disease targets.
Uses: (047) Ability to Absorb (211) Experience Ratio (052) LabProficiency
(218) SQC = I Units: dimensionless Switch for the critical mass effect. Uses: (216) Personnel Ratio
(219) SWE = I Units: dimensionless Switch for the effect from research experience.
Uses: (211) Experience Ratio
(220) SWQ = 1 Units: dimensionless Switch for research quality.
Uses: (213) Laboratory Quality
Appendix 2: List of Equations for Start-Up Model 297
(221) Technology Effectiveness = INTEG (Change in Effectiveness, Indicated Technology Effectiveness) Units: dimensionless Actual probability that assays perform well in compound screening.
(203) Change in Effectiveness (014) Developing Good Assays (026) Technology Ineffectiveness
(222) Time for Effectiveness = 0.25 Units: Year Average time delay to effectively use experience in learning by doing.
Uses: (Ill) Change in Experience
(223) Time for Technology Effectiveness = 0.25 Units: Year Average time to advance actual technology performance.
Uses: (203) Change in Effectiveness
(224) Total Technology Effect = Effect of Critical Mass * Effect of Experience * Effect of Research Quality Units: dimensionless Total effect on technology performance.
(205) Effect of Critical Mass (206) Effect of Experience (207) Effect of Research Quality Uses: (212) Indicated Technology Effectiveness
Appendix 3: Parameter List for Transition Model
Table 1. Parameter list for transition model'
Parameter Alias Value Units Notes
Time to negotiate T\.'( 0.25 year .............................................. ........................
Adjustment fraction for rp 10 I/year
collaborations ...........................
Adjustment fraction for a 5 I/year collaborations waiting
....................................
Length per collaboration Tp 3.0 t
years .......................... ..........................
. i assaylcollab . Effort per collaboration (J 30
......
Attractiveness delay 1'.H- 0.5 year .. ................. ...........................
, This is a list of parameters discussed in Section 3.2.
300 Appendix 3: Parameter List for Transition Model
Table 2. Major initial level conditions for transition model
Alias Parameter Names Values Units Sources
C Number of collaborations 0 Collaboration
; Per definition
W Number of waiting
0 Collaboration collaborations
ORP Collaboration
AC dmnl
Appendix 4: A Dynamic Theory on Cost of Capital for Biotechnology Firms
This appendix develops a theoretical framework on cost of capital for investment in biotechnology firms. It is an extension of section 4.1.3.
1. Dependency of Cost of Capital on R&D Pipeline Phases ••••....•.•.........•. 301
(a) Empirical Evidence ........................................................................... 301 (b) Cost of Capital and Success Probabilities of R&D Projects .............. 303 (c) Cost of Capital and Future Costs for R&D Projects .......................... 304
2. Leverage Concept to Explain Cost of Capital for Investment in R&D Projects ............................................................................................ 305
(a) Financial Leverage and Its Risk Amplifying Effects for Equity Investors ............................................................................................ 305
(b) R&D Leverage as an Analogy to Financial Leverage ....................... 306 (c) Cost of Capital Dynamics for Research Projects ............................... 307
3. Consequences for Management Decisions .............................................. 313
(a) Need for Research Projects with High Return Expectations ............. 313 (b) Expansion of Technology Platforms as Limited by Cost of Capital .... 316 (c) Dynamic Hypotheses for the Research Strategy Collaborative
versus Proprietary Projects and Technology Platform Expansions ... 317
1. Dependency of Cost of Capital on R&D Pipeline Phases
(a) Empirical Evidence
The following table lists three samples of research performing pharmaceutical firms in the first column. The first sample contains large pharmaceutical companies, which have a portfolio of drugs on the market. The second group consists of biotechnology firms with no drugs on the market but at least one approved by the FDA. In the third sample are companies with no drugs yet approved but with drug
302 Appendix 4: A Dynamic Theory on Cost of Capital for Biotechnology Firms
candidates in clinical phases II or III. Thus, the companies are categorized according to the last phase in which the most advanced drug candidates reside. The second row summarize average beta values derived from betas of firms of a particular category. These figures are empirical evidence that by moving backwards from the market place towards discovery research, the risk for investors increases and herewith the cost of capital. The question why is investigated in the following two sections.
Table 1
A verage beta Cost of
Company Sample Capital Source for beta [dmnl]
[percent]
Myers S., and L. Shyan-Sunder (1996), Cost of Capital
Estimates for Investment in Large drug
1.4 15.7 Pharmaceutical Research and
companies Development. in: R. B. Helms (editor), Competitive Strate-gies in the Pharmaceutical
Industry, p. 216.
Shyam-Sunder as cited in Stuart Myers and Christo-
Biotechnology pher Howe (1996), A L(fe-companies
1.38 18.7 Cycle Financial Model (!{
with at least one Pharmaceutical R&D, drug approved unpublished Working Paper,
MIT Program on the Phar-maceutical Industry, p. 25.
Biotechnology companies with drug
2.39 27.4 Ibid. candidates in clinical phase II or III
The cost of capital figures of the third column are calculated according to: (,
where: r f is the risk free rate, 6.8% f3 measures the market risk, and r", is the market return, 15.4%.
" Section 4.1.3 discusses the Capital Asset Pricing Model. See also this section for parameter estimations.
Appendix 4: A Dynamic Theory on Cost of Capital for Biotechnology Firms 303
(b) Cost of Capital and Success Probabilities of R&D Projects
Exploratory fieldwork underlying this study frequently observed that financial managers in biotechnology firms and industry investors believe that high cost of capital is caused by the high risks involved in pharmaceutical R&D. In particular, the earlier projects are in the R&D pipeline, the lower is their transfer probability.7 Figure I shows this idea.
R&D Phases
Phase Specific
I
: Discovery Pre· Clinical I Research clinical Phase I I
I I I I I I I I I I I
I
Climcal I Clinical: FDA Phale II I Phase III I
I I
I I ' p =O.75 I I I I I P = 0.85 I f-----+ I I I p = 0.50
Figure I illustrates two types of transfer probabilities:
Market Place
Success Failure Probabilities Probabilities
p=0.75 p=O.25
p = 0.64 p = 0 36
p = 0.32 p = 0.68
p = 0.24 p = 0.76
p = 0.21 p = O. J9
p = 0.10 p = 0.90
• The phase-specific transfer probabilities for moving projects from the current phase to the next (arrows pointing towards the sloping line),' and
• The success probabilities for moving projects in the various phases to the market place (left column)." Its complement (I - success probability) measures the failure probabilities (far right column).
According to the right column, the probability that drug candidates fail increase the earlier they are in R&D phases. This risk is the frequent justification for high cost of capital for investment in biotechnology companies that operate in early stages of R&D. However, according to corporate finance theory, on which the
Figure I in section 1.1 illustrates the R&D pipeline.
, These figures are based on DiMasi, J. A., R. W. Hansen, H. G. Grabowski, and L. Lasagna (1991), The cost of innovation in the pharmaceutical industry, in: Journal of Health Economics, Vol. 10, No.2, p. 107-142, especially p. 121.
Y For such transfer probabilities see Figure 62 in section 4.1.2.
304 Appendix 4: A Dynamic Theory on Cost of Capital fOf Biotechnology Firms
CAPM is based, the cost of capital is only determined by risks that cannot be diversified away.
Excursus: There are two risk categories distinguished in finance theory: diversifiable and non-diversifiable risks. For example, mediocre management decisions can result in losing investment capital. The investor can avoid this risk by holding a portfolio of shares from different companies. One firm may have a mediocre management; the other does not. The risk of no return due to poor management decisions is therefore "washed out." Since investors can avoid diversifiable risks. they cannot expect any compensation for it.
The other risk type is not diversifiable. Uncertainties related to intlation provide an example. Since every firm faces this risk. it cannot be diversified by investors holding a portfolio of securities of different companies. Investors can expect compensation for risks they cannot avoid through diversification. Nondiversifiable risks are included in the betas presented in Table I, and diversifiable risks are excluded.
This excursus raises the question: What type of risk do investors have from pharmaceutical R&D? Can investors diversify the inherent risk of project failure. illustrated in Figure I. or not? A pension fund manager holding a portfolio of dozens of assets from the pharmaceutical industry will not face the situation that all drug candidates fail thereby earning no return. If one R&D project does not succeed to the market, another will not fail. Thus. investors can diversify away effectively the risks of transferring drug candidates to the market. The diversification effect can even hold true within a single company. A large drug company investigating several dozens of R&D projects can produce continuous flows of drug innovations. III Consequently, uncertainties related to the transfer of R&D projects to the market belong to the class of di versifiable risks. Higher hetas, and thus higher cost of capital for early-stage biotechnology companies, cannot be explained by lower transfer probabilities.
(c) Cost oj' Capital and Future Costs for R&D Projects
An alternative explanation offered by Myers and Shyam-Sunder is based on future costs. They note that the earlier projects are in R&D, the higher their future costs, which increases the risk for investors and herewith the cost of capitaL]] This idea is analogous to the concept of financial leverage, reviewed next.
" Myers. S., and L. Shyam-Sunder. Cost of' Capital Estimates for Investment in Pharmaceutical Research and Development. contract report prepared for the Office of Technology Assessment. U.S. Congress. Washington, D.C., January 1991. p. 279 and p. 280.
Appendix 4: A Dynamic Theory on Cost of Capital for Biotechnology Firms 305
2. Leverage Concept to Explain Cost of Capital for Investment in R&D Projects
(a) Financial Leverage and Its Risk Amplifying Effects for Equity Investors
By borrowing money from banks, companies create financial leverage, which amplifies risk for equity investors. This is because debts are senior claims to be served before the claims of equity investors thus additional debt increases risk for equity holders. A simple market value balance sheet is often used in finance textbooks to explain this concept of financial leverage. 12
Asset value (A V)
Asset value (A V)
Figure 2. Market value balance sheet
Debt value (D)
Equity value (E)
Firm value (FV)
The values of debt and equity (on the right side of the balance sheet in Figure 2) add up to the firm value. From the balance sheet identity it follows that the firm value is equal to the asset value. The returns on the value categories on both balance sheet sides must also be equal:
where: rd is the return on assets, rJ is the return on debt, and r,. is the return on equity.
From debt and equity values equal to asset values follows:
r r;,(D+E) _ rd D
e E E
rD rd D r;. =-"-+r
E " E
" Brealey, R. A., and S. C. Myers (1996), Principles o.f Corporate Finance, p. 214.
(I)
306 Appendix 4: A Dynamic Theory on Cost of Capital for Biotechnology Firms
(2)
Formula (2) shows that a higher DIE ratio increases the return expectations for equity investors. Additional debt creates financial leverage, which increases the risk for equity investors.
(b) R&D Leverage as an Analogy to Financial Leverage
In estimating the cost of capital for projects in pharmaceutical R&D, the following "balance sheet" is used as an analogy to the above balance sheet of Figure 2.
PV of project (PV) PV of total future cost (TFC)
NPV of project (NPV)
Figure 3. Analogous "balance sheet" for R&D projects
The asset value on the left side of the balance sheet of Figure 2 is analogous to the present value (PY) of a project in Figure 3. The analogy applies also to the debt value and the PY of total future project cost (TFC); the equity value and the net present value (NPY) of a project.
According to equation (I), for R&D projects follows:
r,PV = rJFC + r,.NPV (3)
where: r, is the discount rate for expected net revenues, r, is the discount rate for future cost, and r, is the expected rate of return.
The expected rate of return in equation (3) r, is the cost of capital for investing in R&D projects. According to equation (2) the cost of capital for projects in pharmaceutical R&D is therefore:
TFC r, =r +(r -r )--, , , 'NPV r, >r, (4 )
Formula (4) indicates that the cost of capital increases with higher total future cost TFC. The earlier a project is in the R&D process, the higher its future costs and thus its cost of capital. Similar to a high debt-equity ratio which amplifies risk for equity investors due to the senior claim of debt holders. high future R&D cost amplifies risks for investments in pharmaceutical R&D projects. These costs must be paid
Appendix 4: A Dynamic Theory on Cost of Capital for Biotechnology Firms 307
before any return from the market can be realized. The higher the future costs, the less return is left for investors. The risk-amplifying consequences of financial leverage are analogous to what can be labeled pharmaceutical R&D leverage.
The question regarding the risk type arises again. Is the uncertainty introduced by R&D leverage diversifiable by investors or not'? By investing in early-phase biotechnology companies, all firms in the portfolio face the need for sequential investments in order to bring their drugs to the market. This assumes for now that these firms finance R&D themselves. An investor holding a portfolio of early-stage biotechnology companies cannot diversify the risk created by future costs. In other words, investors cannot "wash out" the risks imposed through R&D leverage.
Equation (4) offers a plausible explanation for higher return expectations and thus higher cost of capital the earlier projects are in the R&D pipeline. High future costs, and not high probabilities for project failure, create the market risk measured by the betas listed in Table 1. However, there are other factors influencing cost of capital: (a) the NPY in the denominator of equation (4) increases with falling future costs, and (b) the NPY increases also as a project moves closer to market launch, since return expectations are not as strongly discounted and weighted by low success probabilities. I, Equation (4) indicates that precisely the ratio of total future cost to NPY determines cost of capital. Its minimum is at zero total future cost. The following section presents a model to simulate and investigate cost of capital for a research project in a hypothetical biotechnology firm.
(c) Cost of Capital Dynamics for Research Projects
This section presents a system dynamics model to simulate the cost of capital for a research project in a hypothetical biotechnology firm. The project incorporates research activities of the discovery phase, which is the earliest phase in the R&D pipeline. The model assumes that the biotechnology firm finances discovery activities but a collaborator pays for clinical development.
The discovery phase encompasses three mainly successive activities: assay development, high throughput robotic screening, and compound analoging. 14 The following stock-and-flow diagram illustrates the physical model structure.
At the beginning of the simulation, one research project is pulsed into the level of assays to be developed (top left). After the assay project is largely finished, pilot screening starts to test the assays' performance. The triggering of screening is controlled by the assay development done level (Figure 4). Full scale screening folIows after termination of assay development. The research activity analoging starts as well before completing screening. This allows to optimize actives already identified. After completion of compound analoging, the optimized lead series is turned over to the collaborator. I., Figure 5 depicts the completion rates for all three research activities and the project fractions completed.
" Refer to equation 4.1.2-2.
14 Section 1.1 discusses these three drug discovery activities.
15 Refer to Figure 4 in section 1.1 for the terminology.
308 Appendix 4: A Dynamic Theory on Cost of Capital for Biotechnology Firms
<TIME STEP>
Figure 4
<One Project>
J ~ <Time for
__ ~ Assay Screening Project Left Total Trigger - Project
i Effect on Starting
Screening __
Effect on Starting <Time for
Screening f Screen /rroi"">
Normal Time to Set up Screening
7;;') <Proprietary
Project Started>
--. ~ Scre~ning Analoging Project °
Threshold Tngger
Screening <Total Project Left Project>
---------~
Efofo ....--- Effect on ect on Starting
Starting Analoging f Analoging
Starting Analoging
Normal TimeJ to Set up
Analoging
Analoging
Completing Analoging
Appendix 4: A Dynamic Theory on Cost of Capital for Biotechnology Firms 309
Project/year Project
2.25 Project/year .75 Project
1.5 Project/year 5 Project
.75 Project/year
.25 Project
Project/year Project
[ I
-I
...
,
~ 4\
I' \ U
5
15
.
j 2.' 2
; 1 2
5 1
~
'/ I
(' I I I
~ !
'! I
i
\\J Oru ~ candid tes in c Ilaborat rs'
1 dey lopmen pipelin ... ) ,
4 10 Time (year)
Completing A1>say Development - BASE Project/year Completing Screening - BASE 2 Project/year Completing Analoging - BASE 3- :'\------ 3- ,. "3-'" -3- ~ Project/year As~ay Development Done - BASE 4' 4'" -.:\" Projec[ Screening Done - BASE 5 .. ~,. . j -S- Project Analoging Done - BASE ""tr.~ __ --+<---+---........ _>r-----~r-___ - ___ ----+r--fr--__ ----O-- Project
Figure 5
The simulation run starts at time minus one because this make it easy to observe the dynamics. All three "completing curves" show the typical bell-shaped behavior of a third-order exponential delay structure that is skewed to the right. This indicates that little but time-consuming project work has to be completed towards the end of each research activity.
Since there is just one project pulsed into the system, the reader may be confused that the completing rates reach temporarily a value above 1.5 project per year. The total projects completed is, however, the integration of the completing rates or, in other words, he area under each rate curve. The area is equal to one project. The following stock and tlow structure derives the cost of capital.
The cost of capital formula in equation (4) demands values at every time point of the simulation study. This requires to consider the time value of money represented by compounding intlow rates to both the future cost and present value stocks. Both stocks are initialized to a value at simulation time zero. Table 2 summarizes parameter assumptions to calculate present values of future costs.
Table 3 summarizes parameter values required to calculate present values of expected royalties.
310 Appendix 4: A Dynamic Theory on Cost of Capital for Biotechnology Firms
<Discount Rate for ~
Cost> " Compounding
Costs ':--: Z
-<Creating Future ('osls>
<Compounding PV>
:, NPVof Project
[j,==~~==-~ Creating PV Expectations
L--____ -"
<Costs Incurring>
<Effect of Phase
Transfer>
<One Project>
/1\<proiect .~ I. Pulse In>______., I Project
---------I Started \ ~---~
Figure 6
Tahle2
PVof Royallies
Cost Parameter
Cost of assay
Overhead cost per assay
Assay per project
Cost of screen
Overhead cost per compound
Screen per project
Value: Unit ..
800.000 $
~ <Discount
Rate for Revenues/
Coslof Ca ital '
, <[)Iscount ~ Rate for
Cost>
Notes
Obtained from
Appendix 4: A Dynamic Theory on Cost of Capital for Biotechnology Firms 311
Table 2 (continued)
Cost of analog 1,000 $/Cornpound
4' Obtained from Overhead COS-l per analog 5,000 ,~/Cornpound I,,,,,,,,,,,,,,,,,,,,,,,,,,,,,,,,,,,,,,,,,,,,,,,,,,,,,,,,,,,,,,,,,,,,,,,,,,,,,,,,,,,,,,,,,,,,"+"""""'''''''''''''''+'''''''''''"",,,,,,,,,,,,,,,,,,,,,,,,,,,,,,,,,,,,,j exploratory
f\.ualogs per project
Time for analoging proj(x:s
Discount rate for costs
Table :3
yaUy Parameter
A vcrage Revenue (for collaborator)
Value of revenue at launch
Royalty fraction (proprietary prt'>jeet)
Effective patcnl pro1cction
Time from discovery to market
500 CompouudJpf(~jecl
1.2 Year
0,06 l/Year
Value Unlt ..
fieldwork
/\ppmximately the risk free rate since future costs are mainly fixed,See section 4,1.3
Notes
Hypothetical
Calculated
discusses patent protection issues,
Cdcualted.
312 Appendix 4: A Dynamic Theory on Cost of Capital for Biotechnology Firms
Based on these numerical assumptions, Figure 7 illustrates the time path for cost of capital.
.28 l/year 21X1M S
oM $
.~[ l/yem 150M $ 4.5 M $
1-+ I/vear [(XIM S'
3M $
.07 [/year 50M S 15M S
[/year $ $
~
-I
I I I II-t ~\l ~i~
I
ti I j
I , I
i ,\\,
I, ~
.) , ,
Time (year)
I I i ~
~
~ --~-
-
2 j
, ---+- ---~
I I ,
I i I
I I i t
10 II 12
Co~t of Capital - BASE -+1 ---+---+---+---+--+--;----...,----+----t---+---+---_+_~ I/ycar S NPV of Project - BASE
Total Future CO~h - BASE --.~ --------.~-- --.. -.--:+--------... ~ --'------] ----------3-- --------'\
Note: The Total Future Costs graph is measure on a scale from zero to 6M Dollars.
Figure 7
The cost of capital falls for two reasons:
I. As research activities are performed on the project and, therefore, as costs incur, the total future costs decrease. The dynamic pattern of behavior is determined by total future costs. The downward slope of the cost of capital graph is, however, steeper than the slope of the future cost curve.
2. This is due to the increasing NPV. The NPV increases because future costs decrease and because of the compounding forward effect. Compounding takes into account the time value of money, since the simulation was started with a NPV as of time zero. The increasing NPV accelerates the drop in cost of capital. During the first year it falls sharply from 26% to 12%. In that time period only assay cost incur and the level of total future costs decreases just by 30%.
At time zero, the cost of capital is approximately 26 percent. This is close to the value calculated with the Capital Asset Pricing Model for early stage biotechnology companies (see table 1). After year 3, the project is finished and handed over to the collaborator. All future costs for the biotechnology company cease for rea-
Appendix 4: A Dynamic Theory on Cost of Capital for Biotechnology Firms 313
sons of simplicity. However, there are minor costs for example caused by monitoring the drug candidate progress in the collaborator pipeline.
From year 3 onwards, the cost of capital is constant and equal to the discount rate for expected net revenues r" which appears in equation (4). This reflects the uncertainty of drugs already on the market and is equal to 9 percent in real terms. The biotechnology company bears only the risk of marketing the drug as soon as the future costs are zero, as soon as the drug candidate is turned over to the collaborator who funds clinical development. The risk associated with R&D leverage, i.e. risk caused by future costs, is then entirely shifted to the collaborator.
The NPV graph in Figure 7 reveals steadily rising sections. This is due to the compounding forward effect. The instantaneous jumps are caused as drug candidate move from phase to phase. If a drug candidate is transferred into the next phase its likelihood of succeeding towards the market place increases. This is modeled discretely and illustrated with instantaneous value jumps in royalty expectations. However, a continuous formulation would be more realistic since the value of drug candidates already increases the closer they move towards the end of the current R&D phase. The increasing NPV has no impact on the cost of capital once the future costs are zero. The graph stays at its minimum. This shows that biotechnology companies can achieve very low costs of capital even if their drug candidates are still several years ahead of market launch.
3. Consequences for Management Decisions
(a) Needfor Research Projects with High Return Expectations
There is a large range within which expected revenues for therapeutic products can vary. Revenues are a function of both anticipated sales volume and price. The volume depends on factors such as the number of potential patients, the frequency of drug administration, and the treatment duration. The sales price is usually negotiated with and regulated by national health authorities. For third world countries, prices are as well dictated by the low purchasing power of their population. The following sensitivity simulations reveal consequences of varying revenue expectations on the cost of capital for one project. The cost of capital of a biotechnology firm is an average figure over its entire research program. A reduction in revenue expectations by $ 15m more than doubles the cost of capital in the beginning of the project life. A nearly 60% figure is not unusual for high-technology start-up companies. It reflects the high risk investors are exposed, which cannot be diversified away. High revenue expectations avoid extremely high cost of capital. Revenue expectations are high if the drug candidates are focused on disease areas with large therapeutic needs, and if there are no effective alternative treatments available yet, which could be used as substitutes. Even with large therapeutic needs such as for the Malaria disease, the expected revenue may still be too low, since this disease mainly occurs in third world countries where
314 Appendix 4: A Dynamic Theory on Cost of Capital for Biotechnology Firms
Note: The time hori/on is limited to the three year discovery research. The horizontal reference line at 9% represents the risk from drugs on the market. [t is drawn to distinguish from the R&D risk.
Figure 8. Cost of capital sensitivity to revenue expectations
Table 4
Cost of Capital Present value of : Net present value
Simulation runs [ %] at simulation project [m$s] at of project [m$s]
time zero simulation time at simulation
zero time zero
Base 26 5.8 0.9
($150m average revenue)
Minus $15m 58
(135 m average revenue) 5.2 0.3
Plus $15m 19
(165 m average revenue) 6.4 1.5
patients' have little purchasing power. In order to avoid high cost of capital, biotechnology companies need to focus their research on disease areas with large therapeutic needs and on patients able to reimburse for the medicine. In contrast. large pharmaceutical firms are much better able to perform research in "exotic" disease areas, since their overall cost of capital is the average over several dozens of drug candidates in the R&D pipeline and on the market.
Appendix 4: A Dynamic Theory on Cost of Capital for Biotechnology Firms 315
A reduction in revenue expectations by $ 15m more than doubles the cost of capital in the beginning of the project life. A nearly 60% figure is not unusual for high-technology start-up companies. It reflects the high risk investors are exposed, which cannot be diversified away. High revenue expectations avoid extremely high cost of capital. Revenue expectations are high if the drug candidates are focused on disease areas with large therapeutic needs, and if there are no effective alternative treatments available yet, which could be used as substitutes. Even with large therapeutic needs such as for the Malaria disease, the expected revenue may still be too low, since this disease mainly occurs in third world countries where patients' have little purchasing power. In order to avoid high cost of capital, biotechnology companies need to focus their research on disease areas with large therapeutic needs and on patients able to reimburse for the medicine. In contrast, large pharmaceutical firms are much better able to perform research in "exotic" disease areas, since their overall cost of capital is the average over several dozens of drug candidates in the R&D pipeline and on the market.
Another observation in Figure 8 is that the cost of capital can closely approach the 9% market risk rate even well before research is completed at year three. As discussed previously, this is because the cost of capital depends, according to equation (4), on the relative size of the present value of future costs to the NPV. Cost of capital approaches the market risk rate when the NPV becomes significantly larger than the future costs. This is illustrated in the following for the base case simulation run.
8M S J I/year
oM $ 225 1f~ear
4M S .15 l/ycar
2M S .()75 l/year
$ lIyeur
-I
I\PV of Project - BASE ~ Total Future Costs - BASE Cost of Capital - BASE ., .................. J- .... .
2----J
--I 1
Time l)earl
Figure 9. Cost of capital as determined by the ratio of future costs to NPV s
[/year
316 Appendix 4: A Dynamic Theory on Cost of Capital for Biotechnology Firms
(b) Expansion of Technology Plat/'orms as Limited by Cost of Capital
Figure 10 illustrates a reference mode for the cost of capital dynamics in case a large firm such as Merck or Hoechst finances all R&D activities over the entire project life cycle.
Figure 10. Reference mode on CoC for projects in large pharmaceutical companies
The dynamic pattern of behavior is based on the insights presented and intuition developed previously. When a project begins, the cost of capital will be at its maximum. How high this is depends on the model assumptions (see previous example). The curve stays at a high rates for some time since very few research activities are performed and thus low costs occur and because the NPV is still low. The curve decays at an increasing rate, especially after the discovery phase. This is mainly due to the increasing NPV. In clinical phase I, the curve should reach its highest rate of decay. This is because the drug candidate moves out of a region of extreme low success probability if the drug is first successfully tested on humans. Progress in the clinical II phase has again a strong increasing effect on the NPV. which should push the cost of capital further downwards. Further decay occurs when the most expensive R&D phase. clinical III. passes. The CoC reaches its lowest rate during FDA approval since NPVs are high even if future costs such as those for manufacturing, are still ahead. The reference mode is a qualitative illus-
Appendix 4: A Dynamic Theory on Cost of Capital for Biotechnology Firms 317
tration of dynamic behavior. Quantification requires a simulation model for the entire R&D pipeline costs, which is not subject to this study.
A critical decision for biotechnology research companies is how many phases of the total R&D pipeline should be integrated and financed, i.e. the technology platform breadth. A company with the objective to finance the entire R&D for their drug candidates will start projects at much higher future costs as it is the case in the above example. This will result in very high risks for investors. The investors' expected return, which is the mirror image of the companies' cost of capital, will be high. In recent years, the trend in the biotechnology industry has been that companies focus on few research activities as opposed to pursuing full integration of all R&D activities. Such an observation can be explained by the theoretical framework developed above, since focusing on a few research activities limits cost of capital and herewith investors' return expectations. Values created from drug candidates as they proceed in the pipeline can quicker mach such relatively low return expectations. Such a condition facilitates further access to financial resources allowing the company to grow. The final section of this appendix presents feedback loops, which are dynamic hypotheses for the theoretical framework on cost of capital for biotechnology firms developed so far.
(c) Dynamic Hypotheses for the Research Strategy Collaborative versus Proprietary Projects and Technology Platform Expansions
Perceived Value -----....
Creation + Access to Fraction ~ Financial \
/ - Resources
A~~' +
( 1 i R ~ Financial A verqge ~ Resou ces
Future Costs / perp~.ect -
- +
+ Research COpllab.orative ~ /acity
'"J"" ~ \ P~I"Y + ~
Projects
Figure 11
31 g Appendix 4: A Dynamic Theory on Cost of Capital for Biotechnology Firms
Biotechnology companies can utilize their research capacity for collaborative and proprietary projects. Collaborative research means that a collaborator, usually a large drug firm, pay the project costs. In contrast, the biotechnology firm finances some research activities for proprietary projects. (The previous analysis thus was for proprietary projects.)
By adding proprietary projects to the research program the average future costs per project increases and by adding collaborative research it decreases. If the fractional rate of value creation, as perceived by investors, matches with or overcompensates for the cost of capital, i.e. investors' return expectations, the firm is attractive for further investments. If value creation is disappointing, investor attractiveness declines and access to financial resources may be constraint.
The loop set in figure II hypothesizes that project type decisions can facilitate or complicate capital accessibility. Raising financial resources is easier if collaborative projects are added to the research program. This constitutes the reinforcing loop (R I). If a company goes into proprietary research cost of capital increases, which may complicate raising funds and such a research strategy directly depletes the company's financial resources (B 2).
As observed previously. there is a minimum level for cost of capital. Biotechnology firms that perform only research on collaborative projects have a cost of capital that is equal to the risk of marketing drugs (horizontal lines in figure Sand 9 J. Such a strategy shifts the R&D risk portion to the collaborators. The effect of a minimum cost of capital is added in the next set of feedback loops.
Percei ved ______________ Value --...
CreatIon + ~on~
Access to Financial Resources
~r~1~~~ -~ ~Af,ve6~e CoC ~.
+ 'R0 A verage ~ R;eso ces
Financial
Figure 12
Future Costs Per P ~ect -
- +
+ Research
~ts (iy Proprietary
Projects
Appendix 4: A Dynamic Theory on Cost of Capital for Biotechnology Firms 319
The growth of the reinforcing loop (R I) is limited by the balancing loop (B 3). The minimum cost of capital is exceptionally low for high-technology companies but, as explained previously, the risk inherent in pharmaceutical research has no impact on cost of capital. The previous feedback loops illustrate consequences of project type decisions in the short run. The following figure shows effects in the long run.
Average Royalty Fraction
Perceived Value
Creation Fraction
~ Effect of - r:: "' Average Minimum ~ CoC
Access to Financial Resources
CoC ~r+ 'R0
A vera"e ~ Financial Future Costs Resources
~ P"P'," /
\+ ~ Research Collaborative ~ Capacity
~- Pmj'd' ~
P~~"'Y G0 Projects
Figure 13. Consequences of project type decisions in the long run
Higher royalty fractions on future revenues can be negotiated for proprietary research. This is the return for bearing the risk of R&D. The value creation in R&D increases with higher royalty fractions. As investors perceive an increasing value creation, access to financial resources is easier. In conclusion, adding proprietary projects increases the average cost of capital and constraints the access to financial resources in the short run. In addition, it drains the pool of funds as research is performed. This is not favorable under conditions of increasing competition and the strong need of investing in research capabilities. After value creation in R&D pipelines and perception by investors, expected returns from proprietary research facilitates additional fund raising.
For the case of collaborative projects can be concluded, that they have a decreasing effect on the risk for investors and the cost of capital in the short run. This is favorable if there are fund raising plans. The balancing loop (B 4) illustrates, however, that average royalty fractions decline if research capacity is applied for collaborative and not for proprietary research. Too many collaborative projects may constrain growth in the long run.
320 Appendix 4: A Dynamic Theory on Cost of Capital for Biotechnology Firms
Besides project type decisions biotechnology companies have to determine the scope of research activities. In the previous example the scope was: assay development. then screening. and then analoging. The technology platform are all research activities integrated in a biotechnology company's organizational structure. If firms expand their technology platform by adding other activities, the more future costs occur for proprietary projects. This assumes that the entire technology platform is utilized for proprietary research. To keep the loop set simple, the variable research capacitv is a proxy for the size of a technology platform in the following.
Figure 14. Short versus long term effects of technology platform expansions
A link between research capacity and average future costs with positive polarity constitutes a negative feedback loop (B 5). By expanding the technology platform the cost of capital increases and this constrains the access to financial resources. In the long run, however, higher royalties are expected as a premium for bearing higher R&D risks. This facilitates the access to financial resources and closes the loop (R 2).
Research strategies on the type of research projects and the scope of technology platforms have unfavorable short and favorable long term effects on the attractiveness of high-technology firms to investors. Following qualitative recommendation can be made: Start with collaborative research in the initial period of corporate life for low cost of capital. After sufficient value creation is perceived from research results such as drug candidates, access to financial resources becomes easier, which can be invested into both proprietary projects and the technology
Appendix 4: A Dynamic Theory on Cost of Capital for Biotechnology Firms 321
platform expansion. A numerical model is required to design robust research strategies that maintain firm attractiveness to investors and sustain access to financial resources over the critical period before revenues are achieved from drugs on the market.
Index
A
Absorptive Capacity 49,54 Attractiveness to investors 39, 214
B
Biotechnology firms/ Biopharmaceutical companies
c Capital Asset Pricing Model
(CAPM) 193 Contract research/Collaborative
partnership 142 Contract research funding 152 Cost of capital 193, 30 I
D
Decision rules (policies) 35 Disease Target 4 Diversity of scientific disciplines 73 Drug candidates 2 Drug Discovery I Dynamic Behavior 38
E
Economic value creation 18, 197 Entrepreneurial Confidence 39, 49 Entrepreneurship 18 Equity capital 194
F
Feedback structure 34 Firm value 167 Fund-raising success 223
G
Growth phases 237
H
High-technology 13 Human Genetic Research 20
I
Initial Public Offering (lPO) 223
M
Model boundaries 130
N
Net Present Value (NPV) 188
o Option premium 202
p
Pipeline phases 3, 173 Principal-Agent Theory 135
R
Research Experience 59 Research track record 212 Royalty expectations 185
s Scientific Experience 121
Obsolescence/irrelevance 150 Start-up phase/Start-up model 33 Start-up success 43 System Dynamics 33
T
Technology Effectiveness 59 Transition phase/Transition model