Big Sky Regional Carbon Sequestration Partnership – Kevin Dome Carbon Storage FC26-05NT42587 Lee Spangler, Montana State University U.S. Department of Energy National Energy Technology Laboratory Carbon Storage R&D Project Review Meeting Transforming Technology through Integration and Collaboration August 18-20, 2015
Transcript
Big Sky Regional Carbon
Sequestration Partnership – Kevin
Dome Carbon StorageFC26-05NT42587
Lee Spangler, Montana State University
U.S. Department of Energy
National Energy Technology Laboratory
Carbon Storage R&D Project Review Meeting
Transforming Technology through Integration and Collaboration
August 18-20, 2015
Acknowledgments
• US Department of Energy
• Altamont Oil & Gas, Inc.
• Columbia University & Barnard College
• Idaho National Laboratory
• Los Alamos National Laboratory
• Lawrence Berkeley National Laboratory
• Schlumberger Carbon Services
• SWCA Environmental Consultants
• Vecta Oil and Gas, Ltd.
• Washington State University
2
3
Presentation Outline
• Program Goals / Scope of Work / Goals & Objectives
• Project Overview
– Geology of Kevin Dome / Regional Significance
– Site Characteristics – Scientific Opportunities
• Site Characterization
• Modeling
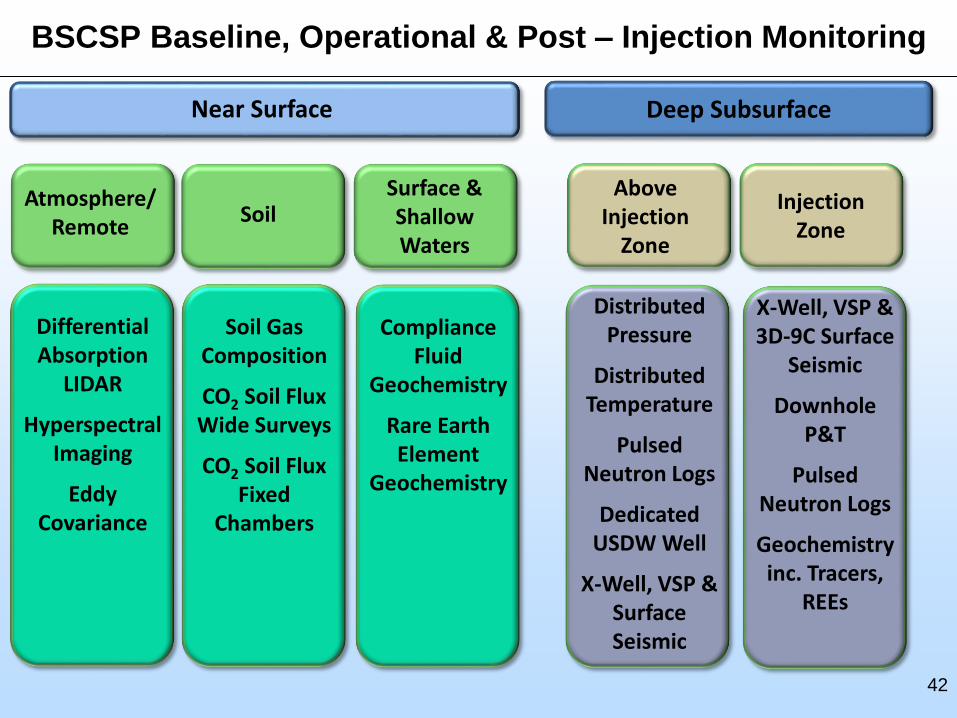
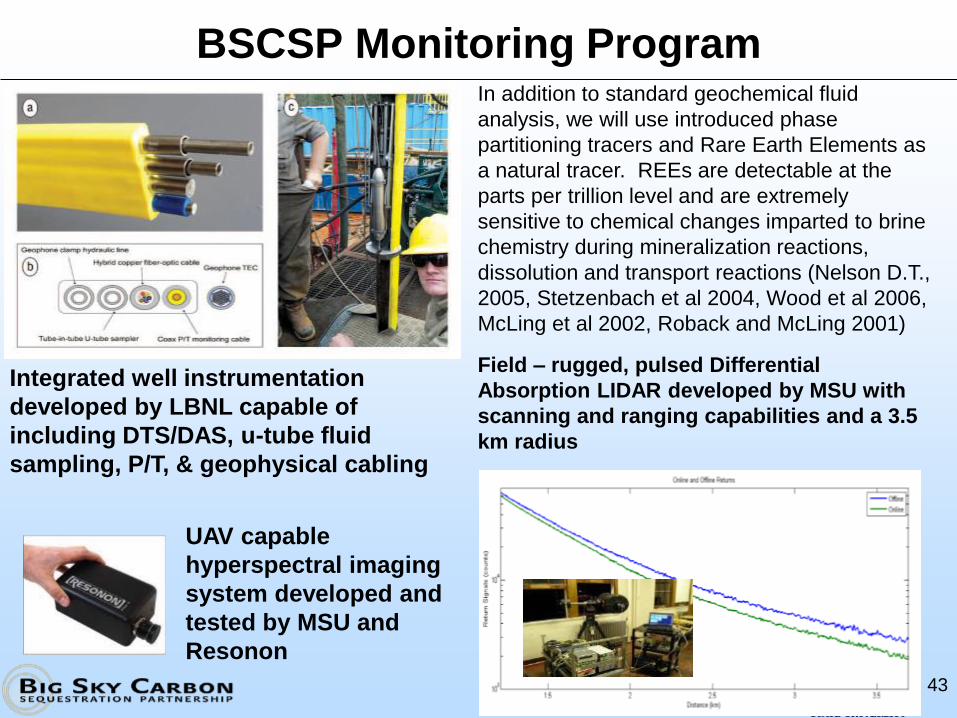
• Monitoring
• Results to Date and Accomplishments
• Summary
4
Benefit to the Program
• Support industries' ability to predict CO2 storage capacity in geologic
formations to within ±30%
The project will correlate logs, core studies, seismic and modeling efforts
with multiple iterations through all stages of the project to determine
actual storage compared to predicted. The project also tests storage in
a regionally significant formation and in regionally significant structural
closures that should refine regional capacity estimates.
• Develop and validate technologies to ensure 99 percent storage
permanence.
The project will use 3D, 9C surface seismic, VSP, in zone and above
zone geochemical sampling, repeat pulsed neutron logging, tracers,
distributed T and P sensors and assurance monitoring techniques to
verify location that the CO2 remains in the storage complex.
5
Benefit to the Program
• Develop technologies to improve reservoir storage efficiency while
ensuring containment effectiveness.
Pulsed neutron logging and heat pulses to the reservoir combined with
distributed temperature sensing should provide saturation information
which can be studied as a function of injection rate. We will also
measure rock physics properties as a function of CO2 saturation to try to
improve understanding of seismic response to SCO2.
• Develop Best Practice Manuals for monitoring, verification,
accounting, and assessment; site screening, selection and initial
characterization; public outreach; well management activities; and
risk analysis and simulation.
BSCSP will use information from this project to contribute to best
practices manuals.
6
Project Overview: Goals and Objectives
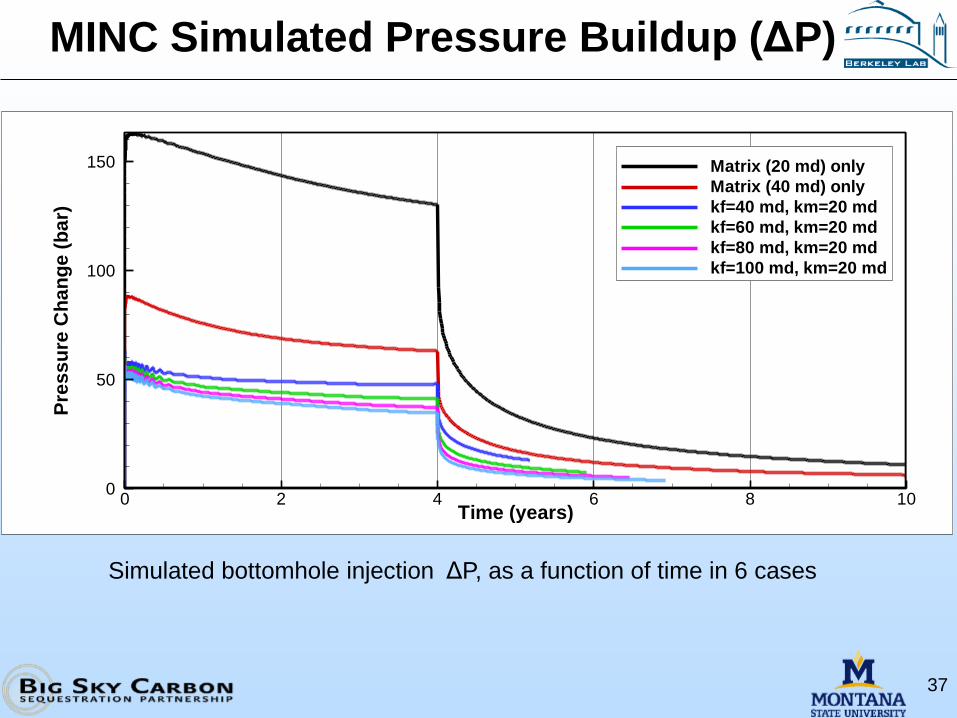
Primary objective - Demonstrate that the target formation and other analogous
formations are a viable and safe target for sequestration of a large fraction of the
region’s CO2 emissions.
Success Criteria – Project safely injects CO2 into the storage formation and models
and monitoring indicate permanence of storage in the reservoir.
Other objectives include improving the understanding of injectivity, capacity, and
storativity in a regionally significant formation.
Success Criteria – Site characterization, laboratory core studies, well tests, models
coupled with operational data deepen understanding of use of site characterization
data for predicting geologic system performance. Comparison of natural analog data
with laboratory studies and geochemical sampling in the injection region improve
understanding of injected CO2 behavior in reactive rock.
7
Project Overview: Goals and Objectives
Operational objectives - Safely procure, transport, inject and monitor up to one
million tons of CO2 into the target formation; understand the behavior of the injected
CO2 within the formation; verify and improve predictive models of CO2 behavior; test
and validate monitoring, verification and accounting (MVA) methodology.
Success Criteria – Safe and successful injection; good history matching of multi-phase
flow and reactive transport models; monitoring techniques detect CO2 when present
and provide information of plume development.
Post-injection phase objective - Assess any resultant changes from the CO2
injection and to continue to monitor the CO2 plume.
Success Criteria – Continued detection of plume evolution and models showing
predictive capability.
Regional characterization objectives - Understand the costs of carbon
sequestration; determine the best management practices to sequester carbon in the
soil of agricultural systems; and refine regional assessments of CO2 sources and
capacity estimates.
8
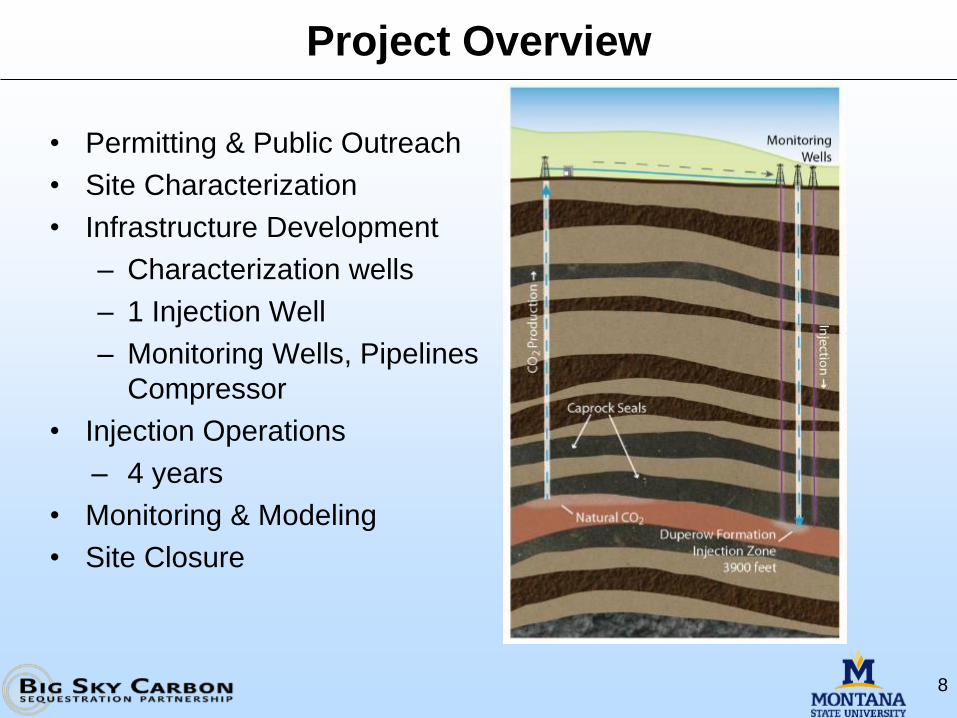
Project Overview
• Permitting & Public Outreach
• Site Characterization
• Infrastructure Development
– Characterization wells
– 1 Injection Well
– Monitoring Wells, Pipelines
Compressor
• Injection Operations
– 4 years
• Monitoring & Modeling
• Site Closure
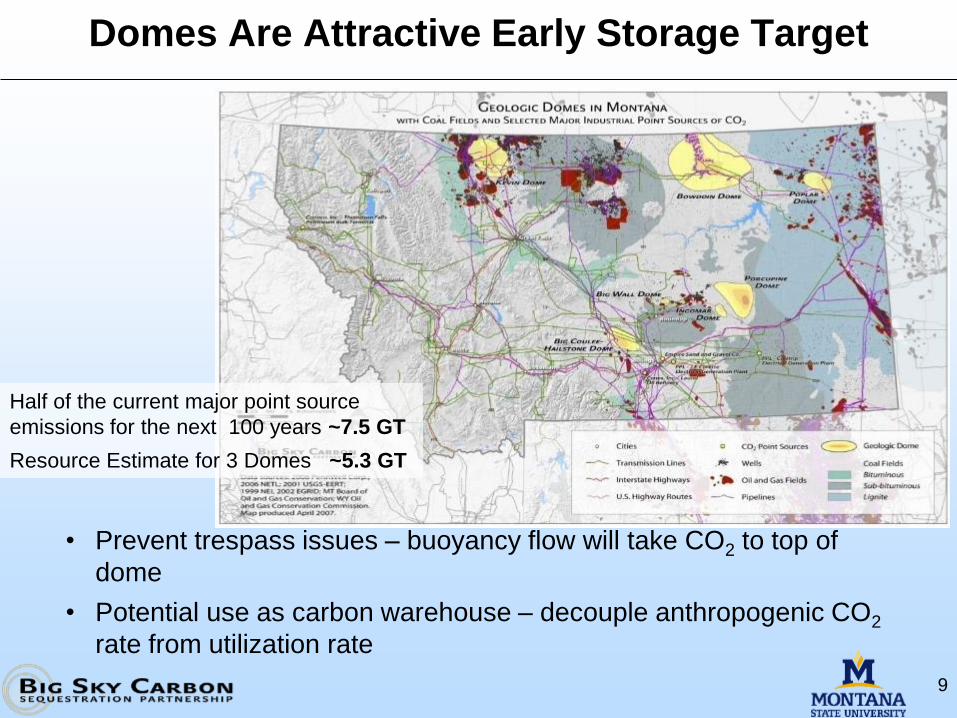
Domes Are Attractive Early Storage Target
9
Half of the current major point source
emissions for the next 100 years ~7.5 GT
Resource Estimate for 3 Domes ~5.3 GT
• Prevent trespass issues – buoyancy flow will take CO2 to top of
dome
• Potential use as carbon warehouse – decouple anthropogenic CO2
rate from utilization rate
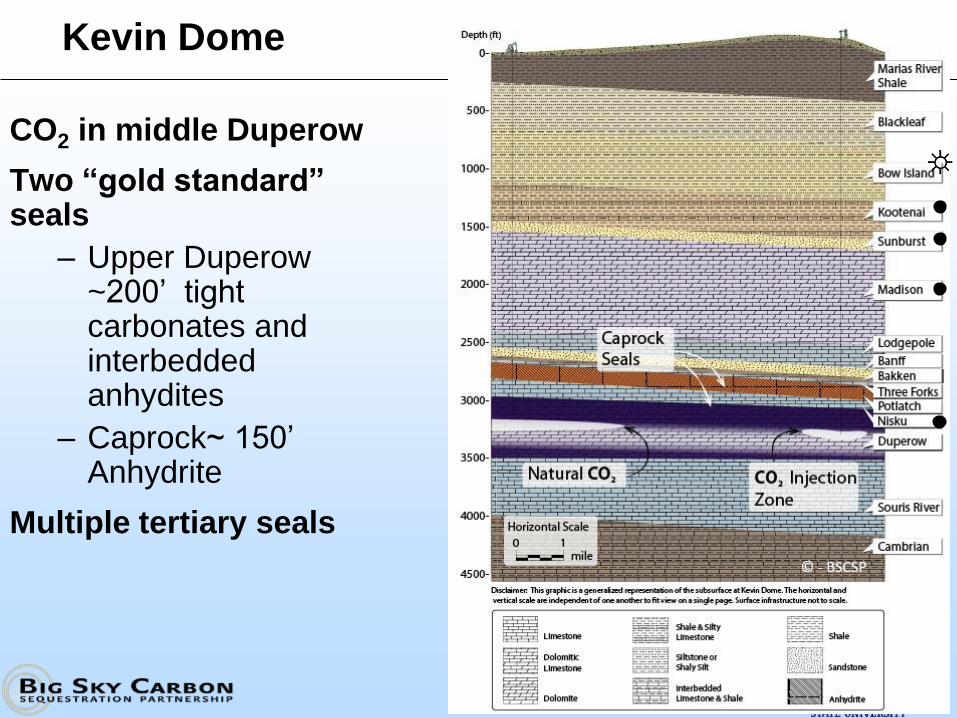
Kevin Dome
10
CO2 in middle Duperow
Two “gold standard” seals
– Upper Duperow~200’ tight carbonates and interbeddedanhydites
– Caprock~ 150’ Anhydrite
Multiple tertiary seals
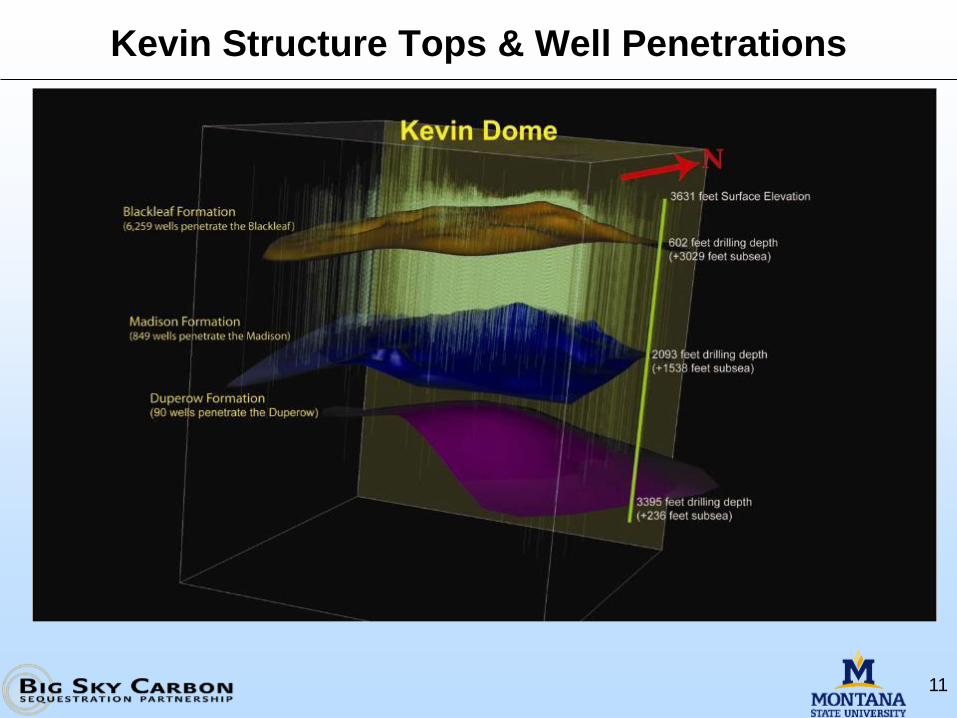
Kevin Structure Tops & Well Penetrations
11
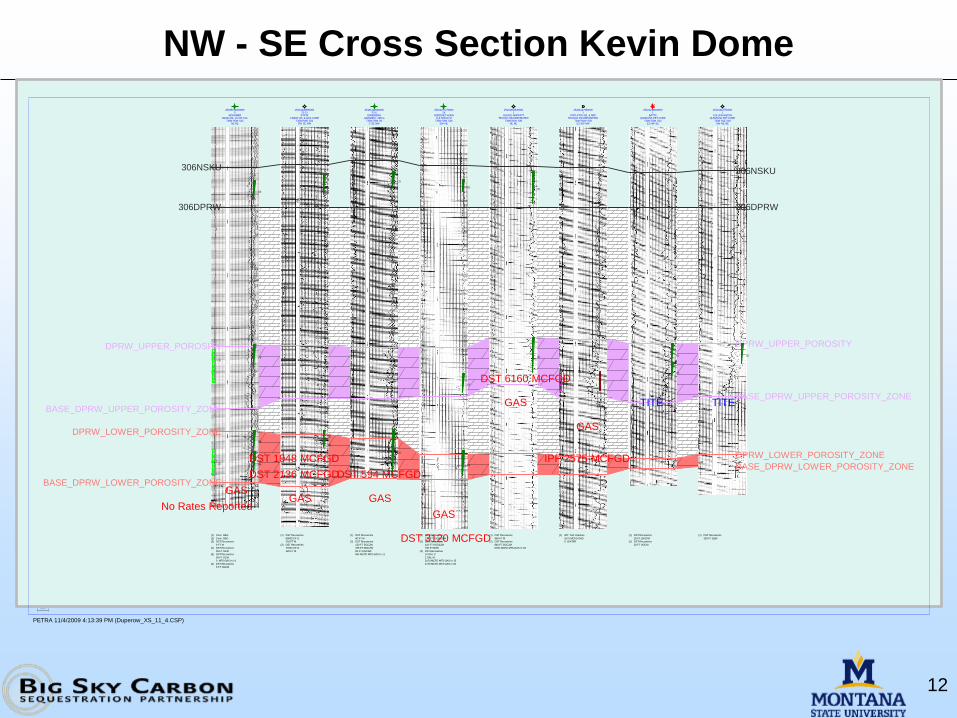
NW - SE Cross Section Kevin Dome
12
250350720600005
MCNAMERUNION OIL CO OF CAL
T36N R5W S15NE NE
2510123859000022-21
STATECABOT OIL & GAS CORP
T35N R4W S21SW SE NW
2510121208000022-6
ENNEBERGGRANNELL DRLG
T35N R3W S6C SE NW
251010772700002X
GOEDDEZ-AGENFULTON W M
T35N R3W S16SW NE
251010526300001
GLEN E MOFFATTTEXACO INCORPORATED
T34N R1W S30NE NE
251012179500001
POTLATCH OIL & REFTEXACO INCORPORATED
T34N R1W S29E2 SW NW
251012136600001
BATTSQUINTANA PET CORP
T33N R1W S12E2 NW SE
251012127500001
CULLEN-WEDINQUINTANA PET CORP
T33N R1E S18SW NE NE
306NSKU 306NSKU
306DPRW 306DPRW
DPRW_UPPER_POROSITY DPRW_UPPER_POROSITY
BASE_DPRW_UPPER_POROSITY_ZONE
BASE_DPRW_UPPER_POROSITY_ZONE
DPRW_LOWER_POROSITY_ZONE
DPRW_LOWER_POROSITY_ZONE
BASE_DPRW_LOWER_POROSITY_ZONE
BASE_DPRW_LOWER_POROSITY_ZONE
(1)
(2)
(3)
(4)
(5)
(6)
(1) Core: O&G
(2) Core: O&G
(3) DST Recoveries
6 FT M
(4) DST Recoveries
58 FT GCM
(5) DST Recoveries
50 FT GCM
0 MTS:GAS in 14
(6) DST Recoveries
5 FT SGCM
(1)
(2)
(1) DST Recoveries
89000 CF G
220 FT M
(2) DST Recoveries
77000 CF G
120 FT M
(1)
(2)
(1) DST Recoveries
40 FT M
(2) DST Recoveries
120 FT SGCZW
155 FT MGCZW
90 FT HGCZW
594 MCFD MTS:GAS in 11
(1)
(2)
(3)
(1) DST Recoveries
130 FT VSO&GCM
(2) DST Recoveries
110 FT HGCBZM
700 FT BZW
(3) DST Recoveries
10 GAL C
2 GAL M
3120 MCFD MTS:GAS in 15
2740 MCFD MTS:GAS in 60
(1)
(2)
(1) DST Recoveries
860 FT M
(2) DST Recoveries
840 FT BGCZM
6160 MCFD MTS:GAS in 33
(1)
(1) IPF: Test Volumes
2575 MCFD GAS
0 WATER
(1)
(2)
(1) DST Recoveries
20 FT ZHGCM
(2) DST Recoveries
20 FT HGCM
(1)
(1) DST Recoveries
330 FT BZW
HS=1131
PETRA 11/4/2009 4:13:39 PM (Duperow_XS_11_4.CSP)
GAS GAS
GAS
GAS
GAS
TITE TITE
IPF 2575 MCFGD
DST 6160 MCFGD
DST 3120 MCFGD
DST 594 MCFGD
GAS
DST 2136 MCFGD
DST 1848 MCFGD
No Rates Reported
Site Characteristics – Scientific Opportunities
13
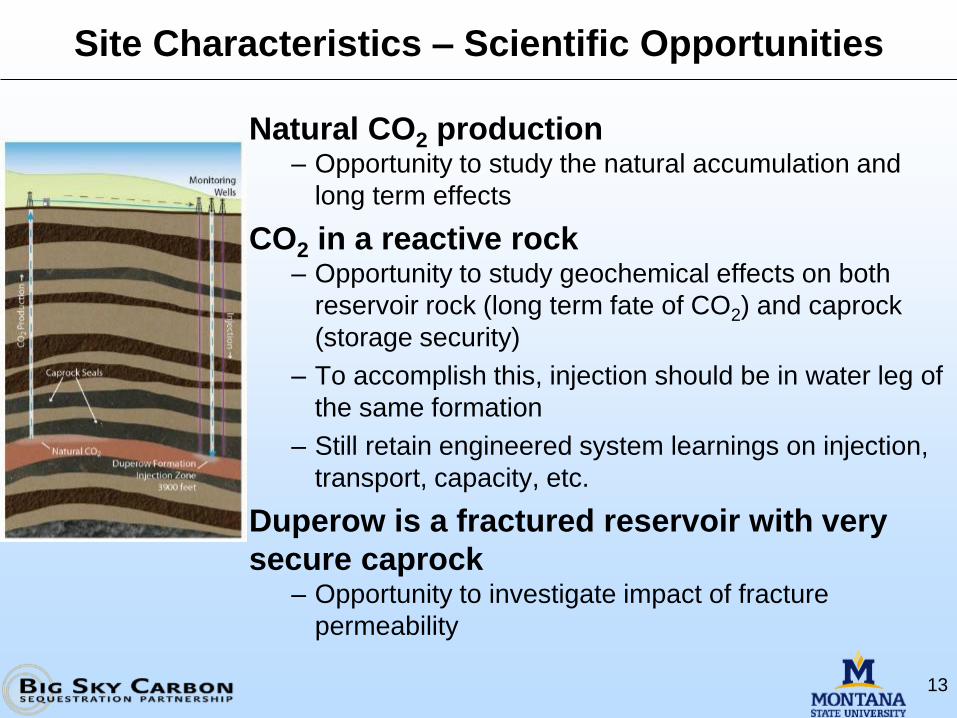
Natural CO2 production– Opportunity to study the natural accumulation and
long term effects
CO2 in a reactive rock– Opportunity to study geochemical effects on both
reservoir rock (long term fate of CO2) and caprock
(storage security)
– To accomplish this, injection should be in water leg of
the same formation
– Still retain engineered system learnings on injection,
transport, capacity, etc.
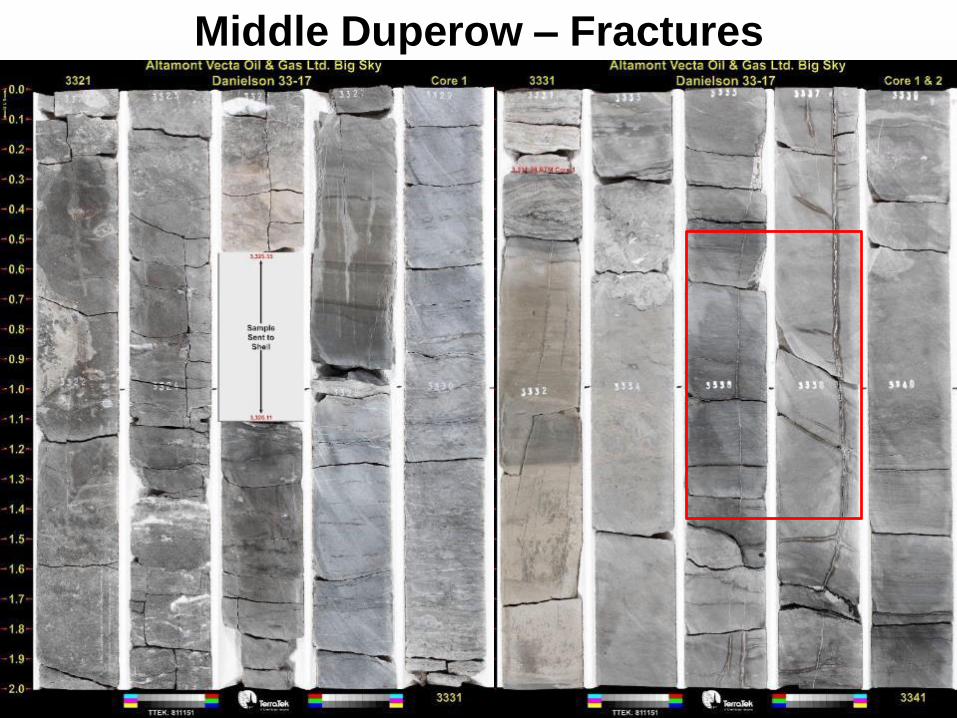
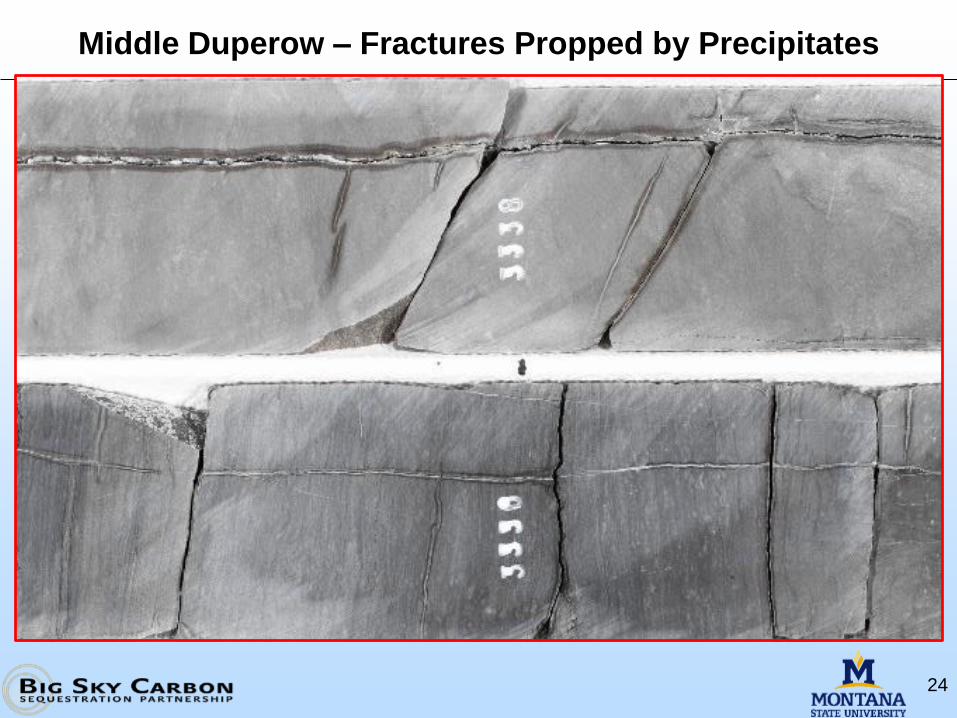
Duperow is a fractured reservoir with very
secure caprock– Opportunity to investigate impact of fracture
permeability
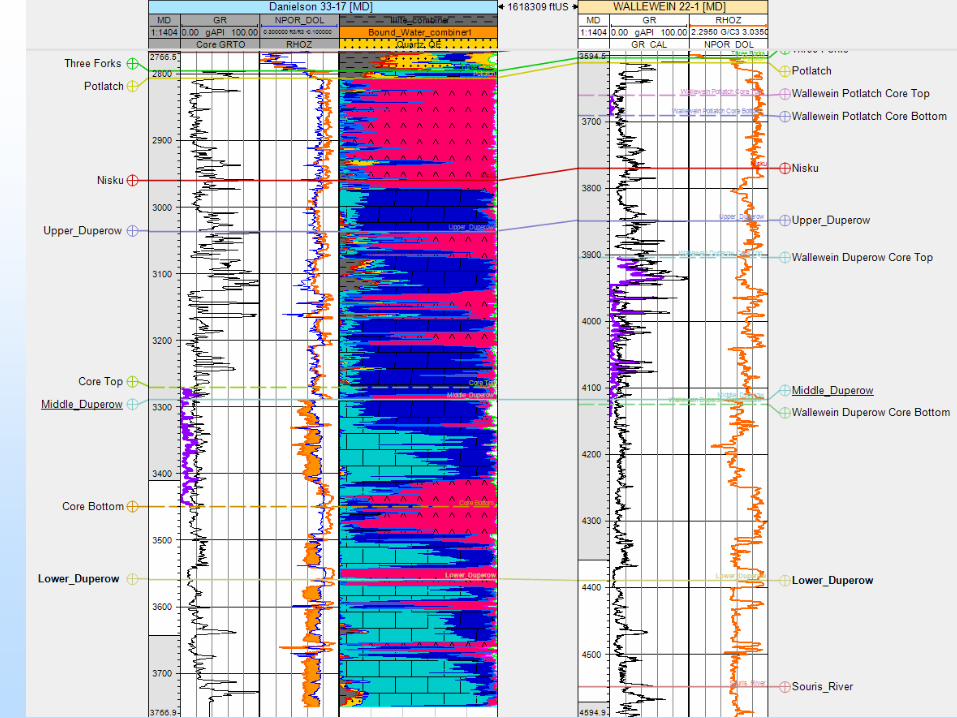
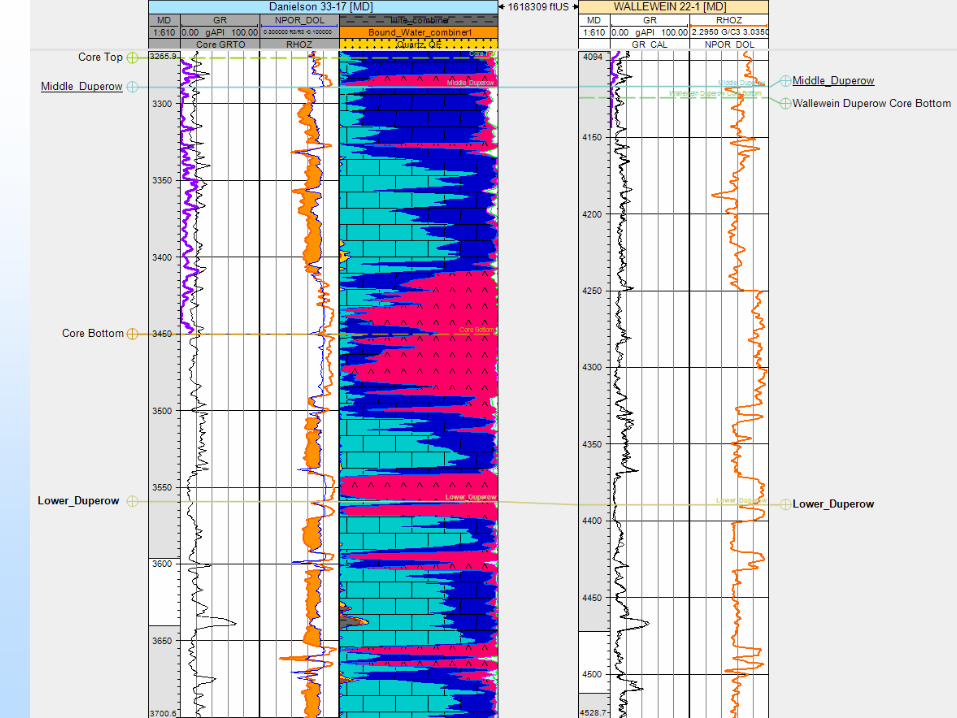
Site Characterization Approach / Accomplishments
Approach• Assimilate surface data
– Topography, water features, viewsheds, infrastructure, cultural resources, biological resources, etc.
• Create GIS products for surface features
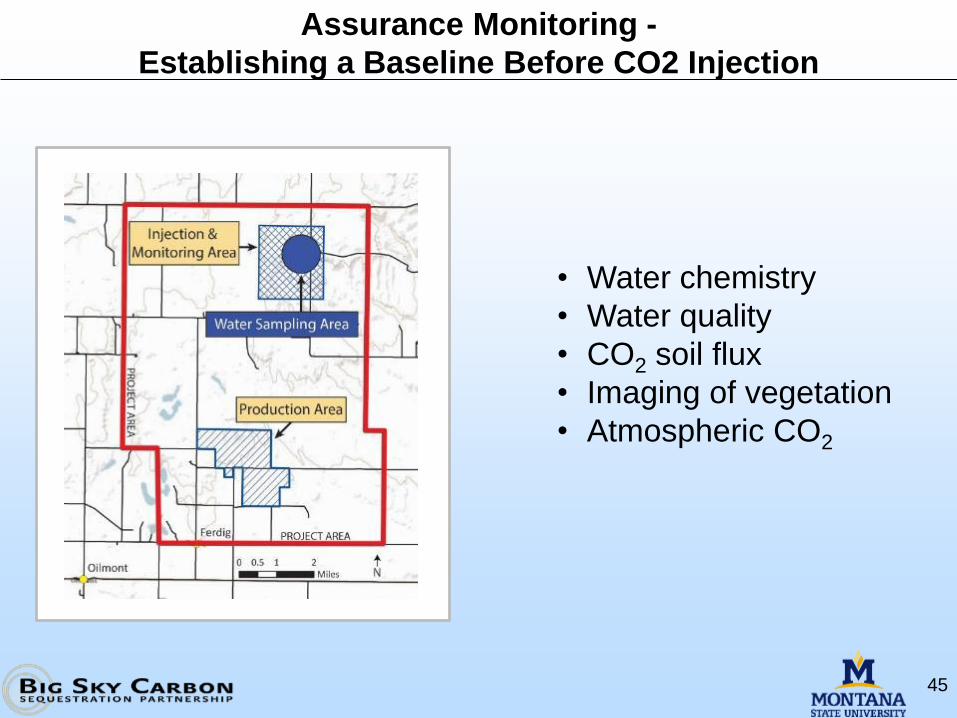
• Perform baseline monitoring
• Assimilate subsurface data
– Wells, tops, logs, 2D seismic, produced water, drilling records
• Create database
• Create static model
• Shoot 3D, 9C seismic
• Drill, log and core 2 wells
– Perform well tests and core analysis
Key Accomplishments• Kevin Atlas created with surface
and subsurface data incorporated
• ~ 36 sq. mi. 3D, 9C seismic shot, processed and being interpreted
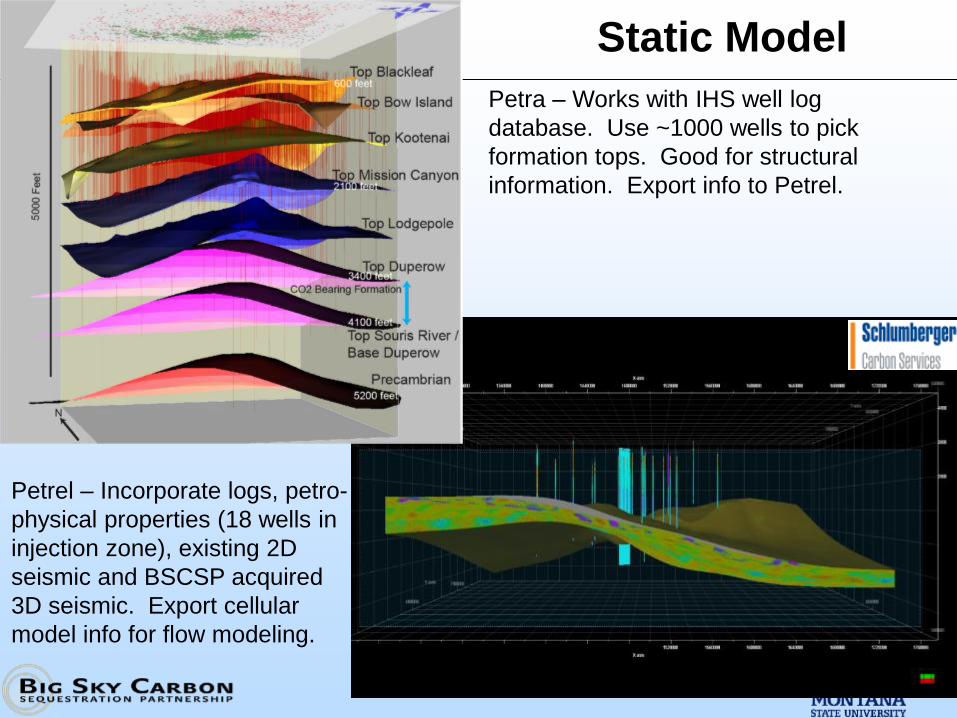
• Static geologic model created
– Hundreds of wells for tops, 32 logs digitized for geophysical parameters, 2D seismic, 3D, 9C seismic
• Initial flow modeling performed
– Injection & production regions
– Sensitivity analysis
– Reactive transport
• Cores and logs acquired / analyzed
• Well tests performed
• Second flow modeling performed
14
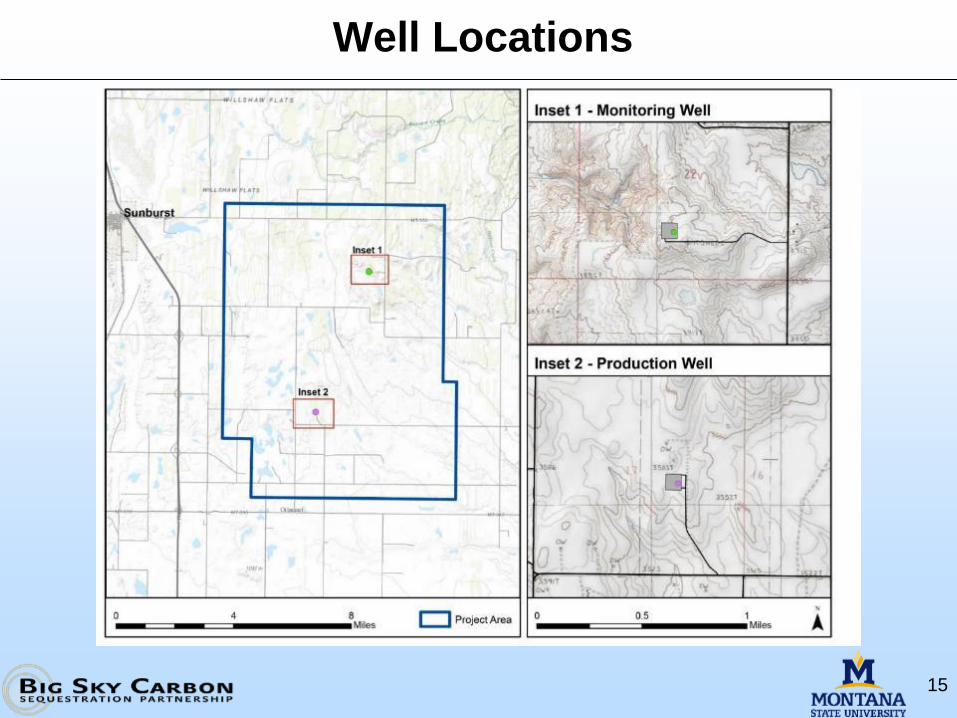
Well Locations
15
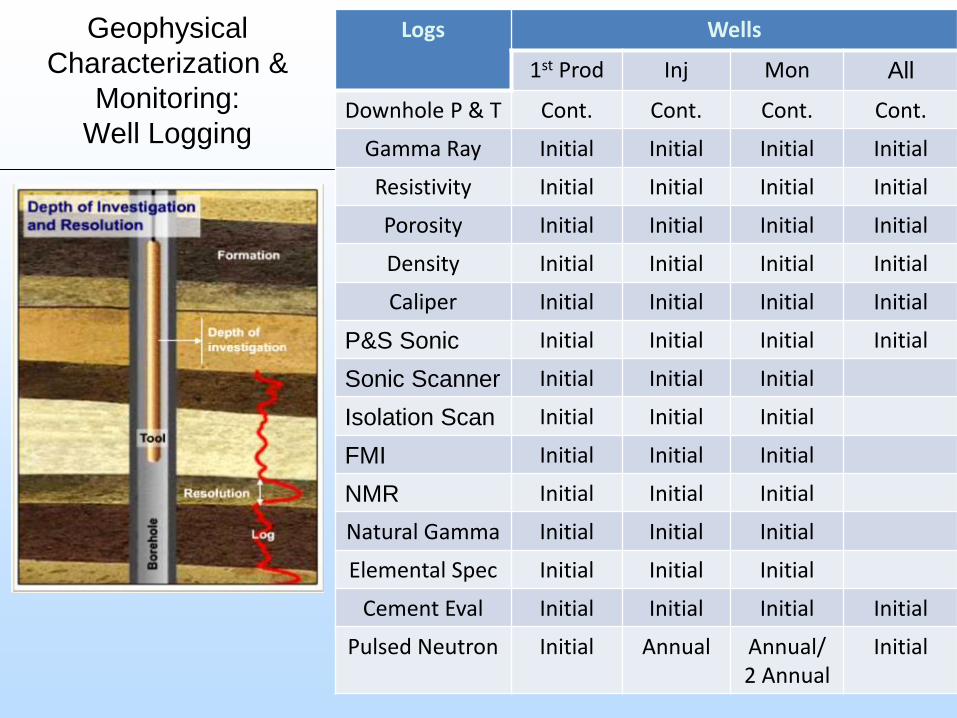
Geophysical
Characterization &
Monitoring:
Well Logging
16
Logs Wells
1st Prod Inj Mon All
Downhole P & T Cont. Cont. Cont. Cont.
Gamma Ray Initial Initial Initial Initial
Resistivity Initial Initial Initial Initial
Porosity Initial Initial Initial Initial
Density Initial Initial Initial Initial
Caliper Initial Initial Initial Initial
P&S Sonic Initial Initial Initial Initial
Sonic Scanner Initial Initial Initial
Isolation Scan Initial Initial Initial
FMI Initial Initial Initial
NMR Initial Initial Initial
Natural Gamma Initial Initial Initial
Elemental Spec Initial Initial Initial
Cement Eval Initial Initial Initial Initial
Pulsed Neutron Initial Annual Annual/ 2 Annual
Initial
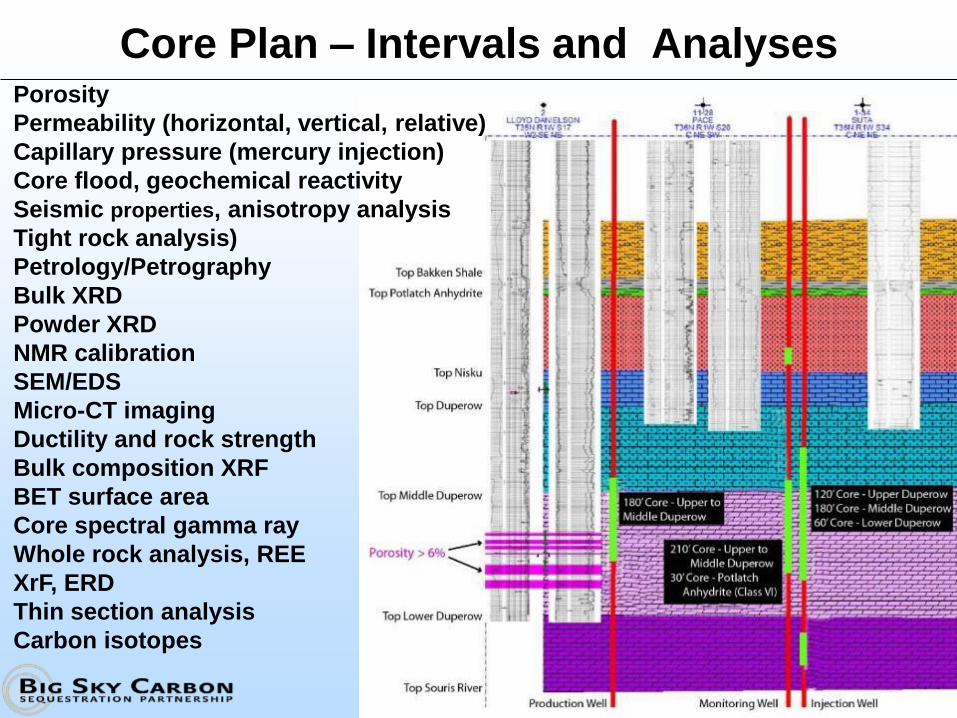
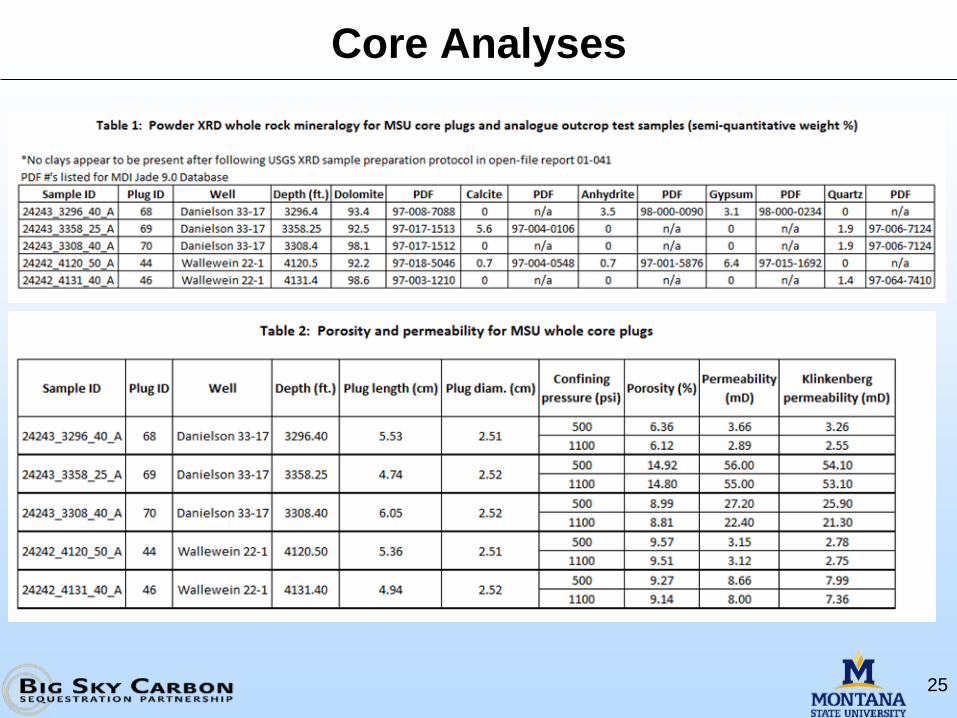
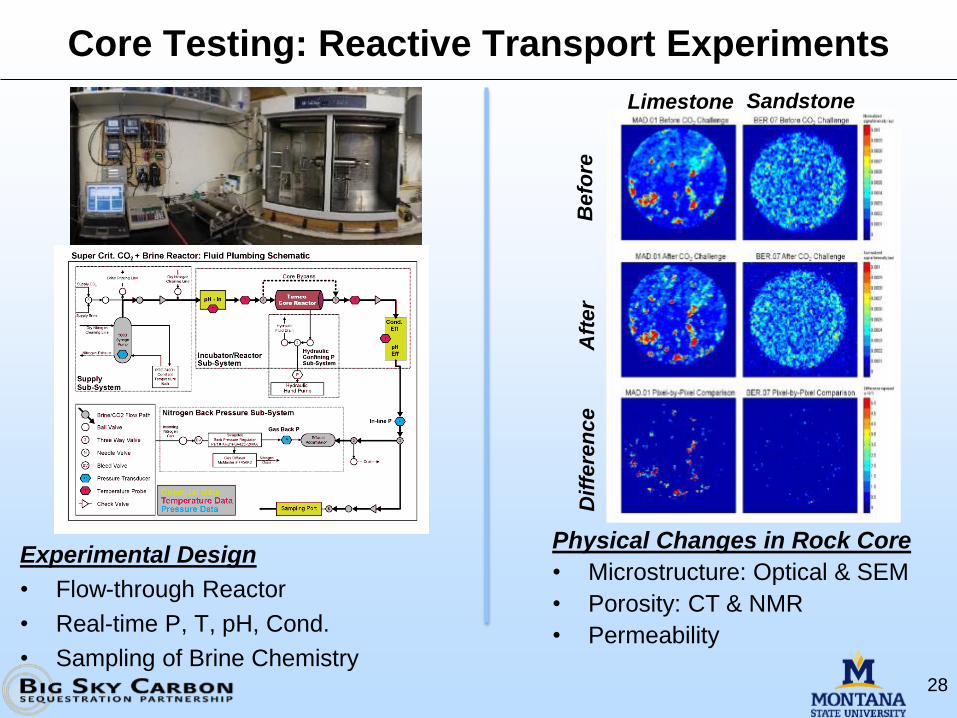
Core Plan – Intervals and AnalysesPorosity
Permeability (horizontal, vertical, relative)
Capillary pressure (mercury injection)
Core flood, geochemical reactivity
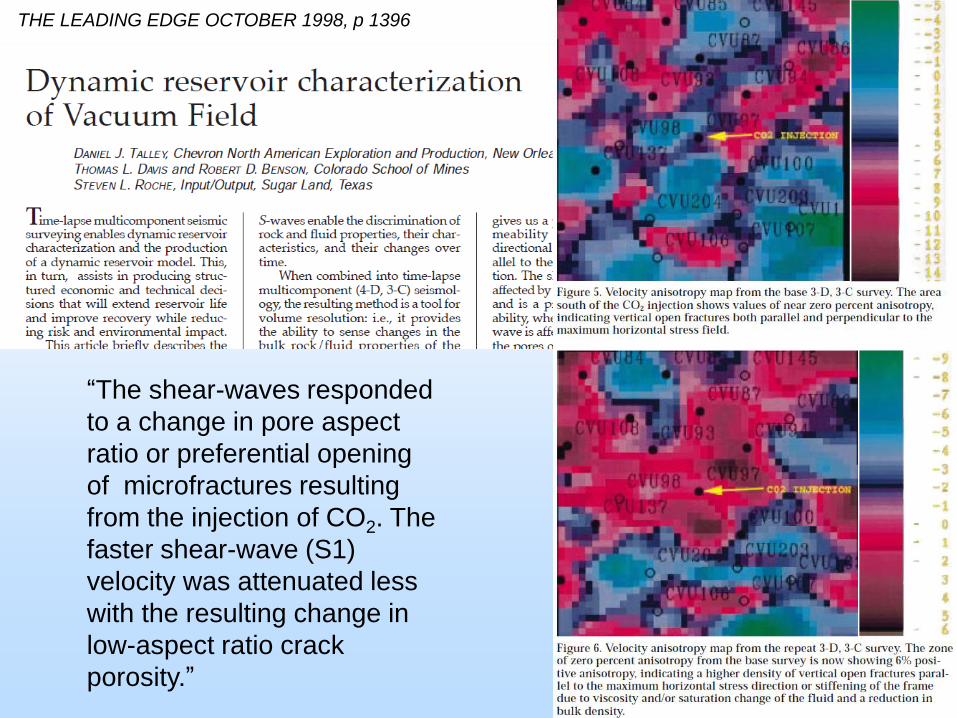
Seismic properties, anisotropy analysis
Tight rock analysis)
Petrology/Petrography
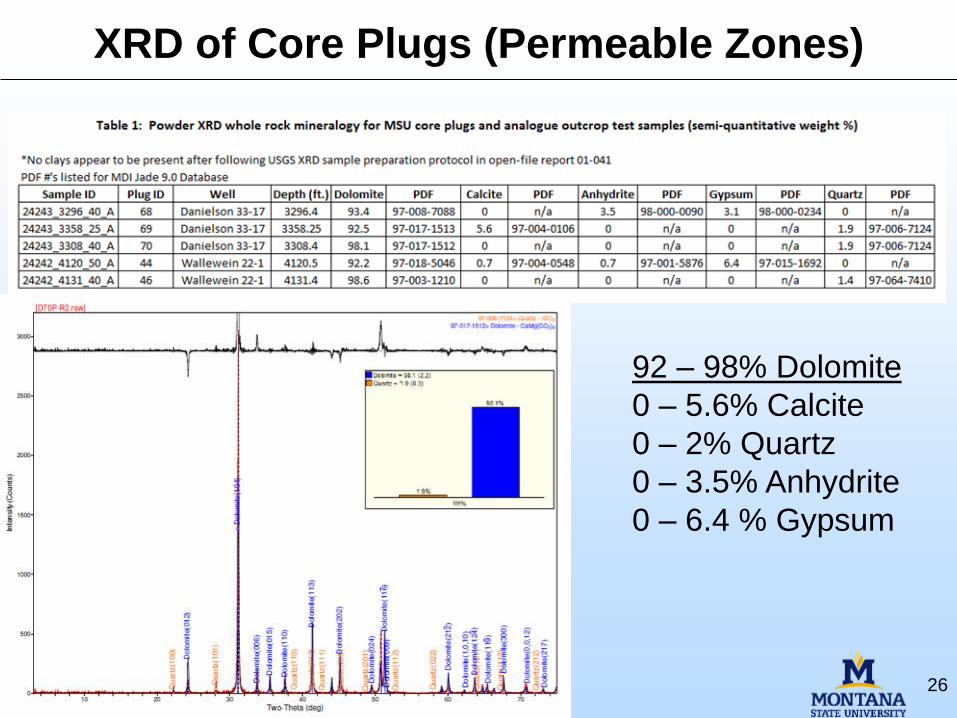
Bulk XRD
Powder XRD
NMR calibration
SEM/EDS
Micro-CT imaging
Ductility and rock strength
Bulk composition XRF
BET surface area
Core spectral gamma ray
Whole rock analysis, REE
XrF, ERD
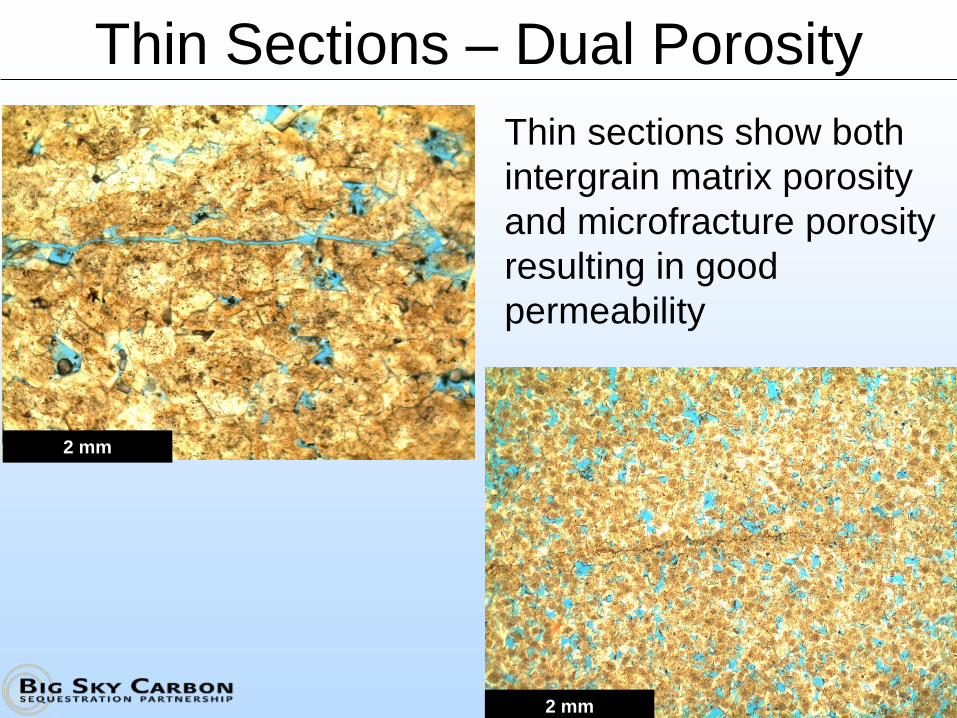
Thin section analysis
Carbon isotopes
Caprock Geomechanical Tests
20
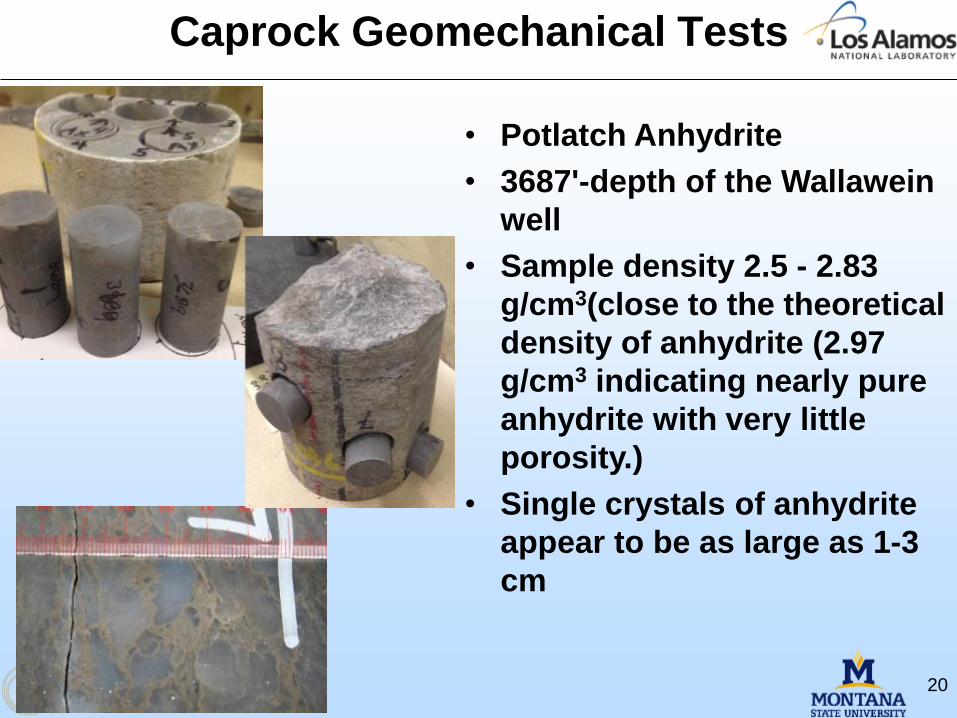
• Potlatch Anhydrite
• 3687'-depth of the Wallawein
well
• Sample density 2.5 - 2.83
g/cm3(close to the theoretical
density of anhydrite (2.97
g/cm3 indicating nearly pure
anhydrite with very little
porosity.)
• Single crystals of anhydrite
appear to be as large as 1-3
cm
Caprock Geomechanical Tests
21
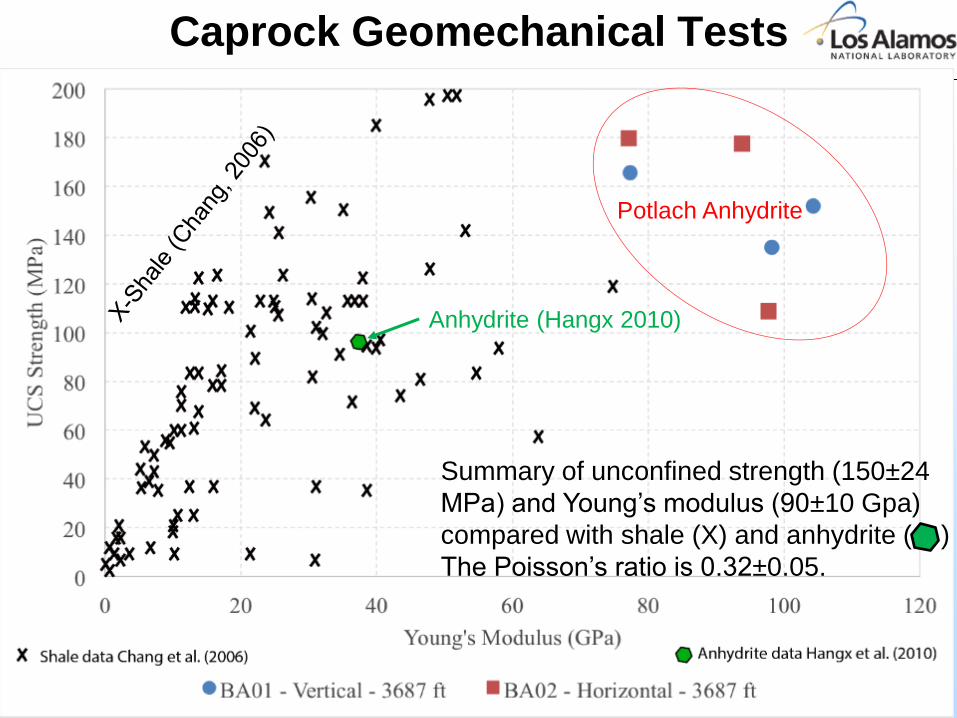
Summary of unconfined strength (150±24
MPa) and Young’s modulus (90±10 Gpa)
compared with shale (X) and anhydrite ( )
The Poisson’s ratio is 0.32±0.05.
Anhydrite (Hangx 2010)
Potlach Anhydrite
Caprock Geomechanical Tests
22
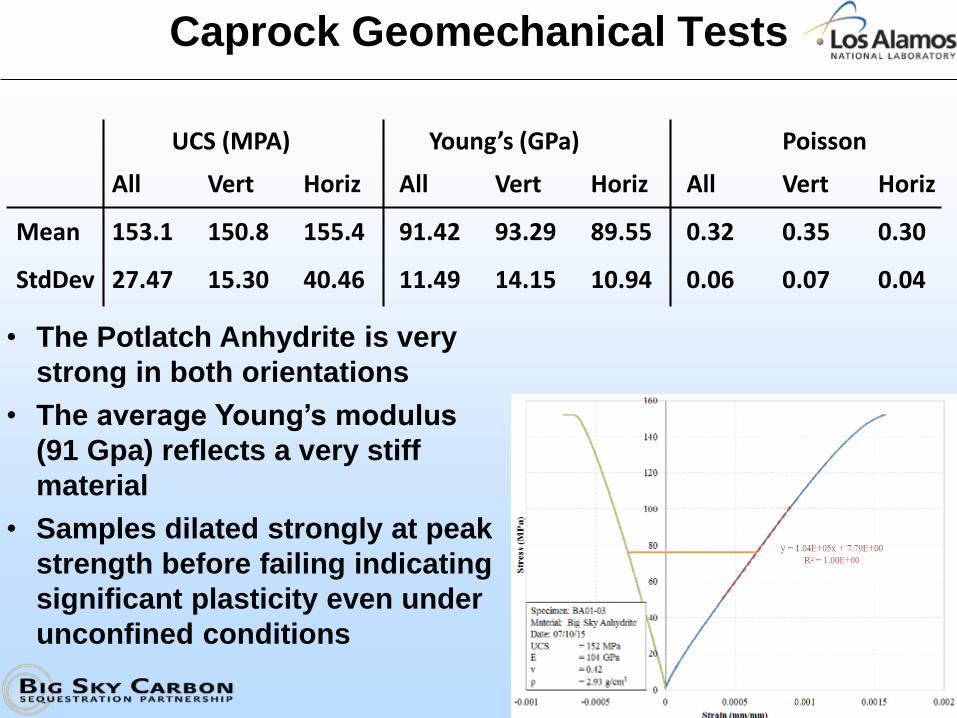
UCS (MPA) Young’s (GPa) Poisson
All Vert Horiz All Vert Horiz All Vert Horiz
Mean 153.1 150.8 155.4 91.42 93.29 89.55 0.32 0.35 0.30