Page 1
Binh Son Refinery (BSR) COMPANY REPORT
Setting stage for 4Q turnaround
July 27, 2020
Nguyen Vinh Analyst / Oil & Gas
[email protected]
Initiate coverage with BUY rating
and target price of VND8,100
Price recovery underway for 4Q
earnings turnaround
Upgrading facilities should be ready
by 2022E alongside the start of
localized petrochemical production
We initiate our coverage of BSR with a BUY rating and a target price of VND8,100.
Our target price is based on a mid-cycle P/B multiple derived from our three-stage
dividend discount model. We apply a mid-cycle valuation for our target price to
reflect our view for more modest recovery in domestic gasoline prices amid an
extended period of weak oil prices.
Local ex-factory gasoline and diesel prices have bounced back by 48% and should
allow steady recovery in margins despite our outlook for a flatter trajectory in oil
price recovery. BSR returned to profitability in June and volumes have come back
to set the stage for an earnings turnaround for 4Q after August’s two-month
scheduled maintenance shutdown. The three-year annual maintenance overhaul
should reduce 3Q utilization to 16% but after completion we expect the company
to be on track for sequential earnings recovery into 2021E.
Vietnam will begin local production of petrochemicals when onshore capacity is
ready for startup in 2023E. BSR is also currently upgrading facilities to enter into
the petrochemical market. We strongly believe this initial step is significant and
marks the beginning of a much more substantial push into petrochemicals,
especially in the context of Vietnam’s sizable LNG capacity expansion.
BUY initiate Target Price VND8,100
Total return (%) 37.3%
Current price (Jul 27) VND5,900
Consensus target price VND6,000
Mkt capitalization (USDbn) USD789mn
Trading data
Free float (%) 7.9%
Avg trading value (3M) USD1.25mn
Foreign available (%) 7.9%
Major shareholders (%) PetroVietnam (92%)
Share price performance
(%) 1M 3M 6M 12M
Absolute -20.8 -1.7 -32.1 -50.4
Relative -14.1 -3.5 -14.3 -37.3
Forecast earnings & valuation
Revenue (VNDbn) 102,824 61,429 90,819 95,360
EBIT 2,869 (2,699) 4,063 4,497
NP attributable to parent 2,914 (2,942) 3,355 3,705
EPS (VND) 940 (949) 1,082 1,195
EPS growth (%) (22.3) (201.0) (214.0) 10.4
P/E (x) 6.3 (6.2) 5.5 4.9
EV/EBITDA (x) 3.1 (42.2) 2.9 3.1
P/B (x) 0.5 0.6 0.5 0.5
ROE (%) 8.9 (9.1) 10.4 10.6
Div yield (%) 2.8 0.0 2.7 6.8
Source: Bloomberg, KB Securities Vietnam
Page 2
KB SECURITIES VIETNAM
2
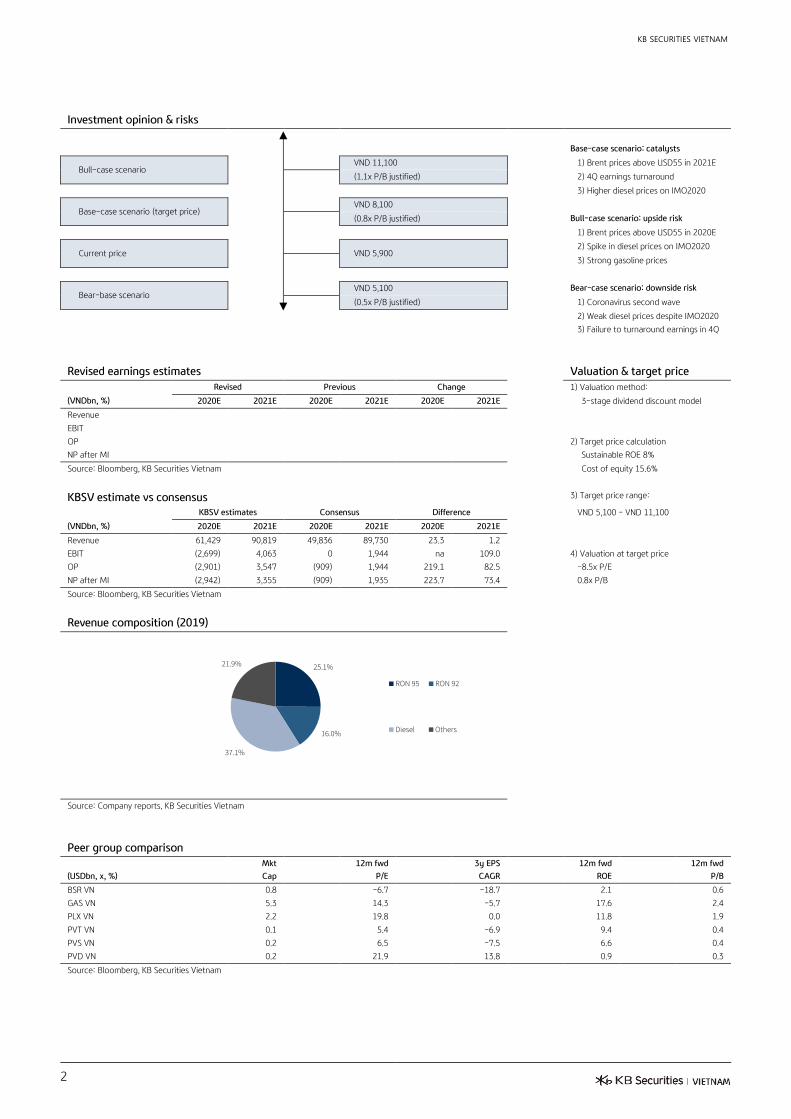
Investment opinion & risks
Base-case scenario: catalysts
Bull-case scenario VND 11,100 1) Brent prices above USD55 in 2021E
(1.1x P/B justified) 2) 4Q earnings turnaround
3) Higher diesel prices on IMO2020
Base-case scenario (target price) VND 8,100
(0.8x P/B justified) Bull-case scenario: upside risk
1) Brent prices above USD55 in 2020E
Current price
VND 5,900 2) Spike in diesel prices on IMO2020
3) Strong gasoline prices
Bear-base scenario VND 5,100 Bear-case scenario: downside risk
(0.5x P/B justified) 1) Coronavirus second wave
2) Weak diesel prices despite IMO2020
3) Failure to turnaround earnings in 4Q
Revised earnings estimates Valuation & target price
Revised Previous Change 1) Valuation method:
(VNDbn, %) 2020E 2021E 2020E 2021E 2020E 2021E 3-stage dividend discount model
Revenue
EBIT
OP 2) Target price calculation
NP after MI Sustainable ROE 8%
Source: Bloomberg, KB Securities Vietnam Cost of equity 15.6%
KBSV estimate vs consensus 3) Target price range:
KBSV estimates Consensus Difference VND 5,100 - VND 11,100
(VNDbn, %) 2020E 2021E 2020E 2021E 2020E 2021E
Revenue 61,429 90,819 49,836 89,730 23.3 1.2
EBIT (2,699) 4,063 0 1,944 na 109.0 4) Valuation at target price
OP (2,901) 3,547 (909) 1,944 219.1 82.5 -8.5x P/E
NP after MI (2,942) 3,355 (909) 1,935 223.7 73.4 0.8x P/B
Source: Bloomberg, KB Securities Vietnam
Revenue composition (2019)
Source: Company reports, KB Securities Vietnam
Peer group comparison
Mkt 12m fwd 3y EPS 12m fwd 12m fwd
(USDbn, x, %) Cap P/E CAGR ROE P/B
BSR VN 0.8 -6.7 -18.7 2.1 0.6
GAS VN 5.3 14.3 -5.7 17.6 2.4
PLX VN 2.2 19.8 0.0 11.8 1.9
PVT VN 0.1 5.4 -6.9 9.4 0.4
PVS VN 0.2 6.5 -7.5 6.6 0.4
PVD VN 0.2 21.9 13.8 0.9 0.3
Source: Bloomberg, KB Securities Vietnam
25.1%
16.0%
37.1%
21.9%
RON 95 RON 92
Diesel Others
Page 3
KB SECURITIES VIETNAM
3
Setting stage for 4Q rebound
Binh Son Refinery (BSR):
4Q turnaround and entering
petrochemical market
We initiate our coverage of BSR with a BUY rating and a target price of
VND8,100. Our target price is based on a mid-cycle P/B multiple derived from
our three-stage dividend discount model. We apply a mid-cycle valuation for
our target price to reflect our view for more modest recovery in domestic
gasoline prices amid an extended period of weak oil prices.
Local ex-factory gasoline and diesel prices have bounced back by 48% and
should allow steady recovery in margins despite slower oil price recovery. BSR
returned to profitability in June and volumes have come back to set the stage
for an earnings turnaround for 4Q after August’s two-month scheduled
maintenance shutdown. BSR is also currently upgrading facilities to enter into
the petrochemical market.
We estimate CAGR at 17.5% between 2021E and 2025E. Earnings performance
should be better for 2021E at VND3,335 billion due to: 1) refinery product
prices back at pre-pandemic and profitable levels; and 2) utilization ratios back
to normal levels at 110%. We also assume on-time completion of the USD1.8
billion upgrading and expansion plan in 2023E despite current financing
difficulties. The upgrade/expansion should: 1) boost total capacity by 30%; 2)
upgrade facilities to complex refining from simple refining and diversify
feedstock to both sour and sweet crude oil; and 3) increase the percentage of
higher-margin petrochemical products.
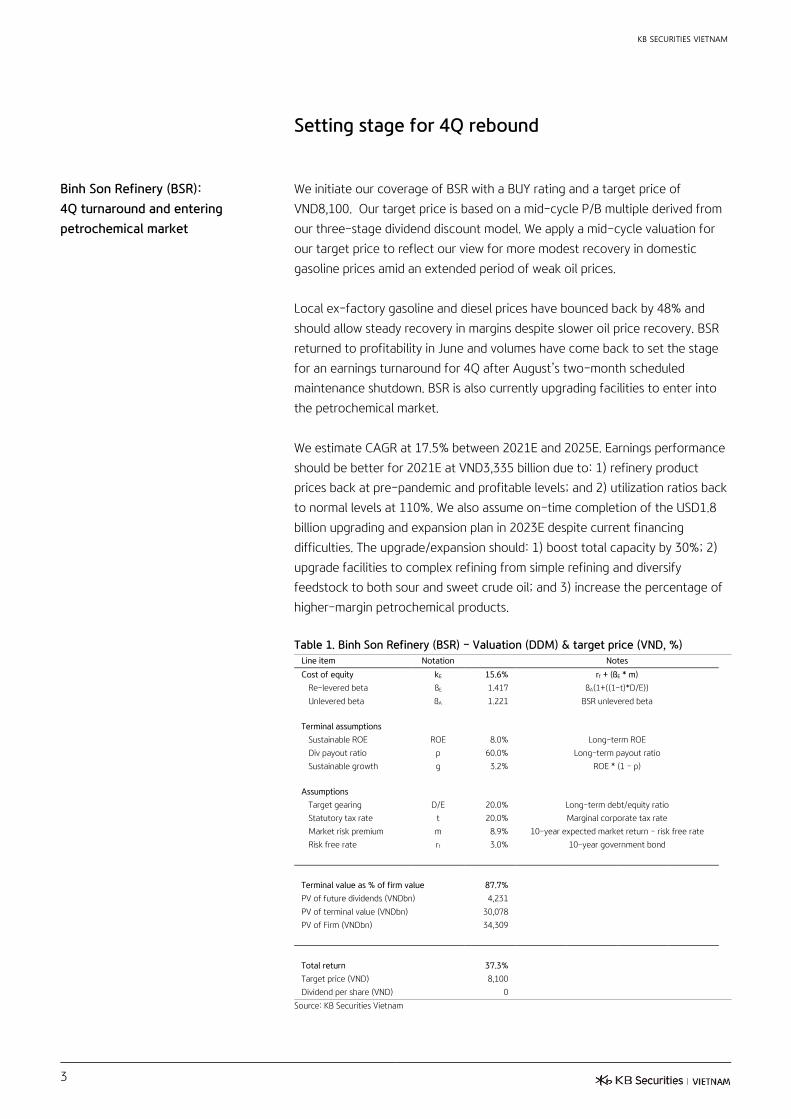
Table 1. Binh Son Refinery (BSR) – Valuation (DDM) & target price (VND, %)
Line item Notation Notes
Cost of equity kE 15.6% rf + (ßE * m)
Re-levered beta ßE 1.417 ßA(1+((1-t)*D/E))
Unlevered beta ßA 1.221 BSR unlevered beta
Terminal assumptions
Sustainable ROE ROE 8.0% Long-term ROE
Div payout ratio p 60.0% Long-term payout ratio
Sustainable growth g 3.2% ROE * (1 - p)
Assumptions
Target gearing D/E 20.0% Long-term debt/equity ratio
Statutory tax rate t 20.0% Marginal corporate tax rate
Market risk premium m 8.9% 10-year expected market return - risk free rate
Risk free rate rf 3.0% 10-year government bond
Terminal value as % of firm value 87.7%
PV of future dividends (VNDbn) 4,231
PV of terminal value (VNDbn) 30,078
PV of Firm (VNDbn) 34,309
Total return 37.3%
Target price (VND) 8,100
Dividend per share (VND) 0
Source: KB Securities Vietnam
Page 4
KB SECURITIES VIETNAM
4
Our 12-month target price set to
mid-cycle price objective vs fully-
growth loaded valuation
Our valuation is based on the three-stage dividend discount model (DDM) that
utilizes the capital asset pricing model (CAPM) to determine an appropriate
discount rate for projected cash dividends/stock buybacks for individual stocks.
We consider valuations generated from the DDM as fully-growth loaded
assessments of value. Additionally, we estimate the ex-growth price-to-book
multiple by modifying the Gordon Growth model [(ROE-g)/(COE-g)] to assume
zero growth or simply the company’s sustainable return on equity (ROE) divided
by the cost of equity (COE). Our mid-cycle target prices is then based the
average of the fully-growth loaded value of the company and the ex-growth
estimate.
Table 2. KBSV – Valuation methodology
Gordon growth model
Justified P/B multiple = ( ROE - g)
(COE - g)
Ex-growth model
Ex-growth P/B multiple = ROE
COE
Mid-cycle model
Mid-cycle P/B multiple = Average of:
[DDM valuation & Ex-growth valuation]
Source: KB Securities Vietnam
Page 5
KB SECURITIES VIETNAM
5
Unexpected 2Q losses despite
VND500 billion in provision
reversals
Losses for 2Q reached VND1,897 billion versus 2019’s profits of VND106 billion
on revenue that plunged by 51% YoY to VND13,736 billion. Weak 2Q results
should have largely been expected as they still reflect: 1) the brunt of the
pandemic-induced fall in global refinery product demand; and 2) decreased
domestic output and consumption due to Vietnam’s nationwide lockdown.
Losses for 1H were VND4,245 billion versus last year’s earnings of VND704
billion but 2Q losses did narrow on VND500 billion in reversals for 1Q’s
inventory provisions with the bounce back in oil prices. Moreover, management
indicated that the company returned to profitability in June, which bodes well
for continuing recovery into 2H.
Pick up in gasoline & diesel should
help 3Q operations but 4Q before
any real turnaround
Recovery in global refinery demand should support 2H recovery and we expect
3Q earnings of VND605 billion or up 0.7% YoY (vs 2Q’s VND1,898 billion loss).
That said, 3Q results should still be weighed down by the two-month
maintenance overhaul in August, which should lower the utilization ratio to
16%. The turnaround should come in 4Q when we expect earnings of VND684
billion (up 13% QoQ but down 57.2% YoY). Given the depth of 1H losses,
however, 2H recovery should not be enough to bring full-year earnings into
positive territory and we estimate VND2,957 billion in losses for the year.
CAGR at 17.5% after earnings
normalize in 2021E
We estimate CAGR at 17.5% between 2021E and 2025E. Earnings performance
should be better for 2021E at VND3,335 billion due to: 1) refinery product
prices back at pre-pandemic and profitable levels; and 2) utilization ratios back
to normal levels at 110%. We also assume on-time completion of the USD1.8
billion upgrading and expansion plan in 2022E despite current financing
difficulties. The upgrade/expansion should: 1) boost total capacity by 30%; 2)
upgrade facilities to complex refining from simple refining and diversify
feedstock to both sour and sweet crude oil; and 3) increase the percentage of
petrochemical products offering higher margins than refinery products.
Page 6
KB SECURITIES VIETNAM
6
Fig 1. Binh Son Refinery (BSR) – Petroleum product output forecasts, 2013-2030E
(million tons)
Source: Company reports, KB Securities Vietnam
Fig 2. Binh Son Refinery (BSR) – Singapore RON 92, RON 95 & Diesel Oil ex-factory
prices, Jan 2020–Jul 2020 (USD)
Refinery output price = Average MOPS 5, 10 or
15 days (number of days depends on buyers &
contracts) + premium (negotiated)
Source: Bloomberg, KB Securities Vietnam
Fig 3. Binh Son Refinery (BSR) – Petrochemical output forecasts, 2013-2030E
(thousand tons)
Source: Company reports, KB Securities Vietnam
0
5
10
15
20
25
30
35
13 14 15 16 17 18 19 20E 21E 22E 23E 24E 25E 26E 27E 28E 29E 30E
(million ton) Binh Son Refinery Nghi Son Refinery Import & Others
0
10
20
30
40
50
60
70
80
90
01.20 02.20 03.20 04.20 05.20 06.20 07.20
(USD per barrel)Brent RON92 RON95 Diesel
Coronavirus
0
500
1,000
1,500
2,000
2,500
3,000
20E 21E 22E 23E 24E 25E 26E 27E 28E 29E 30E
(thous ton)
Nghi Son Refinery Long Son Petrochemicals Binh Son Refinery Upgrade/expansion
Page 7
KB SECURITIES VIETNAM
7
Upstream vs downstream
Upstream companies hit harder as
oil prices below breakeven lead to
project delays and more
production cuts
We expect oil prices at below Vietnam’s USD55.00 breakeven to impact
upstream companies more severely than downstream companies. Vietnam’s
production output already peaked for crude oil in 2015 and natural gas in 2018
and project delays are likely to continue as high extraction costs from
Vietnam’s mature oil and gas fields lead to additional production cuts. Weak oil
prices are also delaying drilling and service contracts at major upstream
customers in neighboring countries.
Fig 4. Southeast Asia oil & gas – Breakeven crude oil prices, 2019 (USD per barrel)
Source: Petrovietnam Group (PVN), KB Securities Vietnam
We expect crude oil and natural
gas production to fall continuously
but the outlook for gas improves
dramatically if mega projects are
approved
We expect oil production to continue its downward trend and fall by about 5%
per year throughout our forecast period due to: 1) harder to extract reserves;
2) less promising outlook for new field discoveries; and 3) ongoing offshore
tensions that make any restart of the Red Emperor project unlikely in the
foreseeable future. Moreover, the stalled recovery in oil prices should extend
production cuts for the remaining part of the year. Production volumes are also
falling from existing natural gas fields but the approval of a few mega projects
could trigger a multi-year boom for natural gas. Our natural gas production
forecasts assume these new fields will face delays but inevitably come online.
Table 2. Vietnam oil & gas – Crude oil production & consumption forecasts, 2019-2030E (thousands of barrels per day, billion
barrels, years)
Metrics/Year 19 20E 21E 22E 23E 24E 25E 26E 27E 28E 29E 30E
Production (thousand bbl/day) 224 201 201 191 181 172 163 155 147 140 133 126
Consumption (thousand bbl/day) 308 307 377 343 356 398 343 356 398 343 398 343
Proven reserves (billion barrels) 4.3 4.2 4.1 4.1 4.0 4.0 3.9 3.8 3.8 3.7 3.7 3.6
Reserves to production (years) 53 55 57 59 61 63 65 68 70 73 76 79
Source: ENI, KB Securities Vietnam
Table 3. Vietnam oil & gas – Natural gas production & consumption forecasts, 2019-2030E (billion cubic metres, years)
Metrics/Year 19 20E 21E 22E 23E 24E 25E 26E 27E 28E 29E 30E
Production (bcm) 10.3 10.1 10.5 11.4 12.6 19.9 25.8 29.3 30.1 29.6 29.1 28.5
Consumption (bcm) 10.3 10.1 14.3 18.3 19.5 26.8 39.6 57.1 59.4 60.2 61.1 66.6
Proven reserves (bcm) 718.0 707.9 697.4 686.0 673.4 653.5 627.8 598.5 568.4 538.8 509.7 481.2
Reserves to production (years) 70.0 70.2 66.5 60.0 53.5 32.9 24.4 20.5 18.9 18.2 17.5 16.9
Source: ENI, KB Securities Vietnam
0
10
20
30
40
50
60
70
New
Guinea
East Timor Phillipines Thailand Cambodia Indonesia Malaysia Myanmar Vietnam Brunei
(USD/barrel)
Current Brent price
Page 8
KB SECURITIES VIETNAM
8
Oil production at Vietnam’s major
oil fields peaked in 2015
Vietnam’s major oil fields have reached maturity and production output has
fallen continuously since 2015. The last big new oil discovery was the Red
Emperor project in the Nam Con Son basin located off the southern shore that
potentially offered 30 thousand barrels of crude oil per day and 0.62 billion
cubic metres of gas per year. Drilling originally began in 2017 but was cancelled
in March 2018 due to offshore tensions. This led to a sharp slowdown in
exploration & production (E&P) activities and pushed Vietnam’s upstream
segment into a sunset era. Moreover, Vietnam’s older fields have proven harder
to extract reserves, which has led to a continual rise in the reserves to
production over the past several years.
Fig 5. Vietnam oil & gas – Production, consumption & reserves to production
forecasts, 2010-2028E (barrels per day, years)
Note: Historical consumption (2010-2019) = Production (P) + Import (M) – Export (X)
Source: General Statistics Office Vietnam, KB Securities Vietnam
Production output at existing
fields to fall continuously
Bach Ho: Once Vietnam’s largest and now only producing about 54.2 thousand
barrels per day or 27% of Vietnam’s total output. At its peak proven reserves
were 3.7 billion barrels of crude oil and this field entered lower production from
2006 after 30 years of production. Bach Ho (White Tiger) is located in the Cuu
Long basin located due south of the Mekong Delta and is operated by
VietsovPetro (a joint venture between Vietnam and Russia).
Rang Dong: A smaller field that produces 12-15 thousand barrels per day or
6% of total crude oil output. Output was as high as 140,000 barrels per day
when the field first started production over 20 years ago. The field is also
located in the Cuu Long basin on Block 15-2 and is operated by JX Nippon Oil &
Energy Corporation at 46.5% ownership.
Su Tu: Now Vietnam’s largest producer at 70.3 thousand barrels per day or 35%
of total crude oil output. The cluster of fields is located in Block 15-1 in the
Cuu Long basin and operated by Cuu Long JOC. Major fields include Su Tu Den
(Black Lion), Su Tu Vang (Yellow Lion), Su Tu Trang (White Lion) and Su Tu Nau
(Brown Lion) with the entire area possessing 2 billion barrels of proven reserves.
0
10
20
30
40
50
60
70
80
0
50,000
100,000
150,000
200,000
250,000
300,000
350,000
400,000
450,000
(years)(bbl/day) Production (left) Consumption (left) Reserves to production (right)
Nghi Son Refinery startup
Page 9
KB SECURITIES VIETNAM
9
Other fields: Vietnam’s other major fields generate about 62.7 thousand barrels
per day or 31% of total output. Major fields include Dai Hung, Hong Ngoc
(Ruby) and Te Giac Trang (White Rhino) that have been producing for more
than 20 years. Dai Hung is located in the Nam Con Son basin off the southern
shore and operated by PetroVietnam Exploration Production (PVEP), while Te
Giac Trang is located in Block 16-1 in the Cuu Long basin and operated by
Hoang Long JOC.
Table 4. Vietnam oil & gas – Crude oil production by field, 2019-2030E (thousand barrels per day)
Field/year (thou bbl/day) 19 20E 21E 22E 23E 24E 25E 26E 27E 28E 29E 30E
Bach Ho 167 155 143 131 123 114 106 98 90 84 78 72
Rang Dong 66 60 54 48 42 38 34 30 26 24 22 20
Su Tu 84 78 72 66 60 54 48 42 46 50 54 58
Others 23 27 48 64 76 100 148 167 151 179 153 124
Total crude output 340 321 317 309 301 307 337 337 314 338 307 274
Source: KB Securities Vietnam
Fig 6. Vietnam oil & gas - Production output by field, 2006-2030E (thousands
barrels per day)
Source: ENI, General Statistics Office Vietnam, KB Securities Vietnam estimates
Vietnam inevitably turning to more
oil imports
Vietnam has inevitably turned to imports and became a net importer of oil in
2018 when the Nghi Son Refinery (NSR) entered commercial production using
Kuwaiti oil feedstock. Unlike Binh Son Refinery’s Dung Quat refinery that
primarily uses locally-produced oil from the Bach Ho field, the Nghi Son
Refinery exclusively uses imported Kuwaiti crude oil. The Dung Quat refinery
has also started to diversify its feedstock this year and has also started use
imported crude oil due to dwindling local reserves.
0
50
100
150
200
250
300
350
400
06 07 08 09 10 11 12 13 14 15 16 17 18 19 20E 21E 22E 23E 24E 25E 26E 27E 28E 29E 30E
(thou bbl/day) Bach Ho Rang Dong Su Tu Others
Page 10
KB SECURITIES VIETNAM
10
Fig 7. Vietnam oil & gas – Crude oil exports & imports, 2010-2019 (barrels per day)
Source: General Statistics Office Vietnam, KB Securities Vietnam
Natural gas fields also witnessing
falling output
Vietnam’s existing gas fields are also witnessing a similar situation of falling
production volumes after peaking in 2018. We estimate that Vietnam’s gas
output could drop by almost half to 5.8 billion cubic metres from 10.1 billion
cubic metres now by 2030E if no new major gas fields come online. Growing
nationwide electricity demand – and adverse weather conditions in the
southern regions that reduced reserves at hydroelectric power plants – forced
Vietnam to increase natural gas output over the past several years to boost
supply to gas-fired power plants. This led to overproduction at most gas fields
that is now slowing production volumes at existing gas fields.
Table 5. Vietnam oil & gas – Gas production by basin (assuming no new fields), 2019-2030E (billion cubic metres)
Basins/years (bcm) 19 20E 21E 22E 23E 24E 25E 26E 27E 28E 29E 30E
Cuu Long 1.1 1.0 0.9 0.8 0.7 0.6 0.5 0.5 0.4 0.3 0.2 0.1
Nam Con Son 7.0 7.0 6.8 6.5 6.3 6.0 5.8 5.5 5.3 5.0 4.8 4.5
Malay-Tho Chu 2.1 2.0 2.0 2.0 1.9 1.8 1.7 1.6 1.5 1.4 1.3 1.2
Song Hong 0.1 0.1 0.1 0.1 0.1 0.1 0.1 0.0 0.0 0.0 0.0 0.0
Total gas output 10.3 10.1 9.7 9.4 8.9 8.5 8.0 7.6 7.2 6.7 6.3 5.8
Source: KB Securities Vietnam
Fig 8. Vietnam oil & gas – Natural gas production by basis (assuming no new fields),
2019-2030E (billions of cubic metres)
Source: PV Gas, General Statistic Office Vietnam, KB Securities Vietnams
0
20,000
40,000
60,000
80,000
100,000
120,000
140,000
160,000
180,000
200,000
2010 2011 2012 2013 2014 2015 2016 2017 2018 2019
(barrels per day) Export Import Vietnam turned into a net importer when Nghi
Son Refinery began importing Kuwaiti oil
0
2
4
6
8
10
12
09 10 11 12 13 14 15 16 17 18 19 20E 21E 22E 23E 24E 25E 26E 27E 28E 29E 30E
(bcm) Cuu Long Nam Con Son Malay-Tho Chu Song Hong
Page 11
KB SECURITIES VIETNAM
11
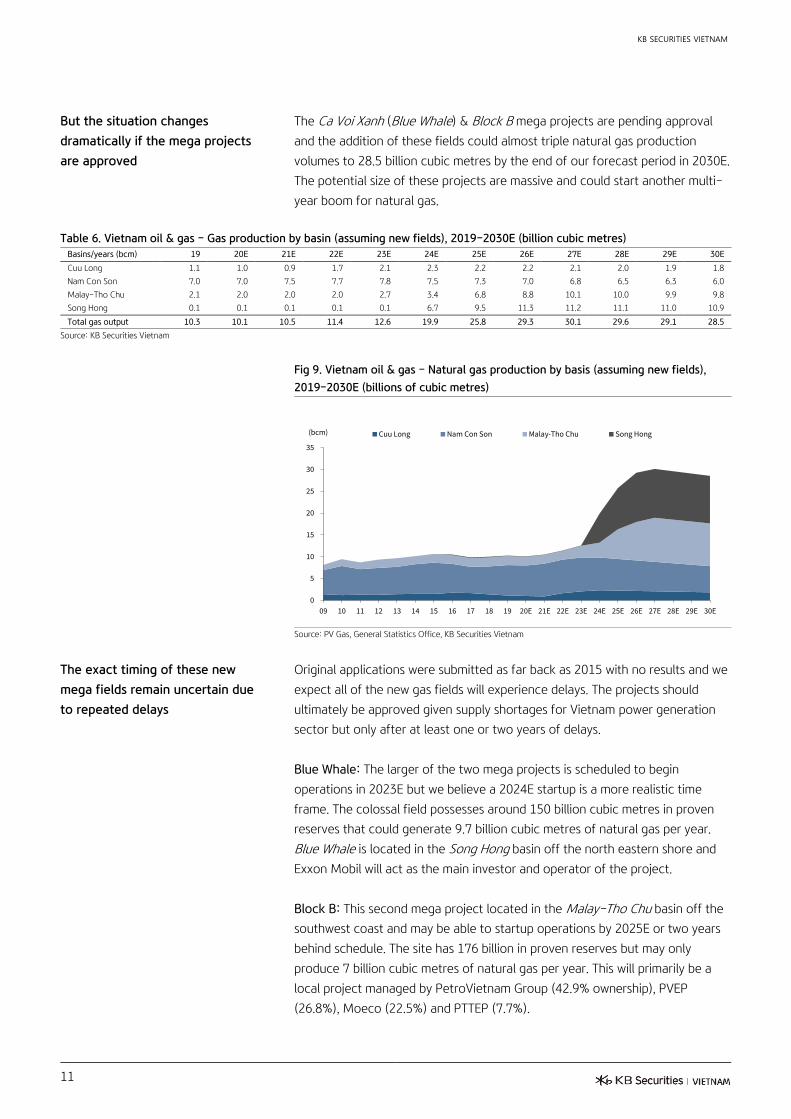
But the situation changes
dramatically if the mega projects
are approved
The Ca Voi Xanh (Blue Whale) & Block B mega projects are pending approval
and the addition of these fields could almost triple natural gas production
volumes to 28.5 billion cubic metres by the end of our forecast period in 2030E.
The potential size of these projects are massive and could start another multi-
year boom for natural gas.
Table 6. Vietnam oil & gas – Gas production by basin (assuming new fields), 2019-2030E (billion cubic metres)
Basins/years (bcm) 19 20E 21E 22E 23E 24E 25E 26E 27E 28E 29E 30E
Cuu Long 1.1 1.0 0.9 1.7 2.1 2.3 2.2 2.2 2.1 2.0 1.9 1.8
Nam Con Son 7.0 7.0 7.5 7.7 7.8 7.5 7.3 7.0 6.8 6.5 6.3 6.0
Malay-Tho Chu 2.1 2.0 2.0 2.0 2.7 3.4 6.8 8.8 10.1 10.0 9.9 9.8
Song Hong 0.1 0.1 0.1 0.1 0.1 6.7 9.5 11.3 11.2 11.1 11.0 10.9
Total gas output 10.3 10.1 10.5 11.4 12.6 19.9 25.8 29.3 30.1 29.6 29.1 28.5
Source: KB Securities Vietnam
Fig 9. Vietnam oil & gas – Natural gas production by basis (assuming new fields),
2019-2030E (billions of cubic metres)
Source: PV Gas, General Statistics Office, KB Securities Vietnam
The exact timing of these new
mega fields remain uncertain due
to repeated delays
Original applications were submitted as far back as 2015 with no results and we
expect all of the new gas fields will experience delays. The projects should
ultimately be approved given supply shortages for Vietnam power generation
sector but only after at least one or two years of delays.
Blue Whale: The larger of the two mega projects is scheduled to begin
operations in 2023E but we believe a 2024E startup is a more realistic time
frame. The colossal field possesses around 150 billion cubic metres in proven
reserves that could generate 9.7 billion cubic metres of natural gas per year.
Blue Whale is located in the Song Hong basin off the north eastern shore and
Exxon Mobil will act as the main investor and operator of the project.
Block B: This second mega project located in the Malay-Tho Chu basin off the
southwest coast and may be able to startup operations by 2025E or two years
behind schedule. The site has 176 billion in proven reserves but may only
produce 7 billion cubic metres of natural gas per year. This will primarily be a
local project managed by PetroVietnam Group (42.9% ownership), PVEP
(26.8%), Moeco (22.5%) and PTTEP (7.7%).
0
5
10
15
20
25
30
35
09 10 11 12 13 14 15 16 17 18 19 20E 21E 22E 23E 24E 25E 26E 27E 28E 29E 30E
(bcm) Cuu Long Nam Con Son Malay-Tho Chu Song Hong
Page 12
KB SECURITIES VIETNAM
12
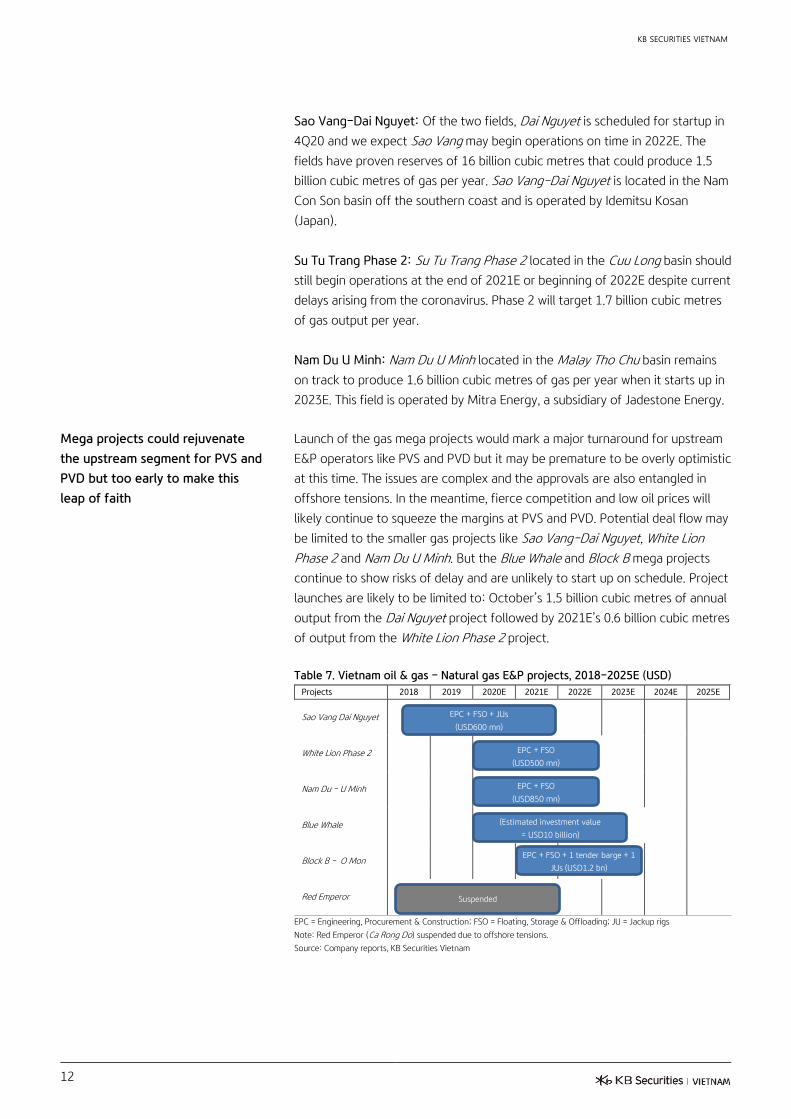
Sao Vang–Dai Nguyet: Of the two fields, Dai Nguyet is scheduled for startup in
4Q20 and we expect Sao Vang may begin operations on time in 2022E. The
fields have proven reserves of 16 billion cubic metres that could produce 1.5
billion cubic metres of gas per year. Sao Vang-Dai Nguyet is located in the Nam
Con Son basin off the southern coast and is operated by Idemitsu Kosan
(Japan).
Su Tu Trang Phase 2: Su Tu Trang Phase 2 located in the Cuu Long basin should
still begin operations at the end of 2021E or beginning of 2022E despite current
delays arising from the coronavirus. Phase 2 will target 1.7 billion cubic metres
of gas output per year.
Nam Du U Minh: Nam Du U Minh located in the Malay Tho Chu basin remains
on track to produce 1.6 billion cubic metres of gas per year when it starts up in
2023E. This field is operated by Mitra Energy, a subsidiary of Jadestone Energy.
Mega projects could rejuvenate
the upstream segment for PVS and
PVD but too early to make this
leap of faith
Launch of the gas mega projects would mark a major turnaround for upstream
E&P operators like PVS and PVD but it may be premature to be overly optimistic
at this time. The issues are complex and the approvals are also entangled in
offshore tensions. In the meantime, fierce competition and low oil prices will
likely continue to squeeze the margins at PVS and PVD. Potential deal flow may
be limited to the smaller gas projects like Sao Vang–Dai Nguyet, White Lion
Phase 2 and Nam Du U Minh. But the Blue Whale and Block B mega projects
continue to show risks of delay and are unlikely to start up on schedule. Project
launches are likely to be limited to: October’s 1.5 billion cubic metres of annual
output from the Dai Nguyet project followed by 2021E’s 0.6 billion cubic metres
of output from the White Lion Phase 2 project.
Table 7. Vietnam oil & gas – Natural gas E&P projects, 2018-2025E (USD)
Projects 2018 2019 2020E 2021E 2022E 2023E 2024E 2025E
Sao Vang Dai Nguyet
White Lion Phase 2
Nam Du - U Minh
Blue Whale
Block B - O Mon
Red Emperor
EPC = Engineering, Procurement & Construction; FSO = Floating, Storage & Offloading; JU = Jackup rigs
Note: Red Emperor (Ca Rong Do) suspended due to offshore tensions.
Source: Company reports, KB Securities Vietnam
EPC + FSO
(USD850 mn)
(Estimated investment value
= USD10 billion)
EPC + FSO + JUs
(USD600 mn)
EPC + FSO
(USD500 mn)
EPC + FSO + 1 tender barge + 1
JUs (USD1.2 bn)
Suspended
Page 13
KB SECURITIES VIETNAM
13
Downstream segments remain the
bright spots in Vietnam’s oil & gas
industry
We believe the bright spots for Vietnam’s oil & gas sector continue to be
growing industrial and consumer demand in the downstream segments. But
markets are young and data sparse. Importantly, major downstream players
have dominant positions in key markets. BSR and NSR should benefit from
growing consumer demand for gasoline and commercial demand for diesel.
Both are also poised to capture growing industrial demand as Vietnam begins to
localize petrochemical production. PLX has a dominant market position in retail
distribution, with Vietnam’s largest directly-owned gas station network. Its
nationwide coverage is well positioned to capture the growth in consumer
gasoline usage as the country narrows the gap in annual per-capita
consumption against peers like Thailand and Indonesia.
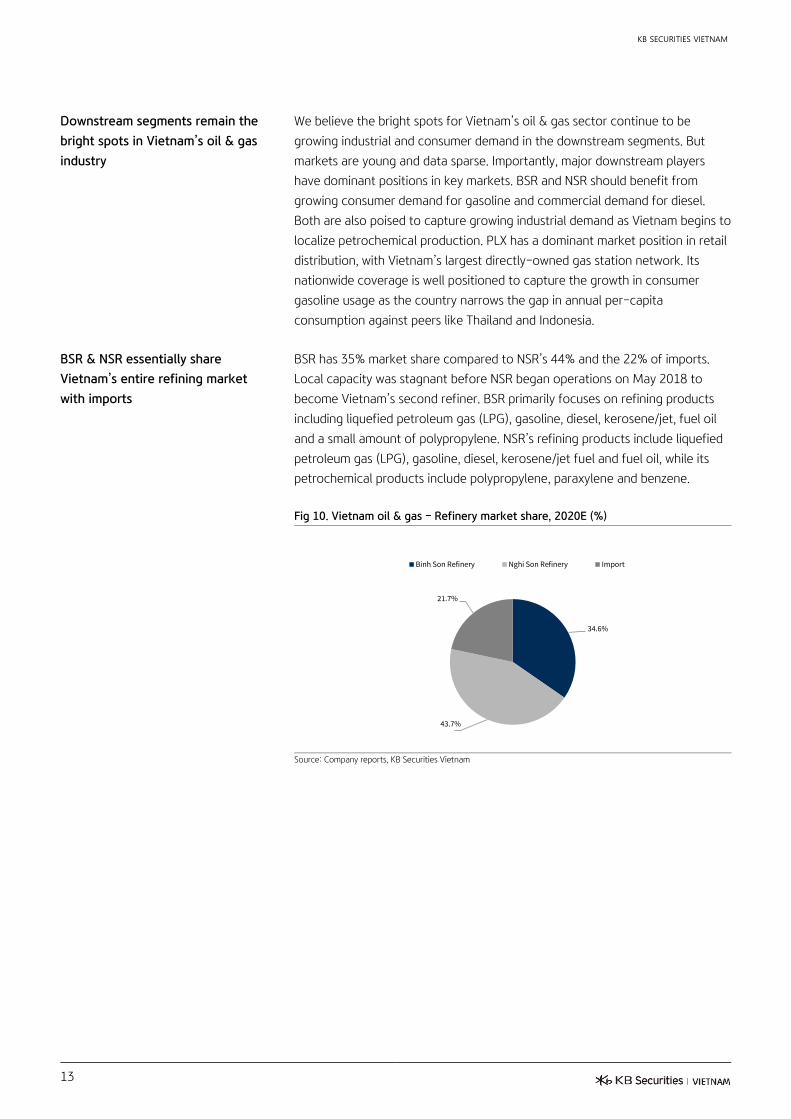
BSR & NSR essentially share
Vietnam’s entire refining market
with imports
BSR has 35% market share compared to NSR’s 44% and the 22% of imports.
Local capacity was stagnant before NSR began operations on May 2018 to
become Vietnam’s second refiner. BSR primarily focuses on refining products
including liquefied petroleum gas (LPG), gasoline, diesel, kerosene/jet, fuel oil
and a small amount of polypropylene. NSR’s refining products include liquefied
petroleum gas (LPG), gasoline, diesel, kerosene/jet fuel and fuel oil, while its
petrochemical products include polypropylene, paraxylene and benzene.
Fig 10. Vietnam oil & gas – Refinery market share, 2020E (%)
Source: Company reports, KB Securities Vietnam
34.6%
43.7%
21.7%
Binh Son Refinery Nghi Son Refinery Import
Page 14
KB SECURITIES VIETNAM
14
PLX controls Vietnam’s largest gas
station network
PLX controls 44% of Vietnam’s retail gasoline market with the country’s largest
nationwide gas station network. PV Oil ranks second at 23% and is the only
other operator offering nationwide coverage. Regional players include Saigon
Petro focusing on the south-central coast and south-western areas; Thalexim
operating in the Binh Duong province just north of Ho Chi Minh City containing
an extremely important road network comprised of several of the country’s
major highways; and Mipec the military gas station network operating in the
northern region.
Fig 11. Vietnam oil & gas – Retail gasoline market share, 2020E (%)
Source: Company reports, KB Securities Vietnam
Vietnam’s annual per-capita
consumption of gasoline has
plenty of room to grow
Vietnam’s annual per-capita consumption of gasoline was only 77 litres in 2019
compared to Thailand’s 106 litres and Indonesia’s 124 litres. Part of this
disparity can be explained by respective fuel costs between countries, with
Vietnam requiring 12% of monthly pay to fill a 40-litre tank of gasoline vs
Thailand’s 6% and Indonesia’s 8%. This implies Vietnam’s growing income levels
could narrow the gap in gasoline consumption to Southeast Asian peers.
Fig 12. Asia oil & gas – Annual per-capita gasoline
consumption by country, 2019 (annual litres per capita)
Fig 13. Asia oil & gas – Percent of monthly income to fill 40-
litre tank of gasoline, 2019 (%)
Source: Global Petrol Prices, KB Securities Vietnam Source: Global Petrol Prices, KB Securities Vietnam
44.0%
22.5%
6.0%
6.0%
6.0%
15.5%
PLX PV Oil Saigon Petro Thalexim Mipec Others
0 50 100 150 200 250 300 350 400 450 500
Vietnam
Philippines
Indonesia
Thailand
Hong Kong
China
Singapore
Malaysia
Japan
Korea
(annual litres per capita)
0.0% 2.0% 4.0% 6.0% 8.0% 10.0% 12.0% 14.0% 16.0% 18.0%
Vietnam
Philippines
Indonesia
Thailand
Hong Kong
China
Singapore
Malaysia
Japan
Korea
(% of monthly income)
Page 15
KB SECURITIES VIETNAM
15
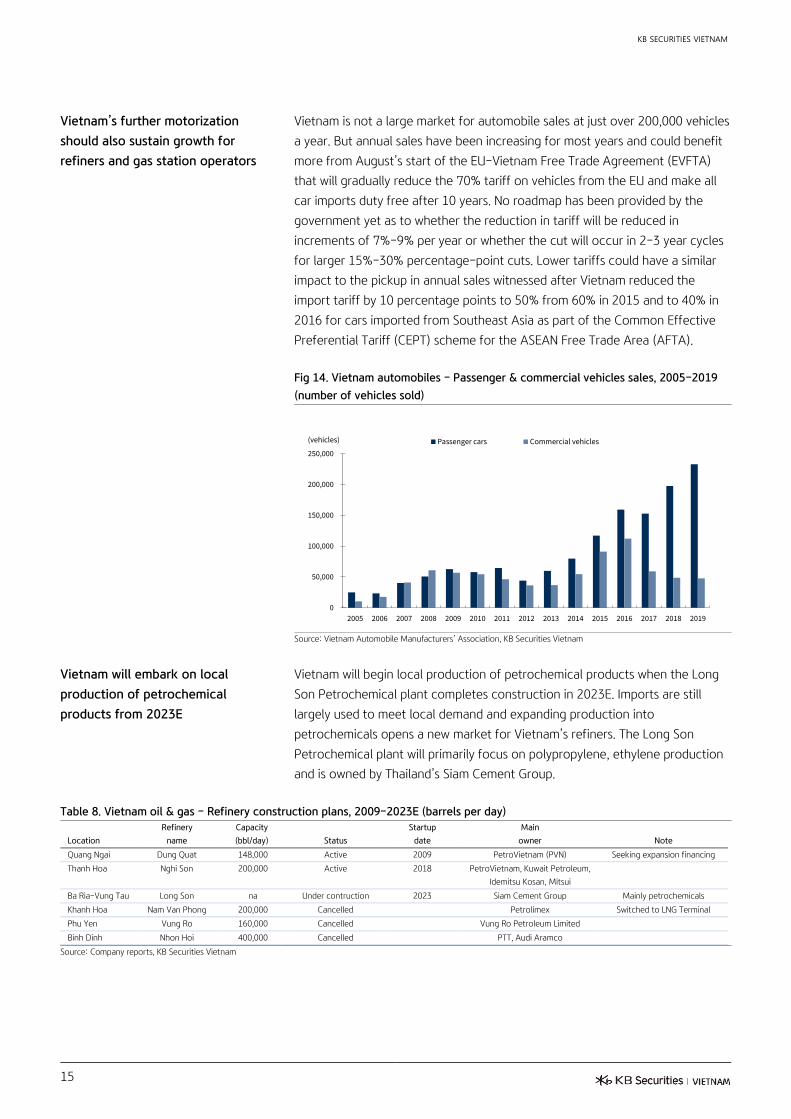
Vietnam’s further motorization
should also sustain growth for
refiners and gas station operators
Vietnam is not a large market for automobile sales at just over 200,000 vehicles
a year. But annual sales have been increasing for most years and could benefit
more from August’s start of the EU-Vietnam Free Trade Agreement (EVFTA)
that will gradually reduce the 70% tariff on vehicles from the EU and make all
car imports duty free after 10 years. No roadmap has been provided by the
government yet as to whether the reduction in tariff will be reduced in
increments of 7%-9% per year or whether the cut will occur in 2-3 year cycles
for larger 15%-30% percentage-point cuts. Lower tariffs could have a similar
impact to the pickup in annual sales witnessed after Vietnam reduced the
import tariff by 10 percentage points to 50% from 60% in 2015 and to 40% in
2016 for cars imported from Southeast Asia as part of the Common Effective
Preferential Tariff (CEPT) scheme for the ASEAN Free Trade Area (AFTA).
Fig 14. Vietnam automobiles – Passenger & commercial vehicles sales, 2005-2019
(number of vehicles sold)
Source: Vietnam Automobile Manufacturers’ Association, KB Securities Vietnam
Vietnam will embark on local
production of petrochemical
products from 2023E
Vietnam will begin local production of petrochemical products when the Long
Son Petrochemical plant completes construction in 2023E. Imports are still
largely used to meet local demand and expanding production into
petrochemicals opens a new market for Vietnam’s refiners. The Long Son
Petrochemical plant will primarily focus on polypropylene, ethylene production
and is owned by Thailand’s Siam Cement Group.
Table 8. Vietnam oil & gas – Refinery construction plans, 2009-2023E (barrels per day)
Refinery Capacity Startup Main Location name (bbl/day) Status date owner Note
Quang Ngai Dung Quat 148,000 Active 2009 PetroVietnam (PVN) Seeking expansion financing
Thanh Hoa Nghi Son 200,000 Active 2018 PetroVietnam, Kuwait Petroleum,
Idemitsu Kosan, Mitsui
Ba Ria-Vung Tau Long Son na Under contruction 2023 Siam Cement Group Mainly petrochemicals
Khanh Hoa Nam Van Phong 200,000 Cancelled Petrolimex Switched to LNG Terminal
Phu Yen Vung Ro 160,000 Cancelled Vung Ro Petroleum Limited
Binh Dinh Nhon Hoi 400,000 Cancelled PTT, Audi Aramco
Source: Company reports, KB Securities Vietnam
0
50,000
100,000
150,000
200,000
250,000
2005 2006 2007 2008 2009 2010 2011 2012 2013 2014 2015 2016 2017 2018 2019
(vehicles) Passenger cars Commercial vehicles
Page 16
KB SECURITIES VIETNAM
16
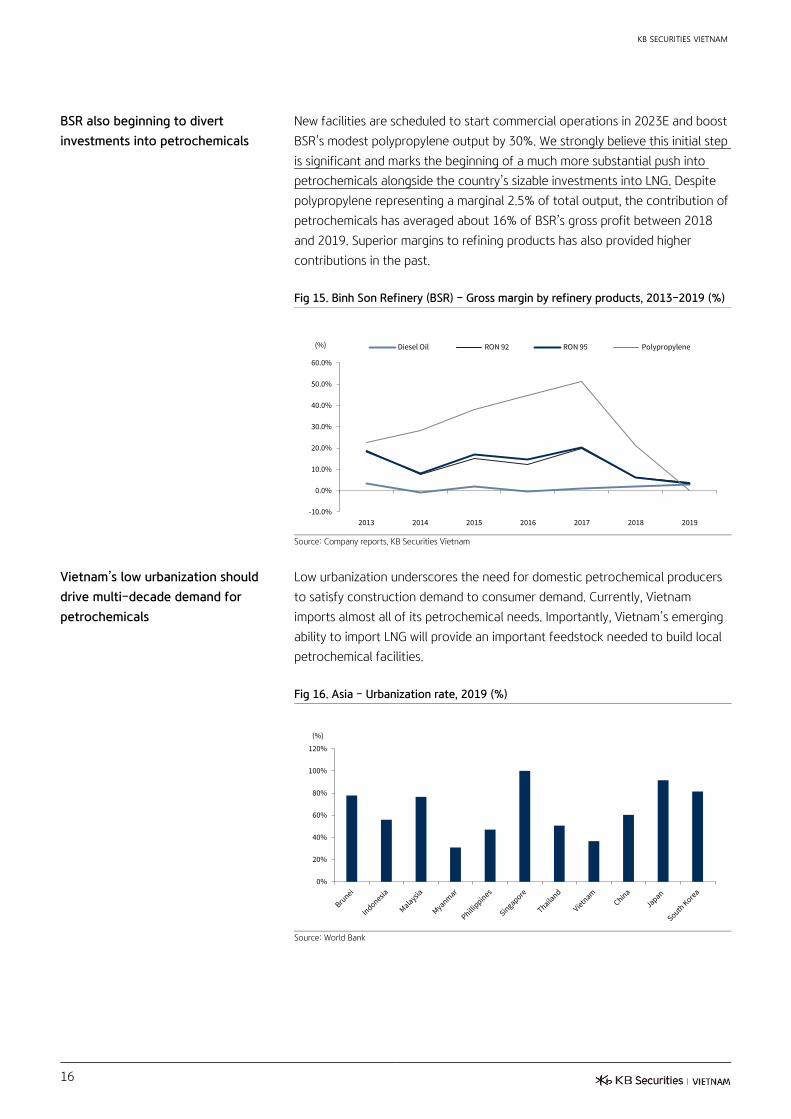
BSR also beginning to divert
investments into petrochemicals
New facilities are scheduled to start commercial operations in 2023E and boost
BSR’s modest polypropylene output by 30%. We strongly believe this initial step
is significant and marks the beginning of a much more substantial push into
petrochemicals alongside the country’s sizable investments into LNG. Despite
polypropylene representing a marginal 2.5% of total output, the contribution of
petrochemicals has averaged about 16% of BSR’s gross profit between 2018
and 2019. Superior margins to refining products has also provided higher
contributions in the past.
Fig 15. Binh Son Refinery (BSR) – Gross margin by refinery products, 2013-2019 (%)
Source: Company reports, KB Securities Vietnam
Vietnam’s low urbanization should
drive multi-decade demand for
petrochemicals
Low urbanization underscores the need for domestic petrochemical producers
to satisfy construction demand to consumer demand. Currently, Vietnam
imports almost all of its petrochemical needs. Importantly, Vietnam’s emerging
ability to import LNG will provide an important feedstock needed to build local
petrochemical facilities.
Fig 16. Asia – Urbanization rate, 2019 (%)
Source: World Bank
-10.0%
0.0%
10.0%
20.0%
30.0%
40.0%
50.0%
60.0%
2013 2014 2015 2016 2017 2018 2019
(%) Diesel Oil RON 92 RON 95 Polypropylene
0%
20%
40%
60%
80%
100%
120%
(%)
Page 17
KB SECURITIES VIETNAM
17
Binh Son Refinery (BSR) – Three-stage dividend discount model
3-STAGE DDM
PV OF DIVIDENDS
Sustainable growth
Cost of Equity 1.7% 2.2% 2.7% 3.2% 3.7% 4.2% 4.7%
14.1% 37,138 38,320 39,605 41,008 42,546 44,239 46,112
14.6% 35,108 36,165 37,310 38,556 39,916 41,407 43,048
15.1% 33,250 34,198 35,222 36,332 37,540 38,859 40,304
15.6% 31,544 32,397 33,316 34,309 35,386 36,557 37,835
16.1% 29,975 30,744 31,571 32,462 33,425 34,469 35,605
16.6% 28,527 29,223 29,970 30,771 31,635 32,569 33,581
17.1% 27,189 27,821 28,496 29,219 29,997 30,835 31,740
PV OF EQUITY PER SHARE
Sustainable growth
Cost of Equity 1.7% 2.2% 2.7% 3.2% 3.7% 4.2% 4.7% Ex-growth
14.1% 12,000 12,400 12,800 13,200 13,700 14,300 14,900 0.5x
14.6% 11,300 11,700 12,000 12,400 12,900 13,400 13,900 5,100
15.1% 10,700 11,000 11,400 11,700 12,100 12,500 13,000 -13.6%
15.6% 10,200 10,400 10,700 11,100 11,400 11,800 12,200 Mid-cycle
16.1% 9,700 9,900 10,200 10,500 10,800 11,100 11,500 0.8x
16.6% 9,200 9,400 9,700 9,900 10,200 10,500 10,800 8,100
17.1% 8,800 9,000 9,200 9,400 9,700 9,900 10,200 37.3%
Projected Distributions
(VNDbn) 2015A 2016A 2017A 2018A 2019A 2020E 2021E 2022E 2023E 2024E 2025E
Net income 6,176 4,483 7,711 3,606 2,914 -2,942 3,355 3,705 4,280 5,244 6,386
Preferred dividend paid - cash 0 0 0 0 0 0 0 0 0 0 0
Preferred dividend per share 0 0 0 0 0 0 0 0 0 0 0
% of par value 0.0% 0.0% 0.0% 0.0% 0.0% 0.0% 0.0% 0.0% 0.0% 0.0% 0.0%
Internally-generated capital 6,176 4,483 7,711 3,606 2,914 -2,942 3,355 3,705 4,280 5,244 6,386
Less: capital @ 20% D/E -5,017 -579 -451 -819 -767 458 118 445 322 3 3
Cash for dividends/buybacks 11,193 5,062 8,161 4,425 3,680 0 3,237 3,260 3,958 5,241 6,383
Common dividend paid - cash 0 0 0 0 508 0 496 1,240 1,488 1,860 2,480
Common dividend per share 0 0 0 0 164 0 160 400 480 600 800
% of par value 0.0% 0.0% 0.0% 0.0% 1.6% 0.0% 1.6% 4.0% 4.8% 6.0% 8.0%
Payout ratio 0.0% 0.0% 0.0% 0.0% 17.4% 0.0% 14.8% 33.5% 34.8% 35.5% 38.8%
Net share buybacks 0 0 713 0 0 0 0 0 0 0 0
Total distributions 0 0 713 0 508 0 496 1,240 1,488 1,860 2,480
Net distribution ratio (%) 0.0% 0.0% 9.3% 0.0% 17.4% 0.0% 14.8% 33.5% 34.8% 35.5% 38.8%
Discount factor 0.00 0.00 0.00 0.00 0.00 1.08 1.25 1.44 1.67 1.93 2.23
Present value 0 0 0 0 0 0 398 861 893 966 1,114
Cost of equity Terminal Assumptions Share Information
Risk free rate 3.0% Sustainable ROE 8.0% PV of future dividend flows (VNDbn) 4,231
Equity risk premium 8.9% Dividend payout ratio 60.0% PV of terminal value (VNDbn) 30,078
Unlevered beta 1.221 Sustainable growth 3.2% Terminal value as % of firm value 87.7%
Re-levered beta 1.417 Forecast period growth 49.5% Current shares outstanding (mn) 3,100.5
Cost of equity 15.6% Target gearing 20.0% Statutory corporate tax rate 20.0%
Forecast period 5 Yrs Transition period 10 Yrs
Memorandum
(VNDbn) 2015A 2016A 2017A 2018A 2019A 2020E 2021E 2022E 2023E 2024E 2025E
Reported common equity 31,747 32,884 34,358 31,378 34,054 30,960 33,836 36,320 39,133 42,543 46,481
Debt/equity ratio 61.0% 50.1% 41.4% 32.3% 18.5% 27.7% 27.1% 31.4% 33.3% 30.6% 28.1%
Debt 19,374 16,479 14,226 10,131 6,299 8,588 9,178 11,402 13,012 13,028 13,044
YoY % Change -56.4% -14.9% -13.7% -28.8% -37.8% 36.3% 6.9% 24.2% 14.1% 0.1% 0.1%
Source: Company reports, KB Securities Vietnam
Page 18
KB SECURITIES VIETNAM
18
Binh Son Refinery (BSR) – Summarized financials & forecasts, 2019-2022E
Income statement Balance sheet
(VNDbn) 2019A 2020E 2021E 2022E (VNDbn) 2019A 2020E 2021E 2022E
Net sales 102,824 61,429 90,819 95,360 Total assets 53,584 49,930 56,268 61,602
Cost of sales 98,851 63,288 85,692 89,759 Current assets 26,896 24,198 31,840 37,028
Gross Profit 3,973 (1,859) 5,127 5,601 Cash & equivalents 8,352 2,982 8,077 8,065
Financial income 537 627 473 473 ST investments 4 2 3 5
Financial expenses 416 828 989 1,051 Accounts receivable 9,972 7,774 10,106 10,612
of which: interest expenses 360 355 386 449 Inventory 8,515 13,302 13,475 18,158
Gain/(loss) from joint ventures 0 0 0 0 Other current assets 52 138 180 189
Selling expenses 714 667 908 954 Long-term assets 26,688 25,732 24,428 24,574
General & admin expenses 389 173 156 150 LT trade receivables 534 777 1,011 1,061
Operating profit/(loss) 2,990 (2,901) 3,547 3,919 Fixed assets 24,848 24,568 22,649 22,759
Other income 69 35 54 56 Investment properties 0 0 0 0
Other expense 4 2 3 4 LT incomplete assets 1,026 58 344 309
Net other income/(expenses) 65 33 50 53 LT investments 10 11 11 11
Pretax profit/(loss) 3,054 (2,868) 3,598 3,972 Goodwill 0 0 0 0
Income tax 181 89 225 249 Other LT assets 271 318 413 434
Net profit/(loss) 2,873 (2,957) 3,372 3,723 Liabilities 19,530 18,970 22,432 25,283
Minority interests (41) (15) 17 19 Current liabilities 12,916 11,932 14,185 15,327
Net profit after MI 2,914 (2,942) 3,355 3,705 Trade accounts payable 8,674 4,640 5,854 6,121
Advances from customers 4 6 8 9
Operating ratios ST borrowings 1,106 3,617 3,617 4,267
(%) 2019A 2020E 2021E 2022E Special reserves 120 215 215 215
Revenue growth (8.2) (40.3) 47.8 5.0 Other current liabilities 3,012 3,455 4,492 4,716
EBIT growth (27.4) (194.1) (250.5) 10.7 Long-term liabilities 6,614 7,037 8,247 9,955
EBITDA growth (21.5) (110.7) nm 5.2 LT payables 0 0 0 0
NP after MI growth (19.2) (201.0) (214.0) 10.4 LT borrowings 5,192 4,971 5,561 7,135
Gross profit margin 3.9 (3.0) 5.6 5.9 Other LT liabilities 1,422 2,066 2,686 2,820
EBITDA margin 5.2 (0.9) 7.3 7.3 Shareholders' equity 34,054 30,960 33,836 36,320
EBIT margin 2.8 (4.4) 4.5 4.7 Paid-in capital 31,005 31,005 31,005 31,005
Pre-tax profit margin 3.0 (4.7) 4.0 4.2 Share premium 0 0 0 0
Net profit margin 2.8 (4.8) 3.7 3.9 Treasury stock 0 0 0 0
Undistributed earnings 2,975 (95) 2,781 5,264
Cash flow Reserve & others 3 3 3 3
(VNDbn) 2019A 2020E 2021E 2022E Minority interests 71 48 48 48
Net profit 2,873 (2,957) 3,372 3,723 Total liabilities & equity 53,584 49,930 56,268 61,602
Plus: depreciation & amort 2,513 2,227 2,593 2,505
Plus: investing (profit)/loss (340) (352) (351) (351) Key ratios
Change in working capital 1,166 (6,508) (527) (4,755) (x, %, VND) 2019A 2020E 2021E 2022E
(Inc)/dec - receivables (1,019) 1,954 (2,565) (556) Valuations
(Inc)/dec - inventory 711 (4,787) (173) (4,683) P/E 6.1 (6.0) 5.3 4.8
(Inc)/dec - other curr assets 27 (87) (41) (9) P/E diluted 6.1 (6.0) 5.3 4.8
Inc/(dec) - payables 205 (4,034) 1,214 267 P/B 0.5 0.6 0.5 0.5
Inc/(dec) - advances (9) 2 2 1 P/S 0.2 0.3 0.2 0.2
Inc/(dec) - other curr liab 1,252 443 1,037 225 EV/EBITDA 3.3 (31.2) 2.7 2.5
Other adj for operations 2,916 (3,912) (448) 1,544 EV/EBIT 6.2 (6.5) 4.3 3.9
Operating cash flow 4,937 (6,178) 5,320 1,368 Dividend yield, ordinary (%) 2.9 0.0 2.8 7.0
ST investments 0 2 (1) (2) EPS 940 (949) 1,082 1,195
Capital expenditures (13) (884) (960) (2,580) BVPS 10,983 9,986 10,913 11,714
Investment properties 0 0 0 0 SPS 33,164 19,813 29,292 30,756
Investment in subsidiaries 0 0 0 0 DPS (annual, ordinary) 164 0 160 400
Other assets 77 (48) (95) (21) Dividend payout ratio (%) 17.4 0.0 14.8 33.5
Other adj for investments (7) 435 546 546 Operating performance
Investing cash flow 57 (495) (511) (2,057) ROE 8.9 -9.1 10.4 10.6
Free cash flow 4,924 (7,062) 4,360 (1,213) ROA 5.5 -5.7 6.3 6.3
Issuance/(repayment) of debt (2,123) (221) 590 1,574 ROIC 8.1 -8.3 11.0 11.7
ST debt (1,710) 2,511 0 650 Financial structure
Other liabilities 3 645 620 134 Total liab/equity 57.4 61.3 66.3 69.6
Issuance/(retirement) of equity 0 0 0 0 Net debt/equity (6.0) 18.1 3.3 9.2
Dividends paid (508) 0 (496) (1,240) Current ratio (x) 2.1 2.0 2.2 2.4
Less: changes in equity 311 (136) 0 0 Interest coverage (x) 8.0 (7.6) 10.5 10.0
Other adj for financing 1,623 (1,495) (428) (440) Activity ratios
Financing cash flow (2,404) 1,302 286 678 Asset turnover 1.9 1.2 1.7 1.6
Net increase in cash & equivalents 2,590 (5,371) 5,095 (12) Receivables turnover 10.9 6.9 10.2 9.2
Cash & equivalents - beginning 5,762 8,352 2,982 8,077 Inventory turnover 11.6 5.6 6.8 6.0
Cash & equivalents - ending 8,352 2,982 8,077 8,065 Payables turnover 12.0 9.2 17.3 15.9
Source: Company reports, KB Securities Vietnam
Page 19
KB SECURITIES VIETNAM RESEARCH
Head of Research – Nguyen Xuan Binh
[email protected]
Macro/Strategy
Head of Macro & Strategy – Tran Duc Anh
[email protected]
Macro Analyst – Thai Thi Viet Trinh
[email protected]
Market Strategist – Le Anh Tung
[email protected]
Equity (Hanoi)
Head of Equity Research (Hanoi) – Duong Duc Hieu
[email protected]
Information Technology & Logistics Analyst – Nguyen Anh Tung
[email protected]
Property Analyst – Pham Hoang Bao Nga
[email protected]
Power & Construction Material Analyst – Le Thanh Cong
[email protected]
Financials Analyst – Nguyen Thi Thu Huyen
[email protected]
Equity (Ho Chi Minh)
Head of Equity Research (Ho Chi Minh) – Harrison Kim
[email protected]
Consumer & Retailing Analyst – Dao Phuc Phuong Dung
[email protected]
Fisheries & Pharmaceuticals Analyst – Nguyen Thanh Danh
[email protected]
Oil & Gas & Chemicals Analyst – Nguyen Vinh
[email protected]
Research Marketing
Korea Marketing Analyst – Seon Yeong Shin
[email protected]
Page 20
Investment ratings & definitions
Investment Ratings for Stocks
(based on expectations for absolute price gains over the next 6 months)
Buy:
+15% or more
Hold:
+15% to -15%
Sell:
-15% or more Opinions in this report reflect the professional judgment of the research analyst(s) as of
the date hereof and are based on information and data obtained from sources that KBSV
considers reliable. KBSV makes no representation that the information and data are
accurate or complete and the views presented in this report are subject to change without
prior notification. Clients should independently consider their own particular
circumstances and objectives and are solely responsible for their investment decisions
and we shall not have liability for investments or results thereof. These materials are the
copyright of KBSV and may not be reproduced, redistributed or modified without the prior
written consent of KBSV. Comments and views in this report are of a general nature and
intended for reference only and not authorized for use for any other purpose.
Investment Ratings for Sectors
(based on expectations for absolute price gains over the next 6 months)
Positive:
Outperform the market
Neutral:
Perform in line with the market
Negative:
Underperform the market
KB SECURITIES VIETNAM (KBSV)
Head Office:
Levels G, 2 & 7, Sky City Tower, 88 Lang Ha Street, Dong Da District, Hanoi, Vietnam
Tel: (+84) 24 7303 5333 - Fax: (+84) 24 3776 5928
Hanoi Branch:
Level 1, VP Building, 5 Dien Bien Phu, Ba Dinh District, Hanoi, Vietnam
Tel: (+84) 24 7305 3335 - Fax: (+84) 24 3822 3131
Ho Chi Minh Branch:
Level 2, TNR Tower Nguyen Cong Tru, 180-192 Nguyen Cong Tru Street, District 1, HCMC, Vietnam
Tel: (+84) 28 7303 5333 - Fax: (+84) 28 3914 1969
Saigon Branch:
Level 1, Saigon Trade Center, 37 Ton Duc Thang, Ben Nghe Ward, District 1, HCMC, Vietnam
Tel: (+84) 28 7306 3338 - Fax: (+84) 28 3910 1611
CONTACT INFORMATION
Institutional Client Center: (+84) 28 7303 5333 – Ext: 2656
Private Customer Care Center: (+84) 24 7303 5333 – Ext: 2276
Email: [email protected]
Website: www.kbsec.com.vn