58
Biodiversity Assessment Method Operational Manual – Stage 1
Biodiversity Assessment Method Operational Manual – Stage 1
© 2018 State of NSW and Office of Environment and Heritage
With the exception of photographs, the State of NSW and Office of Environment and Heritage are pleased to allow this material to be reproduced in whole or in part for educational and non-commercial use, provided the meaning is unchanged and its source, publisher and authorship are acknowledged. Specific permission is required for the reproduction of photographs.
The Office of Environment and Heritage (OEH) has compiled this report in good faith, exercising all due care and attention. No representation is made about the accuracy, completeness or suitability of the information in this publication for any particular purpose. OEH shall not be liable for any damage which may occur to any person or organisation taking action or not on the basis of this publication. Readers should seek appropriate advice when applying the information to their specific needs.
All content in this publication is owned by OEH and is protected by Crown Copyright, unless credited otherwise. It is licensed under the Creative Commons Attribution 4.0 International (CC BY 4.0), subject to the exemptions contained in the licence. The legal code for the licence is available at Creative Commons.
OEH asserts the right to be attributed as author of the original material in the following manner: © State of New South Wales and Office of Environment and Heritage 2018.
Published by:
Office of Environment and Heritage 59 Goulburn Street, Sydney NSW 2000 PO Box A290, Sydney South NSW 1232 Phone: +61 2 9995 5000 (switchboard) Phone: 1300 361 967 (OEH and national parks enquiries) TTY users: phone 133 677, then ask for 1300 361 967 Speak and listen users: phone 1300 555 727, then ask for 1300 361 967 Email: [email protected] Website: www.environment.nsw.gov.au
Report pollution and environmental incidents Environment Line: 131 555 (NSW only) or [email protected] See also www.environment.nsw.gov.au
ISBN 978-1-925753-59-2 OEH 2018/0276 May 2018
iii
Contents
List of figures iv
List of tables iv
Abbreviations v
Introduction 1
NSW Biodiversity Offsets Scheme 1
Biodiversity Assessment Method – Operational Manual 1
Stage 1: Biodiversity assessment 3
Introduction to Stage 1 3
Resources 3
Use of more appropriate local data 4
Biodiversity values excluded from Stage 1 assessment 4
Documenting Stage 1 outcomes 4
Part 1: Assessing landscape features 6
Requirements for the BAR 6
Identify landscape features 7
Part 2: Assessing native vegetation, threatened ecological communities and vegetation integrity 12
Requirements for the BAR 12
Native vegetation cover 13
Stratify native vegetation 13
Vegetation integrity assessment (site condition) 23
Part 3: Assessing habitat suitability for threatened species 33
Requirements for the BAR 33
Identifying habitat suitability for threatened species 35
Biodiversity risk weighting 42
Prescribed impacts 42
Appendix A – Websites and online resources referred to in Stage 1 45
Appendix B – Glossary of terms 47
Appendix C – Sample field data sheet for vegetation survey 52
iv
List of figures Figure 1 Example of subject land with 1500 m buffer (scale 1:25,000) 9
Figure 2 Example of linear subject land with 500 m buffer (scale 1:10,000) 10
Figure 3 Continuous vegetation zones on a stewardship site (scale 1:10,000) 17
Figure 4 Continuous and discontinuous vegetation zones on a development site (scale 1:10,000) 18
Figure 5 Discontinuous zones on a stewardship site (scale 1:10,000) 19
Figure 6 Vegetation zones on a major project site (scale 1:10,000) 20
Figure 7 Mapped vegetation zones and patches on a development site (scale 1:6,000) 22
Figure 8 Plot layout to be used for site assessment 26
Figure 9 Cumberland Plain land snail Meridolum corneovirens species polygon 41
Figure 10 Eucalyptus aggregata species polygon 41
Figure B.1NSW vegetation classification hierarchy 50
List of tables
Table 1 Minimum number of plots required per zone (copy of Table 4 from Paragraph 5.3.4.8 of the BAM) 23
Table 2 Growth form groups and attributes used to assess the composition, structure and function components of vegetation integrity 25
Table 3 Worked example of composition condition score calculation 29
Table 4 Worked example of structure condition score calculation 29
Table 5 Tree stem size diversity scores (copy of Table 17 from the BAM) 30
Table 6 Worked example of function condition score calculation 30
Table 7 Criteria for identifying ecosystem and species credit species at a site 35
Table 8 Example of identification of prescribed impacts on site 44
Table B.1 Biodiversity credit classes and associated general definitions for application in the BAM 48
v
Abbreviations
Abbreviation Description
AOBV Area of Outstanding Biodiversity Value
BAR Biodiversity Assessment Report; includes Biodiversity Development Assessment Reports (BDARs), Biodiversity Certification Assessment Reports (BCARs) and Biodiversity Stewardship Site Assessment Reports (BSSARs)
BAM Biodiversity Assessment Method
BC Act Biodiversity Conservation Act 2016 (NSW)
BC Regulation Biodiversity Conservation Regulation 2017 (NSW)
BOS Biodiversity Offsets Scheme
CEEC Critically endangered ecological community
Chief Executive of OEH Chief Executive of the Office of Environment and Heritage
Calculator Biodiversity Assessment Method Calculator
DIWA Directory of Important Wetlands in Australia
DPE NSW Department of Planning and Environment
EEC Endangered ecological community
EIS Environmental impact statement
EP&A Act Environmental Planning and Assessment Act 1979 (NSW)
EPBC Act Environment Protection and Biodiversity Conservation Act 1999 (C’th)
Fisheries NSW Policy and Guidelines
Fisheries NSW Policy and guidelines for fish habitat conservation and management
LLS Local Land Services
LLS Act Local Land Services Act 2013 (NSW)
the Manual Biodiversity Assessment Method Operational Manual (this Manual)
MNES Matters of National Environmental Significance
OEH Office of Environment and Heritage NSW
PCT Plant community type
SEPP State Environmental Planning Policy
the Standard Native Vegetation Interim Type Standard1
TBDC Threatened Biodiversity Data Collection
TEC Collective term for threatened ecological communities (VECs, EECs, CEECs)
VPA Voluntary planning agreement
1 Sivertsen D 2009, Native Vegetation Interim Type Standard, Department of Environment, Climate Change and Water NSW, Sydney.
Biodiversity Assessment Method Operational Manual
1
Introduction
NSW Biodiversity Offsets Scheme
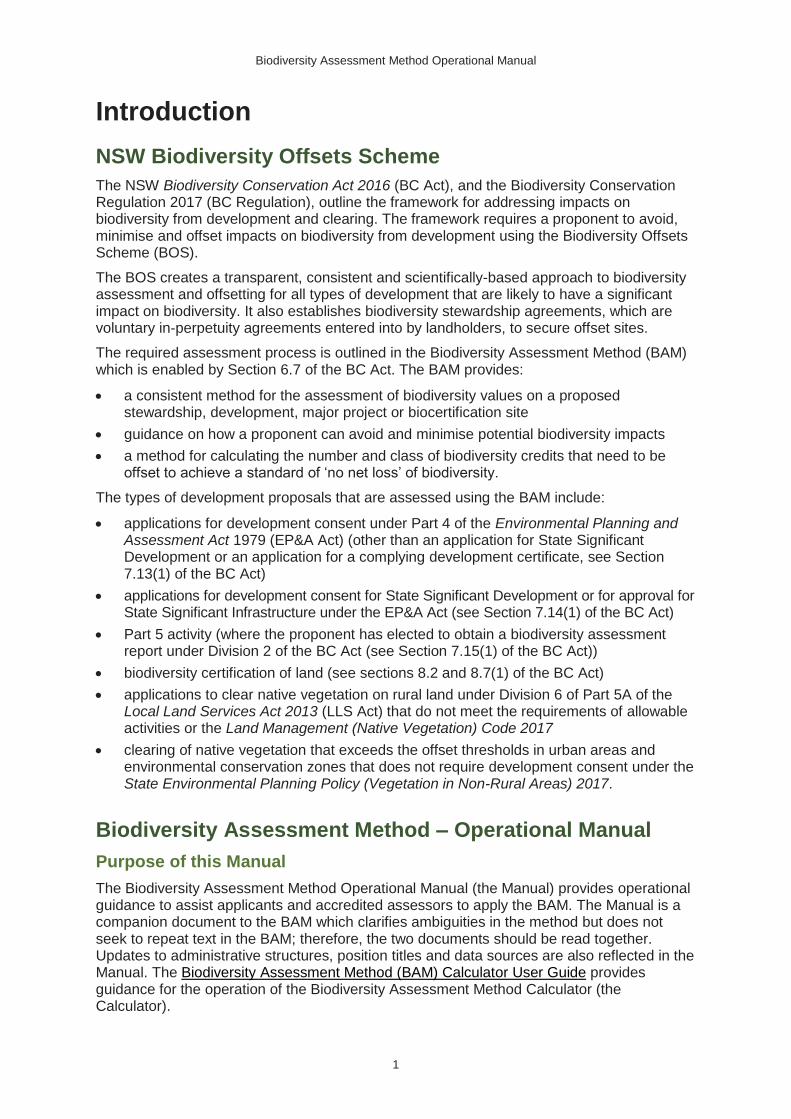
The NSW Biodiversity Conservation Act 2016 (BC Act), and the Biodiversity Conservation Regulation 2017 (BC Regulation), outline the framework for addressing impacts on biodiversity from development and clearing. The framework requires a proponent to avoid, minimise and offset impacts on biodiversity from development using the Biodiversity Offsets Scheme (BOS).
The BOS creates a transparent, consistent and scientifically-based approach to biodiversity assessment and offsetting for all types of development that are likely to have a significant impact on biodiversity. It also establishes biodiversity stewardship agreements, which are voluntary in-perpetuity agreements entered into by landholders, to secure offset sites.
The required assessment process is outlined in the Biodiversity Assessment Method (BAM) which is enabled by Section 6.7 of the BC Act. The BAM provides:
• a consistent method for the assessment of biodiversity values on a proposed stewardship, development, major project or biocertification site
• guidance on how a proponent can avoid and minimise potential biodiversity impacts
• a method for calculating the number and class of biodiversity credits that need to be offset to achieve a standard of ‘no net loss’ of biodiversity.
The types of development proposals that are assessed using the BAM include:
• applications for development consent under Part 4 of the Environmental Planning and Assessment Act 1979 (EP&A Act) (other than an application for State Significant Development or an application for a complying development certificate, see Section 7.13(1) of the BC Act)
• applications for development consent for State Significant Development or for approval for State Significant Infrastructure under the EP&A Act (see Section 7.14(1) of the BC Act)
• Part 5 activity (where the proponent has elected to obtain a biodiversity assessment report under Division 2 of the BC Act (see Section 7.15(1) of the BC Act))
• biodiversity certification of land (see sections 8.2 and 8.7(1) of the BC Act)
• applications to clear native vegetation on rural land under Division 6 of Part 5A of the Local Land Services Act 2013 (LLS Act) that do not meet the requirements of allowable activities or the Land Management (Native Vegetation) Code 2017
• clearing of native vegetation that exceeds the offset thresholds in urban areas and environmental conservation zones that does not require development consent under the State Environmental Planning Policy (Vegetation in Non-Rural Areas) 2017.
Biodiversity Assessment Method – Operational Manual
Purpose of this Manual
The Biodiversity Assessment Method Operational Manual (the Manual) provides operational guidance to assist applicants and accredited assessors to apply the BAM. The Manual is a companion document to the BAM which clarifies ambiguities in the method but does not seek to repeat text in the BAM; therefore, the two documents should be read together. Updates to administrative structures, position titles and data sources are also reflected in the Manual. The Biodiversity Assessment Method (BAM) Calculator User Guide provides guidance for the operation of the Biodiversity Assessment Method Calculator (the Calculator).
Biodiversity Assessment Method Operational Manual
2
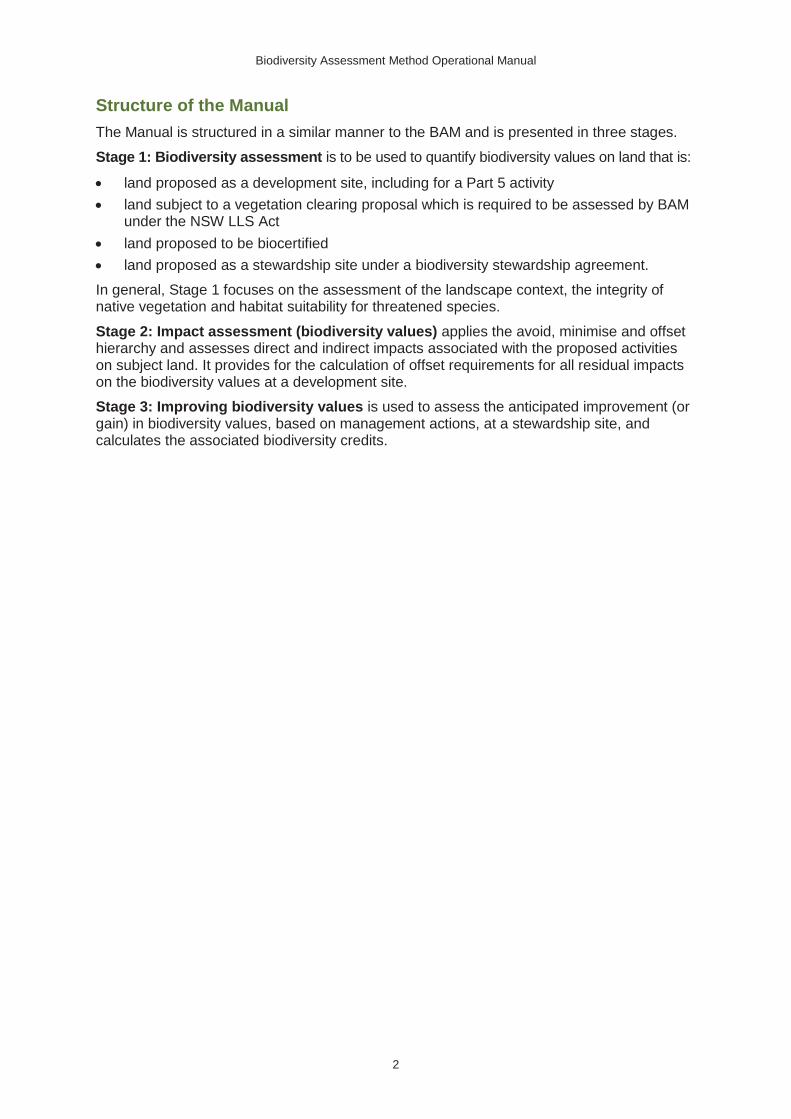
Structure of the Manual
The Manual is structured in a similar manner to the BAM and is presented in three stages.
Stage 1: Biodiversity assessment is to be used to quantify biodiversity values on land that is:
• land proposed as a development site, including for a Part 5 activity
• land subject to a vegetation clearing proposal which is required to be assessed by BAM under the NSW LLS Act
• land proposed to be biocertified
• land proposed as a stewardship site under a biodiversity stewardship agreement.
In general, Stage 1 focuses on the assessment of the landscape context, the integrity of native vegetation and habitat suitability for threatened species.
Stage 2: Impact assessment (biodiversity values) applies the avoid, minimise and offset hierarchy and assesses direct and indirect impacts associated with the proposed activities on subject land. It provides for the calculation of offset requirements for all residual impacts on the biodiversity values at a development site.
Stage 3: Improving biodiversity values is used to assess the anticipated improvement (or gain) in biodiversity values, based on management actions, at a stewardship site, and calculates the associated biodiversity credits.
Biodiversity Assessment Method Operational Manual
3
Stage 1: Biodiversity assessment
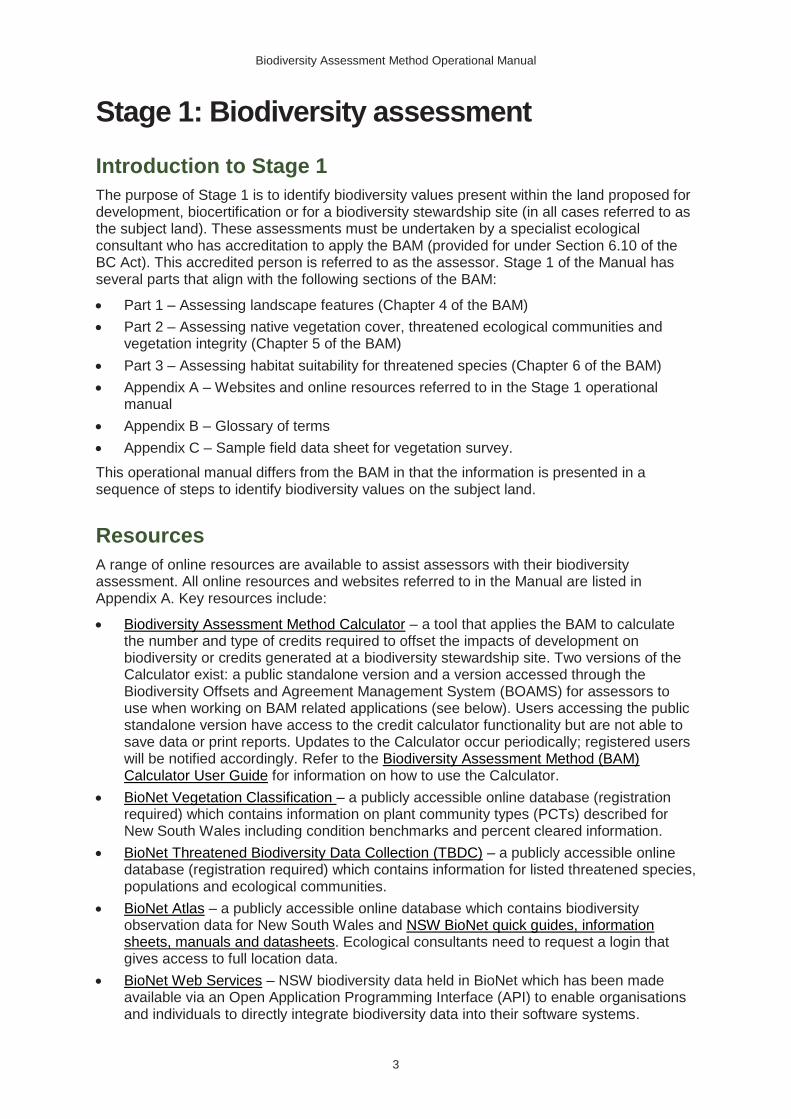
Introduction to Stage 1
The purpose of Stage 1 is to identify biodiversity values present within the land proposed for development, biocertification or for a biodiversity stewardship site (in all cases referred to as the subject land). These assessments must be undertaken by a specialist ecological consultant who has accreditation to apply the BAM (provided for under Section 6.10 of the BC Act). This accredited person is referred to as the assessor. Stage 1 of the Manual has several parts that align with the following sections of the BAM:
• Part 1 – Assessing landscape features (Chapter 4 of the BAM)
• Part 2 – Assessing native vegetation cover, threatened ecological communities and vegetation integrity (Chapter 5 of the BAM)
• Part 3 – Assessing habitat suitability for threatened species (Chapter 6 of the BAM)
• Appendix A – Websites and online resources referred to in the Stage 1 operational manual
• Appendix B – Glossary of terms
• Appendix C – Sample field data sheet for vegetation survey.
This operational manual differs from the BAM in that the information is presented in a sequence of steps to identify biodiversity values on the subject land.
Resources
A range of online resources are available to assist assessors with their biodiversity assessment. All online resources and websites referred to in the Manual are listed in Appendix A. Key resources include:
• Biodiversity Assessment Method Calculator – a tool that applies the BAM to calculate the number and type of credits required to offset the impacts of development on biodiversity or credits generated at a biodiversity stewardship site. Two versions of the Calculator exist: a public standalone version and a version accessed through the Biodiversity Offsets and Agreement Management System (BOAMS) for assessors to use when working on BAM related applications (see below). Users accessing the public standalone version have access to the credit calculator functionality but are not able to save data or print reports. Updates to the Calculator occur periodically; registered users will be notified accordingly. Refer to the Biodiversity Assessment Method (BAM) Calculator User Guide for information on how to use the Calculator.
• BioNet Vegetation Classification – a publicly accessible online database (registration required) which contains information on plant community types (PCTs) described for New South Wales including condition benchmarks and percent cleared information.
• BioNet Threatened Biodiversity Data Collection (TBDC) – a publicly accessible online database (registration required) which contains information for listed threatened species, populations and ecological communities.
• BioNet Atlas – a publicly accessible online database which contains biodiversity observation data for New South Wales and NSW BioNet quick guides, information sheets, manuals and datasheets. Ecological consultants need to request a login that gives access to full location data.
• BioNet Web Services – NSW biodiversity data held in BioNet which has been made available via an Open Application Programming Interface (API) to enable organisations and individuals to directly integrate biodiversity data into their software systems.
Biodiversity Assessment Method Operational Manual
4
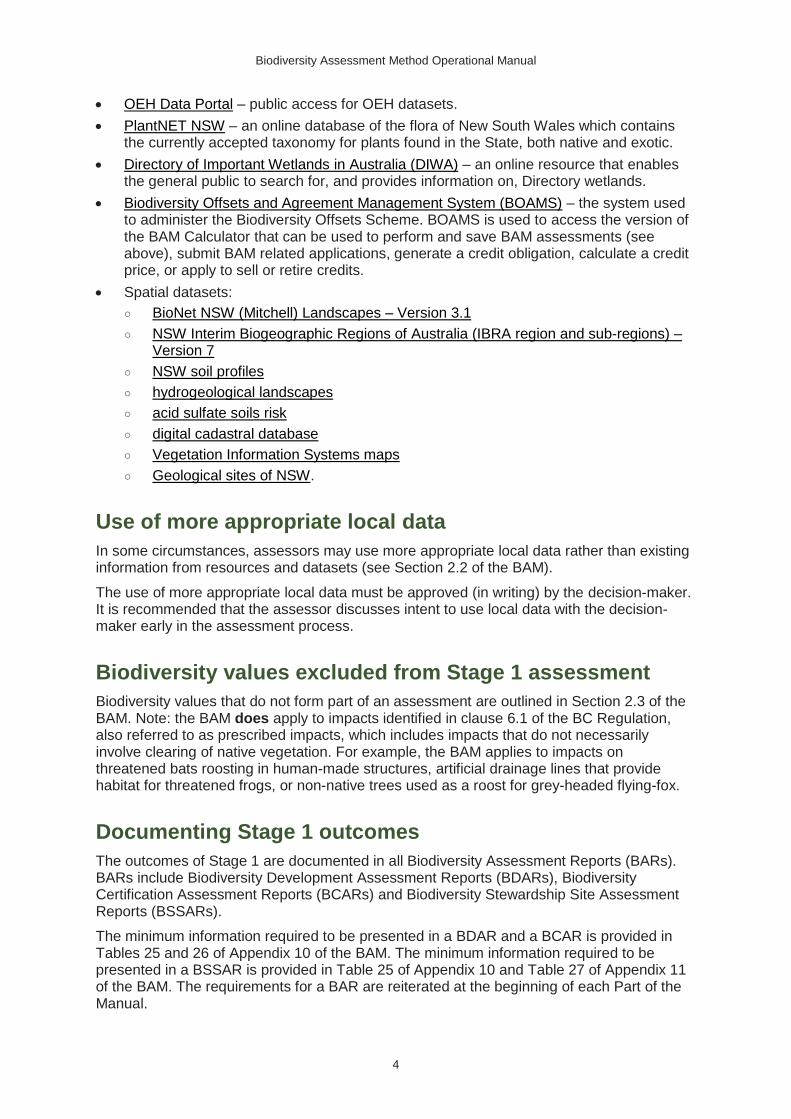
• OEH Data Portal – public access for OEH datasets.
• PlantNET NSW – an online database of the flora of New South Wales which contains the currently accepted taxonomy for plants found in the State, both native and exotic.
• Directory of Important Wetlands in Australia (DIWA) – an online resource that enables the general public to search for, and provides information on, Directory wetlands.
• Biodiversity Offsets and Agreement Management System (BOAMS) – the system used to administer the Biodiversity Offsets Scheme. BOAMS is used to access the version of the BAM Calculator that can be used to perform and save BAM assessments (see above), submit BAM related applications, generate a credit obligation, calculate a credit price, or apply to sell or retire credits.
• Spatial datasets:
○ BioNet NSW (Mitchell) Landscapes – Version 3.1
○ NSW Interim Biogeographic Regions of Australia (IBRA region and sub-regions) – Version 7
○ NSW soil profiles
○ hydrogeological landscapes
○ acid sulfate soils risk
○ digital cadastral database
○ Vegetation Information Systems maps
○ Geological sites of NSW.
Use of more appropriate local data
In some circumstances, assessors may use more appropriate local data rather than existing information from resources and datasets (see Section 2.2 of the BAM).
The use of more appropriate local data must be approved (in writing) by the decision-maker. It is recommended that the assessor discusses intent to use local data with the decision-maker early in the assessment process.
Biodiversity values excluded from Stage 1 assessment
Biodiversity values that do not form part of an assessment are outlined in Section 2.3 of the BAM. Note: the BAM does apply to impacts identified in clause 6.1 of the BC Regulation, also referred to as prescribed impacts, which includes impacts that do not necessarily involve clearing of native vegetation. For example, the BAM applies to impacts on threatened bats roosting in human-made structures, artificial drainage lines that provide habitat for threatened frogs, or non-native trees used as a roost for grey-headed flying-fox.
Documenting Stage 1 outcomes
The outcomes of Stage 1 are documented in all Biodiversity Assessment Reports (BARs). BARs include Biodiversity Development Assessment Reports (BDARs), Biodiversity Certification Assessment Reports (BCARs) and Biodiversity Stewardship Site Assessment Reports (BSSARs).
The minimum information required to be presented in a BDAR and a BCAR is provided in Tables 25 and 26 of Appendix 10 of the BAM. The minimum information required to be presented in a BSSAR is provided in Table 25 of Appendix 10 and Table 27 of Appendix 11 of the BAM. The requirements for a BAR are reiterated at the beginning of each Part of the Manual.
Biodiversity Assessment Method Operational Manual
5
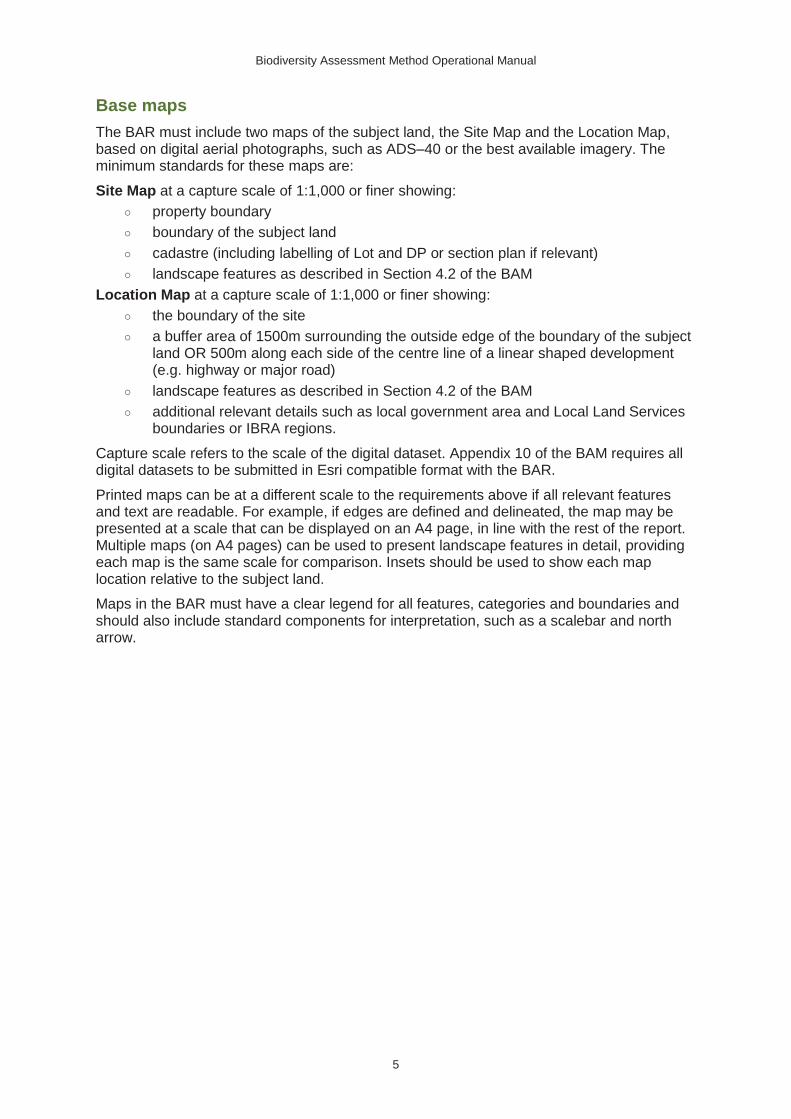
Base maps
The BAR must include two maps of the subject land, the Site Map and the Location Map, based on digital aerial photographs, such as ADS–40 or the best available imagery. The minimum standards for these maps are:
Site Map at a capture scale of 1:1,000 or finer showing:
○ property boundary
○ boundary of the subject land
○ cadastre (including labelling of Lot and DP or section plan if relevant)
○ landscape features as described in Section 4.2 of the BAM
Location Map at a capture scale of 1:1,000 or finer showing:
○ the boundary of the site
○ a buffer area of 1500m surrounding the outside edge of the boundary of the subject land OR 500m along each side of the centre line of a linear shaped development (e.g. highway or major road)
○ landscape features as described in Section 4.2 of the BAM
○ additional relevant details such as local government area and Local Land Services boundaries or IBRA regions.
Capture scale refers to the scale of the digital dataset. Appendix 10 of the BAM requires all digital datasets to be submitted in Esri compatible format with the BAR.
Printed maps can be at a different scale to the requirements above if all relevant features and text are readable. For example, if edges are defined and delineated, the map may be presented at a scale that can be displayed on an A4 page, in line with the rest of the report. Multiple maps (on A4 pages) can be used to present landscape features in detail, providing each map is the same scale for comparison. Insets should be used to show each map location relative to the subject land.
Maps in the BAR must have a clear legend for all features, categories and boundaries and should also include standard components for interpretation, such as a scalebar and north arrow.
Biodiversity Assessment Method Operational Manual
6
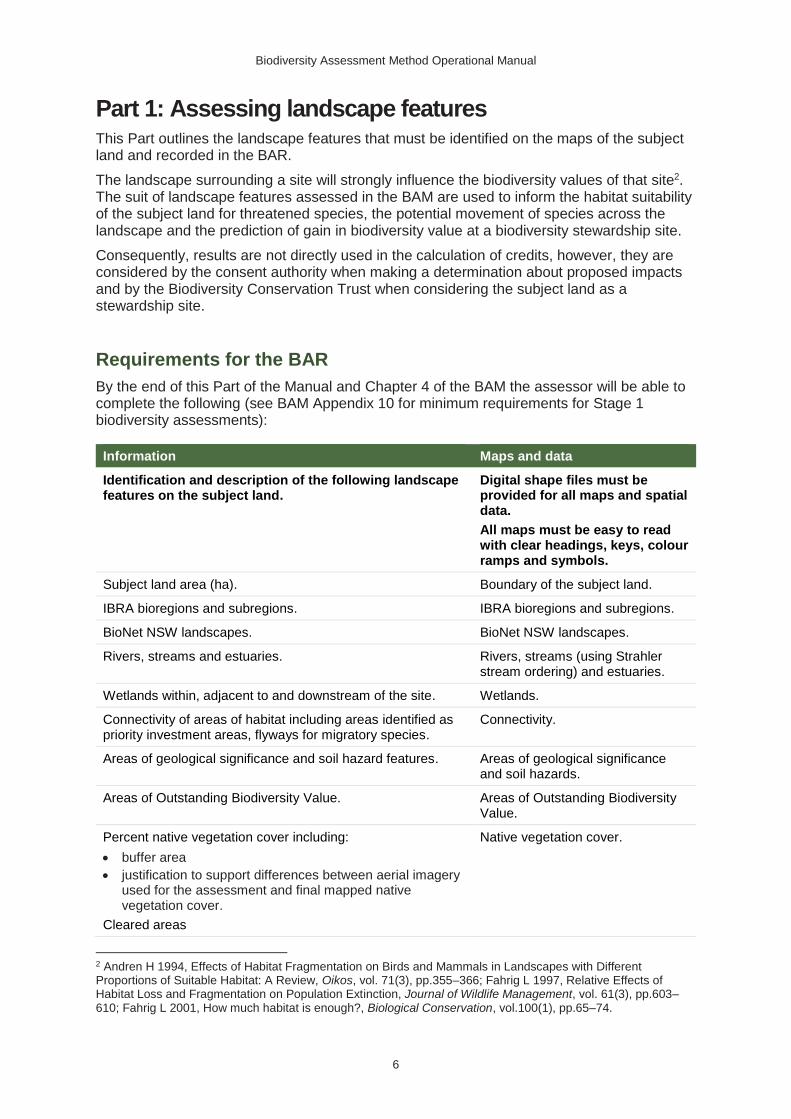
Part 1: Assessing landscape features This Part outlines the landscape features that must be identified on the maps of the subject land and recorded in the BAR.
The landscape surrounding a site will strongly influence the biodiversity values of that site2. The suit of landscape features assessed in the BAM are used to inform the habitat suitability of the subject land for threatened species, the potential movement of species across the landscape and the prediction of gain in biodiversity value at a biodiversity stewardship site.
Consequently, results are not directly used in the calculation of credits, however, they are considered by the consent authority when making a determination about proposed impacts and by the Biodiversity Conservation Trust when considering the subject land as a stewardship site.
Requirements for the BAR
By the end of this Part of the Manual and Chapter 4 of the BAM the assessor will be able to complete the following (see BAM Appendix 10 for minimum requirements for Stage 1 biodiversity assessments):
Information Maps and data
Identification and description of the following landscape features on the subject land.
Digital shape files must be provided for all maps and spatial data.
All maps must be easy to read with clear headings, keys, colour ramps and symbols.
Subject land area (ha). Boundary of the subject land.
IBRA bioregions and subregions. IBRA bioregions and subregions.
BioNet NSW landscapes. BioNet NSW landscapes.
Rivers, streams and estuaries. Rivers, streams (using Strahler stream ordering) and estuaries.
Wetlands within, adjacent to and downstream of the site. Wetlands.
Connectivity of areas of habitat including areas identified as priority investment areas, flyways for migratory species.
Connectivity.
Areas of geological significance and soil hazard features. Areas of geological significance and soil hazards.
Areas of Outstanding Biodiversity Value. Areas of Outstanding Biodiversity Value.
Percent native vegetation cover including:
• buffer area
• justification to support differences between aerial imagery used for the assessment and final mapped native vegetation cover.
Cleared areas
Native vegetation cover.
2 Andren H 1994, Effects of Habitat Fragmentation on Birds and Mammals in Landscapes with Different Proportions of Suitable Habitat: A Review, Oikos, vol. 71(3), pp.355–366; Fahrig L 1997, Relative Effects of Habitat Loss and Fragmentation on Population Extinction, Journal of Wildlife Management, vol. 61(3), pp.603–610; Fahrig L 2001, How much habitat is enough?, Biological Conservation, vol.100(1), pp.65–74.
Biodiversity Assessment Method Operational Manual
7
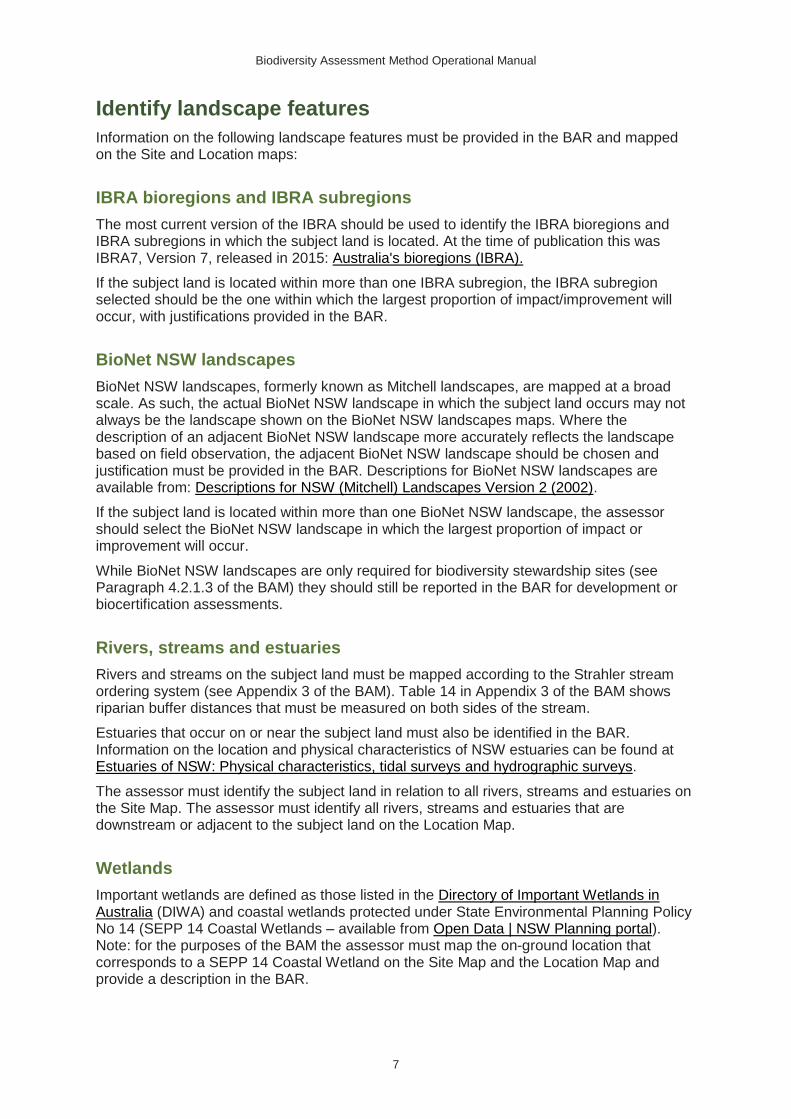
Identify landscape features
Information on the following landscape features must be provided in the BAR and mapped on the Site and Location maps:
IBRA bioregions and IBRA subregions
The most current version of the IBRA should be used to identify the IBRA bioregions and IBRA subregions in which the subject land is located. At the time of publication this was IBRA7, Version 7, released in 2015: Australia's bioregions (IBRA).
If the subject land is located within more than one IBRA subregion, the IBRA subregion selected should be the one within which the largest proportion of impact/improvement will occur, with justifications provided in the BAR.
BioNet NSW landscapes
BioNet NSW landscapes, formerly known as Mitchell landscapes, are mapped at a broad scale. As such, the actual BioNet NSW landscape in which the subject land occurs may not always be the landscape shown on the BioNet NSW landscapes maps. Where the description of an adjacent BioNet NSW landscape more accurately reflects the landscape based on field observation, the adjacent BioNet NSW landscape should be chosen and justification must be provided in the BAR. Descriptions for BioNet NSW landscapes are available from: Descriptions for NSW (Mitchell) Landscapes Version 2 (2002).
If the subject land is located within more than one BioNet NSW landscape, the assessor should select the BioNet NSW landscape in which the largest proportion of impact or improvement will occur.
While BioNet NSW landscapes are only required for biodiversity stewardship sites (see Paragraph 4.2.1.3 of the BAM) they should still be reported in the BAR for development or biocertification assessments.
Rivers, streams and estuaries
Rivers and streams on the subject land must be mapped according to the Strahler stream ordering system (see Appendix 3 of the BAM). Table 14 in Appendix 3 of the BAM shows riparian buffer distances that must be measured on both sides of the stream.
Estuaries that occur on or near the subject land must also be identified in the BAR. Information on the location and physical characteristics of NSW estuaries can be found at Estuaries of NSW: Physical characteristics, tidal surveys and hydrographic surveys.
The assessor must identify the subject land in relation to all rivers, streams and estuaries on the Site Map. The assessor must identify all rivers, streams and estuaries that are downstream or adjacent to the subject land on the Location Map.
Wetlands
Important wetlands are defined as those listed in the Directory of Important Wetlands in Australia (DIWA) and coastal wetlands protected under State Environmental Planning Policy No 14 (SEPP 14 Coastal Wetlands – available from Open Data | NSW Planning portal). Note: for the purposes of the BAM the assessor must map the on-ground location that corresponds to a SEPP 14 Coastal Wetland on the Site Map and the Location Map and provide a description in the BAR.
Biodiversity Assessment Method Operational Manual
8
Local wetlands refer to all other wetlands, including but not restricted to, those listed or mapped in regional planning or conservation strategies. The BAR must reference the document describing a local wetland.
The assessor must identify the subject land in relation to all important and local wetlands on the Site Map. The assessor must identify all other important and local wetlands that are downstream or adjacent to the subject land on the Location Map.
Connectivity
Connectivity can be identified at different scales depending on the target entities and can include recognised biodiversity corridors in a plan approved by OEH (e.g. priority investment areas), flyways for migratory species, a riparian buffer of a stream, wetland or estuary or a local corridor identified by a local council.
Areas of connectivity addressed elsewhere in the BAR, for example, a flyway identified in accordance with Section 6.7 of the BAM, should be mapped and described once in Stage 1 and then referenced in subsequent sections of the BAR.
Areas of geological significance and soil hazard
Areas of geological significance generally include karst, caves, crevices and cliffs. Site inspection will be required to accurately identify, describe and map these features on the subject land.
Soil hazard features such as dryland salinity, acidification, compaction, structural breakdown, sodicity and contamination will require onsite assessment to accurately map location and extent. Assessors can use resources such as hydrogeological mapping and acid sulfate soil risk mapping to support field observations.
Features that are addressed elsewhere in the BAR, for example, karst, caves, crevices and cliffs identified in accordance with Section 6.7 of the BAM, should be mapped and described once in Stage 1 and referenced in subsequent sections of the BAR.
Areas of outstanding biodiversity value
Areas of outstanding biodiversity value (AOBV) are declared by the Minister for the Environment. A public register of AOBVs will be available as more areas are declared. Currently, critical habitat for the little penguin population at Manly, for the Mitchell’s rainforest snail in Stotts Island Nature Reserve, for the Gould’s petrel on Cabbage Tree Island, and for the Wollemi pine are AOBVs.
Percent native vegetation cover
Percent native vegetation cover refers to the amount of native vegetation (woody and non-woody vegetation including regrowth and plantations comprised of plants native to New South Wales) that is estimated to remain in the landscape proximal to the assessment area (total area of the subject land and buffer). It is used:
• as a filter by the Calculator to predict threatened species likely to occur or use habitat on a site (see Section 6.1 of the BAM)
• to define the intrinsic rate of increase in species richness and plant cover as part of the assessment of future vegetation condition on a biodiversity stewardship site (see Equation 31 in the BAM).
The attribute is assessed by applying a 1500 metre buffer around the edge of the subject land and digitising all native vegetation within, using geographic information system (GIS) editing tools and aerial photography (such as ADS–40 imagery or other best available
Biodiversity Assessment Method Operational Manual
9
imagery for the site). The total area of native vegetation is calculated across the assessment area. Information that must be recorded in the BAR includes:
• whole numbers – the total assessment area, the area of native vegetation and/or regrowth within the assessment area in hectares
• percentages – the percentage of native vegetation and/or regrowth estimated in the assessment areas (the assessor also enters this figure into the BAM Calculator)
• cover class – in accordance with Subsection 4.3.2 of the BAM (cover classes range from 0–10%, 10–30%, 30–70% and >70% and are automatically assigned by the Calculator once the percentage of native vegetation cover is entered).
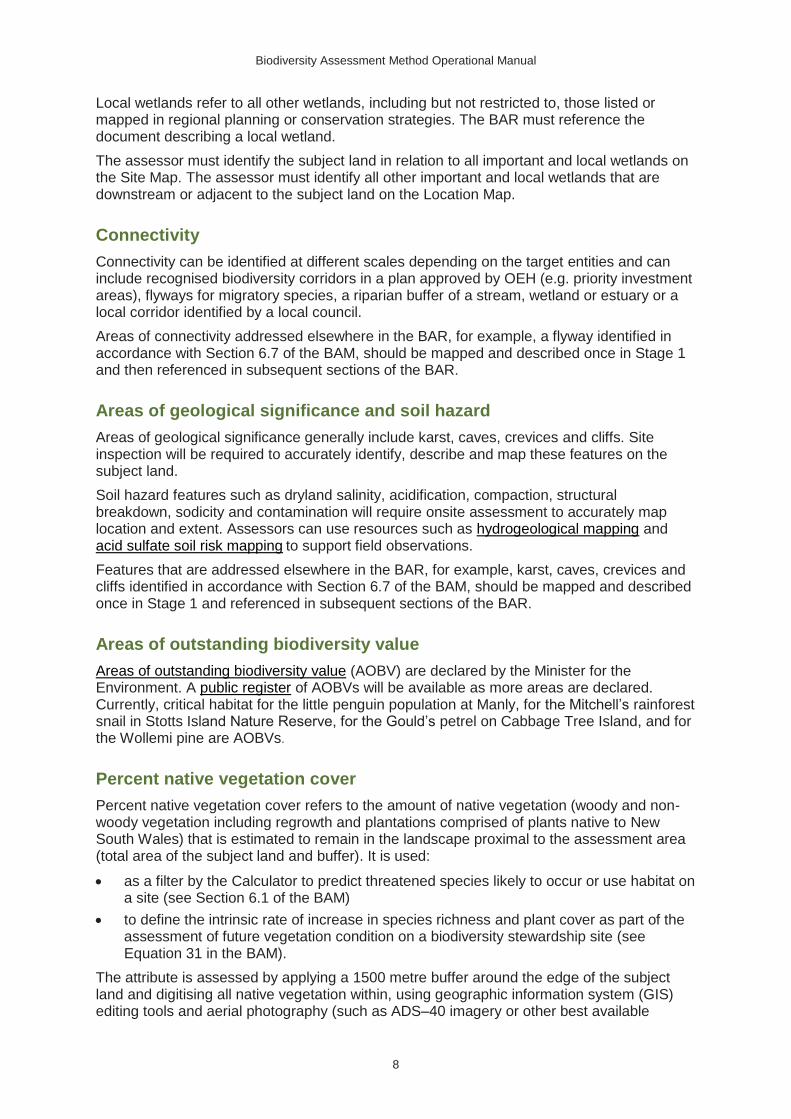
Where the subject land is a linear shape (e.g. a major road or highway development) the 1500 metre buffer is replaced with a 500-metre buffer following the centre line of the subject land (see Figures 1 and 2).
Given this is primarily a desktop assessment the assessor is expected to use professional judgement and their knowledge of the landscape when determining native vegetation cover. Clear justifications must accompany these data particularly in relation to areas of vegetation that have been excluded from the assessment. For example, verification of areas of non-native vegetation by field assessment is a strong justification for their removal from the assessment area. These areas must be clearly indicated on the Location Map and documented in the BAR.
Figure 1 Example of subject land with 1500 m buffer (scale 1:25,000)
Biodiversity Assessment Method Operational Manual
10
Non-linear subject land has a 1500 metre buffer measured from the boundary of the subject land. The percentage of native vegetation is calculated within the buffer (blue) and subject land (green) areas.
In this example, the assessment area is 1162 hectares and the area of native vegetation (outlined in orange) is 415 hectares. Therefore, the percentage of native vegetation is estimated to be approximately 36%.
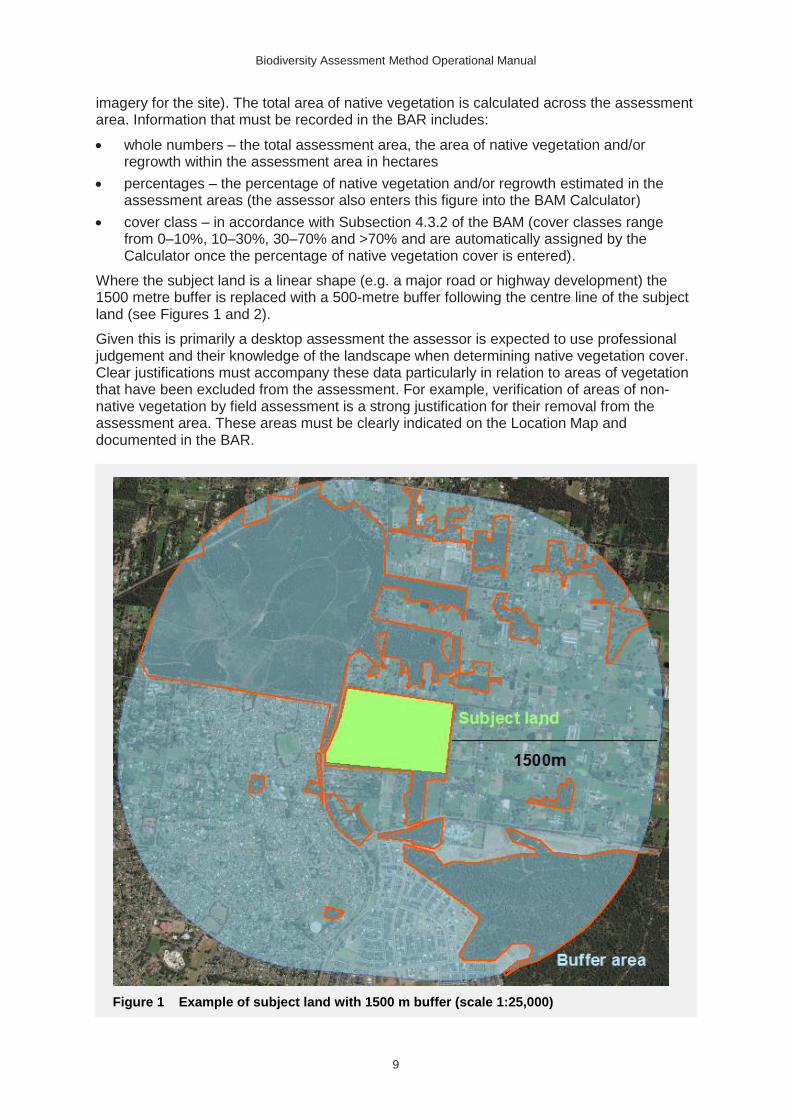
Figure 2 Example of linear subject land with 500 m buffer (scale 1:10,000)
Linear sites have a 500-metre buffer measured from the centre line of the subject land. The percentage of native vegetation is calculated within the buffer (blue) and subject land (green) area.
In this example, the assessment area is 130 hectares and the area of native vegetation (outlined in orange) is 31.5 hectares. Therefore, the percentage of native vegetation is 24%.

Biodiversity Assessment Method Operational Manual
11
Field reconnaissance
The extent and condition of landscape features on the subject land are confirmed by site inspections, particularly caves and karst areas or the presence of non-native vegetation that may be difficult to interpret from remote imagery. The assessor can use ground-truthed information to adjust maps and percent native vegetation cover estimates.
Where access to private property or the size and configuration of the subject land limits the ability to conduct a field assessment the assessor should apply professional judgement, and record the methods used and assumptions made in the BAR.
Biodiversity Assessment Method Operational Manual
12
Part 2: Assessing native vegetation, threatened ecological communities and vegetation integrity This Part outlines:
• the process for mapping and identifying the native vegetation (PCTs and threatened ecological communities) on the subject land
• the process for stratifying native vegetation into vegetation zones, which are based on the PCT and broad vegetation condition
• the role of benchmarks in the assessment
• the field method used to collect data from each vegetation zone
• the process to generate the vegetation condition score, called the vegetation integrity score.
Requirements for the BAR
By the end of this Part of the Manual and Chapter 5 of the BAM the assessor will be able to complete the following information in the BAR (see BAM Appendix 10 for minimum requirements for Stage 1 biodiversity assessments).
Information Maps and data
Identification and description of the following native vegetation features on the subject land.
Digital shape files must be provided for all maps and spatial data.
All maps must be easy to read with clear headings, keys, colour ramps and symbols.
Data must be provided in a format that can be analysed (e.g. MS Excel).
Native vegetation cover on subject land and justification to support differences between mapped native vegetation cover and aerial imagery.
Native vegetation extent within the subject land.
PCTs within the subject land, including:
• vegetation class
• vegetation type (i.e. PCT names and ID numbers)
• area (ha)
• species relied upon for identification of vegetation type and relative abundance
• TEC status
• estimate of percent cleared value of the PCT (available in the BioNet Vegetation Classification)
• evidence and justification of decision pathway used in identification of PCT (e.g. vegetation structure and landscape position/geomorphology).
Distribution of PCTs within the subject land.
Plot locations relative to PCTs including GPS coordinates (GDS zone, eastings, northings and bearings).
Plot field data and sheets.
TECs on the subject land.
Biodiversity Assessment Method Operational Manual
13
Information Maps and data
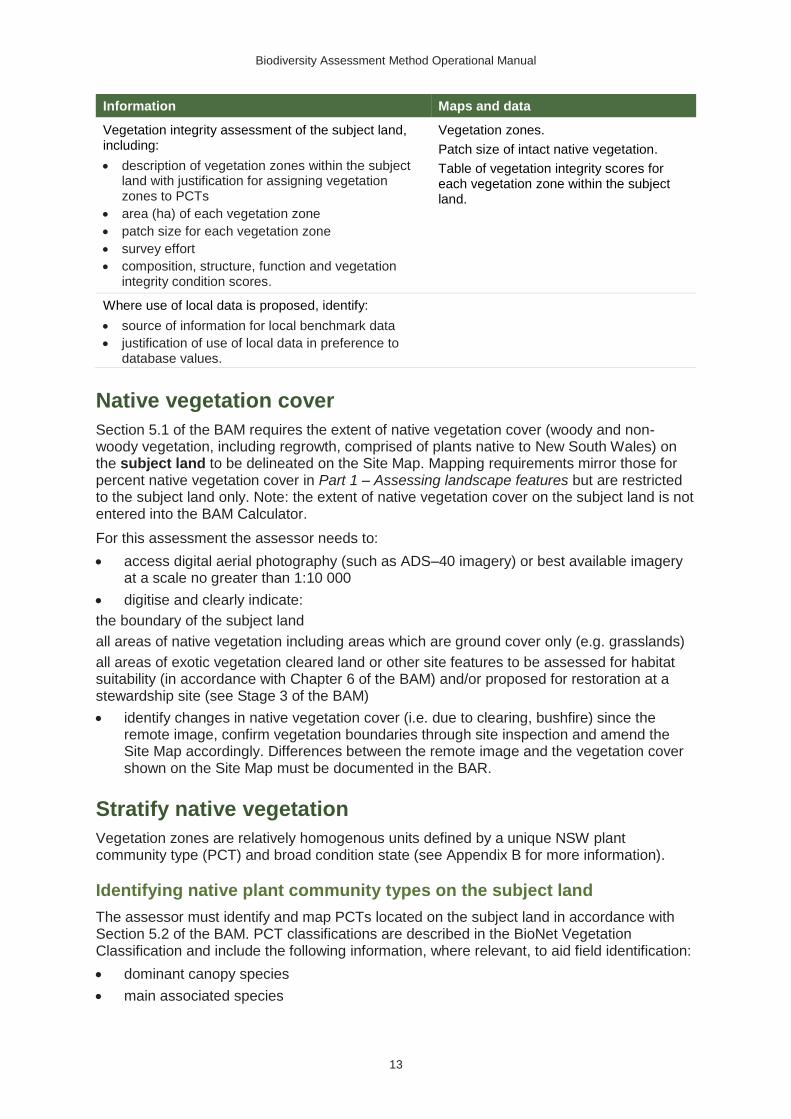
Vegetation integrity assessment of the subject land, including:
• description of vegetation zones within the subject land with justification for assigning vegetation zones to PCTs
• area (ha) of each vegetation zone
• patch size for each vegetation zone
• survey effort
• composition, structure, function and vegetation integrity condition scores.
Vegetation zones.
Patch size of intact native vegetation.
Table of vegetation integrity scores for each vegetation zone within the subject land.
Where use of local data is proposed, identify:
• source of information for local benchmark data
• justification of use of local data in preference to database values.
Native vegetation cover
Section 5.1 of the BAM requires the extent of native vegetation cover (woody and non-woody vegetation, including regrowth, comprised of plants native to New South Wales) on the subject land to be delineated on the Site Map. Mapping requirements mirror those for percent native vegetation cover in Part 1 – Assessing landscape features but are restricted to the subject land only. Note: the extent of native vegetation cover on the subject land is not entered into the BAM Calculator.
For this assessment the assessor needs to:
• access digital aerial photography (such as ADS–40 imagery) or best available imagery at a scale no greater than 1:10 000
• digitise and clearly indicate:
the boundary of the subject land
all areas of native vegetation including areas which are ground cover only (e.g. grasslands)
all areas of exotic vegetation cleared land or other site features to be assessed for habitat suitability (in accordance with Chapter 6 of the BAM) and/or proposed for restoration at a stewardship site (see Stage 3 of the BAM)
• identify changes in native vegetation cover (i.e. due to clearing, bushfire) since the remote image, confirm vegetation boundaries through site inspection and amend the Site Map accordingly. Differences between the remote image and the vegetation cover shown on the Site Map must be documented in the BAR.
Stratify native vegetation
Vegetation zones are relatively homogenous units defined by a unique NSW plant community type (PCT) and broad condition state (see Appendix B for more information).
Identifying native plant community types on the subject land
The assessor must identify and map PCTs located on the subject land in accordance with Section 5.2 of the BAM. PCT classifications are described in the BioNet Vegetation Classification and include the following information, where relevant, to aid field identification:
• dominant canopy species
• main associated species
Biodiversity Assessment Method Operational Manual
14
• landscape position
• characteristic mid-storey species
• characteristic ground cover species
• other diagnostic features and descriptive fields.
Additionally, Appendix 9, Part B of the Native Vegetation Interim Type Standard (the Standard; Sivertsen 2009) is a useful resource for identifying native plant communities.
Plant community types are identified via vegetation strata. This should not be confused with the BAM vegetation condition assessment, or vegetation integrity, which assesses condition within growth form groups.
To identify a PCT the assessor:
1. Reviews existing information for the subject land (e.g. past survey data, vegetation maps or previous reports). Mapping products often include vegetation communities based on statistical analysis (e.g. PATN), and as such include useful fidelity tables that clearly describe diagnostic and characteristic taxa, that may be useful in assigning a PCT. Any existing information used to identify PCTs in the subject land should be reported in the BAR.
2. Uses the outcomes of 1. and level of environmental variation on the subject land, site-scale, gaps in existing mapping and information and vegetation extent to determine survey design and number of plots required to confidently identify the PCT/s on the subject land.
3. Undertakes plot-based floristic vegetation survey in a 20 m x 20 m plot.
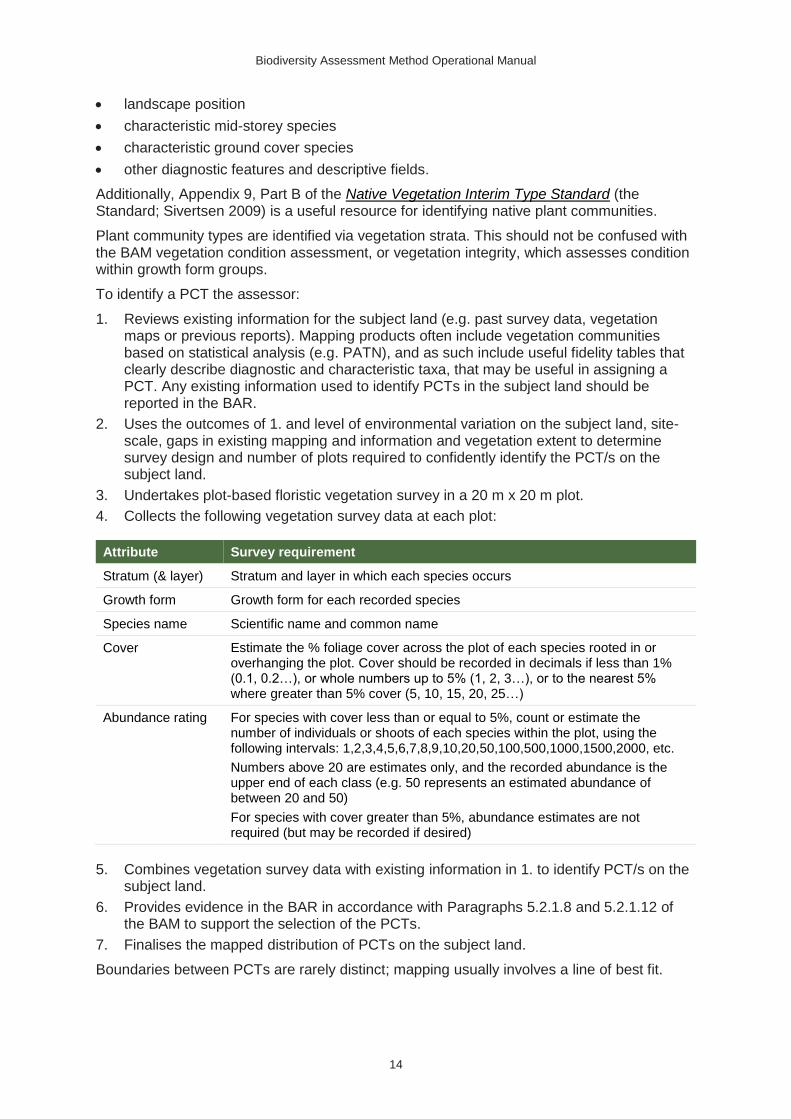
4. Collects the following vegetation survey data at each plot:
Attribute Survey requirement
Stratum (& layer) Stratum and layer in which each species occurs
Growth form Growth form for each recorded species
Species name Scientific name and common name
Cover Estimate the % foliage cover across the plot of each species rooted in or overhanging the plot. Cover should be recorded in decimals if less than 1% (0.1, 0.2…), or whole numbers up to 5% (1, 2, 3…), or to the nearest 5% where greater than 5% cover (5, 10, 15, 20, 25…)
Abundance rating For species with cover less than or equal to 5%, count or estimate the number of individuals or shoots of each species within the plot, using the following intervals: 1,2,3,4,5,6,7,8,9,10,20,50,100,500,1000,1500,2000, etc.
Numbers above 20 are estimates only, and the recorded abundance is the upper end of each class (e.g. 50 represents an estimated abundance of between 20 and 50)
For species with cover greater than 5%, abundance estimates are not required (but may be recorded if desired)
5. Combines vegetation survey data with existing information in 1. to identify PCT/s on the subject land.
6. Provides evidence in the BAR in accordance with Paragraphs 5.2.1.8 and 5.2.1.12 of the BAM to support the selection of the PCTs.
7. Finalises the mapped distribution of PCTs on the subject land.
Boundaries between PCTs are rarely distinct; mapping usually involves a line of best fit.
Biodiversity Assessment Method Operational Manual
15
Vegetation that does not strictly meet the definition of a PCT, as per the BioNet Vegetation Classification, can be allocated to the PCT to which it most closely aligns. PCT selection must be documented, with justifications, in the BAR.
Species naming and classification must be in accordance with the NSW Herbarium (refer to PlantNET NSW). Specimens of species which cannot be identified during inspection should be collected for identification. Genus (or Family name) can be used on species which do not have the appropriate fertile material for identification.
PCTs that are classified under the Vegetation Classification database as being in the saline wetlands vegetation formation must be assessed according to the BAM. For development proposals, OEH also recommends assessors consult with NSW Fisheries (see the Fisheries NSW policy and guidelines for fish habitat conservation and management (update 2013)) for PCTs such as saltmarsh and mangroves and any threatened ecological communities (vulnerable, endangered and critically endangered ecological communities) which are classified under the saline wetlands formation.
In addition to identifying and mapping the PCTs on the Site Map the assessor is required to:
1. record the estimated percent cleared value of each PCT
2. identify and map the distribution of:
threatened ecological communities (vulnerable, endangered and critically endangered ecological communities) that are associated with the PCTs
derived, planted or secondary vegetation communities where the assessor cannot determine the original PCT.
Refer to Box 1 for further explanation.
Box 1 – Supporting information for determination of percent cleared value, TEC status, and derived, planted or secondary vegetation communities
Percent cleared value
The percent cleared value for a PCT can be obtained from the BioNet Vegetation Classification. It is also displayed in the Calculator.
Percent cleared value is the proportion of remnant PCT relative to the estimated distribution prior to 1750. The value is used to determine the threat status class of the ecosystem credit generated from the proposed impact on that PCT (see Section 11.3 of the BAM).
Threatened ecological communities
The BioNet Vegetation Classification provides an indication of whether a PCT may be a TEC, but the list is not exhaustive. The assessor must determine whether any of the vegetation meets the definition of a TEC listed under the BC Act. For example, the assessor should compare the PCT description to that of the NSW Scientific Committee Determination, which describes the community composition of a likely TEC. Up to date information on threatened ecological community listings for New South Wales can be found on the NSW Threatened Species webpage. Case law may also be consulted to determine if vegetation meets the definition of a TEC.
Derived or planted communities
Derived or secondary vegetation is vegetation that has changed to an alternative stable state as a consequence of land management practices since European settlement. Derived communities can have one or more structural components of the vegetation entirely removed or severely reduced (e.g. over-storey of grassy woodland) or have developed new structural components where they were previously absent (e.g. shrubby mid-storey in an open woodland system).
Biodiversity Assessment Method Operational Manual
16
Derived PCTs differ from PCTs that have been modified from their natural state in that the derived PCTs are unlikely to revert to the natural state without significant active restoration.
The BioNet Vegetation Classification does contain PCTs that are derived or secondary vegetation communities (i.e. the PCTs have been modified substantially since 1750); however, they are generic and lack values such as percent cleared estimates.
The assessor must determine the most likely original PCT for areas of derived native vegetation. In determining the most likely PCT that occupied the site prior to modification, the assessor should use nearby reference sites with similar geophysical characteristics (e.g. position, landform, aspect and lithology) to give an indication of the most likely original PCT on the subject land.
Some derived vegetation may meet the definition of a TEC. For example, a derived native grassland with a species composition similar to Box Gum Grassy Woodland (without the over-storey of trees) may be a Box Gum Grassy Woodland TEC. The assessor should follow the steps above for stratifying native vegetation when considering whether a vegetation community is a TEC.
Planted native vegetation is treated in the same way as native vegetation if it meets the definition of native vegetation in Section 5A of the Local Land Services Act 2013. Where the vegetation is a mix of local and non-local planted species the assessor should consider the best matching PCT based on the local species present.
Mapping vegetation zones
Vegetation zones are areas of the same PCT with the same broad condition state. They are mapped in accordance with Subsection 5.3.1 of the BAM.
The assessor must:
• stratify areas of each PCT that are in different broad condition states into separate vegetation zones (e.g. sections of intact vegetation should be separated from sections that have been significantly degraded by grazing, weeds, or where strata layers are absent, or for stewardship sites, areas with different management requirements)
• describe each vegetation zone in the BAR to accurately reflect significant and distinct differences in condition
• calculate the area of each vegetation zone in hectares.
The assessor enters each vegetation zone into the Calculator. The Calculator will assign it a zone number and the relevant PCT number with space for the assessor to type a general description of the zone (this does not influence condition scores or credit calculations).
Descriptions of the vegetation zones are also required in the BAR and should include the general description for the PCT, any defining characteristics and the area of extent.
Vegetation zones made up of one or more discontinuous remnants (i.e. fragments of the same PCT in the same broad condition states) or multiple vegetation zones (i.e. different PCTs and/or the same PCT in different broad condition states) should be represented by separate polygons.
Separate vegetation zones are required for:
• parts of the subject land where the vegetation has a current vegetation integrity score of:
○ <15 for a PCT representative of a critically endangered ecological community (CEEC) or an endangered ecological community (EEC)
○ <17 for a PCT that provides habitat for threatened species or is representative of a vulnerable ecological community (VEC)
Biodiversity Assessment Method Operational Manual
17
○ <20 for a PCT that is not representative of a TEC or associated with threatened species habitat (see Section 3.1 of the BAM)
as vegetation below this threshold does not require an offset in the form of ecosystem credits
• derived, planted or secondary PCTs such as a derived native grassland
• paddock tree areas.
While a vegetation zone is not required for cleared land or land that does not contain native vegetation on a development site it should be shown on the Site Map. Cleared land can be included in a vegetation zone on a stewardship site where active restoration management actions are proposed.
Where PCTs are too small to sample (e.g. some sandstone riparian communities in the Sydney Basin) the assessor should consult OEH about appropriate means of sampling.
Mapped vegetation zones are confirmed by field reconnaissance, which may result in boundary changes or reallocation of some areas to different zones.
Examples for identifying and mapping vegetation zones
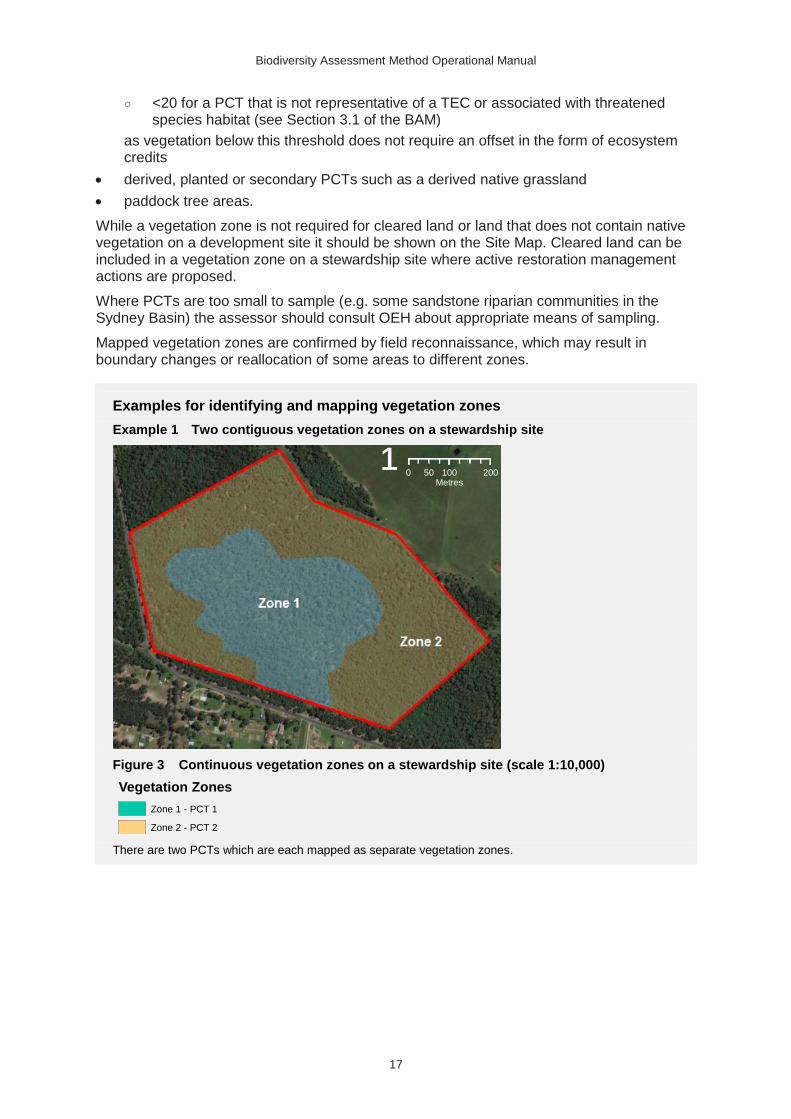
Example 1 Two contiguous vegetation zones on a stewardship site
Figure 3 Continuous vegetation zones on a stewardship site (scale 1:10,000)
There are two PCTs which are each mapped as separate vegetation zones.
Vegetation Zones
Zone 1 - PCT 1
Zone 2 - PCT 2
¹ 0 100 20050Metres
Biodiversity Assessment Method Operational Manual
18
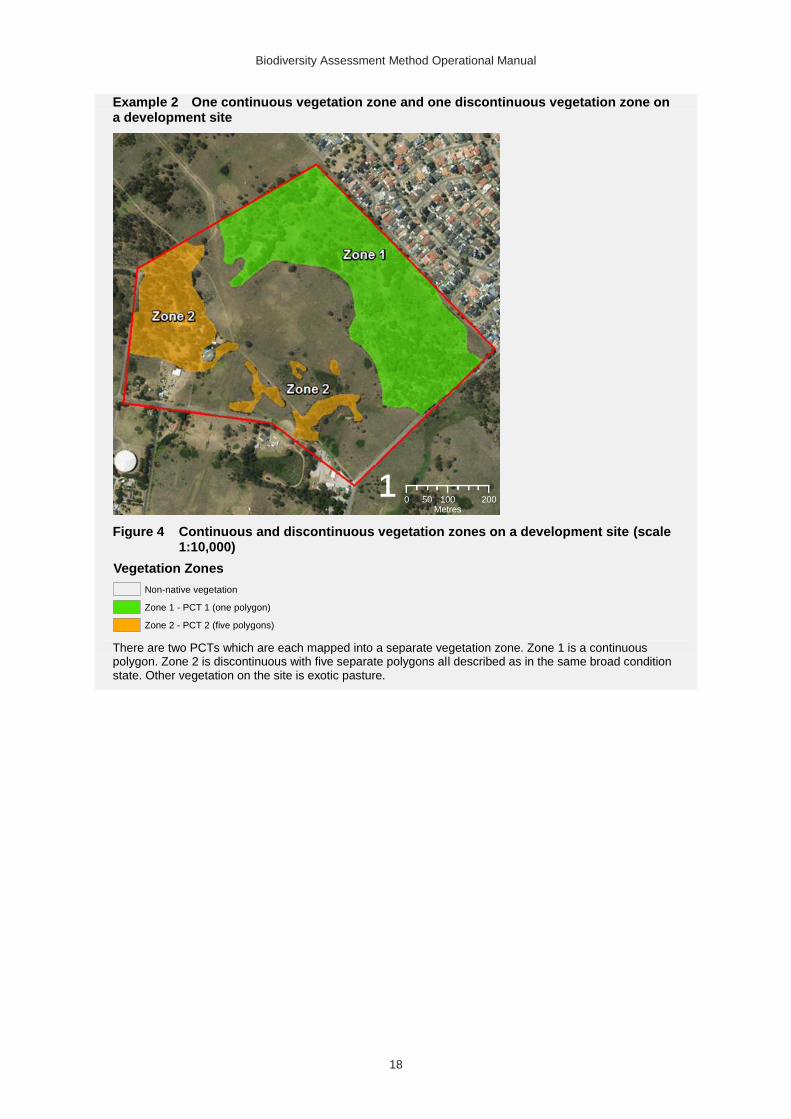
Example 2 One continuous vegetation zone and one discontinuous vegetation zone on a development site
Figure 4 Continuous and discontinuous vegetation zones on a development site (scale 1:10,000)
There are two PCTs which are each mapped into a separate vegetation zone. Zone 1 is a continuous polygon. Zone 2 is discontinuous with five separate polygons all described as in the same broad condition state. Other vegetation on the site is exotic pasture.
Vegetation Zones
Non-native vegetation
Zone 1 - PCT 1 (one polygon)
Zone 2 - PCT 2 (five polygons)
¹ 0 100 20050Metres
Biodiversity Assessment Method Operational Manual
19
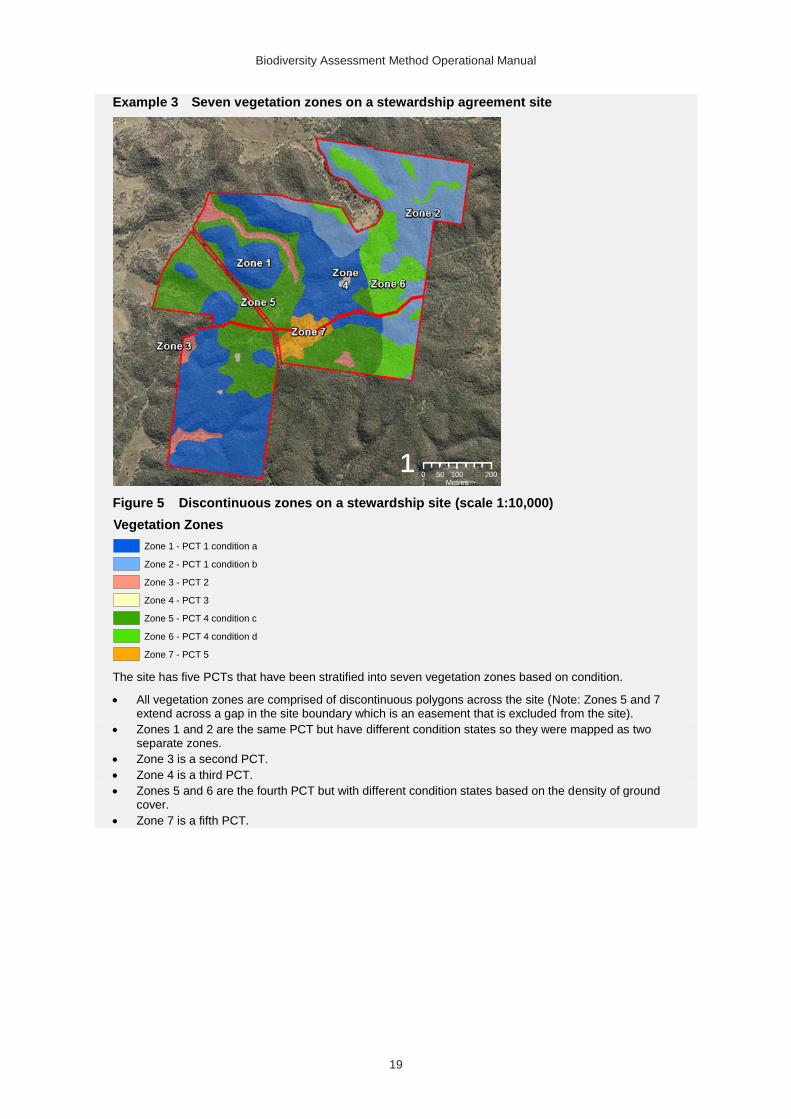
Example 3 Seven vegetation zones on a stewardship agreement site
Figure 5 Discontinuous zones on a stewardship site (scale 1:10,000)
The site has five PCTs that have been stratified into seven vegetation zones based on condition.
• All vegetation zones are comprised of discontinuous polygons across the site (Note: Zones 5 and 7 extend across a gap in the site boundary which is an easement that is excluded from the site).
• Zones 1 and 2 are the same PCT but have different condition states so they were mapped as two separate zones.
• Zone 3 is a second PCT.
• Zone 4 is a third PCT.
• Zones 5 and 6 are the fourth PCT but with different condition states based on the density of ground cover.
• Zone 7 is a fifth PCT.
Vegetation Zones
Zone 1 - PCT 1 condition a
Zone 2 - PCT 1 condition b
Zone 3 - PCT 2
Zone 4 - PCT 3
Zone 5 - PCT 4 condition c
Zone 6 - PCT 4 condition d
Zone 7 - PCT 5
¹ 0 100 20050Metres
Biodiversity Assessment Method Operational Manual
20
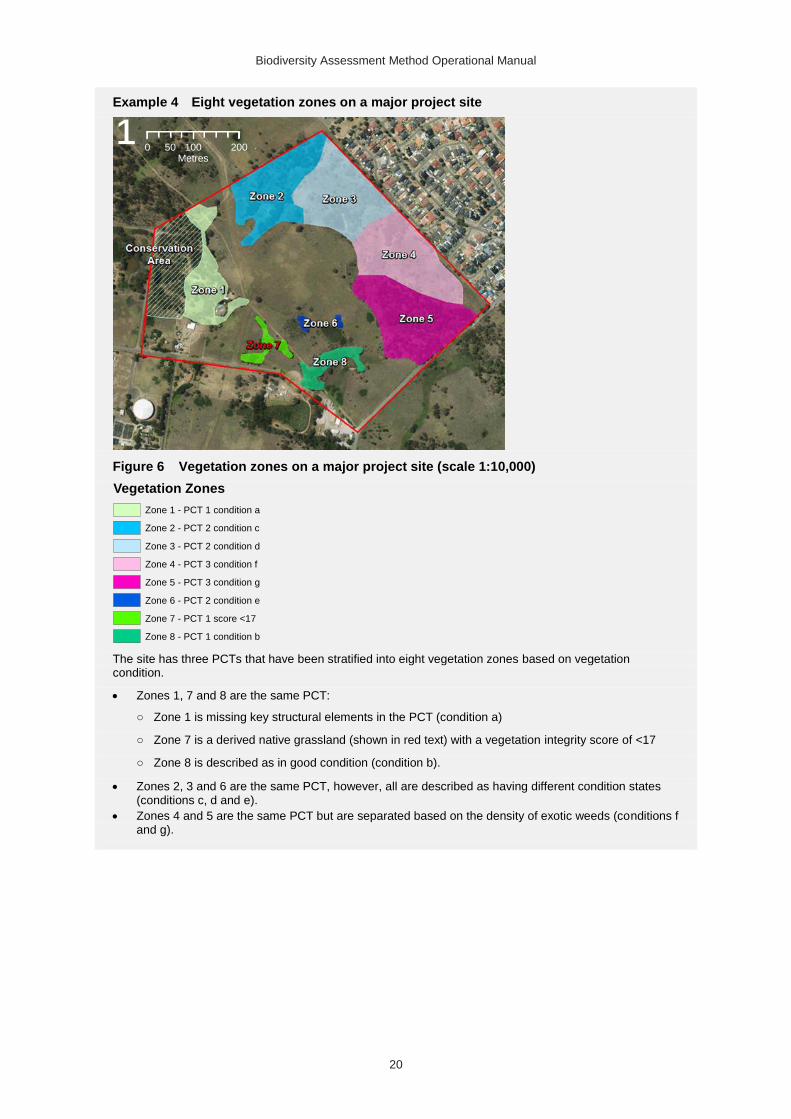
Example 4 Eight vegetation zones on a major project site
Figure 6 Vegetation zones on a major project site (scale 1:10,000)
The site has three PCTs that have been stratified into eight vegetation zones based on vegetation condition.
• Zones 1, 7 and 8 are the same PCT:
○ Zone 1 is missing key structural elements in the PCT (condition a)
○ Zone 7 is a derived native grassland (shown in red text) with a vegetation integrity score of <17
○ Zone 8 is described as in good condition (condition b).
• Zones 2, 3 and 6 are the same PCT, however, all are described as having different condition states (conditions c, d and e).
• Zones 4 and 5 are the same PCT but are separated based on the density of exotic weeds (conditions f and g).
Vegetation Zones
Zone 1 - PCT 1 condition a
Zone 2 - PCT 2 condition c
Zone 3 - PCT 2 condition d
Zone 4 - PCT 3 condition f
Zone 5 - PCT 3 condition g
Zone 6 - PCT 2 condition e
Zone 7 - PCT 1 score <17
Zone 8 - PCT 1 condition b
¹ 0 100 20050Metres
Biodiversity Assessment Method Operational Manual
21
Patch size
A patch is defined in the BAM as an area of intact native vegetation that occurs on the subject land. The patch may extend onto adjoining land beyond the footprint of the subject land, and for woody ecosystems, includes native vegetation separated by ≤100 metres from the next area of intact native vegetation. For non-woody vegetation, this gap is reduced to ≤30 metres.
Intact vegetation must contain all structural layers (strata) characteristic of the PCT. Plot data should not be solely relied upon when determining whether vegetation is intact. If all structural growth form groups expected to exist within the community are present within the vegetation zone and/or adjoining off-site native vegetation, then the vegetation meets the definition of intact. For example, if all structural growth form groups except the shrub layer are present in the plots but species that belong to the shrub growth form group occur elsewhere within the vegetation zone, then the shrub growth form group is present, and the vegetation is intact.
Patch size for each vegetation zone located on the subject land is mapped in accordance with Subsection 5.3.2 of the BAM using the following steps:
1. Identify vegetation zones that will be included in the same patch (i.e. vegetation zones located within 100 metres of one another for intact native woody vegetation and within 30 metres of one another for intact native non-woody vegetation).
2. Identify the boundary of any adjoining intact native vegetation which extends beyond the limit of the subject land.
3. Digitise each patch using separate polygons where multiple patches exist.
4. Calculate the area of each patch in hectares.
Details of the patch size for each vegetation zone must be documented in the BAR and entered into the Calculator. If multiple vegetation zones are included in a single patch, the assessor should enter the same patch size in the Calculator for each of these zones. Alternatively, more than one patch size class can be entered into the Calculator for a vegetation zone if it is made up of multiple discontinuous patches of different sizes. Here separate vegetation zones are entered into the Calculator, each with its own patch size and the same plot data.
The patch is allocated to a patch size class (<5ha, 5–24ha, 25–100ha or >100ha – see Subsection 5.3.2 of the BAM) by the Calculator. Patch size class is used as a filter to predict threatened species likely to occur or use habitat on subject land (see Part 3 of this Manual).
Biodiversity Assessment Method Operational Manual
22
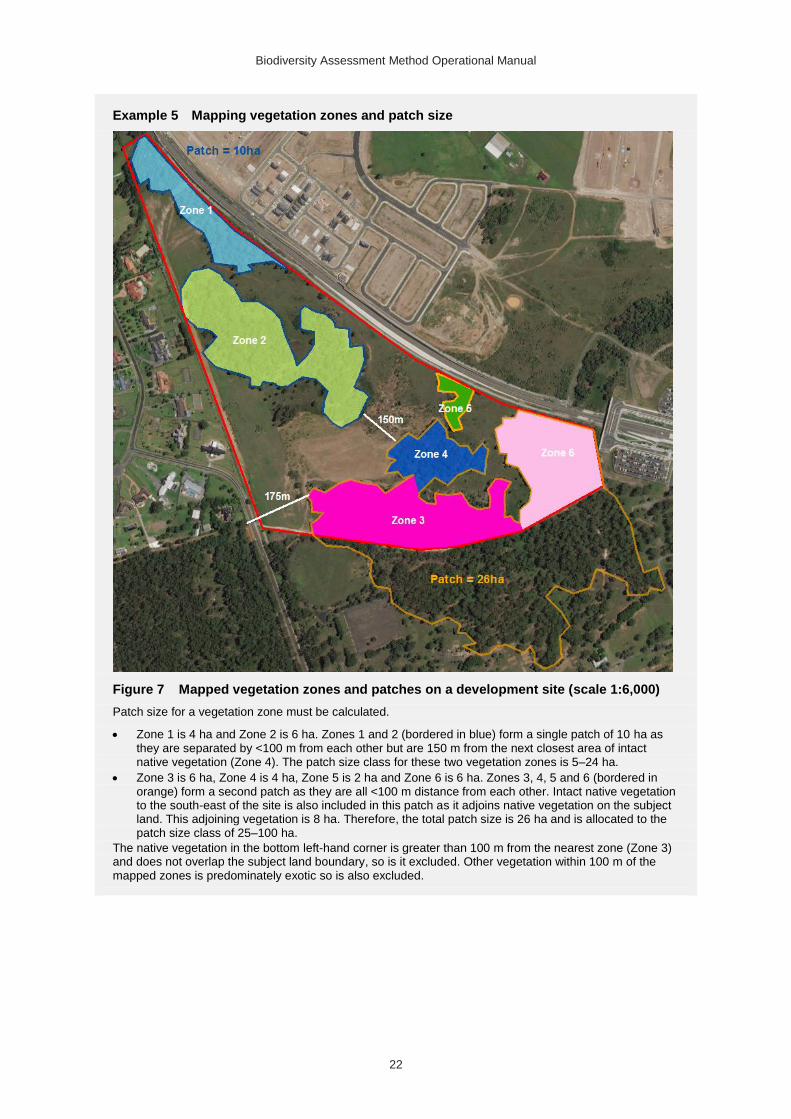
Example 5 Mapping vegetation zones and patch size
Figure 7 Mapped vegetation zones and patches on a development site (scale 1:6,000)
Patch size for a vegetation zone must be calculated.
• Zone 1 is 4 ha and Zone 2 is 6 ha. Zones 1 and 2 (bordered in blue) form a single patch of 10 ha as they are separated by <100 m from each other but are 150 m from the next closest area of intact native vegetation (Zone 4). The patch size class for these two vegetation zones is 5–24 ha.
• Zone 3 is 6 ha, Zone 4 is 4 ha, Zone 5 is 2 ha and Zone 6 is 6 ha. Zones 3, 4, 5 and 6 (bordered in orange) form a second patch as they are all <100 m distance from each other. Intact native vegetation to the south-east of the site is also included in this patch as it adjoins native vegetation on the subject land. This adjoining vegetation is 8 ha. Therefore, the total patch size is 26 ha and is allocated to the patch size class of 25–100 ha.
The native vegetation in the bottom left-hand corner is greater than 100 m from the nearest zone (Zone 3) and does not overlap the subject land boundary, so is it excluded. Other vegetation within 100 m of the mapped zones is predominately exotic so is also excluded.
Biodiversity Assessment Method Operational Manual
23
Vegetation integrity assessment (site condition)
The assessor must undertake a vegetation integrity assessment in accordance with Section 5.3 of the BAM. The vegetation integrity is different from previous approaches to assess vegetation condition (e.g. under BBAM, FBA) in that it:
• uses data-driven benchmarks
• uses vegetation growth forms rather than vegetation strata to estimate vegetation condition
• uses dynamic rather than static attribute weights in calculations
• aggregates composition, structure and function scores using a geometric mean
• scores attribute condition using a continuous non-linear function.
The Native Vegetation Integrity Benchmarks: An information sheet provides further detail on the approach to assessing vegetation condition under the BAM.
Field surveys (including targeted surveys for ‘species credits species’) less than five years old can be used in place of onsite survey. Time limitations are imposed to ensure data used in assessments reflect the current biodiversity values on the subject land.
Plot survey
The assessor must undertake plot surveys for each vegetation zone. The fundamental requirements for survey design are detailed in Section 5 of the of the Native Vegetation Interim Type Standard (the Standard; Sivertsen 2009).
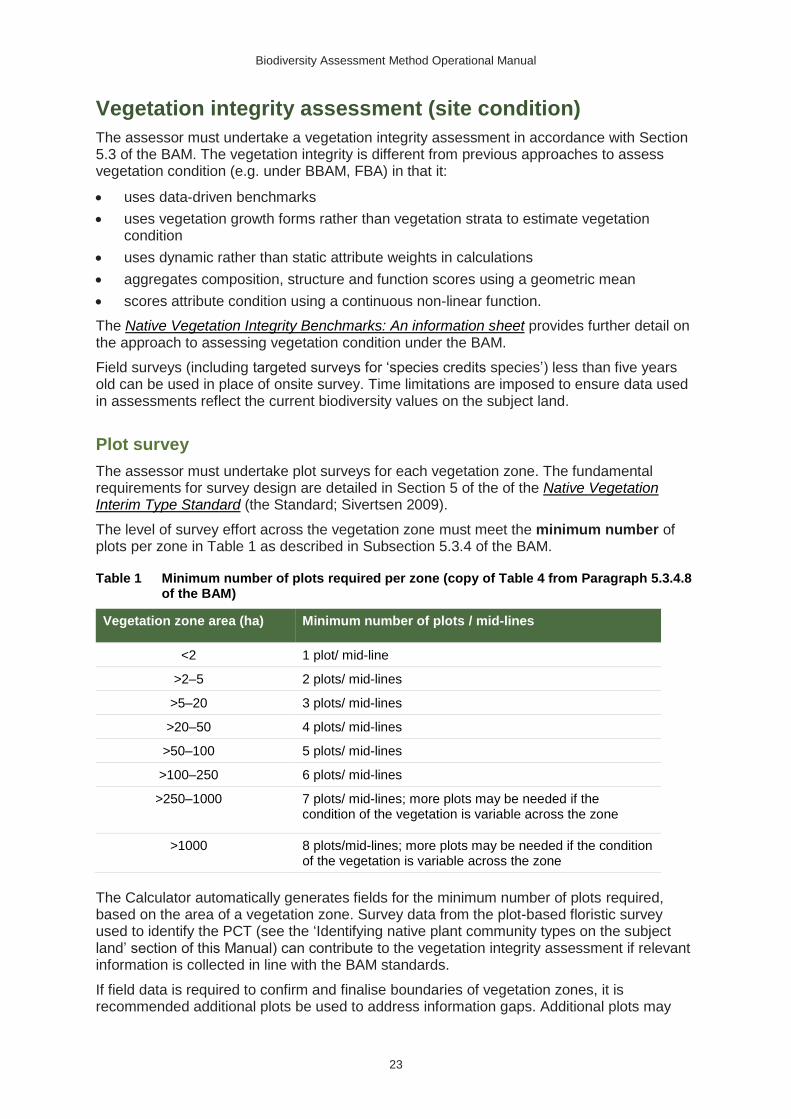
The level of survey effort across the vegetation zone must meet the minimum number of plots per zone in Table 1 as described in Subsection 5.3.4 of the BAM.
Table 1 Minimum number of plots required per zone (copy of Table 4 from Paragraph 5.3.4.8 of the BAM)
Vegetation zone area (ha) Minimum number of plots / mid-lines
<2 1 plot/ mid-line
>2–5 2 plots/ mid-lines
>5–20 3 plots/ mid-lines
>20–50 4 plots/ mid-lines
>50–100 5 plots/ mid-lines
>100–250 6 plots/ mid-lines
>250–1000 7 plots/ mid-lines; more plots may be needed if the condition of the vegetation is variable across the zone
>1000 8 plots/mid-lines; more plots may be needed if the condition of the vegetation is variable across the zone
The Calculator automatically generates fields for the minimum number of plots required, based on the area of a vegetation zone. Survey data from the plot-based floristic survey used to identify the PCT (see the ‘Identifying native plant community types on the subject land’ section of this Manual) can contribute to the vegetation integrity assessment if relevant information is collected in line with the BAM standards.
If field data is required to confirm and finalise boundaries of vegetation zones, it is recommended additional plots be used to address information gaps. Additional plots may
Biodiversity Assessment Method Operational Manual
24
also be required to provide a representative sample of highly variable vegetation. Where plot data indicates significant differences in vegetation condition across the vegetation zone, it must be split into zones of relatively homogenous condition states (see the ‘Mapping vegetation zones’ section of this Manual).
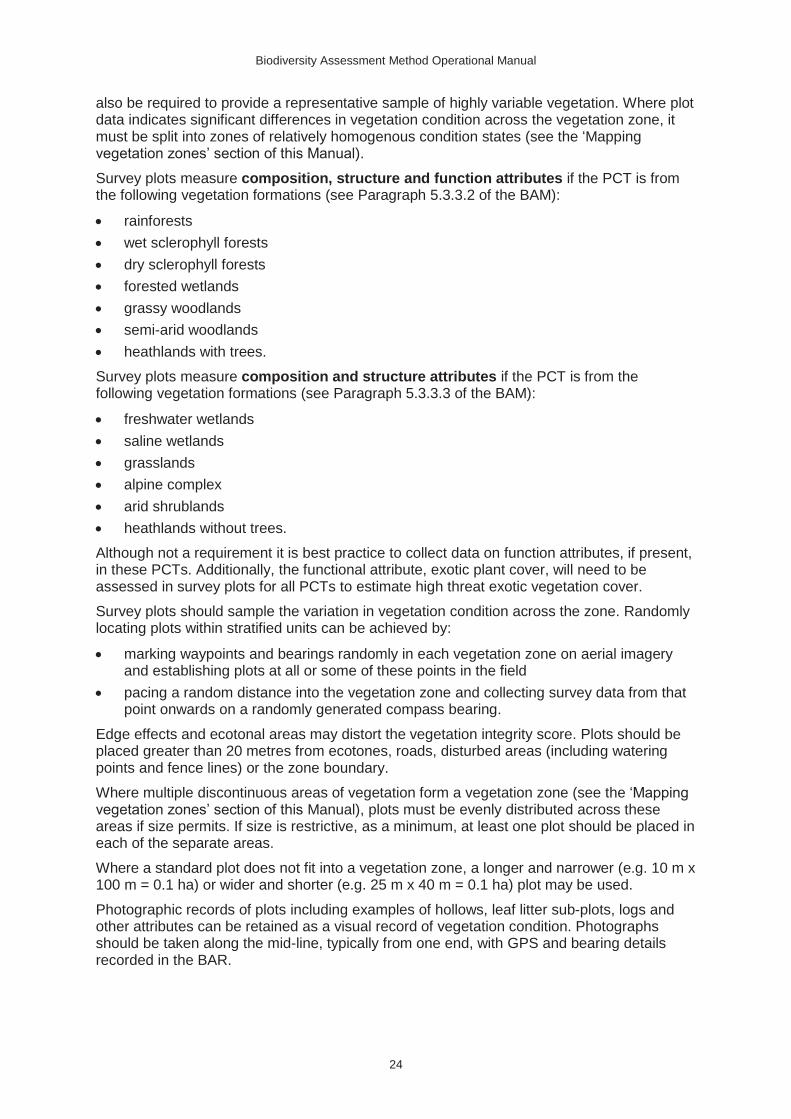
Survey plots measure composition, structure and function attributes if the PCT is from the following vegetation formations (see Paragraph 5.3.3.2 of the BAM):
• rainforests
• wet sclerophyll forests
• dry sclerophyll forests
• forested wetlands
• grassy woodlands
• semi-arid woodlands
• heathlands with trees.
Survey plots measure composition and structure attributes if the PCT is from the following vegetation formations (see Paragraph 5.3.3.3 of the BAM):
• freshwater wetlands
• saline wetlands
• grasslands
• alpine complex
• arid shrublands
• heathlands without trees.
Although not a requirement it is best practice to collect data on function attributes, if present, in these PCTs. Additionally, the functional attribute, exotic plant cover, will need to be assessed in survey plots for all PCTs to estimate high threat exotic vegetation cover.
Survey plots should sample the variation in vegetation condition across the zone. Randomly locating plots within stratified units can be achieved by:
• marking waypoints and bearings randomly in each vegetation zone on aerial imagery and establishing plots at all or some of these points in the field
• pacing a random distance into the vegetation zone and collecting survey data from that point onwards on a randomly generated compass bearing.
Edge effects and ecotonal areas may distort the vegetation integrity score. Plots should be placed greater than 20 metres from ecotones, roads, disturbed areas (including watering points and fence lines) or the zone boundary.
Where multiple discontinuous areas of vegetation form a vegetation zone (see the ‘Mapping vegetation zones’ section of this Manual), plots must be evenly distributed across these areas if size permits. If size is restrictive, as a minimum, at least one plot should be placed in each of the separate areas.
Where a standard plot does not fit into a vegetation zone, a longer and narrower (e.g. 10 m x 100 m = 0.1 ha) or wider and shorter (e.g. 25 m x 40 m = 0.1 ha) plot may be used.
Photographic records of plots including examples of hollows, leaf litter sub-plots, logs and other attributes can be retained as a visual record of vegetation condition. Photographs should be taken along the mid-line, typically from one end, with GPS and bearing details recorded in the BAR.
Biodiversity Assessment Method Operational Manual
25
Field survey
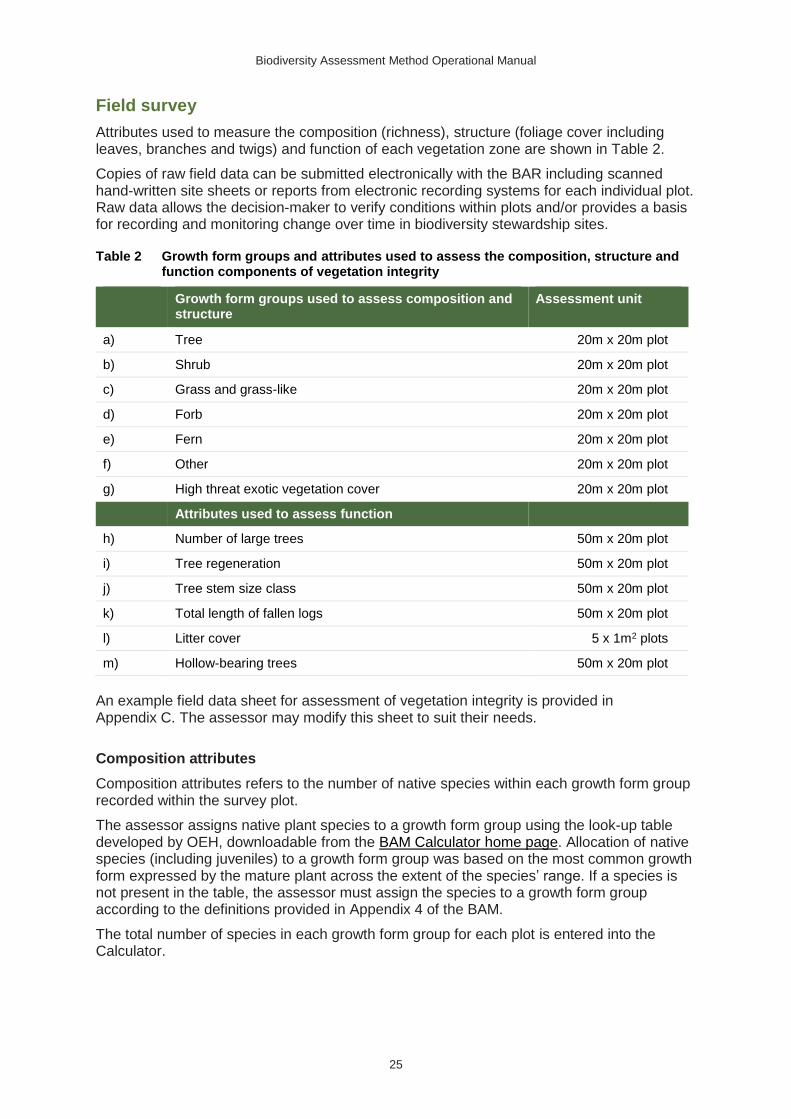
Attributes used to measure the composition (richness), structure (foliage cover including leaves, branches and twigs) and function of each vegetation zone are shown in Table 2.
Copies of raw field data can be submitted electronically with the BAR including scanned hand-written site sheets or reports from electronic recording systems for each individual plot. Raw data allows the decision-maker to verify conditions within plots and/or provides a basis for recording and monitoring change over time in biodiversity stewardship sites.
Table 2 Growth form groups and attributes used to assess the composition, structure and function components of vegetation integrity
Growth form groups used to assess composition and structure
Assessment unit
a) Tree 20m x 20m plot
b) Shrub 20m x 20m plot
c) Grass and grass-like 20m x 20m plot
d) Forb 20m x 20m plot
e) Fern 20m x 20m plot
f) Other 20m x 20m plot
g) High threat exotic vegetation cover 20m x 20m plot
Attributes used to assess function
h) Number of large trees 50m x 20m plot
i) Tree regeneration 50m x 20m plot
j) Tree stem size class 50m x 20m plot
k) Total length of fallen logs 50m x 20m plot
l) Litter cover 5 x 1m2 plots
m) Hollow-bearing trees 50m x 20m plot
An example field data sheet for assessment of vegetation integrity is provided in Appendix C. The assessor may modify this sheet to suit their needs.
Composition attributes
Composition attributes refers to the number of native species within each growth form group recorded within the survey plot.
The assessor assigns native plant species to a growth form group using the look-up table developed by OEH, downloadable from the BAM Calculator home page. Allocation of native species (including juveniles) to a growth form group was based on the most common growth form expressed by the mature plant across the extent of the species’ range. If a species is not present in the table, the assessor must assign the species to a growth form group according to the definitions provided in Appendix 4 of the BAM.
The total number of species in each growth form group for each plot is entered into the Calculator.
Biodiversity Assessment Method Operational Manual
26
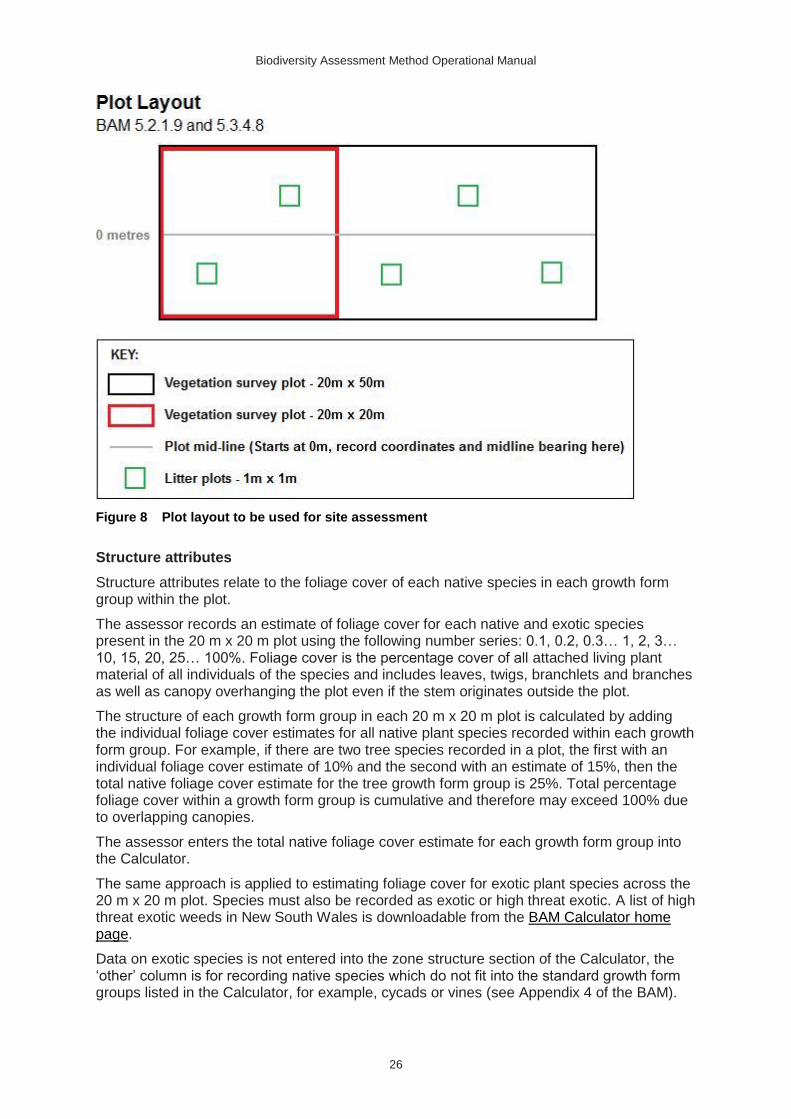
Figure 8 Plot layout to be used for site assessment
Structure attributes
Structure attributes relate to the foliage cover of each native species in each growth form group within the plot.
The assessor records an estimate of foliage cover for each native and exotic species present in the 20 m x 20 m plot using the following number series: 0.1, 0.2, 0.3… 1, 2, 3… 10, 15, 20, 25… 100%. Foliage cover is the percentage cover of all attached living plant material of all individuals of the species and includes leaves, twigs, branchlets and branches as well as canopy overhanging the plot even if the stem originates outside the plot.
The structure of each growth form group in each 20 m x 20 m plot is calculated by adding the individual foliage cover estimates for all native plant species recorded within each growth form group. For example, if there are two tree species recorded in a plot, the first with an individual foliage cover estimate of 10% and the second with an estimate of 15%, then the total native foliage cover estimate for the tree growth form group is 25%. Total percentage foliage cover within a growth form group is cumulative and therefore may exceed 100% due to overlapping canopies.
The assessor enters the total native foliage cover estimate for each growth form group into the Calculator.
The same approach is applied to estimating foliage cover for exotic plant species across the 20 m x 20 m plot. Species must also be recorded as exotic or high threat exotic. A list of high threat exotic weeds in New South Wales is downloadable from the BAM Calculator home page.
Data on exotic species is not entered into the zone structure section of the Calculator, the ‘other’ column is for recording native species which do not fit into the standard growth form groups listed in the Calculator, for example, cycads or vines (see Appendix 4 of the BAM).
Biodiversity Assessment Method Operational Manual
27
Instead, the foliage cover of high threat exotic weeds is recorded in the zone function data section of the Calculator (see the ‘Function attributes’ section of this Manual).
Function attributes
Function attributes include tree stem size classes, number of large trees, tree regeneration, length of fallen logs and leaf litter. Attributes are assessed in each 20 m x 50 m plot and should only include living trees and the largest stem of multi-stemmed trees.
Presence or absence of each tree stem size class from five centimetres DBH (diameter at breast height over bark measured at 1.3 metres above ground level) to the large tree threshold size is recorded and entered into the Calculator. For example, when the large tree threshold size is 50 centimetres, tree stem size classes are 5–9, 10–19, 20–29, 30–49 cm DBH.
While only presence or absence data is required for a BAM assessment actual counts or estimates of the number of stems within each size class can be used to improve thinning thresholds and benchmark data within the BioNet Vegetation Classification.
The number of large trees is assessed by counting all living stems with a DBH equal to or greater than the large tree threshold DBH for the PCT or vegetation class. Threshold size is located in the PCT description in the BioNet Vegetation Classification. The number of large trees is entered into the Calculator.
Tree regeneration is assessed as presence or absence of trees of <5 cm DBH. Only presence or absence is entered into the Calculator.
An estimate of the total length of fallen logs is made by adding together the lengths of all dead woody material greater than 10 centimetres in diameter that is entirely or partly on the ground, within the 20 m x 50 m plot. Where logs extend outside the plot only the length within the plot is recorded. The assessor enters the total length of fallen logs in metres into the Calculator.
Percentage litter cover is measured in five 1 m x 1 m sub-plots located evenly along the 50 metres mid-line (see Figure 8). Litter is taken as plant material detached from a plant including leaves, seeds, twigs, branchlets and branches with diameter of <10 cm. Litter not in contact with the ground is not recorded. The assessor averages the litter cover from the five sub-plots to generate the average percentage litter cover for the entire plot, which is entered into the Calculator.
The total percentage of high threat weed cover for each 20 m x 20 m plot is entered into the Calculator. Although this figure is estimated during collection of structure attribute data (Paragraph 5.3.4.17 of the BAM), it is entered in the function data section of the Calculator. The proportion of high threat weed cover impacts the potential rate of improvement and rehabilitation at a biodiversity stewardship site.
The number of hollow-bearing trees is counted in each plot. A hollow-bearing tree can be living or dead but must contain at least one hollow with an opening width greater than or equal to five centimetres and the hollow must be at least one metre above the ground (see Paragraph 5.3.4.29 of the BAM). Plant species allocated to the shrub growth form can be counted where the hollow meets the above requirements. The number of hollow-bearing trees for each plot is entered into the Calculator.
It is worth noting that hollow-bearing trees do not contribute directly to the vegetation integrity score. The ‘count of hollowing bearing trees’ attribute used in past assessment methods (e.g. BBAM, FBA) has been replaced by the function attribute ‘number of large trees’. The change is in recognition of the importance of large trees in the provision of food, habitat and other resources (in addition to hollows), and the fact that counts of trees with hollows can vary significantly between assessors. However, data on hollow-bearing trees are used:
Biodiversity Assessment Method Operational Manual
28
• in the assessment of habitat suitability for threatened species reliant on hollows for breeding or roosting, particularly those with specific requirements
• on the credit profile for ecosystem credits, if impacted vegetation contains hollow-bearing trees then the offset site must also contain hollow-bearing trees.
Determine the vegetation integrity score
Vegetation integrity scores are used in the BAM during:
• Stage 1 (Biodiversity assessment) to describe the current condition of the subject site, the potential impacts of a proposed development, and when assessing anticipated improvements to biodiversity values on biodiversity stewardship sites.
• Stage 2 (Impact assessment) to determine the impact of development (i.e. the difference between the current and future site condition), which is in turn used to calculate the number of:
○ ecosystem credits required to offset the impacts to that vegetation zone
○ species credits required to offset the impacts to a species habitat (defined by the species polygon, see Part 3 of this Manual) where credit calculations for that species is based on area.
• Stage 3 (Improving biodiversity values) to determine the future site condition from implementing management actions and averted loss from foregoing existing land-use entitlements for a stewardship site, which is in turn used to calculate the number of ecosystem credits created for that vegetation zone or species credits for species assessed by area.
Field data entered into the Calculator is used to compare the composition, structure and function attributes of the vegetation zone against benchmarks for the relevant PCT, generating scores from 0–100. The Calculator then aggregates these three scores to provide the vegetation integrity score. Box 2 explains how the BAM Calculator performs these calculations; they do not need to be performed by the assessor.
Box 2 – Explanation of the calculations performed by the BAM Calculator to determine the composition, structure and function condition scores and the vegetation integrity score
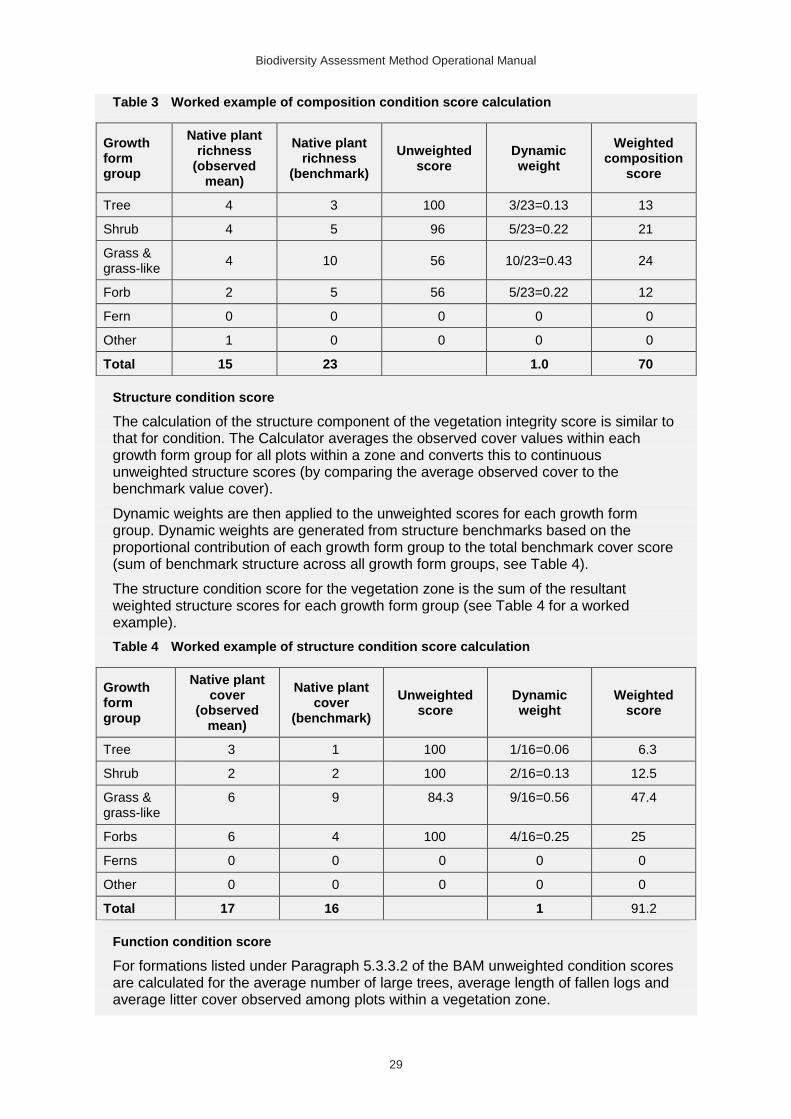
Composition condition score
To calculate the composition component of the vegetation integrity score, the Calculator averages the observed species richness within each growth form group for all plots within a zone and converts this to continuous unweighted condition scores (by comparing the average observed richness to the benchmark value richness).
Dynamic weights are then applied to the unweighted scores for each growth form group. Dynamic weights are generated from richness benchmarks based on the proportional contribution of each growth form group to the total richness (sum of benchmark richness across all growth form groups, see below).
The composition condition score for the vegetation zone is the sum of the resultant weighted composition scores for each growth form group.
Biodiversity Assessment Method Operational Manual
29
Table 3 Worked example of composition condition score calculation
Growth form group
Native plant richness
(observed mean)
Native plant richness
(benchmark)
Unweighted score
Dynamic weight
Weighted composition
score
Tree 4 3 100 3/23=0.13 13
Shrub 4 5 96 5/23=0.22 21
Grass & grass-like
4 10 56 10/23=0.43 24
Forb 2 5 56 5/23=0.22 12
Fern 0 0 0 0 0
Other 1 0 0 0 0
Total 15 23 1.0 70
Structure condition score
The calculation of the structure component of the vegetation integrity score is similar to that for condition. The Calculator averages the observed cover values within each growth form group for all plots within a zone and converts this to continuous unweighted structure scores (by comparing the average observed cover to the benchmark value cover).
Dynamic weights are then applied to the unweighted scores for each growth form group. Dynamic weights are generated from structure benchmarks based on the proportional contribution of each growth form group to the total benchmark cover score (sum of benchmark structure across all growth form groups, see Table 4).
The structure condition score for the vegetation zone is the sum of the resultant weighted structure scores for each growth form group (see Table 4 for a worked example).
Table 4 Worked example of structure condition score calculation
Growth form group
Native plant cover
(observed mean)
Native plant cover
(benchmark)
Unweighted score
Dynamic weight
Weighted score
Tree 3 1 100 1/16=0.06 6.3
Shrub 2 2 100 2/16=0.13 12.5
Grass & grass-like
6 9 84.3 9/16=0.56 47.4
Forbs 6 4 100 4/16=0.25 25
Ferns 0 0 0 0 0
Other 0 0 0 0 0
Total 17 16 1 91.2
Function condition score
For formations listed under Paragraph 5.3.3.2 of the BAM unweighted condition scores are calculated for the average number of large trees, average length of fallen logs and average litter cover observed among plots within a vegetation zone.
Biodiversity Assessment Method Operational Manual
30
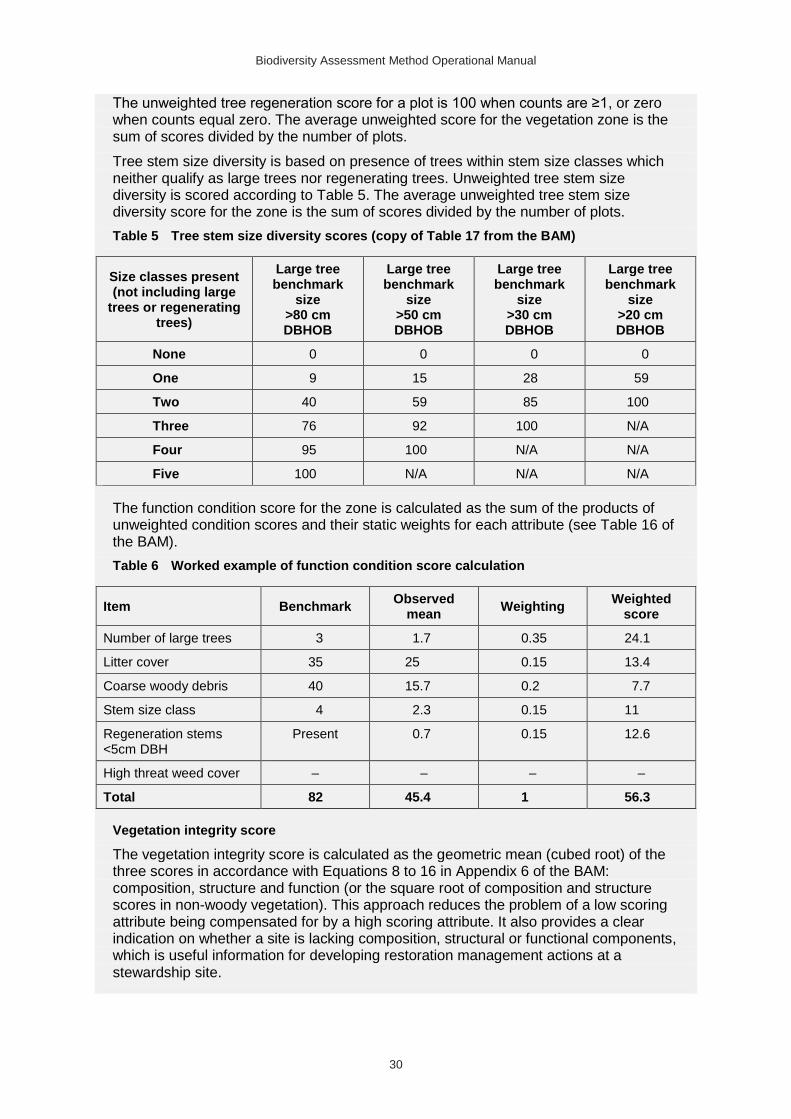
The unweighted tree regeneration score for a plot is 100 when counts are ≥1, or zero when counts equal zero. The average unweighted score for the vegetation zone is the sum of scores divided by the number of plots.
Tree stem size diversity is based on presence of trees within stem size classes which neither qualify as large trees nor regenerating trees. Unweighted tree stem size diversity is scored according to Table 5. The average unweighted tree stem size diversity score for the zone is the sum of scores divided by the number of plots.
Table 5 Tree stem size diversity scores (copy of Table 17 from the BAM)
Size classes present (not including large
trees or regenerating trees)
Large tree benchmark
size >80 cm DBHOB
Large tree benchmark
size >50 cm DBHOB
Large tree benchmark
size >30 cm DBHOB
Large tree benchmark
size >20 cm DBHOB
None 0 0 0 0
One 9 15 28 59
Two 40 59 85 100
Three 76 92 100 N/A
Four 95 100 N/A N/A
Five 100 N/A N/A N/A
The function condition score for the zone is calculated as the sum of the products of unweighted condition scores and their static weights for each attribute (see Table 16 of the BAM).
Table 6 Worked example of function condition score calculation
Item Benchmark Observed
mean Weighting
Weighted score
Number of large trees 3 1.7 0.35 24.1
Litter cover 35 25 0.15 13.4
Coarse woody debris 40 15.7 0.2 7.7
Stem size class 4 2.3 0.15 11
Regeneration stems <5cm DBH
Present 0.7 0.15 12.6
High threat weed cover – – – –
Total 82 45.4 1 56.3
Vegetation integrity score
The vegetation integrity score is calculated as the geometric mean (cubed root) of the three scores in accordance with Equations 8 to 16 in Appendix 6 of the BAM: composition, structure and function (or the square root of composition and structure scores in non-woody vegetation). This approach reduces the problem of a low scoring attribute being compensated for by a high scoring attribute. It also provides a clear indication on whether a site is lacking composition, structural or functional components, which is useful information for developing restoration management actions at a stewardship site.
Biodiversity Assessment Method Operational Manual
31
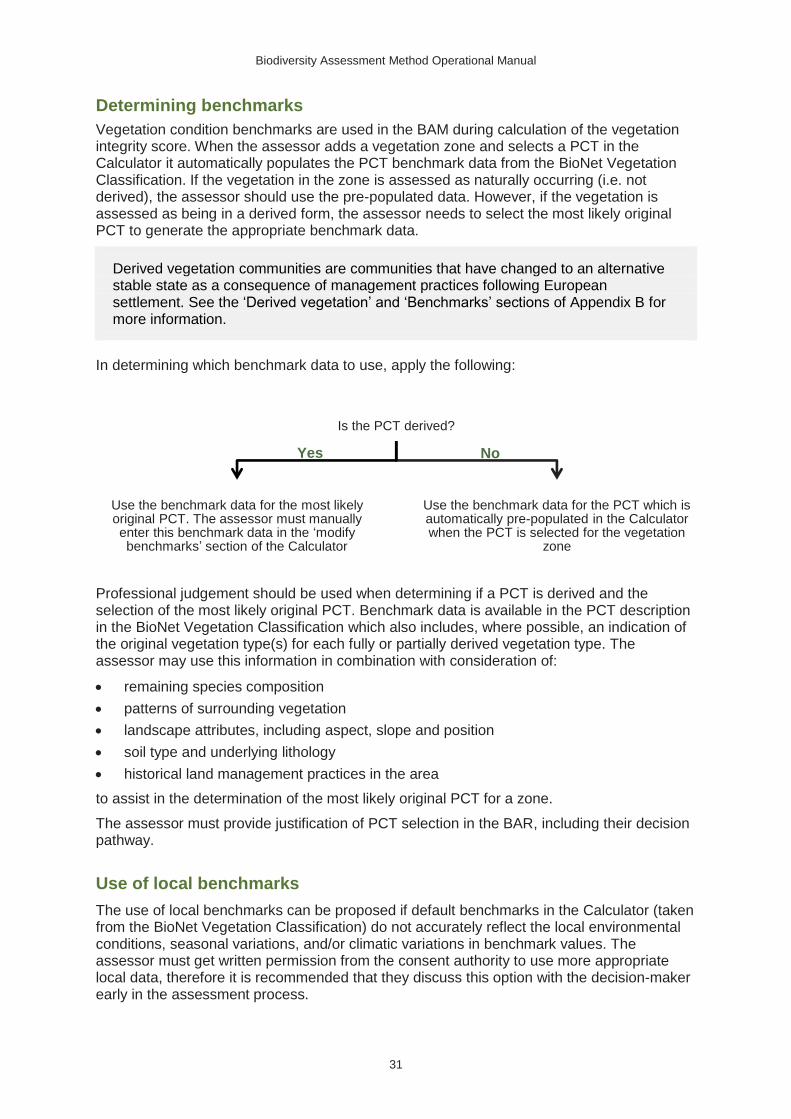
Determining benchmarks
Vegetation condition benchmarks are used in the BAM during calculation of the vegetation integrity score. When the assessor adds a vegetation zone and selects a PCT in the Calculator it automatically populates the PCT benchmark data from the BioNet Vegetation Classification. If the vegetation in the zone is assessed as naturally occurring (i.e. not derived), the assessor should use the pre-populated data. However, if the vegetation is assessed as being in a derived form, the assessor needs to select the most likely original PCT to generate the appropriate benchmark data.
Derived vegetation communities are communities that have changed to an alternative stable state as a consequence of management practices following European settlement. See the ‘Derived vegetation’ and ‘Benchmarks’ sections of Appendix B for more information.
In determining which benchmark data to use, apply the following:
Professional judgement should be used when determining if a PCT is derived and the selection of the most likely original PCT. Benchmark data is available in the PCT description in the BioNet Vegetation Classification which also includes, where possible, an indication of the original vegetation type(s) for each fully or partially derived vegetation type. The assessor may use this information in combination with consideration of:
• remaining species composition
• patterns of surrounding vegetation
• landscape attributes, including aspect, slope and position
• soil type and underlying lithology
• historical land management practices in the area
to assist in the determination of the most likely original PCT for a zone.
The assessor must provide justification of PCT selection in the BAR, including their decision pathway.
Use of local benchmarks
The use of local benchmarks can be proposed if default benchmarks in the Calculator (taken from the BioNet Vegetation Classification) do not accurately reflect the local environmental conditions, seasonal variations, and/or climatic variations in benchmark values. The assessor must get written permission from the consent authority to use more appropriate local data, therefore it is recommended that they discuss this option with the decision-maker early in the assessment process.
Is the PCT derived?
Use the benchmark data for the most likely original PCT. The assessor must manually enter this benchmark data in the ‘modify benchmarks’ section of the Calculator
Use the benchmark data for the PCT which is automatically pre-populated in the Calculator when the PCT is selected for the vegetation
zone
No Yes
Biodiversity Assessment Method Operational Manual
32
Local benchmark data must be collected from nearby reference sites, or obtained from relevant published sources, in accordance with Appendix 5 of the BAM.
The assessor must document the reasons to support the use of local benchmarks in the BAR, including publications, data and other sources of information. Local benchmark data, including shape files where available, must also be documented in the BAR (see the ‘Use of more appropriate local data’ section of the Manual and Section 2.2 of the BAM).
Local benchmarks should not be used for derived vegetation communities as the state of these communities has been influenced by human disturbance.
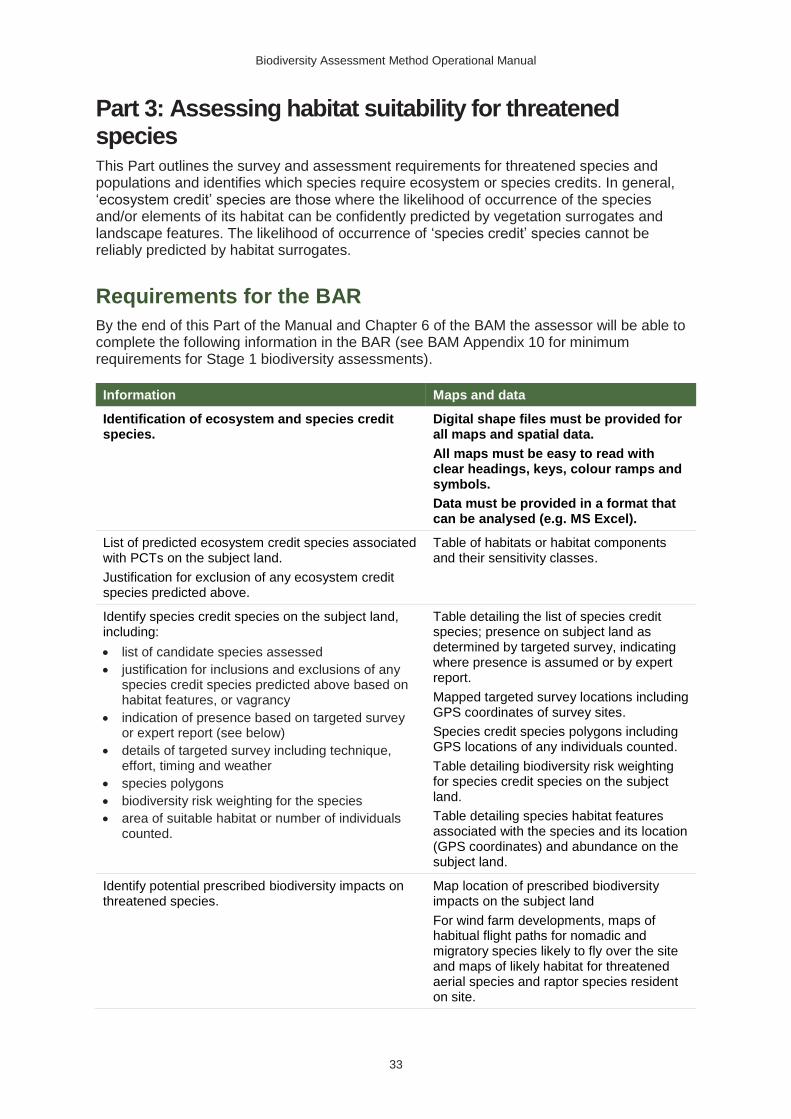
Biodiversity Assessment Method Operational Manual
33
Part 3: Assessing habitat suitability for threatened species This Part outlines the survey and assessment requirements for threatened species and populations and identifies which species require ecosystem or species credits. In general, ‘ecosystem credit’ species are those where the likelihood of occurrence of the species and/or elements of its habitat can be confidently predicted by vegetation surrogates and landscape features. The likelihood of occurrence of ‘species credit’ species cannot be reliably predicted by habitat surrogates.
Requirements for the BAR
By the end of this Part of the Manual and Chapter 6 of the BAM the assessor will be able to complete the following information in the BAR (see BAM Appendix 10 for minimum requirements for Stage 1 biodiversity assessments).
Information Maps and data
Identification of ecosystem and species credit species.
Digital shape files must be provided for all maps and spatial data.
All maps must be easy to read with clear headings, keys, colour ramps and symbols.
Data must be provided in a format that can be analysed (e.g. MS Excel).
List of predicted ecosystem credit species associated with PCTs on the subject land.
Justification for exclusion of any ecosystem credit species predicted above.
Table of habitats or habitat components and their sensitivity classes.
Identify species credit species on the subject land, including:
• list of candidate species assessed
• justification for inclusions and exclusions of any species credit species predicted above based on habitat features, or vagrancy
• indication of presence based on targeted survey or expert report (see below)
• details of targeted survey including technique, effort, timing and weather
• species polygons
• biodiversity risk weighting for the species
• area of suitable habitat or number of individuals counted.
Table detailing the list of species credit species; presence on subject land as determined by targeted survey, indicating where presence is assumed or by expert report.
Mapped targeted survey locations including GPS coordinates of survey sites.
Species credit species polygons including GPS locations of any individuals counted.
Table detailing biodiversity risk weighting for species credit species on the subject land.
Table detailing species habitat features associated with the species and its location (GPS coordinates) and abundance on the subject land.
Identify potential prescribed biodiversity impacts on threatened species.
Map location of prescribed biodiversity impacts on the subject land
For wind farm developments, maps of habitual flight paths for nomadic and migratory species likely to fly over the site and maps of likely habitat for threatened aerial species and raptor species resident on site.
Biodiversity Assessment Method Operational Manual
34
Information Maps and data
Where use of local data is proposed:
• identify relevant species or population
• identify source of information for local data
• justify use of local data in preference to database values.
Where expert reports are used in place of targeted survey:
• identify the relevant species or population
• justify the use of an expert report
• flag the likely presence of the species or population and the evidence to support this assessment including all information considered
• estimate the number of individuals or area of suitable habitat, including a description of how the estimates were made (e.g. reference populations, past reports)
• identify the expert and provide evidence of their expert credentials.
Threatened Biodiversity Data Collection (TBDC)
The Threatened Biodiversity Data Collection (TBDC) is a portal for accessing government-held information about plants and animals in New South Wales. The database is maintained by OEH and provides a detailed profile on each threatened species, population and ecological community in New South Wales including the entity’s habitat, range, key threats, and all data required to operate the BAM (e.g. appropriate time to survey, unit of measure). It is regularly updated to include new information as it becomes available and to add new listings under the BC Act. The BAR must reflect any changes in data made up to the date the BAR is finalised.
Assessors need to register for a login to BioNet to access the TBDC. Section 6.1 of the BAM outlines the information an assessor needs to extract from the TBDC for threatened species and populations likely to occur on the subject land. To download data from the TBDC follow instructions in ‘How to access the BioNet Web Service using Power Query: A BioNet Quick Guide’.
If an assessor considers that the data in the TBDC does not reflect the local environmental conditions, use of local data may be proposed (in accordance with Subsection 2.2.2 of the BAM – see the ‘Use of more appropriate local data’ section of this Manual). The assessor must get written permission from the consent authority to use more appropriate local data, therefore it is recommended that they discuss this option with the decision-maker early in the assessment process. The assessor must include the following information in the BAR:
• reasons to support the use of local data
• any published sources of information relied upon in establishing local values, and
• all local data, including shape files, specific datasheets and/or community/species profiles where relevant.
More appropriate local data cannot be used for sensitivity to loss or sensitivity to potential gain or the biodiversity risk weighting of a threatened entity. If the assessor believes that these scores are inaccurate for a species (noting that scores apply across the species range) they can contact OEH at [email protected]
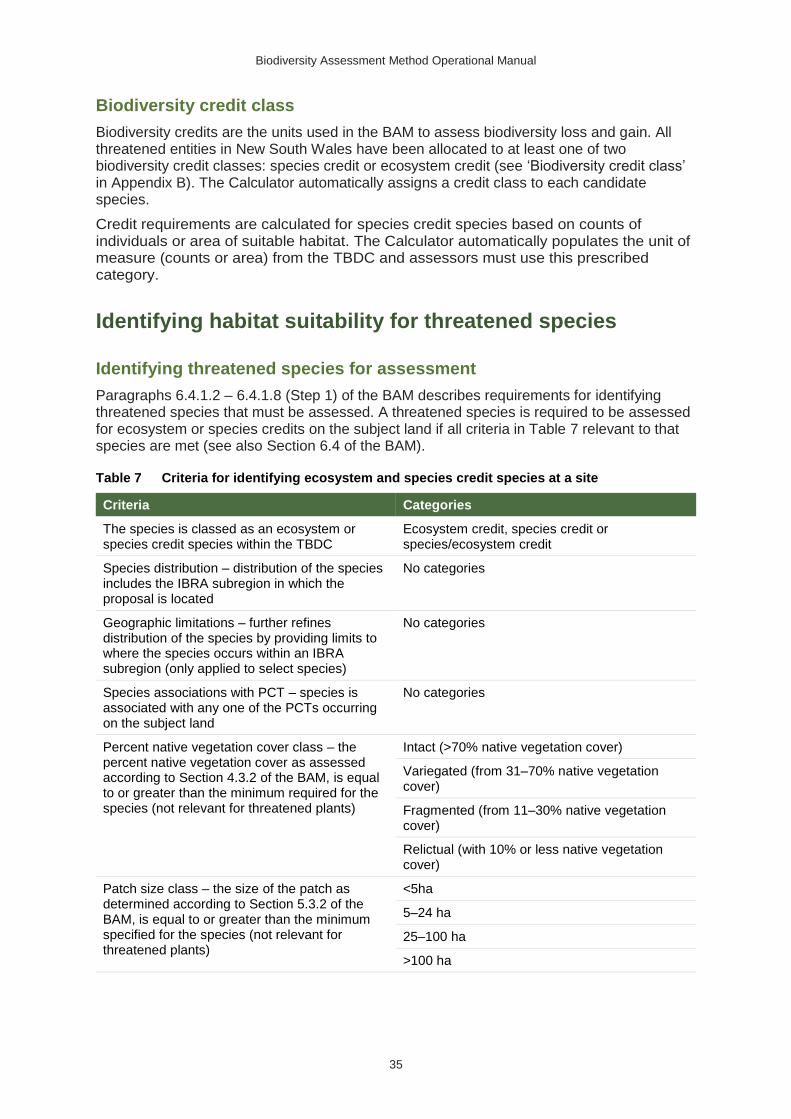
Biodiversity Assessment Method Operational Manual
35
Biodiversity credit class
Biodiversity credits are the units used in the BAM to assess biodiversity loss and gain. All threatened entities in New South Wales have been allocated to at least one of two biodiversity credit classes: species credit or ecosystem credit (see ‘Biodiversity credit class’ in Appendix B). The Calculator automatically assigns a credit class to each candidate species.
Credit requirements are calculated for species credit species based on counts of individuals or area of suitable habitat. The Calculator automatically populates the unit of measure (counts or area) from the TBDC and assessors must use this prescribed category.
Identifying habitat suitability for threatened species
Identifying threatened species for assessment
Paragraphs 6.4.1.2 – 6.4.1.8 (Step 1) of the BAM describes requirements for identifying threatened species that must be assessed. A threatened species is required to be assessed for ecosystem or species credits on the subject land if all criteria in Table 7 relevant to that species are met (see also Section 6.4 of the BAM).
Table 7 Criteria for identifying ecosystem and species credit species at a site
Criteria Categories
The species is classed as an ecosystem or species credit species within the TBDC
Ecosystem credit, species credit or species/ecosystem credit
Species distribution – distribution of the species includes the IBRA subregion in which the proposal is located
No categories
Geographic limitations – further refines distribution of the species by providing limits to where the species occurs within an IBRA subregion (only applied to select species)
No categories
Species associations with PCT – species is associated with any one of the PCTs occurring on the subject land
No categories
Percent native vegetation cover class – the percent native vegetation cover as assessed according to Section 4.3.2 of the BAM, is equal to or greater than the minimum required for the species (not relevant for threatened plants)
Intact (>70% native vegetation cover)
Variegated (from 31–70% native vegetation cover)
Fragmented (from 11–30% native vegetation cover)
Relictual (with 10% or less native vegetation cover)
Patch size class – the size of the patch as determined according to Section 5.3.2 of the BAM, is equal to or greater than the minimum specified for the species (not relevant for threatened plants)
<5ha
5–24 ha
25–100 ha
>100 ha
Biodiversity Assessment Method Operational Manual
36
The Calculator automatically generates a list of the predicted threatened species that meet these initial criteria. The assessor must then assess whether the geographic limitations of a species are met (see the Biodiversity Assessment Method Calculator: User guide). Geographic limitations usually relate to altitude (e.g. a frog species that only occurs above an altitudinal limit) or topographic features (e.g. named permanent waterbodies). Different geographic limitations can be described for different IBRA subregions across a species’ distribution. Where the subject land is not within the geographic limitation described, the assessor can select ‘no’ in the Calculator and the species will be removed from the predicted list of threatened species.
The assessor must review the list of species to ensure it is accurate and includes all species likely to occur within or use habitat on the subject land for development and biocertification proposals. Further species may be added to the list if, for example, the species and/or population:
• has been recently listed under the BC Act (and not yet added to the TBDC)
• has been recorded on or near the subject land but is not predicted by the Calculator (e.g. based on review of ecological reports, environmental impact statements, scientific literature, presence on site during the survey)
• if in the assessor’s professional opinion, it is likely that the species is present in the proposed disturbance area, or the species may be affected by the proposed development.
If the assessor is uncertain about the likelihood of the presence of a species on the subject land, as a precautionary measure they must include the species on the list. Information relating to the past survey and/or reasons for adding species to the list must be included in the BAR.
For linear shaped developments that cross multiple IBRA subregions, the assessor must conduct separate habitat suitability assessments for each IBRA subregion.
Assessment of habitat constraints and vagrant species (optional)
In accordance with Paragraphs 6.4.1.9 – 6.4.1.16 (Step 2) of the BAM, the assessor may opt to undertake an onsite assessment to determine the presence of habitat constraints or microhabitats for the threatened species predicted to occur on the subject land.
The absence of these features may be used to further refine the list of candidate species on the subject land and potentially reduce the need for a survey. Undertaking this step is recommended where species have identified habitat constraints (see TBDC), habitat is significantly degraded, the vegetation is missing key structural elements, is a derived native grassland, or in the case of a biodiversity stewardship site, the habitat is being restored.
Habitat constraints relevant to ecosystem and species credit species are automatically populated in the Calculator from the TBDC. Some species do not have any identified habitat constraints, in which case this step in the process is not required.
Where a species has multiple habitat constraints, and each is assessed as absent on the subject land, the species may be removed from the list and no further assessment is required. However, if a single constraint is present on the subject land, the species must be retained in the list of candidate species and assessed under the remaining steps in Section 6.4 of the BAM.
For a small number of species, a habitat constraint may refer to a mapped location (see Paragraph 6.3.1.4 of the BAM). Mapped locations identify areas that are considered important for the species (e.g. breeding areas or sites where multiple records have been located over multiple years). These species are usually dual credit species assessed for both species and ecosystem credits. If a mapped location is present on the subject land it must be assessed for species credits.
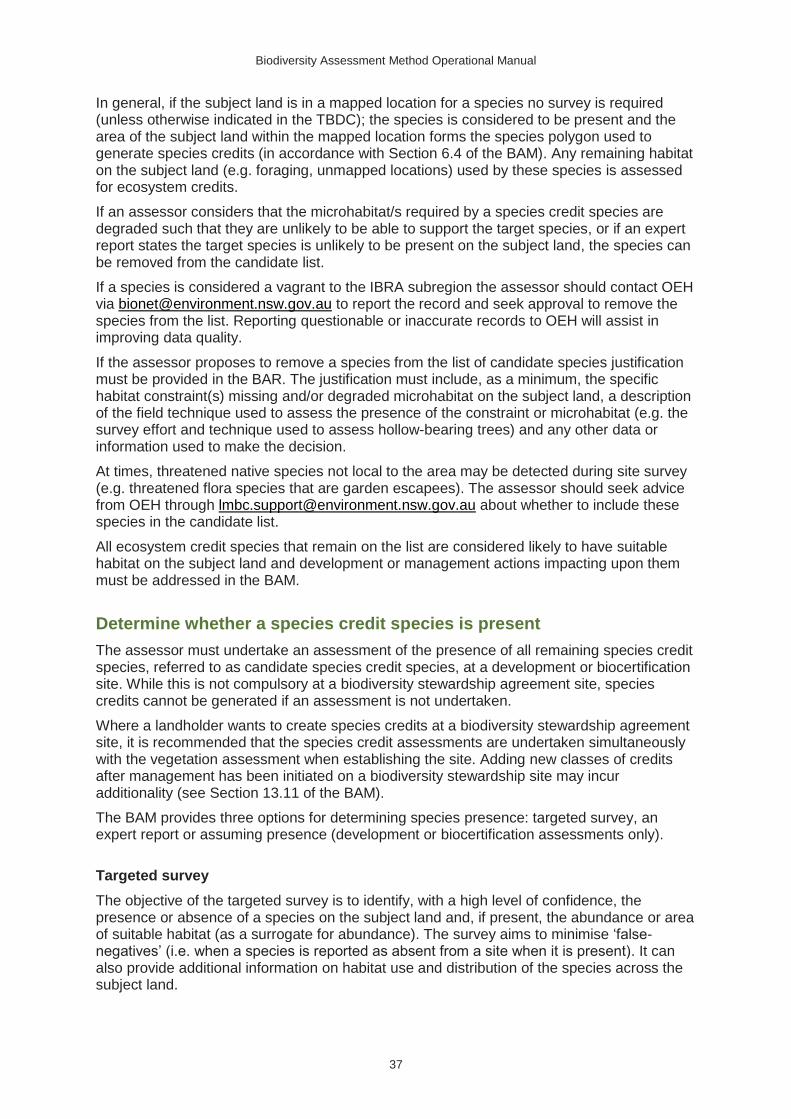
Biodiversity Assessment Method Operational Manual
37
In general, if the subject land is in a mapped location for a species no survey is required (unless otherwise indicated in the TBDC); the species is considered to be present and the area of the subject land within the mapped location forms the species polygon used to generate species credits (in accordance with Section 6.4 of the BAM). Any remaining habitat on the subject land (e.g. foraging, unmapped locations) used by these species is assessed for ecosystem credits.
If an assessor considers that the microhabitat/s required by a species credit species are degraded such that they are unlikely to be able to support the target species, or if an expert report states the target species is unlikely to be present on the subject land, the species can be removed from the candidate list.
If a species is considered a vagrant to the IBRA subregion the assessor should contact OEH via [email protected] to report the record and seek approval to remove the species from the list. Reporting questionable or inaccurate records to OEH will assist in improving data quality.
If the assessor proposes to remove a species from the list of candidate species justification must be provided in the BAR. The justification must include, as a minimum, the specific habitat constraint(s) missing and/or degraded microhabitat on the subject land, a description of the field technique used to assess the presence of the constraint or microhabitat (e.g. the survey effort and technique used to assess hollow-bearing trees) and any other data or information used to make the decision.
At times, threatened native species not local to the area may be detected during site survey (e.g. threatened flora species that are garden escapees). The assessor should seek advice from OEH through [email protected] about whether to include these species in the candidate list.
All ecosystem credit species that remain on the list are considered likely to have suitable habitat on the subject land and development or management actions impacting upon them must be addressed in the BAM.
Determine whether a species credit species is present
The assessor must undertake an assessment of the presence of all remaining species credit species, referred to as candidate species credit species, at a development or biocertification site. While this is not compulsory at a biodiversity stewardship agreement site, species credits cannot be generated if an assessment is not undertaken.
Where a landholder wants to create species credits at a biodiversity stewardship agreement site, it is recommended that the species credit assessments are undertaken simultaneously with the vegetation assessment when establishing the site. Adding new classes of credits after management has been initiated on a biodiversity stewardship site may incur additionality (see Section 13.11 of the BAM).
The BAM provides three options for determining species presence: targeted survey, an expert report or assuming presence (development or biocertification assessments only).
Targeted survey
The objective of the targeted survey is to identify, with a high level of confidence, the presence or absence of a species on the subject land and, if present, the abundance or area of suitable habitat (as a surrogate for abundance). The survey aims to minimise ‘false-negatives’ (i.e. when a species is reported as absent from a site when it is present). It can also provide additional information on habitat use and distribution of the species across the subject land.
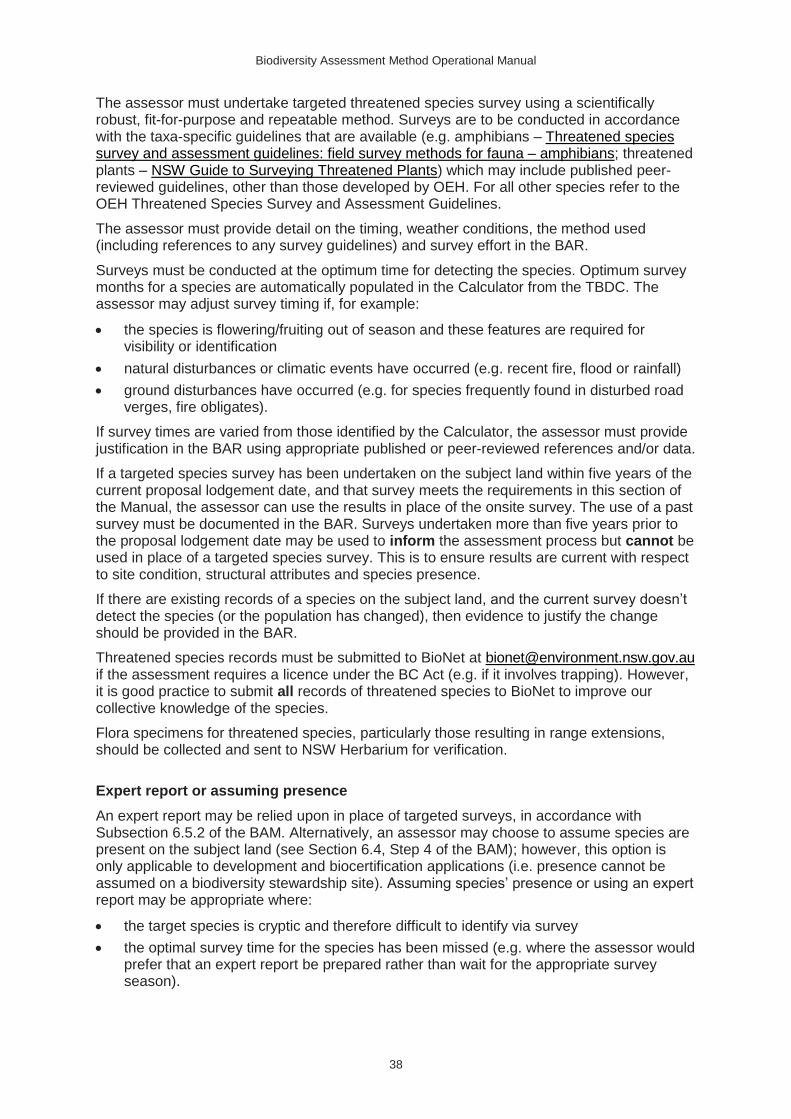
Biodiversity Assessment Method Operational Manual
38
The assessor must undertake targeted threatened species survey using a scientifically robust, fit-for-purpose and repeatable method. Surveys are to be conducted in accordance with the taxa-specific guidelines that are available (e.g. amphibians – Threatened species survey and assessment guidelines: field survey methods for fauna – amphibians; threatened plants – NSW Guide to Surveying Threatened Plants) which may include published peer-reviewed guidelines, other than those developed by OEH. For all other species refer to the OEH Threatened Species Survey and Assessment Guidelines.
The assessor must provide detail on the timing, weather conditions, the method used (including references to any survey guidelines) and survey effort in the BAR.
Surveys must be conducted at the optimum time for detecting the species. Optimum survey months for a species are automatically populated in the Calculator from the TBDC. The assessor may adjust survey timing if, for example:
• the species is flowering/fruiting out of season and these features are required for visibility or identification
• natural disturbances or climatic events have occurred (e.g. recent fire, flood or rainfall)
• ground disturbances have occurred (e.g. for species frequently found in disturbed road verges, fire obligates).
If survey times are varied from those identified by the Calculator, the assessor must provide justification in the BAR using appropriate published or peer-reviewed references and/or data.
If a targeted species survey has been undertaken on the subject land within five years of the current proposal lodgement date, and that survey meets the requirements in this section of the Manual, the assessor can use the results in place of the onsite survey. The use of a past survey must be documented in the BAR. Surveys undertaken more than five years prior to the proposal lodgement date may be used to inform the assessment process but cannot be used in place of a targeted species survey. This is to ensure results are current with respect to site condition, structural attributes and species presence.
If there are existing records of a species on the subject land, and the current survey doesn’t detect the species (or the population has changed), then evidence to justify the change should be provided in the BAR.
Threatened species records must be submitted to BioNet at [email protected] if the assessment requires a licence under the BC Act (e.g. if it involves trapping). However, it is good practice to submit all records of threatened species to BioNet to improve our collective knowledge of the species.
Flora specimens for threatened species, particularly those resulting in range extensions, should be collected and sent to NSW Herbarium for verification.
Expert report or assuming presence
An expert report may be relied upon in place of targeted surveys, in accordance with Subsection 6.5.2 of the BAM. Alternatively, an assessor may choose to assume species are present on the subject land (see Section 6.4, Step 4 of the BAM); however, this option is only applicable to development and biocertification applications (i.e. presence cannot be assumed on a biodiversity stewardship site). Assuming species’ presence or using an expert report may be appropriate where:
• the target species is cryptic and therefore difficult to identify via survey
• the optimal survey time for the species has been missed (e.g. where the assessor would prefer that an expert report be prepared rather than wait for the appropriate survey season).
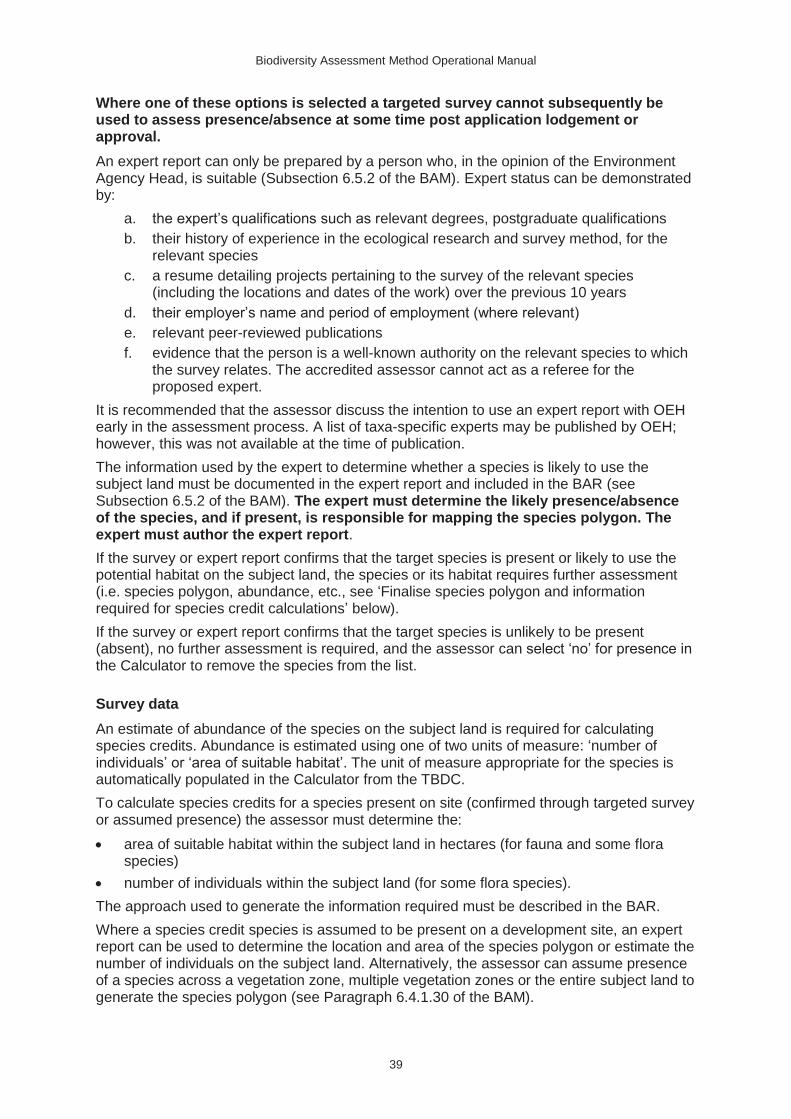
Biodiversity Assessment Method Operational Manual
39
Where one of these options is selected a targeted survey cannot subsequently be used to assess presence/absence at some time post application lodgement or approval.
An expert report can only be prepared by a person who, in the opinion of the Environment Agency Head, is suitable (Subsection 6.5.2 of the BAM). Expert status can be demonstrated by:
a. the expert’s qualifications such as relevant degrees, postgraduate qualifications
b. their history of experience in the ecological research and survey method, for the relevant species
c. a resume detailing projects pertaining to the survey of the relevant species (including the locations and dates of the work) over the previous 10 years
d. their employer’s name and period of employment (where relevant)
e. relevant peer-reviewed publications
f. evidence that the person is a well-known authority on the relevant species to which the survey relates. The accredited assessor cannot act as a referee for the proposed expert.
It is recommended that the assessor discuss the intention to use an expert report with OEH early in the assessment process. A list of taxa-specific experts may be published by OEH; however, this was not available at the time of publication.
The information used by the expert to determine whether a species is likely to use the subject land must be documented in the expert report and included in the BAR (see Subsection 6.5.2 of the BAM). The expert must determine the likely presence/absence of the species, and if present, is responsible for mapping the species polygon. The expert must author the expert report.
If the survey or expert report confirms that the target species is present or likely to use the potential habitat on the subject land, the species or its habitat requires further assessment (i.e. species polygon, abundance, etc., see ‘Finalise species polygon and information required for species credit calculations’ below).
If the survey or expert report confirms that the target species is unlikely to be present (absent), no further assessment is required, and the assessor can select ‘no’ for presence in the Calculator to remove the species from the list.
Survey data
An estimate of abundance of the species on the subject land is required for calculating species credits. Abundance is estimated using one of two units of measure: ‘number of individuals’ or ‘area of suitable habitat’. The unit of measure appropriate for the species is automatically populated in the Calculator from the TBDC.
To calculate species credits for a species present on site (confirmed through targeted survey or assumed presence) the assessor must determine the:
• area of suitable habitat within the subject land in hectares (for fauna and some flora species)
• number of individuals within the subject land (for some flora species).
The approach used to generate the information required must be described in the BAR.
Where a species credit species is assumed to be present on a development site, an expert report can be used to determine the location and area of the species polygon or estimate the number of individuals on the subject land. Alternatively, the assessor can assume presence of a species across a vegetation zone, multiple vegetation zones or the entire subject land to generate the species polygon (see Paragraph 6.4.1.30 of the BAM).
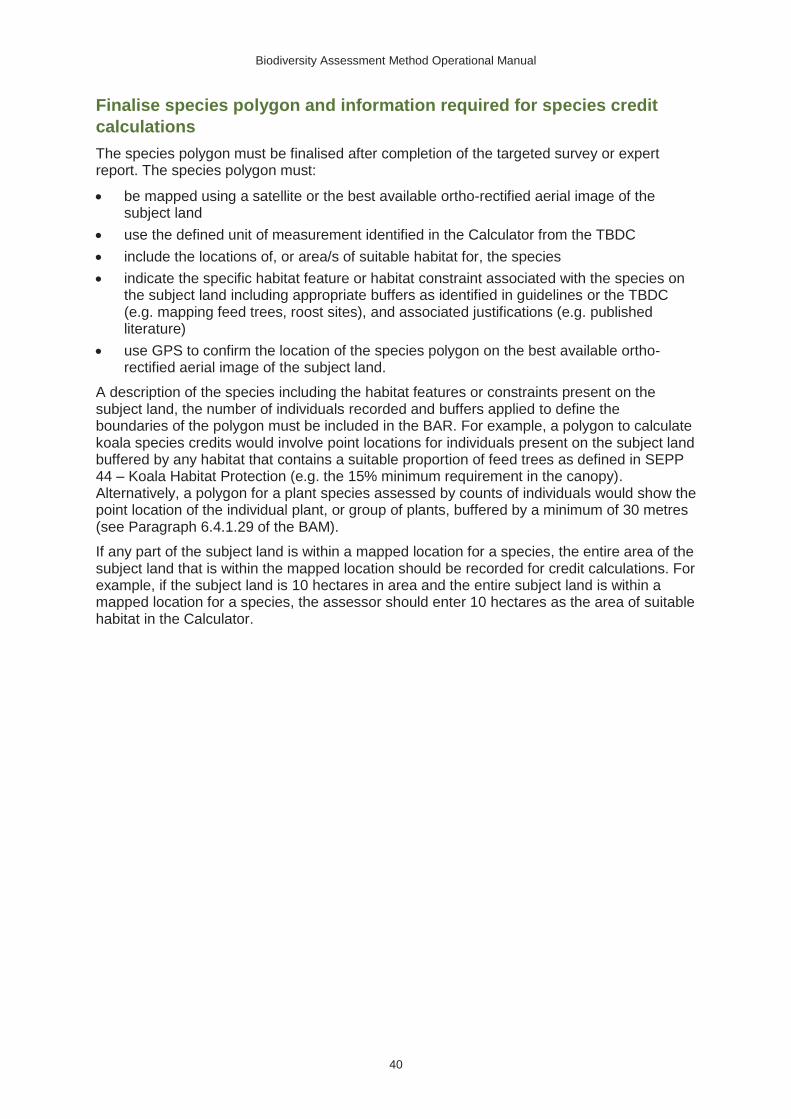
Biodiversity Assessment Method Operational Manual
40
Finalise species polygon and information required for species credit
calculations
The species polygon must be finalised after completion of the targeted survey or expert report. The species polygon must:
• be mapped using a satellite or the best available ortho-rectified aerial image of the subject land
• use the defined unit of measurement identified in the Calculator from the TBDC
• include the locations of, or area/s of suitable habitat for, the species
• indicate the specific habitat feature or habitat constraint associated with the species on the subject land including appropriate buffers as identified in guidelines or the TBDC (e.g. mapping feed trees, roost sites), and associated justifications (e.g. published literature)
• use GPS to confirm the location of the species polygon on the best available ortho-rectified aerial image of the subject land.
A description of the species including the habitat features or constraints present on the subject land, the number of individuals recorded and buffers applied to define the boundaries of the polygon must be included in the BAR. For example, a polygon to calculate koala species credits would involve point locations for individuals present on the subject land buffered by any habitat that contains a suitable proportion of feed trees as defined in SEPP 44 – Koala Habitat Protection (e.g. the 15% minimum requirement in the canopy). Alternatively, a polygon for a plant species assessed by counts of individuals would show the point location of the individual plant, or group of plants, buffered by a minimum of 30 metres (see Paragraph 6.4.1.29 of the BAM).
If any part of the subject land is within a mapped location for a species, the entire area of the subject land that is within the mapped location should be recorded for credit calculations. For example, if the subject land is 10 hectares in area and the entire subject land is within a mapped location for a species, the assessor should enter 10 hectares as the area of suitable habitat in the Calculator.
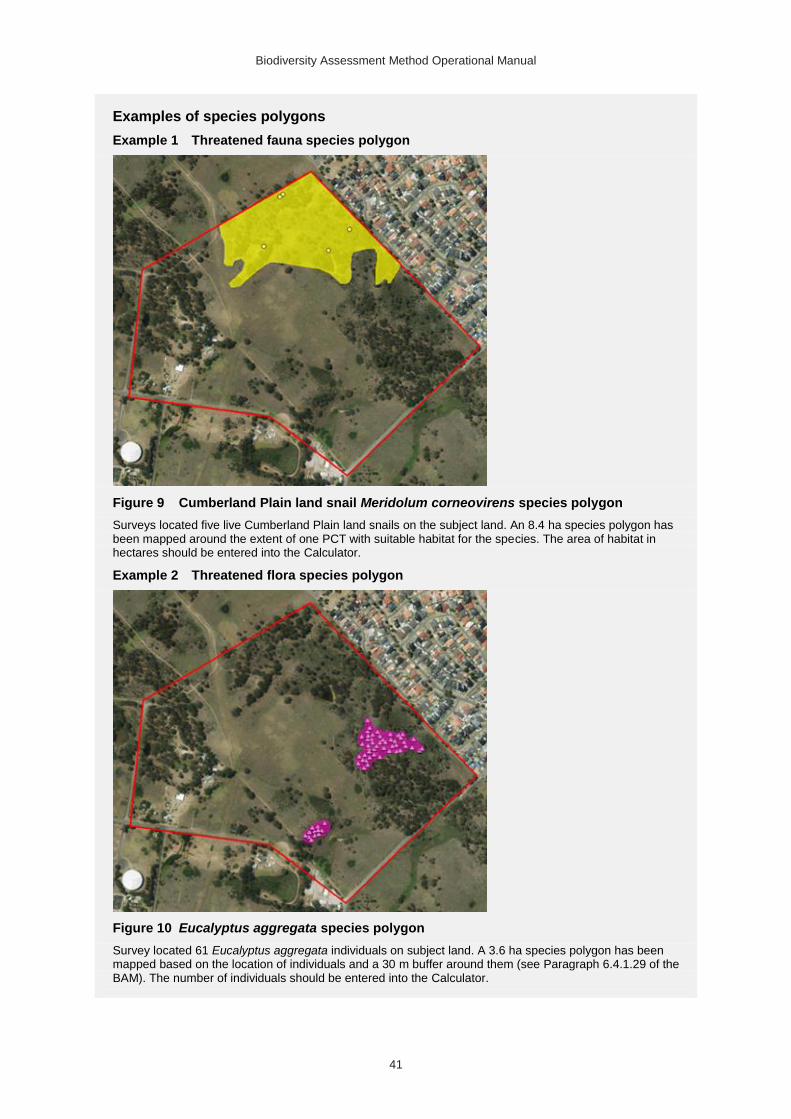
Biodiversity Assessment Method Operational Manual
41
Examples of species polygons
Example 1 Threatened fauna species polygon
Figure 9 Cumberland Plain land snail Meridolum corneovirens species polygon
Surveys located five live Cumberland Plain land snails on the subject land. An 8.4 ha species polygon has been mapped around the extent of one PCT with suitable habitat for the species. The area of habitat in hectares should be entered into the Calculator.
Example 2 Threatened flora species polygon
Figure 10 Eucalyptus aggregata species polygon
Survey located 61 Eucalyptus aggregata individuals on subject land. A 3.6 ha species polygon has been mapped based on the location of individuals and a 30 m buffer around them (see Paragraph 6.4.1.29 of the BAM). The number of individuals should be entered into the Calculator.
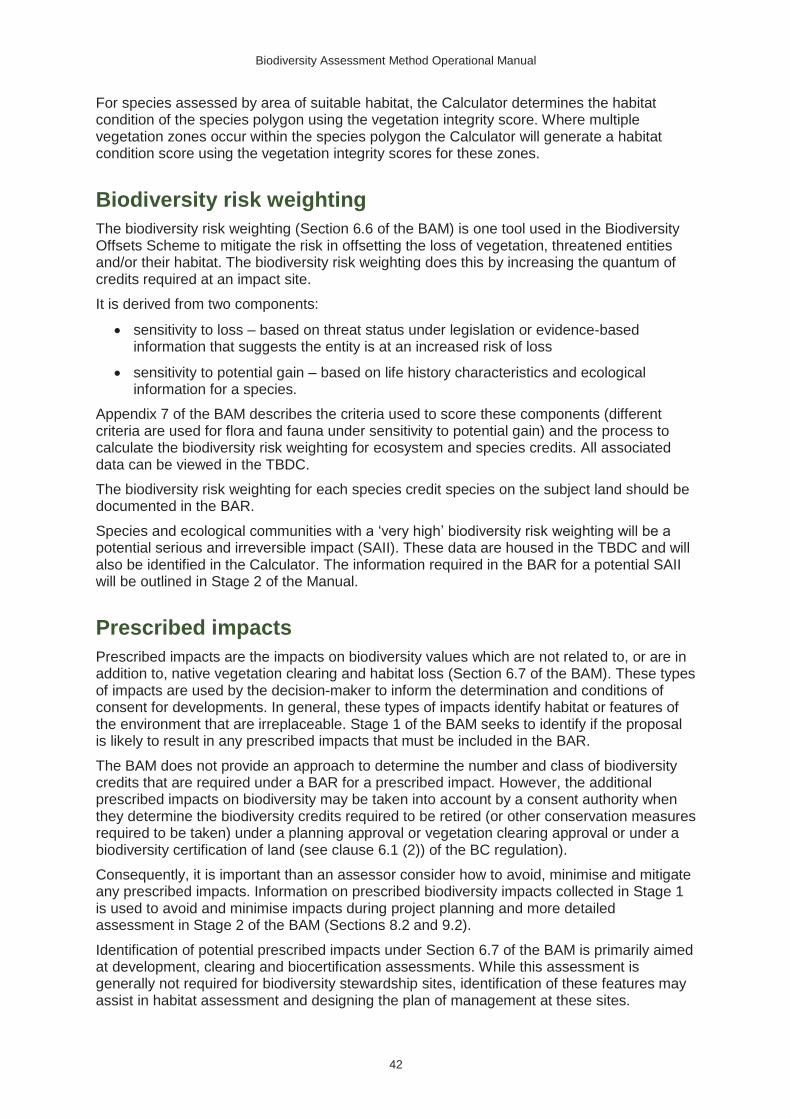
Biodiversity Assessment Method Operational Manual
42
For species assessed by area of suitable habitat, the Calculator determines the habitat condition of the species polygon using the vegetation integrity score. Where multiple vegetation zones occur within the species polygon the Calculator will generate a habitat condition score using the vegetation integrity scores for these zones.
Biodiversity risk weighting
The biodiversity risk weighting (Section 6.6 of the BAM) is one tool used in the Biodiversity Offsets Scheme to mitigate the risk in offsetting the loss of vegetation, threatened entities and/or their habitat. The biodiversity risk weighting does this by increasing the quantum of credits required at an impact site.
It is derived from two components:
• sensitivity to loss – based on threat status under legislation or evidence-based information that suggests the entity is at an increased risk of loss
• sensitivity to potential gain – based on life history characteristics and ecological information for a species.
Appendix 7 of the BAM describes the criteria used to score these components (different criteria are used for flora and fauna under sensitivity to potential gain) and the process to calculate the biodiversity risk weighting for ecosystem and species credits. All associated data can be viewed in the TBDC.
The biodiversity risk weighting for each species credit species on the subject land should be documented in the BAR.
Species and ecological communities with a ‘very high’ biodiversity risk weighting will be a potential serious and irreversible impact (SAII). These data are housed in the TBDC and will also be identified in the Calculator. The information required in the BAR for a potential SAII will be outlined in Stage 2 of the Manual.
Prescribed impacts
Prescribed impacts are the impacts on biodiversity values which are not related to, or are in addition to, native vegetation clearing and habitat loss (Section 6.7 of the BAM). These types of impacts are used by the decision-maker to inform the determination and conditions of consent for developments. In general, these types of impacts identify habitat or features of the environment that are irreplaceable. Stage 1 of the BAM seeks to identify if the proposal is likely to result in any prescribed impacts that must be included in the BAR.
The BAM does not provide an approach to determine the number and class of biodiversity credits that are required under a BAR for a prescribed impact. However, the additional prescribed impacts on biodiversity may be taken into account by a consent authority when they determine the biodiversity credits required to be retired (or other conservation measures required to be taken) under a planning approval or vegetation clearing approval or under a biodiversity certification of land (see clause 6.1 (2)) of the BC regulation).
Consequently, it is important than an assessor consider how to avoid, minimise and mitigate any prescribed impacts. Information on prescribed biodiversity impacts collected in Stage 1 is used to avoid and minimise impacts during project planning and more detailed assessment in Stage 2 of the BAM (Sections 8.2 and 9.2).
Identification of potential prescribed impacts under Section 6.7 of the BAM is primarily aimed at development, clearing and biocertification assessments. While this assessment is generally not required for biodiversity stewardship sites, identification of these features may assist in habitat assessment and designing the plan of management at these sites.
Biodiversity Assessment Method Operational Manual
43
Identification of prescribed impacts
An assessor should use professional judgement when assessing prescribed impacts. Habitat features and the processes needed for the feature to continue to exist should be identified.
Natural hydrological processes that affect habitat health, connectivity and access to refuge should be identified.
Information relating to prescribed impacts should be included on the Site Map and documented in the BAR (see Table 8 for an example). To minimise repetition where information on prescribed impacts is captured elsewhere in the BAR, reference can be made to these sections.
Wind farm development
Paragraphs 6.7.1.5 to 6.7.1.8 of the BAM apply only to development sites with wind farm proposals. Requirements under these sections do not need to be considered for biodiversity stewardship sites.
Prescribed impacts related to wind farm development apply not only to threatened species but also any resident raptor species and nomadic or migratory species whose flight paths are likely to cross the subject land (Paragraph 6.7.1.5 of the BAM). The assessor must develop a candidate list of species that are likely to use or fly over the subject land. The assessor must undertake targeted surveys for each candidate species which meet all requirements under Paragraph 6.7.1.6 of the BAM.
The BAR must include the:
• list of candidate species
• methods used to develop the list of candidate species
• methods, location of detectors, effort and timing used during targeted surveys for each candidate species including detailing the requirements under Paragraph 6.7.1.6 of the BAM
• results of targeted surveys.
If targeted surveys identify nomadic or migratory species likely to fly over the subject land, assessors must map predicted flight paths on the Location and Site Maps.
If targeted surveys identify resident raptors or threatened aerial species, assessors must map likely habitat and flyways and include them on the Site Map.
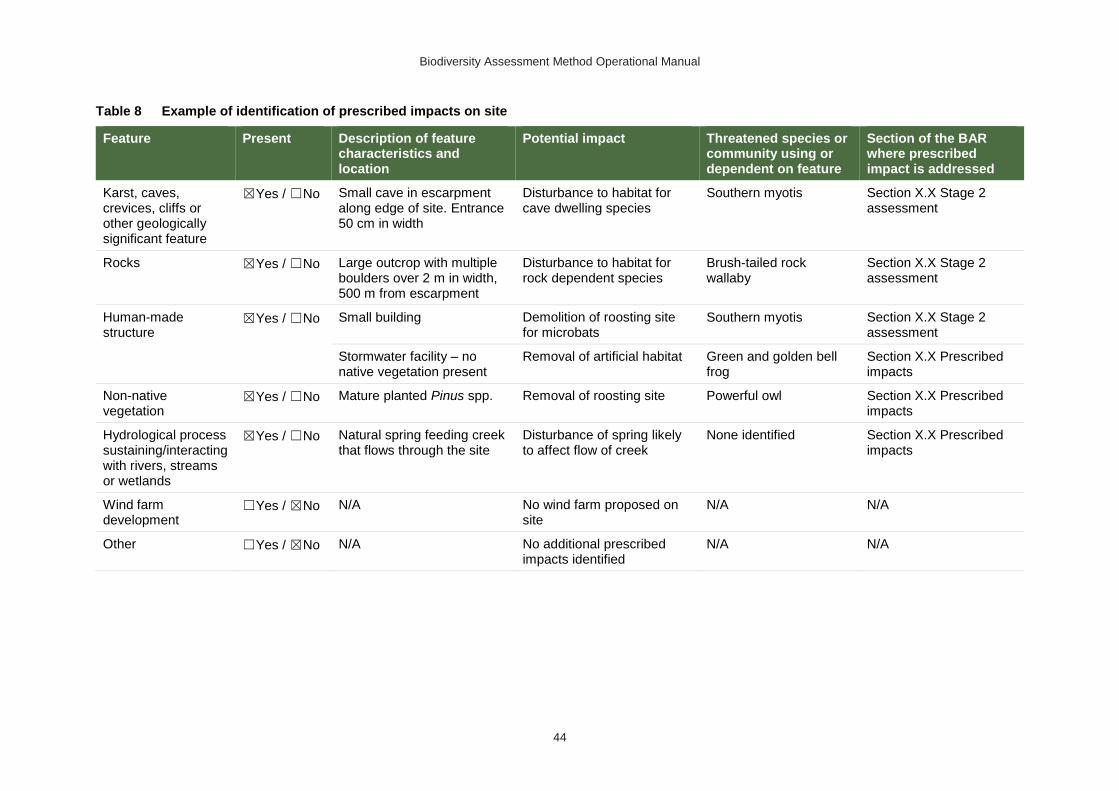
Biodiversity Assessment Method Operational Manual
44
Table 8 Example of identification of prescribed impacts on site
Feature Present Description of feature characteristics and location
Potential impact Threatened species or community using or dependent on feature
Section of the BAR where prescribed impact is addressed
Karst, caves, crevices, cliffs or other geologically significant feature
☒Yes / ☐No Small cave in escarpment along edge of site. Entrance 50 cm in width
Disturbance to habitat for cave dwelling species
Southern myotis Section X.X Stage 2 assessment
Rocks ☒Yes / ☐No Large outcrop with multiple boulders over 2 m in width, 500 m from escarpment
Disturbance to habitat for rock dependent species
Brush-tailed rock wallaby
Section X.X Stage 2 assessment
Human-made structure
☒Yes / ☐No Small building Demolition of roosting site for microbats
Southern myotis Section X.X Stage 2 assessment
Stormwater facility – no native vegetation present
Removal of artificial habitat Green and golden bell frog
Section X.X Prescribed impacts
Non-native vegetation
☒Yes / ☐No Mature planted Pinus spp. Removal of roosting site Powerful owl Section X.X Prescribed impacts
Hydrological process sustaining/interacting with rivers, streams or wetlands
☒Yes / ☐No Natural spring feeding creek that flows through the site
Disturbance of spring likely to affect flow of creek
None identified Section X.X Prescribed impacts
Wind farm development
☐Yes / ☒No N/A No wind farm proposed on site
N/A N/A
Other ☐Yes / ☒No N/A No additional prescribed impacts identified
N/A N/A
Biodiversity Assessment Method Operational Manual
45
Appendix A – Websites and online resources
referred to in Stage 1
Acid sulfate soils risk www.environment.nsw.gov.au/topics/land-and-soil/soil-degradation/acid-sulfate-soils
Application for login access to BioNet www.environment.nsw.gov.au/atlaspublicapp/Registration.aspx
Areas of outstanding biodiversity value (AOBV) www.environment.nsw.gov.au/biodiversity/outstandingbiodivvalue.htm
Biodiversity Assessment Method Calculator www.lmbc.nsw.gov.au/bamcalc
Biodiversity Assessment Method Calculator User Guide www.lmbc.nsw.gov.au/bamcalc/app/assets/BAMTools_UserGuide.pdf
Biodiversity Conservation Regulation 2017 www.legislation.nsw.gov.au/regulations/2017-432.pdf
Biodiversity Offsets and Agreement Management System (BOAMS) www.environment.nsw.gov.au/biodiversity/systemsregistersfees.htm
Biodiversity Values Map www.lmbc.nsw.gov.au/Maps/index.html?viewer=BVMap
BioNet Atlas www.environment.nsw.gov.au/wildlifeatlas/about.htm
BioNet Atlas Search www.environment.nsw.gov.au/atlaspublicapp/UI_Modules/ATLAS_/AtlasSearch.aspx
BioNet Flora Survey Data Collection http://data.environment.nsw.gov.au/dataset/nsw-bionet-flora-survey-data-collection1c3a0
BioNet guides, information sheets, manuals and datasheets www.bionet.nsw.gov.au/bionet-guides-manuals.htm
BioNet Threatened Biodiversity Data Collection (TBDC) https://www.environment.nsw.gov.au/asmslightprofileapp/Account/Login
BioNet Vegetation Classification www.environment.nsw.gov.au/research/Visclassification.htm
BioNet Vegetation Classification user manual www.environment.nsw.gov.au/resources/bionet/bionet-vegetation-classification-user-manual-170340.pdf
BioNet Web Services https://data.bionet.nsw.gov.au/
BioNet Web Services – Using Power Query: A BioNet Quick Guide www.environment.nsw.gov.au/publications/bionet/150547-quick-guide-power-query.htm
Digital cadastral database https://sdi.nsw.gov.au/nswsdi/catalog/main/home.page
Directory of Important Wetlands in Australia (DIWA) www.environment.gov.au/water/wetlands/australian-wetlands-database/directory-important-wetlands
EPBC Act listed threatened species and ecological communities www.environment.gov.au/epbc/what-is-protected/threatened-species-ecological-communities
Biodiversity Assessment Method Operational Manual
46
Estuaries of NSW: Physical characteristics, tidal surveys and hydrographic surveys www.environment.nsw.gov.au/estuaries/list.htm
Fisheries NSW Policy and Guidelines for Fish Habitat Conservation and Management (Update 2013) www.dpi.nsw.gov.au/__data/assets/pdf_file/0009/468927/Policy-and-guidelines-for-fish-habitat.pdf
Geological sites of NSW www.geomaps.com.au/scripts/geositeslist.php
Hydrogeological landscapes www.environment.nsw.gov.au/topics/land-and-soil/soil-degradation/salinity/salinity-locations-and-mapping
Native Vegetation Integrity Benchmarks www.environment.nsw.gov.au/research-and-publications/publications-search/native-vegetation-integrity-benchmarks
Native Vegetation Interim Type Standard www.environment.nsw.gov.au/resources/nativeveg/10060nvinttypestand.pdf
Native Vegetation Regulatory Map www.environment.nsw.gov.au/biodiversity/regulatorymap.htm
NSW Guide to Surveying Threatened Plants www.environment.nsw.gov.au/resources/threatenedspecies/160129-threatened-plants-survey-guide.pdf
NSW Interim Biogeographic Regions of Australia (IBRA region and subregions) – Version 7 http://environment.gov.au/land/nrs/science/ibra#ibra
NSW (Mitchell) Landscapes – Version 3.1 http://data.environment.nsw.gov.au/dataset/nsw-mitchell-landscapes-version-3-1
NSW (Mitchell) Landscapes Descriptions www.environment.nsw.gov.au/resources/conservation/LandscapesDescriptions.pdf
NSW Soil Profiles http://data.environment.nsw.gov.au/dataset/nsw-soil-profiles15bf7
NSW Threatened Species www.environment.nsw.gov.au/topics/animals-and-plants/threatened-species
OEH Data Portal http://data.environment.nsw.gov.au/
OEH Public Registers www.environment.nsw.gov.au/publicregister/
OEH Threatened Species Survey and Assessment Guidelines www.environment.nsw.gov.au/surveys/BiodiversitySurveyGuidelinesDraft.htm
PlantNET NSW http://plantnet.rbgsyd.nsw.gov.au/
SEPP 14 Coastal Wetlands http://data.environment.nsw.gov.au/dataset/state-environmental-planning-policy-no-14-coastal-wetlands
State Vegetation Type Map www.environment.nsw.gov.au/vegetation/state-vegetation-type-map.htm
Threatened species survey and assessment guidelines: field survey methods for fauna – amphibians www.environment.nsw.gov.au/resources/threatenedspecies/09213amphibians.pdf
Vegetation Information Systems maps www.environment.nsw.gov.au/research/VISmap.htm
Biodiversity Assessment Method Operational Manual
47
Appendix B – Glossary of terms
Areas of geological significance and soil hazard
Areas of geological significance, such as karst formations, caves, crevices and cliffs provide important habitat for native flora and fauna including threatened species and communities. For example, these areas provide species with breeding, foraging, roosting and refuge sites and provide ecosystems with resources such as bedrock and soils, some of which are endemic to karst and cave systems. As a result, areas of geological significance are critical for conservation and their presence increases the biodiversity value of a subject land.
Soil hazard features such as dryland salinity, acidification, compaction, structural breakdown, sodicity and contamination must be considered and identified during site assessment. In making their determination, the decision-maker may use this information to estimate the environmental risk associated with soil disturbance resulting from the proposed development.
Areas of outstanding biodiversity value
Areas of outstanding biodiversity value (AOBV) are declared by the Minister for the Environment. These are special areas that contain irreplaceable biodiversity values that are important to New South Wales, Australia or globally and will be a priority for investment in private land conservation.
Benchmarks
Benchmarks are quantitative measures that describe the reference state to which sites are compared to assess the biodiversity values of native vegetation and threatened species habitat. The reference state relates to those sites within the contemporary landscape with higher numbers of native plants species, greater structural complexity and replete with functional components, relative to other sites of the same vegetation type.
Richness and foliage cover benchmarks have been created by modelling data from more than 36,000 full-floristic 0.04-hectare plots and represent the 75th percentile of the data distributions for richness and cover of the six growth form groups: trees, shrubs, grasses and grass-like plants, forbs ferns and ‘other’. They assume average prior rainfall conditions and represent the average benchmark value over 12 months.
Function benchmarks were generated from approximately 14,000 records from 0.1-hectare plots and were created at a variety of classification levels (up to formation) based on available data. They represent the 75th percentile of each attribute’s raw data distribution.
Benchmarks are described for specified attributes for more than 650 bioregional vegetation classes. Bioregional vegetation classes are an amalgamation of IBRA regions and NSW Vegetation Classes3.
Biodiversity credit class
Biodiversity credits are the currency used to assess biodiversity loss and gain in the BAM. All threatened entities in New South Wales have been allocated to at least one of two biodiversity credit classes: species credit or ecosystem credit (see Table 5).
All threatened ecological communities are an ecosystem credit.
3 Keith D 2004, Ocean shores to desert dunes: the native vegetation of New South Wales and the ACT, Department of Environment and Conservation NSW, Hurstville.
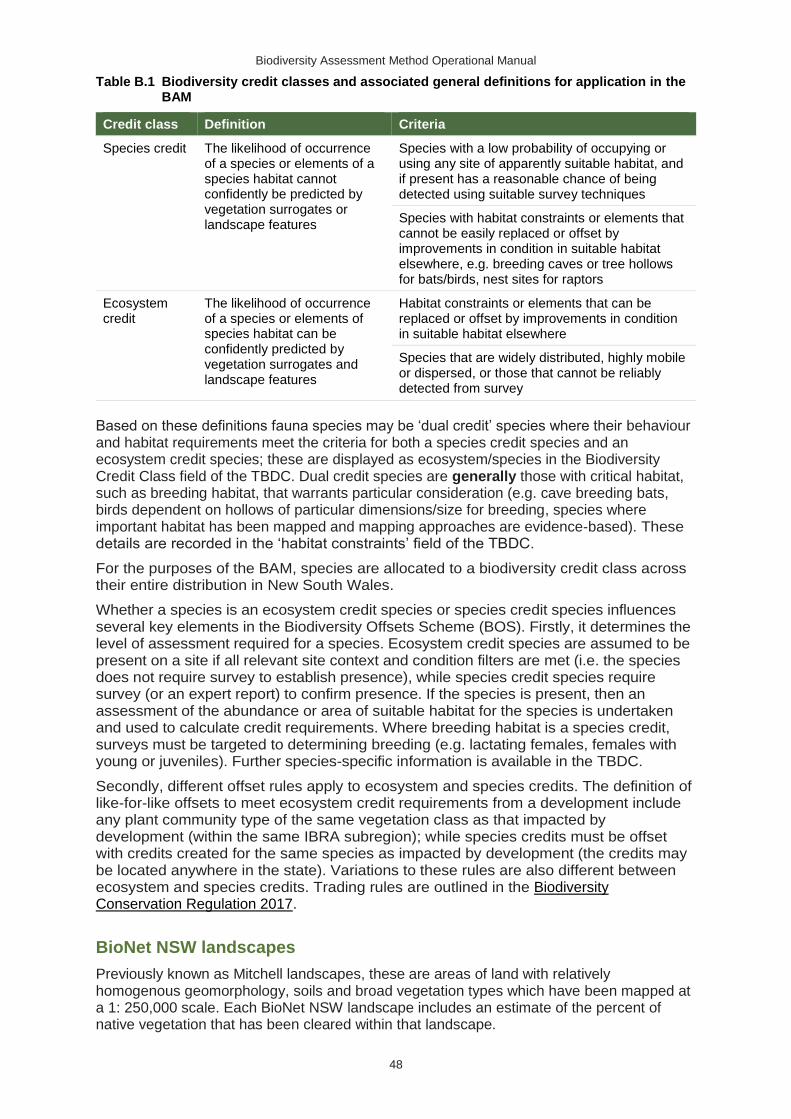
Biodiversity Assessment Method Operational Manual
48
Table B.1 Biodiversity credit classes and associated general definitions for application in the BAM
Credit class Definition Criteria
Species credit The likelihood of occurrence of a species or elements of a species habitat cannot confidently be predicted by vegetation surrogates or landscape features
Species with a low probability of occupying or using any site of apparently suitable habitat, and if present has a reasonable chance of being detected using suitable survey techniques
Species with habitat constraints or elements that cannot be easily replaced or offset by improvements in condition in suitable habitat elsewhere, e.g. breeding caves or tree hollows for bats/birds, nest sites for raptors
Ecosystem credit
The likelihood of occurrence of a species or elements of species habitat can be confidently predicted by vegetation surrogates and landscape features
Habitat constraints or elements that can be replaced or offset by improvements in condition in suitable habitat elsewhere
Species that are widely distributed, highly mobile or dispersed, or those that cannot be reliably detected from survey
Based on these definitions fauna species may be ‘dual credit’ species where their behaviour and habitat requirements meet the criteria for both a species credit species and an ecosystem credit species; these are displayed as ecosystem/species in the Biodiversity Credit Class field of the TBDC. Dual credit species are generally those with critical habitat, such as breeding habitat, that warrants particular consideration (e.g. cave breeding bats, birds dependent on hollows of particular dimensions/size for breeding, species where important habitat has been mapped and mapping approaches are evidence-based). These details are recorded in the ‘habitat constraints’ field of the TBDC.
For the purposes of the BAM, species are allocated to a biodiversity credit class across their entire distribution in New South Wales.
Whether a species is an ecosystem credit species or species credit species influences several key elements in the Biodiversity Offsets Scheme (BOS). Firstly, it determines the level of assessment required for a species. Ecosystem credit species are assumed to be present on a site if all relevant site context and condition filters are met (i.e. the species does not require survey to establish presence), while species credit species require survey (or an expert report) to confirm presence. If the species is present, then an assessment of the abundance or area of suitable habitat for the species is undertaken and used to calculate credit requirements. Where breeding habitat is a species credit, surveys must be targeted to determining breeding (e.g. lactating females, females with young or juveniles). Further species-specific information is available in the TBDC.
Secondly, different offset rules apply to ecosystem and species credits. The definition of like-for-like offsets to meet ecosystem credit requirements from a development include any plant community type of the same vegetation class as that impacted by development (within the same IBRA subregion); while species credits must be offset with credits created for the same species as impacted by development (the credits may be located anywhere in the state). Variations to these rules are also different between ecosystem and species credits. Trading rules are outlined in the Biodiversity Conservation Regulation 2017.
BioNet NSW landscapes
Previously known as Mitchell landscapes, these are areas of land with relatively homogenous geomorphology, soils and broad vegetation types which have been mapped at a 1: 250,000 scale. Each BioNet NSW landscape includes an estimate of the percent of native vegetation that has been cleared within that landscape.
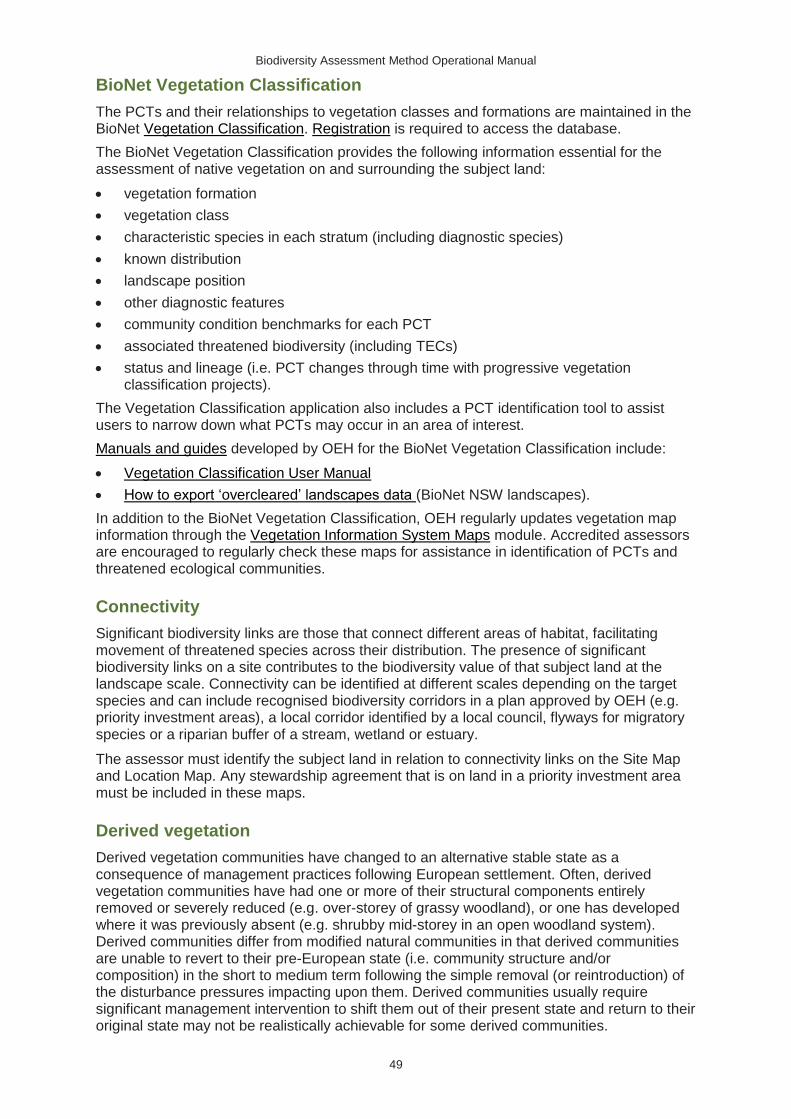
Biodiversity Assessment Method Operational Manual
49
BioNet Vegetation Classification
The PCTs and their relationships to vegetation classes and formations are maintained in the BioNet Vegetation Classification. Registration is required to access the database.
The BioNet Vegetation Classification provides the following information essential for the assessment of native vegetation on and surrounding the subject land:
• vegetation formation
• vegetation class
• characteristic species in each stratum (including diagnostic species)
• known distribution
• landscape position
• other diagnostic features
• community condition benchmarks for each PCT
• associated threatened biodiversity (including TECs)
• status and lineage (i.e. PCT changes through time with progressive vegetation classification projects).
The Vegetation Classification application also includes a PCT identification tool to assist users to narrow down what PCTs may occur in an area of interest.
Manuals and guides developed by OEH for the BioNet Vegetation Classification include:
• Vegetation Classification User Manual
• How to export ‘overcleared’ landscapes data (BioNet NSW landscapes).
In addition to the BioNet Vegetation Classification, OEH regularly updates vegetation map information through the Vegetation Information System Maps module. Accredited assessors are encouraged to regularly check these maps for assistance in identification of PCTs and threatened ecological communities.
Connectivity
Significant biodiversity links are those that connect different areas of habitat, facilitating movement of threatened species across their distribution. The presence of significant biodiversity links on a site contributes to the biodiversity value of that subject land at the landscape scale. Connectivity can be identified at different scales depending on the target species and can include recognised biodiversity corridors in a plan approved by OEH (e.g. priority investment areas), a local corridor identified by a local council, flyways for migratory species or a riparian buffer of a stream, wetland or estuary.
The assessor must identify the subject land in relation to connectivity links on the Site Map and Location Map. Any stewardship agreement that is on land in a priority investment area must be included in these maps.
Derived vegetation
Derived vegetation communities have changed to an alternative stable state as a consequence of management practices following European settlement. Often, derived vegetation communities have had one or more of their structural components entirely removed or severely reduced (e.g. over-storey of grassy woodland), or one has developed where it was previously absent (e.g. shrubby mid-storey in an open woodland system). Derived communities differ from modified natural communities in that derived communities are unable to revert to their pre-European state (i.e. community structure and/or composition) in the short to medium term following the simple removal (or reintroduction) of the disturbance pressures impacting upon them. Derived communities usually require significant management intervention to shift them out of their present state and return to their original state may not be realistically achievable for some derived communities.
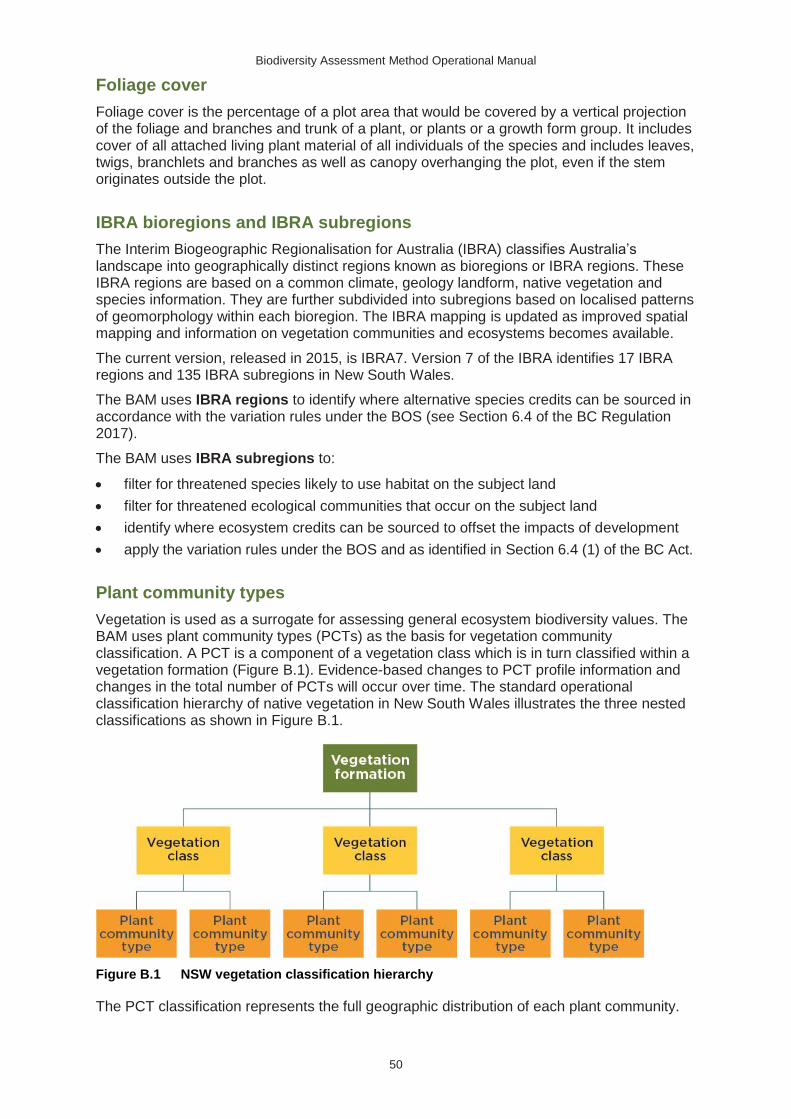
Biodiversity Assessment Method Operational Manual
50
Foliage cover
Foliage cover is the percentage of a plot area that would be covered by a vertical projection of the foliage and branches and trunk of a plant, or plants or a growth form group. It includes cover of all attached living plant material of all individuals of the species and includes leaves, twigs, branchlets and branches as well as canopy overhanging the plot, even if the stem originates outside the plot.
IBRA bioregions and IBRA subregions
The Interim Biogeographic Regionalisation for Australia (IBRA) classifies Australia’s landscape into geographically distinct regions known as bioregions or IBRA regions. These IBRA regions are based on a common climate, geology landform, native vegetation and species information. They are further subdivided into subregions based on localised patterns of geomorphology within each bioregion. The IBRA mapping is updated as improved spatial mapping and information on vegetation communities and ecosystems becomes available.
The current version, released in 2015, is IBRA7. Version 7 of the IBRA identifies 17 IBRA regions and 135 IBRA subregions in New South Wales.
The BAM uses IBRA regions to identify where alternative species credits can be sourced in accordance with the variation rules under the BOS (see Section 6.4 of the BC Regulation 2017).
The BAM uses IBRA subregions to:
• filter for threatened species likely to use habitat on the subject land
• filter for threatened ecological communities that occur on the subject land
• identify where ecosystem credits can be sourced to offset the impacts of development
• apply the variation rules under the BOS and as identified in Section 6.4 (1) of the BC Act.
Plant community types
Vegetation is used as a surrogate for assessing general ecosystem biodiversity values. The BAM uses plant community types (PCTs) as the basis for vegetation community classification. A PCT is a component of a vegetation class which is in turn classified within a vegetation formation (Figure B.1). Evidence-based changes to PCT profile information and changes in the total number of PCTs will occur over time. The standard operational classification hierarchy of native vegetation in New South Wales illustrates the three nested classifications as shown in Figure B.1.
Figure B.1 NSW vegetation classification hierarchy
The PCT classification represents the full geographic distribution of each plant community.
Biodiversity Assessment Method Operational Manual
51
The BAM uses the term PCT when referring to an ecological community (what many ecologists term ‘vegetation’ in a structural sense) and the accredited assessor should select the most likely PCT from the BioNet Vegetation Classification to identify vegetation on the subject land. The most likely PCT must be justified using a quantitative analysis of plot data in which the species are matched to the potential list of PCTs that could occur in that location (Paragraph 5.2.1.12 of the BAM). This is often prepared as an analysis that considers all PCTs at a subregional or greater scale.
Rivers, streams and estuaries
Rivers, streams and their riparian buffers are identified in an assessment as important ecological connectivity and habitat features. Riparian buffers are important for maintaining or improving the shape, stability and ecological functions of the water body as well as providing a diversity of habitat for terrestrial, riparian and aquatic plants and animals.
Estuaries, defined as semi-enclosed water bodies with open or intermittently closed connections with the ocean, must also be identified in a biodiversity assessment.
Wetlands
Wetlands are an important component of the natural environment and include areas of land saturated by surface water and/or groundwater for long enough periods that the plants and animals in them are adapted to and depend upon wet conditions for at least part of their life cycle. An area does not have to be permanently wet to be a wetland; it can be wet cyclically or intermittently with fresh, brackish or saline water.
Wetlands in New South Wales are diverse and cover a wide range of habitats including lakes, lagoons, swamps, bogs, billabongs, marshes, floodplain areas that pond with water, saltmarshes and mangrove forests. To determine the location and extent of a wetland in its dry phase, vegetation type, soil properties (including egg and seed banks) and records of flooding can be used.
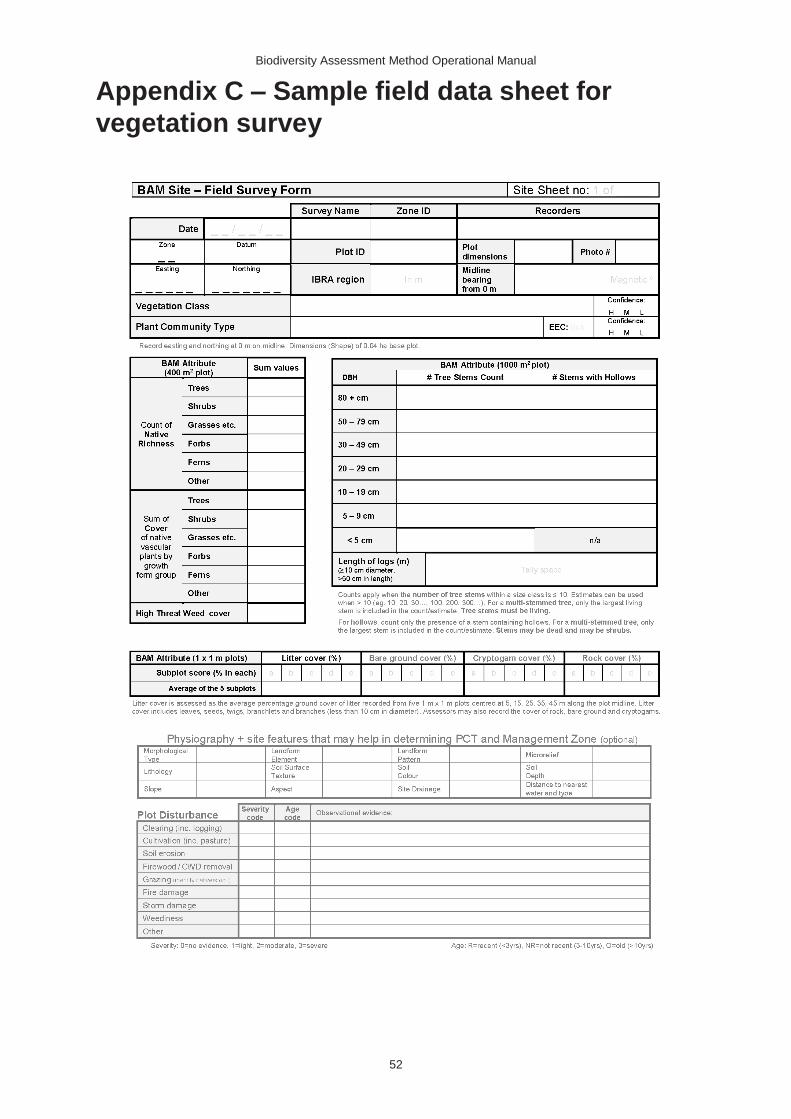
Biodiversity Assessment Method Operational Manual
52
Appendix C – Sample field data sheet for
vegetation survey
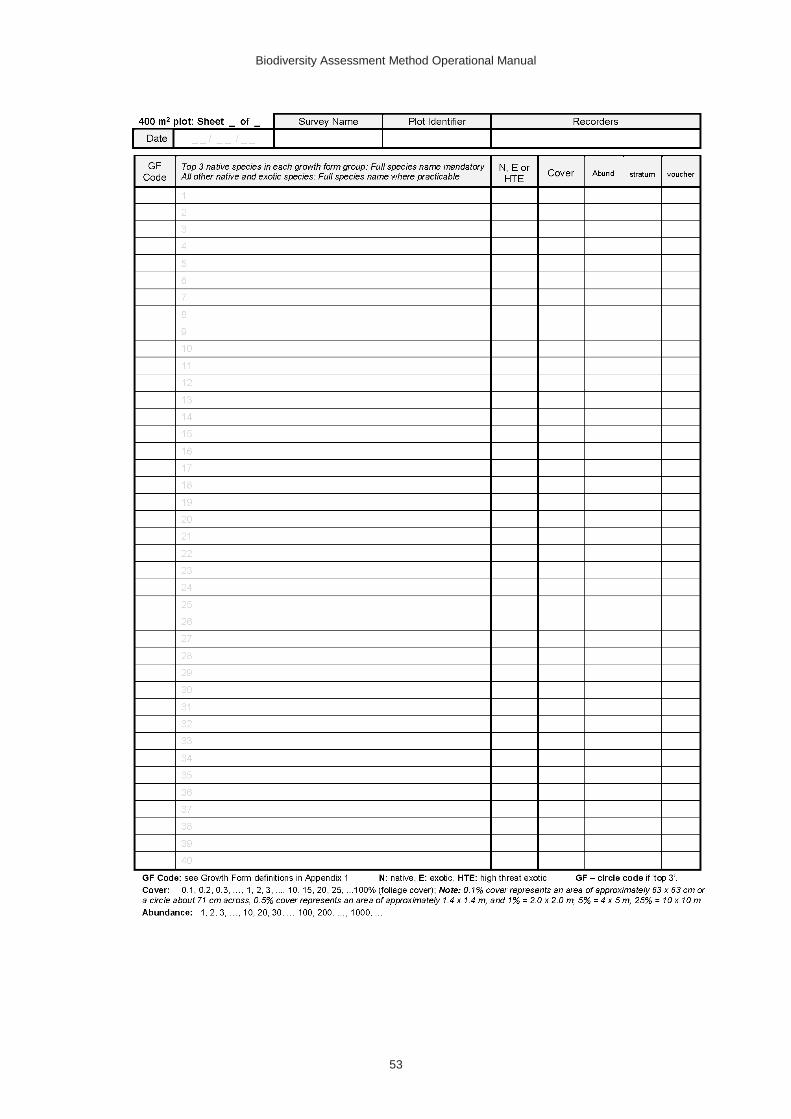
Biodiversity Assessment Method Operational Manual
53


