Biogas Market Study in Bhutan Final Report Submitted to Asian Development Bank Submitted by Prakash C. Ghimire Sr. Regional Advisor, SNV/Asia Biogas Programme Saroj K. Nepal Consultant, Gonefel Options Consult, Bhutan December, 2009
Transcript
Biogas Market Study in Bhutan
Final Report
Submitted to
Asian Development Bank
Submitted by
Prakash C. Ghimire Sr. Regional Advisor, SNV/Asia Biogas Programme
Saroj K. Nepal Consultant, Gonefel Options Consult, Bhutan
December, 2009
ii
Executive Summary o A feasibility study conducted in Bhutan in 2008 by SNV concluded that a small scale domestic biogas
programme is possible with a technical potential of about 20,000 biogas plants especially in the southern belt and inner mountain valleys. The key question for the development of a substantial biogas programme in Bhutan is whether the households having enough number of cattle to install biogas plant are willing and able to invest in it and to feed the plant with the required amount of manure on a daily basis. Asian Development Bank (ADB) under the framework of Energy for All Partnership Programme proposed to undertake a specific market study to provide realistic answers to various questions related to technical and socio-economic feasibility of a biogas programme in Bhutan and contracted Netherlands Development Organisation (SNV) to carry out an in-depth market study.
o The objective of the biogas market study was to assess the willingness and affordability of livestock keeping households to invest in biogas technology. The key question of the study was, therefore, ‘can biogas plant be ‘sold’ in Bhutan and if yes, to how many households and at what cost’?
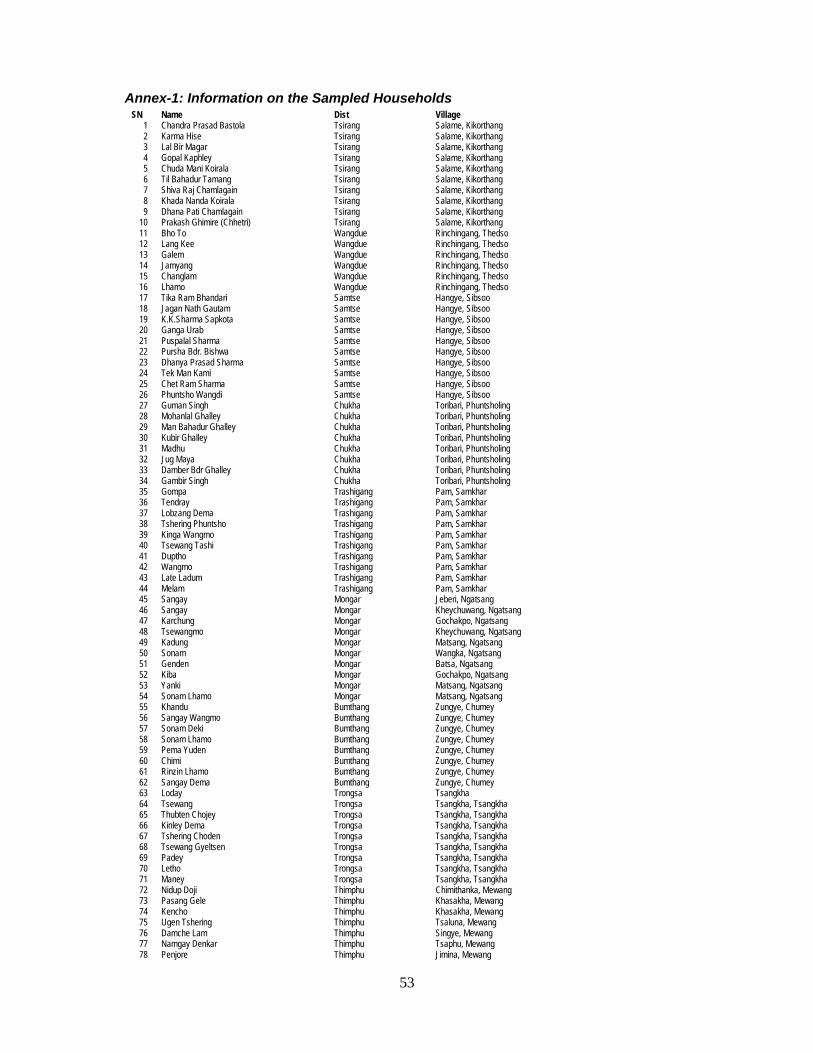
o The main methods used were cluster meetings, household survey and market survey using a structured questionnaire as the instrument of the study as well as open-ended unstructured interviews with respondents from the selected households under study. Additional investigation tools included observations, especially of cattle-sheds, manure management practice, water sources, household kitchen and conventional fuel sources being used in the sampled households, and informal discussions with people in the survey clusters. Seventy eight households from nine districts representing all three ecological zones as well as four administrative regions in the country were sampled for the study. Given the total number of households in each cluster, the sample size is not representative for the entire country. Hence, the findings of the study should be considered as indicative rather than representative.
o The demographic attributes of the sample population showed that there were more male members than female. On an average there were 5.65 members in the household. Although 55% of the population were in the productive population group (between 17 and 61 years); the dependency ratio is relatively high with 71 young and elderly population being supported by 100 productive persons. However, given that the labour requirements for biogas plant operation are low, the present productive population are sufficient to take up operation.
o Half the population depended on agriculture and are therefore based in the village implying that the biogas plants (which are home-based) can be managed since people will generally be around their farms. Farmers have sufficient land to install biogas plants and slurry pits although location of the cowsheds may not always be near the houses and kitchens in some of the households. The crops produced from the land are in most of the cases consumed by the family. Farmers however grow cash crops and derive most of their income from the sale of such crops. There were substantial differences in income among sampled households. Thirteen households earned less than Nu.13,164 a year implying that they lived in poverty. Another four did not earn any income. Those at the lower rung of the income ladder may not be able to afford to invest in biogas plants unless some financing incentives are provided.
o Education attainment levels were relatively low with 44% of the family members being illiterate among which majority were women. Any information and communication materials developed for awareness-raising and training on biogas will have to take this into consideration.
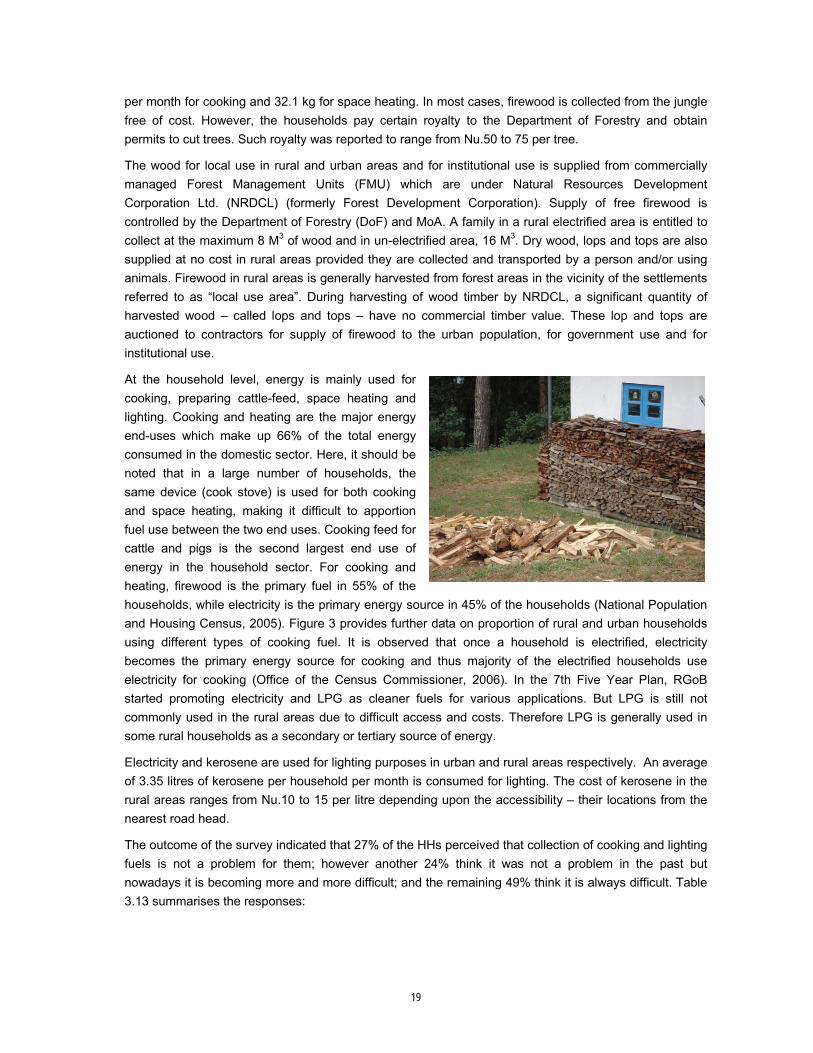
o The outcome of the study revealed that the main source of energy for cooking was firewood collected from the nearby forest. Eighty six percent of the HHs collected firewood from nearby forest or their own land whereas the remaining 14% of the HHs purchased it from market/vendors. Sixty two percent of the HHs cut the whole tree and the other 38% cut twigs and dried branches from the tree. Fifty two
iii
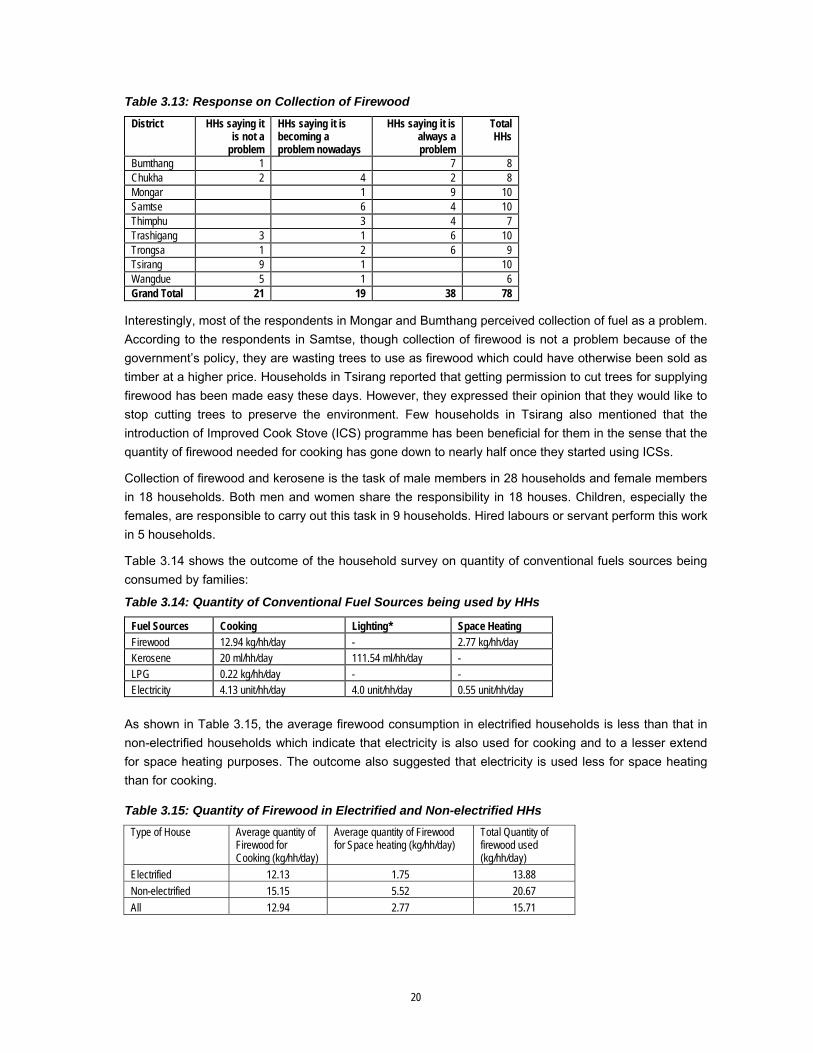
percent out of those who cut whole tree to supply firewood, were reported to cut 2 trees in a year followed by 33% cutting 3 trees and the remaining 15% cut only one tree. One household on an average burns 388.2 kilograms of firewood per month for cooking and 32.1 kg for space heating. The average firewood consumption in electrified households (13.88 kg/hh/day) is less than that in non-electrified households (20.67 kg/hh/day) which indicated that electricity was also used for cooking and space heating purposes. Electricity and kerosene were used for lighting purposes in urban and rural areas respectively. An average of 3.35 litres of kerosene per household per month was consumed for lighting. The field findings also revealed that out of the 78 households under study, 12 HHs used batteries, 2 HHs used solar PV and 1 HH used pine resin for lighting.
o In general farmers owned cattle and other smaller livestock. Most farmers qualify to install biogas since the majority own more than 3 cattle with the average cattle holding being 6 cattle, most of which are night stalled cattle. The cultural practices of keeping cattle in sheds also vary with some villages having cattle sheds quite distant from the houses. In such situations, providing biogas and conveying the gas to the households can be expensive. Based upon field observation and information from the respondents, 2 adult zero grazed cattle or 3 adult open-grazed (night-stabled) cattle would be sufficient to produce at least 20 kg of dung, which is minimum requirement for a household to qualify for the installation of a smallest sized biogas plant (4 m3). The findings suggested that 95% of the total households have enough cattle dung to install a domestic biogas plant.
o Eighty one percent of the respondents replied that they are often encountering smoke-borne diseases where as 19% think smoke has never been a big problem. The main reason for incidence of such diseases is the smoke-filled cooking environment due to poor ventilation in the kitchen.
o The respondents reported that there are negligible major social and cultural taboos associated with the use of biogas and bioslurry. However, some people during informal discussions raised the issue of impurity of biogas produced with the digestion of night soil from toilets. Hence some of the farmers might resist the attachment of toilets to a biogas plant. There are no cultural inhibitions to the handling of dung.
o The exposure of communities to biogas technology is limited. Thirty one percent of the respondents were familiar about biogas technology where as 40% of them had never heard about it. The remaining 29% had heard a little about it but do not know anything about it. The level of knowledge on biogas technology was relatively better in Samtse, Thimphu and Trashigang whereas people in Bumthang, Mongar and Trongsa had limited knowledge on it. However, ninety percent of the HHs are interested/willing to get substitutions for the conventional sources of fuel because they are expensive and difficult to obtain and 72% of the total HHs think biogas is best suited to fulfil their domestic demand for cooking fuel. This information indicates the necessity of effective awareness raising initiative as one of the main components of a national biogas programme.
o Biogas plant is perceived as an expensive undertaking by 25 households whereas two of them think it is cheap. Ten respondents were unable to comment on the cost of installation. The remaining 41 respondents were of the view that the cost is reasonable. Out of the 14 households who think the investment cost will be an inhibiting factor for them to install biogas plant, 12 of them expressed that they will install biogas plant if more than 40% subsidy is provided by the government. One of them thinks biogas plant is cumbersome to operate and the remaining one respondent believes that the family does not have enough capital to invest. Sixty two percent of the HHs felt that they have enough saving per year to invest in biogas plant.
o It was revealed that taking a loan or credit for agricultural activities is not a common practice in Bhutan at the household level although 50% of the respondents said that they have taken loan at least once to overcome a financial difficulty. Out of those who have taken a loan, very few persons (8%) were
iv
reported to have obtained it more than once. When asked if they need loans to install biogas plants, more than half replied affirmatively. The anticipated interest rates on biogas loan were reported to be in between 6 to 12% per annum. Seventy seven percent of the respondents believe that biogas plants will result in substantial financial saving which could be used to repay the loan on time; whereas 19% assume biogas will not help in financial saving considerably. The remaining 4% claimed that they are not in a position to give their opinion whether biogas plant generates financial saving or not.
o The data suggested that the average burning hours of conventional cook stove in the sampled households was 3.84 hours per household per day. The maximum and minimum burning hours were reported to be 7 hours and 1.5 hours respectively. To fulfil this demand for cooking as well as some more needs for lighting, biogas plants of size ranging from 4 to 10 cum meters are more than sufficient.
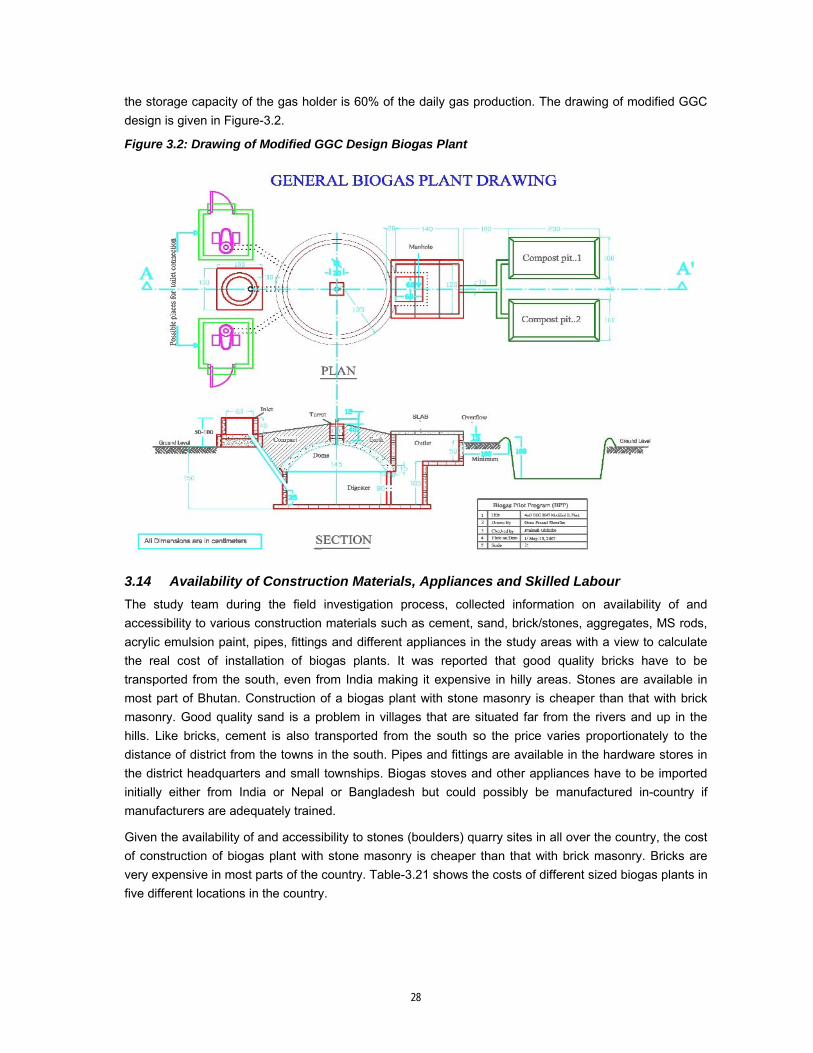
o The GGC model being disseminated under the Biogas Programme in Nepal and modified to suit the country contexts of Laos, Pakistan, Indonesia, Ethiopia and Rwanda turns out to be the most suitable plant for mass dissemination in Bhutan. The appropriateness of this design for both brick and stone masonry works in hilly regions of Bhutan where stones are cheaper than bricks; simplicity in construction; higher resistance of gas holder against ground tremors; easy access for cleaning and maintenance of digester and gas holder; higher level of user's satisfaction; and proven track record of successful functioning in different countries under SNV’s biogas programmes make this model more suitable than others. Weaknesses of this plants such as labour intensive construction of gas holder, relatively less suitability of the model in areas with high water table (because of flat bottom), and more time and efforts needed in quality control will not impact much in the Bhutanese context.
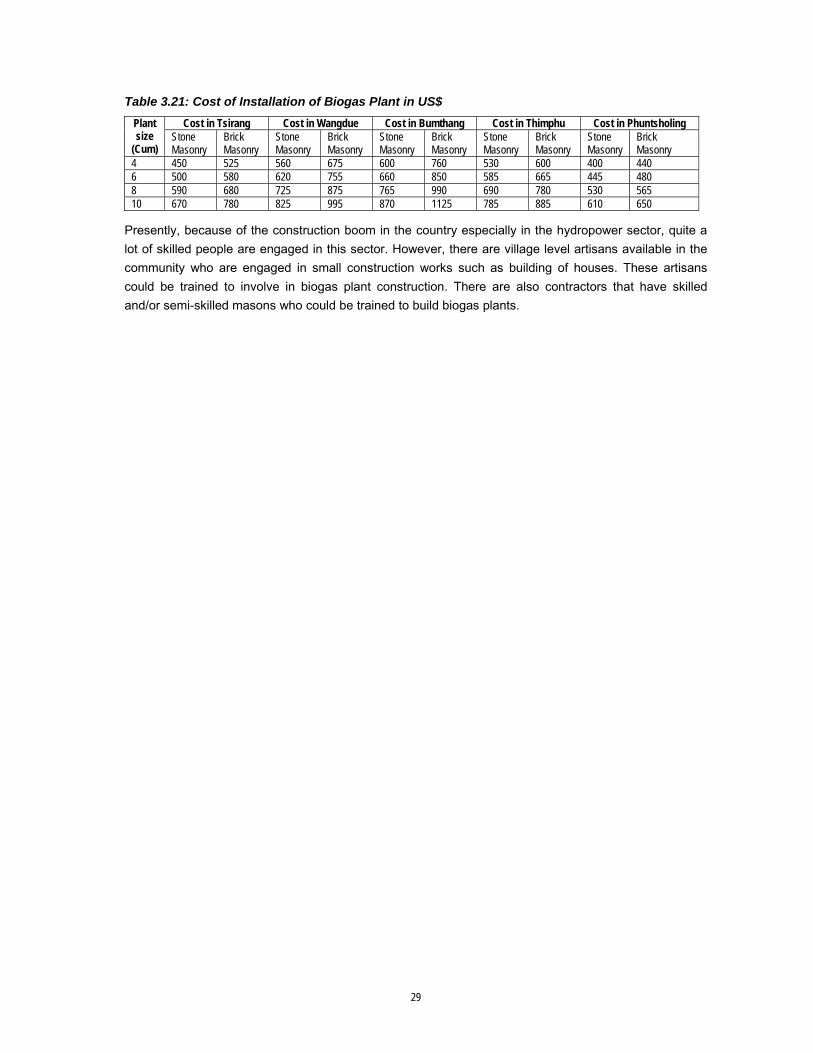
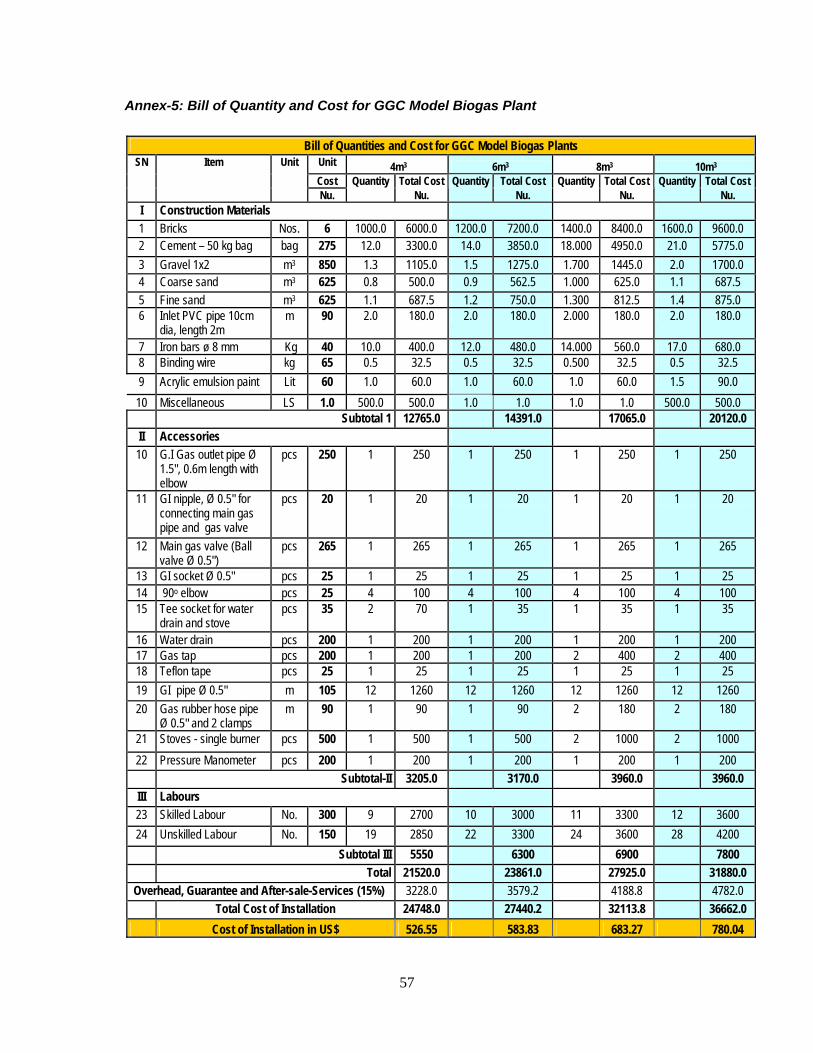
o Given the availability of and accessibility to stones (boulders) quarry sites all over the country, the cost of construction of biogas plant with stone masonry will be cheaper than that of brick masonry. The cost of a 6 cum biogas plant ranges from US$ 400 in Phuntsholing in the southern plain to US$ 600 in Bumthang in the high hills. There are village level artisans available in the community who are engaged in small construction works such as building of houses and these artisans could be trained in biogas plant construction.
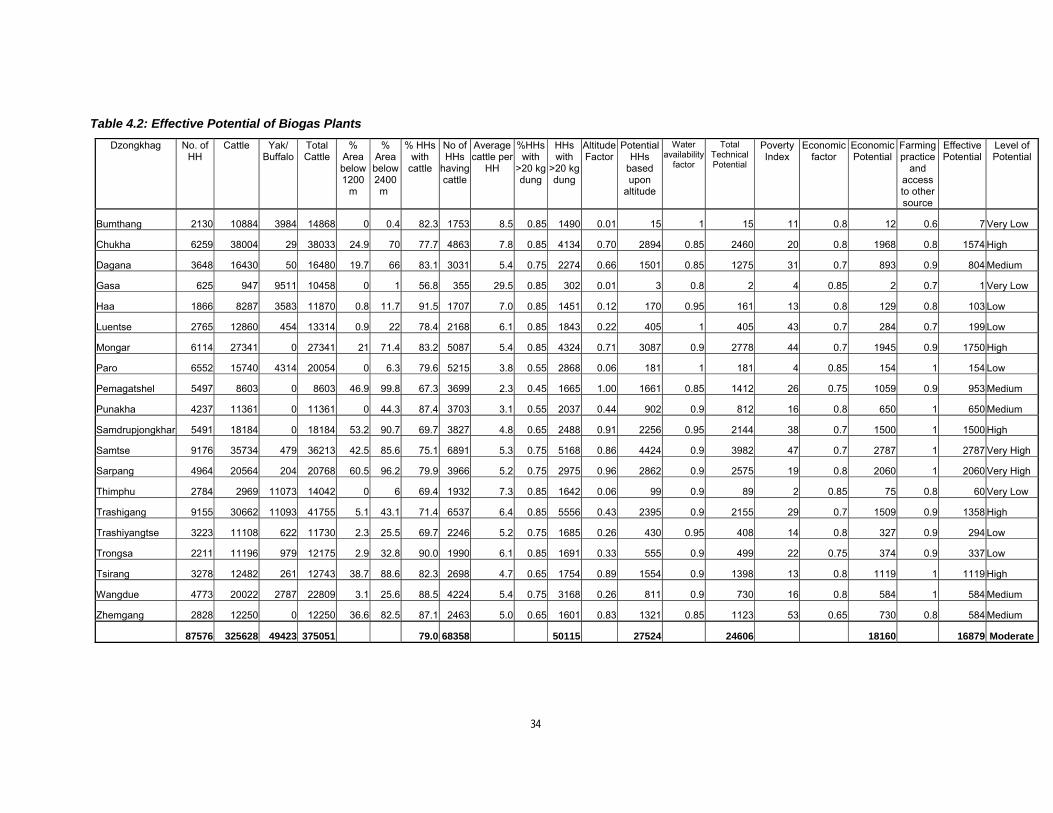
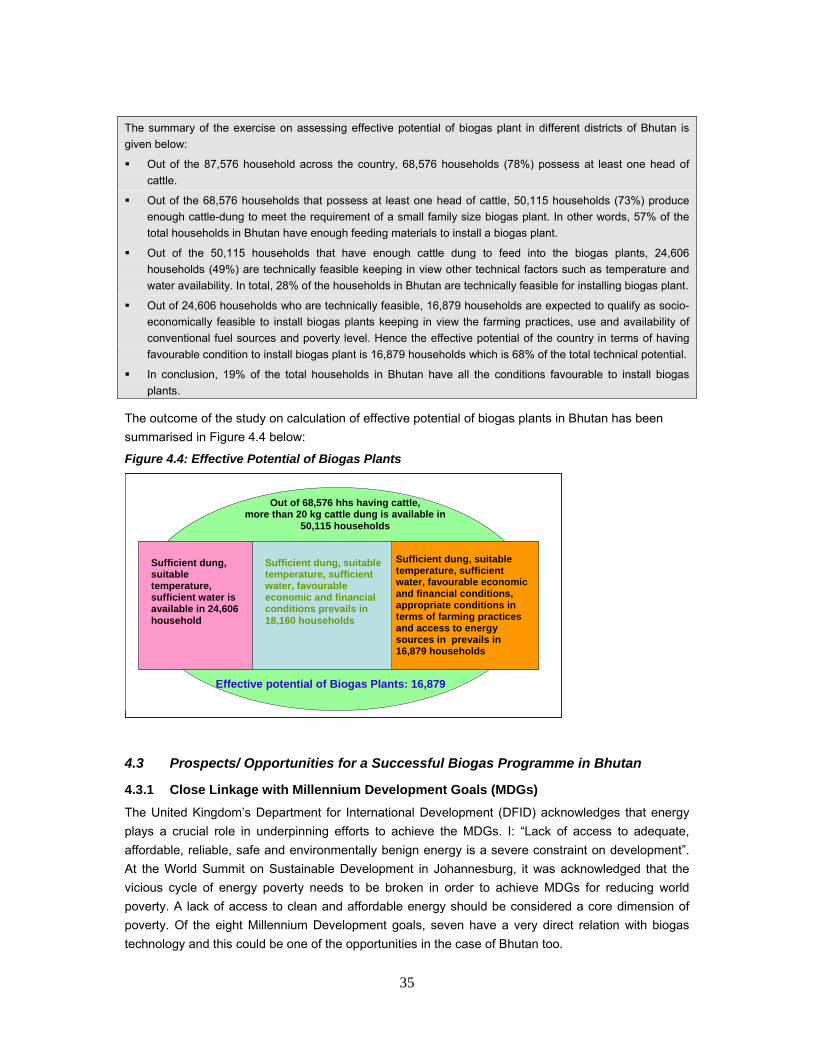
o Out of the 87,576 household across the country, 68,576 households (78%) possess at least one head of cattle. However, only 50,115 households (73%) produce enough cattle-dung to meet the requirement of a small family size biogas plant. In other words, 57% of the total households in Bhutan have enough feeding materials to install a biogas plant. Out of these 50,115 households, 24,606 households (49%) are technically feasible keeping in view the other technical factors such as temperature and water availability. In total, 28% of the households in Bhutan are technically feasible for installing a biogas plant. However, only 16,879 households are expected to qualify as socio-economically feasible to install biogas plants keeping in view the farming practices, use and availability of conventional fuel sources and poverty level. Hence the effective potential of the country in terms of having favourable conditions to install biogas plant is 16,879 households which is 68% of the total technical potential. In conclusion, 19% of the total households in Bhutan have all the conditions favourable to install biogas plants.
o Multiple benefits of biogas and bioslurry (including carbon revenue, MDGs), conducive farming practices (agriculture, livestock), higher incidences of smoke-borne diseases, social acceptance, quest of farmers to supplement chemical fertiliser with organic manure, and willingness of people to switch to Renewable Energy Technologies (RETs), especially Biogas, are major demand-side opportunities where as relatively low level of awareness of people, non-affordability for people at the lower level of socio-economic pyramid, low temperature, availability and accessibility to conventional sources of energy and trend of electrification in the country could be some of the constraints.
v
o Likewise, interest as well as commitment of the government and other organisations (ADB, SNV), reasonable market (more than 15,000 potential households), availability of affordable technology and suitable programme modalities within the region, possibility of integration of biogas programme with other development initiatives and commitment of government for environmental protection are the major opportunities to effective supply-side management. However, the scattered demand, difficulty on transportation of construction materials in rural areas, lack of qualified technicians, absence of strong and committed private sector, absence of accessible credit and limited experience with large scale biogas programme could be limiting factors.
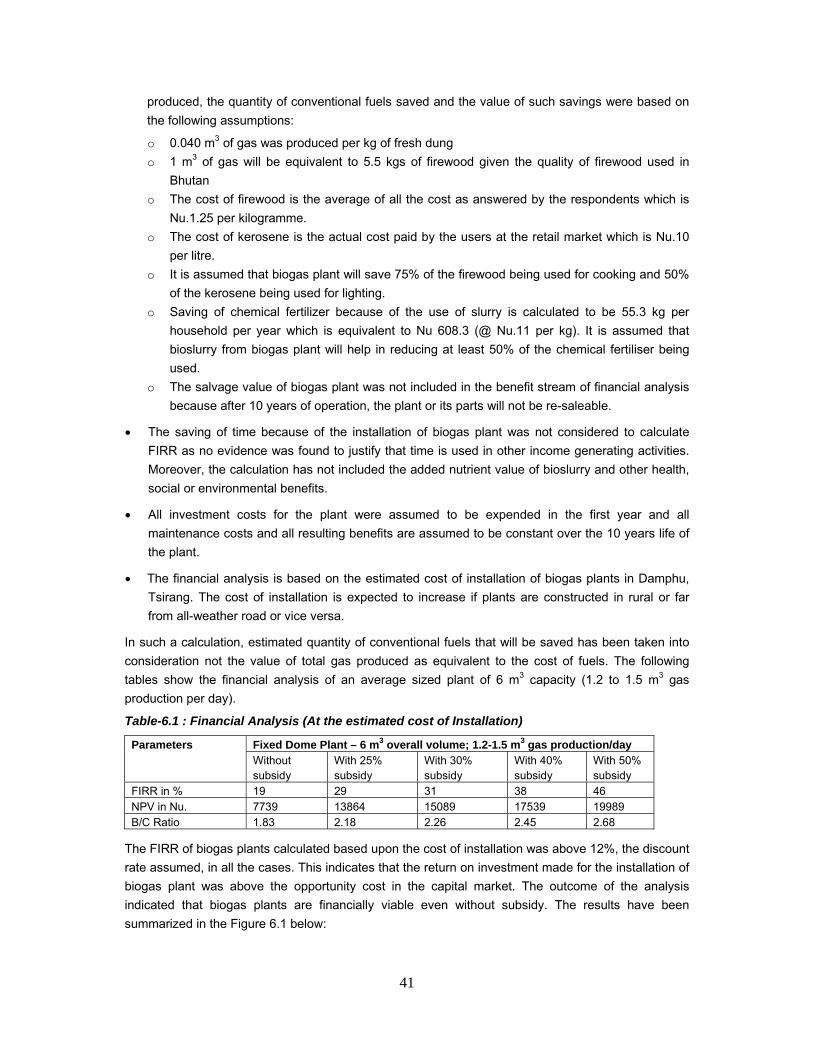
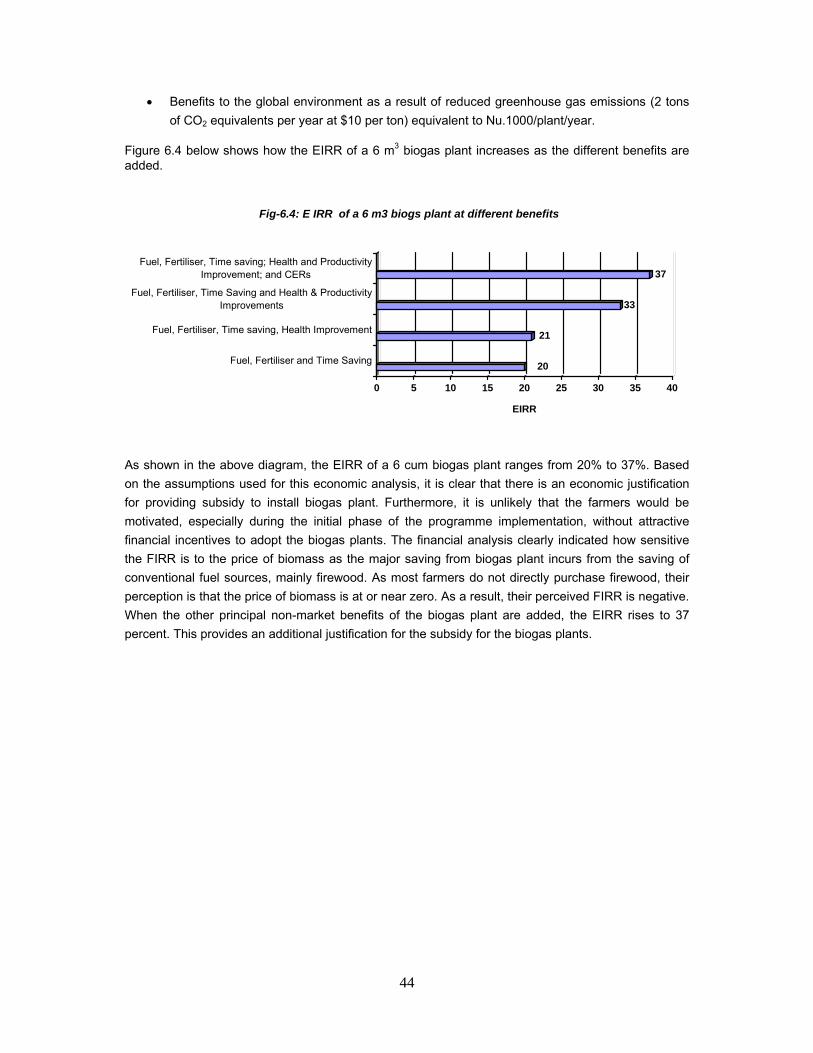
o The outcome of the financial analysis indicates that biogas plants are financial viable even without subsidy as the FIRR was calculated to be 19% for a 6 cum biogas plant. The benefit-cost ratio, based on current pricing ranges from 1.83 for a biogas plant without subsidy to 2.68 with 50% subsidy; indicates that the biogas plants are viable even without subsidy. The EIRR of a 6 cum biogas plant ranges from 20% to 37%. It is clear that there is an economic justification for providing subsidy to install biogas plants. Furthermore, it is unlikely that the farmers would be motivated, especially during the initial phase of the programme implementation, without attractive financial incentives to adopt biogas plants. In order to stimulate the demand for domestic biogas, lower the investment threshold for prospective households, and create leverage for quality management, some financial incentives such as investment subsidy is necessary
o A large proportion of Bhutan’s rural households own adequate livestock, setting the scope for a successful biogas programme. However, competitive prices of conventional fuel sources due to abundant forests, relatively low level of awareness of the people about biogas technology, low ambient temperatures especially at night time in temperate and higher altitude areas, and low affordability of rural farmers may limit that scope significantly. Current effective market for biogas plants seems modest mostly concentrated along the southern belt and inner valleys in the country. Samtse, Sarpang, Mongar, and Chukha are the most potential dzongkhags followed by Samdrupjongkhar, Trashigang and Tsirang. Substantial investments are needed in promotion, capacity building and quality management as well as private sector development, extension, and research & development.
o It is, therefore, recommended made to launch a modest National Biogas Program of five to six years duration with a target of installing 8,000 to 10,000 biogas plants; divided into phases of one to two years, each triggered by success of previous phase. In the initial year of implementation, 3 to 4 adjoining Dzongkhags could be selected based upon effective potential, ease of delivery services and other existing institutional support mechanisms.
vi
ACRONYMS & GLOSSARY Acronyms ADB AEO AMSL ARI BDFC BRE ° C CDM CER CO2
DFID DoE DOF DoL EIRR EPI Info FAO FIRR FM FMU FYM GDP GGC GHG GI Gwh HH/Hh ICS IEC Kl LPG MDG MFI MFPD MoA MoEA MS MS Rods MT MW NGO NPK NPV NRDCL
Asian Development Bank Assistant Extension Officer Altitude from Mean Sea Level Acute Respiratory Infection Bhutan Development Finance Corporation Biogas and Renewable Energy Degree Celsius Clean Development Mechanism Certified Emission Reduction Carbon dioxide Department for International Development Department of Energy Department of Forests Department of Livestock Economic Internal Rate of Return Statistics and Database Computer Software Food & Agriculture Organisation Financial Internal Rate of Return Frequency Modulation Forest Management Unit Farm Yard Manure Gross Domestic Product Gobar Gas (Biogas) Company Green House Gases Galvanised Iron Giga watt-hour Household Improved Cook Stoves Information Communication Education Kilo litre Liquefied Petroleum Gas Millennium Development Goals Micro-finance Institution Marketing and Food Policy Division Ministry of Agriculture Ministry of Economic Affairs Micro-soft Mild Steel Rods Metric tonne Mega Watt Non-governmental Organisation Nitrogen, Phosphorous, Potassium Net Present Value Natural Resource Development Corporation Limited
vii
Nu. PV PVC RED RET RGoB RMA RNR SHS SNV TERI TOR VER
Ngultrum (Bhutanese Currency) Photo Voltaic Poly Vinyl Chloride Renewable Energy Division Renewable Energy Technology Royal Government of Bhutan Royal Monetary Authority Renewable Natural Resources Solar Home Systems Netherlands Development Organisation The Energy and Research Institute Terms of Reference Voluntary Emission Reduction
Glossary Dzongkhag Gewog Ngultrum (Nu.)
Administrative unit - District Administrative unit – Block Bhutanese Currency ( 1 US$ = Nu. 46)
viii
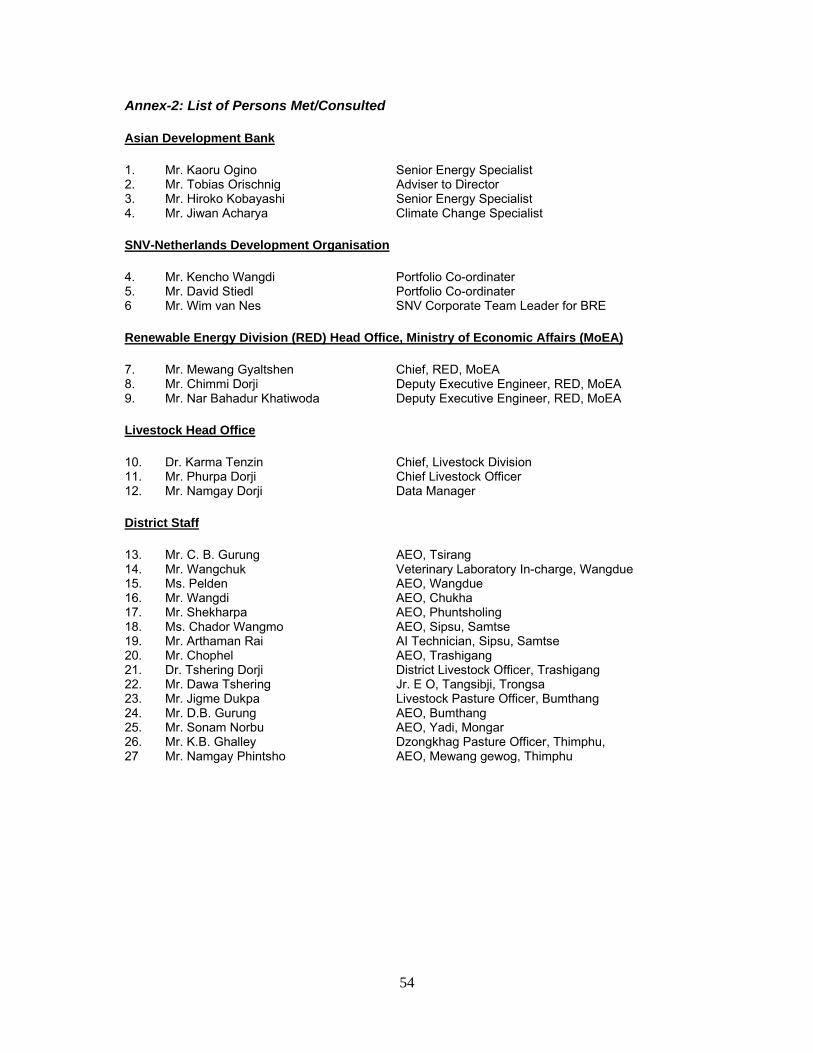
Acknowledgements We express our sincere thanks to Asian Development Bank, especially Mr. Kaoru Ogino, Senior Energy Specialist and Mr. Jiwan Acharya, Climate Change Specialists, for entrusting us to undertake the ‘Market Study of Biogas Plants in Bhutan’. During the course of this study, we have received help and advice from a large number of people and professionals, without which successful completion of this study would have been difficult. First of all, we would like to extend our appreciation to all, the names of whose do not appear in the list of acknowledgement. We sincerely acknowledge the guidance and support provided by Dr. Karma Tenzin, Division Head and Mr. Phurpa Dorji, Chief Livestock Officer from the Department of Livestock, Ministry of Agriculture; and Mr. Mewang Gyaltshen, Division Head, Mr. Chhimi Dorji and Mr. Nar B. Khatiwoda, Deputy Executive Engineers of the Renewable Energy Division of the Ministry of Economic Affairs. They were instrumental in guiding the preparation of the study tools and quality assurance of outputs. We extend out special thanks to Mr. Wim van Nes, SNV Biogas and Renewable Energy Practice Leader, Mr. David Steidl and Mr. Kencho Wangdi, Portfolio Coordinators, SNV Bhutan for their unfailing assistance and guidance provided during the course of the study. Our appreciation is extended to the livestock extension officials based in the sampled gewogs for assisting with field work logistics and arranging meetings and interviews with livestock rearing farmers. Above all, our sincere gratitude to the farmers selected in sampled districts and villages for spending their valuable time sharing their rich experiences on energy use and livestock rearing. Their inputs were critical in providing information for assessing market feasibility of biogas plants in Bhutan. We hope that the study truthfully reflects the views, problems and perceptions of these people. In closing, we would like to extend our sincere thanks to SNV Bhutan team for helping us with logistic and all other assistance rendered during our mission in Bhutan. The views expressed in this Report are those of the Consultants and do not represent the views of either ADB or SNV. Prakash C. Ghimire Saroj K. Nepal
ix
Table of Contents
EXECUTIVE SUMMARY ............................................................................................................................................II ACRONYMS & GLOSSARY.................................................................................................................................... VI ACKNOWLEDGEMENTS ..................................................................................................................................... VIII 1. INTRODUCTION .................................................................................................................................................1
1.5.1 Study Tools...............................................................................................................................................3 1.5.2 Sampling ..................................................................................................................................................4 1.5.3 Study Phases ............................................................................................................................................5
1.6 LIMITATIONS ..................................................................................................................................................7 1.7 ORGANISATION OF REPORT.........................................................................................................................7
2. COUNTRY BACKGROUND .............................................................................................................................8 2.1 INTRODUCTION..............................................................................................................................................8 2.2 ECONOMY .....................................................................................................................................................8 2.3 ENERGY RESOURCES AND CONSUMPTION.................................................................................................9 2.4 NATIONAL POLICY ON RENEWABLE ENERGY TECHNOLOGIES (RETS) ..................................................10 2.5 RENEWABLE NATURAL RESOURCES (RNR).............................................................................................10 2.6 HISTORY OF BIOGAS PLANTS IN BHUTAN AND LESSONS LEARNT...........................................................11
3. OUTCOME OF FIELD INVESTIGATION .....................................................................................................12 3.1 DEMOGRAPHY.............................................................................................................................................12 3.2 ECONOMIC STATUS ....................................................................................................................................13
3.2.1 Occupation.............................................................................................................................................13 3.2.2 Landholdings ........................................................................................................................................14 3.2.3 Agricultural Production .......................................................................................................................15 3.2.4 Livestock.................................................................................................................................................15 3.2.5 Income and expenditure.........................................................................................................................17
3.3 EDUCATIONAL STATUS...............................................................................................................................18 3.4 ENERGY USE ..............................................................................................................................................18 3.5 COOKING PATTERN AND COOKING ENVIRONMENT ..................................................................................21 3.6 DUNG PRODUCTION ...................................................................................................................................22 3.7 FARMING PRACTICES .................................................................................................................................23 3.8 HEALTH & SANITATION...............................................................................................................................23 3.9 SOCIAL AND CULTURAL ISSUES .................................................................................................................23 3.10 EXPOSURE TO BIOGAS TECHNOLOGY.......................................................................................................24 3.11 WILLINGNESS AND AFFORDABILITY ...........................................................................................................25 3.12 PRACTICE OF TAKING LOAN.......................................................................................................................26 3.13 APPROPRIATE BIOGAS DESIGN AND SIZES...............................................................................................26 3.14 AVAILABILITY OF CONSTRUCTION MATERIALS, APPLIANCES AND SKILLED LABOUR .............................28
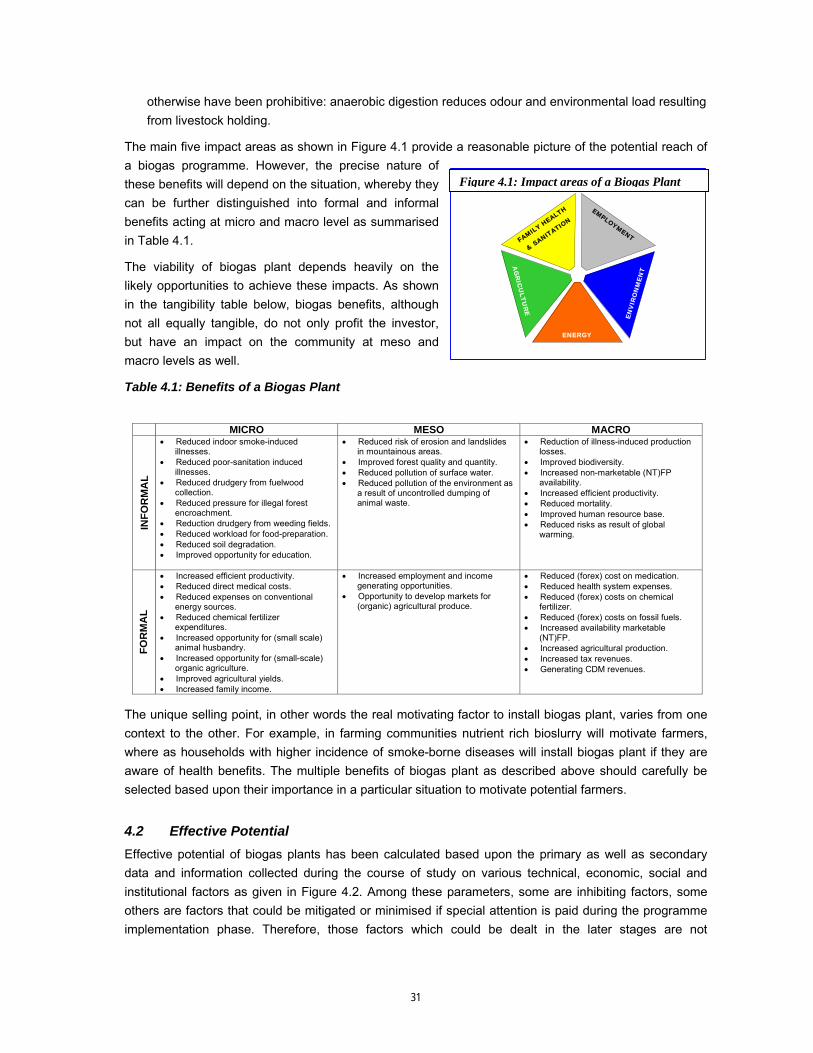
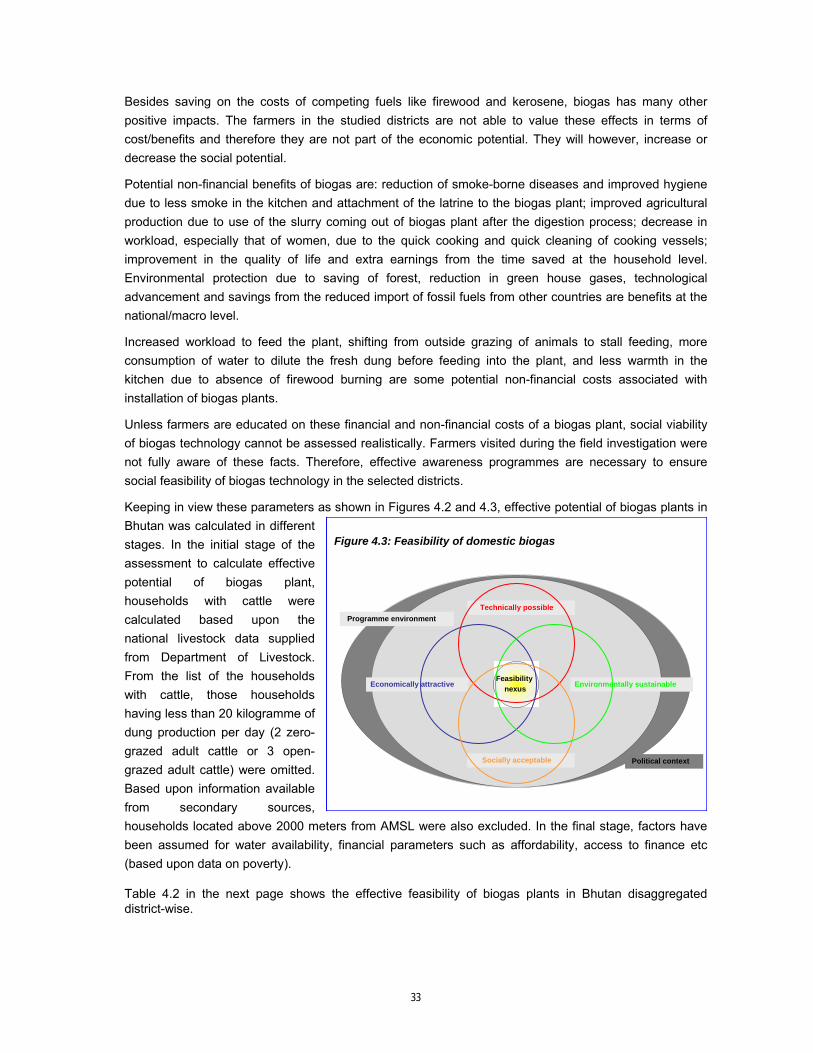
4. FEASIBILITY OF BIOGAS PLANTS ............................................................................................................30 4.1 BENEFITS OF A BIOGAS PLANT ..................................................................................................................30 4.2 EFFECTIVE POTENTIAL...............................................................................................................................31 4.3 PROSPECTS/ OPPORTUNITIES FOR A SUCCESSFUL BIOGAS PROGRAMME IN BHUTAN.........................35
4.3.1 Close Linkage with Millennium Development Goals (MGDs) .............................................................35 4.3.2 Prospects for Carbon Revenue (CERs/VERs).......................................................................................37 4.3.3 Internal factors ......................................................................................................................................37
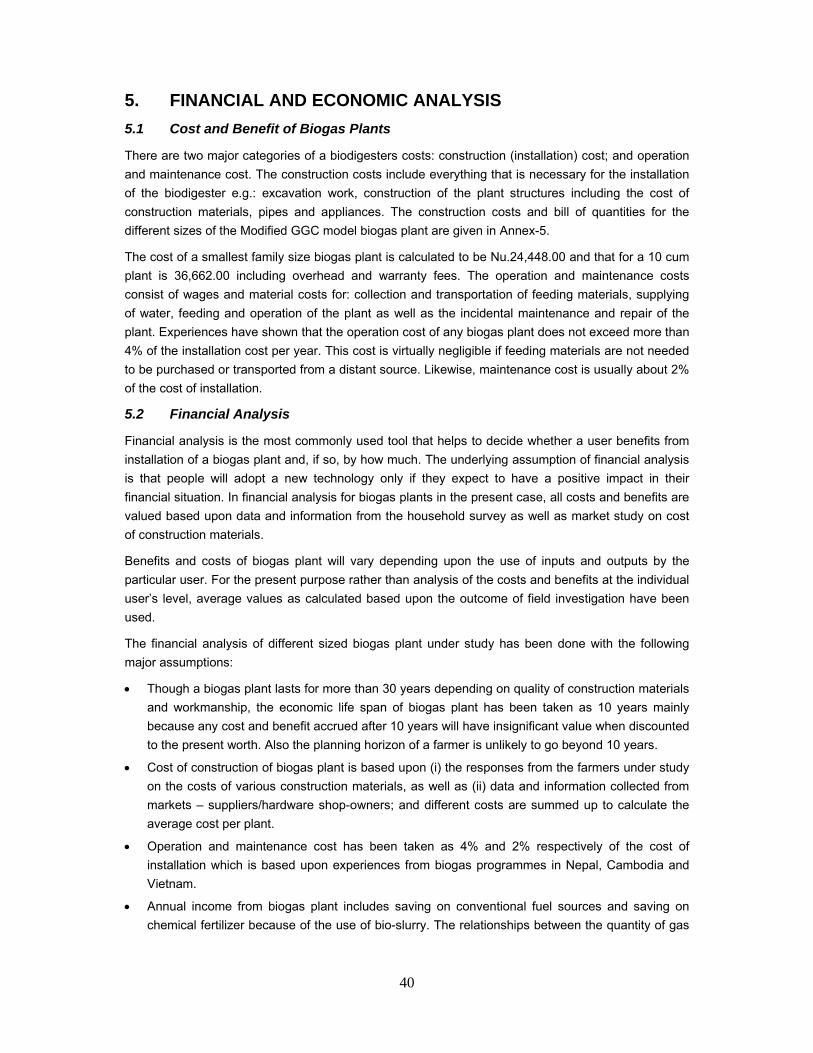
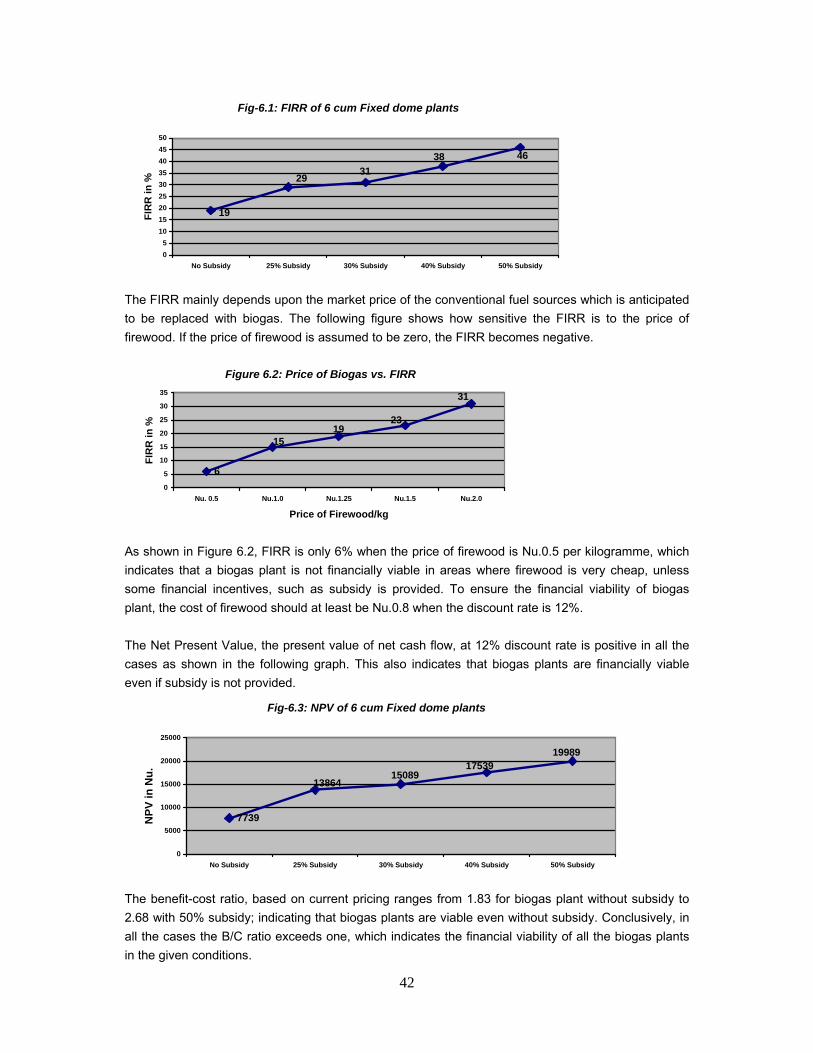
5. FINANCIAL AND ECONOMIC ANALYSIS .................................................................................................40 5.1 COST AND BENEFIT OF BIOGAS PLANTS...................................................................................................40 5.2 FINANCIAL ANALYSIS ..................................................................................................................................40 5.3 ECONOMIC ANALYSIS .................................................................................................................................43
6. CONCLUSION AND RECOMMENDATIONS..............................................................................................45 6.1 CONCLUSION ..............................................................................................................................................45 6.2 RECOMMENDATIONS ..................................................................................................................................45
6.2.1 Formulation of Programme Implementation Document for Biogas Programme................................45 6.2.2 Demand and Supply Side Management.................................................................................................46 6.2.3 Institutional Setup..................................................................................................................................46 6.2.4 Private Sector Development ..................................................................................................................47 6.2.5 Social verses Commercial Objectives of Programme...........................................................................47 6.2.6 Developing Effective Partnership .........................................................................................................48 6.2.7 Public and Political Awareness ............................................................................................................48 6.2.8 Motivation and Technology Promotion.................................................................................................49 6.2.9 Focus on ‘Quality’ .................................................................................................................................49 6.2.10 Incentives to be provided to Potential Farmers ...................................................................................50
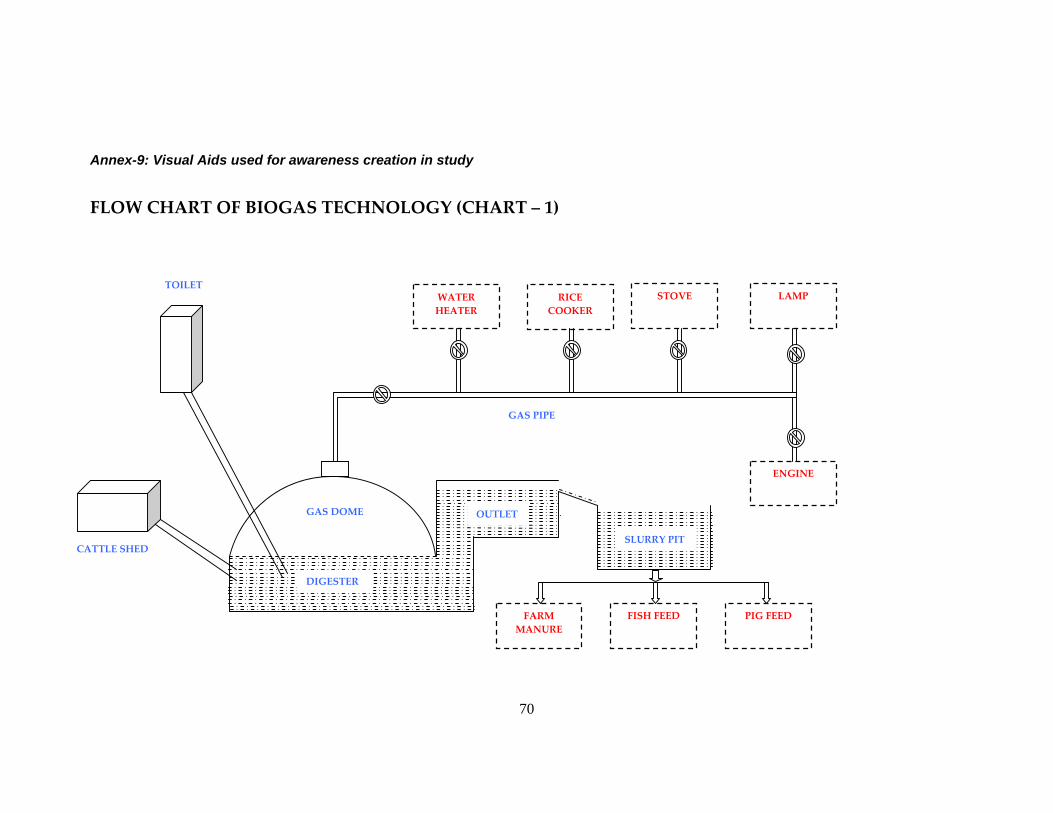
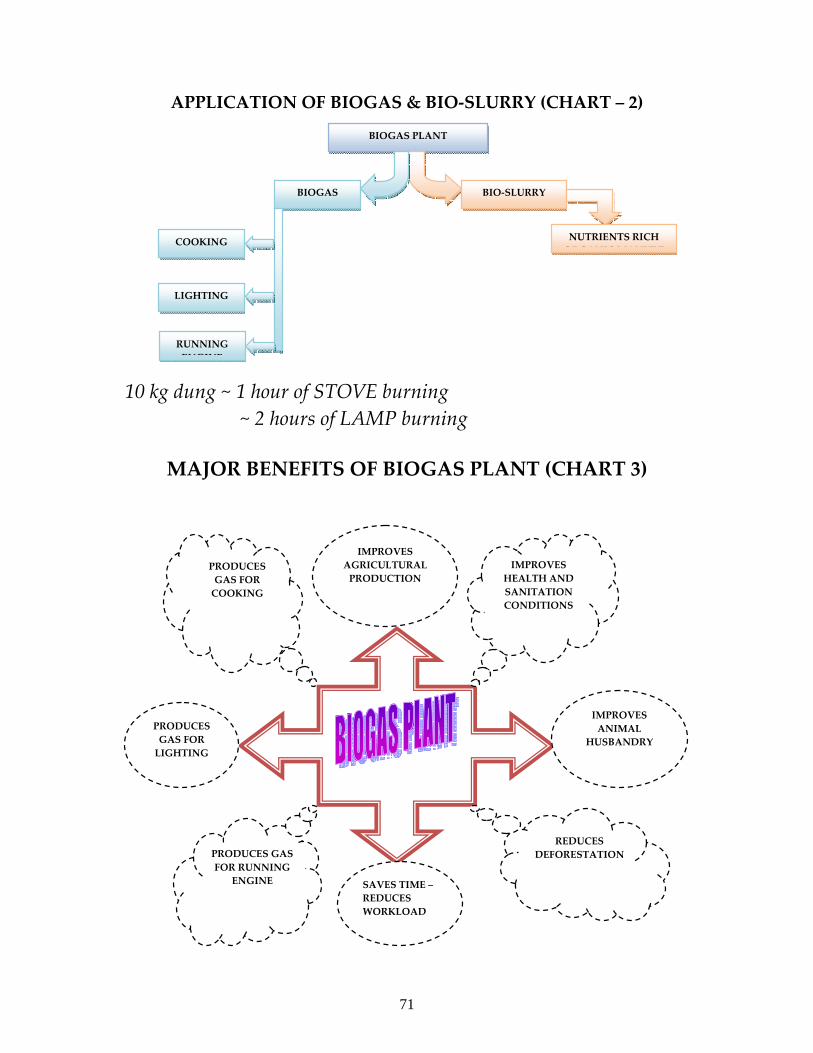
ANNEX-1: INFORMATION ON THE SAMPLED HOUSEHOLDS.....................................................................................53 ANNEX-2: LIST OF PERSONS MET/CONSULTED......................................................................................................54 ANNEX-3: STUDY SCHEDULE ...................................................................................................................................55 ANNEX-4: CONDITIONS FOR DISSEMINATION OF BIOGAS TECHNOLOGY...............................................................56 ANNEX-5: BILL OF QUANTITY AND COST FOR GGC MODEL BIOGAS PLANT ........................................................57 ANNEX-6: TERMS OF REFERENCES .........................................................................................................................58 ANNEX-7: FIELD STUDY QUESTIONNAIRES .............................................................................................................60 ANNEX-8: LIST OF PARTICIPANTS IN STAKEHOLDERS’ MEETING ...........................................................................69 ANNEX-9: VISUAL AIDS USED FOR AWARENESS CREATION IN STUDY....................................................................70
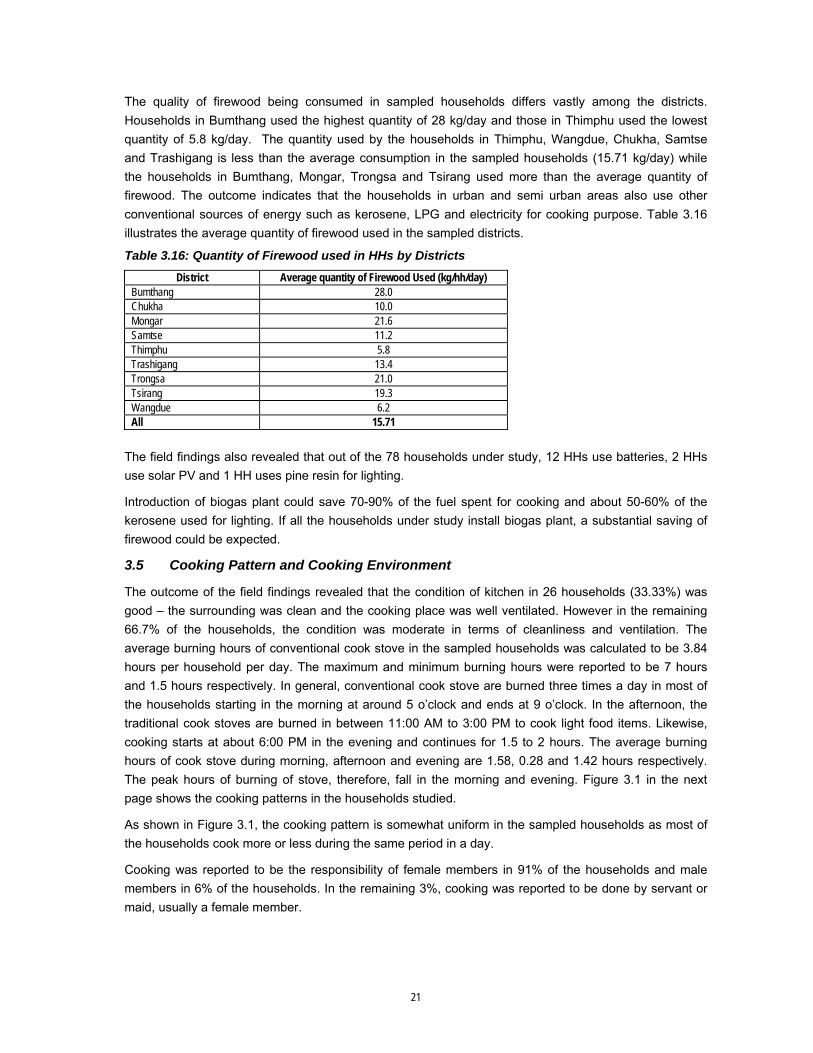
1
1. Introduction 1.1 Background Energy provides vital advantages that fuel economic growth and social development, and underpin the expansion and improvement of services in all aspects of development, including, water and sanitation systems, telecommunications, transportation, governance, agriculture, health, and education. Despite the centrality of energy services to development, developing countries are often disadvantaged in achieving development objectives because of lack of access to energy infrastructure and the services provided by this infrastructure. Expanding access to modern energy services increases economic growth, employment opportunities, private sector investment, and competitiveness; improves quality of life by enabling better health care, education, and access to clean water; and, protects the environment and public health. Unfortunately, more than two billion people, or one-third of the world’s population, have no access to electricity or other modern forms of energy. In important fields in energy infrastructure, developing countries and countries in transition often lag far behind developed countries. Expanding access to safe, affordable, efficient, reliable and clean energy to power economic and social development is often the cornerstone of most governments’ energy mission.
These days, new concepts and systems are emerging that demonstrate the importance of renewable energy as the new, clean, user-friendly and environment-benign source of fuel for domestic, institutional and industrial uses. Among these sources, biodigester technology that utilises organic substances, especially cattle dung, to produce biogas and bioslurry is becoming popular because of its simplicity and cost-effectiveness. Biogas technology is now considered as an important source of energy that can be used for cooking and lighting, and nutrient-rich organic manure which helps in increasing the productivity of the soil.
With many other Asian countries successfully promoting biogas, the Royal Government of Bhutan (RGoB) is showing a renewed and keen interest on promoting biogas technology in the country. The key institutions are the Department of Livestock (DoL) of the Ministry of Agriculture (MoA) having a wide network and staff throughout the country and the Renewable Energy Division (RED) under the Department of Energy (DoE) of the Ministry of Economic Affairs (MoEA).
In December 2008, SNV conducted a brief assessment of the feasibility of a possible biogas programme in Bhutan. The assessment was based on meetings with government officials, households and a few field observations. The study concluded that a small scale biogas programme for domestic use looks feasible. The outcome of the study revealed that about 20,000 biogas plants are technically feasible especially in the southern belt and inner mountain valleys. One of the reported challenges is the motivation of households to invest in biogas plants. The report also envisages that provision of subsidy and soft loans may help to attract more customers.
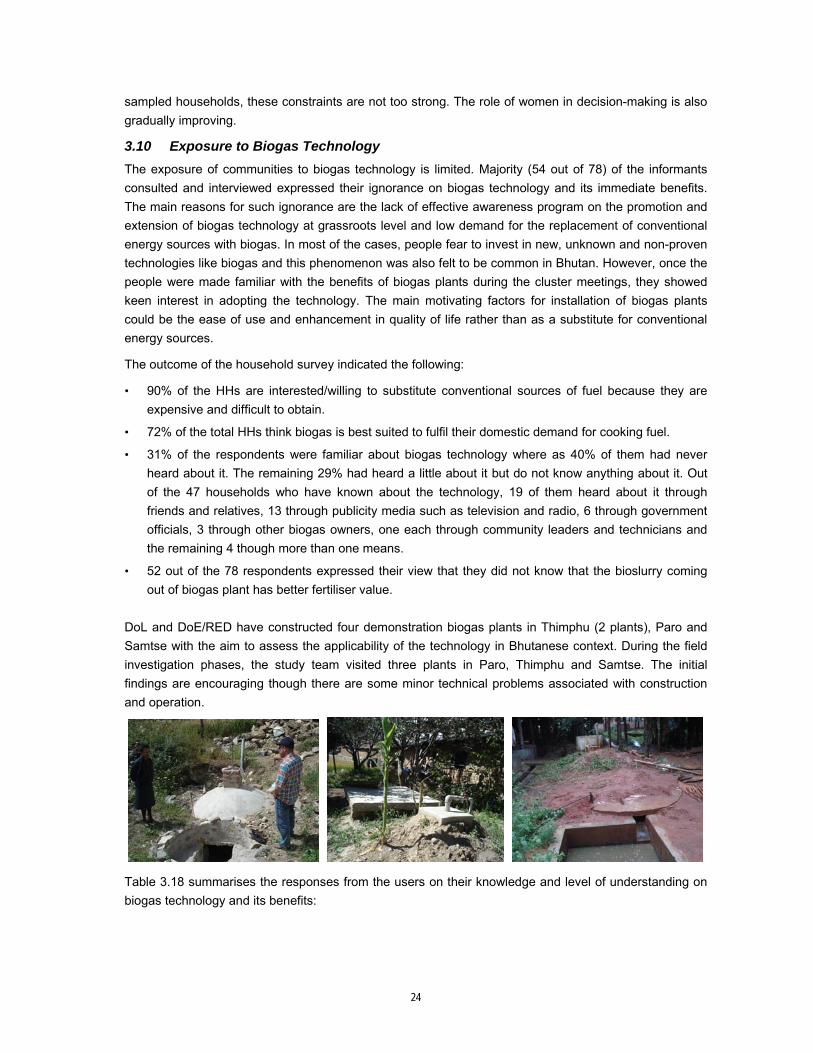
One of the recommendations of the SNV study was to establish a few pilot plants to further develop confidence within the possible implementing organisations. In this respect, the MoA commissioned two pilot biogas plants – one in Paro and one in Thimphu in 2009. Both the plants are operational and the biogas being used for cooking. The RED also initiated two pilot plants, one in Samtse (southern Bhutan) and one in Thimphu. With these initiatives, a foundation has been laid for potential biogas programme in Bhutan.
1.2 Rationale The key question for the development of a substantial biogas programme in Bhutan is whether the households having enough number of cattle to install biogas plants are willing and able to invest in it and
2
to feed the plant with the required amount of manure on a daily basis. The very tentative costs of a 6m3 capacity domestic biogas plant of Nepalese Gobar Gas Company (GGC) or Indian Deenbandhu design including construction fee amounts to Nu 27,440 or about US$ 550, which is a substantial sum of money for rural households to invest in a technology they are not familiar with. It is, therefore, necessary to assess technical feasibility as well as other related socio-economic parameters before deciding to initiate a full fledged national biogas programme. Asian Development Bank (ADB) under the framework of Energy for All Partnership Programme proposed to undertake a specific market study to provide realistic answers to various questions related to technical and socio-economic feasibility of a biogas programme in Bhutan and contracted SNV Netherlands Development Organisation to carry out an in-depth study. Energy for All Partnership is a regional, multi-stakeholder platform for networking, cooperation, sharing lessons learned, developing ‘scaling up’ projects with an objective to provide access to reliable and affordable modern energy services to 100 million people in Asia and the Pacific by 2015 ensuring the involvement of key stakeholders from private sector, financial institutions, governments and NGOs.
In case the market study is concluded positively, an implementation document detailing technological, organisational and institutional aspects for a Bhutanese biogas programme, including strategy, activity schedule, required budget and proposed financing will be formulated.
1.3 Objective, Scope and Activities The objective of the biogas market study is to assess the willingness and affordability of livestock keeping households to invest in biogas technology. The key question of the study is, therefore, ‘can biogas plants be ‘sold’ in Bhutan and if yes, to how many households and at what cost’?
The focus of this market study is on the following areas related to dissemination of biogas technology:
Demand side: What are the requirements in terms of domestic energy, improving health and enhancing agricultural production of farmers and local communities?
Supply side: How can the existing infrastructure (soft and hardware components) assist in dissemination of domestic biogas? and;
Intervention: Which are the niche geographical areas to disseminate biogas technology in Bhutan?
The following activities were conducted during the course of the study.
o Collection and review of relevant secondary (statistical) data on population, livestock, agriculture, water supply, energy consumption and soil temperature;
o Preparation of a questionnaire and design of a sampling method to collect data from livestock keeping households providing a realistic picture of the domestic biogas market in Bhutan. The questionnaire contained key technical and financial issues among others related to the number and type of the livestock at the farm; the estimated amount of fresh manure that can be collected on a daily basis to feed the digester; the possibility to use cattle urine for the mixing of the manure; the current (daily and seasonal pattern in the) use of fuels for lighting, heating and cooking by sex and its associated costs in terms of money and/or time; the current use of organic and chemical fertilisers; and the willingness and ability of the household to invest in a biogas plant in cash, kind or through a loan.
o Introductory meetings with key staff of Ministry of Economic Affairs (MoEA)/Department of energy (DoE)/Renewable Energy Division (RED); Ministry of Agriculture/Department of Livestock (MoA/DOL)
3
and SNV at the start of the assignment in Bhutan to finalise questionnaires, decide sample households and discuss on various aspects of the study;
o Preparation of a very brief questionnaire to collect data at the local markets on the price of fuels and basic construction materials (cement, sand, gravel, stones, gas pipe) and labour (skilled, unskilled);
o Visits to sampled clusters and selected households to collect primary data and information through cluster meetings, interview, observations and some measurements;
o Execution of a survey of 78 livestock keeping households and local markets in the sampled districts;
o Visits to operational and biogas plants under-construction in Paro and Thimphu to assess physical status and functioning.
o Preparation and presentation of the initial results of the study in a meeting involving key staff of MoA/DoL, MoEA/DoE/RED, ADB and SNV/Bhutan;
o Submission of a complete draft report for comment by key institutions; and
o Submission of a final report by incorporating/considering the comments from the key institutions.
1.4 Expected Results The main deliverable of this market study is a final report that includes: o Description of socio-economic characteristics of the sampled households (demography, family size,
occupations, land holdings, agricultural production, livestock ownership, educational status, income and expenditure etc.)
o Description of the suitability of domestic biogas plants in the country context. o Description of the fit of biogas in the local (agricultural) practices. o Description of the technical and socio-economic feasibility of biogas at micro level. o Description on the realistic market of domestic biogas in Bhutan. o Cost and quantity estimations of biogas plants by region. o Justification for the further development of a detailed programme implementation document for
domestic biogas in Bhutan. 1.5 Methodology
1.5.1 Study Tools The study was conducted in accordance with the objectives set out in the ToR. Both primary as well as secondary data and information were collected during the course of the study. Particular attention was paid to objectively verifiable indicators depending on the level of factual, quantitative and statistical information available, and the degree to which it was possible to quantify and extrapolate conclusions from field investigations and observation.
The main methods used were cluster meetings/group discussions, household survey and market assessment. The main instruments of the study were structured questionnaire and open-ended unstructured interview checklists with respondents from the selected households under study. Additional investigation methods included observations, especially of cattle-sheds, manure management practice, water sources, household kitchen and conventional fuel sources being used in the sampled households, using checklists, and informal discussions with people in the survey clusters. The structured questionnaire was discussed among experts from DoL/MoA, RED/DoE/MoEA and SNV-Bhutan prior to the field-testing and fine-tuning.
4
During the field survey process, the study team adopted an interactive approach to collect information rather than a ‘question and answer session’ with the respondents to enhance the quality of data and information collected. The interactions with respondents were focussed on issues/questions for which answers were elicited.
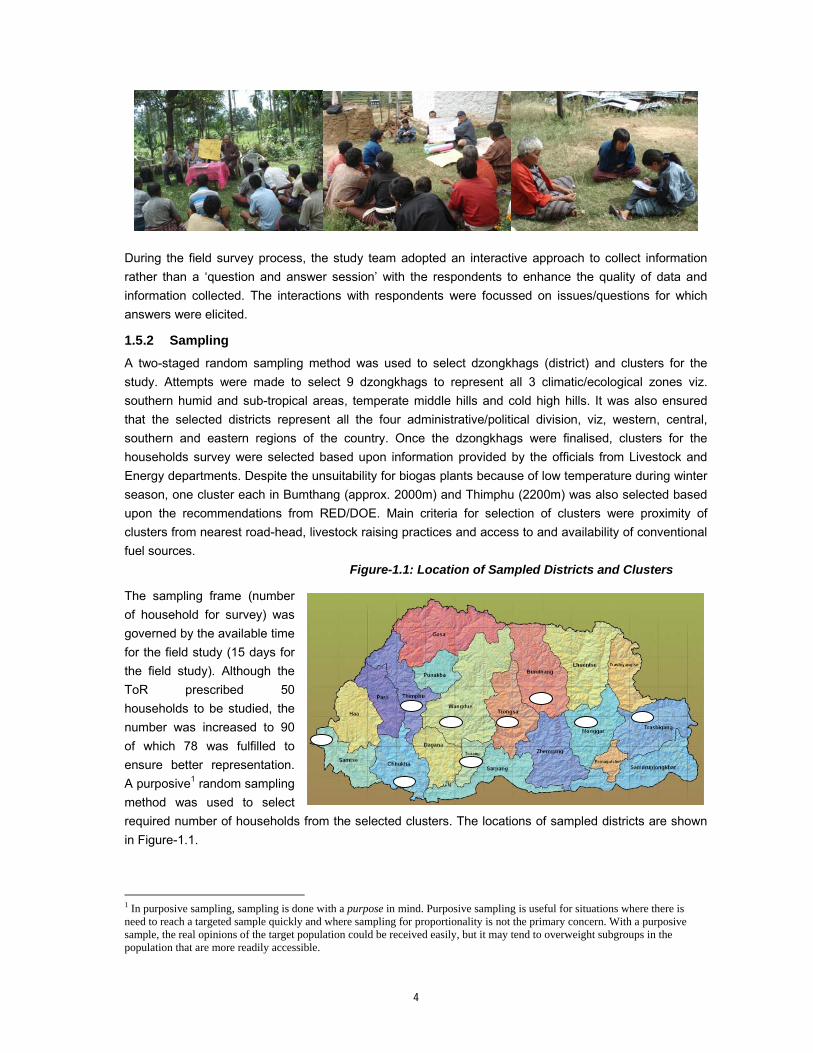
1.5.2 Sampling A two-staged random sampling method was used to select dzongkhags (district) and clusters for the study. Attempts were made to select 9 dzongkhags to represent all 3 climatic/ecological zones viz. southern humid and sub-tropical areas, temperate middle hills and cold high hills. It was also ensured that the selected districts represent all the four administrative/political division, viz, western, central, southern and eastern regions of the country. Once the dzongkhags were finalised, clusters for the households survey were selected based upon information provided by the officials from Livestock and Energy departments. Despite the unsuitability for biogas plants because of low temperature during winter season, one cluster each in Bumthang (approx. 2000m) and Thimphu (2200m) was also selected based upon the recommendations from RED/DOE. Main criteria for selection of clusters were proximity of clusters from nearest road-head, livestock raising practices and access to and availability of conventional fuel sources. Figure-1.1: Location of Sampled Districts and Clusters
The sampling frame (number of household for survey) was governed by the available time for the field study (15 days for the field study). Although the ToR prescribed 50 households to be studied, the number was increased to 90 of which 78 was fulfilled to ensure better representation. A purposive1 random sampling method was used to select required number of households from the selected clusters. The locations of sampled districts are shown in Figure-1.1.
1 In purposive sampling, sampling is done with a purpose in mind. Purposive sampling is useful for situations where there is need to reach a targeted sample quickly and where sampling for proportionality is not the primary concern. With a purposive sample, the real opinions of the target population could be received easily, but it may tend to overweight subgroups in the population that are more readily accessible.
5
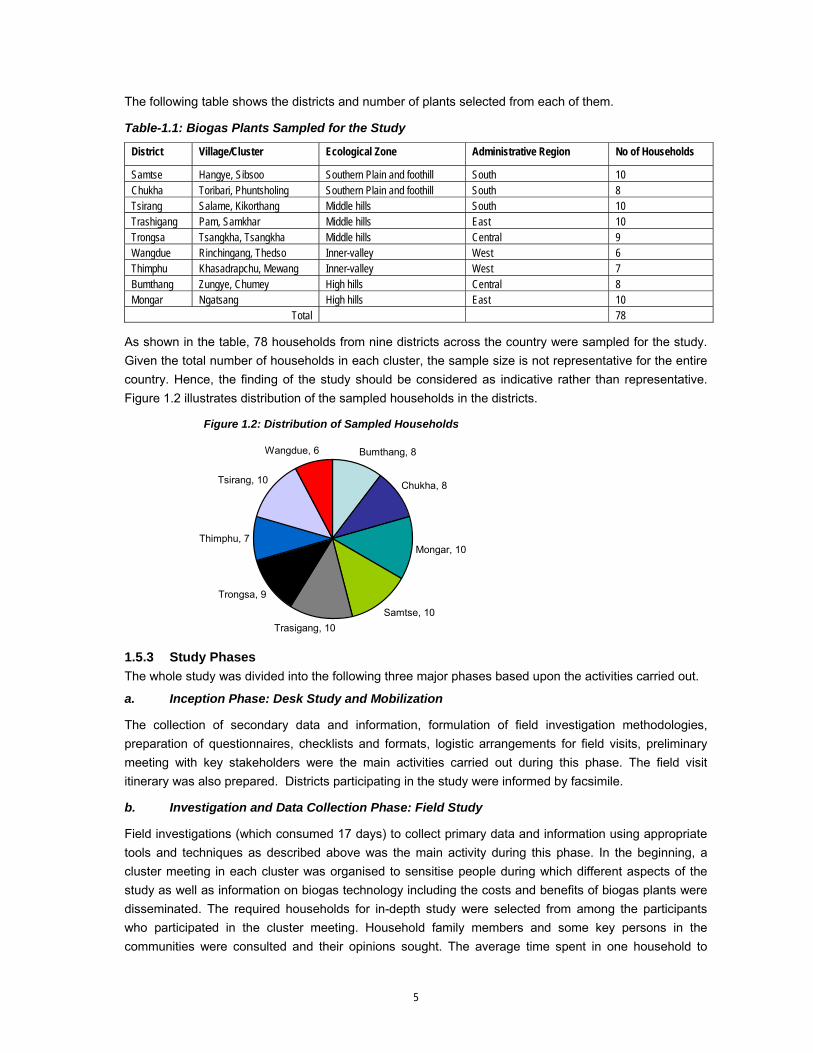
The following table shows the districts and number of plants selected from each of them.
Table-1.1: Biogas Plants Sampled for the Study
District Village/Cluster Ecological Zone Administrative Region No of Households
Samtse Hangye, Sibsoo Southern Plain and foothill South 10 Chukha Toribari, Phuntsholing Southern Plain and foothill South 8 Tsirang Salame, Kikorthang Middle hills South 10 Trashigang Pam, Samkhar Middle hills East 10 Trongsa Tsangkha, Tsangkha Middle hills Central 9 Wangdue Rinchingang, Thedso Inner-valley West 6 Thimphu Khasadrapchu, Mewang Inner-valley West 7 Bumthang Zungye, Chumey High hills Central 8 Mongar Ngatsang High hills East 10
Total 78
As shown in the table, 78 households from nine districts across the country were sampled for the study. Given the total number of households in each cluster, the sample size is not representative for the entire country. Hence, the finding of the study should be considered as indicative rather than representative. Figure 1.2 illustrates distribution of the sampled households in the districts.
Figure 1.2: Distribution of Sampled Households
Bumthang, 8
Chukha, 8
Mongar, 10
Samtse, 10Trasigang, 10
Trongsa, 9
Thimphu, 7
Tsirang, 10
Wangdue, 6
1.5.3 Study Phases The whole study was divided into the following three major phases based upon the activities carried out.
a. Inception Phase: Desk Study and Mobilization
The collection of secondary data and information, formulation of field investigation methodologies, preparation of questionnaires, checklists and formats, logistic arrangements for field visits, preliminary meeting with key stakeholders were the main activities carried out during this phase. The field visit itinerary was also prepared. Districts participating in the study were informed by facsimile.
b. Investigation and Data Collection Phase: Field Study
Field investigations (which consumed 17 days) to collect primary data and information using appropriate tools and techniques as described above was the main activity during this phase. In the beginning, a cluster meeting in each cluster was organised to sensitise people during which different aspects of the study as well as information on biogas technology including the costs and benefits of biogas plants were disseminated. The required households for in-depth study were selected from among the participants who participated in the cluster meeting. Household family members and some key persons in the communities were consulted and their opinions sought. The average time spent in one household to
6
collect data and information was 40 minutes with a maximum of 1 hour and 10 minutes and a minimum of 30 minutes.
c. Concluding Phase: Data Analysis, Interpretation and Report Preparation
Once the field activities were completed, all the data collected from the field and from secondary sources were crosschecked, verified, cleaned and analyzed using appropriate computer software programmes (EPI Info, MS Excel and MS Word). Primary data and information were triangulated with available secondary data and information as far as possible. The outcome of the analysis was then incorporated in a concise report.
The general methodology followed during the study has been illustrated in the following diagram.
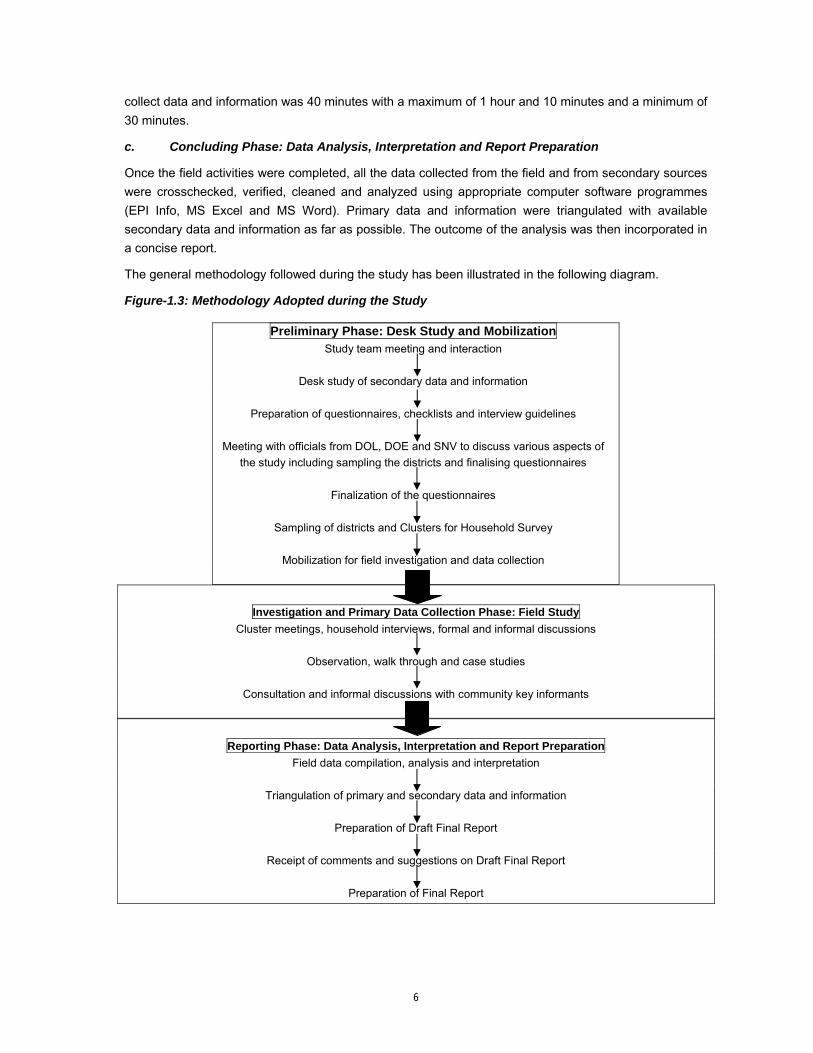
Figure-1.3: Methodology Adopted during the Study
Preliminary Phase: Desk Study and Mobilization Study team meeting and interaction
Desk study of secondary data and information
Preparation of questionnaires, checklists and interview guidelines
Meeting with officials from DOL, DOE and SNV to discuss various aspects of
the study including sampling the districts and finalising questionnaires
Finalization of the questionnaires
Sampling of districts and Clusters for Household Survey
Mobilization for field investigation and data collection
Investigation and Primary Data Collection Phase: Field Study
Cluster meetings, household interviews, formal and informal discussions
Observation, walk through and case studies
Consultation and informal discussions with community key informants
Reporting Phase: Data Analysis, Interpretation and Report Preparation
Field data compilation, analysis and interpretation
Triangulation of primary and secondary data and information
Preparation of Draft Final Report
Receipt of comments and suggestions on Draft Final Report
Preparation of Final Report
7
1.6 Limitations The study team attempted to be as participatory and consultative as possible during field investigation. However, like in every study/survey of this type, this study has its limitations as described hereafter: a. Due to limited awareness of people, additional time was spent informing them of biogas technology
and its applications. In general, there was limited experience and knowledge on biogas among rural households.
b. Given the limited sample size and confined coverage, the findings of the study may not represent the whole country. However, the outcome will be significantly similar in areas with comparable similar socio-economic, cultural and geographical settings. The outcome of the study therefore, is more indicative than representative.
c. The source of primary data and information was mainly the household survey. It should be noted that views and findings contained in this report are those derived from the responses of respective respondents.
d. Among many others, the study intended to explore some basic family/household level information on land holding, income and expenditure. It is possible that there were some shortcomings in retrieving actual information on these aspects. It was felt that some of the respondents had the tendency to withhold exact information due to various reasons while some others were hesitant to talk about it, some claimed ignorance and some mentioned quantities that proved to be very low or high later on. The same was the case on time spent on different activities, total burning hours of stoves and use of conventional fuel sources. Since it was a survey of households, there was no actual measurement. As far as quantifiable data and information were concerned, recall method was used, which may not be very exact.
e. Despite genuine efforts, this study was conducted within a short timeframe and with many other constraints. Hence the study might possess some errors methodologically and also in the findings presented here in.
f. The respondents are farmers having diverse social and educational backgrounds. Therefore, response errors are likely to be high although various techniques were used to get accurate responses.
1.7 Organisation of Report This report presents the outcome of the Biogas Market study conducted in October and November, 2009 by a team of consultants. Chapter-1 deals with the background, rationale, objective, methodology and limitations of the study. Chapter-2 describes a brief background of Bhutan including some facts on agricultural and energy sectors. The outcome of field investigations and implications of findings on biogas market in Bhutan is provided in Chapter-3. Chapter-4 comprises of the information on benefits of biogas plant, effective potentials of biogas plants in Bhutan as well as constraints and opportunities to market biogas plants in the country. An assessment of the financial and economic internal rates of return is presented in Chapter-5. Main conclusions and recommendations of the study are mentioned in Chapter-6. Chapter-7 enlists the reference materials referred during the course of the study. The annexure of the report consist of information on sampled households, lists of persons consulted, study schedule, conditions for dissemination of biogas technology, cost and quantity estimation of biogas plants of various sizes, terms of reference, field study questionnaires and visual aids used for awareness creation during field study.
8
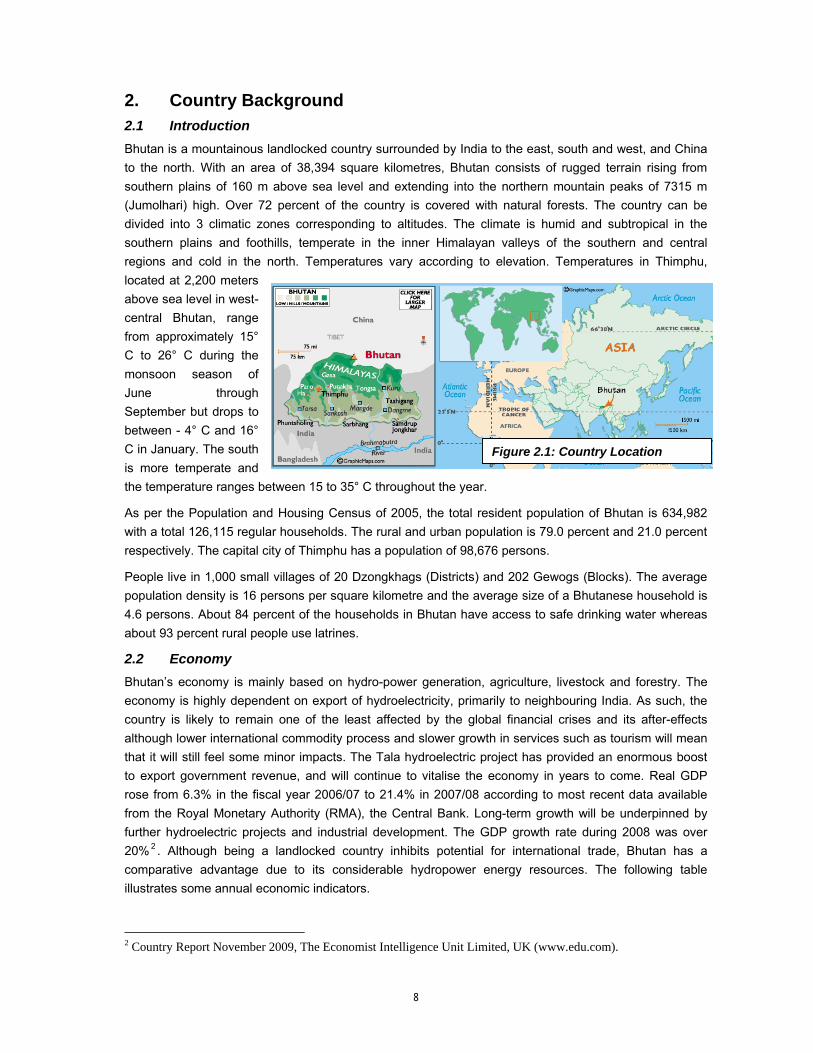
2. Country Background 2.1 Introduction Bhutan is a mountainous landlocked country surrounded by India to the east, south and west, and China to the north. With an area of 38,394 square kilometres, Bhutan consists of rugged terrain rising from southern plains of 160 m above sea level and extending into the northern mountain peaks of 7315 m (Jumolhari) high. Over 72 percent of the country is covered with natural forests. The country can be divided into 3 climatic zones corresponding to altitudes. The climate is humid and subtropical in the southern plains and foothills, temperate in the inner Himalayan valleys of the southern and central regions and cold in the north. Temperatures vary according to elevation. Temperatures in Thimphu, located at 2,200 meters above sea level in west-central Bhutan, range from approximately 15° C to 26° C during the monsoon season of June through September but drops to between - 4° C and 16° C in January. The south is more temperate and the temperature ranges between 15 to 35° C throughout the year.
As per the Population and Housing Census of 2005, the total resident population of Bhutan is 634,982 with a total 126,115 regular households. The rural and urban population is 79.0 percent and 21.0 percent respectively. The capital city of Thimphu has a population of 98,676 persons.
People live in 1,000 small villages of 20 Dzongkhags (Districts) and 202 Gewogs (Blocks). The average population density is 16 persons per square kilometre and the average size of a Bhutanese household is 4.6 persons. About 84 percent of the households in Bhutan have access to safe drinking water whereas about 93 percent rural people use latrines.
2.2 Economy Bhutan’s economy is mainly based on hydro-power generation, agriculture, livestock and forestry. The economy is highly dependent on export of hydroelectricity, primarily to neighbouring India. As such, the country is likely to remain one of the least affected by the global financial crises and its after-effects although lower international commodity process and slower growth in services such as tourism will mean that it will still feel some minor impacts. The Tala hydroelectric project has provided an enormous boost to export government revenue, and will continue to vitalise the economy in years to come. Real GDP rose from 6.3% in the fiscal year 2006/07 to 21.4% in 2007/08 according to most recent data available from the Royal Monetary Authority (RMA), the Central Bank. Long-term growth will be underpinned by further hydroelectric projects and industrial development. The GDP growth rate during 2008 was over 20% 2 . Although being a landlocked country inhibits potential for international trade, Bhutan has a comparative advantage due to its considerable hydropower energy resources. The following table illustrates some annual economic indicators.
2 Country Report November 2009, The Economist Intelligence Unit Limited, UK (www.edu.com).
Figure 2.1: Country Location
9
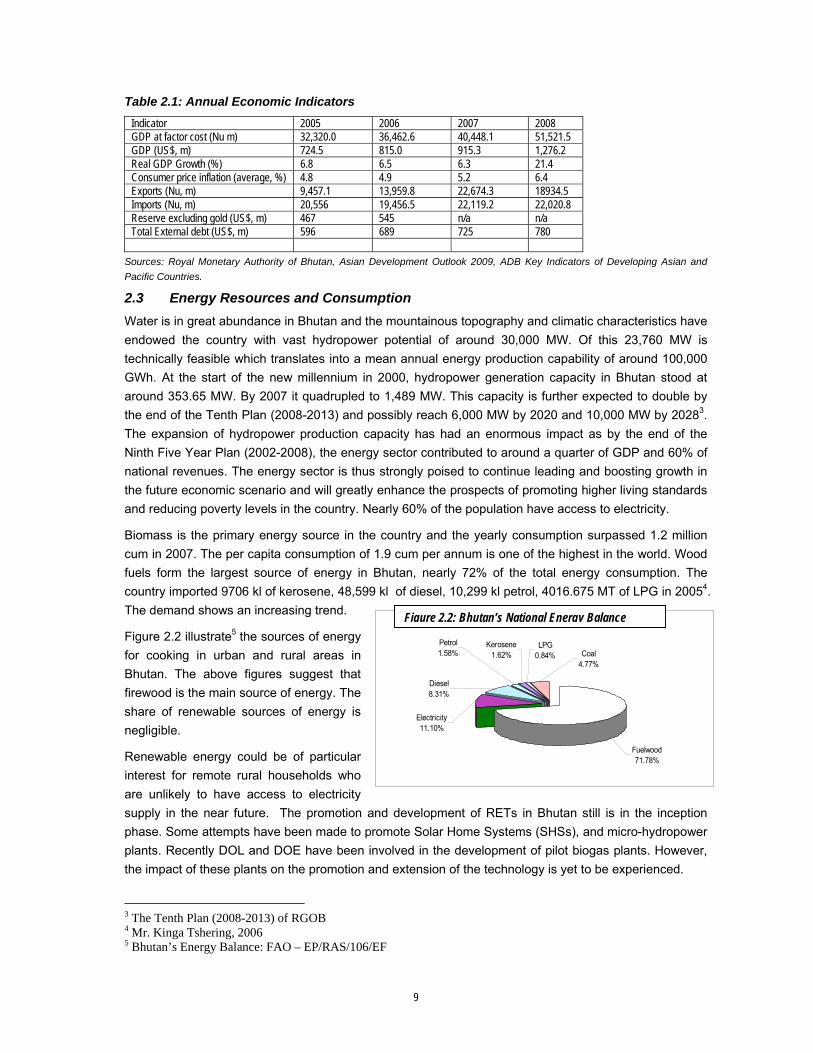
Table 2.1: Annual Economic Indicators Indicator 2005 2006 2007 2008 GDP at factor cost (Nu m) 32,320.0 36,462.6 40,448.1 51,521.5 GDP (US$, m) 724.5 815.0 915.3 1,276.2 Real GDP Growth (%) 6.8 6.5 6.3 21.4 Consumer price inflation (average, %) 4.8 4.9 5.2 6.4 Exports (Nu, m) 9,457.1 13,959.8 22,674.3 18934.5 Imports (Nu, m) 20,556 19,456.5 22,119.2 22,020.8 Reserve excluding gold (US$, m) 467 545 n/a n/a Total External debt (US$, m) 596 689 725 780
Sources: Royal Monetary Authority of Bhutan, Asian Development Outlook 2009, ADB Key Indicators of Developing Asian and Pacific Countries.
2.3 Energy Resources and Consumption Water is in great abundance in Bhutan and the mountainous topography and climatic characteristics have endowed the country with vast hydropower potential of around 30,000 MW. Of this 23,760 MW is technically feasible which translates into a mean annual energy production capability of around 100,000 GWh. At the start of the new millennium in 2000, hydropower generation capacity in Bhutan stood at around 353.65 MW. By 2007 it quadrupled to 1,489 MW. This capacity is further expected to double by the end of the Tenth Plan (2008-2013) and possibly reach 6,000 MW by 2020 and 10,000 MW by 20283. The expansion of hydropower production capacity has had an enormous impact as by the end of the Ninth Five Year Plan (2002-2008), the energy sector contributed to around a quarter of GDP and 60% of national revenues. The energy sector is thus strongly poised to continue leading and boosting growth in the future economic scenario and will greatly enhance the prospects of promoting higher living standards and reducing poverty levels in the country. Nearly 60% of the population have access to electricity.
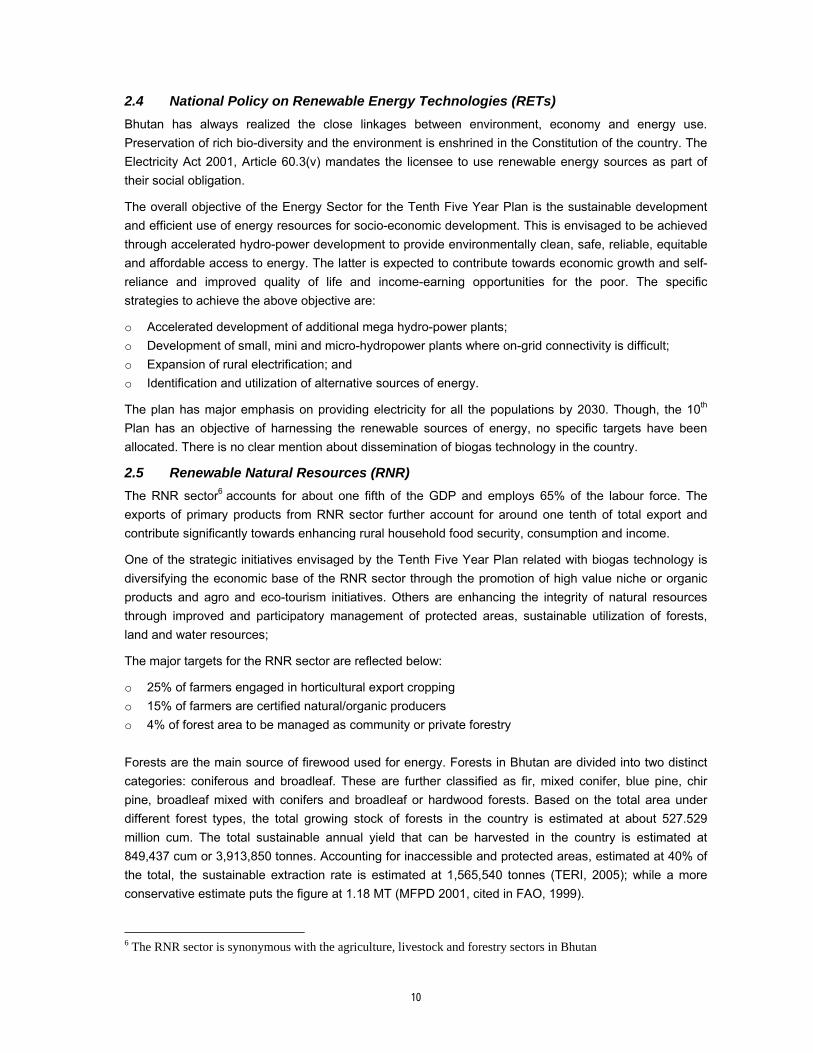
Biomass is the primary energy source in the country and the yearly consumption surpassed 1.2 million cum in 2007. The per capita consumption of 1.9 cum per annum is one of the highest in the world. Wood fuels form the largest source of energy in Bhutan, nearly 72% of the total energy consumption. The country imported 9706 kl of kerosene, 48,599 kl of diesel, 10,299 kl petrol, 4016.675 MT of LPG in 20054. The demand shows an increasing trend.
Figure 2.2 illustrate5 the sources of energy for cooking in urban and rural areas in Bhutan. The above figures suggest that firewood is the main source of energy. The share of renewable sources of energy is negligible.
Renewable energy could be of particular interest for remote rural households who are unlikely to have access to electricity supply in the near future. The promotion and development of RETs in Bhutan still is in the inception phase. Some attempts have been made to promote Solar Home Systems (SHSs), and micro-hydropower plants. Recently DOL and DOE have been involved in the development of pilot biogas plants. However, the impact of these plants on the promotion and extension of the technology is yet to be experienced.
3 The Tenth Plan (2008-2013) of RGOB 4 Mr. Kinga Tshering, 2006 5 Bhutan’s Energy Balance: FAO – EP/RAS/106/EF
Bhutan's National Energy Balance - FAO (EP/RAS/106/EF)
LPG0.84%
Petrol1.58%
Diesel8.31%
Electricity11.10%
Fuelwood71.78%
Kerosene1.62% Coal
4.77%
Figure 2.2: Bhutan’s National Energy Balance
10
2.4 National Policy on Renewable Energy Technologies (RETs) Bhutan has always realized the close linkages between environment, economy and energy use. Preservation of rich bio-diversity and the environment is enshrined in the Constitution of the country. The Electricity Act 2001, Article 60.3(v) mandates the licensee to use renewable energy sources as part of their social obligation.
The overall objective of the Energy Sector for the Tenth Five Year Plan is the sustainable development and efficient use of energy resources for socio-economic development. This is envisaged to be achieved through accelerated hydro-power development to provide environmentally clean, safe, reliable, equitable and affordable access to energy. The latter is expected to contribute towards economic growth and self-reliance and improved quality of life and income-earning opportunities for the poor. The specific strategies to achieve the above objective are:
o Accelerated development of additional mega hydro-power plants; o Development of small, mini and micro-hydropower plants where on-grid connectivity is difficult; o Expansion of rural electrification; and o Identification and utilization of alternative sources of energy.
The plan has major emphasis on providing electricity for all the populations by 2030. Though, the 10th Plan has an objective of harnessing the renewable sources of energy, no specific targets have been allocated. There is no clear mention about dissemination of biogas technology in the country.
2.5 Renewable Natural Resources (RNR) The RNR sector6 accounts for about one fifth of the GDP and employs 65% of the labour force. The exports of primary products from RNR sector further account for around one tenth of total export and contribute significantly towards enhancing rural household food security, consumption and income.
One of the strategic initiatives envisaged by the Tenth Five Year Plan related with biogas technology is diversifying the economic base of the RNR sector through the promotion of high value niche or organic products and agro and eco-tourism initiatives. Others are enhancing the integrity of natural resources through improved and participatory management of protected areas, sustainable utilization of forests, land and water resources;
The major targets for the RNR sector are reflected below:
o 25% of farmers engaged in horticultural export cropping o 15% of farmers are certified natural/organic producers o 4% of forest area to be managed as community or private forestry Forests are the main source of firewood used for energy. Forests in Bhutan are divided into two distinct categories: coniferous and broadleaf. These are further classified as fir, mixed conifer, blue pine, chir pine, broadleaf mixed with conifers and broadleaf or hardwood forests. Based on the total area under different forest types, the total growing stock of forests in the country is estimated at about 527.529 million cum. The total sustainable annual yield that can be harvested in the country is estimated at 849,437 cum or 3,913,850 tonnes. Accounting for inaccessible and protected areas, estimated at 40% of the total, the sustainable extraction rate is estimated at 1,565,540 tonnes (TERI, 2005); while a more conservative estimate puts the figure at 1.18 MT (MFPD 2001, cited in FAO, 1999).
6 The RNR sector is synonymous with the agriculture, livestock and forestry sectors in Bhutan
11
2.6 History of Biogas Plants in Bhutan and Lessons Learnt Keeping in view the importance of biogas technology to fulfil the demand of domestic energy, an attempt was made in Bhutan during late 80s to introduce biogas technology by installing about 50 biogas plants in the southern sub-tropical region of the country. The model of biogas plant selected for installation was the Indian Deenbandhu fixed dome digester with a size of 4m3 and 6m3 capacity. The majority of the biogas plants stopped functioning after a few years of operation mainly due to gas leakage from gas holders and water traps. Some of them reportedly worked for more than 15 years without any major problems. The first plant constructed as a demonstration plant functioned till 2006. It is assumed that this first plant worked longer due to high quality construction and effective operation and maintenance. After the failure of these plants, no further attempts at promoting biogas was made in Bhutan, though couple of plants were reported to be installed in Punakha and Paro by few individuals.
The major reasons for the failure of such biogas plants were mainly the lack of organised service delivery provisions. The installations were given for free, and mostly the user selection was not done properly. When something went wrong with the biogas plant, the user quickly lost interest in it. Furthermore, the users were not informed on the benefits and limitations of the technology, neither have they been trained in operation and maintenance of the plant. The masons that build such plants were not trained to do the job; therefore the quality of final product was low. There were neither after-sales service provisions nor a warranty given for defaults in construction. Worst of all, the users were not trained to benefit from the bio-slurry that comes out of the biogas plant.
Sustainable biogas programs are complex and very costly. In order to be cost effective, they need to be large-scale and to be implemented during a sufficient long period of time to consolidate all the achievements and to have sufficient critical mass in terms of institutional knowledge, trained masons and informed users. A sustainable biogas program consists mainly of the following components:
o Promotion and marketing o Training and capacity building o Quality management o Monitoring and evaluation o Institutional support including private sector development o Extension
The outcome of the study indicated that the earlier initiatives lacked long-term vision and organised service delivery mechanisms. The ad hoc nature of service delivery without any provisions of awareness building activities before the construction, and the absence of after-sale-services once the plant is operational were main causes for the failure of installed biogas plants.
12
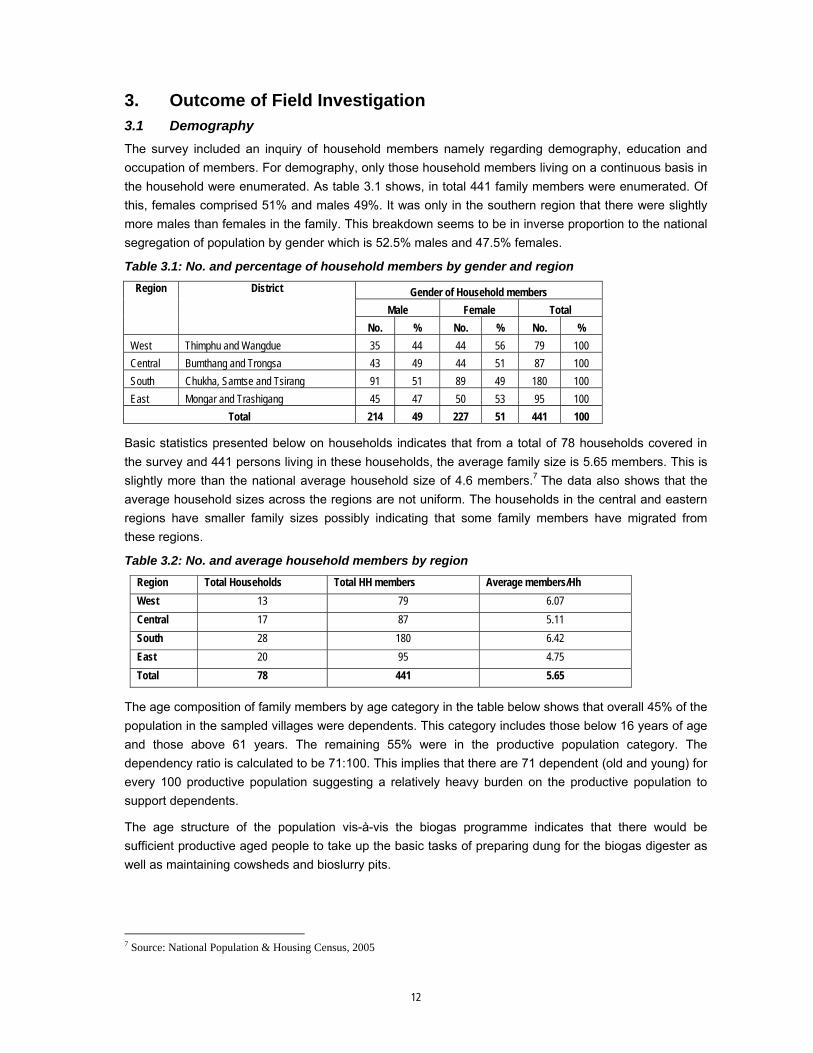
3. Outcome of Field Investigation 3.1 Demography The survey included an inquiry of household members namely regarding demography, education and occupation of members. For demography, only those household members living on a continuous basis in the household were enumerated. As table 3.1 shows, in total 441 family members were enumerated. Of this, females comprised 51% and males 49%. It was only in the southern region that there were slightly more males than females in the family. This breakdown seems to be in inverse proportion to the national segregation of population by gender which is 52.5% males and 47.5% females.
Table 3.1: No. and percentage of household members by gender and region
Gender of Household members Male Female Total
Region District
No. % No. % No. % West Thimphu and Wangdue 35 44 44 56 79 100 Central Bumthang and Trongsa 43 49 44 51 87 100 South Chukha, Samtse and Tsirang 91 51 89 49 180 100 East Mongar and Trashigang 45 47 50 53 95 100
Total 214 49 227 51 441 100
Basic statistics presented below on households indicates that from a total of 78 households covered in the survey and 441 persons living in these households, the average family size is 5.65 members. This is slightly more than the national average household size of 4.6 members.7 The data also shows that the average household sizes across the regions are not uniform. The households in the central and eastern regions have smaller family sizes possibly indicating that some family members have migrated from these regions.
Table 3.2: No. and average household members by region Region Total Households Total HH members Average members/Hh West 13 79 6.07 Central 17 87 5.11 South 28 180 6.42 East 20 95 4.75 Total 78 441 5.65
The age composition of family members by age category in the table below shows that overall 45% of the population in the sampled villages were dependents. This category includes those below 16 years of age and those above 61 years. The remaining 55% were in the productive population category. The dependency ratio is calculated to be 71:100. This implies that there are 71 dependent (old and young) for every 100 productive population suggesting a relatively heavy burden on the productive population to support dependents.
The age structure of the population vis-à-vis the biogas programme indicates that there would be sufficient productive aged people to take up the basic tasks of preparing dung for the biogas digester as well as maintaining cowsheds and bioslurry pits.
7 Source: National Population & Housing Census, 2005
13
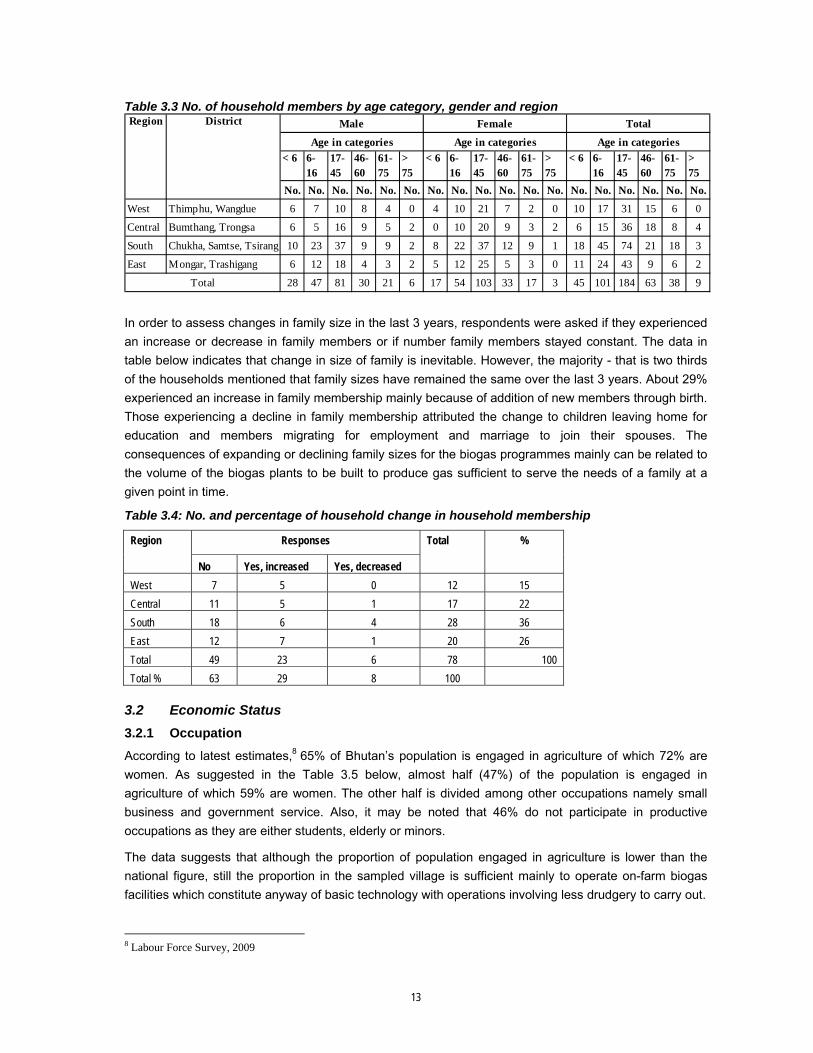
Table 3.3 No. of household members by age category, gender and region
Age in categories Age in categories Age in categories
Total
Region District Male Female
In order to assess changes in family size in the last 3 years, respondents were asked if they experienced an increase or decrease in family members or if number family members stayed constant. The data in table below indicates that change in size of family is inevitable. However, the majority - that is two thirds of the households mentioned that family sizes have remained the same over the last 3 years. About 29% experienced an increase in family membership mainly because of addition of new members through birth. Those experiencing a decline in family membership attributed the change to children leaving home for education and members migrating for employment and marriage to join their spouses. The consequences of expanding or declining family sizes for the biogas programmes mainly can be related to the volume of the biogas plants to be built to produce gas sufficient to serve the needs of a family at a given point in time.
Table 3.4: No. and percentage of household change in household membership
Responses Region
No Yes, increased Yes, decreased
Total %
West 7 5 0 12 15 Central 11 5 1 17 22 South 18 6 4 28 36 East 12 7 1 20 26 Total 49 23 6 78 100 Total % 63 29 8 100
3.2 Economic Status 3.2.1 Occupation According to latest estimates,8 65% of Bhutan’s population is engaged in agriculture of which 72% are women. As suggested in the Table 3.5 below, almost half (47%) of the population is engaged in agriculture of which 59% are women. The other half is divided among other occupations namely small business and government service. Also, it may be noted that 46% do not participate in productive occupations as they are either students, elderly or minors.
The data suggests that although the proportion of population engaged in agriculture is lower than the national figure, still the proportion in the sampled village is sufficient mainly to operate on-farm biogas facilities which constitute anyway of basic technology with operations involving less drudgery to carry out.
8 Labour Force Survey, 2009
14
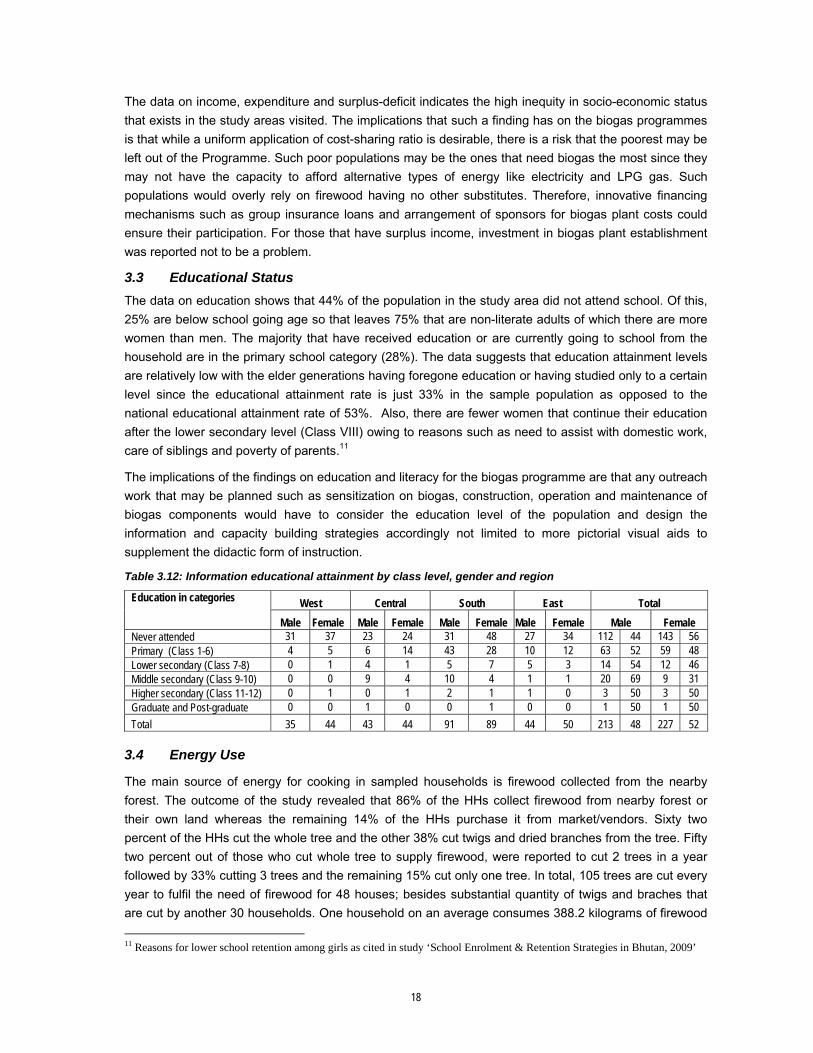
Table 3.5: No. and percentage of household members’ occupation by region, gender and type of occupation
West Central South East Total Male Female Male Female Male Female Male Female Male Female
Information collected on secondary occupations shows that agriculture followed by operating small businesses are the next best options to the main occupations. However, the number that adopted these is low with only 21 persons in agriculture and 6 persons in small business, suggesting that agriculture is the primary means of livelihoods in rural areas.
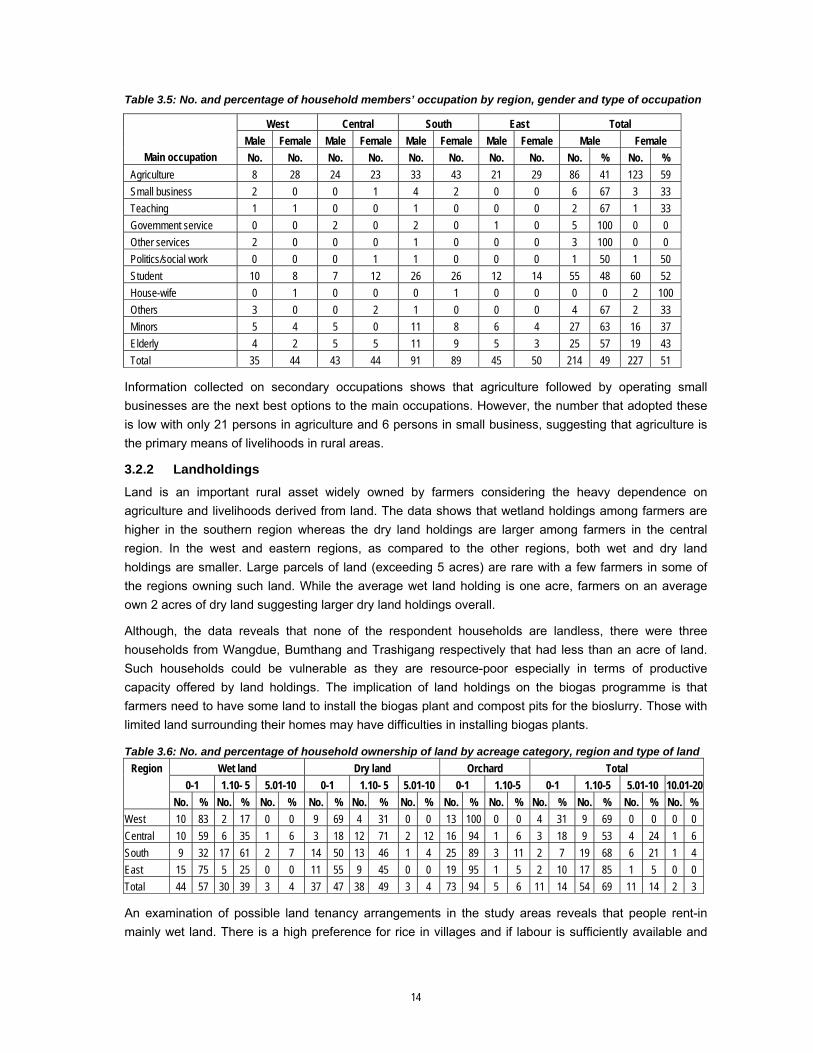
3.2.2 Landholdings Land is an important rural asset widely owned by farmers considering the heavy dependence on agriculture and livelihoods derived from land. The data shows that wetland holdings among farmers are higher in the southern region whereas the dry land holdings are larger among farmers in the central region. In the west and eastern regions, as compared to the other regions, both wet and dry land holdings are smaller. Large parcels of land (exceeding 5 acres) are rare with a few farmers in some of the regions owning such land. While the average wet land holding is one acre, farmers on an average own 2 acres of dry land suggesting larger dry land holdings overall.
Although, the data reveals that none of the respondent households are landless, there were three households from Wangdue, Bumthang and Trashigang respectively that had less than an acre of land. Such households could be vulnerable as they are resource-poor especially in terms of productive capacity offered by land holdings. The implication of land holdings on the biogas programme is that farmers need to have some land to install the biogas plant and compost pits for the bioslurry. Those with limited land surrounding their homes may have difficulties in installing biogas plants.
Table 3.6: No. and percentage of household ownership of land by acreage category, region and type of land Wet land Dry land Orchard Total
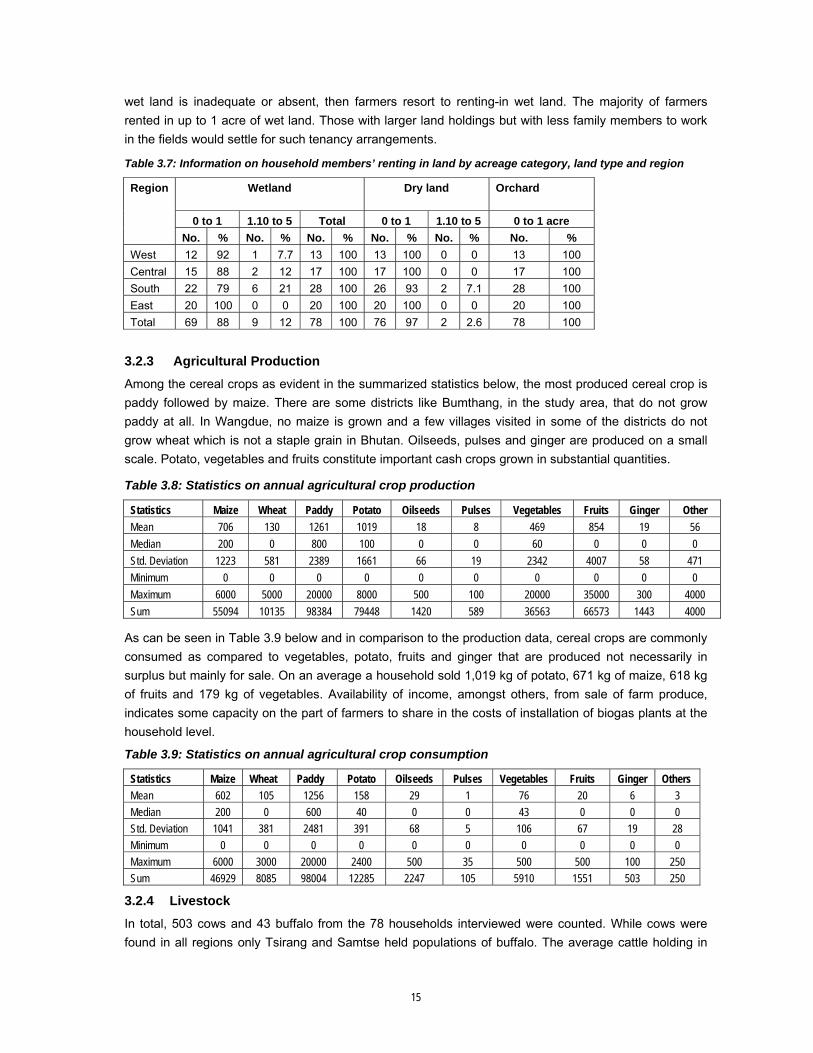
An examination of possible land tenancy arrangements in the study areas reveals that people rent-in mainly wet land. There is a high preference for rice in villages and if labour is sufficiently available and
15
wet land is inadequate or absent, then farmers resort to renting-in wet land. The majority of farmers rented in up to 1 acre of wet land. Those with larger land holdings but with less family members to work in the fields would settle for such tenancy arrangements.
Table 3.7: Information on household members’ renting in land by acreage category, land type and region
Wetland Dry land Orchard
0 to 1 1.10 to 5 Total 0 to 1 1.10 to 5 0 to 1 acre
3.2.3 Agricultural Production Among the cereal crops as evident in the summarized statistics below, the most produced cereal crop is paddy followed by maize. There are some districts like Bumthang, in the study area, that do not grow paddy at all. In Wangdue, no maize is grown and a few villages visited in some of the districts do not grow wheat which is not a staple grain in Bhutan. Oilseeds, pulses and ginger are produced on a small scale. Potato, vegetables and fruits constitute important cash crops grown in substantial quantities.
Table 3.8: Statistics on annual agricultural crop production
As can be seen in Table 3.9 below and in comparison to the production data, cereal crops are commonly consumed as compared to vegetables, potato, fruits and ginger that are produced not necessarily in surplus but mainly for sale. On an average a household sold 1,019 kg of potato, 671 kg of maize, 618 kg of fruits and 179 kg of vegetables. Availability of income, amongst others, from sale of farm produce, indicates some capacity on the part of farmers to share in the costs of installation of biogas plants at the household level.
Table 3.9: Statistics on annual agricultural crop consumption
3.2.4 Livestock In total, 503 cows and 43 buffalo from the 78 households interviewed were counted. While cows were found in all regions only Tsirang and Samtse held populations of buffalo. The average cattle holding in
16
the study area is 6 heads of cattle. This is much more than the national average of 3.71 cattle heads. High number of cattle holding in the studied households probably is because of the biases created while sampling as the clusters selected for the survey were among those where livestock raising is widely practiced. In terms of smaller livestock, 92 goats mostly reared in the southern region, 31 pigs and 1302 poultry were counted.
Before discussing whether cattle are ‘zero-grazed’ or ‘night-stabled’, it is important to know what the terms imply in Bhutan. Night-stabled cattle here are considered as those cattle that are let loose or grazed under supervision in the forests or pastures during the day and brought back for the night to be kept in cow sheds or tethered in the open fields. It is mostly in the south that cows are tethered and rotated in the fields mainly in winter once the crops are harvested for fertilization.
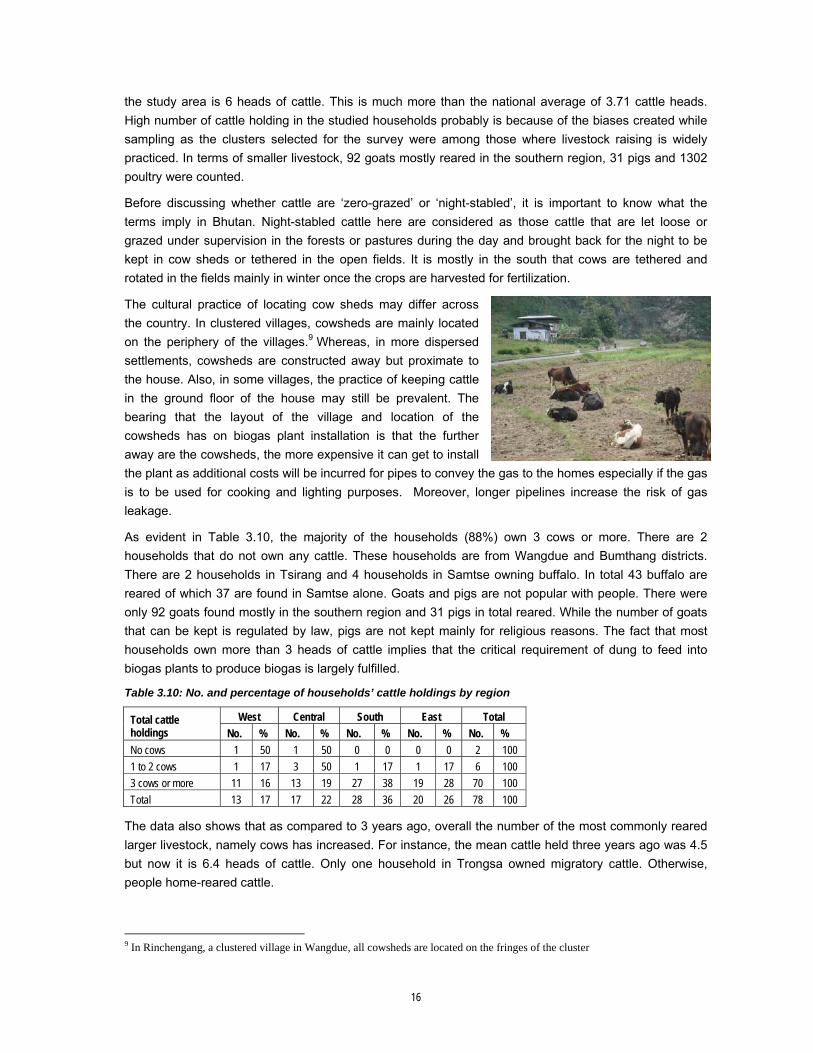
The cultural practice of locating cow sheds may differ across the country. In clustered villages, cowsheds are mainly located on the periphery of the villages.9 Whereas, in more dispersed settlements, cowsheds are constructed away but proximate to the house. Also, in some villages, the practice of keeping cattle in the ground floor of the house may still be prevalent. The bearing that the layout of the village and location of the cowsheds has on biogas plant installation is that the further away are the cowsheds, the more expensive it can get to install the plant as additional costs will be incurred for pipes to convey the gas to the homes especially if the gas is to be used for cooking and lighting purposes. Moreover, longer pipelines increase the risk of gas leakage.
As evident in Table 3.10, the majority of the households (88%) own 3 cows or more. There are 2 households that do not own any cattle. These households are from Wangdue and Bumthang districts. There are 2 households in Tsirang and 4 households in Samtse owning buffalo. In total 43 buffalo are reared of which 37 are found in Samtse alone. Goats and pigs are not popular with people. There were only 92 goats found mostly in the southern region and 31 pigs in total reared. While the number of goats that can be kept is regulated by law, pigs are not kept mainly for religious reasons. The fact that most households own more than 3 heads of cattle implies that the critical requirement of dung to feed into biogas plants to produce biogas is largely fulfilled.
Table 3.10: No. and percentage of households’ cattle holdings by region
West Central South East Total Total cattle holdings No. % No. % No. % No. % No. % No cows 1 50 1 50 0 0 0 0 2 100 1 to 2 cows 1 17 3 50 1 17 1 17 6 100 3 cows or more 11 16 13 19 27 38 19 28 70 100 Total 13 17 17 22 28 36 20 26 78 100
The data also shows that as compared to 3 years ago, overall the number of the most commonly reared larger livestock, namely cows has increased. For instance, the mean cattle held three years ago was 4.5 but now it is 6.4 heads of cattle. Only one household in Trongsa owned migratory cattle. Otherwise, people home-reared cattle.
9 In Rinchengang, a clustered village in Wangdue, all cowsheds are located on the fringes of the cluster
17
The implication of this finding on the biogas programme is that the availability of cow dung and urine which are important raw materials to be placed in the biogas plant digester is assured.
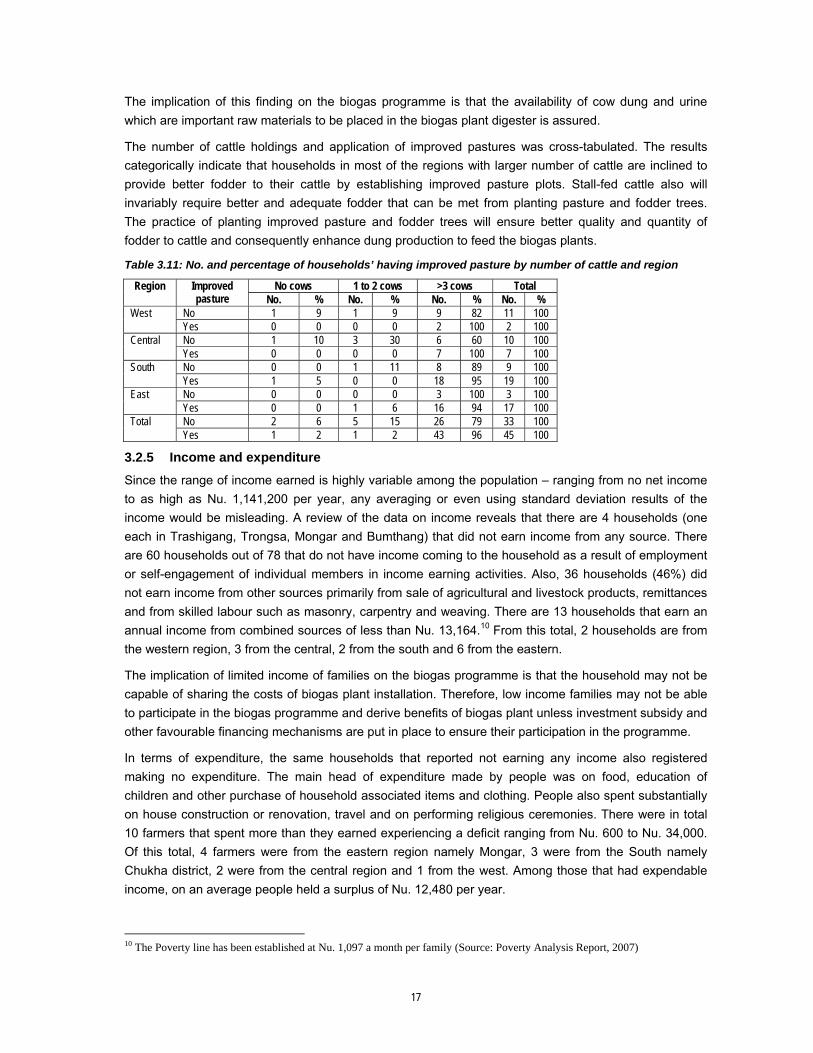
The number of cattle holdings and application of improved pastures was cross-tabulated. The results categorically indicate that households in most of the regions with larger number of cattle are inclined to provide better fodder to their cattle by establishing improved pasture plots. Stall-fed cattle also will invariably require better and adequate fodder that can be met from planting pasture and fodder trees. The practice of planting improved pasture and fodder trees will ensure better quality and quantity of fodder to cattle and consequently enhance dung production to feed the biogas plants.
Table 3.11: No. and percentage of households’ having improved pasture by number of cattle and region
No cows 1 to 2 cows >3 cows Total Region Improved pasture No. % No. % No. % No. %
No 1 9 1 9 9 82 11 100 West Yes 0 0 0 0 2 100 2 100 No 1 10 3 30 6 60 10 100 Central Yes 0 0 0 0 7 100 7 100 No 0 0 1 11 8 89 9 100 South Yes 1 5 0 0 18 95 19 100 No 0 0 0 0 3 100 3 100 East Yes 0 0 1 6 16 94 17 100 No 2 6 5 15 26 79 33 100 Total Yes 1 2 1 2 43 96 45 100
3.2.5 Income and expenditure Since the range of income earned is highly variable among the population – ranging from no net income to as high as Nu. 1,141,200 per year, any averaging or even using standard deviation results of the income would be misleading. A review of the data on income reveals that there are 4 households (one each in Trashigang, Trongsa, Mongar and Bumthang) that did not earn income from any source. There are 60 households out of 78 that do not have income coming to the household as a result of employment or self-engagement of individual members in income earning activities. Also, 36 households (46%) did not earn income from other sources primarily from sale of agricultural and livestock products, remittances and from skilled labour such as masonry, carpentry and weaving. There are 13 households that earn an annual income from combined sources of less than Nu. 13,164.10 From this total, 2 households are from the western region, 3 from the central, 2 from the south and 6 from the eastern.
The implication of limited income of families on the biogas programme is that the household may not be capable of sharing the costs of biogas plant installation. Therefore, low income families may not be able to participate in the biogas programme and derive benefits of biogas plant unless investment subsidy and other favourable financing mechanisms are put in place to ensure their participation in the programme.
In terms of expenditure, the same households that reported not earning any income also registered making no expenditure. The main head of expenditure made by people was on food, education of children and other purchase of household associated items and clothing. People also spent substantially on house construction or renovation, travel and on performing religious ceremonies. There were in total 10 farmers that spent more than they earned experiencing a deficit ranging from Nu. 600 to Nu. 34,000. Of this total, 4 farmers were from the eastern region namely Mongar, 3 were from the South namely Chukha district, 2 were from the central region and 1 from the west. Among those that had expendable income, on an average people held a surplus of Nu. 12,480 per year.
10 The Poverty line has been established at Nu. 1,097 a month per family (Source: Poverty Analysis Report, 2007)
18
The data on income, expenditure and surplus-deficit indicates the high inequity in socio-economic status that exists in the study areas visited. The implications that such a finding has on the biogas programmes is that while a uniform application of cost-sharing ratio is desirable, there is a risk that the poorest may be left out of the Programme. Such poor populations may be the ones that need biogas the most since they may not have the capacity to afford alternative types of energy like electricity and LPG gas. Such populations would overly rely on firewood having no other substitutes. Therefore, innovative financing mechanisms such as group insurance loans and arrangement of sponsors for biogas plant costs could ensure their participation. For those that have surplus income, investment in biogas plant establishment was reported not to be a problem.
3.3 Educational Status The data on education shows that 44% of the population in the study area did not attend school. Of this, 25% are below school going age so that leaves 75% that are non-literate adults of which there are more women than men. The majority that have received education or are currently going to school from the household are in the primary school category (28%). The data suggests that education attainment levels are relatively low with the elder generations having foregone education or having studied only to a certain level since the educational attainment rate is just 33% in the sample population as opposed to the national educational attainment rate of 53%. Also, there are fewer women that continue their education after the lower secondary level (Class VIII) owing to reasons such as need to assist with domestic work, care of siblings and poverty of parents.11
The implications of the findings on education and literacy for the biogas programme are that any outreach work that may be planned such as sensitization on biogas, construction, operation and maintenance of biogas components would have to consider the education level of the population and design the information and capacity building strategies accordingly not limited to more pictorial visual aids to supplement the didactic form of instruction.
Table 3.12: Information educational attainment by class level, gender and region
West Central South East Total Education in categories
The main source of energy for cooking in sampled households is firewood collected from the nearby forest. The outcome of the study revealed that 86% of the HHs collect firewood from nearby forest or their own land whereas the remaining 14% of the HHs purchase it from market/vendors. Sixty two percent of the HHs cut the whole tree and the other 38% cut twigs and dried branches from the tree. Fifty two percent out of those who cut whole tree to supply firewood, were reported to cut 2 trees in a year followed by 33% cutting 3 trees and the remaining 15% cut only one tree. In total, 105 trees are cut every year to fulfil the need of firewood for 48 houses; besides substantial quantity of twigs and braches that are cut by another 30 households. One household on an average consumes 388.2 kilograms of firewood 11 Reasons for lower school retention among girls as cited in study ‘School Enrolment & Retention Strategies in Bhutan, 2009’
19
per month for cooking and 32.1 kg for space heating. In most cases, firewood is collected from the jungle free of cost. However, the households pay certain royalty to the Department of Forestry and obtain permits to cut trees. Such royalty was reported to range from Nu.50 to 75 per tree.
The wood for local use in rural and urban areas and for institutional use is supplied from commercially managed Forest Management Units (FMU) which are under Natural Resources Development Corporation Ltd. (NRDCL) (formerly Forest Development Corporation). Supply of free firewood is controlled by the Department of Forestry (DoF) and MoA. A family in a rural electrified area is entitled to collect at the maximum 8 M3 of wood and in un-electrified area, 16 M3. Dry wood, lops and tops are also supplied at no cost in rural areas provided they are collected and transported by a person and/or using animals. Firewood in rural areas is generally harvested from forest areas in the vicinity of the settlements referred to as “local use area”. During harvesting of wood timber by NRDCL, a significant quantity of harvested wood – called lops and tops – have no commercial timber value. These lop and tops are auctioned to contractors for supply of firewood to the urban population, for government use and for institutional use.
At the household level, energy is mainly used for cooking, preparing cattle-feed, space heating and lighting. Cooking and heating are the major energy end-uses which make up 66% of the total energy consumed in the domestic sector. Here, it should be noted that in a large number of households, the same device (cook stove) is used for both cooking and space heating, making it difficult to apportion fuel use between the two end uses. Cooking feed for cattle and pigs is the second largest end use of energy in the household sector. For cooking and heating, firewood is the primary fuel in 55% of the households, while electricity is the primary energy source in 45% of the households (National Population and Housing Census, 2005). Figure 3 provides further data on proportion of rural and urban households using different types of cooking fuel. It is observed that once a household is electrified, electricity becomes the primary energy source for cooking and thus majority of the electrified households use electricity for cooking (Office of the Census Commissioner, 2006). In the 7th Five Year Plan, RGoB started promoting electricity and LPG as cleaner fuels for various applications. But LPG is still not commonly used in the rural areas due to difficult access and costs. Therefore LPG is generally used in some rural households as a secondary or tertiary source of energy.
Electricity and kerosene are used for lighting purposes in urban and rural areas respectively. An average of 3.35 litres of kerosene per household per month is consumed for lighting. The cost of kerosene in the rural areas ranges from Nu.10 to 15 per litre depending upon the accessibility – their locations from the nearest road head.
The outcome of the survey indicated that 27% of the HHs perceived that collection of cooking and lighting fuels is not a problem for them; however another 24% think it was not a problem in the past but nowadays it is becoming more and more difficult; and the remaining 49% think it is always difficult. Table 3.13 summarises the responses:
Interestingly, most of the respondents in Mongar and Bumthang perceived collection of fuel as a problem. According to the respondents in Samtse, though collection of firewood is not a problem because of the government’s policy, they are wasting trees to use as firewood which could have otherwise been sold as timber at a higher price. Households in Tsirang reported that getting permission to cut trees for supplying firewood has been made easy these days. However, they expressed their opinion that they would like to stop cutting trees to preserve the environment. Few households in Tsirang also mentioned that the introduction of Improved Cook Stove (ICS) programme has been beneficial for them in the sense that the quantity of firewood needed for cooking has gone down to nearly half once they started using ICSs.
Collection of firewood and kerosene is the task of male members in 28 households and female members in 18 households. Both men and women share the responsibility in 18 houses. Children, especially the females, are responsible to carry out this task in 9 households. Hired labours or servant perform this work in 5 households.
Table 3.14 shows the outcome of the household survey on quantity of conventional fuels sources being consumed by families:
Table 3.14: Quantity of Conventional Fuel Sources being used by HHs
As shown in Table 3.15, the average firewood consumption in electrified households is less than that in non-electrified households which indicate that electricity is also used for cooking and to a lesser extend for space heating purposes. The outcome also suggested that electricity is used less for space heating than for cooking. Table 3.15: Quantity of Firewood in Electrified and Non-electrified HHs
Type of House Average quantity of Firewood for Cooking (kg/hh/day)
Average quantity of Firewood for Space heating (kg/hh/day)
The quality of firewood being consumed in sampled households differs vastly among the districts. Households in Bumthang used the highest quantity of 28 kg/day and those in Thimphu used the lowest quantity of 5.8 kg/day. The quantity used by the households in Thimphu, Wangdue, Chukha, Samtse and Trashigang is less than the average consumption in the sampled households (15.71 kg/day) while the households in Bumthang, Mongar, Trongsa and Tsirang used more than the average quantity of firewood. The outcome indicates that the households in urban and semi urban areas also use other conventional sources of energy such as kerosene, LPG and electricity for cooking purpose. Table 3.16 illustrates the average quantity of firewood used in the sampled districts.
Table 3.16: Quantity of Firewood used in HHs by Districts
District Average quantity of Firewood Used (kg/hh/day) Bumthang 28.0 Chukha 10.0 Mongar 21.6 Samtse 11.2 Thimphu 5.8 Trashigang 13.4 Trongsa 21.0 Tsirang 19.3 Wangdue 6.2 All 15.71
The field findings also revealed that out of the 78 households under study, 12 HHs use batteries, 2 HHs use solar PV and 1 HH uses pine resin for lighting.
Introduction of biogas plant could save 70-90% of the fuel spent for cooking and about 50-60% of the kerosene used for lighting. If all the households under study install biogas plant, a substantial saving of firewood could be expected.
3.5 Cooking Pattern and Cooking Environment
The outcome of the field findings revealed that the condition of kitchen in 26 households (33.33%) was good – the surrounding was clean and the cooking place was well ventilated. However in the remaining 66.7% of the households, the condition was moderate in terms of cleanliness and ventilation. The average burning hours of conventional cook stove in the sampled households was calculated to be 3.84 hours per household per day. The maximum and minimum burning hours were reported to be 7 hours and 1.5 hours respectively. In general, conventional cook stove are burned three times a day in most of the households starting in the morning at around 5 o’clock and ends at 9 o’clock. In the afternoon, the traditional cook stoves are burned in between 11:00 AM to 3:00 PM to cook light food items. Likewise, cooking starts at about 6:00 PM in the evening and continues for 1.5 to 2 hours. The average burning hours of cook stove during morning, afternoon and evening are 1.58, 0.28 and 1.42 hours respectively. The peak hours of burning of stove, therefore, fall in the morning and evening. Figure 3.1 in the next page shows the cooking patterns in the households studied.
As shown in Figure 3.1, the cooking pattern is somewhat uniform in the sampled households as most of the households cook more or less during the same period in a day.
Cooking was reported to be the responsibility of female members in 91% of the households and male members in 6% of the households. In the remaining 3%, cooking was reported to be done by servant or maid, usually a female member.
Time Stove Starts in Morning Tme Stove Ends in Morning Time Stove Starts in NoonTime Stove Ends in Noon Time Stove Starts in Evening Time Stove Ends in Evening
3.6 Dung Production
The technical feasibility of biogas plant primarily depends upon the use of the required quantity of dung produced in the cattle shed. Based upon type of animals, grazing practices and condition of cattle sheds; an attempt has been made to calculate the quantity of dung produced in each of the household under study. Table 3.17 summarises the findings:
Table 3.17: Quantity of Cattle-dung Production Quantity of Dung Production per day No of Households None 2 Less than 20 kg 2 20 to 40 kg 3 41 to 60 kg 7 61 to 80 kg 17 81 to 100 kg 8 101 to 150 kg 13 151 to 200 kg 9 More than 200 kg 17 Total 78 Minimum - 0 kg, Maximum – 532 kg, Average – 140 kg and Standard Deviation - 111.8
Based upon field observation and information from the respondents, 2 adult zero grazed cattle or 3 adult open-grazed cattle would be sufficient to produce at least 20 kg of dung, which is minimum requirement for a household to qualify for installation of a biogas plant. The findings suggest that 95% of total households have enough cattle dung to install a domestic biogas plant. However, the dung production alone may not be the true indicator for feasibility of biogas plant unless the structure of cattle shed, especially the stable floor, is constructed in such a way that it facilitates easy collection of dung without much wastage on the ground. The field findings revealed that majority of the households (49 out of 78) have cattle shed with out proper flooring arrangements - unsuitable for collecting dung and urine to feed into the biogas plants. However, the cattle shed in the remaining 29 households were found to be good enough to facilitate effective collection of dung and urine.
23
3.7 Farming Practices Farming practice in the sampled households represents common practice of Bhutanese farmers. The main source of fertilizer for agricultural lands is organic manure from cattle dung complimented with chemical fertilisers. Dung in the form of Farm Yard Manure (FYM) is widely used in most of the crops. Seventy six out of the 78 households use cattle dung in farm as farm-yard-manure. Similarly 55 of them think that organic manure such as cattle dung is better than chemical fertilisers because of capacity of the former to preserve soil productivity for longer duration with out imposing detrimental effect to soil texture.
Use of chemical fertilizer in agricultural lands is common in the studied areas. Fifty three out of 78 respondents reported using chemical fertilisers. Farmers on an average use 110.6 kg of NPK fertilisers per year per family. Sixteen households use less than 100 kg of fertilisers per year where as 2 of them use more than 500 kg. The cost per kilogram of chemical fertilizer ranges from Nu.11 to Nu.15 depending upon availability and accessibility. Chemical fertilizers are mainly used for fruit and vegetable cultivation.
Majority of the respondents seems to have knowledge on organic farming though none of them have really practiced it. When they heard more about the usefulness of bioslurry coming out of biogas plants, all of them expressed interest to really experience benefits. Agricultural practices in the households, in general, are found to be favourable for a successful biogas programme.
3.8 Health & Sanitation The field results revealed that smoke-borne diseases such as Acute Respiratory Illnesses (ARIs), eye diseases, headache, dizziness (vertigo) and nausea are some ailments in the households under study. Eighty one percent of the respondents replied that they often encounter smoke-borne diseases where as 19% think smoke has never been a big problem. The main reason for incidence of such diseases is the smoke-filled cooking environment due to poor ventilation in the kitchen. However, the household sanitation condition in and around the households was satisfactory. Latrines were constructed in 83% of households. In the remaining households people use stream banks, forests and open spaces for defecation. There are limited prospects of attachment of toilets to biogas plants. However, biogas would be effectively beneficial in households where piggery is practiced as the pig manure could be managed properly in the biodigesters to avoid foul odour.
3.9 Social and Cultural issues The outcome of the household survey indicated negligible major social and cultural taboos associated with the use of biogas and bioslurry as well as handling of cattle dung. However, some people during informal discussions raised the issue of impurity of biogas produced with digestion of night soil from toilets. Consequently, some farmers might resist the attachment of toilets to biogas plants. There were instances where community people, especially the older people in the house, expressed reluctance to use biogas generated from night soil. Secondly, the role of women, the immediate beneficiaries of biogas, in decision making is rather limited. The male decision makers might give less priority to biogas and as a result, investment choices will be something else other than biogas plants. In the case of the
24
sampled households, these constraints are not too strong. The role of women in decision-making is also gradually improving.
3.10 Exposure to Biogas Technology The exposure of communities to biogas technology is limited. Majority (54 out of 78) of the informants consulted and interviewed expressed their ignorance on biogas technology and its immediate benefits. The main reasons for such ignorance are the lack of effective awareness program on the promotion and extension of biogas technology at grassroots level and low demand for the replacement of conventional energy sources with biogas. In most of the cases, people fear to invest in new, unknown and non-proven technologies like biogas and this phenomenon was also felt to be common in Bhutan. However, once the people were made familiar with the benefits of biogas plants during the cluster meetings, they showed keen interest in adopting the technology. The main motivating factors for installation of biogas plants could be the ease of use and enhancement in quality of life rather than as a substitute for conventional energy sources.
The outcome of the household survey indicated the following:
• 90% of the HHs are interested/willing to substitute conventional sources of fuel because they are expensive and difficult to obtain.
• 72% of the total HHs think biogas is best suited to fulfil their domestic demand for cooking fuel.
• 31% of the respondents were familiar about biogas technology where as 40% of them had never heard about it. The remaining 29% had heard a little about it but do not know anything about it. Out of the 47 households who have known about the technology, 19 of them heard about it through friends and relatives, 13 through publicity media such as television and radio, 6 through government officials, 3 through other biogas owners, one each through community leaders and technicians and the remaining 4 though more than one means.
• 52 out of the 78 respondents expressed their view that they did not know that the bioslurry coming out of biogas plant has better fertiliser value.
DoL and DoE/RED have constructed four demonstration biogas plants in Thimphu (2 plants), Paro and Samtse with the aim to assess the applicability of the technology in Bhutanese context. During the field investigation phases, the study team visited three plants in Paro, Thimphu and Samtse. The initial findings are encouraging though there are some minor technical problems associated with construction and operation.
Table 3.18 summarises the responses from the users on their knowledge and level of understanding on biogas technology and its benefits:
25
Table 3.18: Knowledge on Biogas Technology
District Do not know Have heard a little Have some knowledge Total HHs Bumthang 7 1 8 Chukha 1 5 2 8 Mongar 5 3 2 10 Samtse 2 3 5 10 Thimphu 3 4 7 Trashigang 2 4 4 10 Trongsa 5 2 2 9 Tsirang 2 5 3 10 Wangdue 4 1 1 6
Total 31 23 24 78
The level of knowledge on biogas technology was relatively better in Samtse, Thimphu and Trashigang whereas people in Bumthang, Mongar and Trongsa had limited knowledge on it. This information indicates the necessity of effective awareness raising initiative as one of the main components of a national biogas programme.
3.11 Willingness and Affordability
When asked whether they would like to switch to other renewable energy sources, 90% of the users replied affirmatively. Six percent of the respondents are of the view that there are no major problems with the use of conventional fuel sources. However, they would be happy to adopt new technology if government provides incentives and support services. The remaining 4% expressed that currently they could not decide. Out of the respondents who expressed their willingness to switch to new and renewable technology, 80% (56 households) expressed that they would like to install biogas plants to fulfil the need for cooking fuels. Table 3.19 summarises the responses on willingness of people to adopt new and renewable sources of energy. It is encouraging to note that 100% of the respondents from Mongar, Samtse, Thimphu, Trongsa and Tsirang expressed their willingness to find replacement for the conventional fuel sources. The response from Wangdue was discouraging owing possibly to wide use of electricity for lighting and cooking, relatively good access to firewood and lack of land near the houses for installing the biogas plants.
Table 3.19: Response on Willingness to switch to RET
District No Yes Can not say Total HHs Bumthang 1 7 8 Chukha 1 7 8 Mongar 10 10 Samtse 10 10 Thimphu 7 7 Trashigang 1 9 10 Trongsa 9 9 Tsirang 10 10 Wangdue 2 1 3 6 Grand Total 5 70 3 78
The study team made genuine efforts to make participants familiar on various aspects of biogas technology including the cost of installation as well as operation and maintenance prior to asking them whether the cost of a family sized biogas plants ranging from Nu.25,000 to Nu.40,000 is affordable. Table 3.20 summarises the responses from the respondents:
26
Table-3.20: Perception of the Households on the cost of a Biogas Plant
Response No. of HHs % It is cheap - I can afford 1 1.3 It is cheap – but I can not afford 1 1.3 It is reasonable, I can afford 35 44.9 It is reasonable, but I can not afford 6 7.7 It is quite expensive, but I can afford 18 23.1 It is quite expensive, I can not afford 4 5.1 It is very expensive, I can not afford 3 3.8 Can not say now 10 12.8 Total 78 100
As shown in the Table 3.20, biogas plant is perceived as an expensive undertaking by 25 households whereas 2 of them think it is cheap. Ten respondents were unable to comment on the cost of installation. The remaining 41 respondents were of the view that the cost is reasonable. Out of the 14 households who think the investment cost will be inhibiting factor for them to install biogas plant, 12 of them expressed that they will install biogas plant if more than 40% subsidy is provided by the government. One of them thinks biogas plant is cumbersome to operate and the remaining 1 respondent believes that the family does not have enough capital to invest. Sixty two percent of the HHs feel that they have enough saving per year to invest in biogas plant.
3.12 Practice of Taking Loan
The outcome of the field investigation revealed that taking a loan or credit for agricultural activities is not a common practice in Bhutan at the household level although 50% of the respondents said that they have taken loan at least once to overcome a financial difficulty. Out of those who have taken loan, very few persons (8%) were reported to have obtained it more than once. Out of the 38 respondents who acquired loan, 36 reported that they received it from banks and MFIs and 2 borrowed from the local cooperatives. The remaining 1 household obtained loan from a local money lender. The interest rates ranged from 12 to 14% for those who received loans from banks, MFIs and local cooperatives. However, the interest rate was reported to be double (24%) in the case of loan from local money lender. Most borrowers (30 out of 38) stated that they repaid the loan on time. The remaining households have paid only part of the loan.
Fifty percent of the respondents have never taken loans. The reasons for not taking loan were reported to be: good financial condition; perception that loan degrades social prestige; higher interest rates; cumbersome process to obtain loans; lack of collateral asked by the financing institute; and no need felt.
When asked if they need loan to install biogas plants, more than half replied affirmatively. The anticipated interest rates on biogas loan were reported to be in between 6 to 12% per annum. Seventy seven percent of the respondents believe that biogas plant will result in substantial financial saving which could be used to repay the loan on time; whereas 19% assume biogas will not help in financial saving considerably. The remaining 4% claimed that they are not in a position to give their opinion whether biogas plant generates financial saving or not.
3.13 Appropriate Biogas Design and Sizes
As stated in Chapter 3.5, the actual burning hours of cook stoves in the households under study ranges from 1.5 to 7 hours, with the mean average at 3.84 hours. Assuming that the installation of a biogas plant would result in saving of at least 25% of the total time incurred while cooking with firewood, the average time of cooking will reduce to 2.88 hours after installation of biogas plant. Likewise, the maximum cooking hour will also drop down to 5.25 hours. To fulfil this demand for cooking as well as some additional needs
27
for lighting, biogas plants of size ranging from 4 to 10 cum are sufficient. If fed properly with the required quantity of quality feeding, 30 to 40 kg of cattle dung mixed with equal volume of water to maintain the designed hydraulic retention time, preferably 50 to 60 days for Bhutanese context, a 4 cum plant will yield enough gas to burn a single burner stove for at least 4 hours. A biogas plant of 10 cum capacity will yield more than double of what a 4 cum plant produces.
The following factors have to be considered while selecting a particular design of biogas plant for mass dissemination under the framework of a national biogas programme:
a. Climatic and geo-physical parameters • Ambient temperature • Geo-physical conditions of the soil and potential vulnerability such as landslide, earthquake etc. • Condition of ground water-table
b. Technological Parameters • Structural strength against different load conditions (structural durability) • Methods of construction/supervision; operation and maintenance • Time and effort in quality control • Applicability/adoptability of the design in different geographical context for mass dissemination • Prospects for sharing of technical information and know-how
c. Affordability for potential farmers to install biogas plant • Availability of construction materials and skilled and unskilled labours at the local level • Cost of installation, operation and maintenance • Transportation facilities
d. Purpose of the use of the products from biogas plant • Use of gas for cooking, lighting and/or operating a dual-fuel engine • Use of slurry as organic fertiliser
e. Performance of existing models, if any, in the local and/or regional conditions • Existing physical status and functioning • User's level of satisfaction
f. Quality and quantity of available feeding materials • Type of feeding materials (cattle dung, pig manure, human excreta etc.) • Availability of water for mixing • No. of cattle/pig per household
Keeping in view the above mentioned factors, the Gobar Gas Company (GGC) model being disseminated under the Biogas Programme in Nepal and modified to suit the country contexts of Laos, Pakistan, Indonesia, Ethiopia and Rwanda turns out to be the most suitable plant for mass dissemination in Bhutan. The suitability of this design for both brick and stone masonry works in hilly regions of Bhutan where stones are cheaper than bricks; simplicity in construction; higher resistance of gas holder against ground tremors; easy access for cleaning and maintenance of digester and gas holder; higher level of user's satisfaction; and proven track record of successful functioning in different countries under SNV’s biogas programme as mentioned above make this model more suitable than others. Weaknesses of this plants such as labour intensive construction of gas holder, relatively less suitability of the model in areas with high water table (because of flat bottom), and more time and efforts needed in quality control will not weigh much in the Bhutanese context. Moreover, this design has already been piloted in Bhutan with satisfactory performance. Keeping in view the cooking pattern in Bhutan, this model could serve best as
28
the storage capacity of the gas holder is 60% of the daily gas production. The drawing of modified GGC design is given in Figure-3.2.
Figure 3.2: Drawing of Modified GGC Design Biogas Plant
3.14 Availability of Construction Materials, Appliances and Skilled Labour The study team during the field investigation process, collected information on availability of and accessibility to various construction materials such as cement, sand, brick/stones, aggregates, MS rods, acrylic emulsion paint, pipes, fittings and different appliances in the study areas with a view to calculate the real cost of installation of biogas plants. It was reported that good quality bricks have to be transported from the south, even from India making it expensive in hilly areas. Stones are available in most part of Bhutan. Construction of a biogas plant with stone masonry is cheaper than that with brick masonry. Good quality sand is a problem in villages that are situated far from the rivers and up in the hills. Like bricks, cement is also transported from the south so the price varies proportionately to the distance of district from the towns in the south. Pipes and fittings are available in the hardware stores in the district headquarters and small townships. Biogas stoves and other appliances have to be imported initially either from India or Nepal or Bangladesh but could possibly be manufactured in-country if manufacturers are adequately trained.
Given the availability of and accessibility to stones (boulders) quarry sites in all over the country, the cost of construction of biogas plant with stone masonry is cheaper than that with brick masonry. Bricks are very expensive in most parts of the country. Table-3.21 shows the costs of different sized biogas plants in five different locations in the country.
29
Table 3.21: Cost of Installation of Biogas Plant in US$ Cost in Tsirang Cost in Wangdue Cost in Bumthang Cost in Thimphu Cost in Phuntsholing Plant
Presently, because of the construction boom in the country especially in the hydropower sector, quite a lot of skilled people are engaged in this sector. However, there are village level artisans available in the community who are engaged in small construction works such as building of houses. These artisans could be trained to involve in biogas plant construction. There are also contractors that have skilled and/or semi-skilled masons who could be trained to build biogas plants.
30
4. Feasibility of Biogas Plants 4.1 Benefits of a Biogas Plant Domestic biogas plants contribute to sustainable development and help in fulfilling the UN Millennium Development Goals12. The benefits of biogas in energy supply, agriculture, health, sanitation, gender and environment are well documented. Various aspects of biogas production have multiple benefits:
Animal dung (and night soil where culturally acceptable) is collected regularly and fed into the biogas plant, this: o reduces pollution: leading to a cleaner farm environment;
o reduces human and animal disease: by improving sanitary conditions related to bad sanitation and polluted surface water for the household, and;
o reduces greenhouse gas emissions: depending on traditional manure handling, the improved manure management system can significantly reduce GHG emissions.
The generated gas substitutes conventional fuels. In doing so, biogas: o reduces indoor air pollution: the incomplete combustion of conventional biomass fuels is minimized,
resulting in a reduction of eye and respiratory illnesses particularly of those most heavily exposed to smoke namely women and children;
o reduces workload: especially in regard to fetching firewood, maintaining the fire and cleaning cooking pots. The use of biogas can reduce workload by 2 to 3 hours per day, particularly the workload of women and children;
o reduces fuel expenses: traditional domestic fuels are increasingly becoming part of the formal economy. Biogas significantly decreases consumption of these traditional fuels;
o increases benefits of better lighting and hot water through the use of appliances such as gas lamps and water heaters;
o reduces greenhouse gas emissions emitted by conventional energy sources;
o reduces deforestation: by reducing the demand for firewood;
o provides income generation opportunities: by providing an energy source for different economic activities (incubators, kilns, lanterns etc) as a new or more efficient resource.
o allows for the time saved, from not having to collect firewood and faster cooking, to be used in on- and off-farm income generating activities.
The residue of the process - bioslurry, is a potent organic fertilizer. When used in this way it can: o provide a superior organic fertilizer: in terms of available nutrients and soil texture, increasing
agricultural yields by 20-40%.
o provide a catalyser for composting other agricultural waste: Applying this practice increases the amount and quality of organic fertilizer;
o improve handling safety: of residue due to the fact that the process of digestion followed by composting makes handling of the residue much safer from a hygienic point of view;
o reduce chemical fertilizer costs of farmers: by reducing the amount of synthetic fertilizer used;
o reduce greenhouse gas emissions through avoiding the application of synthetic fertiliser
o enables farmers to participate in animal husbandry in areas in which discharge regulations would 12 Please refer to Paragraphs 4.3.1 for an overview of the contribution of biogas on reaching the UN Millennium Development Goals.
31
Biogas Practice AreaBiogas Practice AreaBiogas Practice AreaImpact areas of domestic biogas
ENERGY
AG
RIC
ULT
UR
E
ENV
IRO
NM
ENT
FAMILY HEALTH
& SANITATION
EMPLOYMENT
otherwise have been prohibitive: anaerobic digestion reduces odour and environmental load resulting from livestock holding.
The main five impact areas as shown in Figure 4.1 provide a reasonable picture of the potential reach of a biogas programme. However, the precise nature of these benefits will depend on the situation, whereby they can be further distinguished into formal and informal benefits acting at micro and macro level as summarised in Table 4.1.
The viability of biogas plant depends heavily on the likely opportunities to achieve these impacts. As shown in the tangibility table below, biogas benefits, although not all equally tangible, do not only profit the investor, but have an impact on the community at meso and macro levels as well.
Table 4.1: Benefits of a Biogas Plant
The unique selling point, in other words the real motivating factor to install biogas plant, varies from one context to the other. For example, in farming communities nutrient rich bioslurry will motivate farmers, where as households with higher incidence of smoke-borne diseases will install biogas plant if they are aware of health benefits. The multiple benefits of biogas plant as described above should carefully be selected based upon their importance in a particular situation to motivate potential farmers.
4.2 Effective Potential Effective potential of biogas plants has been calculated based upon the primary as well as secondary data and information collected during the course of study on various technical, economic, social and institutional factors as given in Figure 4.2. Among these parameters, some are inhibiting factors, some others are factors that could be mitigated or minimised if special attention is paid during the programme implementation phase. Therefore, those factors which could be dealt in the later stages are not
MICRO MESO MACRO
INFO
RM
AL
• Reduced indoor smoke-induced illnesses.
• Reduced poor-sanitation induced illnesses.
• Reduced drudgery from fuelwood collection.
• Reduced pressure for illegal forest encroachment.
• Reduction drudgery from weeding fields. • Reduced workload for food-preparation. • Reduced soil degradation. • Improved opportunity for education.
• Reduced risk of erosion and landslides in mountainous areas.
• Improved forest quality and quantity. • Reduced pollution of surface water. • Reduced pollution of the environment as
considered as inhibiting factor and they are left out while calculating the effective potential. For example, access to technology, availability of technical manpower, and most of the institutional factors are not considered to be limiting factors.
Figure 4.2: Factors Affecting Effective Potential of Biogas Plants
Technical factors
No. of cattle (buffalo and cows in particular) Total dung production Feed stock available (Total dung production minus wastage) Access to water sources Geographical location Access to technology Availability of technical manpower Availability and accessibility of construction materials
Financial factors
Cost of construction (material and labour costs) and O&M Land holding and agricultural practices Household income sources (agricultural and off-farm activities) Capacity to pay (affordability) Access to financing (credit and subsidy) Cost of substitutes (firewood, kerosene, charcoal, electricity etc.) Cost of fertilizers Opportunity for employment/wage labouring Valuation of time saving Cost-benefit analysis
Social factors
Social and cultural constraints Performance of existing plants Goodwill of actors/stakeholders Willingness to install biogas plants Acceptance of the technology Knowledge on non-financial costs and benefits of biogas Level of awareness on environment, health and sanitation Willingness to enhance quality of life Exposure to RETs Role of women in decision-making Migration patterns
Institutional factors
Absorptive capacity and institutional set-up of different stakeholders Trustworthiness of stakeholders Institutional responses Government policy on RET and use of energy Sector co-ordination
Effective Potential of Biogas Plants
33
Besides saving on the costs of competing fuels like firewood and kerosene, biogas has many other positive impacts. The farmers in the studied districts are not able to value these effects in terms of cost/benefits and therefore they are not part of the economic potential. They will however, increase or decrease the social potential.
Potential non-financial benefits of biogas are: reduction of smoke-borne diseases and improved hygiene due to less smoke in the kitchen and attachment of the latrine to the biogas plant; improved agricultural production due to use of the slurry coming out of biogas plant after the digestion process; decrease in workload, especially that of women, due to the quick cooking and quick cleaning of cooking vessels; improvement in the quality of life and extra earnings from the time saved at the household level. Environmental protection due to saving of forest, reduction in green house gases, technological advancement and savings from the reduced import of fossil fuels from other countries are benefits at the national/macro level.
Increased workload to feed the plant, shifting from outside grazing of animals to stall feeding, more consumption of water to dilute the fresh dung before feeding into the plant, and less warmth in the kitchen due to absence of firewood burning are some potential non-financial costs associated with installation of biogas plants.
Unless farmers are educated on these financial and non-financial costs of a biogas plant, social viability of biogas technology cannot be assessed realistically. Farmers visited during the field investigation were not fully aware of these facts. Therefore, effective awareness programmes are necessary to ensure social feasibility of biogas technology in the selected districts.
Keeping in view these parameters as shown in Figures 4.2 and 4.3, effective potential of biogas plants in Bhutan was calculated in different stages. In the initial stage of the assessment to calculate effective potential of biogas plant, households with cattle were calculated based upon the national livestock data supplied from Department of Livestock. From the list of the households with cattle, those households having less than 20 kilogramme of dung production per day (2 zero-grazed adult cattle or 3 open-grazed adult cattle) were omitted. Based upon information available from secondary sources, households located above 2000 meters from AMSL were also excluded. In the final stage, factors have been assumed for water availability, financial parameters such as affordability, access to finance etc (based upon data on poverty).
Table 4.2 in the next page shows the effective feasibility of biogas plants in Bhutan disaggregated district-wise.
The summary of the exercise on assessing effective potential of biogas plant in different districts of Bhutan is given below:
Out of the 87,576 household across the country, 68,576 households (78%) possess at least one head of cattle.
Out of the 68,576 households that possess at least one head of cattle, 50,115 households (73%) produce enough cattle-dung to meet the requirement of a small family size biogas plant. In other words, 57% of the total households in Bhutan have enough feeding materials to install a biogas plant.
Out of the 50,115 households that have enough cattle dung to feed into the biogas plants, 24,606 households (49%) are technically feasible keeping in view other technical factors such as temperature and water availability. In total, 28% of the households in Bhutan are technically feasible for installing biogas plant.
Out of 24,606 households who are technically feasible, 16,879 households are expected to qualify as socio-economically feasible to install biogas plants keeping in view the farming practices, use and availability of conventional fuel sources and poverty level. Hence the effective potential of the country in terms of having favourable condition to install biogas plant is 16,879 households which is 68% of the total technical potential.
In conclusion, 19% of the total households in Bhutan have all the conditions favourable to install biogas plants.
The outcome of the study on calculation of effective potential of biogas plants in Bhutan has been summarised in Figure 4.4 below:
Figure 4.4: Effective Potential of Biogas Plants
4.3 Prospects/ Opportunities for a Successful Biogas Programme in Bhutan
4.3.1 Close Linkage with Millennium Development Goals (MDGs) The United Kingdom’s Department for International Development (DFID) acknowledges that energy plays a crucial role in underpinning efforts to achieve the MDGs. I: “Lack of access to adequate, affordable, reliable, safe and environmentally benign energy is a severe constraint on development”. At the World Summit on Sustainable Development in Johannesburg, it was acknowledged that the vicious cycle of energy poverty needs to be broken in order to achieve MDGs for reducing world poverty. A lack of access to clean and affordable energy should be considered a core dimension of poverty. Of the eight Millennium Development goals, seven have a very direct relation with biogas technology and this could be one of the opportunities in the case of Bhutan too.
Out of 68,576 hhs having cattle, more than 20 kg cattle dung is available in
50,115 households
Sufficient dung, suitable temperature, sufficient water is available in 24,606 household
Sufficient dung, suitable temperature, sufficient water, favourable economic and financial conditions prevails in 18,160 households
Effective potential of Biogas Plants: 16,879
Sufficient dung, suitable temperature, sufficient water, favourable economic and financial conditions, appropriate conditions in terms of farming practices and access to energy sources in prevails in 16,879 households
36
MDG 1: Eradicate extreme poverty and hunger
Access to energy services facilitates economic development – micro enterprise, livelihood activities beyond daylight hours, local businesses that create employment - and assists in bridging the “digital divide”. Construction and installation of biogas plants on a large scale in Bhutan may create employment for landless rural people and reduce under-employment. Biogas being a small scale, affordable Renewable Energy Technology helps in reducing the vulnerability of the poor by minimising their reliance on natural resources, labour and environment. Likewise, the aim of halving the proportion of people suffering from hunger can be supported by energy services that can improve access to pumped drinking / irrigation water. Most staple foods require energy for cooking before they can be eaten. Domestic biogas can entirely replace the need for firewood used for cooking, especially in seriously degraded areas. Moreover, proper use of digested slurry as bio-fertiliser significantly increases crop production and counters soil degradation due to excessive use of chemical fertilisers.
MDG 2: Primary education for children
Biogas lights in non-electrified houses contribute to a better studying environment for the children. Moreover liberation from the compulsion to spend time to collect and transport conventional fuel sources will help in better enrolment in school.
MDG 3: Promote gender equality and empower women
Installation of biogas helps in achieving the target of eliminating gender disparity. Women and girls predominantly take the burden of providing traditional energy services, spending time and energy that could better be used for education. Modern energy services - directly and indirectly- significantly reduce this workload, thus facilitating time for education. Furthermore, modern energy services further improve (rural) access to media. Illumination of houses and schools helps in lowering barriers for women and girls to education and information. Domestic biogas reduces the workload between 1 to 3 hours per day. Likewise, biogas illumination helps positively in executing household works as well as study.
MDG 4: Reduce child mortality
Target to reduce by two-thirds the under-five mortality rate has a relationship with biogas. Studies have shown, indoor air pollution from burning of solid fuels kills over 1.6 million people each year, out of which indoor smoke claims nearly one million children’s (<5) lives per year. Diseases that result from a lack of basic sanitation and consequential water contamination, cause an even greater death toll, particularly small children (under 5 mortality caused by diarrhoea is approximately 1.5 million persons per year). Domestic biogas substitutes conventional cook stoves and energy sources, virtually eliminating indoor smoke pollution and, hence, related health risks. It also significantly improves the sanitary condition of farm yard and its immediate surrounding, lowering the exposure of household members to harmful infections. Additionally, increased use of bioslurry helps in enhancing agricultural production which ensures food security.
MDG 5: Improve Maternal Health
Biogas plants helps in achieving MGD 5 through the reduction of labour and ensuring better hygiene conditions in the house as it eliminates smoke-borne diseases.
MDG 6: Combat HIV/AIDS, malaria and other diseases.
Installation of biogas helps in eliminating indoor air pollution and poor sanitary conditions that cause millions of premature deaths each year. Moreover, energy is a key component of a functioning health
37
system (lighting of clinics, refrigeration of vaccines and medicines, sterilization of equipment). Energy is required to provide safe water and food. Domestic biogas virtually eliminate health risks 13 associated with indoor air pollution and helps in enhancing sanitation condition in and around the household premises to reduces risk of illness.
MDG 7: Ensure environmental sustainability
Improved energy efficiency and use of cleaner alternatives can help to achieve sustainable use of natural resources, as well as reducing emissions, which protects the local and global environment. Domestic biogas reduces the pressure on forests for firewood. It also reduces solid waste and nutrient loading of fresh water systems. Installation of biogas plants significantly reduce greenhouse gas emissions and air pollution in general. Moreover, application of bio-slurry increases soil structure and fertility, and renders application of chemical fertilizer often superfluous. Particularly larger biogas dissemination programmes have a considerable governance component. As such, they positively influence national policies on sustainable development (e.g. agriculture, forestation, health). Biogas systems also reduce fresh water pollution as a result of solid waste and nutrient discharge.
4.3.2 Prospects for Carbon Revenue (CERs/VERs) In the last several years, climate change and carbon finance have gained importance on the agenda of governments in Asia, increasing their awareness of the related issues and opportunities. Domestic biogas installations can reduce greenhouse gas (GHG) emissions in three ways: by changing the manure management modality; by substituting fossil fuels and non-renewable biomass for cooking (and to a smaller extent for lighting) with biogas, and; by substituting chemical fertilizer with bio-slurry. The actual reduction of greenhouse gas emissions by domestic biogas installations depends on the local situation, the size of the installation and the way the installation is operated, whereas the “claimable” GHG emission reduction depends on the used methodology. Emission reduction units, measured in tons CO2 equivalents, can be traded on the formal CDM market or the voluntary market. For both markets methodologies applicable for domestic biogas are available. Bhutan can also benefit from carbon revenues that will be generated from the installation of biogas plants. Government is keen to promote clean energy technologies with the view of worsening global climate change and protecting environment. Bhutan has already initiated carbon fund projects and believes that biogas can be another good carbon project in the future. A family size biogas plant helps in saving 2 to 4 tons of CO2 equivalents depending upon baseline conditions. This saving can be sold in carbon market.
4.3.3 Internal factors o The potential of full integration of biogas in the present household structures and farming practice
is identified as one of the main prospects to further dissemination of biogas in Bhutan. The overwhelming willingness of the households to install biogas plants to replace conventional source of energy, despite their low level of awareness, is instrumental for the success of a biogas programme.
o Bhutan’s rural population depends mainly on firewood as source of cooking energy. The outcome of the field study has indicated that firewood collection from the forests is difficult since people are not allowed to cut trees in the national forests unless they get permission from the authority. Community Forest Management Groups allow its members to collect dead trees and twigs only, which is more time consuming and difficult. Furthermore, government aims to protect the natural forests with the access to alternative sources of energy to the households. As depletion will
13 Respiratory diseases, eye ailment, burning accidents etc.
38
continue in days to come, accessibility to forest resource will increasingly become difficult and people will switch to other forms of energy such as biogas to fulfil their energy need. LPG is another source of cooking energy. However; it is becoming expensive these days and could be unsustainable.
o A high percentage of rural households own livestock. Government is planning to develop a programme promoting sedentary cattle in cowsheds rather than allowing them free grazing in the fields which will help to collect more dung and promote biogas technology.
o Within the region affordable technology and programme modalities are available. With some minor modifications and adjustments, this technology and implementation modality can be introduced in Bhutan.
o DoA and DoE/RED have shown their genuine interest and commitments to be involved in biogas sector. They are convinced that the technology works well in the country context. This is a huge added value to initiate a national biogas programme.
4.4 Constraints
The primary as well as secondary data and information collected in the course of the market study have reveals that there are some constraints for successful implementation of a biogas programme. However, these constraints are not inhibiting factors; rather they provide impetus for formulating realistic and effective measures to overcome such limitations during the course of biogas programme implementation. These constraints are highlighted with potential solutions to overcome them. o The low level of knowledge and awareness of people on biogas technology and its benefits, as
well as lack of knowledge on other RETs, are a major constrain to disseminate biogas. Promotion through production shall be the main vehicle to create awareness in rural areas. Additionally a nation wide awareness campaign should be initiated.
o The abundance of forest and cheap electricity is a limiting factor for dissemination of biogas. However, biogas as replacement for firewood is merely one of the considerations for farmers to consider biogas. Other important considerations for adopting biogas are: convenience, improvements in health and sanitation, enhanced productivity of land with the use of bioslurry, etc. and as a consequence promotion should focus on the improvement of quality of living conditions. Moreover, the access to forest for firewood is becoming difficult day by day.
o Lack of qualified masons and other technical staff for the construction of biogas plants. Technical staff can sufficiently be trained through the establishment of training programmes. Technical and vocational polytechnics can be instrumental in this process.
o Absence of private sector for marketing and construction of biogas. Government should create favourable conditions to engage the private sector in the dissemination of biogas to rural households. Private sector will foster if they see opportunity to make profits.
o Absence of credit facilities / subsidy policy for biogas and renewable energy in general. No financial policy is formulated to guide Banks to make credit available to farmers. Formulation of a national financing (credit/subsidy) policy for Biogas, in particular, and RE in general and implementation modalities should be in place.
o DOA and DOE has limited experience with large-scale dissemination of biogas. Effective capacity building and strengthening through External Technical and Financial Assistance is needed.
o The farmers at the bottom of the socio-economic pyramid may not be able to afford high investment cost of the existing biogas technology. Introduction of ‘new’ and appropriate biogas
39
technology; introduction of pro-poor subsidy and credit facilities; construction through private sector make biogas plant affordable and competitive.
o Not all people wholeheartedly have accepted biogas. There were some who felt that their adoption of biogas technology will depend on their observed success/failure of biogas plants. As Biogas is a new and unfamiliar technology for them, some farmers, especially the farmers with limited income/surplus, have shown hesitation to install biogas plants. It is natural that when a new technology is introduced population at the middle or top level of socio-economic pyramid will adopt it. The programme should harness the ‘low-hanging fruits’ in the beginning and in the mean time formulate strategy to penetrate the lower part of the pyramid. To ensure effective functioning of the installed biogas plants, strict quality control mechanisms should be formulated and implemented. The programme should never forget that ‘satisfied users are the best promoters of biogas technology and vice versa’.
o Many villages are being electrified and there is a drive from the government to accelerate rural electrification in Tenth Five Year Plan. Already, 60% of Bhutan’s population has access to electricity. In the villages visited during the survey, it was found that electricity has a prominent position in the household in being the prime source for lighting. Even for cooking, some villagers depend on electricity or use it in conjunction with either firewood or LPG. With the availability of electricity, there is a need to ensure viability of biogas for cooking and lighting. Electricity can be a solution given the rapid pace of electrification in the country, but it is difficult to reach every rural household with grid connections because of rugged terrain and isolation of households. Cooking fully with electricity is also not common practice in Bhutan and households still need other sources of energy for cooking besides electricity. With the realisation of benefit of biogas plant, people may be motivated to use biogas for cooking instead of electricity given its negligible production cost. A biogas plant will fetch benefits for more than 20 years once it is installed.
o Many villages were noted to have switched to electricity and LPG for their lighting and cooking needs. However, for preparation of cattle feed, a lot of firewood is still being used. Keeping in view the experience from other programmes, biogas stoves may not be suitable for cooking cattle feed which needs bigger pots. Biogas stoves with larger burner and bigger frame could be manufactured if there is high need to use biogas for cooking cattle feed. This issue should be considered as a topic for further research and development under the framework of national biogas programme.
o Financing of biogas plants by the farmers is an important but rather complicated issue. People in rural Bhutan have limited cash holdings and limited opportunities for cash generation as well. The further away from the road a community is located, the less chances it has to enter the market economy. Therefore, funding a biogas plant, even if subsidized, could be challenging for many farmers. Credit is an option, but the experience is that rural credit dispensed by the Bhutan Development Finance Corporation, is not farmer-friendly as procedures are lengthy and collateral is required to avail a loan. This may limit the popularity of biogas technology. Using a mechanism such as that provided for the Thimphu Peri-urban Dairy Group, wherein farmers were given loans through the project to buy improved breed of cows at 7% per annum (which is less than the BDFC interest rate @ 12-13% per annum) and then farmers repaid the loans to the project. The money was then revolved to others who needed it.
40
5. FINANCIAL AND ECONOMIC ANALYSIS 5.1 Cost and Benefit of Biogas Plants
There are two major categories of a biodigesters costs: construction (installation) cost; and operation and maintenance cost. The construction costs include everything that is necessary for the installation of the biodigester e.g.: excavation work, construction of the plant structures including the cost of construction materials, pipes and appliances. The construction costs and bill of quantities for the different sizes of the Modified GGC model biogas plant are given in Annex-5.
The cost of a smallest family size biogas plant is calculated to be Nu.24,448.00 and that for a 10 cum plant is 36,662.00 including overhead and warranty fees. The operation and maintenance costs consist of wages and material costs for: collection and transportation of feeding materials, supplying of water, feeding and operation of the plant as well as the incidental maintenance and repair of the plant. Experiences have shown that the operation cost of any biogas plant does not exceed more than 4% of the installation cost per year. This cost is virtually negligible if feeding materials are not needed to be purchased or transported from a distant source. Likewise, maintenance cost is usually about 2% of the cost of installation.
5.2 Financial Analysis
Financial analysis is the most commonly used tool that helps to decide whether a user benefits from installation of a biogas plant and, if so, by how much. The underlying assumption of financial analysis is that people will adopt a new technology only if they expect to have a positive impact in their financial situation. In financial analysis for biogas plants in the present case, all costs and benefits are valued based upon data and information from the household survey as well as market study on cost of construction materials.
Benefits and costs of biogas plant will vary depending upon the use of inputs and outputs by the particular user. For the present purpose rather than analysis of the costs and benefits at the individual user’s level, average values as calculated based upon the outcome of field investigation have been used.
The financial analysis of different sized biogas plant under study has been done with the following major assumptions:
• Though a biogas plant lasts for more than 30 years depending on quality of construction materials and workmanship, the economic life span of biogas plant has been taken as 10 years mainly because any cost and benefit accrued after 10 years will have insignificant value when discounted to the present worth. Also the planning horizon of a farmer is unlikely to go beyond 10 years.
• Cost of construction of biogas plant is based upon (i) the responses from the farmers under study on the costs of various construction materials, as well as (ii) data and information collected from markets – suppliers/hardware shop-owners; and different costs are summed up to calculate the average cost per plant.
• Operation and maintenance cost has been taken as 4% and 2% respectively of the cost of installation which is based upon experiences from biogas programmes in Nepal, Cambodia and Vietnam.
• Annual income from biogas plant includes saving on conventional fuel sources and saving on chemical fertilizer because of the use of bio-slurry. The relationships between the quantity of gas
41
produced, the quantity of conventional fuels saved and the value of such savings were based on the following assumptions:
o 0.040 m3 of gas was produced per kg of fresh dung o 1 m3 of gas will be equivalent to 5.5 kgs of firewood given the quality of firewood used in
Bhutan o The cost of firewood is the average of all the cost as answered by the respondents which is
Nu.1.25 per kilogramme. o The cost of kerosene is the actual cost paid by the users at the retail market which is Nu.10
per litre. o It is assumed that biogas plant will save 75% of the firewood being used for cooking and 50%
of the kerosene being used for lighting. o Saving of chemical fertilizer because of the use of slurry is calculated to be 55.3 kg per
household per year which is equivalent to Nu 608.3 (@ Nu.11 per kg). It is assumed that bioslurry from biogas plant will help in reducing at least 50% of the chemical fertiliser being used.
o The salvage value of biogas plant was not included in the benefit stream of financial analysis because after 10 years of operation, the plant or its parts will not be re-saleable.
• The saving of time because of the installation of biogas plant was not considered to calculate FIRR as no evidence was found to justify that time is used in other income generating activities. Moreover, the calculation has not included the added nutrient value of bioslurry and other health, social or environmental benefits.
• All investment costs for the plant were assumed to be expended in the first year and all maintenance costs and all resulting benefits are assumed to be constant over the 10 years life of the plant.
• The financial analysis is based on the estimated cost of installation of biogas plants in Damphu, Tsirang. The cost of installation is expected to increase if plants are constructed in rural or far from all-weather road or vice versa.
In such a calculation, estimated quantity of conventional fuels that will be saved has been taken into consideration not the value of total gas produced as equivalent to the cost of fuels. The following tables show the financial analysis of an average sized plant of 6 m3 capacity (1.2 to 1.5 m3 gas production per day).
Table-6.1 : Financial Analysis (At the estimated cost of Installation)
Fixed Dome Plant – 6 m3 overall volume; 1.2-1.5 m3 gas production/day Parameters Without subsidy
With 25% subsidy
With 30% subsidy
With 40% subsidy
With 50% subsidy
FIRR in % 19 29 31 38 46 NPV in Nu. 7739 13864 15089 17539 19989 B/C Ratio 1.83 2.18 2.26 2.45 2.68
The FIRR of biogas plants calculated based upon the cost of installation was above 12%, the discount rate assumed, in all the cases. This indicates that the return on investment made for the installation of biogas plant was above the opportunity cost in the capital market. The outcome of the analysis indicated that biogas plants are financially viable even without subsidy. The results have been summarized in the Figure 6.1 below:
42
Fig-6.1: FIRR of 6 cum Fixed dome plants
463831
29
19
05
101520253035404550
No Subsidy 25% Subsidy 30% Subsidy 40% Subsidy 50% Subsidy
FIR
R in
%
The FIRR mainly depends upon the market price of the conventional fuel sources which is anticipated to be replaced with biogas. The following figure shows how sensitive the FIRR is to the price of firewood. If the price of firewood is assumed to be zero, the FIRR becomes negative.
Figure 6.2: Price of Biogas vs. FIRR
6
31
2319
15
0
5
10
15
20
25
30
35
Nu. 0.5 Nu.1.0 Nu.1.25 Nu.1.5 Nu.2.0
Price of Firewood/kg
FIR
R in
%
As shown in Figure 6.2, FIRR is only 6% when the price of firewood is Nu.0.5 per kilogramme, which indicates that a biogas plant is not financially viable in areas where firewood is very cheap, unless some financial incentives, such as subsidy is provided. To ensure the financial viability of biogas plant, the cost of firewood should at least be Nu.0.8 when the discount rate is 12%. The Net Present Value, the present value of net cash flow, at 12% discount rate is positive in all the cases as shown in the following graph. This also indicates that biogas plants are financially viable even if subsidy is not provided.
Fig-6.3: NPV of 6 cum Fixed dome plants
7739
1998917539
1508913864
0
5000
10000
15000
20000
25000
No Subsidy 25% Subsidy 30% Subsidy 40% Subsidy 50% Subsidy
NPV
in N
u.
The benefit-cost ratio, based on current pricing ranges from 1.83 for biogas plant without subsidy to 2.68 with 50% subsidy; indicating that biogas plants are viable even without subsidy. Conclusively, in all the cases the B/C ratio exceeds one, which indicates the financial viability of all the biogas plants in the given conditions.
43
5.3 Economic Analysis Some benefits and cost of biogas plants are not limited to the users. For example, if a large number of biogas plants are installed in a community, the non-users will also benefit due to a cleaner community and conservation of forest in the area. Such benefits, and its related costs, that accrue even outside of the user’s household is a subject matter of economic analysis. A single biogas plant does not significantly affect the economy as a whole. Therefore, economic analysis may not be relevant for a single plant but is of immense importance at the community program level where the impact of the program on the economy is assessed.
In analyzing the economic viability of biogas program some intangible benefits like environmental impacts such as protection of forest, land-productivity improvement, reduction in carbon emissions (potential CER values) etc; reduction in smoke-borne diseases and improvement in general health; improvement in economic condition due to employment opportunities and proper use of saved time; increased yield of crop with the use of nutrient-rich bio-slurry; social prestige and satisfaction; etc. should be valued. Difficulties involved in identifying all these items in terms of benefits, and adjusting their market prices to reflect social preferences have been the major limitation of the economic analysis. The situation requires some level of generalization, simplifications, and even some restrictive assumptions based upon experience from other biogas programmes.
Due to the limited timeframe to collect primary data and information, the economic analysis had to rely mostly on secondary data. These data provide a reasonable basis for the economic analysis. The principal assumptions relate to the conversion from financial prices to economic prices. Economic benefits resulting from improved sanitation through toilet attachment and employment generation are not considered. The analysis is based on calculating the economic internal rate of return (EIRR) for the net annual benefits associated with the biogas plant. All investment costs for the plant are assumed to be expended in the first year and all maintenance costs and all resulting benefits are assumed to be constant over the 10 year life of the plant. It is thus expected that the economic internal rates of return (EIRR) of an investment into household biogas would be much higher than FIRR, once other non-cash benefits are also included. It is also assumed that the economic benefit for the society because of the avoidance of conventional fuel saving is equal to the financial benefits being received by the households.
These benefits will likely include the following:
• The cost of firewood is the average of all the cost as answered by the respondents which is Nu.1.25 per kilogramme.
• The cost of kerosene is the actual cost paid by the users at the retail market which is Nu.10 per litre. It is not the cost that the Bhutanese Government is paying to Indian Government to import kerosene.
• Time anticipated to be saved by women and children in the collection of firewood and collection of lighting fuel as well as time to be saved through faster cooking and cleaning equivalent to Nu. 28 (assuming about 1.5 hours savings per day at the rate of Nu.150 labour wage per 7 working days of 8 hours).
• Health benefits to family members from reduced indoor smoke equivalent to Nu.300/year (assumption based upon the experience).
• Benefits from increased productivity of land valued in terms of quantity of bio-slurry produced, approximately Nu. 2920 (Per day 8 kg of dry manure @ Nu.1/kg) for a 6 m3 plant.
44
• Benefits to the global environment as a result of reduced greenhouse gas emissions (2 tons of CO2 equivalents per year at $10 per ton) equivalent to Nu.1000/plant/year.
Figure 6.4 below shows how the EIRR of a 6 m3 biogas plant increases as the different benefits are added.
20
21
33
37
0 5 10 15 20 25 30 35 40
EIRR
Fuel, Fertiliser and Time Saving
Fuel, Fertiliser, Time saving, Health Improvement
Fuel, Fertiliser, Time Saving and Health & ProductivityImprovements
Fuel, Fertiliser, Time saving; Health and ProductivityImprovement; and CERs
Fig-6.4: E IRR of a 6 m3 biogs plant at different benefits
As shown in the above diagram, the EIRR of a 6 cum biogas plant ranges from 20% to 37%. Based on the assumptions used for this economic analysis, it is clear that there is an economic justification for providing subsidy to install biogas plant. Furthermore, it is unlikely that the farmers would be motivated, especially during the initial phase of the programme implementation, without attractive financial incentives to adopt the biogas plants. The financial analysis clearly indicated how sensitive the FIRR is to the price of biomass as the major saving from biogas plant incurs from the saving of conventional fuel sources, mainly firewood. As most farmers do not directly purchase firewood, their perception is that the price of biomass is at or near zero. As a result, their perceived FIRR is negative. When the other principal non-market benefits of the biogas plant are added, the EIRR rises to 37 percent. This provides an additional justification for the subsidy for the biogas plants.
45
6. Conclusion and Recommendations 6.1 Conclusion A large proportion of Bhutan’s rural households own livestock, setting the scope for a successful
biogas programme. However, competitive prices of the conventional fuel sources due to the abundant forests, relatively low level of awareness of the people about biogas technology, low ambient temperatures especially at night time in temperate and high altitude areas, and low affordability of rural farmers may limit that scope significantly. Therefore, the current effective market for biogas seems modest mostly concentrated along the southern belt and inner valleys in the country, whereby it should be noted that the socio-economic developments would indicate improvement at the medium term.
Social changes may be occurring which favour a market for Biogas. In years to come, parents may increasingly like to see their children studying more and foraging less, and as electricity supply becomes more common from grid and solar PV use, the family may start to look forward to a modernized kitchen. While smoke may keep mosquitoes away to an extent, and the wood fire does help dehydrate foodstuffs stored nearby, the gas ring increasingly has the appeal of modernization.
The attitude of potential farmers towards the use of new technology plays a vital role in its promotion and extension. The attitude differs from place to place and from farmer to farmer. The outcome of the field investigation indicates positive attitude of farmers towards biogas technology despite their low level of awareness.
The outcome of the study based upon the primary and secondary data and information collected from various sources indicated that the effective potential, the marketable biogas plants, in Bhutan counts to 16,879 numbers. In total, 19% of the total households in Bhutan have all the conditions favourable to install biogas plants.
The outcome of the market study reveals that substantial investments are needed in promotion, capacity building and quality management. Other important activities include private sector development, extension, institutional support, monitoring & evaluation and research & development. To stimulate the demand for domestic biogas, to lower the investment threshold for prospective households, and to create leverage for quality management, some financial incentives such as investment subsidy is necessary.
6.2 Recommendations
6.2.1 Formulation of Programme Implementation Document for Biogas Programme Based heavily upon the outcome of the field study and keeping in view favourable conditions in
the country, recommendation is made to launch a modest Biogas Program of five to six years duration with a target of installing 10,000 biogas plants; divided into phases of one to two year, each triggered by success of the previous phase. The first year of programme implementation should include institutional preparation, recruitment and capacity building of implementers, and delivery modality design. This would be combined with familiarization of the recommended plant design through training and construction of some demonstration biogas plants in strategic locations in the selected districts with niche market.
46
The overall goal of the biogas programme should be to ensure improvements in social and environmental conditions. This can be detailed in a list of social and environmental objectives, such as:
o Improvements in quality of life of people by providing access to clean, cheap, decentralised and sustainable energy source
o Reduction of deforestation effects of wood fuel use o Savings in drudgery, especially the workload of women o Reduction in health risks posed by domestic wood fuel use o Access for farmers to a low-cost and environmentally benign fertilizer source o Reduction in methane and CO2 emissions (greenhouse gases)
Care should also be taken to think through and monitor accomplishment of social objectives, for example the program design should elucidate some of the comparative advantages in Bhutan of direct fertilization of agricultural land by cattle and the use of biogas slurry.
6.2.2 Demand and Supply Side Management Biogas being a new and unfamiliar technology in most part of Bhutan, dissemination
infrastructure–ranging from promotion to credit and from installation to extension - is largely non-existent. As a consequence, the current commercial viability of a biogas sector is relatively low. The main function of an eventual support programme, therefore, should be to prepare this market. In so doing, efficiency and effectiveness will have to be balanced, thus indicating that biogas dissemination is best integrated with other activities. Because of the modest effective market over all, the report seeks to define niche areas in which biogas can be successfully introduced. The field study indicates that Samtse, Sarpang, Mongar, Chukha, Samdrupjongkhar, Tsirang and Trashigang harbour the highest biogas potential.
Implementation modality of biogas program should clearly state the nature of motivation and technology promotion. It should be kept in mind that the exact nature of motivation strategy must be responsive to the specific needs of the area and situation. Reliance on ‘demonstration effects’, and motivation through government officials, local resource persons, local leaders, village institutions and educational institutes could be some strategies for motivation in the context of Bhutan.
Likewise, the overall approach of implementation of the biogas program should be viewed from three main angles: right program focus, appropriate dissemination strategy, and effective integration of biogas program with other sector programs. It is recommended that the biogas program in Bhutan be integrated with women’s development, agriculture and health programs. There is limited room, at present, to integrate biogas program with wood saving and forest conservation programs due to easy access to firewood. Some pilot projects are recommended to be initiated in the initial phase in rural energy interventions to demonstrate the ‘integrated’ approach.
6.2.3 Institutional Setup The institutional set up to implement biogas program should consists of a small unit either under
the Ministry of Agriculture or Ministry of Economic Affairs coordinated by an Advisory Committee consisting of representatives from potential sector institutions, to take overall responsibility of program design, implementation and monitoring and evaluation. A strong quality management unit is also recommended under the same framework for quality management and credit and
47
subsidy administration. If MOA and MOE are involved from the onset of the program, they will internalize the process and sustainability could be guaranteed.
6.2.4 Private Sector Development Strengthening the private sector is the main pre-requisite for the promotion and extension of
biogas technologies. Private sector development should be viewed as a means to develop a more productive and efficient economy and to increase the economic participation of the population. In the case of production and use of biogas, the objective should be to let the sector develop by using the internal forces of demand and supply and by reducing external driving forces such as centrally planned production targets and subsidization in the long run. However, the immediate or short term driving force should be external driving force like subsidy. A condition for a successful privatization process should be that there are checks and balances between countervailing powers (competition, standardisation/ quality control, users’ satisfaction etc.) because that dismisses the government sector from the need to intervene. The objective of national policy on biogas program should be to provide a conducive environment for the private sector entrepreneurs to function effectively. The private sector is the main vehicle for the programme to penetrate into the communities and they should be provided with a clear-cut mandate to participate in biogas programs.
Entrepreneurs, selling energy services, need to trade in a range of viable services to justify the expense and investment they make in visiting and servicing villages. Biogas may not qualify as a viable business proposition in Bhutan in the initial phase of the programme implementation, even with the proposed price subsidy elements, as the market will develop slowly even if the social changes do come into effect. One hope for implementation of biogas is therefore to piggy-back it onto something much more marketable. Such companies should be motivated to market biogas as one element in their portfolio of services.
6.2.5 Social verses Commercial Objectives of Programme There is need to distinguish between ‘poverty alleviation’ objective and ‘commercial sector development’ objective of Biogas Programme in Bhutan. Though the long term objective of biogas programme in Bhutan should be to create a commercially viable market oriented biogas sector, it should not overlook the social aspects. In other words, there is need to deal differently with the ‘social’ versus ‘commercial’ approaches of biogas programme implementation. Biogas program should be linked with the poverty alleviation efforts of the government. The analysis indicated that the following features are important in the success of biogas program to address the issue of poverty alleviation.
• For direct effects, biogas plant should be small scale, affordable and accessible to the poor. • Increasing access to energy through dissemination of biogas plants can provide the means for
freeing time and empowering people. Where possible the biogas related services being delivered should allow either a manual task to be replaced, or provide an improvement in efficiency, which results in freed time. This allows an opportunity for increase in earned income or other quality of life benefits. This also maximizes local benefits from biogas project in terms of education and health.
• Subsidy should be provided as driving/motivating factor to penetrate the poorer strata of the society until a demand-driven market is propelled.
• Poor and marginalized people with strong willingness and commitments to be involved in biogas plant construction need to be given opportunity while imparting training and capacity building initiatives. To penetrate into small and marginal farmers and to make biogas technology more
48
affordable, one of the major efforts would be to provide credit and to spread repayment period over a longer period of time, thereby reducing the size of each payment. Given the relative newness of the technology in the rural areas, the low level of awareness on the benefits of the technology and the lack of a credit history of the majority of the target population, the financing institutions may be hesitant to provide biogas loans. A massive awareness campaign to disseminate the usefulness of the technology is needed. Group loans with social collateral would be beneficial to include more small and marginal farmers under the framework of the biogas program.
6.2.6 Developing Effective Partnership The proposed biogas program should formulate the modality of partnership agreement with other potential partners, based upon their areas of expertise and capacity to undertake specific assignments, with the assumption that it is the morally and sometimes legally binding documents to illustrate that two or more parties are working towards achieving shared and/or compatible objectives in which the parties:
• Share authority and responsibilities • Invest time and resources for synergy • Share risks and benefits • Help each other to grow and institutionalize • Enter into an explicit agreement or contracts that sets out terms
6.2.7 Public and Political Awareness Popularisation of biogas technology has to go hand in hand with the actual construction of biodigesters in the field. Without the public awareness of biodigester technology, its benefits and pitfalls, there will be no sufficient basis to disseminate the technology at grassroots level. At the same time, awareness within the government is essential. Since impacts and aspects of biodigester technology concern so many different governmental institutions (e.g. agriculture, energy, environment, etc.) it is necessary to identify and include all responsible government departments in the dissemination and awareness-raising process. To raise awareness of the people the following activities has to be carried out:
Develop and distribute different IEC (information, Education and Communication) materials in the national language such as: posters, pamphlet, and leaflets that contain information on biodigesters, their benefits, costs, services, installers, subsidy and loan provisions;
Develop and distribute IEC materials on effective storage, handling and utilization of digester effluent including composting methods;
Develop DVD’s on promotion and extension of biogas and slurry applications and broadcast them from TV/local cable;
Disseminate information on biogas plants through radio, local FM stations, TV and cinema halls; Organise orientation training for potential users, government line-agency offices, NGO workers,
school teachers and workers of local organisations; Organise exhibitions and demonstrations; Motivate biogas plant construction companies to concentrate in cluster area construction and
organise effective promotion campaign.
49
6.2.8 Motivation and Technology Promotion Motivation is a vital component of any program including biogas that is aimed at a wider section of the population. The exact nature of motivation strategy must, however, be responsive to the specific needs of the area and situation. In the context of biogas program in Bhutan, motivation plays an important role when the technology is being introduced for the first time. Developing an effective motivation strategy becomes even more critical in areas where people are likely to unfavourable attitudes towards the technology because of various reasons, especially the failure of the existing plants in the southern part of the country. Similarly, in areas where the general awareness among the people on biogas technology is low or not existent, there is a strong need to actively publicize it. The strategy for motivation in the context of Bhutan could be the following:
• Reliance on ‘demonstration effects’ by constructing quality demonstration plants in strategic locations in the country
• Motivation through governmental and non-governmental officials • Use of Local Resource Persons such as teachers, NGO workers, civil society leaders • Use of local political and religious leaders • Use of Village Institutions/Networks • Use of Educational Institutions
6.2.9 Focus on ‘Quality’ Non-functioning and poorly functioning biogas plants cause not only capital waste but also harm the reputation of biogas technology and eventually hamper the establishment of a permanent biogas sector. Therefore ‘quality’ should be the prime concern of the future biogas programme. Quality should basically relate to the following aspects of biogas programme implementation:
• Quality of design of biogas plant: The biogas plant should be cost-effective; users’ friendly; easy to construct, operate and maintain.
• Quality of training and capacity building activities: Correct training need assessment; proper selection of training participants, proper selection of facilitators, suitable training contents, session plans and scheduling; appropriate training methods; effective practical sessions; effective evaluation of training; timely follow-up of the evaluation findings.
• Quality of promotion and extension work: Potential customers should fully be aware and understand all the benefits and costs. They should be provided with factual data and information and should be aware of their roles and responsibilities for quality control.
• Quality of construction (including selection of construction materials and appliances): Strict adherence of set quality standards on site selection, selection of construction materials and appliances and construction.
• Quality of operation and maintenance by the users and technical backstopping from the installer: Effective training to users’, timely follow-up visits by the installer.
• Quality of after-sale-services on behalf of the installers: Strict adherence of terms and condition of after-sale-service provisions including timely actions to the complaints from users, routine visits and problem-solving.
• Quality of financial and administrative procedures and practices: Proper utilisation of fund, timely disbursement of subsidy amount, proper book-keeping, shorter procedures, fast, friendly and useful customer services.
50
6.2.10 Incentives to be provided to Potential Farmers a. Subsidy A flat rate subsidy should be provided to motivate the farmers to install biodigester. The subsidy structure should be designed to cover the substantial part of the installation cost, more than one third of the cost of construction for smaller biodigesters. This type of flat rate subsidy will encourage small farmers to install biodigesters. Besides lowering the financial threshold for, especially smaller farmers, the subsidy is a powerful tool to enforce quality standards set for the digesters and it will be used as a promotional instrument.
b. Credit through Financing Institutes
Financing biodigesters through commercial and development banks is quite an established practice in other countries. The national programme in Bhutan should build a strong component for credit.
c. Technical Backstopping and warranty on Biogas Plant
To enhance knowledge of users on proper operation of biodigester and on minor repair and maintenance work, different training programmes should be proposed by the programme. One day operation and maintenance training for the users should be organised immediately after the installation of biodigesters. Likewise, follow-up/refresher user’s training needs to be conducted from time to time based upon the demand of the users. Technicians from the programme should frequently visit the biogas plants to assess the performance and solve minor problems, if any. There should be a provision of warranty for a specific duration, for at least 3 years duration for the construction work
d. Research and Development
The programme should have a strong Research and Development component with activities focusing on the following points:
Research to improve the existing biodigester model, including improving design, better materials, installation and construction technique, operation techniques, method to maximize the use of biogas and bioslurry in order to improve quality of biogas plants and to cut costs.
Research to build up biogas technology development strategy including marketing and promotion and support to companies.
Measure and evaluate the impact of biogas technology dissemination on individual households as well as on communities.
Research on technical viability of biogas plants in cold climatic regions in Bhutan. Nepal’s biogas programme which has been conducting similar research in high Himalayan regions could be instrumental in sharing innovations and lessons learnt.
51
References 1. Agriculture Statistics 2007, Department of Agriculture, Ministry of Agriculture, Royal Government
of Bhutan.
2. Annual Health Bulletin, 2009, Bhutan.
3. Asian Development Outlook 2009, Asian Development Bank, Manila, The Philippines.
4. Asian Development Bank, Key Indicators of Developing Asian and Pacific Countries.
5. Bajgain, Sundar; Feasibility of a Biogas Programme in Bhutan, December 2008.
6. Bhutan Country Report, November 2009, The Economist Intelligence Unit, London, UK.
7. Compendium of Renewable Natural Resources Statistics, 2008, Policy and Planning Division, Ministry of Agriculture, Royal Government of Bhutan.
8. DoE (Department of Energy) 2007. Bhutan Energy Data Directory 2005. Department of Energy, Ministry of Trade and Industry, Royal Government of Bhutan, Thimphu, Bhutan.
9. Draft Tenth Plan (2008-2013), Volume I and II, February 2008, GNH Commission, Royal Government of Bhutan.
10. FAO 1991, Master plan for forestry development in Bhutan: Wood Energy Sectoral Analysis; RWEDP Field Document No 32. Food and Agricultural Organization, Bangkok, Thailand.
11. Felix ter Heegde and Bikash Pandey; Programme Implementation Document for a National Programme on Domestic Biogas Dissemination in Pakistan, October, 2008.
12. Ghimire, Prakash C.; Final Report on Technical Study of Biogas Plants Installed in Pakistan, December 2007, Islamabad, Pakistan.
13. Ghimire, Prakash C., and Boers, Willem; Feasibility of Biogas Programme in Lao PDR, 2003.
14. Norbu P.; Fuelwood consumption and alternative energy sources in Bhutan. Bhutan Trust Fund for Environmental Conservation, Thimphu, Bhutan2001.
15. Office of Census Commissioner 2006. Population and Housing Census of Bhutan 2005. Office of Census Commissioner, Royal Government of Bhutan, Thimphu, Bhutan.
16. Poverty Analysis Report 2007, National Statistic Bureau, Royal Government of Bhutan.
17. Presentation of Mr. Kinga Tshering, entitled Bhutan’s Experience in capacity Building in RE Sector, South Asia Conference in RE, 19th April 2006.
18. RED Metrological Data, 2007, Bhutan.
19. Santner M., Jussel R.; Rural Stoves for Bhutan; Interdisciplinary Research Institute for Development Cooperation, Johannes Kepler University, Linz, Austria 2003.
20. SNV, CRT/ARECOP/GERES; Study on Opportunity of SNV to Successfully support the dissemination of ICS in SNV Asia Countries, Final Report, June 2008.
21. Statistical Year Book of Bhutan, 2007, National Statistic Bureau, Royal Government of Bhutan.
22. TERI 2005. Integrated Energy Management Master Plan Survey. The Energy and Resources Institute, New Delhi, India.
23. The Pesticide Act of Bhutan, 2000, Ministry of Agriculture, Royal Government of Bhutan.
24. Wim van Nes, Fabby Tumiwa, Ifnu Setyadi; Final Report on Feasibility of a National Programme on Domestic Biogas in Indonesia, January 2009.
52
Annexes
53
Annex-1: Information on the Sampled Households SN Name Dist Village
1. Mr. Kaoru Ogino Senior Energy Specialist 2. Mr. Tobias Orischnig Adviser to Director 3. Mr. Hiroko Kobayashi Senior Energy Specialist 4. Mr. Jiwan Acharya Climate Change Specialist
SNV-Netherlands Development Organisation
4. Mr. Kencho Wangdi Portfolio Co-ordinater 5. Mr. David Stiedl Portfolio Co-ordinater 6 Mr. Wim van Nes SNV Corporate Team Leader for BRE
Renewable Energy Division (RED) Head Office, Ministry of Economic Affairs (MoEA)
7. Mr. Mewang Gyaltshen Chief, RED, MoEA 8. Mr. Chimmi Dorji Deputy Executive Engineer, RED, MoEA 9. Mr. Nar Bahadur Khatiwoda Deputy Executive Engineer, RED, MoEA
Livestock Head Office
10. Dr. Karma Tenzin Chief, Livestock Division 11. Mr. Phurpa Dorji Chief Livestock Officer 12. Mr. Namgay Dorji Data Manager
District Staff
13. Mr. C. B. Gurung AEO, Tsirang 14. Mr. Wangchuk Veterinary Laboratory In-charge, Wangdue 15. Ms. Pelden AEO, Wangdue 16. Mr. Wangdi AEO, Chukha 17. Mr. Shekharpa AEO, Phuntsholing 18. Ms. Chador Wangmo AEO, Sipsu, Samtse 19. Mr. Arthaman Rai AI Technician, Sipsu, Samtse 20. Mr. Chophel AEO, Trashigang 21. Dr. Tshering Dorji District Livestock Officer, Trashigang 22. Mr. Dawa Tshering Jr. E O, Tangsibji, Trongsa 23. Mr. Jigme Dukpa Livestock Pasture Officer, Bumthang 24. Mr. D.B. Gurung AEO, Bumthang 25. Mr. Sonam Norbu AEO, Yadi, Mongar 26. Mr. K.B. Ghalley Dzongkhag Pasture Officer, Thimphu, 27 Mr. Namgay Phintsho AEO, Mewang gewog, Thimphu
55
Annex-3: Study Schedule Date Day Activity
21.09.09 Monday Preliminary works, desk study of related documents and collection of secondary data and information
22.09.09 Tuesday Desk study, design of study tools and techniques including preparation of questionnaires 23.09.09 Wednesday Preparation of questionnaires, checklists and formats 24.09.09 Thursday Preparatory works and finalisation of questionnaires and checklists 25.09.09 Friday Travel to Kathmandu 26.09.09 Saturday Travel to Biratnager 27.09.09 Sunday Travel to Phuntsholing 28.09.09 Monday Travel to Thimphu 29.09.09 Tuesday Meeting of consultants and interactions on study process and methodology 30.09.09 Wednesday Desk study of related documents and collection of secondary data and information 01.10.09 Thursday Meetings with DoL/MoA, RED/DoE and SNV Bhutan 02.10.09 Friday Travel to Tsirang for field investigation 03.10.09 Saturday Household survey and data collection in Tsiring 04.10.09 Sunday Household survey and data collection in Wangdue 05.10.09 Monday Travel to Phuntsholing from Wangdue 06.10.09 Tuesday Household survey and data collection in Samtse 07.10.09 Wednesday Household survey and data collection in Toribari 08.10.09 Thursday Prakash returned to Kathmandu 09.10.09 Friday Prakash travelled to Bangkok on way to Phnom Penh 10.10.09 Saturday Prakash travelled to Phnom Penh from Bangkok 12.10.09 Monday Prakash - Data entry
Saroj - Travelled to Bumthang for field study 13.10.09 Tuesday Prakash - Data entry
Saroj - Travelled to Trashigang for field study 14.10.09 Wednesday Saroj - Household survey in Trashigang and travel to Mongar 15.10.09 Thursday Saroj- Household survey in Mongar and travel to Bumthang 16.10.09 Friday Saroj- Household survey in Bumthang and travel to Trongsa 17.10.09 Saturday Saroj - Household survey in Trongsa and travel to Thimphu 18.10.09 Sunday Saroj - Household survey in Thimphu 19.10.09 Monday Saroj - Data Entry 20.10.09 Tuesday Saroj - Data Entry and collection of relevant secondary information from various sources 21.10.09 Wednesday Saroj - Data Entry completed. Database sent to Prakash in Phnom Penh 02.11.09 Monday Prakash – Data cross checking and cleaning 03.11.09 Tuesday Data analysis 04.11.09 Wednesday Data analysis 05.11.09 Thursday Data analysis 10.11.09 Tuesday Meeting with RED/DoE, DoL/MoA, SNV and ADB to present preliminary findings 16.11.09 Monday Data analysis 17.11.09 Tuesday Data interpretation and report writing 18.11.09 Wednesday Data interpretation and report writing 19.11.09 Thursday Data interpretation and report writing 20.11.09 Friday Report writing 23.11.09 Monday Report writing
Meting with ADB, PPTA Team and SNV to discuss various aspects of the study and present findings.
24.11.09 Tuesday Report writing 25.11.09 Wednesday Report writing 26.11.09 Thursday Finalisation of draft final report 27.11.09 Friday Prakash travelled to Kathmandu on way to Thimphu 28.11.09 Saturday Prakash travelled to Thimphu from Kathmandu 29.11.09 Sunday Review of draft report, interaction with local consultant; diner meeting with ADB/PPTA Consultants 30.11.09 Monday Meeting in SNV office, Preparation of annex materials 01.12.09 Tuesday Preparation of presentation slides on study findings 02.12.09 Wednesday Preparation of presentation slides on study findings 03.12.09 Thursday Meeting with stakeholders and presentation of study findings 04.12.09 Friday Incorporation of comments and suggestions 05.12.09 Saturday Finalisation of report and travel to Kathmandu 07.12.09 Monday Travel to Bangkok on way to Phnom Penh 08.12.09 Tuesday Travel to Phnom Penh
56
Annex-4: Conditions for Dissemination of Biogas Technology
Key Condition for Dissemination of Biogas Technology Existing Condition
Technical Factors Ambient temperatures over 200 C throughout the year + - Full Stabling of animals (zero-grazing) + - Night stabling of animal + At least 20 kg/day dung available per plant + Availability of water with in 15 min distance + Biogas plant can be well spaced in the compound + + Performance of existing biogas plants, if any + - Financial/Economic Factors Use of organic fertilizer is traditionally practiced + + Dairy farming is the main source of income + Farmers are owners of the farm and live primary on the farm + Farm product are the main source of income + Moderate pricing of the plant in relation to the income + Economically healthy farms open for ‘modernization’ + Insufficient and expensive supply of conventional sources of energy - Building materials and gas appliance available locally + Availability of qualified mason / private sector + - Potential users have practice of taking loan + - Potential users have access to credit - Cost of plant installation is affordable + - Facilities for transportation of construction materials and appliances exist + - Social Factors Regular gas demand/fuel use (cooking) pattern suits with plant operation + + Gas utilization and O&M of the plant can be done by the members in the household
+ +
Awareness on Biogas Technology by users + - Socio-Cultural Acceptance of Biogas + Willingness of potential users to invest in biogas users + Peoples awareness on non-financial costs and benefits of biogas + Peoples awareness on environmental and health and sanitation issues + Operating the biogas plant can be integrated into the normal working routine of the house and the farm, no extra time required
+
Role of women in decision making Institutional Factors Availability of organisations having access to potential users + Possibility to mobilize private sector organizations + - Organizational experience with dissemination of biogas technology - Institutional experience with dissemination of biogas technology - Political will of the Government to support biogas technology + + Secured financing of the Biogas sector - Government Policy on RET - Government Policy on practical gender needs (such as reduction of women workload)
+
Willingness of stakeholders to develop a biogas sector + Effective sector co-ordination in place +
Note: + = Satisfactory condition - = does not meet the desired condition + + = desired condition - - = constraint + - = Doubtful
57
Annex-5: Bill of Quantity and Cost for GGC Model Biogas Plant
Bill of Quantities and Cost for GGC Model Biogas Plants Unit 4m3 6m3 8m3 10m3 Cost Total Cost Total Cost Total Cost Total Cost
III Labours 23 Skilled Labour No. 300 9 2700 10 3000 11 3300 12 3600 24 Unskilled Labour No. 150 19 2850 22 3300 24 3600 28 4200 Subtotal III 5550 6300 6900 7800
Total 21520.0 23861.0 27925.0 31880.0 Overhead, Guarantee and After-sale-Services (15%) 3228.0 3579.2 4188.8 4782.0 Total Cost of Installation 24748.0 27440.2 32113.8 36662.0 Cost of Installation in US$ 526.55 583.83 683.27 780.04
58
Annex-6: Terms of References Biogas Market Study in Bhutan Biogas history:
An attempt was made during late 80s to introduce biogas technology installing about 50 biogas plants in Southern Bhutan. The model selected for these plants was Deenbandhu fixed dome digester with a size of 4m3 and 6m3 capacity. The majority of the biogas plants stopped functioning after few years of installation mainly due to gas leakage from the digester and moisture trap. Some of them worked for more than15 years without major problem. The first plant constructed as a demonstration plant functioned till 2006. It is assumed that this first plant worked longer due to high quality construction. After the failure of these plants, no further attempts for promoting biogas was made in Bhutan.
Renewed interest by Royal Kingdom of Bhutan:
With many other Asian countries are successfully promoting biogas, the Royal Government of Bhutan (RGoB) is showing a renewed and keen interest on promoting biogas technology in the country. The key institutes are the Department of Livestock (DoL) of the Ministry of Agriculture (MoA) having a wide network and staff throughout the country and the Renewable Energy Division (RED) under the Department of Energy (DoE) of the Ministry of Economic Affairs (MoEA).
Brief assessment by SNV:
In December 2008, SNV Netherlands Development Organization conducted a brief assessment of the feasibility of a possible biogas programme in Bhutan14. The assessment was based on meetings with government officials, households and a few field observations and concluded that a small scale biogas programme for domestic use looks feasible. About 20,000 biogas plants are technically feasible especially in southern parts and inner mountain valleys. One of the reported challenges is the motivation of households to invest in biogas plants. Provision of subsidy and soft loan may help to attract more customers.
Pilot plants:
One of the recommendations of the SNV study was to establish a few pilot plants to further develop confidence within the possible implementing organisations. In this respect, the MoA commissioned two pilot biogas plants – one in Paro and one in Thimphu in 2009. Both plants have become into operation with the gas being used for cooking. The RED also initiated two pilot plants, one in Samtse (southern Bhutan) and one in Thimphu.
Need for market study:
The key question for the development of a substantial biogas programme in Bhutan is whether the livestock keeping households are willing and able to invest in a biogas plant and to feed it with the required amount of manure on a daily basis. The very tentative costs of a 6 m3 biogas plant (Nepalese design) excluding construction fee amount to BTN 25,000 or USD 500. It is proposed here to undertake a specific market study to provide a solid answer on this question. In case the market study will be concluded positively, an implementation document will have to be formulated detailing technological, organisational and institutional aspects for a Bhutanese biogas programme, including activity schedule, required budget and proposed financing.
Objective of the assignment:
The objective of the biogas market study in Bhutan is to assess the willingness and ability of livestock keeping households15 to invest in biogas technology.
14 Sundar Bajgain, Feasibility of a Biogas Programme in Bhutan. SNV, December 2008 15 The SNV study report suggests that at least five adult cattle heads will be required to feed a minimum of 25 kg of manure every day to the smallest size of biogas plant (4 m3)
59
Activities to be carried out under the market study:
The following are the activities to be carried out in the framework of this assignment:
- Collection and/or review of relevant secondary (statistical) data on population, livestock, agriculture, water supply, energy consumption, soil temperature, etc.;
- Preparation of a questionnaire and representative sampling method to collect data from livestock keeping households providing a realistic picture of the domestic biogas market in Bhutan. The questionnaire will contain key technical and financial issues among others related to the number and type of the livestock at the farm; the estimated amount of fresh manure that can be collected on a daily basis to feed the digester; the possibility to use cattle urine for the mixing of the manure; the current (daily and seasonal pattern in the) use of fuels for lighting, heating and cooking by sex and its associated costs in terms of money and/or time; the current use of organic and chemical fertilisers; and the willingness and ability of the household to invest in a biogas plant in cash, kind or through a loan. The collection of data will be done through visits to selected households implying interview, observations and possibly also some measurements;
- Preparation of a very brief questionnaire to collect data at the local markets on the price of fuels and basic construction materials (cement, sand, gravel, stones, gas pipe) and labour (skilled, unskilled);
- Introductory meetings with key staff of MoA/DoL, MoEA/DoE/RED and SNV/Bhutan at the start of the assignment in Bhutan;
- Execution of a survey including 50 livestock keeping households in potential districts in Bhutan and local markets on the road;
- Presentation of the initial results of the study in a workshop involving key staff of MoA/DoL, MoEA/DoE/RED and SNV/Bhutan at the end of the assignment in Bhutan;
- Submission of a complete draft report for comment by key institutes; and - Submission of a final report by incorporating/considering the comments from the key
institutes. Required manpower and time: The assignment will be executed by a small team consisting of an international consultant being the team leader (35 working days) and a national consultant (25 working days). Time schedule: The assignment will be executed in September and/or October 2009.
60
Annex-7: Field Study Questionnaires
ADB/SNV
Biogas Market Study Questionnaire for Household Survey
Informed consent & cover page
Greetings! My name is ______________________________. I am here on behalf of the Asian Development
Bank (ADB)/Netherlands Development Organization (SNV) which is conducting a market study of biogas plants
in Bhutan. In order to get information related to this market study, we are conducting a survey of households in
the area. Your household has been selected by chance from all the households this cluster. I would like to ask
you some questions related to socio-economic condition, energy use patterns, livestock raising and farming
practices.
The information you provide will be useful to find out the technical feasibility as well as socio-economic viability of
biogas programmes in your community, and will be used to plan future development programs on biogas in this
area and also in the country.
Participation in the survey is voluntary, and you can choose not to take part.
All the information you give will be confidential. The information will be used to prepare general reports, but will
not include any specific names. There will be no way to identify that you are the one who gave this information.
If you have any questions about the survey, you can ask me. If you want to know more about biogas technology
and its benefits, I would be happy to explain. Please be sure that you know about the technology before you start
answering my questions.
At this time do you have any questions about the survey?
Signature of interviewer
Date:
Respondent agreed to be interviewed
1. YES
2. NO
61
1. HOUSEHOLD IDENTIFICATION This section is to be completed for each household visited. 101. Sample number 102. Name of the Household Head 103. District name 104. Village Name 105. Type of House 106. Electrified 107. Respondent’s name 108. Date of interview 109. Time interview commenced 110. Time interview ended Interviewer: Remember to obtain consent from each household. Write answers
directly in the tables and mark the boxes on the right side of each form. PLEASE INSURE THAT YOU HAVE DESCRIBED BASICS ON BIOGAS TECHNOLOGY AND ITS BENEFITS TO THOSE WHO HAVE NO IDEA ABOUT IT. TAKE 10-15 MINUTES TO DESCRIBE ABOUT THE TECHNOLOGY.
Field Supervisor: Check ALL answers recorded in each section, ensuring gaps or missing
answers are obtained BEFORE leaving the household. Mark tick in the right hand side for checked answers after correction and validation.
Please complete this part of the form Interviewer Data entry personnel Name Date
Record Number
Day: Month: Year: October 2009
Yes / No
Kuchcha/ Semi Pucca/ Pucca
62
2. HOUSEHOLD CHARACTERISTICS Can you please tell me the names of all the members of your household who usually live here, sleep here and eat from the same kitchen, including yourself. Please include children, relatives or orphans, but do not count temporary visitors. First names are sufficient. This information is confidential and will not be shared with anyone. Names are only used in the interview and will not be related to data in the report. Make a list of ALL names before asking other questions. After getting the full list of family members, continue with the other questions in the table for each person in the list.
201 202 203 204 205 206 207
Name of all the members
Gender Age Highest-level education
completed?
Approximate Income
Coding For Answers Name
1. Male 2. Female
For child <1 year write the age as 1
Write the number for the grade level passed. Put 0 = never 13=BA 14=MA 15=PhD
Main Occupation 1.Agriculture 2.Small Business 3.Teaching 4.Govt Service 5. Other Services 6. Politics/Social Work 7. Student 8. House-wife 9. Others (specify)
Secondary Occupation
1.Agriculture 2.Small Business 3. Teaching 4.Govt Service 5. Other Services 6. Politics/Social Work 7. Others (specify)
Monthly Income (Estimated)
in Nu.
1.
2.
3.
4.
5.
6.
7.
8.
9.
10.
11.
Gross family income from individuals per YEAR(208)
Income from other sources such as selling of agricultural productions per YEAR (209)
Expenditure per YEAR (add the expenditure and write the total in the right) (210) Food : Nu.…………………….. Health: Nu.…………….. Education: Nu.……………. Others…………….: Nu………………..
Net surplus/deficit per YEAR(211)
Have there any changes in family size in the last three years? (212) No Yes, increased because of………….. Yes, decreased because of…………….
63
Land Holdings Land Owned (Ha/Acres) Land Rented-in (Ha/Acres) Land Rented-out (Ha/Acres) Low-land (213a)
Upland (213b)
Orchard farm (213c)
Low-land (214a)
Upland (214b)
Orchard farm (214c)
Low-land (215a)
Upland (215b)
Orchard farm (215c)
Agricultural Production Agri. Production Production in Kg Consumption in
Kg Income from selling or Expense for buying per
year (Nu.) Maize (216 a, b, c) Wheat (217 a, b, c) Paddy (218 a, b, c) Potato (219 a, b, c) Oilseeds (220 a, b, c) Pulses (221 a, b, c, d) Vegetables (222 a, b, c) Fruits (223 a, b, c) Cardamom (224 a, b, c) Ginger (225 a, b, c) Other 1 (226 a, b, c) Other 2 (227 a, b, c) Livestock Ownership
Numbers (current) Numbers (before 3 years)
Adult Calf Total Total Livestock
Stall-fed Free-ranged
Stall-fed Free-ranged
Stall-fed
Free-ranged
Cow/Oxen (228, a to g) Buffalo (229, a to g) Horse/Donkey (230, a to g) Goats (231, a to d) Pigs (232, a to d) Poultry (233, a, b) Total quantity of dung production (234) Do you have other migratory cattle/yak besides those mentioned above? (235) No Yes, ……….. cattle/yak Do you have improved pasture land? (236) No Yes 3. USE OF CONVENTIONAL FUEL SOURCES Supervisor’s use
only
301. How long the stove is burnt in a day for cooking purpose (calculate the timing of all the stoves) Use 24 hours system?
1. …….to ……. (…..Hrs in the morning) 2. …… to ……(…..Hrs in the afternoon) 3. …… to ……(…..Hrs in the evening/night)
301 (a-i)
302. How much fuel is consumed for cooking food for family in a month? 1. Fuel wood ------- kg @ Nu. ………. per Kg 2. Kerosene --------- litre @ Nu.……… per litre 3. LPG ---------- cylinder @ Nu. ………. per cylinder of ... kg 302 (a-n) 4. Electricity -------- unit @ Nu. ……….. per unit 5. Dried dung --------- Kg @ Nu. ……… per Kg 6. Agricultural wastes --------- Kg @ Nu.…….. per Kg 7. Others (specify) …………….
303. For how many months in a year, you use fuel for space heating? 1. ………. Months 303
64
304. How much fuel is required for space heating in a month? 1. Fuel wood ------- kg 2. Kerosene --------- litre 3. LPG ---------- cylinder 304 (a-g) 4. Electricity -------- unit 5. Died dung --------- Kg 6. Agricultural wastes --------- Kg 7. Others (specify) ……………. 305. How much fuel is required for lighting in a month? 1. Kerosene --------- litre @ Nu.……… per litre 2. Electricity -------- unit @ Nu. ……….. per unit 305 (a-j) 3. Candle …… nos. @ Nu. ……… per no. 4. Dry Cell ….. nos. @ Nu. …..per no. 7. Others (specify) …………….
306. How much fuel is required other purposes than cooking, lighting and space heating (such as entertainment) in a month?
1. Fuel wood ------- kg 2. Kerosene --------- litre 3. LPG ---------- cylinder 306 (a-i) 4. Electricity -------- unit 5. Died dung --------- Kg 6. Agricultural wastes --------- Kg 7. Candle …… nos.. 8. Others (specify) ……………. 307. Do you buy fuel wood/dried dung/agri-wastes or collect them from Jungle/ own sources? 1. Buy fuel wood, dried dung and agricultural wastes from vendors 2. Collect from jungle/own land/other sources….. 3. Both 1 and 2 307 308. How much fuel wood can you collected from Jungle/own source in one day? 1. Not applicable 2. …….. kg 308 309. What is the source of firewood if collected from own source or Jungle? 1. Cutting the whole trees 2. Cutting twigs and dry braches only 309
310. What is the average time required to transport kerosene from market to the house? 1. Do not use kerosene 2. ------- hours 310 311. Who collects and/or transports cooking and lighting fuels? (Answers can be more than one) 1. Male members in the house 2. Female members in the house 311. 3. Male children in the house 4. Female children in the house 5. Servant 6. Others (specify)….. 312. Do you think collection and transportation of conventional sources of fuel for cooking is getting difficult day by day?
1. No, it is not a problem 2. It was not a problem however, these days it is becoming difficult 312 3. Yes, it is a problem 313. Are you interested/willing to get substitutions for the conventional sources of fuel because they are expensive and difficult to obtain?
1. No, I do not feel any problem with the conventional sources 2. Yes 313 3. Can not say now 314. What do you think is the best alternative sources of energy to replace the conventional fuel sources being used for cooking and lighting?
1. I have no idea 2. Biogas 314 3. Solar energy 4. Biogas for cooking and solar for lighting 5. Others (specify)………………
65
4. USE OF CATTLE DUNG AND FARMING PRACTICE
401. Do you use cattle dung on farm? 1. No 2. Yes 401. 402. If no, what do you do to the dung? 1. Sale to others 2. Give out to others 402. 3. Make dung cakes to burn 4. Dump to water courses or drains or open spaces 5. Others (specify) 403. Why do not you use dung? 1. No farmland to use 2. It is difficult to use 403. 3. Use chemical fertilizer because it is easy to apply 4. Others (specify) 404. How much chemical fertilizer (all N,P,K) do you use per year? (Write 0 if not used) 1. --------- kgs per year @ Nu……. Per kg 404.a, b 405. How much time is needed to transport chemical fertilizer (all N,P,K) from sales agent to the
household?
1. Never use chemical fertilizers 2. ----- hours 405. 406. Are there any social taboos in handling cattle dung and urine? 1. No, dung and urine are handled without any restraints 2. Yes, Dung and urine are considered to be filthy and unhygienic 406. 3. Others (specify)……………. 407. Would you prefer using FYM/organic manure to replace chemical fertilizer? 1. Not applicable, I do not use chemical fertilizer 2. Yes, organic manure is better than chemical fertilizer 407.
3. No, I prefer chemical fertilizer as it is readily available and easy to handle
4. Can not say 5. AFFORDABILITY/WILLINGNESS TO INSTALL BIOGAS PLANT
501. Have you heard about biogas technology and biogas plant? 1. No 2. Partly 501 3. Yes 502. If yes, how did you know about this technology? 1. Through publicity media 2. Through government officials 502 3. Through service providers 4. Through friends/relatives 5. Through other biogas owners 6. Through NGO/CBO personnel 7. Through community leaders 8. Other (specify)
503. If you have heard about biogas technology, what are the main benefits from biogas plant? 1. Smoke-free cooking environment 2. Liberation from collecting conventional fuel sources 503. 3. Social benefits/Prestige 4. Health benefits 5. Environmental benefits 6. Economic benefits 7. Saves time and energy 11. Other (specify)
504. Do you know cattle dung and urine could be used to produce biogas which can be used for cooking and lighting?
1. No
2. Yes 504
505. Do you know biogas plant not only produces biogas but also yields bioslurry which has higher
66
nutrient value than farm-yard-manure? 1. No
2. Yes 505
506. The cost of a family sized biogas plants that produces enough gas to meet the cooking demand of a family ranges from Nu. 25,000 to Nu. 40,000. What is your opinion on the cost of installation of a biogas plant? (PLEASE MAKE SURE THAT RESPONDENT IS MADE FAMILIAR ABOUT THE TECHNOLOGY BEFORE ASKING THIS QUESTION)
1. It is cheap - I can afford 2. It is cheap – but I can not afford 3. It is reasonable, I can afford 506 4. It is reasonable, but I can not afford 5. It is quite expensive, but I can afford 6. It is quite expensive, I can not afford 7. It is very expensive, I can not afford 8. Can not say now 507. Do you think biogas plant could be a feasible/viable alternative for the conventional fuel
sources?
1. No 2. Yes 507 3.Can not say now 508. If no, what is/are the reason(s)? 1. Conventional fuel sources are easily available at cheaper prices 2. I have no money to invest 508 3. I do not like biogas 4. Operation of biogas plant is cumbersome 5. The technology is new for me and I have no idea at all 6. I am not convinced that the technology works well in my community 7. Others (specify)…… 509. Are you encountering any smoke borne diseases such as dizziness, eye-burning or
respiratory infections (MAKE SURE THE RESPONDENT HAS IDEA ABOUT SMOKE-BORNE DISEASES)?
1. No 2. Yes, but not often (very rarely) 3. Yes, frequently 509. 510. Have you ever taken loan from bank/MFIs for household/agricultural purposes? 1. No 2. Yes, but not often (very rarely) 3. Yes, frequently 510. 511. If yes, from where you usually take loans? 1. Bank and MFIs 2. Local Cooperatives 3. Local Money lenders 511. 4. Friends and relatives 5. Others (specify)……..
512. What is the interest rate? 1. …………..% 512. 2. Do not know
513. Have you paid the loan on time? 1. No 2. Yes, partly 513. 3. Yes, whole
514. If loan not taken why? 1. You are well off 2. You are against the philosophy of taking loans 3. Interest rate is too high 514. 4. Processing for the loan is cumbersome 5. Loan is not available/bank is far 6. Taking loans degrade your social status 7. Collateral asked, which you could not fulfil 8. Other (specify)………..
67
515. If loan/affordable credit is available, would you be interested to take loan to install a biogas plant?
1. No 2. Yes 515 3.Can not say now
516. What should be the interest rate for a biogas loan? 1. …………………% 2. Can not say now 516 517. Do you know biogas plant helps in financial savings? 1. No 2. Yes 517 3. Can not say 518. Biogas plant needs water to mix dung and water. Is collection of water a problem for you? 1. No 2. Yes 518
519. What could be the motivating factors to encourage potential farmer like you to install a biogas plant? (answers can be more than one)
1. Provide subsidy 2. Ensure affordable credit system 3. Ensure effective quality control systems 519 4. Provide after-sale- services 5. Provide training to users 6. Others (specify)…. 6. BSERVATION CHECKLIST
Component
Observation Enough land available for constructing Biogas Plant (601)
1. No 2. Yes
Distance of site from Kitchen (602)
……….. metre
Kitchen environment/condition of kitchen (603)
1. Good 2. Moderate 3. Poor
Distance of household from water source (604)
……… metre
Type of Cattle shed (605)
1. Open space 2. Closed space without flooring arrangements
3. Closed space with good flooring arrangement
Condition of the floor of cattle shed in terms of collection of dung and urine (606)
1. Easy to collect 2. Need minor improvements
3. Needs major improvements
Distance of cattle shed/ poultry firm from kitchen/household (607)
………. metre
Condition of Latrine (608) 1. Not constructed 2. Clean 3. Moderate 4. Dirty Enough land available for constructing slurry pits (609)
1. No 2. Yes
Road/transportation Condition (610)
1. Easily accessible all weather
2. Accessible during dry season months
3. Difficult
Nearest market from the community (611)
……….. km far
Additional Information, if any….
68
CHECKLIST: COST OF CONSTRUCTION MATERIALS AND APPLIANCES
SN Item Unit Tsirang
Unit cost
(Nu.)
Wandue
Unit cost
(Nu.)
Phuntsholing
Unit Cost
(Nu.)
Trashigang
Unit Cost
(Nu.)
Mongar
Unit Cost
(Nu.)
Trongsa
Unit Cost
(Nu.)
I Construction Materials
1 Brick Piece
2 Concrete blocks Peac
e
3 Stone Cu.m
4 Cement – 50 kg bag bag
5 Gravel 1x2 m3
6 Coarse sand m3
7 Fine sand m3
8 Inlet pipe 10cm dia, length 2m Piece
9 Iron bars ø 8 mm Kg
10 Binding wire kg
11 Water proofing compound kg
12 Acrylic emulsion paint Lit
II Accessories
13 G.I Gas outlet pipe Ø 0.5", 0.6m
long
Piece
14 GI nipple, Ø 0.5" for connecting
main gas pipe and main gas valve
Piece
15 Main gas valve (Ball valve Ø 0.5") Piece
16 Male-female socket Ø 0.5", G.I.
with aluminium thread, for
connecting main gas valve and
gas pipeline (G.I.)
Piece
17 G.I. 90◦ elbow Piece
18 T-socket Ø0.5" for water trap
(aluminium thread inside)
Piece
19 Water drain Piece
21 Gas tap Piece
22 Teflon tape Piece
23 Gas pipe, G.I. or PVC pipe Ø 0.5” m
24 Rubber hose pipe Ø 0.5” and 2
clamps
m
25 Stoves – single burner Piece
26 Lamp Piece
27 Pressure meter/Manometer Piece
28 Miscellaneous
III Labours
26 Skilled Labour per day No.
27 Unskilled Labour per day No.
69
Annex-8: List of Participants in Stakeholders’ Meeting
No. Name
1. 2.
3. 4. 5.
6. 7.
8. 9.
10. 11. 12. 13. 14. 15.
16.
17. 18. 19.
Renewable Energy Division, Department of Energy Mr. Mewang Gyaltshen Mr. Chhimi Dorji Bhutan Power Corporation Mr. Tempa Dorji Mr. Suresh Nepal Mr. Jigme Nidup Asian Development Bank Mr. Jiwan Acharya Mr. K. Ogino SNV Mr. Kencho Wangdi Mr. David Stiedl PPTA, RED (ADB) Mr. Michael Cheng Mr. Jayan Atuakarne Mr. Bruce Smith Mr. Tempa Jurme Mr. Megay Penjore Ms. Deki Yonten DOA/Livestock Division Mr. Phurpa Dorji TA for Biogas market Study and Implementation Plan (ADB) Mr. Julio Castro Mr. Prakash C. Ghimire Mr. Saroj K. Nepal
70
Annex-9: Visual Aids used for awareness creation in study
FLOW CHART OF BIOGAS TECHNOLOGY (CHART – 1)
WATERHEATER
RICE COOKER
STOVE LAMP
ENGINE
FARM MANURE
FISH FEED PIG FEED
TOILET
CATTLE SHED
GAS DOME
DIGESTER
OUTLET
SLURRY PIT
GAS PIPE
71
APPLICATION OF BIOGAS & BIO‐SLURRY (CHART – 2)
10 kg dung ~ 1 hour of STOVE burning ~ 2 hours of LAMP burning