www.ccsenet.org/mas Modern Applied Science Vol. 5, No. 5; October 2011 Published by Canadian Center of Science and Education 39 Biomonitoring of Effects Following Exposure of Fish to Sugar Refinery Effluent Tugiyono (Corresponding author) & Nuning Nurcahyani Department of Biology, Faculty of Natural Sciences, University of Lampung, Indonesia R. Supriyanto & Sutopo Hadi (Corresponding author) Department of Chemistry, Faculty of Natural Sciences, University of Lampung, Indonesia E-mail: [email protected], [email protected]Received: August 11, 2011 Accepted: August 26, 2011 doi:10.5539/mas.v5n5p39 Abstract Biomarker is the newest concept in environmental biomonitoring. One of the key functions of biomarker is to provide an early warning signal of significant biological effects. The objective of this research was to determine biomarker as a water quality monitoring tool on the waste water treatment plant (WWTP). The experiment was conducted at waste water treatment plant ponds (WWTPs) of a sugar refinery by growing Nile tilapia in floating net cages for 60 days. Results show that CF and LSI decreased in all WWTP whereas the GSI value in first and second aeration ponds increased compared to the control fish. The SDH enzyme activity significantly increased in the first aeration and monitoring ponds compared to those of the other ponds. The most severe hyperemia in hepatic cells occurred in the first and second aeration ponds. The highest value of SGR and SR was observed in stabilization pond. Keywords: Biomarker, SDH, Nile tilapia, Sugar refinery 1. Introduction Changes in environmental quality can be identified based on changes in selected biological parameters. This approach in biomonitoring uses living organisms to monitor changes in biochemistry, physiology, morphology, and organism behavior instead of traditional approaches using community structure measures like abundance and diversity indices. Biomonitoring uses tools known as biochemical markers (biomarkers) to anticipate the impacts of pollution at the cellular and tissue level through to the level of population structure (Lam and Wu, 2003). A biomarker measures a biological response to chemical substances in the environment to give a measure of exposure and sometimes, also, of toxic effect (Walker et al., 1996). It is a biological tool used as a sensitive indicator demonstrating that toxicants have entered the organisms, been distributed within the tissues, and are eliciting a toxicological effect (McCarthy and Shugart, 1990). Biomarkers are the most-up-to-date tools used to estimate the impact of chronic exposure to specific or non-specific chemicals in the environment (Jørgensen, 1997). One of the main roles of biomarkers is to provide an early warning signal of significant biological effect (Lam and Gray, 2001). This study used the biomarker sorbitol dehydrogenase activity to assess the quality of water in waste water treatment ponds (WWTPs) of PT. Gunung Madu Plantation (PT.GMP), a large sugar refinery company in Lampung, Indonesia, using caged fish. Histopathology of the liver of the fish was assessed to confirm the biomarker results. 2. Experiment 2.1 Fish Culture Twenty Nile tilapias (Oreochromis niloticus Linn) (9.62±2.16 g) were cultured in 1m x 1m x 1m floating net cages placed in the WWTPs. Five ponds were used in this experiment, namely first and second aeration ponds, stabilization pond, monitoring pond and a control pond. The size and weight of each fish were measured prior to commencement of the experiment. The fish were kept for 60 days, were fed twice a day and any dead fish removed. At the end of 60 days, fishes were harvested and the following analyses were performed: Standard growth rate (SGR) and Survival rate (SR) were calculated using the following equation (Gabche and Hockey, 1995; Gisbert and Williot, 1997):
Transcript
www.ccsenet.org/mas Modern Applied Science Vol. 5, No. 5; October 2011
Published by Canadian Center of Science and Education 39
Biomonitoring of Effects Following Exposure of Fish to Sugar Refinery Effluent
Received: August 11, 2011 Accepted: August 26, 2011 doi:10.5539/mas.v5n5p39
Abstract
Biomarker is the newest concept in environmental biomonitoring. One of the key functions of biomarker is to provide an early warning signal of significant biological effects. The objective of this research was to determine biomarker as a water quality monitoring tool on the waste water treatment plant (WWTP). The experiment was conducted at waste water treatment plant ponds (WWTPs) of a sugar refinery by growing Nile tilapia in floating net cages for 60 days. Results show that CF and LSI decreased in all WWTP whereas the GSI value in first and second aeration ponds increased compared to the control fish. The SDH enzyme activity significantly increased in the first aeration and monitoring ponds compared to those of the other ponds. The most severe hyperemia in hepatic cells occurred in the first and second aeration ponds. The highest value of SGR and SR was observed in stabilization pond.
Keywords: Biomarker, SDH, Nile tilapia, Sugar refinery
1. Introduction
Changes in environmental quality can be identified based on changes in selected biological parameters. This approach in biomonitoring uses living organisms to monitor changes in biochemistry, physiology, morphology, and organism behavior instead of traditional approaches using community structure measures like abundance and diversity indices. Biomonitoring uses tools known as biochemical markers (biomarkers) to anticipate the impacts of pollution at the cellular and tissue level through to the level of population structure (Lam and Wu, 2003).
A biomarker measures a biological response to chemical substances in the environment to give a measure of exposure and sometimes, also, of toxic effect (Walker et al., 1996). It is a biological tool used as a sensitive indicator demonstrating that toxicants have entered the organisms, been distributed within the tissues, and are eliciting a toxicological effect (McCarthy and Shugart, 1990). Biomarkers are the most-up-to-date tools used to estimate the impact of chronic exposure to specific or non-specific chemicals in the environment (Jørgensen, 1997). One of the main roles of biomarkers is to provide an early warning signal of significant biological effect (Lam and Gray, 2001). This study used the biomarker sorbitol dehydrogenase activity to assess the quality of water in waste water treatment ponds (WWTPs) of PT. Gunung Madu Plantation (PT.GMP), a large sugar refinery company in Lampung, Indonesia, using caged fish. Histopathology of the liver of the fish was assessed to confirm the biomarker results.
2. Experiment
2.1 Fish Culture
Twenty Nile tilapias (Oreochromis niloticus Linn) (9.62±2.16 g) were cultured in 1m x 1m x 1m floating net cages placed in the WWTPs. Five ponds were used in this experiment, namely first and second aeration ponds, stabilization pond, monitoring pond and a control pond. The size and weight of each fish were measured prior to commencement of the experiment. The fish were kept for 60 days, were fed twice a day and any dead fish removed. At the end of 60 days, fishes were harvested and the following analyses were performed:
Standard growth rate (SGR) and Survival rate (SR) were calculated using the following equation (Gabche and Hockey, 1995; Gisbert and Williot, 1997):
www.ccsenet.org/mas Modern Applied Science Vol. 5, No. 5; October 2011
ISSN 1913-1844 E-ISSN 1913-1852 40
%100)ln(ln
t
oWtWSGR and %100
oN
tNSR
where Wo is weight or length in the first days or day to 0; Wt is weight or length in the day t; t is duration of maintenance (day), No is number of fish at day 0, and Nt is number of harvested fish at day t.
Physiological indices including condition factor (CF), liver somatic index (LSI) and gonadosomatic index (GSI) where calculated as follows:
1003length) (total
tbody weigh totalCF (Lucky, 1977, Gisbert and Williot, 1997).
100tbody weigh
htliver weigLSI (Norrgren et al., 1999)
100tbody weigh
weightgonadGSI (Gabche and Hockey, 1995)
Sorbitol dehydrogenase enzyme (SDH) assay: The quantity of SDH was calculated from plasma/serum separated from blood or meat (muscle). Serum sorbitol dehydrogenase was analyzed UV-spectrophotometrically using Sigma Diagnostic Procedure No 50-UV. This method is based on the catalytic reduction of fructose to sorbitol with presence of NADH through the following reaction:
SDH
D-Fructose + NADH D-Sorbitol + NAD
The rate of decrease in absorbance at 340 nm is a measure of SDH activity (Holdway et al., 1994; Webb and Gagnon, 2007).
Liver Histology: Each fish liver was fixated with 10 % formalin solution, histological slices was made using conventional histological method (McManus and Mowry, 1964), and colored with haematoxylin and eosin (H&E). The slices were photographed to identify any histological alteration.
2.2 Analysis of Water Quality
The physico-chemical quality of the water in the WWTP was measured daily (i.e temperature, pH, chemical oxygen demands (COD), conductivity, total dissolved solid (TDS) and turbidity).
2.3 Statistics
Results are presented as means ± standard error. Analysis of variance (ANOVA) and Least Significant Differences (LSD) was used to assess differences amongst treatments. p < 0.05 was accepted for statistical significance.
3. Results and Discussion
3.1 Growth and Survival rates
The SGR of fish in all WWTP (first and second aeration ponds, stabilization and monitoring) were bigger compared to those of control. The SGR of fish in stabilization WWTP showed the highest amongst the other three WWTP ponds. It is also observed that the value of SR of all WWTP ponds is significantly higher compared to those of control (Table 1). These results indicated that the water conditions in the WWTP will successfully support fish life.
External factors (environment) that can influence fish growth are temperature and food availability. Results from this research showed that the temperature in all WWTP was in the range from 29oC – 30oC. This means that the water temperature in WWTP was normal. Hence, food availability will be the dominant factor to explain the increased size of the fish in the treatment ponds. Gabche and Hockey (1995) concluded that fish in an
www.ccsenet.org/mas Modern Applied Science Vol. 5, No. 5; October 2011
Published by Canadian Center of Science and Education 41
environment with excessive food will grow much faster than fish in comparable environments with less food availability.
3.2 Physiological Indices
The CF is a measure of the fattiness of the fish and allows comparisons to be made between populations living under different conditions. This physiological indicator may be affected if food is limited or if food consumption of the fish is impaired due to other stress factors. In addition the commercial value of the CF indicates the quality and quantity of meat and fish available to be eaten. So the condition factor can have either a biological or commercial meaning (Lucky, 1977). The CF recorded in the fish from the WWTP (first and second aeration, stabilization, and monitoring) was not significantly different (p > 0.05) compared to that of the control (Table 2). According to Lucky (1977), as the overall value of CF measured in this study was ≤1.7, it means that fish were living in a depressed environment. Similarly the value of LSI of fish from the WWTP ponds that was lower than that of in control, but the difference was not significant (p > 0.05; Table 2). The CF and LSI of rainbow trout fishes (Oncorhynchus mykiss) when fed by food mixed with astaxanthin was lower than that of in control (Rehulka, 2000). Finnegan et al. (2009) reported that snail living in the depressed environment (for instance exposed to irgarol) was less mobile and showed no responses.
GSI measured in the fish from the first and second aeration WWTPs was significantly greater (p < 0.05) than that of in control. While the GSI value of fish in the stabilization and monitoring WWTP was greater than that of in control, but the differences were not significantly different (p < 0.05; Table 2). GSI values amongst all WWTPs were not significantly different. This suggests that there was no interference in the development of Nile tilapia gonad living in WWTPs. The low value of GSI can be an indicator of a disturbance on reproductive ability, which in a long period can be a serious threat (Pointet and Miller, 2000; Webb, 2005).
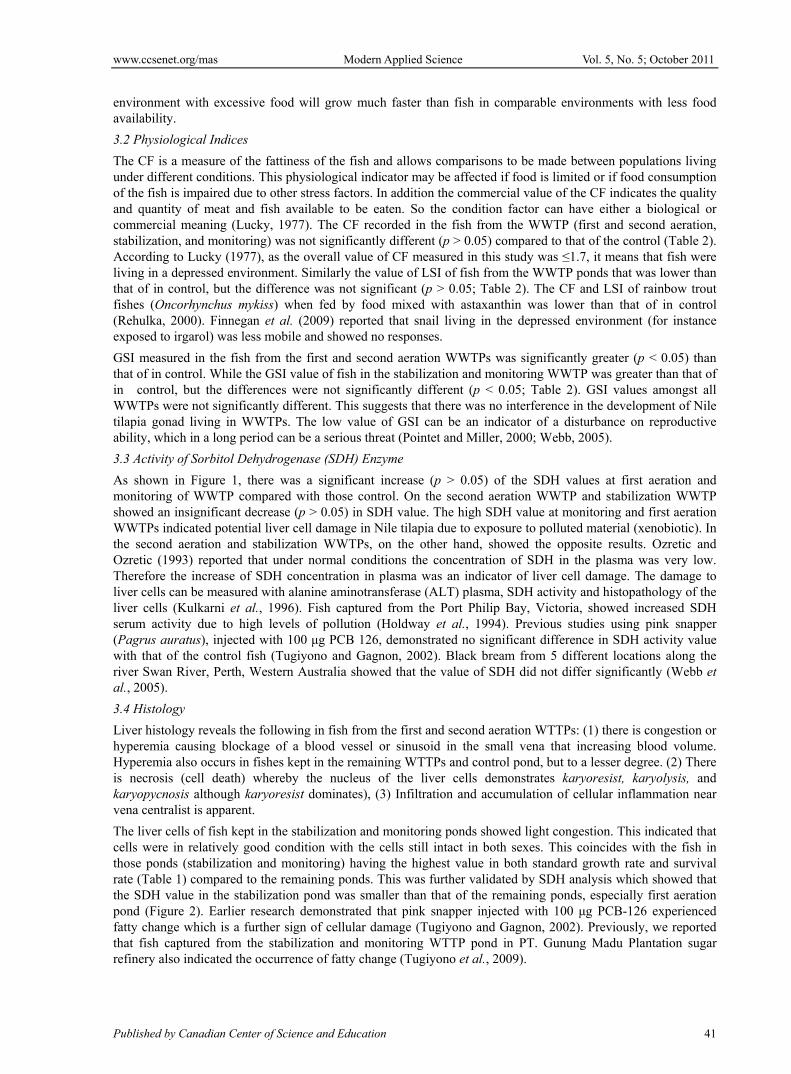
3.3 Activity of Sorbitol Dehydrogenase (SDH) Enzyme
As shown in Figure 1, there was a significant increase (p > 0.05) of the SDH values at first aeration and monitoring of WWTP compared with those control. On the second aeration WWTP and stabilization WWTP showed an insignificant decrease (p > 0.05) in SDH value. The high SDH value at monitoring and first aeration WWTPs indicated potential liver cell damage in Nile tilapia due to exposure to polluted material (xenobiotic). In the second aeration and stabilization WWTPs, on the other hand, showed the opposite results. Ozretic and Ozretic (1993) reported that under normal conditions the concentration of SDH in the plasma was very low. Therefore the increase of SDH concentration in plasma was an indicator of liver cell damage. The damage to liver cells can be measured with alanine aminotransferase (ALT) plasma, SDH activity and histopathology of the liver cells (Kulkarni et al., 1996). Fish captured from the Port Philip Bay, Victoria, showed increased SDH serum activity due to high levels of pollution (Holdway et al., 1994). Previous studies using pink snapper (Pagrus auratus), injected with 100 μg PCB 126, demonstrated no significant difference in SDH activity value with that of the control fish (Tugiyono and Gagnon, 2002). Black bream from 5 different locations along the river Swan River, Perth, Western Australia showed that the value of SDH did not differ significantly (Webb et al., 2005).
3.4 Histology
Liver histology reveals the following in fish from the first and second aeration WTTPs: (1) there is congestion or hyperemia causing blockage of a blood vessel or sinusoid in the small vena that increasing blood volume. Hyperemia also occurs in fishes kept in the remaining WTTPs and control pond, but to a lesser degree. (2) There is necrosis (cell death) whereby the nucleus of the liver cells demonstrates karyoresist, karyolysis, and karyopycnosis although karyoresist dominates), (3) Infiltration and accumulation of cellular inflammation near vena centralist is apparent.
The liver cells of fish kept in the stabilization and monitoring ponds showed light congestion. This indicated that cells were in relatively good condition with the cells still intact in both sexes. This coincides with the fish in those ponds (stabilization and monitoring) having the highest value in both standard growth rate and survival rate (Table 1) compared to the remaining ponds. This was further validated by SDH analysis which showed that the SDH value in the stabilization pond was smaller than that of the remaining ponds, especially first aeration pond (Figure 2). Earlier research demonstrated that pink snapper injected with 100 μg PCB-126 experienced fatty change which is a further sign of cellular damage (Tugiyono and Gagnon, 2002). Previously, we reported that fish captured from the stabilization and monitoring WTTP pond in PT. Gunung Madu Plantation sugar refinery also indicated the occurrence of fatty change (Tugiyono et al., 2009).
www.ccsenet.or
42
Fatty change oxygen to theHypoxemia faThis congestio
3.5 Analysis of
The SGR, SRstabilization athree other po
The concentraWWTPs, althmaterial in thein water (Hell
4. Conclusion
The fish fromevident histophowever this had water qua
Acknowledge
The authors wHigher Educaproject thro28/SP2H/PP/Dalso go to PTof Technology
Control 7.72±0.16a 80.43±6.40a 588.86±18.12a 294.29±8.96a 21.86±3.02a
Note: The same letter on the same column show no significant differences (p ≥ 0.05).
Figure 1. Sorbitol Dehydrogenize (SDH) enzyme activities at the WWTPs PT. Gunung Madu Plantation. Lampung. Indonesia. The same letter on each bar indicates no significant differences at (p ≥ 0.05)
A B A A B
www.ccsenet.org/mas Modern Applied Science Vol. 5, No. 5; October 2011
Published by Canadian Center of Science and Education 45
Figure 2. (A) Histological preparation of liver cells in Nile tilapia collected from WWTPs PT. Gunung Madu Plantation. Lampung. Indonesia (a) hyperemia (congestion) in the sinusoid or blood vessel cells in the small vena. (b) infiltration (cellular inflammation) near the vena centralist. and (c) fatty change in liver from fish in the first and second aeration WWTP. (B) Hepatocyte cell from fish in the control pond: (d) nuclei (e) membrane cell. HE X 400