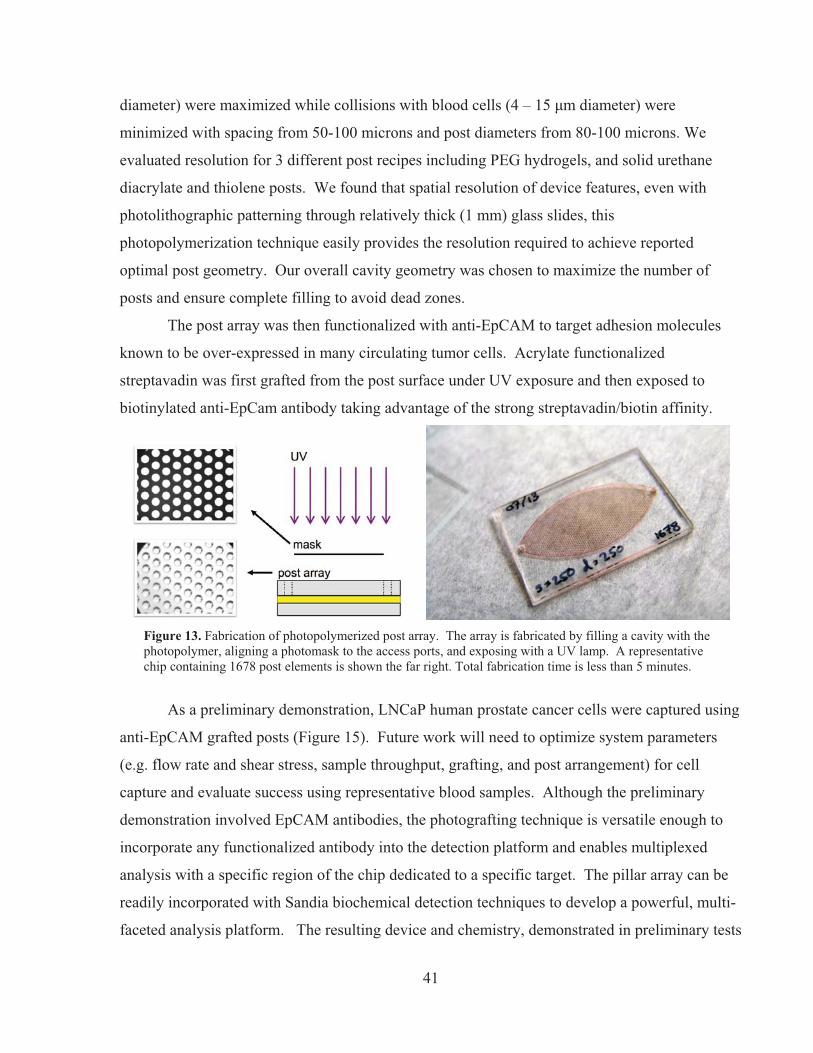
SANDIA REPORT SAND2010-8032 Unlimited Release Printed November 2010 Biotechnology Development for Biomedical Applications Susan L. Rempe, David M. Rogers, Stephen Buerger, Michael Kuehl, Anson Hatch, Vinay Abhyankar, Junyu Mai, Shawn Dirk, Kirsten Cicotte, Susan M. Brozik, Vincent De Sapio, Joseph S. Schoeniger, Andriy Anishken, Sergei Sukharev and Elizabeth Hedberg-Dirk Prepared by Sandia National Laboratories Albuquerque, New Mexico 87185 and Livermore, California 94550 Sandia National Laboratories is a multi-program laboratory managed and operated by Sandia Corporation, a wholly owned subsidiary of Lockheed Martin Corporation, for the U.S. Department of Energy’s National Nuclear Security Administration under contract DE-AC04-94AL85000." Approved for public release; further dissemination unlimited.
Transcript
1
SANDIA REPORT SAND2010-8032 Unlimited Release Printed November 2010 Biotechnology Development for Biomedical Applications
Susan L. Rempe, David M. Rogers, Stephen Buerger, Michael Kuehl, Anson Hatch, Vinay Abhyankar, Junyu Mai, Shawn Dirk, Kirsten Cicotte, Susan M. Brozik, Vincent De Sapio, Joseph S. Schoeniger, Andriy Anishken, Sergei Sukharev and Elizabeth Hedberg-Dirk Prepared by Sandia National Laboratories Albuquerque, New Mexico 87185 and Livermore, California 94550 Sandia National Laboratories is a multi-program laboratory managed and operated by Sandia Corporation, a wholly owned subsidiary of Lockheed Martin Corporation, for the U.S. Department of Energy’s National Nuclear Security Administration under contract DE-AC04-94AL85000." Approved for public release; further dissemination unlimited.
2
Issued by Sandia National Laboratories, operated for the United States Department of Energy by Sandia Corporation. NOTICE: This report was prepared as an account of work sponsored by an agency of the United States Government. Neither the United States Government, nor any agency thereof, nor any of their employees, nor any of their contractors, subcontractors, or their employees, make any warranty, express or implied, or assume any legal liability or responsibility for the accuracy, completeness, or usefulness of any information, apparatus, product, or process disclosed, or represent that its use would not infringe privately owned rights. Reference herein to any specific commercial product, process, or service by trade name, trademark, manufacturer, or otherwise, does not necessarily constitute or imply its endorsement, recommendation, or favoring by the United States Government, any agency thereof, or any of their contractors or subcontractors. The views and opinions expressed herein do not necessarily state or reflect those of the United States Government, any agency thereof, or any of their contractors. Printed in the United States of America. This report has been reproduced directly from the best available copy. Available to DOE and DOE contractors from
U.S. Department of Energy Office of Scientific and Technical Information P.O. Box 62 Oak Ridge, TN 37831
Telephone: (865)576-8401 Facsimile: (865)576-5728 E-Mail: [email protected] Online ordering: http://www.osti.gov/bridge Available to the public from
U.S. Department of Commerce National Technical Information Service 5285 Port Royal Rd Springfield, VA 22161
Biotechnology Development for Biomedical Applications
Susan L. Rempe and David M. Rogers Nanobiology Department
Sandia National Laboratories
Stephen Buerger and Michael Kuehl Intelligent Systems Controls Department
Sandia National Laboratories
Anson Hatch, Vinay Abhyankar, and Junyu Mai Biotechnology and Bioengineering Department
Sandia National Laboratories
Shawn Dirk and Kirsten Cicotte Organic Materials Department Sandia National Laboratories
Susan Brozik
Biosensors and Nanomaterials Department Sandia National Laboratories
Vincent De Sapio Scalable Modeling and Analysis Department
Sandia National Laboratories
Andriy Anishken and Sergei Sukharev University of Maryland, College Park
College Park, MD 20742
Elizabeth Hedberg-Dirk University of New Mexico Albuquerque, NM 87131
Edited by: Stephen A. Casalnuovo
Biosensors and Nanomaterials Department Sandia National Laboratories
P.O. Box 5800 Albuquerque, NM 87185
Abstract Sandia’s scientific and engineering expertise in the fields of computational biology, high-performance prosthetic limbs, biodetection, and bioinformatics has been applied to specific problems at the forefront of cancer research. Molecular modeling was employed to design stable mutations of the enzyme L-asparaginase with improved selectivity for asparagine over other amino acids with the potential for improved cancer chemotherapy. New electrospun polymer composites with improved electrical conductivity and mechanical compliance have been demonstrated with the promise of direct interfacing between the peripheral nervous system and the control electronics of advanced prosthetics. The capture of rare circulating tumor cells has been demonstrated on a microfluidic chip produced with a versatile fabrication processes capable of integration with existing lab-on-a-chip and biosensor technology. And software tools have been developed to increase the calculation speed of clustered heat maps for the display of relationships in large arrays of protein data. All these projects were carried out in collaboration with researchers at the University of Texas M. D. Anderson Cancer Center in Houston, TX.
4
ACKNOWLEDGMENTS
The authors would like to thank Richard Fate of Sandia’s Intelligent Systems Controls Department for his personal commitment to forging the collaboration between Sandia and the M. D. Anderson Cancer Center. Without Dick’s dedication to this effort, this work would never have taken place. We would also like to acknowledge funding from the Sandia LDRD Program, which enabled our collaboration with researchers at the M. D. Anderson Cancer Center, the University of Maryland, College Park, and the University of New Mexico.
5
CONTENTS Abstract ......................................................................................................................................... 3 Acknowledgments........................................................................................................................... 4 Introduction ..................................................................................................................................... 7 Computational Studies of L-Asparaginase II Enzymes .................................................................. 9 Sequence alignment and conservancy analysis .................................................................... 11 Spatial alignment of structures ............................................................................................ 14 Assembly of the simulation cells ........................................................................................ 15 MD simulations ................................................................................................................... 17 Simulations and analysis methods ...................................................................................... 17 Estimation of equilibration and stability ............................................................................. 17 Mobility analysis and detection of catalytic loop hinges ..................................................... 23 Principal component analysis ............................................................................................. 25 Symmetry-driven simulated annealing ............................................................................... 27 Exploration of conformational space using the "Extrapolated Motion" protocol ............... 28 Discussion ........................................................................................................................... 29 Compliant Materials for Regenerative Nerve Interfaces .............................................................. 29 Target system level specifications ....................................................................................... 29 Polymer fabrication ............................................................................................................. 31 Impedance testing ............................................................................................................... 34 Biocompatibility testing ...................................................................................................... 37 Assembly considerations .................................................................................................... 37 Conclusions ......................................................................................................................... 38 Circulating Tumor Cells - Trapping and Detection ...................................................................... 38 Motivation ............................................................................................................................ 38 Approach ............................................................................................................................. 39 Post arrays and cell capture .................................................................................................. 39 Biochemical detection and analysis .................................................................................... 43 Fluorescence based solid-phase immunoassay ................................................................... 44 Electrode array .................................................................................................................... 45 Clustered Heat Maps for Bioformatics Data Analysis .................................................................. 46 Clustered heat map analysis and visualization .................................................................... 46 Conclusion .................................................................................................................................... 50 References ..................................................................................................................................... 52 Distribution List ............................................................................................................................ 55
6
7
Introduction
With 40% of the U.S. population expected to develop cancer at some point during their
lives1, the diagnosis and treatment of cancer represents a critically important public health and
technological challenge. Through its biodefense and emerging infectious disease programs,
Sandia is developing the science and technology required to understand and address infectious
disease pathogenesis, detection, and therapeutics – capabilities that are foundational to many
areas of medical research, including cancer research. Like infectious disease, understanding and
treating cancer involves the detection of disease markers, the understanding of nucleic acid and
protein dynamics resulting from genetic disease (in the case of cancer), and the ability to design
effective therapeutics (e.g., chemotherapy, hormonal, radiation) that can mitigate the disease
evolution. Beyond fundamental biological science, cancer research exercises other Sandia
capabilities, from informatics for the analysis of large data sets to robotics as applied to advanced
prosthetic devices. In all these areas, the application of Sandia’s expertise to cancer research
directly builds capabilities relevant to its national security mission.
On November 2 and 3, 2009, Sandia and the University of Texas M. D. Anderson Cancer
Center (MDACC), held a joint workshop on the MDACC campus in Houston, TX, to identify
research areas of mutual interest suitable for collaboration. Discussions during and after the
workshop indicated that there was significant strategic interest for both institutions to collaborate
in four areas: computational biology, high-performance prosthetic limbs, biodetection, and
bioinformatics. For MDACC, a partnership with Sandia brings world-class expertise in the
application of physical sciences to the fields of biology and medical science. For Sandia,
MDACC brings world-class expertise in the biological sciences, disease pathogenesis,
theranostics (therapy and diagnostics), prosthetics and potentially other areas that directly
support Sandia’s Defense Systems and Assessments SMU and International, Homeland, and
Nuclear Security SMU.
In this project, we have investigated four problems at the forefront of cancer research,
one in each of the topic areas identified during the workshop:
1. Computational Biology – apply Sandia developments in molecular modeling to design
stable enzyme mutations for improved cancer chemotherapy.
2. High-Performance Prosthetic Limbs – develop new regenerative nerve interface
electrodes that are materially and structurally compliant, incorporate nanoparticle-doped
8
polymer systems, and are inspired by micro-neurosurgical practice, and can overcome
current limitations.
3. Biodetection - develop medical diagnostic and biosensing tools to capture and identify
rare circulating tumor cells (CTCs).
4. Bioinformatics – explore novel algorithms to dramatically speed up the analysis of large
arrays of biological data, leading to more interactive ways to extract information from
these data sets.
Each problem was led by a Sandia investigator in collaboration with a MDACC
researcher. The ultimate goal of this interaction, in the words of the 2009 Sandia/University of
Texas Memorandum of Understanding, is to build “strengths together that neither institution has
alone (and) target areas that have potential to make substantive national impact”.
9
Computational Studies of L-Asparaginase II Enzymes Cancer is a pervasive and deadly disease whose best method of control is by selectively
removing infected cells. Forty percent of the population expects to be diagnosed with cancer
during a lifetime and more than half a million deaths in the US were attributed to cancer in a
single year (2008). For the special case of cells deficient in asparagine, a condition encountered
in lymphoblastic leukemia, the E. coli- derived enzyme L-Asparaginase type II (L-ASN2) is
currently used for clinical treatment and operates by reducing the availability of asparagine in the
blood stream. Because the endogenous synthesis pathway in cancer cells is compromised due to
a deficiency in asparagine synthetase, introduction of L-ASN2 begins an autophagy pathway,
breaking the cell down into component nutrients. A critical problem in this cancer treatment is
that this enzyme does not react exclusively with the asparagine substrate. We have leveraged our
recent developments in molecular modeling to design stable asparaginase mutations with higher
substrate selectivity. Specifically, we have quantified reaction energetics in biological
environments by extending a statistical theory developed in our lab to include protein
conformational motions. Our collaborator at MDACC will experimentally test our designs. As
a consequence of our work, we expect to enhance asparaginase-based cancer treatment and
establish ourselves as partners of MDACC researchers.
Substrate selectivity is critical for a circulating metabolic enzyme. Varying degrees of
selectivity between asparagine and glutamine are observed among asparaginases. Unfortunately
metabolism of the glutamine substrate is associated with severe side effects. Since these amino
acids differ by only one CH2 group, the substrate control problem is extremely difficult. This
problem is further complicated by the conformational changes in a surface loop forming the
enzyme active site upon substrate binding. These changes may be cooperative between the four
catalytic sites of the 1304-residue macromolecule and thus provide a host of possibilities for
enzyme engineering.
We have attempted to address the two most challenging aspects of the L-ASN catalysis
reaction: 1) cooperativity of substrate binding2; and 2) flexibility of a surface loop forming the
active site3. Crystal structures of L-ASN from E. coli, Er. chrysanthemi and carotovora, and
recently H. pylori 4 provide a rich set of reference structures from which to draw mechanistic
conclusions. The latter two homologues display higher selectivity for asparagine than the
reference E. coli protein, but the inter-subunit contacts formed in the carotovora structure are not
10
stable enough for clinical application. Because of the close proximity of the catalytic site to the
subunit interface and the possibility of cooperative effects, mutations must be carefully chosen to
balance selectivity and stability.
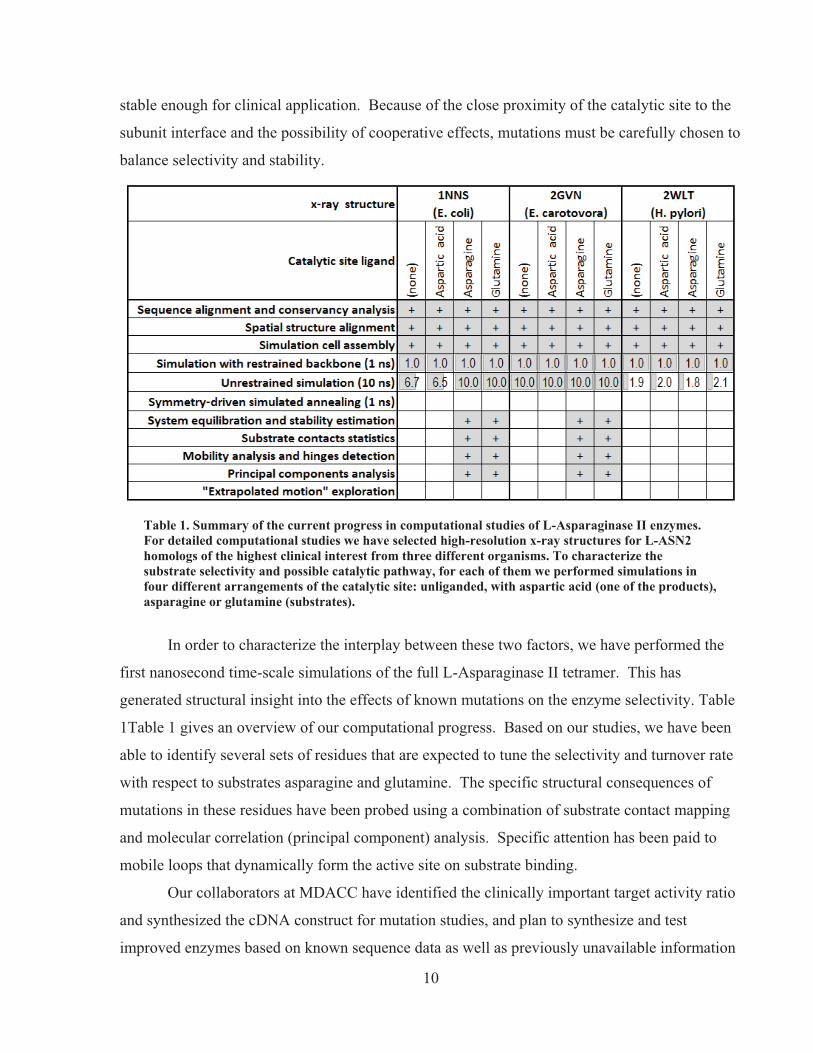
Table 1. Summary of the current progress in computational studies of L-Asparaginase II enzymes. For detailed computational studies we have selected high-resolution x-ray structures for L-ASN2 homologs of the highest clinical interest from three different organisms. To characterize the substrate selectivity and possible catalytic pathway, for each of them we performed simulations in four different arrangements of the catalytic site: unliganded, with aspartic acid (one of the products), asparagine or glutamine (substrates).
In order to characterize the interplay between these two factors, we have performed the
first nanosecond time-scale simulations of the full L-Asparaginase II tetramer. This has
generated structural insight into the effects of known mutations on the enzyme selectivity. Table
1Table 1 gives an overview of our computational progress. Based on our studies, we have been
able to identify several sets of residues that are expected to tune the selectivity and turnover rate
with respect to substrates asparagine and glutamine. The specific structural consequences of
mutations in these residues have been probed using a combination of substrate contact mapping
and molecular correlation (principal component) analysis. Specific attention has been paid to
mobile loops that dynamically form the active site on substrate binding.
Our collaborators at MDACC have identified the clinically important target activity ratio
and synthesized the cDNA construct for mutation studies, and plan to synthesize and test
improved enzymes based on known sequence data as well as previously unavailable information
11
on enzyme dynamics. By identifying and synthesizing mutated L-ASN2 enzymes with enhanced
selectivity for the desirable substrate, asparagine, instead of its toxic competitor, glutamine, we
expect to enhance asparaginase-based cancer treatment, especially lymphoblastic leukemia.
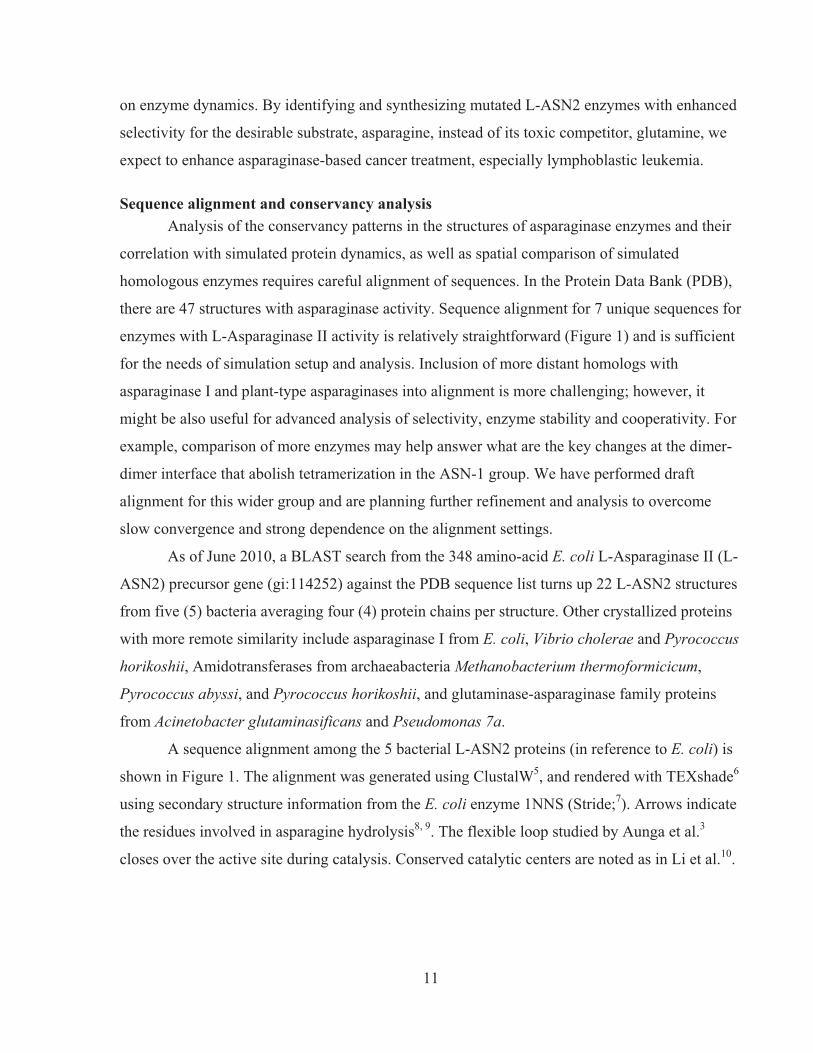
Sequence alignment and conservancy analysis Analysis of the conservancy patterns in the structures of asparaginase enzymes and their
correlation with simulated protein dynamics, as well as spatial comparison of simulated
homologous enzymes requires careful alignment of sequences. In the Protein Data Bank (PDB),
there are 47 structures with asparaginase activity. Sequence alignment for 7 unique sequences for
enzymes with L-Asparaginase II activity is relatively straightforward (Figure 1) and is sufficient
for the needs of simulation setup and analysis. Inclusion of more distant homologs with
asparaginase I and plant-type asparaginases into alignment is more challenging; however, it
might be also useful for advanced analysis of selectivity, enzyme stability and cooperativity. For
example, comparison of more enzymes may help answer what are the key changes at the dimer-
dimer interface that abolish tetramerization in the ASN-1 group. We have performed draft
alignment for this wider group and are planning further refinement and analysis to overcome
slow convergence and strong dependence on the alignment settings.
As of June 2010, a BLAST search from the 348 amino-acid E. coli L-Asparaginase II (L-
ASN2) precursor gene (gi:114252) against the PDB sequence list turns up 22 L-ASN2 structures
from five (5) bacteria averaging four (4) protein chains per structure. Other crystallized proteins
with more remote similarity include asparaginase I from E. coli, Vibrio cholerae and Pyrococcus
horikoshii, Amidotransferases from archaeabacteria Methanobacterium thermoformicicum,
Pyrococcus abyssi, and Pyrococcus horikoshii, and glutaminase-asparaginase family proteins
from Acinetobacter glutaminasificans and Pseudomonas 7a.
A sequence alignment among the 5 bacterial L-ASN2 proteins (in reference to E. coli) is
shown in Figure 1. The alignment was generated using ClustalW5, and rendered with TEXshade6
using secondary structure information from the E. coli enzyme 1NNS (Stride;7). Arrows indicate
the residues involved in asparagine hydrolysis8, 9. The flexible loop studied by Aunga et al.3
closes over the active site during catalysis. Conserved catalytic centers are noted as in Li et al.10.
12
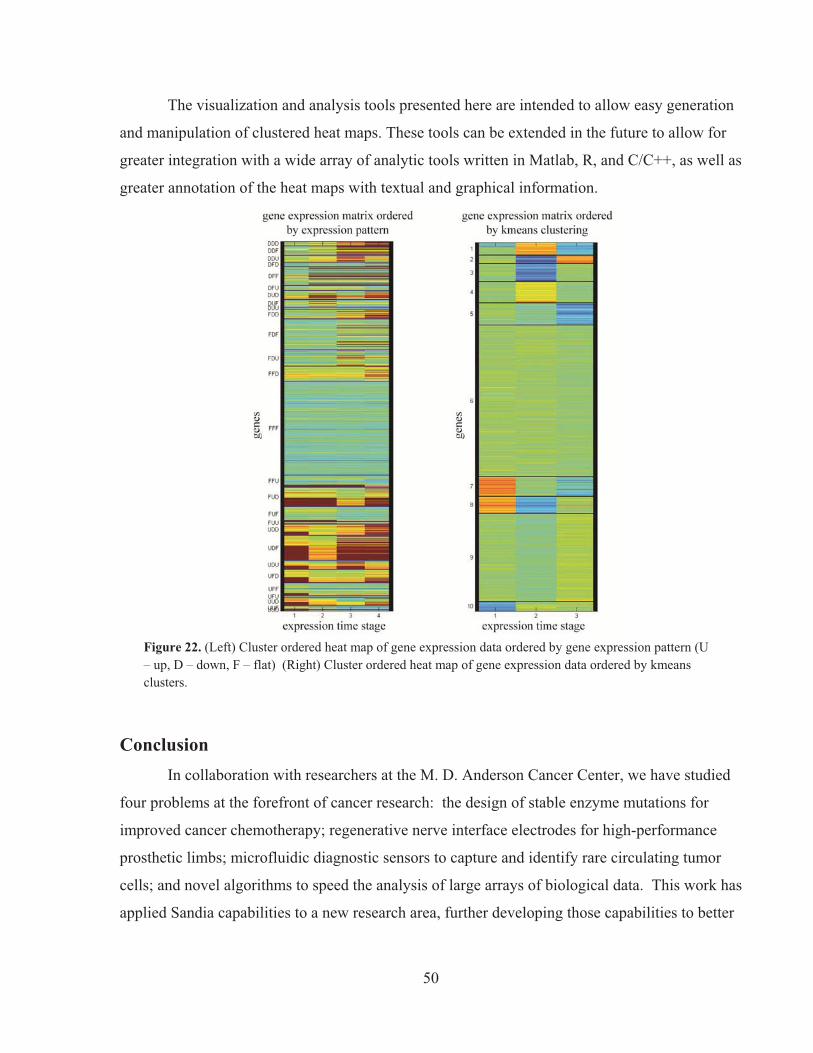
Figure 1. Sequence alignment of L-ASN2 proteins among: (A) Escherichia coli, (B) Erwinia chrysanthemi, (C) Erwinia carotovora, (D) Helicobacter pylori, and (E) Wolinella succinogenes. Amino acids in one-letter abbreviation are colored by sequence conservation.
13
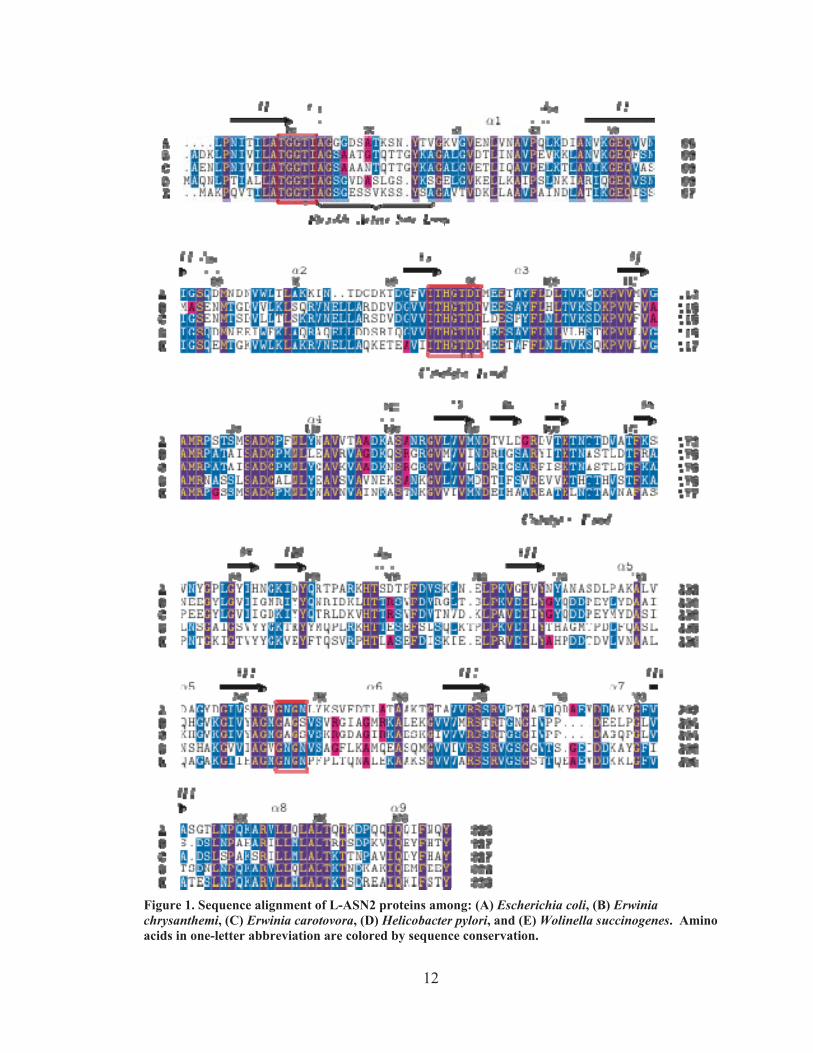
Table 2. List of 22 available crystallographic structures.
Detailed information on the individual structures is given in Table 2. All of the structures
are composed of four monomers with identical sequences. In addition, the sequences of the
Protein Data Bank structures are identical among each species with the exception of E. coli,
where several mutant structures are available. In particular, the 4ECA enzyme contains
mutations T12D and T89V, the 1HO3 enzyme contains Y25F, while 1JJA, 1IHD, and 1JAZ
enzymes all contain the D90E mutation.
Based on the hypothesis that the glutaminase activity of these enzymes contributes
significantly to observed treatment toxicity, structures selected from the above list for molecular
14
dynamics (MD) simulations should display a range of glutamine to asparagine activity ratios. In
order of decreasing glutaminase activity, the enzyme sequence is E. chrysanthemi (20%; 11), E.
coli (10%; ibid.; 12), H. pylori (0.7%; 13), E. carotovora (0.02%; 14), and W. succinogenes (0.0%; 15). Catalytically relevant substrate- and product-complexed structures are available for E. coli,
E. chrysanthemi, and E. carotovora structures. An advantage of higher resolution crystal
structures is that they are less likely to contain large regions of ambiguous, missing, or mis-
folded atomic coordinates, which would complicate MD equilibration protocols. We have
therefore chosen to simulate these L-Asparaginase II enzymes for molecular dynamics studies:
1NNS from E. coli, 2GVN from E. carotovora, and 2WLT from H. pylori.
Spatial alignment of structures The 22 L-Asparaginase II structures in the PDB database include both wild type and
mutant forms, some of the homologs were solved with several different ligands. Based on their
sequence alignment, we have performed spatial alignment for all 22 L-ASN2 structures.
For effective structural comparison and analysis of structural distinctions in specific
regions, it is essential to have certain quantification of spatial deviation per residue. We have
compiled a database with pairwise spatial alignment for all the combinations of the basic set of
structures based on four (4) sets of matching residues with increasing degree of conservancy
(progressively smaller subsets of residues): 1) all the sequence fragments that can be aligned
without gaps; 2) those that have similar properties (like LEU and ILE); 3) conservative; 4)
identical in all the sequences (about 200 pairwise alignments in total). This subdivision allows us
to quantify separately the deviations in the most conservative core and in the varying regions of
the proteins. In every case we have only used alpha-carbons for the spatial alignment.
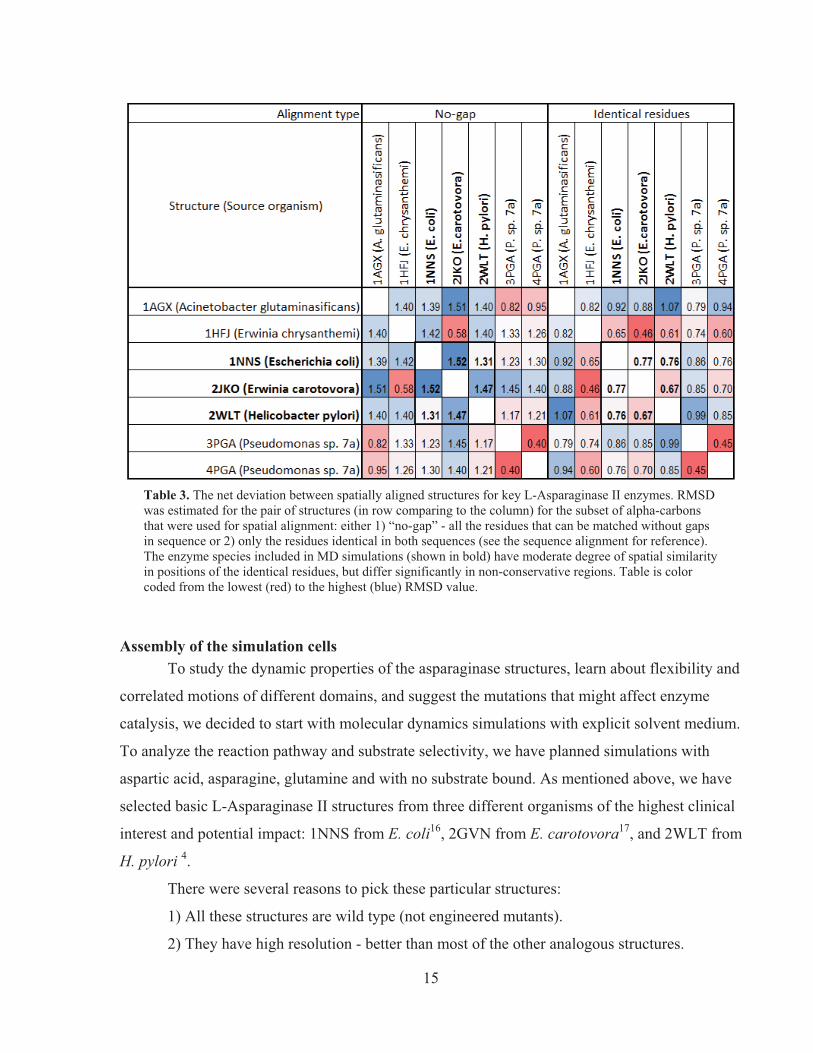
The calculated root mean square deviation (RMSD) values per residue are embedded into
the beta column of the PDB structures, which significantly facilitates visualization and
comparison. The net whole-structure deviation for the small set of key structures is presented in
the color-coded Table 3.
15
Table 3. The net deviation between spatially aligned structures for key L-Asparaginase II enzymes. RMSD was estimated for the pair of structures (in row comparing to the column) for the subset of alpha-carbons that were used for spatial alignment: either 1) “no-gap” - all the residues that can be matched without gaps in sequence or 2) only the residues identical in both sequences (see the sequence alignment for reference). The enzyme species included in MD simulations (shown in bold) have moderate degree of spatial similarity in positions of the identical residues, but differ significantly in non-conservative regions. Table is color coded from the lowest (red) to the highest (blue) RMSD value.
Assembly of the simulation cells To study the dynamic properties of the asparaginase structures, learn about flexibility and
correlated motions of different domains, and suggest the mutations that might affect enzyme
catalysis, we decided to start with molecular dynamics simulations with explicit solvent medium.
To analyze the reaction pathway and substrate selectivity, we have planned simulations with
aspartic acid, asparagine, glutamine and with no substrate bound. As mentioned above, we have
selected basic L-Asparaginase II structures from three different organisms of the highest clinical
interest and potential impact: 1NNS from E. coli16, 2GVN from E. carotovora17, and 2WLT from
H. pylori 4.
There were several reasons to pick these particular structures:
1) All these structures are wild type (not engineered mutants).
2) They have high resolution - better than most of the other analogous structures.
16
3) They all were originally solved with aspartic acid in the reaction center (not covalently
bound, just located there) and had significant amounts of structurally resolved water
molecules (~1000 per structure). Although we intended to simulate the enzymes with
different ligands, the original structure with glutamic acid was available only for E.
carotovora among our enzymes of interest, and non-liganded state only for E. carotovora
and D90E mutant of E. coli, but nothing for H. pylori. Therefore, for uniformity, we
chose to use the aspartic-acid structures as the templates for all of them.
4) These structures are complete compared to most of the other structures in the structural
database, which have some loops unresolved (up to ~20 residues). Modeling of partially
unresolved structures would be a challenging task with potential danger of affecting the
enzyme dynamics. Among our selected structures only H. pylori structure was missing
two residues (22 and 23), but those were on the external loop, without significant contact
with the rest of the protein. We have modeled them by homology to the same loop in E.
coli enzyme. The 1NNS structure is resolved starting from the very beginning of the
sequence, while the other two have the first two (2GVN) or four (2WLT) residues
missing (the truncated N-termini in those two cases were modeled as non-dissociated).
All three enzymes are resolved up to the very C-terminus.
In the simulation setup, we have preserved the structural water molecules and added the
necessary amount of water to fill a simulation size of 120x120x120 Å cubed (this provides ~ 25
Å padding between the mirror protein images, so that rotation and slight reshaping of the protein
will not result in inter-mirror contacts). The total system size is ~175 000 atoms. For each of the
structures, we have prepared four (4) variants - non-liganded, with aspartic acid, asparagine, and
glutamine. For the last two ligands, their positions were based on the location of the aspartic acid
in the crystal structures, with the side chain atoms modified as required. At this stage we decided
not to include an ammonium residue for the aspartic acid variant (keeping it similar to the crystal
structure and suggesting quick diffusion of the ammonia from the catalytic site); however, force
field parameters for the ammonium ion from the CHARMM biomolecular simulation software
are available for potential future use.
The simulated solvent medium contained NaCl salt in 143 mM concentration to
approximate an ionic strength in the medium used by our collaborators in experiments, similar to
physiological conditions of the blood plasma. For the given size of simulation cell, the expected
17
number of all other components of the experimental medium and the proper concentrations was
insignificant, often less than one molecule. L-Asparaginase II enzymes do not have known
strong selective dependence on any specific ions or other substances and can operate in a wide
range of solution pH values.
All the amino acids were modeled in their default ionization states. We have estimated
the dissociation state of the residues for the simulated structures using ProPKa program18 and
found that at that at physiological pH (7.4), the default ionization states would be the most
probable case.
MD simulations Molecular dynamics simulations have been performed using the High Performance
Computer Cluster (~1600 processors) at the University of Maryland, College Park. The available
resources allow simulation of about 8 nanoseconds a day per one system.
Simulations and analysis methods: All simulations were performed using NAMD219 with the CHARMM27 forcefield20 with
TIP3P water21, Particle-mesh Ewald22 method for long-range electrostatics estimation, 10 Å
cutoff for short-range electrostatic and van der Waals forces, and Langevin thermostat set at 310
K. All the simulations were performed in a flexible orthogonal periodic box at 1 atm pressure
(Langevin piston method). VMD [23] was used for visualization, molecular modifications, and
analysis using embedded Tcl language, providing flexible and convenient environment for
analysis of trajectories. Custom scripts were written for analysis of atomic contacts, spatial
fluctuations, Ramachandran angles fluctuations, and visualization of the results of Principal
Component Analysis.
We have first performed a 1 ns relaxing simulation with harmonically (1 kcal/mol/Å2)
restrained enzyme backbone (to adjust the medium to the enzyme and allow the ligands to
sample the space in the reaction center). For the next stage, 10 ns of unrestrained simulation are
in process for each one of the 12 systems (see Table 1 for details).
Estimation of equilibration and stability We have started our unrestrained simulations with 1NNS (E. coli) and 2GVN (E.
carotovora) enzymes with asparagine and glutamine as substrates. The exposure of the protein
surface to water (in 3 Å vicinity of the protein atoms) might serve as one of the measures of
18
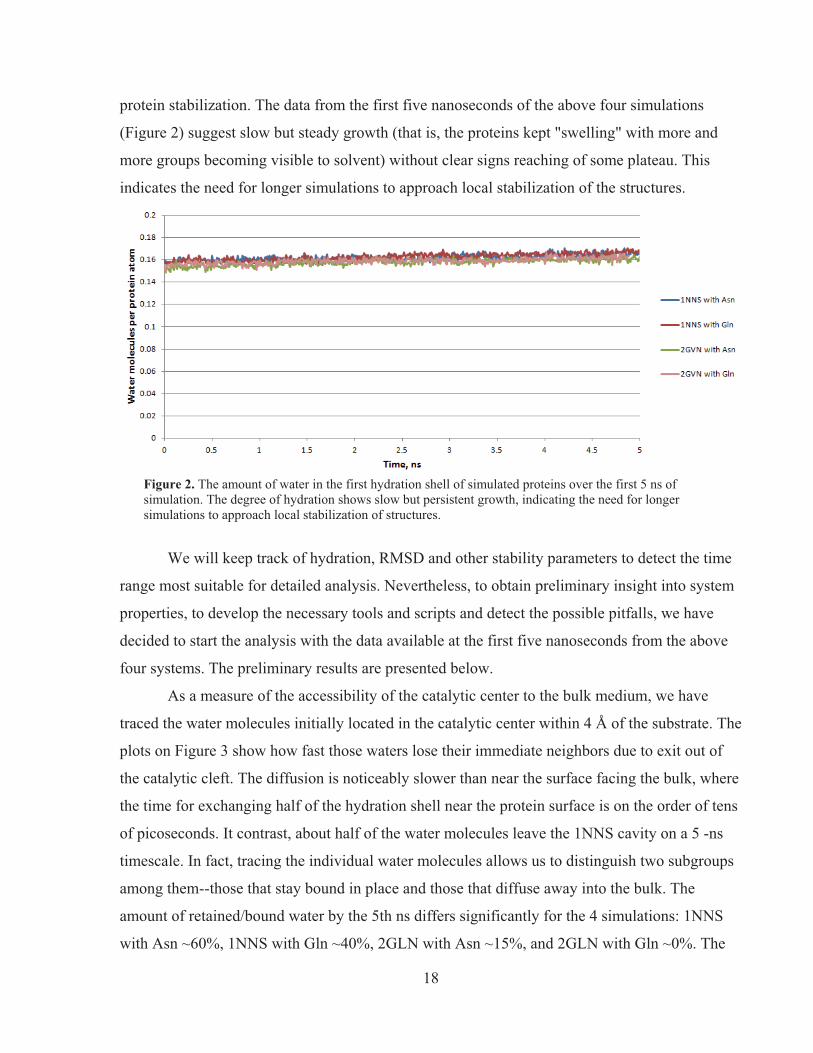
protein stabilization. The data from the first five nanoseconds of the above four simulations
(Figure 2) suggest slow but steady growth (that is, the proteins kept "swelling" with more and
more groups becoming visible to solvent) without clear signs reaching of some plateau. This
indicates the need for longer simulations to approach local stabilization of the structures.
Figure 2. The amount of water in the first hydration shell of simulated proteins over the first 5 ns of simulation. The degree of hydration shows slow but persistent growth, indicating the need for longer simulations to approach local stabilization of structures.
We will keep track of hydration, RMSD and other stability parameters to detect the time
range most suitable for detailed analysis. Nevertheless, to obtain preliminary insight into system
properties, to develop the necessary tools and scripts and detect the possible pitfalls, we have
decided to start the analysis with the data available at the first five nanoseconds from the above
four systems. The preliminary results are presented below.
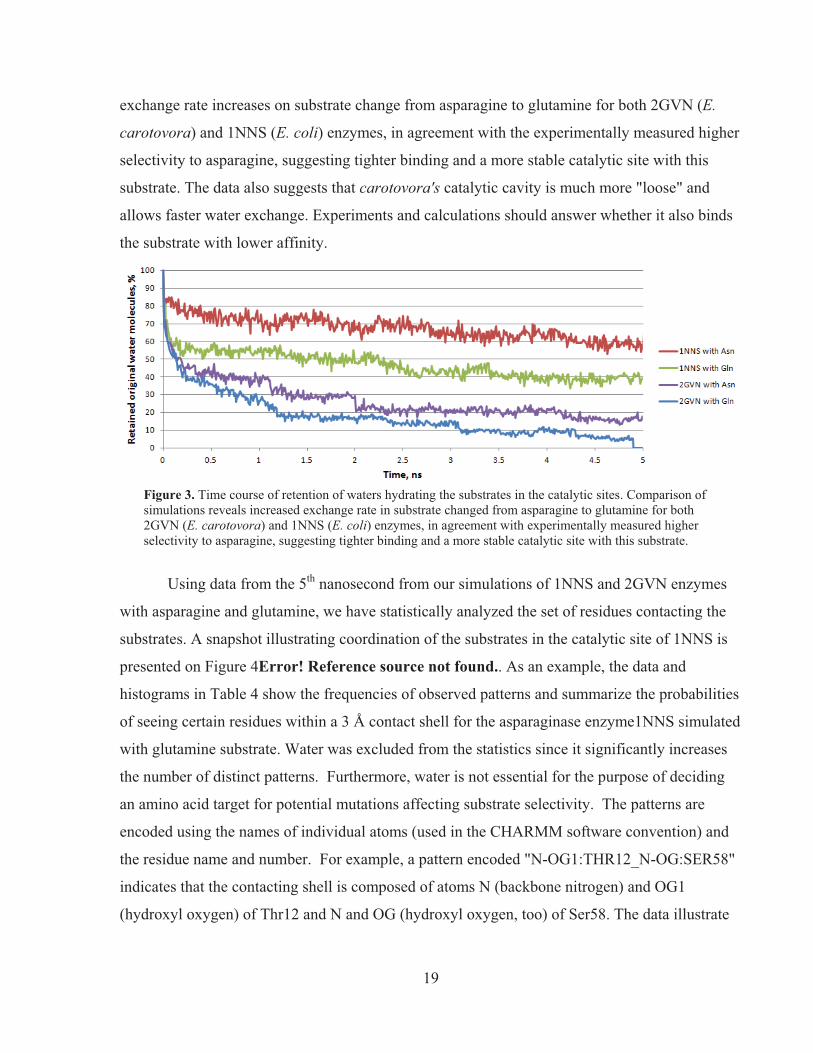
As a measure of the accessibility of the catalytic center to the bulk medium, we have
traced the water molecules initially located in the catalytic center within 4 Å of the substrate. The
plots on Figure 3 show how fast those waters lose their immediate neighbors due to exit out of
the catalytic cleft. The diffusion is noticeably slower than near the surface facing the bulk, where
the time for exchanging half of the hydration shell near the protein surface is on the order of tens
of picoseconds. It contrast, about half of the water molecules leave the 1NNS cavity on a 5 -ns
timescale. In fact, tracing the individual water molecules allows us to distinguish two subgroups
among them--those that stay bound in place and those that diffuse away into the bulk. The
amount of retained/bound water by the 5th ns differs significantly for the 4 simulations: 1NNS
with Asn ~60%, 1NNS with Gln ~40%, 2GLN with Asn ~15%, and 2GLN with Gln ~0%. The
19
exchange rate increases on substrate change from asparagine to glutamine for both 2GVN (E.
carotovora) and 1NNS (E. coli) enzymes, in agreement with the experimentally measured higher
selectivity to asparagine, suggesting tighter binding and a more stable catalytic site with this
substrate. The data also suggests that carotovora's catalytic cavity is much more "loose" and
allows faster water exchange. Experiments and calculations should answer whether it also binds
the substrate with lower affinity.
Figure 3. Time course of retention of waters hydrating the substrates in the catalytic sites. Comparison of simulations reveals increased exchange rate in substrate changed from asparagine to glutamine for both 2GVN (E. carotovora) and 1NNS (E. coli) enzymes, in agreement with experimentally measured higher selectivity to asparagine, suggesting tighter binding and a more stable catalytic site with this substrate.
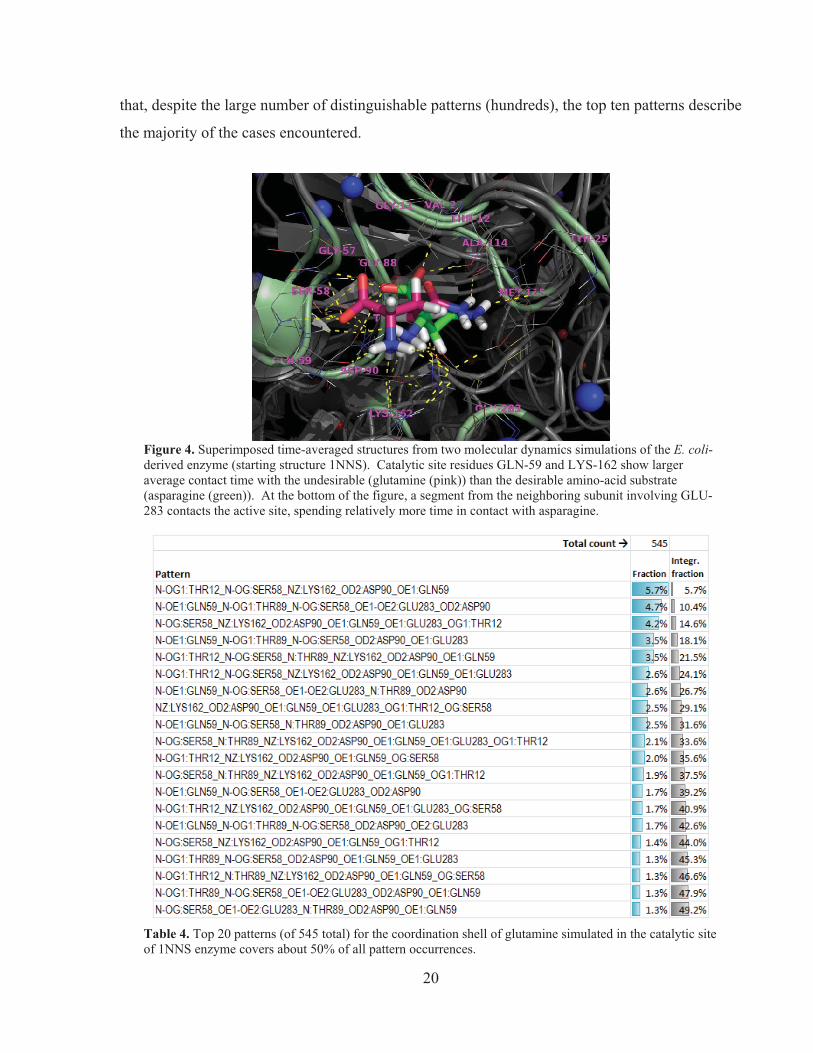
Using data from the 5th nanosecond from our simulations of 1NNS and 2GVN enzymes
with asparagine and glutamine, we have statistically analyzed the set of residues contacting the
substrates. A snapshot illustrating coordination of the substrates in the catalytic site of 1NNS is
presented on Figure 4Error! Reference source not found.. As an example, the data and
histograms in Table 4 show the frequencies of observed patterns and summarize the probabilities
of seeing certain residues within a 3 Å contact shell for the asparaginase enzyme1NNS simulated
with glutamine substrate. Water was excluded from the statistics since it significantly increases
the number of distinct patterns. Furthermore, water is not essential for the purpose of deciding
an amino acid target for potential mutations affecting substrate selectivity. The patterns are
encoded using the names of individual atoms (used in the CHARMM software convention) and
the residue name and number. For example, a pattern encoded "N-OG1:THR12_N-OG:SER58"
indicates that the contacting shell is composed of atoms N (backbone nitrogen) and OG1
(hydroxyl oxygen) of Thr12 and N and OG (hydroxyl oxygen, too) of Ser58. The data illustrate
20
that, despite the large number of distinguishable patterns (hundreds), the top ten patterns describe
the majority of the cases encountered.
Figure 4. Superimposed time-averaged structures from two molecular dynamics simulations of the E. coli-derived enzyme (starting structure 1NNS). Catalytic site residues GLN-59 and LYS-162 show larger average contact time with the undesirable (glutamine (pink)) than the desirable amino-acid substrate (asparagine (green)). At the bottom of the figure, a segment from the neighboring subunit involving GLU-283 contacts the active site, spending relatively more time in contact with asparagine.
Table 4. Top 20 patterns (of 545 total) for the coordination shell of glutamine simulated in the catalytic site of 1NNS enzyme covers about 50% of all pattern occurrences.
21
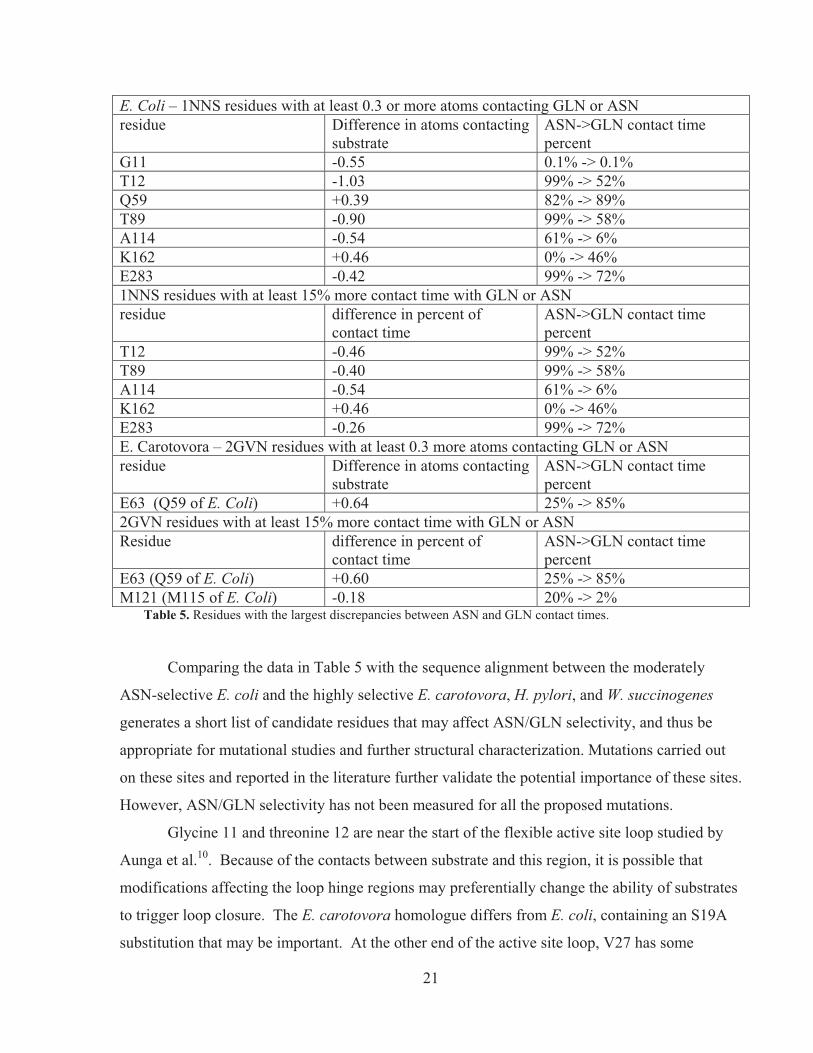
E. Coli – 1NNS residues with at least 0.3 or more atoms contacting GLN or ASN residue Difference in atoms contacting
substrate ASN->GLN contact time percent
G11 -0.55 0.1% -> 0.1% T12 -1.03 99% -> 52% Q59 +0.39 82% -> 89% T89 -0.90 99% -> 58% A114 -0.54 61% -> 6% K162 +0.46 0% -> 46% E283 -0.42 99% -> 72% 1NNS residues with at least 15% more contact time with GLN or ASN residue difference in percent of
contact time ASN->GLN contact time percent
T12 -0.46 99% -> 52% T89 -0.40 99% -> 58% A114 -0.54 61% -> 6% K162 +0.46 0% -> 46% E283 -0.26 99% -> 72% E. Carotovora – 2GVN residues with at least 0.3 more atoms contacting GLN or ASN residue Difference in atoms contacting
substrate ASN->GLN contact time percent
E63 (Q59 of E. Coli) +0.64 25% -> 85% 2GVN residues with at least 15% more contact time with GLN or ASN Residue difference in percent of
contact time ASN->GLN contact time percent
E63 (Q59 of E. Coli) +0.60 25% -> 85% M121 (M115 of E. Coli) -0.18 20% -> 2%
Table 5. Residues with the largest discrepancies between ASN and GLN contact times.
Comparing the data in Table 5 with the sequence alignment between the moderately
ASN-selective E. coli and the highly selective E. carotovora, H. pylori, and W. succinogenes
generates a short list of candidate residues that may affect ASN/GLN selectivity, and thus be
appropriate for mutational studies and further structural characterization. Mutations carried out
on these sites and reported in the literature further validate the potential importance of these sites.
However, ASN/GLN selectivity has not been measured for all the proposed mutations.
Glycine 11 and threonine 12 are near the start of the flexible active site loop studied by
Aunga et al.10. Because of the contacts between substrate and this region, it is possible that
modifications affecting the loop hinge regions may preferentially change the ability of substrates
to trigger loop closure. The E. carotovora homologue differs from E. coli, containing an S19A
substitution that may be important. At the other end of the active site loop, V27 has some
22
sequence heterogeneity that makes it a good candidate for mutations affecting loop closure
sterically through side-chain size.
Glycine 57 occurs in a turn connecting a beta sheet with an alpha helix whose C-terminal
end positions T89 and D90 of the catalytic triad. It forms a hydrogen bond with N248 of a
neighboring monomer, closing one side of the active site pocket. In light of its structural role in
positioning the catalytic triad and closing the active site, constraining the position of this residue
may have interesting effects on catalysis and selectivity. However, Derst, Henseling and Rohm8
tried substitutions of this residue with progressively larger hydrophobic residues alanine, valine,
and leucine and found that all decreased enzyme activity without significant effects on
selectivity.
The next two residues C-term to G57 have also been the subject of mutation studies.
Kozak and Jaskolski24 have changed S58 to T, V, and E and found no overall structural changes
(leaving selectivity changes unreported). Q59 to G, A, and E were attempted by Derst, Henseling
and Rohm8, where it was found that while all mutations reduced overall activity, reduction in
size decreased glutamine activity more than asparagine – indicating its important role in efficient
substrate binding.
Lysine 162 is important for binding to and stabilizing the negatively charged substrate
carbonyl group. Because our MD simulations showed differences in preferred rotation (c1
angle) of the substrate backbone with minor changes in the side-chain orientation, mutations of
K162 to alternate basic residues asparagine or histidine may be useful in tuning substrate
specificity through their equilibrium binding energy and bound conformational preferences.
It is interesting that the E. coli enzyme showed a decreased contact of Glutamine 283
with GLN as compared to ASN substrates. This residue is part of a large segment forming a
loop reaching across sub-units that was difficult to align between E. coli and E. carotovora
enzymes. Notice the sequence similarity between E. coli 281DAEV and E. carotovora
287DAGQ. Structurally, these pieces should occupy similar positions, and homologous
segments are indeed shown adjacent in the alignment of Derst et al.8. However, the sequence
alignment must necessarily place E. carotovora’s 287DAGQ either with 281 or later, starting at
E. coli’s 285 (as shown in the sequence alignment of Figure 1). In MD simulations, this loop
was seen to stabilize the bound conformer by interaction with NH3+. Asparagine 248, studied
extensively by Derst et al.8, folds near this same position and proved to be influential in
23
determining relative substrate activity. The shorter segments present in E. carotovora and E.
chrysanthemi should be expected to decrease binding site stability while simultaneously serving
as a critical determinant of substrate selectivity.
Important insight into the problem could be provided by removing a segment from E. coli
while attempting to maintain the overall fold by replacing this complete segment with the
corresponding sequence from E. carotovora (e.g. V273--T296 -> E. carotovora T279--S298).
Besides the possibility for inter-subunit contact stability and substrate selectivity, Moola
et al.25 identified residues 282-292 as being part of an immunodominant epitope, indicating its
possible role in acquired enzyme resistance and toxcicity. Just inside this epitope, several
mutations of glutamine 283 were noted by Derst et al.8.
This basic analysis of enzyme hot spots has lead to the identification of several residues
that may modify loops forming the active site. Experimental work may be immediately carried
out to test the relative importance of sites, and computation should analyze the contribution of
each residue to the positioning, stability, and reactivity of alternate substrates. These two
approaches combined will lead to a comprehensive description of how to tune structure/function
relationships for this enzyme.
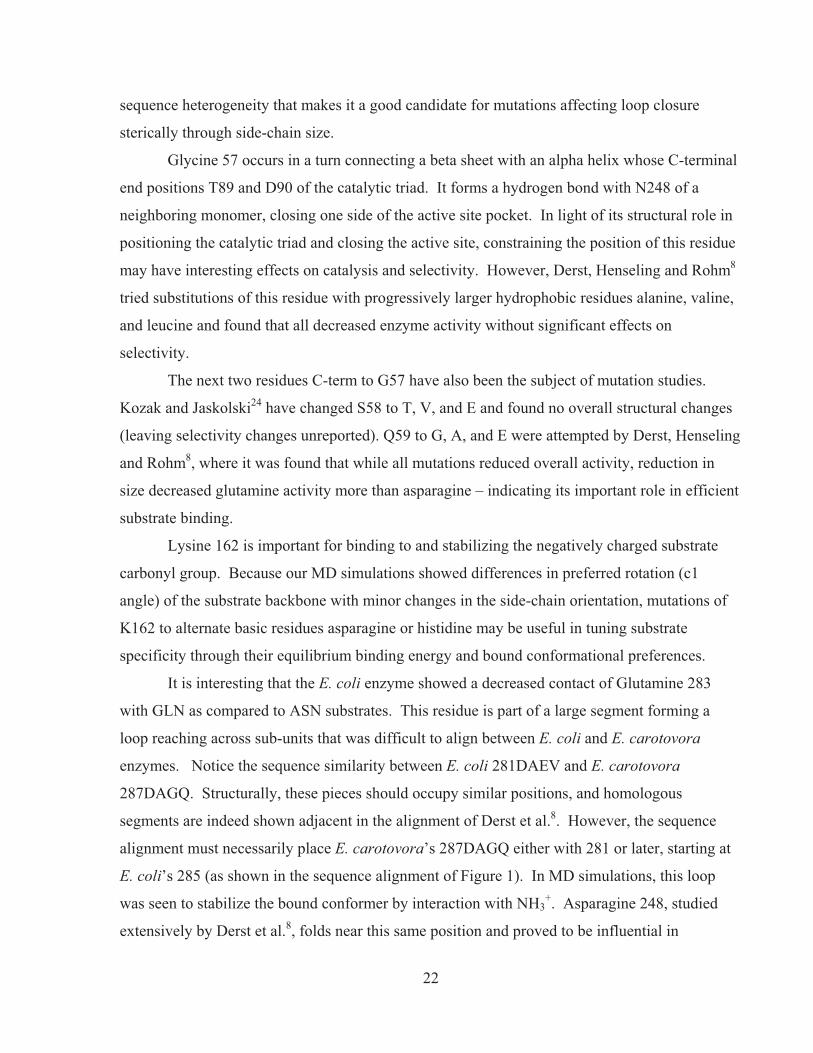
Mobility analysis and detection of catalytic loop hinges Experimental data suggest that the catalytic cycle in asparaginases might involve critical
conformational changes, including relocation of the loop (controlling the accessibility of the
catalytic site to the bulk media) and long-range domain rearrangements (underlying inter-
monomer cooperativity at certain conditions). An important insight into the conformational
changes during the catalysis and the key residues essential for the dynamics might be provided
by analysis of the mobility of atomic groups. It also often occurs that a relatively “solid” domain
is connected to another part of the protein by a flexible “hinge” enabling the rotation around it
and therefore capable of affecting the domain motion in the case of proper mutations. However,
the straightforward analysis of deviation in spatial coordinates will highlight the most distant
parts of the moving domain rather than the hinge itself. Thus to complement the RMSF (root
mean square fluctuations) analysis, the estimation in variability in torsion Ramachandran angles
can be used since it determines rotation of residues relative to each other. An illustration of this
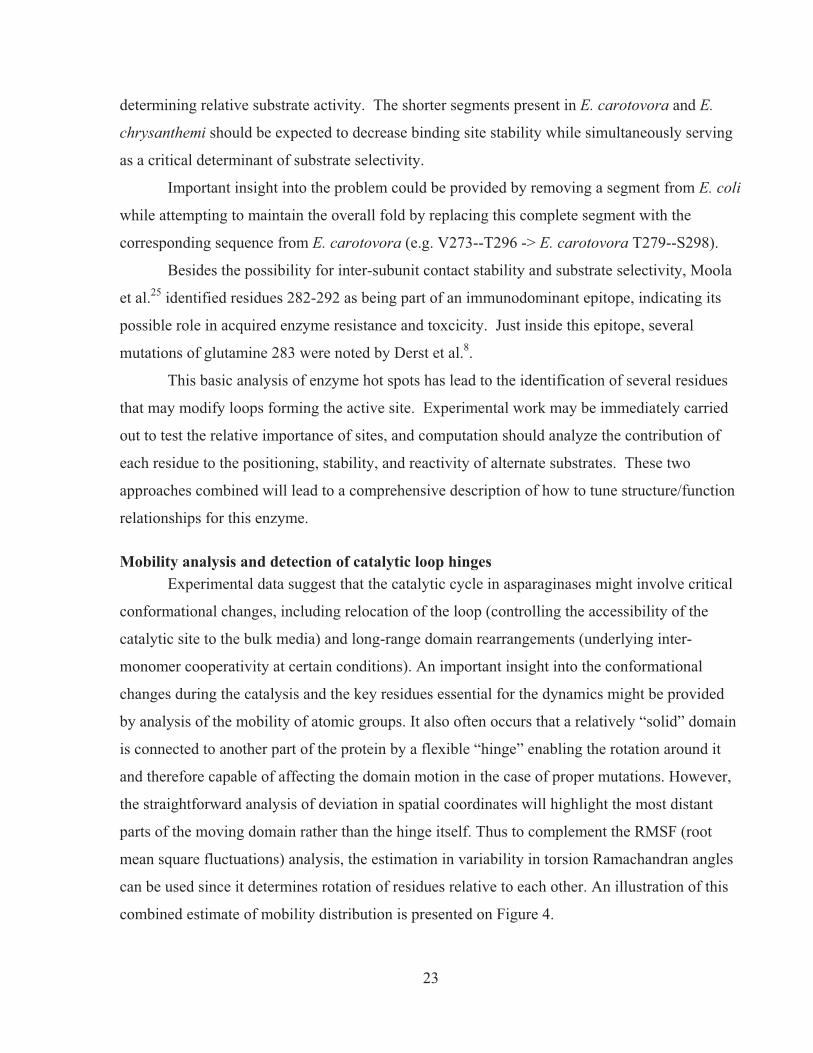
combined estimate of mobility distribution is presented on Figure 4.
24
It is notable that the distribution of RMSF in simulations (B) closely resembles the
distribution of the temperature factor in x-ray crystals (A); however, the analysis of fluctuations
in Ramachandran angles provides distinct information that can’t be readily available from the
“still” structure. The most probable hinge would be a residue with high Ramachandran angle
standard deviation and located next to the domain with high mobility. For simulations of 1NNS
structure with glutamine, those hinge residues in the loop controlling the accessibility of the
catalytic site are G16, G17, S23 and N24.
Comparison of the combined mobility data for simulations with different substrates
allows us to highlight the differences and suggest ways to bias the mobility pattern toward an
“asparagine type” through enzyme engineering.
Figure 4. Mobility and “hinge” function of the residues in the vicinity of the catalytic site of 1NNS (E. coli) enzyme simulated with glutamine. The substrate is shown as van der Waals spheres (carbon yellow, nitrogen blue, oxygen red). The distribution of the temperature factor from the 1NNS x-ray structure (A; blue –small, red -high) over the protein backbone (thin tube) is remarkably similar to the mobility in MD simulations estimated as RMSF averaged over the 5th nanosecond of unrestrained simulation (B). However the pattern of standard deviation in Ramachandran angles calculated over the same time period (C) noticeably differs from the beta-factor distribution in the crystal structure (A) and mobility (B). Alpha-carbons of the residues with the highest variance in Ramachandran angles (shown as small spheres (A, C)) can be considered as “hinges” if they flank a significant segment of the protein with high mobility and can serve as effective mutagenesis targets for controlling protein dynamics and catalysis rate (e.g. residues G16, G17, S23, N24 on panel B). (D) Comparison of simulations with glutamine as substrate to asparagine simulations reveals changes in mobility (tube coloring, blue – decrease, red - increase) and the hinge function (sphere coloring).
25
Besides the total RMSF value per residue and average Ramachandran angles fluctuation,
we have also estimated more detailed RMSF distributions between individual atoms and,
separately, between torsion angles phi and psi. These can be used in future analysis in
combination with data derived from Principal Component Analysis.
Principal component analysis Molecular dynamics simulations are able to predict molecular motions on the nanosecond
timescale; however, typically it is challenging to reach conclusions about physiologically
relevant protein motions because of two fundamental obstacles: 1) the limited time of
simulations, often a few orders of magnitude shorter than the real protein dynamics; and 2) the
necessity of manually evaluating the suitability of data from multiple mutants and limited
development of large-scale analysis tools. However, using current technology it is possible to
carry out statistical analysis of correlations in atomic motions based on eigenvalue
decomposition, which helps to alleviate these problems and reveal essential protein motions that
may represent segments of slower large-scale transitions. Principal component analysis (PCA)
was successfully applied to the analysis of numerous molecular systems, including enzymes26, 27,
28.
For the first PCA stage, we have selected the trajectories of E. coli and E. carotovora
enzymes simulated with asparagine and glutamine. The coordinates of all the alpha-carbons were
collected in the timespan between the 4th and 5th nanosecond of simulation with a 1 ps time step
and analyzed using routines from the biomolecular simulation software GROMACS 3.129: the
routine g_covar was used for calculation of correlation matrices and eigenvalue decomposition,
and g_anaeig for estimation of the projections of the trajectories onto the top ten eigenvectors.
Considering that ASN-2 is a homo-tetramer and that all subunits in the starting crystal structures
were resolved in nearly identical conformations, the 10-ns trajectories were processed in two
different ways. The first method considered the entire tetramer with different subunits as
different entities and the first ten modes reflected primarily the motions of one subunit relative to
another and a number of disconcerted motions inside each of the subunits. The second method
allowed us to consider each of the subunits as “interchangeable” entities and treat the enzyme
essentially as a monomer. The structures of four subunits were aligned in space and their
trajectories were concatenated as if they occurred sequentially in time. The rationale for the
second approach was the assumption that each subunit independently explores its own
26
conformational space and sequential analysis of trajectories, besides its computational efficiency,
would provide a better sampling of accessible conformations. The capability of the existing
software and the flexibility of alignment schemes allow us to focus our analysis on specific
regions of subunits, particularly on the active site of the enzyme. The second method allows
much greater conformational sampling, since the limited movements of individual sub-units are
referenced to the conformation space spanned by the complete set of monomers. Comparison of
samples taken on all subunits along the simulation trajectory is thus better suited to studying
slower motions observed on the multi-nanosecond timescale.
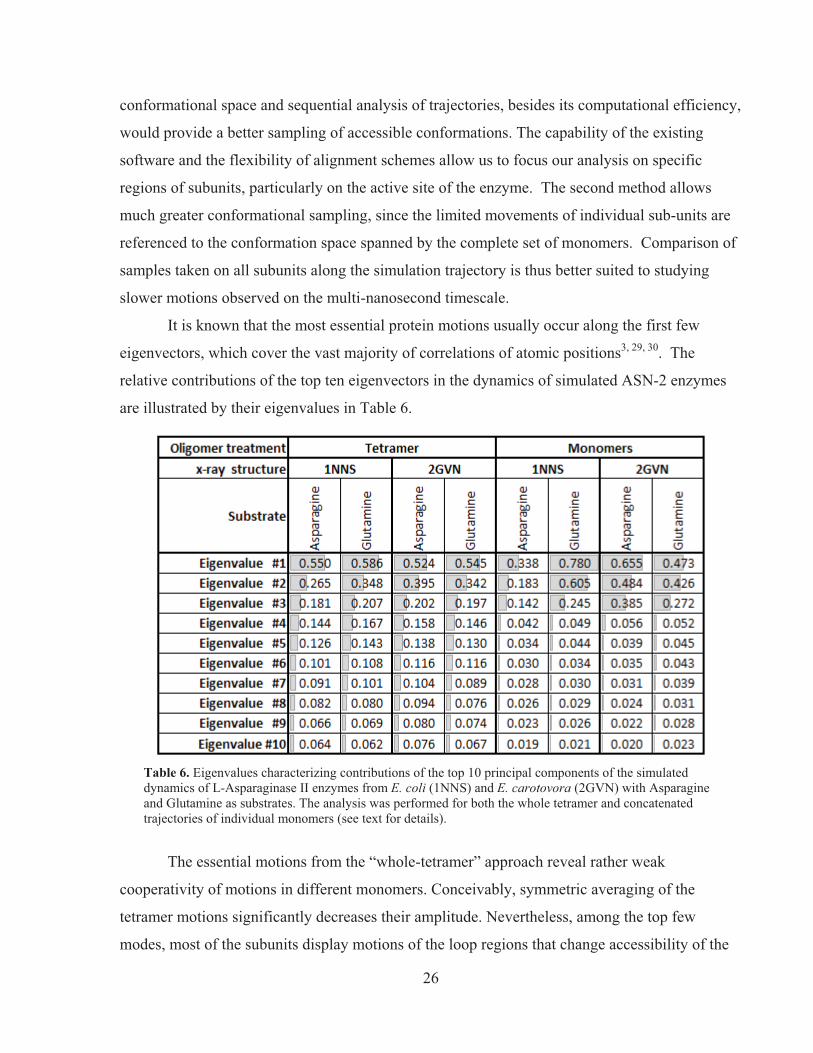
It is known that the most essential protein motions usually occur along the first few
eigenvectors, which cover the vast majority of correlations of atomic positions3, 29, 30. The
relative contributions of the top ten eigenvectors in the dynamics of simulated ASN-2 enzymes
are illustrated by their eigenvalues in Table 6.
Table 6. Eigenvalues characterizing contributions of the top 10 principal components of the simulated dynamics of L-Asparaginase II enzymes from E. coli (1NNS) and E. carotovora (2GVN) with Asparagine and Glutamine as substrates. The analysis was performed for both the whole tetramer and concatenated trajectories of individual monomers (see text for details).
The essential motions from the “whole-tetramer” approach reveal rather weak
cooperativity of motions in different monomers. Conceivably, symmetric averaging of the
tetramer motions significantly decreases their amplitude. Nevertheless, among the top few
modes, most of the subunits display motions of the loop regions that change accessibility of the
27
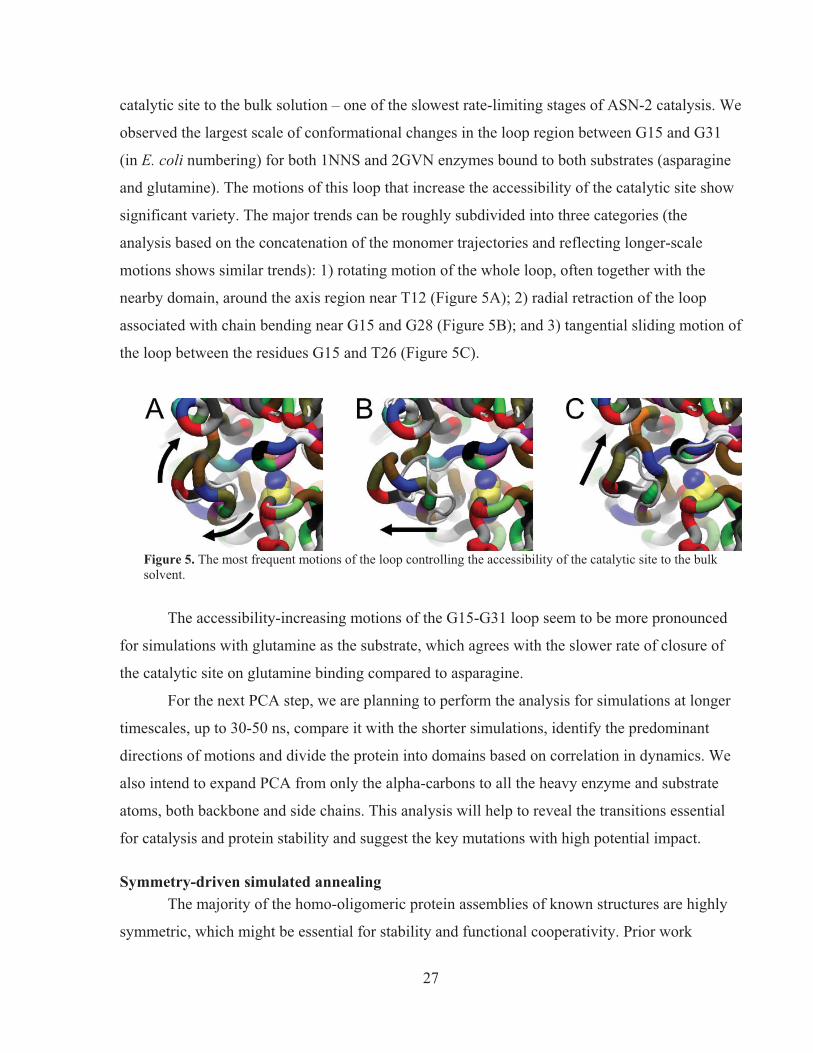
catalytic site to the bulk solution – one of the slowest rate-limiting stages of ASN-2 catalysis. We
observed the largest scale of conformational changes in the loop region between G15 and G31
(in E. coli numbering) for both 1NNS and 2GVN enzymes bound to both substrates (asparagine
and glutamine). The motions of this loop that increase the accessibility of the catalytic site show
significant variety. The major trends can be roughly subdivided into three categories (the
analysis based on the concatenation of the monomer trajectories and reflecting longer-scale
motions shows similar trends): 1) rotating motion of the whole loop, often together with the
nearby domain, around the axis region near T12 (Figure 5A); 2) radial retraction of the loop
associated with chain bending near G15 and G28 (Figure 5B); and 3) tangential sliding motion of
the loop between the residues G15 and T26 (Figure 5C).
Figure 5. The most frequent motions of the loop controlling the accessibility of the catalytic site to the bulk solvent.
The accessibility-increasing motions of the G15-G31 loop seem to be more pronounced
for simulations with glutamine as the substrate, which agrees with the slower rate of closure of
the catalytic site on glutamine binding compared to asparagine.
For the next PCA step, we are planning to perform the analysis for simulations at longer
timescales, up to 30-50 ns, compare it with the shorter simulations, identify the predominant
directions of motions and divide the protein into domains based on correlation in dynamics. We
also intend to expand PCA from only the alpha-carbons to all the heavy enzyme and substrate
atoms, both backbone and side chains. This analysis will help to reveal the transitions essential
for catalysis and protein stability and suggest the key mutations with high potential impact.
Symmetry-driven simulated annealing The majority of the homo-oligomeric protein assemblies of known structures are highly
symmetric, which might be essential for stability and functional cooperativity. Prior work
28
showed that slow application of symmetry restraints with increasing ‘stiffness’ is an effective
procedure for refinement of multimeric protein structures in molecular dynamics simulations30.
On completion of the planned unrestrained simulations described above, we intend to perform 1
ns symmetry-driven simulated annealings for the key structures to refine them and reveal the
predominant structural rearrangements that distinguish structures with different bound substrates.
This is especially important for simulations of the 2GVN enzyme, which shows higher
variability in position and orientation of the substrates between different subunits. For this
enzyme, annealing might drive convergence of the system to a more stable and probable
configuration. We have already prepared and tested all the scripts enabling annealing for this
type of symmetry.
Exploration of conformational space using the “Extrapolated Motion” protocol From published experimental studies of the asparaginase enzyme kinetics, it is clear that
certain stages of the catalytic cycle likely occur on a millisecond timescale, which exceeds the
MD-accessible range by several orders of magnitude and might involve large-scale protein
motions. Although PCA suggested the principal dynamic components, there is a need to follow
the PCA-suggested directions of motions and further explore the conformational space. The
“extrapolated motion” protocol for MD simulations is one of the techniques to explore slower
protein motions based on recursive cycles of small structural displacements, energy
minimizations and short relaxing MD simulations. It was successfully used to study the
dynamics of the mechanosensitive channel MscS occurring on the timescale up to seconds and
the computational predictions were supported by experimental testing31, 32, 33. We intend to use
this approach in three modes: 1) to propagate the motions predicted by PCA (we will test the first
10 principal modes, ten independent runs for each); 2) to study ASN-2 dynamics initiated by
amplified spontaneous thermal fluctuations; and 3) to introduce random steered distortions of
different scales into ASN-2 structures, with subsequent unrestrained MD simulations to
overcome the principal energy barriers and follow the relaxation pathways. The results of the
conformational space exploration, together with the published experimental data on the catalytic
mechanism, will be used to reveal the residues essential for the large-scale dynamics and
stability and suggest ways to control them through site-directed mutagenesis.
29
Discussion We have performed the first nanosecond time-scale simulations of the full L-ASN2
tetramer, and our collaborators are in position to synthesize and test improved enzymes based on
known sequence data as well as previously unavailable information on enzyme dynamics. Our
initial funding period has provided us with preliminary hypotheses for mutations that will
increase L-ASN2 selectivity as well as structural insight into tetramer stability. Key mutation
sites were identified based on residues with high probability for contacting the unwanted
glutamine, but not the required asparagine substrate. Additional mutation sites have been
identified on a flexible surface loop forming the active site on substrate binding. Further analysis
of this data to pinpoint the loop hinge regions and dynamics in the presence of glutamine and
asparagine are underway. Our MDACC collaborators have produced the E. coli cDNA construct
and preliminary mutational screening experimental design.
It will take 2-5 months to computationally probe the details of the enzyme catalytic cycle
(previously inferred from static structural and experimental studies) in order to prepare a
manuscript for publication. Meanwhile, our initial structural data is sufficient for our MDACC
collaborators to synthesize and test the first set of mutants with altered substrate coordination (1-
2 months).
Further research should aim to provide a more thorough structural and energetic basis for
the involvement of key residues, including the flexible active site loop, in the enzyme catalytic
cycle. Combining this structural data with glutaminase and asparaginase activity assays to be
carried out at MDACC and experimental thermodynamic analysis of substrate/product binding at
UMD will produce a comprehensive model for controlling enzyme function.
Compliant Materials for Regenerative Nerve Interfaces
Target system level specifications The feasibility of a peripheral nerve interface structured as proposed was studied in
detail. The relevant literature was explored to derive requirements to serve as targets for
development. Our intent is to develop nerve interfaces through which transected nerves may
grow, such that small groups of neurons come into close contact with electrode sites, each of
which is connected to electronics external to the interface. These interfaces must be physically
structured to allow neurons to grow through them, either by being porous or by including
30
specific channels for the nerves. They must be mechanically compatible with nerves such that
they promote growth and do not harm the nervous system, and biocompatible to promote neuron
growth and to allow close integration with biological tissue. They must exhibit selective and
structured conductivity to allow the connection of electrode sites with external circuitry, and
electrical properties must be tuned to enable the transmission of neural signals. Finally, the
interfaces must be capable of being physically connected to external circuitry, e.g. through
attached wires.
The geometry required for optimal nerve growth is somewhat unclear and is a subject
intended for in vivo experiments to be conducted by collaborators at the MDACC. Holes or
pores must be large enough to allow neurons to grow through, but small enough to enable
interfacing with neurons with tight spatial resolution. While we have not seen reports of groups
growing nerves directly through porous structures, at least one group used a tubular electrospun
scaffold consisting of walls with fibers ranging from 300 nm to 8 �m and pores varying from
700 nm to 20 �m34. While the nerve predominately grew through a 500 �m central tube, some
outgrowth was seen through the walls. Therefore pores on the order of tens of μm should offer a
reasonable starting point.
Although the optimal mechanical properties for regenerative peripheral nerve interfaces
are unknown and require thorough study, previous designs that encouraged neuron growth
through holes in rigid materials (e.g., silicon) caused a significant negative impact on the health
of the nerve over time35. As the neurons grew they experienced increasing pressure from the
rigid orifices, ultimately resulting in neuron death. Therefore one possible design target is to
make interfaces out of materials that have mechanical properties similar to those of neurons.
Although there is a potentially wide variation across different types of nerves, the literature
suggests that nerves behave viscoelastically and have elastic moduli of tens to hundreds of kPa36, 37. Proper stiffness could be achieved by manipulating both the material properties and structural
geometry of a neural interface.
Whether used for neural stimulation or recording, impedance at electrode sites must be
low. For recording, the literature suggests site impedance on the order of 100 kOhm to 1 MOhm,
with lower being preferable. Site size is generally several thousand �m2 or less38. For
stimulation, the site acts as a current source, and charge injection capacity is critical and typically
varies widely between several �C/cm2 and several mC/cm2 38. Site impedance must be low
31
enough to output adequate charge without voltage exceeding the electrolysis threshold (around
1.2 V). Impedance is typically measured at the biologically-relevant frequency of 1 kHz.
Conductors should have impedance several orders of magnitude lower than the electrode sites in
order to transmit the signals without distortion. They must also have minimal capacitance so as
not to filter signals with content into at least the tens of kHz. Ideally, cutoff frequencies would be
in the hundreds of kHz or beyond.
Development and experimentation was conducted in several areas to test the feasibility of
using certain materials and processes to meet these requirements. Where noted, work is ongoing
and only preliminary results are available.
Polymer fabrication The initial development conducted as part of this project focused on several known
polymer systems and techniques considered potentially suitable for this application. Expert
medical collaborators suggested an initial focus on polydimethylsiloxane (PDMS) based polymer
systems for potential use as implantable neural interface materials. PDMS and similar polymers
are widely used for biomedical and implantable applications and generally exhibit a high degree
of biocompatibility. The mechanical properties of PDMS can be made similar to those of many
biological tissues, and we hypothesized that loading PDMS with some volume fraction of multi-
walled carbon nanotubes (MWCNTs) would make the composite material electrically conductive
while preserving the favorable mechanical and biocompatible properties of the base polymer.
Key considerations included achieving high surface area and a porous structure to enable
integration with the nerve, biocompatibility and electrical conductivity. Research was conducted
in all of these areas.
Electrospinning was identified as a promising method to produce samples with porous
and adjustable geometry. Recently Kim et al. demonstrated the use of a sol-gel method to
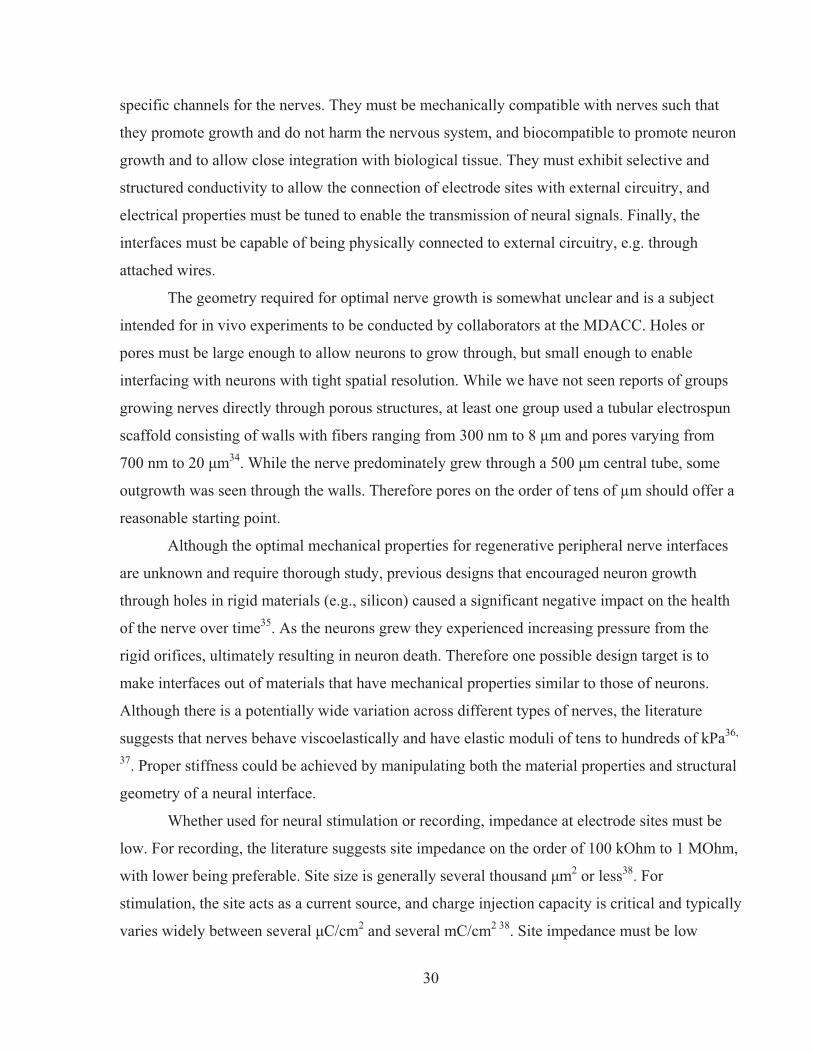
produce electrospun PDMS fibers39. We successfully reproduced the work of Kim as shown in
Figure 7. Briefly, silanol terminated PDMS (DMS-S27, Gelest) was condensed with tetraethyl
orthosilicate (TEOS) using an acidic catalyst (nitric acid) in a THF solution at 80 °C for 40 min.
The viscous solution was then diluted using THF to produce a solution of PDMS in THF (15%,
w/w). The solution was delivered at a constant rate, 15 mL/hr, via a syringe pump (KD scientific,
model 100s); through a 2 mL plastic syringe (inner diameter = 4.64 mm) fitted with a 1.5 inch
20 gauge stainless steel blunt tip needle (Small Parts, Inc.). The needle was charged at 20 kV
32
through a high voltage supply (Glassman High Voltage, Inc. Series EL), and the resulting
polymer fibers were collected on a grounded target (6x6 in2 Cu plate fitted with Al foil) at a
distance of 20 cm from the end of the tip. All PDMS films fabricated in this way were adhered to
Al foil.
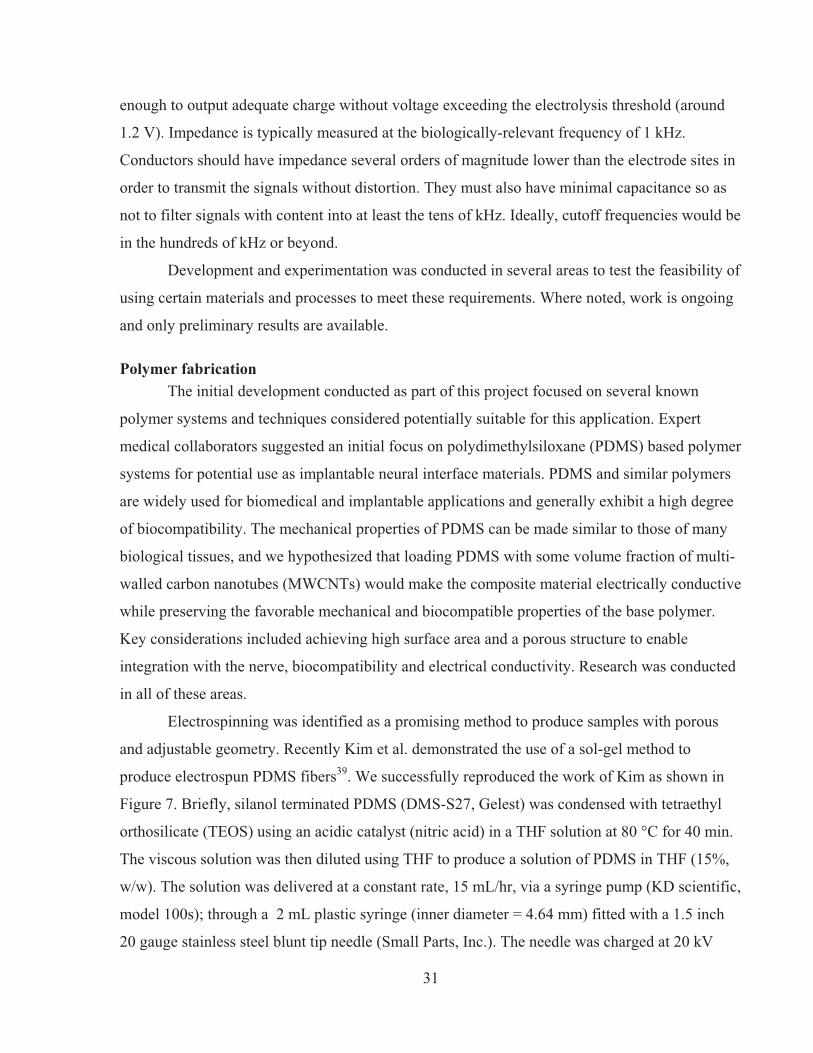
The electrospinning process was repeated using MWCNT fillers at two loadings (1% and
25% (w/w)) to create electrospun fiber mats. Due to the viscosity increase of the solution,
containing 1% mass loading of MWCNTs the fibers deposited in a circle as seen in Figure 8.
Higher mass loadings of MWCNTs did not exhibit the previously observed unusual deposition
pattern.
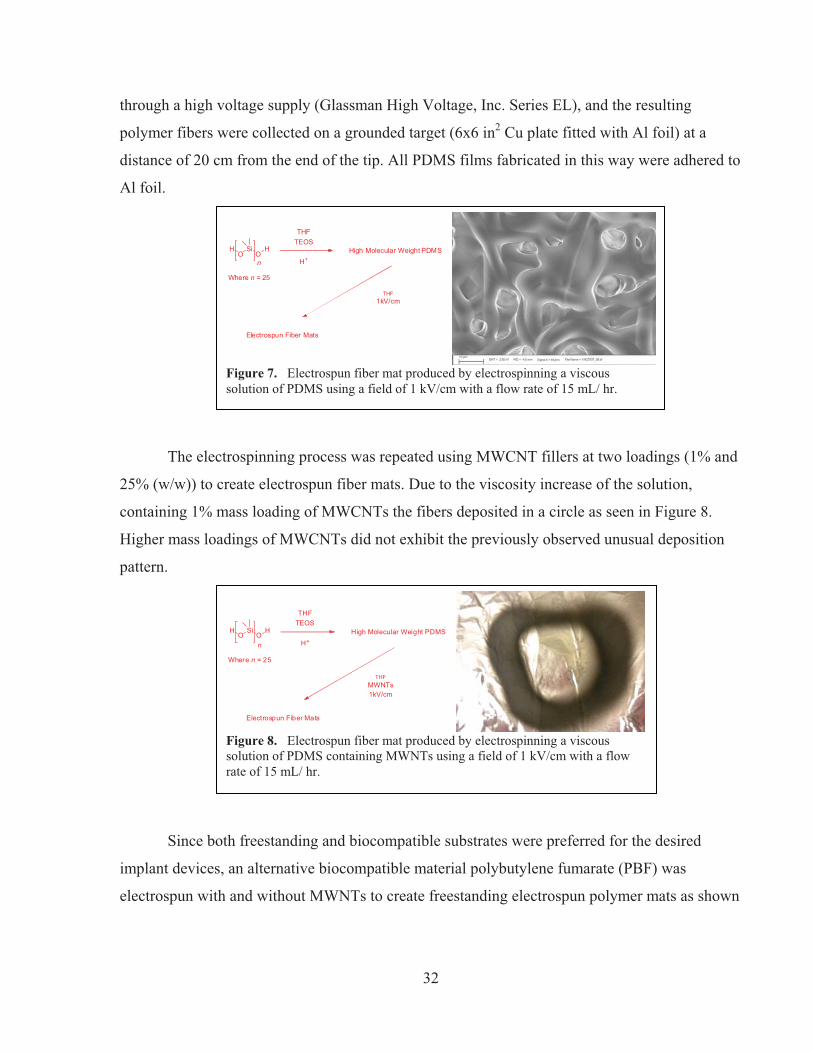
Since both freestanding and biocompatible substrates were preferred for the desired
implant devices, an alternative biocompatible material polybutylene fumarate (PBF) was
electrospun with and without MWNTs to create freestanding electrospun polymer mats as shown
OSi
OHH
n
THFTEOS
H+High Molecular Weight PDMS
Where n = 25
THFMWNTs1kV/cm
Electrospun Fiber Mats
Figure 8. Electrospun fiber mat produced by electrospinning a viscous solution of PDMS containing MWNTs using a field of 1 kV/cm with a flow rate of 15 mL/ hr.
OSi
OHH
n
THFTEOS
H+High Molecular Weight PDMS
Where n = 25
THF1kV/cm
Electrospun Fiber Mats
Figure 7. Electrospun fiber mat produced by electrospinning a viscous solution of PDMS using a field of 1 kV/cm with a flow rate of 15 mL/ hr.
33
in Figure 9 along with the synthesis. Two separate methods have been used to synthesize PBF,
which have both been recently reported by our laboratory40.
PBF was synthesized through the ring opening of maleic anhydride with butane diol (BD)
followed by the step growth condensation polymerization of the �-carboxylic acid-�-hydroxyl
compound (Method A) or the polymerization of BD and diethyl fumarate (DEF) using zinc
chloride (ZnCl2) as a catalyst (Method B). The polymerization PBF synthesized according to
Method A was carried out at high temperature, ~150-200°C in order to isomerize the maleate
functionality to the energetically more stable fumarate functionality (Figure 9). PBF synthesized
through Method B, was prepared using conditions previously reported in the synthesis of poly
(propylene fumarate) (PPF) by Kasper et al41. Briefly, the diethyl fumarate was transesterified
using BD at an elevated temperature followed by a high temperature vacuum assisted removal of
BD to form the PBF polymer. PBF synthesized through both methods had a glass transition
temperature (Tg) below room temperature. PBF synthesized from DEF yielded a Tg of -27°C,
whereas the Tg of PBF synthesized from MA as a starting material was -21°C.
Fabrication of crosslinked electrospun fiber mats was accomplished using ultraviolet
radiation (�= 365 nm) was used in combination with a photoinitiator phenylbis (2, 4, 6-
OO O
OH
OH ZnCl2
OH
OH
O
OO
O
ZnCl2
HO OO
O
OH
PBF
Method A
Method B
Figure 9. Routes to synthesize PBF using maleic anhydride and butane diol (BD) (Method A) and diethyl fumarate and BD (Method B) and electrrospun images of fibers produced from PBF mats (A) mat center (B) perimeter of mat.
34
trimethylbenzoyl) phosphine oxide (BAPO) to photocrosslink the linear unsaturated polyester
through the carbon-carbon double bond.
An effort was undertaken to explore the ramifications for biocompatibility and
conductivity of loading PDMS with conductive MWCNTs. PDMS samples (containing
MWCNTs) were prepared by blending the nanotubes at seven different loading levels ranging
from 0.5 to 32% (w/w) into a dilute solution of thermally cured PDMS (Sylguard 184). Solutions
were diluted with chloroform and sonicated overnight to ensure complete blending of the
MWCNTs into the polymer matrix. These solutions were used to cast thin films (approximately
0.010” thick) of PDMS using a Gardco automatic drawdown machine. Solutions were cast onto
silanized release paper that was later cured at 70 °C overnight. The film forming process was
also repeated using the same silanol condensation chemistry presented in Figure 7. Films were
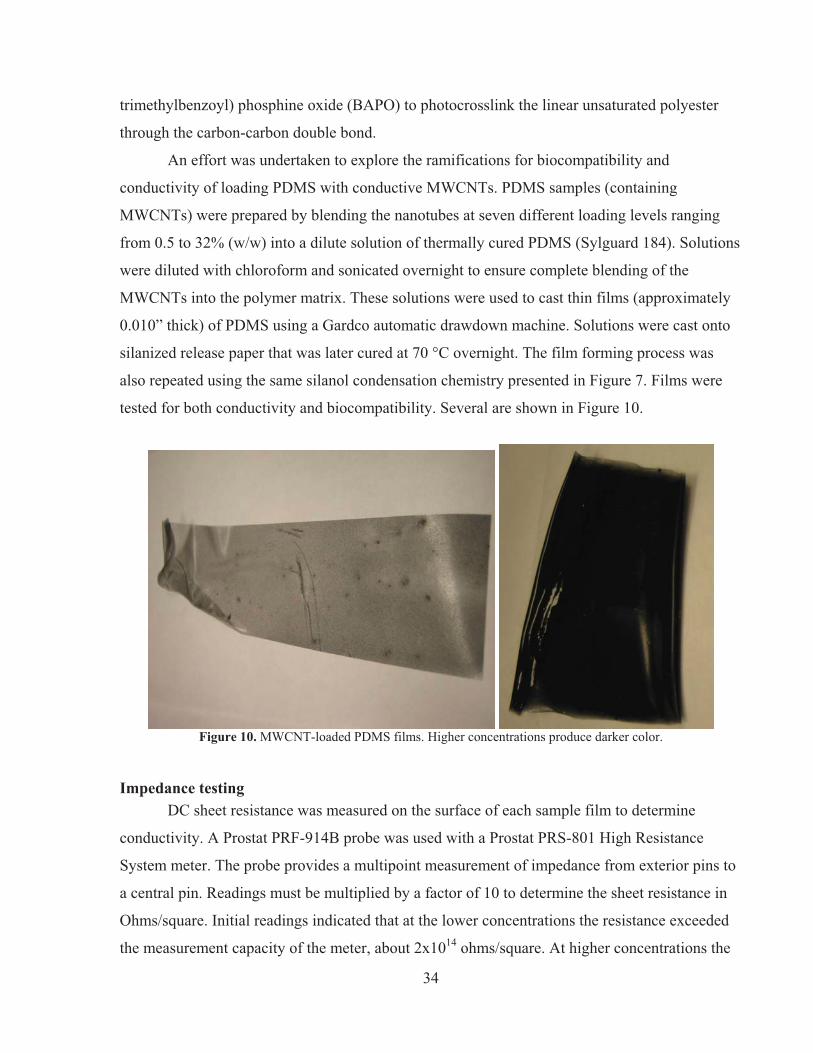
tested for both conductivity and biocompatibility. Several are shown in Figure 10.
Figure 10. MWCNT-loaded PDMS films. Higher concentrations produce darker color.
Impedance testing DC sheet resistance was measured on the surface of each sample film to determine
conductivity. A Prostat PRF-914B probe was used with a Prostat PRS-801 High Resistance
System meter. The probe provides a multipoint measurement of impedance from exterior pins to
a central pin. Readings must be multiplied by a factor of 10 to determine the sheet resistance in
Ohms/square. Initial readings indicated that at the lower concentrations the resistance exceeded
the measurement capacity of the meter, about 2x10¹⁴ ohms/square. At higher concentrations the
35
resistance became measurable, and followed the expected trend of decreasing resistance with
increasing concentration of MWCNT. Still, resistance values were significantly higher than
expected. Measurements varied somewhat with location of the probe tip on the sample. The
lowest repeatable measured resistance at each concentration is shown in Table 7.
MWCNT
Concentration (%) Min Sheet Resistance
(Ohms/sq) 0.5 >2 x 10¹⁴ 1 >2 x 10¹⁴ 2 >2 x 10¹⁴ 4 >2 x 10¹⁴ 8 2.7 x 10¹² 16 7.1 x 10⁶ 32 2.2 x 10⁵
Table 7. Lowest repeatable measured sheet resistance value for each MWCNT fill concentration.
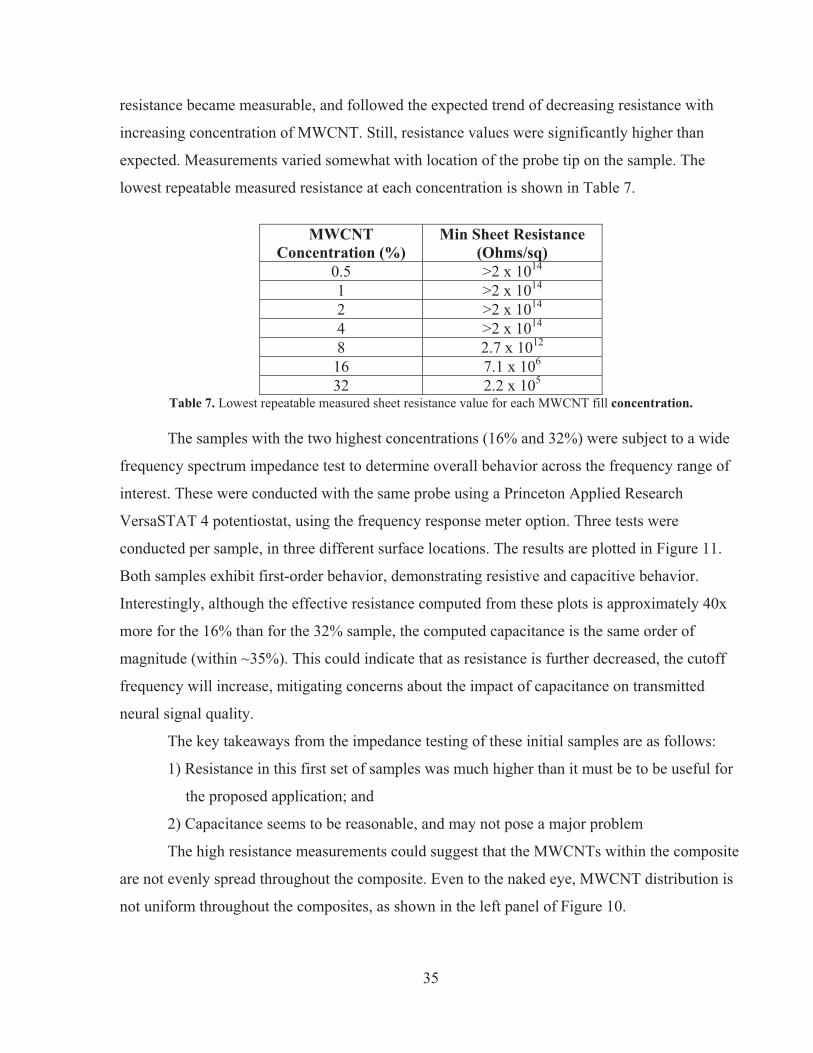
The samples with the two highest concentrations (16% and 32%) were subject to a wide
frequency spectrum impedance test to determine overall behavior across the frequency range of
interest. These were conducted with the same probe using a Princeton Applied Research
VersaSTAT 4 potentiostat, using the frequency response meter option. Three tests were
conducted per sample, in three different surface locations. The results are plotted in Figure 11.
Both samples exhibit first-order behavior, demonstrating resistive and capacitive behavior.
Interestingly, although the effective resistance computed from these plots is approximately 40x
more for the 16% than for the 32% sample, the computed capacitance is the same order of
magnitude (within ~35%). This could indicate that as resistance is further decreased, the cutoff
frequency will increase, mitigating concerns about the impact of capacitance on transmitted
neural signal quality.
The key takeaways from the impedance testing of these initial samples are as follows:
1) Resistance in this first set of samples was much higher than it must be to be useful for
the proposed application; and
2) Capacitance seems to be reasonable, and may not pose a major problem
The high resistance measurements could suggest that the MWCNTs within the composite
are not evenly spread throughout the composite. Even to the naked eye, MWCNT distribution is
not uniform throughout the composites, as shown in the left panel of Figure 10.
36
1.00E+00
1.00E+01
1.00E+02
1.00E+03
1.00E+04
1.00E+05
1.00E+06
1.00E+07
1 10 100 1000 10000 100000 1000000
abs(
Z), O
hm/s
q x
10 16pct_a16pct_b16pct_c32pct_a32pct_b32pct_c
-100
-80
-60
-40
-20
0
20
1 10 100 1000 10000 100000 1000000
freq, Hz
phas
e(Z)
, deg
16pct_a16pct_b16pct_c32pct_a32pct_b32pct_c
Figure 11. Magnitude (top) and phase (bottom) of surface impedance for 16% and 32% MWCNT loaded PDMS films.
Atomic force microscopy experiments were utilized to determine if the fraction of
MWCNTs observed on the surface was consistently increasing as a function of mass loading.
Initial results look as if mixing was not consistent from formulation to formulation with only one
formulation (8% MWCNT loading (w/w)) showing any clear sign of MWCNTs on the surface.
Electrospinning may provide a more effective method of distributing nanotubes more
effectively within wound fibers. Impedance and AFM test data on the electrospun samples was
unavailable at the time of this writing.
37
Biocompatibility testing MWCNT-loaded PDMS films were tested for biocompatibility by collaborators at the
University of New Mexico. Experiments were conducted to evaluate the in vitro
cytocompatibility of the composite films using the adherent PC-12 Adh cell line. A
comprehensive report on the biocompatibility testing was not available at the time of this
writing, however preliminary results showed that cells had difficulty attaching to the PDMS
based films in culture. Many of the cells underwent apoptosis. This is probably because PDMS is
intrinsically hydrophobic. While this can be advantageous for many implantable devices as it
prevents them from being fouled by cells attaching and dying, the regenerative neural interface
application almost certainly requires healthy integration. Recent work has shown that both
surface wettability and mechanical properties influence cell growth, with surface properties
dominating initial cell attachment and mechanical properties determining long-term growth42.
Initial results suggest that surface treatments will be required to allow nerve cells to attach to a
PDMS scaffold. Another alternative is to pursue different base polymers such as PBF, which our
team has shown to allow cell attachment. When complete test data is available, this will be
shared with our MD Anderson collaborators and evaluated in the specific biological context
proposed.
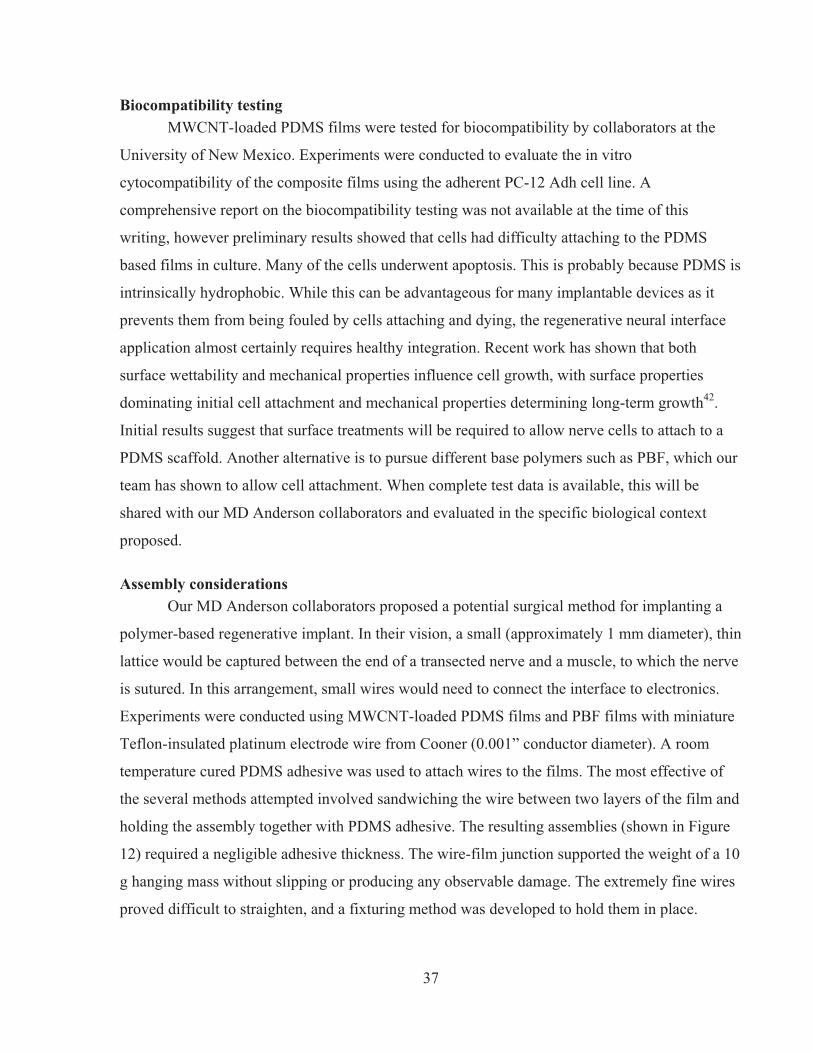
Assembly considerations Our MD Anderson collaborators proposed a potential surgical method for implanting a
polymer-based regenerative implant. In their vision, a small (approximately 1 mm diameter), thin
lattice would be captured between the end of a transected nerve and a muscle, to which the nerve
is sutured. In this arrangement, small wires would need to connect the interface to electronics.
Experiments were conducted using MWCNT-loaded PDMS films and PBF films with miniature
Teflon-insulated platinum electrode wire from Cooner (0.001” conductor diameter). A room
temperature cured PDMS adhesive was used to attach wires to the films. The most effective of
the several methods attempted involved sandwiching the wire between two layers of the film and
holding the assembly together with PDMS adhesive. The resulting assemblies (shown in Figure
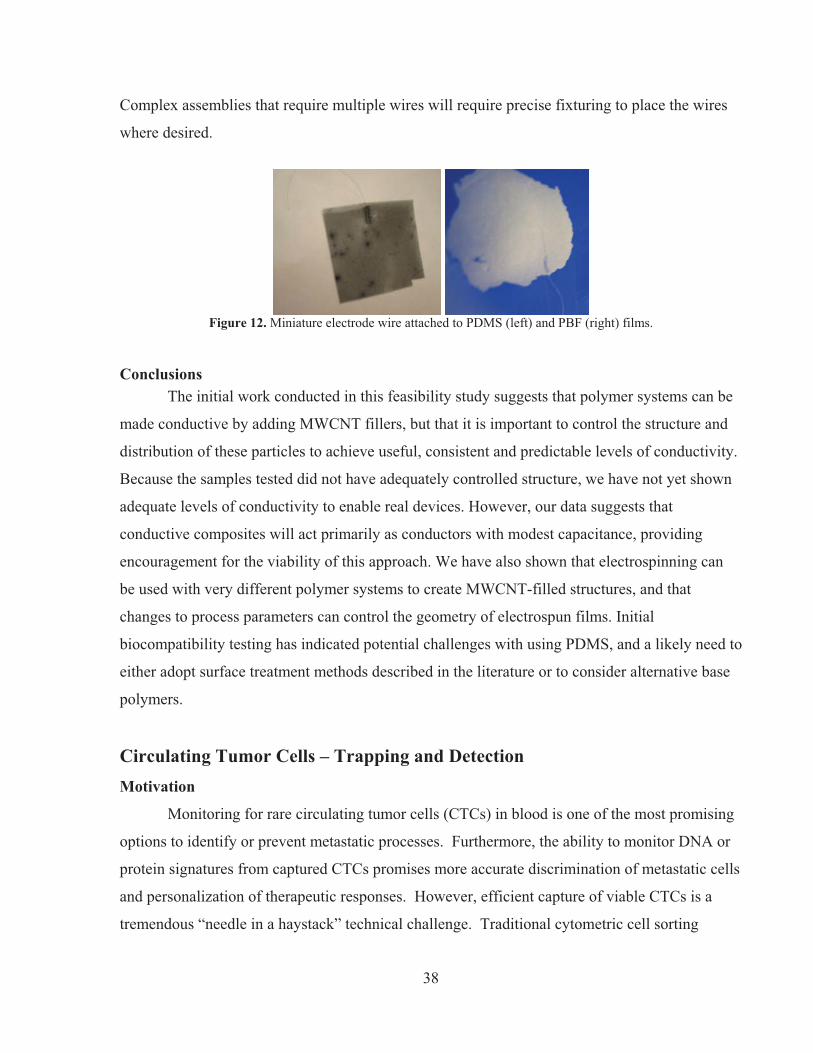
12) required a negligible adhesive thickness. The wire-film junction supported the weight of a 10
g hanging mass without slipping or producing any observable damage. The extremely fine wires
proved difficult to straighten, and a fixturing method was developed to hold them in place.
38
Complex assemblies that require multiple wires will require precise fixturing to place the wires
where desired.
Figure 12. Miniature electrode wire attached to PDMS (left) and PBF (right) films.
Conclusions The initial work conducted in this feasibility study suggests that polymer systems can be
made conductive by adding MWCNT fillers, but that it is important to control the structure and
distribution of these particles to achieve useful, consistent and predictable levels of conductivity.
Because the samples tested did not have adequately controlled structure, we have not yet shown
adequate levels of conductivity to enable real devices. However, our data suggests that
conductive composites will act primarily as conductors with modest capacitance, providing
encouragement for the viability of this approach. We have also shown that electrospinning can
be used with very different polymer systems to create MWCNT-filled structures, and that
changes to process parameters can control the geometry of electrospun films. Initial
biocompatibility testing has indicated potential challenges with using PDMS, and a likely need to
either adopt surface treatment methods described in the literature or to consider alternative base
polymers.
Circulating Tumor Cells – Trapping and Detection
Motivation
Monitoring for rare circulating tumor cells (CTCs) in blood is one of the most promising
options to identify or prevent metastatic processes. Furthermore, the ability to monitor DNA or
protein signatures from captured CTCs promises more accurate discrimination of metastatic cells
and personalization of therapeutic responses. However, efficient capture of viable CTCs is a
tremendous “needle in a haystack” technical challenge. Traditional cytometric cell sorting
39
techniques can be specific but not sensitive enough, and only a bead-based immuno-capture
technology “CellSearch CTC test” (Veridex) has been FDA approved for breast, prostate and
colorectal cancers. The drawbacks of the bead-based approach are sample handling demands
that result in CTC losses and significant reductions in cell viability that alter biochemical
signatures in the process.
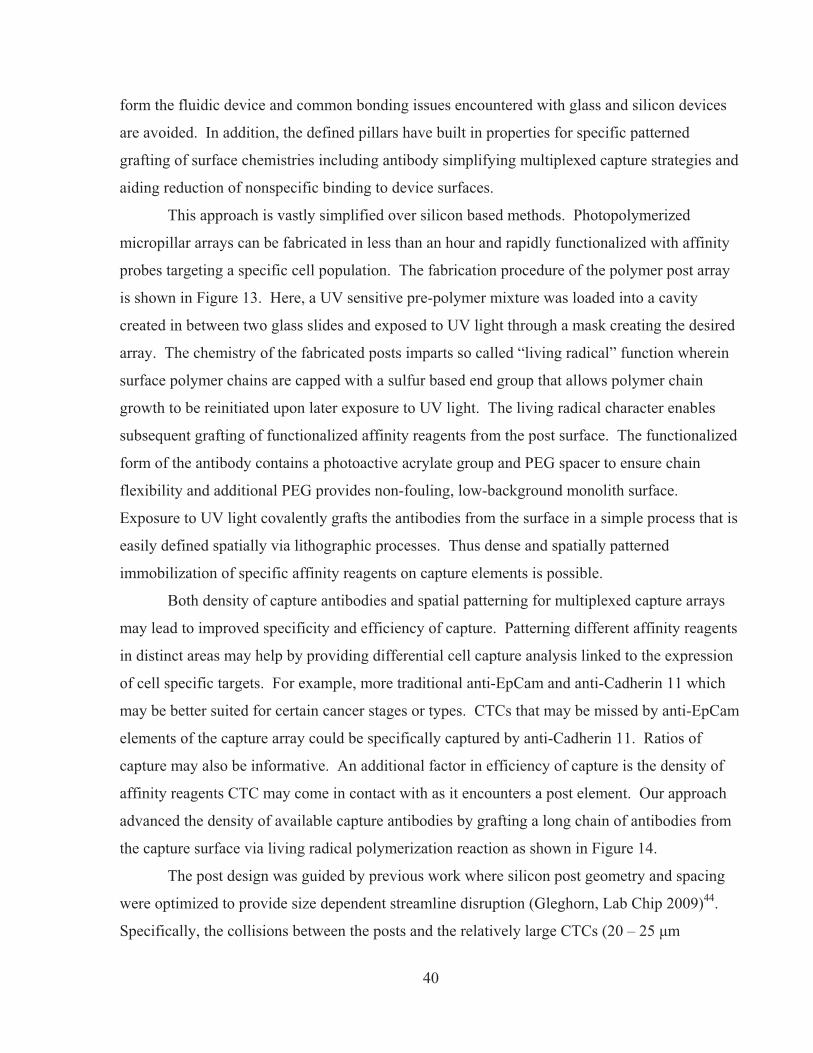
The recent emergence of CTC capture chips as a means of gentle and highly efficient
capture of viable CTCs is a promising option for diagnosis and monitoring of metastatic cancers.
The microfluidic chip-based approach is also amenable to integrated biochemical analysis while
maintaining CTC viability as exemplified in a preliminary demonstration of screening for
mutations in EHGR genes of lung cancer CTCs. Several challenges must be addressed before
CTC-based approaches and chip-based tools can be widely adopted in clinical practice. We
address two primary needs that are emphasized in recent (2010) reviews in Science and Journal
of Oncology:43 1) the targeted cell adhesion proteins are neither sensitive nor specific enough
and 2) the lack of in situ biochemical detection and analysis.
Approach In order to meet the above identified needs, alternatives to silicon based post arrays must
be considered. To boost sensitivity and specificity, new CTC target adhesion proteins must be
evaluated and CTC capture devices will need to implement multi-target capture strategies.
Approaches to fabricating cell capture arrays must be flexible to enhance options for multiplexed
capture and to facilitate integrated biochemical analysis.
Post arrays and cell capture Novel post array fabrication approach was selected based on compatibility with
multiplexed CTC capture strategies as well as facile integration with biochemical analysis
strategies. The photopolymerization micropillar approach allows great flexibility and can be
readily integrated with a number of existing nanosensing and lab-on-a-capabilities relevant to
sensing biochemical signatures. The approach leverages new methods recently developed by our
group that allows channel features including pillar arrays to be lithographically defined and
attached to a variety of relevant substrates including glass, silicon and plastic. The substrates
may also have pre-existing and even delicate features that are not exposed to harsh etching
agents, thermal or pressure conditions. Dissimilar top and bottom subtrates can also be used to
40
form the fluidic device and common bonding issues encountered with glass and silicon devices
are avoided. In addition, the defined pillars have built in properties for specific patterned
grafting of surface chemistries including antibody simplifying multiplexed capture strategies and
aiding reduction of nonspecific binding to device surfaces.
This approach is vastly simplified over silicon based methods. Photopolymerized
micropillar arrays can be fabricated in less than an hour and rapidly functionalized with affinity
probes targeting a specific cell population. The fabrication procedure of the polymer post array
is shown in Figure 13. Here, a UV sensitive pre-polymer mixture was loaded into a cavity
created in between two glass slides and exposed to UV light through a mask creating the desired
array. The chemistry of the fabricated posts imparts so called “living radical” function wherein
surface polymer chains are capped with a sulfur based end group that allows polymer chain
growth to be reinitiated upon later exposure to UV light. The living radical character enables
subsequent grafting of functionalized affinity reagents from the post surface. The functionalized
form of the antibody contains a photoactive acrylate group and PEG spacer to ensure chain
flexibility and additional PEG provides non-fouling, low-background monolith surface.
Exposure to UV light covalently grafts the antibodies from the surface in a simple process that is
easily defined spatially via lithographic processes. Thus dense and spatially patterned
immobilization of specific affinity reagents on capture elements is possible.
Both density of capture antibodies and spatial patterning for multiplexed capture arrays
may lead to improved specificity and efficiency of capture. Patterning different affinity reagents
in distinct areas may help by providing differential cell capture analysis linked to the expression
of cell specific targets. For example, more traditional anti-EpCam and anti-Cadherin 11 which
may be better suited for certain cancer stages or types. CTCs that may be missed by anti-EpCam
elements of the capture array could be specifically captured by anti-Cadherin 11. Ratios of
capture may also be informative. An additional factor in efficiency of capture is the density of
affinity reagents CTC may come in contact with as it encounters a post element. Our approach
advanced the density of available capture antibodies by grafting a long chain of antibodies from
the capture surface via living radical polymerization reaction as shown in Figure 14.
The post design was guided by previous work where silicon post geometry and spacing
were optimized to provide size dependent streamline disruption (Gleghorn, Lab Chip 2009)44.
Specifically, the collisions between the posts and the relatively large CTCs (20 – 25 �m
41
diameter) were maximized while collisions with blood cells (4 – 15 �m diameter) were
minimized with spacing from 50-100 microns and post diameters from 80-100 microns. We
evaluated resolution for 3 different post recipes including PEG hydrogels, and solid urethane
diacrylate and thiolene posts. We found that spatial resolution of device features, even with
photolithographic patterning through relatively thick (1 mm) glass slides, this
photopolymerization technique easily provides the resolution required to achieve reported
optimal post geometry. Our overall cavity geometry was chosen to maximize the number of
posts and ensure complete filling to avoid dead zones.
The post array was then functionalized with anti-EpCAM to target adhesion molecules
known to be over-expressed in many circulating tumor cells. Acrylate functionalized
streptavadin was first grafted from the post surface under UV exposure and then exposed to
biotinylated anti-EpCam antibody taking advantage of the strong streptavadin/biotin affinity.
Figure 13. Fabrication of photopolymerized post array. The array is fabricated by filling a cavity with the photopolymer, aligning a photomask to the access ports, and exposing with a UV lamp. A representative chip containing 1678 post elements is shown the far right. Total fabrication time is less than 5 minutes.
As a preliminary demonstration, LNCaP human prostate cancer cells were captured using
anti-EpCAM grafted posts (Figure 15). Future work will need to optimize system parameters
(e.g. flow rate and shear stress, sample throughput, grafting, and post arrangement) for cell
capture and evaluate success using representative blood samples. Although the preliminary
demonstration involved EpCAM antibodies, the photografting technique is versatile enough to
incorporate any functionalized antibody into the detection platform and enables multiplexed
analysis with a specific region of the chip dedicated to a specific target. The pillar array can be
readily incorporated with Sandia biochemical detection techniques to develop a powerful, multi-
faceted analysis platform. The resulting device and chemistry, demonstrated in preliminary tests
42
with anti-EpCam, is poised for future efforts to evaluate CTC capture with new antibodies of
interest to Dr. Sue-Hwa Lin at MDACC, to test hypothesis of improves specificity and sensitivity
for certain cancer stages or subtypes.
Figure 14. Top image shows schematic representation of dense antibody grafting technique. Long chains of specific capture antibody and PEG spacers are grafted to polymeric post surfaces to enhance capture. This strategy promises improved capture efficiency compared to more typical physical adsorption of antibody. Bottom (left) image confirms effective grafting as determined by specifically immobilized fluorophore. Non-grafted control is shown for comparison (right)
43
Figure 15. Capture of LNCaP cells using anti-EpCAM grafted posts. Scale bar = 250 micrometers. The posts in this example were patterned with a non-circular pattern that helped evaluate fidelity and resolution of the photolithographic process.
Biochemical detection and analysis For useful biochemical analysis in a microfluidic chip, integrated and highly sensitive
techniques must be developed. Immunoassays of protein signatures secreted by CTCs represent
a significant achievement that has implications in diagnosis and treatment. Some demonstrations
of protein quantitation from single or a few cells have been demonstrated. However, this has not
been accomplished with captured CTCs and the proteins of interest are generally orders of
magnitude lower in abundance.
Chemical Sensing Element
PSA+ PSA-
Figure 16. Antibody grafted monolithic polymer capture elements used to detect low concentrations PSA secreted by LNCaP cancer cells. Total assay time was < 45 minutes.
44
A
B
C
Figure 17. Digital Isoelectric Fractionation of Protein Glycoforms. Novel photopatterning of discrete and individually tunable pH membranes serve as an important workflow step for resolving protein glycoforms that could improve sensitivity and specificity of early cancer detection. Shown here is preliminary data that we can indeed rapidly (<5 minutes) resolve representative PSA glycoforms at high resolution using this digital approach while traditional separation also shown requires >3 hrs. A) Individual pH membranes (<200 microns in size) are shown in bright field, insets show fluorescent images of PSA isoforms selectively fractionated according to PI. B) Preliminary demonstration that digital fractionation membranes targeting prominent PSA glycoforms at pH 7.4, pH 6.8, and pH 6.2 is readily achieved. C) Traditional IEF separations and western blot resolving the same PSA glycoforms.
Fluorescence based solid-phase immunoassay To demonstrate possible integration of biochemical detection from a cell population,
prostate specific antigen (PSA) secreted from a cultured LNCaP cells was detected using an
antibody grafted porous polymer monolith. Figure 16 shows 3D monolithic capture elements
and corresponding PSA signal detected in cell culture supernatant. This device is fabricated
using the same photolithographic process as for the posts, but monomer mixtures forming porous
polymer monolith are used to pattern the PSA capture element. Similar to antibody chains used
for CTC capture, antibody chains specific to PSA were grafted to the monolith surface. In
preliminary studies shown here we extrapolate a sensitivity limit approaching 1 pM or sufficient
to sense activity from ~100-1,000 cells depending on the time allowed for collection. Further
enhancements to this detection format such as enzyme amplification of signal are expected to
further improve detection sensitivity. The pillar array platform is also compatible with a
multipronged approach incorporating the capture of rare cells, isoelectric fractionation of PSA
isoforms, and subsequent immunoassay quantitation as shown in Figure 17.
45
Electrode array The goal of this study was two-fold, 1) demonstrate efficient capture of viable CTCs
using our monolithic microfluidic chip as described above and 2) demonstrate detection and
quantitation of CTC secreted proteins. Since the long term goal would be detection of multiple
protein markers secreted from the cells, we tested the feasibility of our existing electrode arrays
for IL-6 detection since the electrode arrays have the potential for multiplexing, low detection
limits, and spatial resolution. We have already demonstrated the use of electrode arrays for
multi-target protein (cytokines) detection using a sandwich assay45. Diazonium-modified
antibodies were deposited onto the array followed by delivery of known concentrations of three
different cytokines. Once the cytokines bound to their selective Ab, secondary biotinylated
antibodies bound to the captured targets and were then detected electrochemically by
introduction of ExtrAvidin-HRP. This assay was repeated for detection of IL-6. As with most
sandwich assays the detection limit is nanomolar concentrations of protein. For detection of
trace amounts of released proteins from a few cells we need to achieve fM detection limits. This
is possible using catalytic assays. We have been able to achieve fM detection limits for DNA
detection but are still developing catalytic assays for protein detection. Through this project and
another leveraged project, we have been developing catalytic assays for protein detection by
incorporating nanoparticles onto carbon or ITO electrode arrays. Our first approach was to
deposit gold nanoparticles onto the electrode surface followed by electrochemical deposition of
palladium (Pd). Antibodies specific to our target protein were then immobilized on the catalytic
particle. The goal was to monitor oxygen reduction at the surface of the nanoparticle and once
our target protein was bound, it would be large enough to displace the reduction reaction, turning
off our signal. We have demonstrated catalytic activity, of the Pd-Au particle once bound as
shown in Figure 18 below (green curve). However, binding of the Ab alone inhibited our signal
so we decided to use a different target that bound to a short peptide sequence. Again, the small
peptide inhibited the catalytic signal (pink curve). Another problem with this assay was once we
introduced the target, it displaced the peptide turning our signal on (red curve). An “on” signal
would be good however this is not reliable since the displacement depended on the protein size,
binding constant, etc. We are continuing to develop a new assay and hope that through our other
effort we will have this work completed in a few months.
46
Through this effort we also wanted to determine the number of cells that were required to
secrete enough protein markers for detection but the cell line we ordered was delayed in shipping
and we were unable to complete these experiments. The cells (PC-3 prostate cancer cell line
(ATCC CRL-1435)) arrived at the completion of the project and have been frozen if there is
opportunity in the future to continue this work.
Clustered Heat Maps for Bioinformatics Data Analysis
Clustered Heat Map Analysis and Visualization A set of routines for generating a number of different simple and composite clustered
heat maps (CHM), based on a variety of input data, has been developed. These routines were
written as a Matlab46 toolbox. This provides a straightforward path to C/C++ implementation of
the prototype Matlab toolbox using the Matlab Compiler. The MATLAB Compiler automates
the process of converting Matlab code into stand-alone executables or shared libraries. As a
shared library, the toolbox can be linked with other C/C++ code into an application, as well as
being called from third party packages such as the R statistics package47.
The CHM toolbox is integrated with a number of other routines for performing
clustering. Standard linkage based clustering algorithms can be used as well as kmeans and
47
kcenters algorithms. Some of these algorithms (kmeans) take the raw data as input while others
(kcenters) take a distance matrix (Euclidean metric, city block, etc.) as input. The toolbox also
allows facile integration of statistical tools, including principal component analysis (PCA) as
well as cluster accuracy metrics including variation of information (VOI). Bootstrapping and
cluster ensembling routines are also implemented.
Since the toolbox allows for a variety of ways of pre-processing and clustering the data
combined with a variety of ways of representing the composite CHM, the output can take on a
number of forms. We will provide some examples of output based on sample data to illustrate
the functionality of the toolbox.
Figure 19. (Left) The distribution of the 317 proteins in the space of ligand binding affinities associated with the first two principal components. Colors correspond to the cluster groupings. (Right) Cluster ordered heat map of the Euclidean distance matrix (proteins in ligand space). The highlighted diagonal blocks display the relative proximity of kinases within a given cluster group (hotter colors indicating closer proximity in ligand binding space). The off diagonal elements indicate proximities between kinases of different cluster groups.
Figure 19 displays output from the clustering of 317 protein kinases based on ligand
binding affinities. Associated with each kinase are binding values with each of 38 different
ligands. PCA was performed on the data in ligand space to find a reduced number of principal
components. Clustering using the kcenters algorithm was performed by computing the Euclidean
distance matrix in the reduced principal component space (first 5 principal components). The
plot on the left displays the distribution of the 317 proteins in the space of ligand binding
affinities associated with the first two principal components. The colors correspond to the cluster
groupings found by the kcenters algorithm (in the space of the first 5 principal components). The
48
CHM on the right reflects the cluster ordered heat map of the Euclidean distance matrix. The
highlighted diagonal blocks display the relative proximity of kinases within a given cluster group
(hotter colors indicating closer proximity in ligand binding space). The off diagonal elements
indicate proximities between kinases of different cluster groups. The heat map effectively
conveys the objective of the kcenters clustering, that is, greater similarity of kinases within a
cluster group (hotter colors) than between kinases of different cluster groups (colder colors).
Figure 20. (Left) Cluster ordered heat map of the Euclidean distance matrix (ligands in protein space). The highlighted diagonal blocks display the relative proximity of ligands within a given cluster group (hotter colors indicating closer proximity in protein space). The off diagonal elements indicate proximities between ligands of different cluster groups. (Right) Cluster ordered heat map of the raw ligand binding matrix data ordered vertically by the kinase clustering (horizontal lines partitioning kinase cluster groups) and horizontally by the ligand clustering (vertical lines partitioning ligand cluster groups).
This same exercise can be done by looking at the complementary problem - clustering
ligands in protein space. Figure 20 displays output from the clustering of 38 ligands based on
binding affinities with the 317 kinases. The CHM on the left reflects the cluster ordered heat map
of the Euclidean distance matrix in protein space. Analogous to Figure 19, the highlighted
49
diagonal blocks display the relative proximity of ligands within a given cluster group. The CHM
on the right displays the raw ligand binding data ordered vertically by the kinase clustering
(horizontal lines partitioning kinase cluster groups) and horizontally by the ligand clustering
(vertical lines partitioning ligand cluster groups). This CHM effectively combines information
from the two complementary clusterings.
All of the output associated with Figures 19 and 20, including the preprocessing steps
(PCA, distance matrix computations, etc.) and post clustering analysis (reporting of VOI
accuracy metrics relative to human kinome phylogentic tree) was performed in a simple scripted
fashion using the CHM toolbox (Matlab’s Statistics toolbox was used for underlying statistics
function calls).
Figure 21. (Left) Gene regulation patterns for a set of genes (U – up, D – down, F – flat) (Right) Plots of the genes in expression space with colors indicating cluster groupings by expression patterns and kmeans clusters.
Another example application involves clustering of genes by expression values. Gene
expression data48 was used for this. The set of plots on the left in Figure 21 displays the gene
regulation patterns for a set of genes (U – up, D – down, F – flat). The genes can be plotted in
expression space and clustered based on the gene expression pattern or based on a kmeans
clustering of the expression values, as shown in the plots to the right. Figure 22 displays the
corresponding CHM’s of the gene expression data ordered by expression pattern (left) and
kmeans cluster (right).
50
The visualization and analysis tools presented here are intended to allow easy generation
and manipulation of clustered heat maps. These tools can be extended in the future to allow for
greater integration with a wide array of analytic tools written in Matlab, R, and C/C++, as well as
greater annotation of the heat maps with textual and graphical information.
Figure 22. (Left) Cluster ordered heat map of gene expression data ordered by gene expression pattern (U – up, D – down, F – flat) (Right) Cluster ordered heat map of gene expression data ordered by kmeans clusters.
Conclusion
In collaboration with researchers at the M. D. Anderson Cancer Center, we have studied
four problems at the forefront of cancer research: the design of stable enzyme mutations for
improved cancer chemotherapy; regenerative nerve interface electrodes for high-performance
prosthetic limbs; microfluidic diagnostic sensors to capture and identify rare circulating tumor
cells; and novel algorithms to speed the analysis of large arrays of biological data. This work has
applied Sandia capabilities to a new research area, further developing those capabilities to better
51
address Sandia’s national security mission. We expect that this effort will lead to enhanced
interactions between Sandia and MDACC.
52
References 1 DevCan: Probability of Developing or Dying of Cancer Software, Version 6.4.1, Statistical
Research and Applications Branch, National Cancer Institute, 2009, srab.cancer.gov/devcan. 2 Kravchenko OV, Kislitsin YA, Popov AN, Nikonov SV, Kuranova IP. "Three-dimensional
structures of L-asparaginase from Erwinia carotovora complexed with aspartate and glutamate." Acta Crystallogr D Biol Crystallogr. 2008;64(Pt 3):248-256
3 Aung H-P, Bocola B, Schleper S, and R �ohm KH. Dynamics of a mobile loop at the active site of Escherichia coli asparaginase. Biochim Biophys Acta. 2000;1481(2):349-359.
4 Dhavala P, Papageorgiou AC "Structure of Helicobacter pylori L-Asparaginase at 1.4 A resolution." Acta Crystallogr D Biol Crystallogr. 2009;65(Pt 12):1253-1261
5 Larkin MA, G. Blackshields, N. P. Brown, R. Chenna, P. A. McGetti- gan, H. McWilliam, F Valentin, I. M. Wallace, A. Wilm, R. Lopez, J. D. Thompson, T. J. Gibson, and D. G. Higgins. Clustal W and Clustal X version 2.0. Bioinfo., 23(21):2947–2948, November 2007
6 Beitz E. TeXshade: shading and labeling of multiple sequence align- ments using LaTeX2e. Bioinformatics, 16(2):135–139, 2000
7 Heinig M and Frishman D. STRIDE: a web server for secondary structure assignment from known atomic coordinates of proteins. Nuc. Acids Res., 32:W500–W502, 2004
8 Derst C, J. Henseling, and K. H. R �ohm. Engineering the substrate specificity of Escherichia coli asparaginase II. selective reduction of glu- taminase activity by amino acid replacements at position 248. Protein Science, 9:2009–2017, 2000
9 Derst C, Andreas Wehner, Volker Specht, and Klaus-Heinrich R �ohm. States and functions of tyrosine residues in Escherichia coli As- paraginase II. European Journal of Biochemistry, 224:533–540, 2005
10 Li LZ, Tian-Hong Xie, Hong-Jun Li, Chen Qing, Guang-Ming Zhang, and Mao-Sheng Sun. Enhancing the thermostability of Es- cherichia coli L-Asparaginase II by substitution with pro in predicted hydrogen-bonded turn structures. Enzyme and Microbial Technology, 41(4):523–527, 2007
11 Aghaiypour, K., A. Wlodawer and J. Lubkowski. Structural basis for the activity and substrate specificity of Erwinia chrysanthemi L-Asparaginase. Biochemistry 40: 5655-64, 2001
12 Rohm, K. H. and F. Schneider. Kinetic studies on the mechanism of asparaginase from E. coli. Hoppe Seylers Z. Physiol. Chem. 352: 1739-43, 1971
13 Cappelletti D., L. R. Chiarelli, M. V. Pasquetto, S. Stivala, G. Valentini and C. Scotti. Helicobacter pyloril-asparaginase: a promising chemotherapeutic agent. Biochem Biophys. Res. Commun. 377: 1222-6, 2008
14 Kotzia G. A. and N. E. Labrou. Cloning, expression and characterisation of Erwinia carotovora L-Asparaginase. J. Biotechnol. 119: 309-23, 2005
15 Reinert R. B., L. M. Oberle and S. A. Wek et al. Role of glutamine depletion in directing tissue-specific nutrient stress responses to L-Asparaginase. J. Biol. Chem. 281: 31222-33, 2006
16 Sanches M, Barbosa JA, de Oliveira RT, Abrahão Neto J, Polikarpov I. "Structural comparison of Escherichia coli L-Asparaginase in two monoclinic space groups." Acta Crystallogr D Biol Crystallogr. 2003;59(Pt 3):416-422
53
17 Kravchenko OV, Kislitsin YA, Popov AN, Nikonov SV, Kuranova IP "The 3d structure of L-Asparaginase from Erwinia carotovora in complex with L-aspartate and L-glutamate." (To be Published)
18 Hui Li, Andrew D. Robertson, and Jan H. Jensen "Very Fast Empirical Prediction and Interpretation of Protein pKa Values" Proteins, 2005, 61, 704-721
19 Phillips, J.C., R. Braun, W. Wang, J. Gumbart, E. Tajkhorshid, E. Villa, C. Chipot, R.D. Skeel, L. Kale, and K. Schulten. 2005. Scalable molecular dynamics with NAMD. J. Comput. Chem. 26:1781–1802.
20 MacKerell, A.D., D. Bashford, M. Bellott, R.L. Dunbrack, J.D. Evanseck, M.J. Field, S. Fischer, J. Gao, H. Guo, S. Ha, et al. 1998. All-atom empirical potential for molecular modeling and dynamics studies of proteins. J. Phys. Chem. B. 102:3586–3616.
21 Jorgensen WL, Chandrasekhar J, Madura JD. 1983. “Comparison of simple potential functions for simulating liquid water.” J. Chem. Phys. 79:926
22 Darden T, York D, Pedersen L. 1993. “Particle mesh ewald—an N.log(N) method for ewald sums in large systems.” J. Chem. Phys. 98:10089–10092.
23 Humphrey, W., A. Dalke, and K. Schulten. 1996. VMD: visual molecular dynamics. J. Mol. Graph. 14:33–38.
24 Kozak M, Jaskólski M. "Crystallization and preliminary crystallographic studies of a new crystal form of Escherichia coli L--asparaginase II (Ser58Ala mutant)." Acta Crystallogr D Biol Crystallogr. 2000;56(Pt 4):509-511
25 Moola ZB, Scawen MD, Atkinson T, Nicholls DJ.” Erwinia chrysanthemi L-asparaginase: epitope mapping and production of antigenically modified enzymes.” Biochem J. 1994;302 ( Pt 3):921-927.
26 Lukman S, Grant BJ, Gorfe AA, Grant GH, McCammon JA "The Distinct Conformational Dynamics of K-Ras and H-Ras A59G." PLoS Comput Biol. 2010;6(9).pii: e1000922
27 Di Marino D, Oteri F, Morozzo Della Rocca B, Chillemi G, Falconi M. "ADP/ATP mitochondrial carrier MD simulations to shed light on the structural-dynamical events that, after an additional mutation, restore the function in a pathological single mutant." J Struct Biol. 2010 Aug 3. [Epub ahead of print]
28 Lou H, Cukier RI. "Molecular dynamics of apo-adenylate kinase: a principal component analysis." J Phys Chem B. 2006;110(25):12796-12808
29 Lindahl E, Hess B, van der Spoel D. "GROMACS 3.0: a package for molecular simulation and trajectory analysis" Journal of Molecular Modeling, 2001; 7(8):306-317
30 Anishkin A, Milac AL, Guy HR. "Symmetry-restrained molecular dynamics simulations improve homology models of potassium channels." Proteins. 2010; 78(4):932-949
31 Akitake B, Anishkin A, Liu N, Sukharev S. "Straightening and sequential buckling of the pore-lining helices define the gating cycle of MscS." Nat Struct Mol Biol. 2007;14(12):1141-1149
32 Anishkin A, Kamaraju K, Sukharev S. "Mechanosensitive channel MscS in the open state: modeling of the transition, explicit simulations, and experimental measurements of conductance." J Gen Physiol. 2008; 132(1):67-83
33 Belyy V, Anishkin A, Kamaraju K, Liu N, Sukharev S. "The tension-transmitting 'clutch' in the mechanosensitive channel MscS." Nat Struct Mol Biol. 2010; 17(4):451-458
54
34 S. Panseri, BMC Biotechnology 8, 39 (2008). 35 X. Navarro, T.B. Krueger, N. Lago, S. Micera, T. Stieglitz, P. Dario, J. Periph. Nerv. Sys. 10,
229 (2005). 36 M.K. Kwan, E.J. Wall, J. Massie, S.R. Garfin, Acta Orthopaedica 63, 267 (1992). 37 G.H. Borschel, K.F. Kia, W.M. Kuzon, R.G. Dennis, J. Surg. Res. 114, 133 (2003). 38 S. Cogan, Annu. Rev. Biomed. Eng. 10, 275 (2008). 39 Y. B. Kim, D. Cho, W. H. Park, J. Appl. Polym. Sci. 114, 3870 (2009). 40 K. N. Cicotte, E. L. Hedberg-Dirk, S. M. Dirk, J. Appl. Polym. Sci. 117, 1984 (2010). 41 F. K. Kasper, K. Tanahashi, J. P. Fisher, A. G. Mikos, Nat. Protoc. 4, 518 (2009). 42 X.Q. Brown, K. Ookawa, J.Y. Wong, J Biomat 26, 3123 (2005). 43 J. Kaiser, “Cancer’s Circulation Problem.” Science 327:1072-1074 (2010). A.L. Allan, M.
Keeney, “Circulating Tumor Cell Analysis: Technical and Statistical Considerations for Application to the Clinic.” J Oncology 2010:1-10 (2010).
44 J.P. Gleghorn, E.D. Pratt, D. Denning, H. Liu, N.H. Bander, S.T. Tagawa, D.M. Nanus, P.A. Giannakakou, B.J. Kirby, “Capture of Circulating Tumor Cells From Whole Blood of Prostate Cancer Patients Using Geometrically Enhanced Differential Immunocapture (GEDI) and a Prostate-Specific Antibody.” Lab Chip 10(1):27-29 (2010).
46 Matlab, The MathWorks Inc., http://www.mathworks.com/ 47 The R Project for Statistical Computing, http://www.r-project.org/ 48 Wu, J.Q., et. al. Dynamic transcriptomes during neural differentiation of human embryonic
stem cells revealed by short, long, and paired-end sequencing, Proceedings of the National Academy of Sciences, 107, 5254–5259 (2010)
55
Distribution List 1 MS 0899 Technical Library 9536 (electronic copy) 1 MS 0359 D. Chavez, LDRD Office 1911