108
BIS Quarterly Review December 2003 International banking and financial market developments

BIS Quarterly Review December 2003
International banking and financial market developments

BIS Quarterly Review Monetary and Economic Department Editorial Committee:
Joseph Bisignano Eli Remolona William White Claudio Borio Philip Turner Robert McCauley Paul Van den Bergh General queries concerning this commentary should be addressed to Eli Remolona (tel +41 61 280 8414, e-mail: [email protected]), queries concerning specific parts to the authors, whose details appear at the head of each section, and queries concerning the statistics to Rainer Widera (tel +41 61 280 8425, e-mail: [email protected]).
Requests for copies of publications, or for additions/changes to the mailing list, should be sent to:
Bank for International Settlements Press & Communications CH-4002 Basel, Switzerland E-mail: [email protected]
Fax: +41 61 280 9100 and +41 61 280 8100
This publication is available on the BIS website (www.bis.org).
© Bank for International Settlements 2003. All rights reserved. Brief excerpts may be reproduced or translated provided the source is cited.
ISSN 1683-0121 (print)
ISSN 1683-013X (online)
Also published in French, German and Italian.

BIS Quarterly Review, December 2003 iii
BIS Quarterly Review
December 2003
International banking and financial market developments
1. Overview: signs of growth boost confidence ............................................... 1 Pressure on the dollar intensifies .......................................................... 1 Little spillover from currency to fixed income markets ........................... 3 Emerging markets benefit from rating upgrades .................................... 6 Box: Credit ratings of large finance companies ................................... 8 Equities rally on strong earnings .......................................................... 9
2. The international banking market ................................................................ 13 Loans to corporations subdued as banks invest in securities ................ 13 Box: Offshore centres, the US dollar and the yen ............................... 16 Flows into and out of emerging markets driven by deposits .................. 18 Deposit repatriations also drive inflows to emerging Europe ................. 23 Box: International syndicated credits in the third quarter of 2003 ........ 25
3. The international debt securities market ..................................................... 27 Global bond market sell-off disrupts fund-raising .................................. 29 Greater US borrowing supports dollar issuance .................................... 31 Rating upgrades back greater developing country borrowing ................ 32 Box: Flows into US bonds versus flows into US dollar bonds .............. 33 Lower-rated issuers postpone plans in the face of volatility ................... 35 A repayment bulge in early 2004 .......................................................... 36
4. Derivatives markets .................................................................................... 39 Contrasting pattern of activity in interest rate contracts ......................... 40 Volatile markets slow the turnover of interest rate options .................... 40 Further expansion of stock index contracts ........................................... 43 Currency contracts trade at a steady pace ........................................... 43 Box: The rise of pan-European equity index trading ............................ 44 Broad-based expansion of OTC markets .............................................. 46 Gross market values grow at a robust pace .......................................... 49 OTC business slows relative to that on exchanges ............................... 49
Special features
The credit spread puzzle ................................................................................... 51 Jeffery D Amato and Eli M Remolona
Decomposing the spreads .................................................................... 52 The difficulty of diversification .............................................................. 55 Evidence from arbitrage CDOs ............................................................. 57 Box: Diversification and overcollateralisation in CDOs ........................ 59 The role of default correlations ............................................................. 60 Conclusions and implications ............................................................... 61

iv BIS Quarterly Review, December 2003
Common factors in emerging market spreads ..................................................... 65 Patrick McGuire and Martijn A Schrijvers
Asset pricing and the portfolio manager ................................................ 65 Emerging market debt as an asset class ............................................... 67 Common variation in spreads ................................................................ 68 Assigning economic meaning ................................................................ 73 Conclusions .......................................................................................... 75 Box: US interest rates and emerging market bond spreads ................. 76
Sovereign credit default swaps ........................................................................... 79 Frank Packer and Chamaree Suthiphongchai
Background and data source ................................................................ 80 Growth and development ...................................................................... 81 Premia on sovereign CDSs ................................................................... 85 Conclusion ........................................................................................... 87
Unifying government bond markets in East Asia ................................................. 89 Robert N McCauley
Overfunding the fiscal deficit to transform central bank debt .................. 90 Benefits to the bond market and monetary operations ........................... 92 Issues to be resolved ............................................................................ 96 Conclusions .......................................................................................... 97
Recent initiatives by Basel-based committees and the Financial Stability Forum ......................................... 99
Basel Committee on Banking Supervision ............................................. 99 Box: Next steps for the New Basel Capital Accord ............................... 100 Financial Stability Forum ...................................................................... 101 Other initiatives .................................................................................... 102
Statistical Annex ........................................................................................ A1
Special features in the BIS Quarterly Review ................................ B1
List of recent BIS publications .............................................................. B2
Notations used in this Review
e estimated
lhs, rhs left-hand scale, right-hand scale billion thousand million … not available . not applicable – nil or negligible $ US dollar unless specified otherwise Differences in totals are due to rounding.

BIS Quarterly Review, December 2003 1
Frank Packer+41 61 280 8449
Philip D Wooldridge+41 61 280 8819
1. Overview: signs of growth boost confidence
Widespread signs of a global economic recovery underpinned an improvement in investor confidence in the autumn. In October especially, yields rose, equities resumed their upward climb, and corporate and emerging market spreads narrowed. Foreign exchange markets, which had seen unusually sharp movements following a G7 meeting in September, stabilised as the volatility proved to have only a limited impact on other markets.
Sentiment towards emerging markets was also boosted by a series of credit rating upgrades. In October alone, 10 sovereigns were upgraded, mostly in Asia. Attracted by favourable financing conditions, emerging market borrowers raised $19 billion in the international debt securities market in the third quarter of 2003, the largest amount in two years.
Although signs of potential problems emerged in some markets, these appeared to be isolated events. The downgrading of several automobile companies highlighted vulnerabilities in this volatile sector of the corporate bond market. The arrest of a well known Russian business leader increased doubts among investors about the country’s recent promotion to investment grade. And allegations of fraud in the mutual fund industry threatened to undermine the optimism of equity investors.
Pressure on the dollar intensifies
Sentiment in currency markets shifted significantly in September. The dollar, which had strengthened against the euro, and held its own against the yen and other Asian currencies during the summer bond market sell-off, depreciated sharply. Weaker than expected releases in the United States, such as the 95,000 loss in non-farm payrolls announced for August on 5 September, initially brought the dollar under pressure.
Further impetus for a weaker dollar was provided by the press statement that followed the meeting of G7 finance ministers and central bank governors in Dubai, released on 20 September, which emphasised the desirability of more flexibility in exchange rates. While the statement did not attempt to guide markets in a particular direction, it was perceived by many market participants as a call for a weaker US dollar.
In particular, following the Dubai statement market participants reassessed the possible adjustment of Asian currencies against the dollar.
Dollar weakening in September …
… is given further impetus by a G7 statement

2 BIS Quarterly Review, December 2003
Whereas the euro had appreciated by 13% against the US dollar in the 12 months prior to 20 September, most Asian currencies had appreciated by far less (Graph 1.1). This had been so in spite of economic data suggesting that Asian countries were rebounding more quickly than initially anticipated from the SARS epidemic earlier in the year. This inflexibility was perceived by some market participants and politicians as an obstacle to the orderly adjustment of the US current account deficit. The Dubai statement, therefore, was interpreted as a signal that Asian countries were expected to share the burden of adjustment by allowing their currencies to appreciate. Traders pushed up the yen, Thai baht and Korean won against the dollar in the days following the meeting. Expectations about the future value of the Chinese renminbi and Hong Kong dollar against the US dollar also shifted markedly.
Pressure on Asian currencies eased within a few weeks of the Dubai meeting. Macroeconomic news out of the United States was surprisingly positive in October, prompting traders to cover their short dollar positions. The October employment report was the first of several announcements that confirmed the strengthening of the US economy. Indeed, the GDP report released at the end of October showed that the US economy had expanded by a remarkable 7.2% in the third quarter.
Signs that Asian financial authorities continued to intervene in foreign exchange markets to stem any appreciation of their currencies also contributed to the easing of pressure. The Japanese Ministry of Finance revealed that it had authorised the sale of more than ¥4 trillion against foreign currencies in September, a record amount of intervention. In an effort to alleviate pressure on the baht, on 14 October the Thai central bank announced that short-term funds deposited locally by non-residents would be limited in amount and no
Exchange rates against the US dollar 1 January 2002 = 100
Spot rates Spot rates Forward rates1
75
80
85
90
95
100
105
Jan 02 Jan 03
EuroYen
75
80
85
90
95
100
105
Jan 02 Jan 03
Indonesian rupiahKorean wonThai baht
75
80
85
90
95
100
105
Jan 02 Jan 03
Chinese renminbiHong Kong dollar
Note: The vertical lines indicate 22 September 2003.
1 Twelve-month forward rate; for the renminbi, non-deliverable forwards.
Sources: Bloomberg; national data. Graph 1.1
… but pressure proves short-lived
Adjustment against Asian currencies is marked …
Forex intervention in Asia continues

BIS Quarterly Review, December 2003 3
Holdings of US securities by Asian residents
Holdings of US Treasuries Foreign exchange reserves
10
15
20
25
30
35
Jan 01 Jan 02 Jan 030
200
400
600
800
1,000 Treasury holdings (lhs)
Share of outstandingTreasuries¹ (rhs)
500
750
1,000
1,250
1,500
1,750
Jan 01 Jan 02 Jan 03
Total reserves²
Treasury securities in custody at the Fed³
Note: Asia is defined as China, Hong Kong SAR, Japan, Korea, Taiwan (China), Thailand and Singapore.
1 Asians’ holdings of US Treasury securities as a percentage of the outstanding stock of privately held Treasury securities. 2 Foreign exchange reserves held by Asian authorities. 3 US Treasury securities held in custody by the US Federal Reserve for foreign official institutions, including Asian and other central banks.
Sources: US Federal Reserve Board; US Treasury; International Monetary Fund. Graph 1.2
longer remunerated. Meanwhile, Asian residents continued to purchase large amounts of US Treasury securities in September, even as net purchases by all foreigners fell to their lowest level since the global financial market crisis of 1998. By end-September, Asians held approximately one quarter of the outstanding stock of US Treasury debt, with central banks and other official institutions accounting for the largest share of Asian purchases (Graph 1.2).
While stabilising against Asian currencies shortly after the Dubai meeting, the US dollar depreciated further against the euro. Between 20 September and 28 November, the euro appreciated by 6% against the dollar, to a record high of $1.20. In addition to increasingly positive macro news out of the euro area, market participants appeared to focus on the US current account deficit and ongoing trade disputes as signals justifying a stronger euro.
Little spillover from currency to fixed income markets
Spillovers from currency market volatility to bond markets were limited. While concerns about foreign demand for US securities contributed to a 5 basis point increase in dollar yields on the first trading day following the Dubai statement, yield movements tended to be driven by the changing outlook for the US economy. Owing to a series of weaker than expected data releases, yields on 10-year dollar swaps finished September nearly 60 basis points down on the month (Graphs 1.3 and 1.4). However, yields then rose by approximately 30 basis points in October as signs of a strengthening US economy accumulated.
Euro yields were also unaffected by events in currency markets, and appeared to be divorced from developments in the euro area economy as well. Euro yields moved virtually in lockstep with dollar yields throughout September
Euro strengthening resumes
Dollar yields respond to the US macro outlook …

4 BIS Quarterly Review, December 2003
and October. In September, euro yields tracked dollar yields downwards, seemingly ignoring euro area data releases that tended to be better than expected. In October, they moved up in tandem with dollar yields, even though economists did not revise their growth forecasts for the euro area economy by as much as they did for the US economy.
The volatility in currency markets did at times impact on yen fixed income markets, but any currency-induced moves were quickly reversed. For example, yields on 10-year yen-denominated swaps fell by 11 basis points immediately following the Dubai statement, on concerns that a stronger yen might undermine the recovery in Japan. However, they returned to their pre-Dubai levels within a few days. Even though the yen appreciated by 8% against the US dollar between mid-August and mid-October, yields on 10-year yen swaps ended the period approximately where they had begun, at 1.4%. Bolstered by a positive Tankan survey, strong industrial production numbers and other better than expected indicators, bond investors appeared to judge that the recovery in Japan was sufficiently well entrenched that it would not be derailed by a stronger yen.
Efforts by central banks to clarify their prospective policy stance may have helped to forestall further increases in yields. Following its August meeting, the US Federal Open Market Committee stated that an accommodative monetary policy could be maintained for a considerable period, which was interpreted by many market participants as indicating that the Federal Reserve would not increase interest rates even if economic growth were to move above trend for a few quarters, as long as inflation remained subdued. On 10 October, the Bank of Japan issued a statement clarifying its intention to maintain its quantitative
Macroeconomic data and growth forecasts
Macroeconomic surprises1 Growth forecasts for 20044
-3
-2
-1
0
1
Jan 03 Apr 03 Jul 03 Oct 03
US macroeconomic surprises² Ifo³
0
1
2
3
4
Jan 03 Apr 03 Jul 03 Oct 03
United States Euro areaJapan
1 Normalised announcement surprises, based on the difference between actual numbers and consensus forecasts. The observations are positioned in the month in which the actual numbers were released. 2 Weighted average of normalised surprises of the ISM survey, non-farm payrolls, retail sales and producer price and consumer price announcements. 3 The German Ifo survey is a business climate index derived by the Institut für Wirtschaftsforschung from survey responses. 4 Percentage changes over previous year. Forecasts as published monthly by Consensus Economics. The observations are positioned at the end of the month in which the forecast was made.
Sources: Bloomberg; © Consensus Economics; BIS calculations. Graph 1.3
… while euro yields move virtually in lockstep
Yields in Japan rise despite a stronger yen
Central banks work to clarify their policy stance

BIS Quarterly Review, December 2003 5
Swap yield curves In percentages
US dollar Euro Yen
1
2
3
4
5
3-m 1-yr 3-yr 5-yr 7-yr 9-yr
28 Nov 2003 30 Sep 2003 29 Aug 2003
1
2
3
4
5
3-m 1-yr 3-yr 5-yr 7-yr 9-yr0.0
0.4
0.8
1.2
1.6
3-m 1-yr 3-yr 5-yr 7-yr 9-yr
Maturity
Note: For three-, six- and 12-month US dollar and yen maturities, Libor; for three- and six-month euro maturities, euro deposit rates.
Source: Bloomberg. Graph 1.4
easing policy at least until year-on-year changes of zero or higher were “confirmed over a few months” for core CPI, and a majority of the Policy Board forecast positive changes in core CPI over the forecasting period. Robust demand for dollar bonds from Asian financial authorities and other investors in the international debt securities market also helped to limit the impact of currency movements on dollar yields (see the box on page 33).
The decline in yields in early September seemed to help restore order to the settlement process in the US repo market, where the number of “fails”, or unsettled trades, had surged in July and August. Facing a sell-off in government bond markets, some market participants had reportedly tried to take short positions by simultaneously borrowing the on-the-run 10-year US Treasury note in the repo market and selling it in the outright market. In many cases, however, such speculators could not find the security when it was time to deliver, because few investors had been willing to lend it. This evidently led to the large number of fails. Once yields fell in early September, such shorting activity apparently became less significant, and the number of fails dropped sharply.
Despite the reassurances by central banks, the spate of favourable data releases in October led to a change in market expectations about the timing of future increases in dollar and euro policy rates. By the end of October, futures markets had priced in a tightening by the Fed and ECB of as much as 50 basis points by mid-2004. By contrast, most economists continued to attach a low probability to a rate hike before the end of 2004. The Reserve Bank of Australia became the first major central bank to tighten, raising its policy rate by 25 basis points on 5 November, followed a day later by the Bank of England.
Futures price in tightening by mid-2004

6 BIS Quarterly Review, December 2003
Emerging markets benefit from rating upgrades
The year-long narrowing of credit spreads, which had paused in the summer amidst the volatility in bond markets, resumed in the autumn. Liquidity probably played a role, as investors channelled significant amounts into US high-yield mutual funds in late September and October after withdrawing funds in early August. Spreads between BBB-rated US corporate debt and US Treasuries narrowed by around 14 basis points between 1 October and 21 November, those on high-yield dollar debt fell by around 70 basis points and emerging market spreads tightened by 42 basis points (Graph 1.5).
The period under review was extraordinarily positive for sovereign credit ratings, particularly in Asia (Graph 1.6). Ten jurisdictions – China, Greece, Hong Kong SAR, Indonesia, Macau SAR, Malaysia, Pakistan, Russia, Thailand and Turkey – received upgrades from at least one of the three major international rating agencies in October alone. Improving fiscal fundamentals and increased reserves were usually the headline reasons. Russia’s two-notch upgrade by Moody’s to investment grade capped a spectacular improvement in ratings for a country that had defaulted as recently as 1998.
The upgrades for sovereigns appear to have been anticipated by a narrowing of credit spreads, with an announcement effect evident only in the case of Russia. Asian investment grade sovereign spreads fell over the period to historically low levels, well below those prior to the Asian financial crisis of 1997–98. Reports of an intensifying investigation into Russia’s largest oil firm Yukos, culminating in the arrest of its chief executive, led to a sharp sell-off in Russian bond and equity markets from mid-October. However, these markets subsequently stabilised at levels seen shortly before the upgrade. Moreover, events in Russia had no impact on other emerging markets.
Credit spreads1
In basis points
BBB-rated bonds High-yield spreads
50
100
150
200
250
Jan 03 Apr 03 Jul 03 Oct 03
US dollar Euro
300
450
600
750
900
Jan 03 Apr 03 Jul 03 Oct 03
US dollarEuroEMBI+²
1 Option-adjusted spread over government bonds as calculated by Merrill Lynch for corporate bond indices. 2 Weighted spread of sovereign debt instruments over US Treasury securities as calculated by JPMorgan Chase.
Sources: Bloomberg; JPMorgan Chase; Merrill Lynch. Graph 1.5
Credit spreads narrow
Many sovereigns receive upgrades in October
Asian high-grade spreads fall markedly …

BIS Quarterly Review, December 2003 7
Emerging market spreads1 and October upgrades In basis points
100
150
200
250
300
350
400
Jan 03 Apr 03 Jul 03 Oct 03
Russia Indonesia
0
25
50
75
100
125
150
Jan 03 Apr 03 Jul 03 Oct 03
ThailandMalaysia
Note: The vertical lines indicate an upgrade of the sovereign credit rating by either Standard & Poor’s or Moody’s. On 8 October 2003, Russia was upgraded from Ba2 to Baa3 by Moody’s, Indonesia from B– to B by Standard & Poor’s, Thailand from BBB– to BBB by Standard & Poor’s and Malaysia from BBB+ to A–, also by Standard & Poor’s.
1 Spread against US Treasuries.
Sources: Bloomberg; Datastream; JPMorgan Chase; Moody’s; Standard & Poor’s. Graph 1.6
Not all emerging market bonds saw a narrowing of spreads. Philippine
bonds traded lower given lingering political uncertainties, as did Colombia’s amid ongoing fiscal problems. But, in general, a continuing search for yield kept demand for emerging market debt more than ample to meet the steadily increasing supply of international bonds (see “The international debt securities market” on page 27). Aggressive pricing on China’s $1.5 billion sovereign bond issue in October provided a significant example of the strength of demand for Asian paper in particular. About one-half of the issue was reportedly placed in Asia.
Meanwhile, both investment grade and high-yield bonds in the United States and euro area were also supported over the period by signs of improvement in credit quality. In addition to an accumulation of positive corporate earnings announcements, default rates continued to edge down, with the 12-month moving average of defaults as a percentage of speculative grade issuers at 5.7% at the end of the third quarter, the lowest in nearly three years.
Credit markets were not entirely free from volatility, however. In the last few weeks of October, spreads widened dramatically in the automobile and related finance company sector, following Standard and Poor’s unexpected downgrade of DaimlerChrysler and placement of Ford and its affiliated finance company on credit watch. There was even concern in some quarters over the potential systemic impact on financial markets if Ford were to be downgraded to non-investment grade. Ford Motor Credit, with $130 billion of unsecured term debt, is among the largest finance companies globally, and its bonds account for a significant proportion of many investors’ portfolios (see the box on page 8). But S&P’s announcement of a stable outlook for Ford’s credit
… amidst strong demand for Asian paper
Automobile sector downgrades add volatility

8 BIS Quarterly Review, December 2003
Credit ratings of large finance companies Eli Remolona and Dimitrios Karampatos
Finance companies are among the largest issuers of corporate bonds. Ford Motor Credit is one such issuer. Its recent downgrade raises the question of how important credit ratings are to big finance companies. Ford Motor Credit is also a fully owned subsidiary of a large manufacturing concern, and it is of interest to see what role the parent plays in the rating of a finance company subsidiary.
Finance companies in the United States are a diverse group of financial intermediaries. Like commercial banks, they extend credit to both households and businesses. Unlike banks, however, they do not take deposits and are thus not subject to the regulation and supervision that apply to depository institutions. According to the most recent survey by the US Federal Reserve, the US finance company sector as a whole held $1 trillion in financial assets as of mid-2000, making it one fifth the size of the US commercial banking industry. The finance company sector is highly concentrated: there are about 1,000 US finance companies, but only 20 of them account for nearly 70% of all the sector’s receivables.
Having no access to deposits as a source of funds, the large finance companies rely heavily on the debt securities markets, while the smaller ones depend on bank credit. The corporate bond market is the main source of funds for the sector as a whole, providing at least one third of the sector’s funding. The commercial paper (CP) market is the second most important source, accounting for about 18%.
The reliance on securities markets makes credit ratings crucial to large US finance companies. The ratings determine their cost of funds and thus the terms on which they can compete with other financial intermediaries. These ratings consist of short-term ratings for the CP market and long-term ratings for the corporate bond market.
Ratings of large US finance companies1
Short-term versus long-term rating2 Finance company versus parent rating3
BBB+ A AA- AA+
A-3
A-1
A-2
GE
DB, AXP
AFC
CO
FORD
GMAC, CHR, MBNA
HF
CHL
Sample45º line
BBB
AA
A
GE
MBNA
HF DB
AFC
CO FORD
GMAC
AXP
CHL CHR
BBB AA A
1 Average rating between Standard & Poor’s and Moody’s, as of the end of November 2003. AFC is Associates First Capital, AXP American Express, CHL Countrywide Home Loans, CHR DaimlerChrysler Financial Services, CO Capital One Bank, DB Discover Bank, FORD Ford Motor Credit, GE General Electric Capital, GMAC General Motors Acceptance Corporation, HF Household Finance and MBNA MBNA America Bank. 2 Short-term rating on the vertical axis, long-term rating on the horizontal axis. 3 Long-term rating for the finance company on the vertical axis, long-term rating for the parent company on the horizontal axis.
Source: Bloomberg. __________________________________
For a comprehensive discussion of the survey, see K E Dynan, K W Johnson and S M Slowinski, “Survey of finance companies, 2000”, Federal Reserve Bulletin, January 2002, pp 1–14. For an analysis of how finance companies compete with banks, see E M Remolona and K C Wulfekuhler, “Finance companies, bank competition and niche markets”, FRBNY Quarterly Review, Summer, 1992, pp 25–38.

BIS Quarterly Review, December 2003 9
Raising funds in the CP market on a regular basis effectively requires a high short-term rating
– eg P-1 from Moody’s or A-1 from Standard & Poor’s. A lower rating is a serious handicap, because money market mutual funds, which are the most important investors in the CP market, are severely limited by regulation in how much lower-rated paper they can hold. There is a rough correspondence between short-term and long-term ratings. As shown in the left-hand panel of the graph, a single-A long-term rating tends to serve as the threshold between high and low short-term ratings. When downgrades in early 2002 pushed the largest automobile finance companies below this threshold, they lost access to the CP market (although they could still issue asset-backed CP by securitising receivables) and had to rely more heavily on the corporate bond market.
The largest finance companies tend to be subsidiaries of other corporations, and for these companies the single most important determinant of long-term ratings is the rating of the parent. Indeed, the three large automobile finance companies are “captive” subsidiaries in that they are largely in the business of lending to finance their parents’ products. When Standard and Poor’s announced the downgrade of Ford Motor Credit in November 2003, the rating agency’s rationale was simply, “The ratings on Ford Motor Credit reflect those of its parent, Ford Motor Co”. As shown in the right-hand panel of the graph, in a sample of 11 large finance companies, the parent and the subsidiary are assigned the same rating in the majority of cases. When the ratings differ and the parent is not itself a financial intermediary, the subsidiary tends to have the higher rating. When only the subsidiary is a financial institution, it needs the high rating more than does the parent, and the financial ties between the two will often be designed to favour the subsidiary’s rating.
In the long run, credit ratings are critical for the viability of a large finance company. Since ratings determine the cost of funds, a finance company cannot indefinitely continue to operate with ratings lower than those of its competitors (unless it has a parent with sufficiently deep pockets willing to provide subsidies). In 1990, for example, Chrysler Financial was the fourth largest finance company in terms of receivables, about half the size of Ford Motor Credit. However, Chrysler Financial had just been downgraded to BBB– at a time when two of its rivals, GMAC and Ford Motor Credit, still had AA– ratings. Large commercial banks in the business of automobile finance also tended to have double-A ratings. As a consequence, Chrysler Financial steadily lost ground until its parent merged with Daimler-Benz in 1998, by which time it was less than one fifth the size of Ford Motor Credit. __________________________________
Under a 1991 rule of the US Securities and Exchange Commission, money market mutual funds may hold no more than 5% of their portfolio in the form of lower-rated CP. This result has been established empirically by Remolona and Wulfekuhler (1992). These financial ties may include attorney’s letters and debt covenants that prevent the parent from taking capital out of the finance company.
rating upon its downgrade to BBB– on 12 November diminished fears that a downgrade to junk bond status was imminent. Indeed, spreads on Ford debt narrowed to the levels seen before the corporation was placed on credit watch.
Equities rally on strong earnings
The improving economic outlook gave a further boost to global equity markets starting in early September. After being rangebound from mid-June to late August, the MSCI World index gained 8% between 29 August and 28 November (Graph 1.7). Many emerging markets posted double digit gains, with Argentina, Brazil and Turkey all rising by upwards of 30%. This brought the total increase in the MSCI World since the trough on 12 March to 37%.
In the major markets, investor optimism was fuelled by an acceleration in earnings growth. Earnings per share reported by companies included in the
Global rally in equity markets resumes …
… as earnings growth accelerates

10 BIS Quarterly Review, December 2003
Equity markets
Americas Europe Asia
0.4
0.7
1
1.3
1.6
1.9
Jan 03 Jul 03
Risk aversion (lhs)4
MSCI World (rhs)1, 2 S&P 500 (rhs)1
Jan 03 Jul 03
Risk aversion (lhs)4
DJ EURO STOXX (rhs)1
FTSE 100 (rhs)1
80
90
100
110
120
130
Jan 03 Jul 03
TOPIX (rhs)1 Asia excl Japan (rhs)1, 3
1 End-December 2002 = 100. 2 In US dollars. 3 MSCI index; in local currency. 4 Derived by comparing probabilities implied by option prices, on S&P 500 and FTSE 100, with probabilities estimated from a time series of realised returns, using the approach of Tarashev et al in “Investors’ attitude towards risk: what can we learn from options?”, BIS Quarterly Review, June 2003.
Sources: Bloomberg; Datastream; BIS calculations. Graph 1.7
S&P 500 increased by 20% year over year in the third quarter, significantly above analysts’ initial forecasts and up from 11% in the second quarter. Profit margins were boosted by further cost cutting; productivity in the US non-farm business sector improved by an astounding 8% in the third quarter. Sales also picked up in many sectors, in particular technology-related sectors. Despite the recent volatility in bond markets, investment banks reported surprisingly strong earnings.
Even while reporting better than expected sales and profit growth in the third quarter, many firms, including Cisco, Amazon and other bellwether firms, warned that the outlook for 2004 was uncertain. US companies announcing negative outlooks for future earnings continued to outnumber those announcing positive outlooks (Graph 1.8).
Investors in the United States, however, appeared to discount these warnings and to demonstrate greater confidence in the economic outlook than firms themselves. Although weaker than expected macroeconomic news did weigh on US equity markets in late September, any uncertainty was allayed by October’s data releases. Reflecting both perceived future volatility in market returns and investors’ risk aversion, implied volatility in equity index options declined to unusually low levels in late October and early November: 16% for the S&P 100, compared to 23% on average over the first nine months of 2003 (Graph 1.8). Indeed, estimates of effective risk aversion derived from these options remained low (Graph 1.7). The impressive rally in equity markets so far this year appeared to support a growing appetite for risk.
In contrast to US markets, in the Japanese equity market investors seemed increasingly uncertain about the future. Japanese equities experienced some exceptionally large daily swings even in the absence of significant news.
US investors show greater confidence than firms
Japanese investors begin to question valuations

BIS Quarterly Review, December 2003 11
Profit warnings and equity market volatility
US profit warnings1 Implied volatilities2
-80
-60
-40
-20
0
Jan 01 Jan 02 Jan 03
Warnings diffusion index13-week moving average
10
20
30
40
50
Jan 01 Jan 02 Jan 03
S&P 100TOPIX
1 Difference between positive and negative announcements by companies regarding forecast earnings as a percentage of all announcements. 2 Implied volatilities of index call options; weekly averages.
Sources: Bloomberg; BIS calculations. Graph 1.8
For example, on 23 October the TOPIX fell by 5% despite the lack of any identifiable trigger. It rebounded over the following week before turning down again in early November. This volatility appeared to reflect growing doubts about prevailing valuations, and in particular about whether fundamentals in Japan had improved sufficiently to justify the 25% increase in the TOPIX since the end of April.
It was notable that investor sentiment proved robust to investigations into some of the key institutions underpinning the functioning of modern financial
Portfolio flows by US investors In billions of US dollars
Cash equivalents Long-term mutual funds
-90
-45
0
45
90
135
Jan 02 Jan 03
Money market fundsBank deposits¹
-60
-40
-20
0
20
40
Jan 02 Jan 03
Equity fundsCorporate bond funds²
1 Monthly change in the seasonally adjusted stock of funds on deposit with commercial banks in the United States. 2 Includes high-yield bond funds.
Sources: US Federal Reserve Board; Investment Company Institute. Graph 1.9

12 BIS Quarterly Review, December 2003
markets. In mid-2002 revelations of accounting and governance improprieties at several prominent firms had rocked equity markets. By contrast, in September 2003 questions about the governance of the New York Stock Exchange – the world’s largest and most liquid equity market – and the resignation of its chairman seemed not to dampen confidence. Also starting in September, allegations of fraud unsettled the mutual fund industry and raised concerns about a potential liquidation of assets by mutual funds facing charges to meet withdrawals. In the United States, most retail investors own mutual funds; the industry manages over $7 trillion in assets. US state regulators in conjunction with the Securities and Exchange Commission charged several funds with improper trading, including late trading after the price had been fixed for the day. Those fund managers facing charges did experience large withdrawals, but to date there have been no signs of a more widespread redemption of funds. On the contrary, the rally in equity markets appeared to prompt US investors to shift out of bank deposits and other cash equivalents in September and October and into equities, including into equity mutual funds (Graph 1.9).
Allegations of fraud unsettle the mutual fund industry

BIS Quarterly Review, December 2003 13
Patrick McGuire+41 61 280 8921
2. The international banking market
In the second quarter of 2003, the increase in claims on corporate and other non-bank borrowers was again overshadowed by flows between banks, much of which reflected inter-office activity and investment in securities issued by other banks. Moreover, the expansion in claims on the non-bank sector was driven by investments in international debt securities, primarily government debt, while flows to this sector in the form of loans remained subdued.
A second consecutive quarter of positive net flows to emerging markets was this time driven by movements in deposits. However, differences across regions were substantial. Large deposit repatriations by banks in China led to a net inflow to the Asia-Pacific region. At the same time, repatriations by banks in Russia were behind the second largest net inflow to the emerging European countries in five years. Conversely, increases in deposits with reporting area banks, especially by banks in Brazil, contributed to the fifth consecutive net outflow from Latin America.
Loans to corporations subdued as banks invest in securities
Banks parked funds in other banks and in debt securities in the second quarter of 2003, reflecting a trend that has been evident since mid-2002. Throughout this period, banks have shifted funds between government securities and the interbank market, while no clear sign of a sustained increase in lending to corporate and other non-bank borrowers has emerged. Claims in the form of loans to non-banks remained weak relative to debt security investment in this sector, an indication that corporate borrowing has yet to pick up.
Evidence of the repeated shift between government securities and interbank lending can be seen in Table 2.1, which shows the periodic swelling in interbank claims that has been evident since at least 2001. Peaks in interbank claims seemingly occur every other quarter, including the second quarter of 2003. In seasonally unadjusted terms, interbank lending in the second quarter boosted the outstanding stock of total cross-border claims by $495 billion, to $14.9 trillion. This pushed the year-over-year growth in claims to 10.3% from 8.8% in the previous quarter, the fifth consecutive quarter of accelerating claim growth (Graph 2.1, left-hand panel).
Interbank lending dominates credit flows …

14 BIS Quarterly Review, December 2003
Cross-border claims by sector and instrument
By sector Debt security claims on non-banks3
-5
0
5
10
15
1998 1999 2000 2001 2002 2003 -200
0
200
400
600
Claims on banks (lhs)¹ Claims on non-banks (lhs)¹ Annual growth of total (rhs)²
25
35
45
55
1996 1998 2000 2002
EuroYenUS dollar
1 Exchange rate adjusted changes in amounts outstanding, in billions of US dollars. 2 Calculated as the sum of exchange rate adjusted changes in amounts outstanding between periods t–3 and t, divided by the amount outstanding in period t–4, in percentages. 3 As a percentage share of total claims on non-banks. Graph 2.1
Repo and intragroup activity drives claims on banks
Claims on corporate and other non-bank borrowers were again overshadowed by interbank lending. Claims on banks increased by $304 billion, more than double the long-term average increase of $121 billion, although inter-office lending accounted for over 60% of this. Following a quarter of weak growth, interbank claims of banks in the United Kingdom rose by $104 billion, the third largest increase for that country in the BIS statistics. Much of this reflected intragroup business with counterparties in Germany, Japan, France and Switzerland, and greater lending to banks in the United States.
Credit to other banks from banks in the United States and Germany was also robust, seemingly driven by repo activity and inter-office claims. Of the $37 billion expansion in claims on banks by banks in the United States, $20 billion was channelled to banks in the United Kingdom, and was explained by an increase in repo agreements. An additional $26 billion flowed to banks in offshore centres, primarily in the Cayman Islands and Jersey, and largely reflected inter-office business (see the box on page 16). Cross-border claims on banks by banks in Germany also grew, by $76 billion, approximately half of which was attributable to interbank lending to banks in the United Kingdom.
Banks invest in government and private sector securities
Although the increase in total claims on non-bank borrowers was relatively strong in the second quarter of 2003, clear evidence of a pickup in lending to corporates remained absent. In a period of expanding fiscal deficits and greater government bond issuance, the actual flow of loans to non-bank borrowers was obscured by comparatively large investments in debt securities. Total cross-border claims on the non-bank sector rose by a relatively large $192 billion to $5.2 trillion. However, only 9% of this rise was accounted for by actual loans to non-bank borrowers, compared with the long-term average of 46%. A total of $137 billion in purchases of international debt securities, the largest increase in
… especially from banks in the United Kingdom …
… as lending to corporations remains subdued

BIS Quarterly Review, December 2003 15
the BIS coverage period, and $38 billion in equity investments by BIS reporting banks were the main factors behind growth in claims on this sector.1
The rise in debt security claims in the second quarter was a continuation of a longer-term trend that has been evident since at least 1996. The share of debt security claims in total claims vis-à-vis non-banks has risen in recent years, largely driven by increases in euro-denominated claims. International debt securities issued by non-bank borrowers now comprise 42% of total claims on non-banks, up from 40% in the previous quarter and 39% a year earlier. Debt security claims accounted for over 50% of all euro-denominated credit to non-bank borrowers since the first quarter of 1999, mainly in the form of euro area government securities (Graph 2.1, right-hand panel). Roughly 54% of the $1.2 trillion in outstanding euro-denominated debt securities issued by governments and other non-bank borrowers is held within the euro area.
Cross-border claims of BIS reporting banks Exchange rate adjusted changes in amounts outstanding, in billions of US dollars1
2001 2002 2003
Year Year Q2 Q3 Q4 Q1 Q2
Stocks at end-Jun
2003
Total cross-border claims 859.4 741.8 225.4 93.8 365.3 336.5 495.3 14,853.8
Total claims on banks 417.3 455.0 145.0 –53.6 354.1 125.3 303.7 9,663.6 on non-banks 442.1 286.8 80.4 147.4 11.1 211.2 191.6 5,190.2
Loans: banks 363.0 424.6 73.3 –64.5 432.1 98.7 318.9 8,343.3 non-banks 249.2 76.7 9.8 67.1 –15.9 167.0 16.6 2,787.4
Securities: banks 27.3 36.3 60.6 8.4 –51.9 19.8 –6.0 926.4 non-banks 201.4 202.2 79.0 98.8 27.9 54.0 137.3 2,173.0
Total claims by currency US dollar 422.7 320.8 183.7 –114.4 201.9 93.8 248.7 6,095.5
Euro 439.6 463.0 98.5 201.1 119.1 226.8 206.3 5,307.6 Yen –65.5 –40.0 5.4 16.6 19.4 –16.2 –25.6 697.6 Other currencies2 62.5 –2.0 –62.2 –9.5 24.9 32.1 65.9 2,753.1
By residency of non-bank borrower
Advanced economies 384.8 289.6 46.4 134.2 64.5 159.9 163.3 4,031.0 Euro area 139.0 117.4 9.0 49.7 7.2 56.5 67.8 1,804.6 Japan –3.7 4.1 6.3 –0.4 0.5 21.5 15.1 164.4 United States 183.4 140.0 39.1 59.1 59.1 25.8 60.2 1,385.1 Offshore centres 55.0 17.7 36.8 16.7 –28.2 79.6 21.3 595.0 Emerging economies 2.5 –17.0 –4.9 2.4 –23.8 –6.3 3.6 517.2 Unallocated3 –0.2 –3.5 2.1 –5.9 –1.4 –22.0 3.4 47.0
Memo: Local claims4 76.4 38.6 –34.2 –26.5 35.6 182.6 93.5 2,066.2
1 Not adjusted for seasonal effects. 2 Including unallocated currencies. 3 Including claims on international organisations. 4 Foreign currency claims on residents of the country in which the reporting bank is domiciled. Table 2.1
1 The increase in equity investments is partially the result of mark to market accounting in the face of rising equity prices.
Debt security claims have been on the rise …

16 BIS Quarterly Review, December 2003
Offshore centres, the US dollar and the yen
Following a two-year period of sluggish claim growth after the LTCM crisis in 1998, claims on offshore centres have rebounded in recent quarters. Banks in the United States accounted for much of the rise. Total claims on offshore centres by BIS reporting banks totalled $1.8 trillion in the second quarter of 2003, more than double the stock in 1990. Moreover, the share of claims on offshore centres has recently trended upwards, averaging 12% of total claims since end-2001 compared with an average of 11% in 2000 and 2001.
Three consecutive quarters of relatively large increases in claims on offshore centres by banks in the United States, primarily vis-à-vis the Cayman Islands and Jersey, have been largely responsible for the overall rise in offshore centre activity. These recent moves have further established the US banking sector as the biggest user of offshore centres, a position it has held since the fourth quarter of 2000. Total claims of banks in the United States on offshore centres totalled $601 billion in the second quarter of 2003, accounting for roughly one third of all claims on offshore centres. As shown in the left-hand panel of the graph below, the share of total interbank claims originating from banks in the United States that pass through offshore centres reached 42% in the second quarter of 2003 compared with just over 34% a year earlier. More globally, an increasing share of US dollar-denominated claims has filtered through offshore centres in recent quarters. As shown in the graph on the next page, the share of total US dollar-denominated claims passing through offshore centres hit 19% in the first half of 2003, up from 17% throughout 2002 and less than 15% in early 2000. Over half of this is attributable to US dollar activity in the Cayman Islands, whose share of business in this currency has recently approached that of the United Kingdom, and is continuing to rise.
An increasingly large portion of offshore business is vis-à-vis non-bank counterparties such as hedge funds, insurance companies and securities firms. While it is difficult to individually isolate these counterparties in the data, the BIS data do permit an “upper bound” calculation on their total share in offshore activity. As shown in the right-hand panel of the graph below, the share of claims on the non-bank sector in total claims on offshore centres has risen steadily since at least 1995 for
Claims on offshore centres by currency and sector
In percentages
Claims on banks by reporting country1 Claims on non-banks by currency2
15
30
45
60
1995 1997 1999 2001 2003
United StatesJapanCanadaPortugal
5
15
25
35
1995 1997 1999 2001 2003
EuroYenUS dollar
1 Share of total claims on banks. Developed countries with the largest share of their total claims on offshore centres in 2003 Q2 are listed. 2 Share of total claims on non-banks in offshore centres.
__________________________________
The sudden drop in the share of euro-denominated claims on the United Kingdom and the corresponding rise in the share on offshore centres shown in the middle panel of the graph below largely reflect reporting changes in the fourth quarter of 2001. Claims vis-à-vis Jersey had previously been reported as claims on the United Kingdom.

BIS Quarterly Review, December 2003 17
Claims on offshore centres and the United Kingdom by currency1
US dollar Euro Yen
0
5
10
15
20
2000 2001 2002 2003
Offshore centres Bahamas Cayman Islands Jersey United Kingdom
0
2
4
6
2000 2001 2002 20038
11
14
17
Offshore centresCayman IslandsJerseySingaporeUnited Kingdom (lhs)
0
10
20
30
2000 2001 2002 2003
Offshore centresCayman IslandsHong Kong SARSingapore United Kingdom
1 Percentage share of total claims in each currency of all currency reporting countries.
all currency denominations. Interestingly, the share of euro-denominated business is more concentrated in non-bank counterparties than is US dollar business, mainly due to the high volume of loans that passes between banks in the United States and their affiliates in the Bahamas and the Cayman Islands. Reflecting this, the share of claims on non-banks in total claims on the Cayman Islands has actually been falling, from 47% to 42% over the last three quarters. Conversely, the shift to non-bank counterparties has been most pronounced in the Bahamas and Bermuda.
Concurrent with the rise in US dollar business, yen-denominated activity in offshore centres has continuously trended downwards since the third quarter of 2001. This is explained to a great extent by the global retrenchment of Japanese banks over the last decade. The share of yen-denominated activity in offshore centres plunged to less than 10% in the second quarter of 2003 from over 36% in 1995. Thirty-five per cent of the total stock of interbank claims of banks in Japan was on banks in offshore centres in the second quarter of 2000, the highest share of all BIS reporting countries at that time. By the second quarter of 2003, however, this share had slipped to just over 30%, second to the United States, and largely reflected a reduction in round-tripping activity through Hong Kong SAR. This unwinding of interbank loan positions contributed to the rise in the share of claims on non-bank financial counterparties in total yen-denominated claims (right-hand panel of the graph on the previous page).
__________________________________
After Japan, the most offshore-intensive banking systems in the second quarter of 2000 were located in the United States (34%), Portugal (32%) and Canada (31%). By the second quarter of 2003, the top four positions were occupied by the United States (42%), Japan (31%), Canada (22%) and Switzerland (20%). The rise of Switzerland into fourth place reflected reporting changes in the fourth quarter of 2001, after which claims vis-à-vis Jersey were reported separately from those on the United Kingdom.

18 BIS Quarterly Review, December 2003
European and Japanese banks were the most active investors in international debt securities in the second quarter of 2003. Overall, banks in the European Union purchased $97 billion in international debt securities, much of which reflected investment in government debt. This was the largest quarterly increase in international debt security claims for this group of countries since the first quarter of 1999, and their second largest ever. Almost 80% of the rise in these claims flowed to non-bank borrowers, primarily in the euro area and the United States. In contrast, only $14 billion of the relatively robust $253 billion increase in loans from banks in the European Union went to non-bank borrowers. On a consolidated basis, which nets out inter-office positions, claims on the public sector by banks in developed Europe rose to 13% of all consolidated international claims on developed countries, up from 12% in the previous six quarters.2
The investment in debt securities was relatively widespread across reporting countries in the European Union. Banks in the United Kingdom purchased $13 billion in US debt securities, much of it US government debt, and a total of $11 billion in securities issued by euro area banks, primarily those in Italy, Germany, the Netherlands and Ireland. Banks in Belgium and the Netherlands invested in euro area government debt, while banks in Ireland purchased $19.5 billion in securities from non-bank issuers in the United States, Italy and Germany.
Elsewhere, Japanese banks continued to channel funds to the public sector, particularly that in Europe and the United States. Loans to non-bank borrowers from banks in Japan fell in the second quarter by $40 billion, reflecting reduced lending to borrowers in the United States and euro area. However, total claims of banks in Japan were boosted by a $62 billion investment in international debt securities, much of which was comprised of euro area and US government debt. On a consolidated basis, Japanese banks’ international claims on the public sector expanded by $44.8 billion, pushing the share of claims on this sector to 38.5% of their total claims from 28.4% a year earlier. Japanese banks’ consolidated claims on the US public sector increased by over $10 billion, and those on euro area public sectors, primarily in Germany, France and Italy, by nearly $27 billion.
Flows into and out of emerging markets driven by deposits
The net flow of funds into emerging markets from banks in the BIS reporting area was again positive in the second quarter of 2003, although differences across regions were substantial (Graph 2.2). A net inflow of $11 billion reflected a slight decline in claims on emerging markets and a more significant fall in liabilities of reporting banks. These liabilities fell by $14 billion as banks in China, Korea and Russia repatriated deposits. This led to net inflows to the
2 This calculation excludes France as a reporting country because of changes in accounting practices in the second quarter of 2003.
… reflecting investments in US and euro area government securities

BIS Quarterly Review, December 2003 19
Net bank flows to emerging economies¹ Exchange rate adjusted changes in amounts outstanding, in billions of US dollars
Latin America & Caribbean Asia & Pacific Emerging Europe
1997 1999 2001 2003
Claims Liabilities² Net flow³
1997 1999 2001 2003-45
-30
-15
0
15
30
1997 1999 2001 20031 A positive value represents an inflow to emerging economies from banks in the BIS reporting area, and a negative value an outflow from emerging economies. 2 A positive value indicates a decrease in BIS reporting banks’ liabilities vis-à-vis emerging economies, and a negative value an increase. 3 Changes in claims minus changes in liabilities. Graph 2.2
Asia-Pacific region and emerging Europe, whereas Latin America experienced its fifth consecutive net outflow. The share of cross-border claims on emerging market borrowers continued its downward trend, falling to 6% of total claims of BIS reporting banks from 7% throughout 2002 and 8% throughout 2001.
In addition to the gradual shift away from emerging market lending, reporting area banks have reduced exposure to riskier borrowers within emerging markets, as evidenced by the rise in the average rating of their emerging market cross-border portfolios.3 With the Standard & Poor’s sovereign ratings of the regional vis-à-vis countries held constant at their 2002 Q4 level, the average rating of the Latin America portfolio of each of the top four creditor banking systems rose from near CCC+ in the second quarter of 2000 to near B in the second quarter of 2003 (Graph 2.3). As discussed below, this is largely the result of reduced exposure to Argentina and Brazil. Although less pronounced, a rise in the average rating of the top creditors’ Asia-Pacific and emerging Europe portfolios also occurred over this period.
Increased deposits result in net outflow from Latin America
The outflow from Latin America continued in the second quarter of 2003, this time due mainly to relatively large increases in deposits placed with banks in the reporting area by residents in Latin America. Although total claims on the region fell for the eighth consecutive quarter, the year-over-year rate of
3 The average rating for a particular reporting country is calculated as the weighted average of the Standard & Poor’s sovereign ratings of all vis-à-vis countries to which the reporting country lends. The weights are the share of ultimate risk claims on each vis-à-vis country in total ultimate risk claims of the reporting country. See the September 2003 issue of the BIS Quarterly Review for details of the calculation.
Average rating of emerging market portfolios edges upwards

20 BIS Quarterly Review, December 2003
Average rating of emerging market portfolios by reporting country1
Latin America & Caribbean Asia & Pacific Emerging Europe
BB BB– B+
B
B–
CCC+
Jun 99 Jun 00 Jun 01 Jun 02 Jun 03
Spain United States United KingdomGermany
BB+BB
BB–
B+
Jun 99 Jun 00 Jun 01 Jun 02 Jun 03
United KingdomUnited StatesGermanyJapan
BB+BB
BB–
B+
Jun 99 Jun 00 Jun 01 Jun 02 Jun 03
Germany Italy Belgium Netherlands
1 Top four reporting countries with the highest shares of claims on the region. Vis-à-vis country ratings held constant at their 2002 Q4 level. Graph 2.3
contraction slowed to 7% (from 9% in the previous two quarters), and reflected the improvement in economic conditions in several of the major borrowing countries. The stock of claims on the region fell to $275.5 billion, or 29.6% of total claims on emerging markets (down from 31.5% a year earlier). At the same time, liabilities vis-à-vis Latin America rose by $11 billion as both banks and non-banks in the region increased deposits with reporting area banks.
A decline in claims on Brazilian residents and greater lending to Argentine banks were noteworthy, while claims on most other countries in the region remained stable from the previous quarter. Claims on Brazil fell by $1.7 billion, partially the result of Banco Bilbao Vizcaya Argentaria’s sale of its Brazilian branch and a reduction in loans to the Brazilian bank and non-bank sectors from banks in offshore centres. This pushed claims on Brazil down to 32% of total claims on the region, from 33% in the previous quarter and 34% a year earlier. Elsewhere, claims on Argentina rose for the first time since the second quarter of 2001, this time by $1 billion, following increased loans to the Argentine bank sector from banks in offshore centres. The share of claims on Argentina in total claims on Latin America has stabilised at 11% in the last three quarters, after falling from its 1999 fourth quarter peak of 17%.
It was increases in deposits by banks in Brazil and Mexico that were significant in the second quarter of 2003. Banks in Brazil deposited $3.9 billion with banks in the United States, primarily denominated in US dollars and euros. The liabilities of banks in many European countries as well as in offshore centres vis-à-vis banks in Brazil also grew, although by smaller amounts. Liabilities vis-à-vis banks in Mexico rose by $0.7 billion, as banks in this country increased deposits with banks in the United Kingdom. Similarly, an expansion in deposits with banks in offshore centres by non-banks contributed to the $2.3 billion net outflow from Mexico.
Claim movements vis-à-vis Latin America are modest …
… while increases in deposits drive the net outflow

BIS Quarterly Review, December 2003 21
Cross-border bank flows to emerging economies Exchange rate adjusted changes in amounts outstanding, in billions of US dollars
2001 2002 2003 Banks’ positions1 Year Year Q2 Q3 Q4 Q1 Q2
Stocks at end-Jun
2003
Total2 Claims –27.0 –36.9 1.1 –0.3 –37.0 33.0 –3.7 931.6 Liabilities 20.3 –45.9 –6.4 –18.4 –10.8 11.0 –14.3 1,115.3
Argentina Claims –5.8 –11.8 –0.8 –4.5 –2.3 –1.9 0.9 30.6 Liabilities –16.7 0.0 0.5 0.3 0.2 0.6 0.1 26.2
Brazil Claims 0.9 –11.2 –2.4 –3.5 –6.3 2.2 –1.7 89.1 Liabilities 0.4 –8.0 –3.8 –1.4 –4.3 3.3 6.6 51.2
China Claims –3.5 –12.4 1.0 4.1 –10.2 16.0 –6.4 54.7 Liabilities –6.5 –3.6 6.4 –1.0 –1.9 1.4 –11.3 84.1
Czech Rep Claims 0.9 2.3 2.0 0.5 0.3 0.7 0.5 15.6 Liabilities 3.4 –3.7 1.9 –1.3 –2.7 –1.8 0.1 10.2
Indonesia Claims –5.4 –6.0 –2.1 –1.3 –1.2 –1.1 –1.0 29.9 Liabilities 1.1 –2.4 –0.3 –0.2 –0.5 0.4 –0.1 12.4
Korea Claims –0.2 8.2 1.8 6.5 –6.4 2.3 –1.6 75.8 Liabilities 1.7 0.5 –5.6 –0.4 –4.8 –0.8 –6.1 24.9
Mexico Claims 2.0 3.1 1.7 –1.9 0.0 –0.5 –0.1 64.4 Liabilities 8.8 –11.4 1.3 –0.3 1.7 4.5 2.2 61.7
Poland Claims 2.3 2.9 0.1 1.1 –0.4 0.9 0.9 29.4 Liabilities 2.8 –3.1 –1.1 –0.8 –2.5 0.8 –1.1 17.5
Russia Claims 1.3 3.6 0.8 –1.1 2.4 1.8 1.7 39.3 Liabilities 5.2 9.6 0.0 4.0 2.0 5.6 –4.4 41.1
South Africa Claims –0.4 –0.4 0.2 –0.6 1.5 –0.4 0.8 19.2 Liabilities 2.1 2.7 1.3 –0.4 1.4 0.6 4.8 26.9
Thailand Claims –3.5 –5.0 –0.5 –0.5 –1.8 –0.3 0.3 19.3 Liabilities 1.3 –4.6 –1.3 –1.4 –1.2 2.5 –0.9 13.1
Turkey Claims –12.0 –2.8 –1.5 –2.1 –0.1 2.4 –0.5 39.2 Liabilities –2.1 0.0 –1.9 –0.2 0.5 –3.9 1.5 17.8
Memo:
EU accession Claims 6.3 10.1 1.9 3.4 3.3 5.7 1.4 103.4 countries3 Liabilities 9.9 –6.4 0.5 –1.3 –5.4 –2.1 –1.2 60.5
OPEC Claims –13.7 –9.8 –0.6 –4.4 –8.2 –0.3 –6.5 124.6 members Liabilities –2.9 –8.8 –3.1 –1.2 1.6 –5.2 –13.6 239.6
1 External on-balance sheet positions of banks in the BIS reporting area. Liabilities mainly comprise deposits. An increase in claims represents an inflow to emerging economies; an increase in liabilities represents an outflow from emerging economies. 2 All emerging economies. For details on additional countries, see Tables 6 and 7 in the Statistical Annex. 3 Bulgaria, Cyprus, the Czech Republic, Estonia, Hungary, Latvia, Lithuania, Malta, Poland, Romania, Slovakia and Slovenia.
Table 2.2
Closing the gap: Asia-Pacific moves closer to net zero position
Funds flowed into the Asia-Pacific region for the second consecutive quarter, largely as a result of changes on the liability side of the balance sheet. Claims on the region actually declined by $2.8 billion to $292.9 billion, mainly reflecting reduced repo activity. Offsetting this decrease in claims, a relatively large repatriation of deposits ($14.8 billion) by banks in the region, primarily those in

22 BIS Quarterly Review, December 2003
China, Korea and Taiwan (China),4 drove the net inflow of $12.9 billion. Reflecting the ongoing repatriation of deposits, liabilities vis-à-vis residents in the region fell to 31% of total liabilities vis-à-vis emerging markets, down from 32% in the previous quarter and 34% a year earlier.
Repo activity with banks in the United States was again a significant determinant of regional claim flows. The claims of banks in the United States on the region’s bank sector fell by $12 billion, the result of reduced credit to banks in Korea, as well as decreases in repo transactions with banks in China and Taiwan. This drop in claims was partly offset by increased interbank loans from banks in offshore centres.
The net flow of funds into the Asia-Pacific region, while erratic, has been on average positive over the last six quarters, leading to a noticeable shift in the net claim stock vis-à-vis the region. At its peak in the second quarter of 1997, the net stock of total claims on the region stood at $220 billion. With the onset of the Asian currency crises, banks in the reporting area reduced credit to the region, while banks in the region channelled their excess funds into cross-border deposits. By the first quarter of 2000, banks in the region had become net creditors to the world’s banking system (Graph 2.4, left-hand panel).
However, the stock of net claims on the Asia-Pacific region bottomed out in the second quarter of 2001 and has since moved closer to positive territory. This recent rise seems to have coincided with the fall in interest rates since 2000 in the United States and elsewhere. In addition, speculative views on exchange rates have probably joined interest rate differentials as a reason for renewed flows to the region. Increased loans to, as well as deposit
Stock of net claims on banks in emerging markets1 In billions of US dollars
Emerging Asia-Pacific Emerging Europe
-90
-45
0
45
90
1996 1997 1998 1999 2000 2001 2002 2003
ChinaKoreaTaiwan, China Emerging Asia-Pacific
-50
-25
0
25
50
1996 1997 1998 1999 2000 2001 2002 2003
Czech RepublicPolandRussiaEmerging Europe
1 Net claims of BIS reporting countries calculated as the total stock of claims on banks minus the total stock of liabilities to banks. Graph 2.4
4 Hereinafter referred to as Taiwan.
Net claims on the Asia-Pacific region expand …

BIS Quarterly Review, December 2003 23
repatriations by, banks in the region have been largely responsible for the rise in the overall stock of net claims. Deposit liabilities of BIS reporting banks vis-à-vis banks in the region have fallen by 15% (or $33 billion) since the first quarter of 2001, while claims on banks have risen by 15% (or $22 billion) over this same period.
This overall trend is largely the result of movements vis-à-vis China, Korea and Taiwan. Banks in China have repatriated deposits in eight of the last 10 quarters, including a relatively large $9.1 billion repatriation in the second quarter of 2003. In consequence, cross-border deposits by banks in China fell from a total of $92.5 billion in the second quarter of 2001 to $70.4 billion in the most recent period under review. At the same time, claims on banks in China have trended upwards since the second quarter of 2002. Both trends have pushed the net stock of claims on Chinese banks towards positive territory, implying that the surplus of funds placed in the international banking system by the Chinese banking sector that has been available for the financing of foreign government deficits is shrinking.5
A similar story is emerging in Taiwan and Korea. Claims on Taiwanese banks have continued to rise since the first quarter of 2002. This, combined with the erratic but downward trend over this same period in the stock of deposits placed with BIS reporting banks, has driven up the stock of net claims on the Taiwanese banking sector from –$42 billion in the second quarter of 2001 to –$21.5 billion in the second quarter of 2003. Banks in Korea, which have long been net borrowers from the international banking system, have also contributed to the rise in the stock of net claims vis-à-vis the region. The stock of net claims vis-à-vis Korea’s banking sector increased from $9 billion in the first quarter of 2002 to $39 billion in the second quarter of 2003, fuelled by increased loan flows and five consecutive deposit repatriations. In the most recent quarter under review, banks in Korea repatriated a total of $6.3 billion in deposits, this time from banks in offshore centres.
Deposit repatriations also drive inflows to emerging Europe
As in the Asia-Pacific region, the stock of net claims on emerging Europe has trended upwards in recent quarters, after falling consistently since the fourth quarter of 1998. The region as a whole has long been a net borrower from the international banking community; since the third quarter of 2000, the net borrower status of the region’s non-banks has more than offset the net creditor position of its banks. However, the stock of net claims vis-à-vis banks in emerging Europe has recently moved towards positive territory, further pushing up the stock of net claims on the region as a whole (Graph 2.4, right-hand panel). Over the last year, this has been driven by increased claims on banks in Russia, Hungary, Poland, the Czech Republic and Turkey, as well as by gradual deposit repatriations by banks in many of these countries.
5 Official foreign exchange reserves in China increased to $346.5 billion in the second quarter of 2003 from $316 billion in the first, although it is not clear to what extent these reserves were placed as deposits with overseas banks.
… as banks in China and Korea repatriate deposits …
… and lending to banks in Taiwan rises
Net stock of claims on emerging Europe grows …

24 BIS Quarterly Review, December 2003
In the second quarter of 2003, deposit repatriation by banks located in the region contributed to the second largest quarterly net inflow ($10 billion) since the first quarter of 1998. Banks in Russia and, to a lesser extent, Poland and Slovakia repatriated a total of $7 billion in deposits from banks in the European Union and the United States. This led to the first drop in liabilities vis-à-vis Russia since the third quarter of 2001; the sustained increase in deposits by the Russian banking sector with BIS reporting banks had made Russia the region’s largest net creditor to the international banking community since the third quarter of 1998.
Greater lending to the region – primarily to banks in Russia, the Czech Republic and Croatia – also contributed to the net inflow. Loans flowed from banks in the United Kingdom to banks in Russia, and from banks in Austria to banks in the Czech Republic. In addition, claims on non-bank borrowers in Poland rose by $0.9 billion, the fourth consecutive increase, as banks in Sweden and, to a lesser extent, Japan purchased Polish government securities.
… as banks in Russia repatriate deposits

BIS Quarterly Review, December 2003 25
International syndicated credits in the third quarter of 2003 Blaise Gadanecz Activity on the international syndicated loan market was subdued in the third quarter of 2003. Signings of facilities fell to $277 billion, which on a seasonally adjusted basis represented a 9% drop from the previous period. Despite preliminary evidence of a turnaround in US financing conditions, US lending volumes remained weak by historical standards. Conversely, European borrowers arranged a high volume of refinancing deals.
Lending to US borrowers remained at comparatively low levels despite evidence from the October Senior Loan Officer Opinion Survey that, overall, domestic banks were not tightening their lending practices. Furthermore, according to the survey, foreign lenders appeared to be slightly easing their standards. These factors had not yet translated into higher signed volumes at the time of writing: at $120 billion, signings remained below the volumes recorded a year earlier. The healthcare, insurance, oil and manufacturing sectors obtained the largest amounts, while the energy industry arranged less than half of the funding secured a year before.
In contrast to US signings, volumes for western European borrowers increased moderately from a year ago. These borrowers closed facilities totalling $108 billion, 75% of which was refinancing, bringing the share of refinancing activity in total European borrowing to a peak. Business was boosted by the transportation, vehicle manufacturing and food sectors. The largest deals were arranged for Volkswagen, which rolled over €10 billion, and for an Italian motorway operator (€8 billion). Alstom SA, which had escaped bankruptcy earlier in the year, obtained in excess of €1.5 billion for debt restructuring.
Lending to emerging market borrowers fell back slightly from its level of a year ago, with a slowdown in the Africa and Middle East region and in Latin America offsetting an increase in Europe. In the Africa and Middle East region, activity was driven by trade and project finance deals. De Beers, a UK-listed company with South African roots, refinanced $2.5 billion, and a state-owned oil enterprise from Angola raised $1.2 billion. Only a few borrowers from Latin American countries – Mexico, Chile and Brazil – raised funds, totalling a modest $1.3 billion, with credit mainly directed at entities from the public sector or those dealing in natural resources.
Business in Asia and eastern Europe was more buoyant. A steady volume of lending to Asian, especially Chinese, borrowers, could be observed. The signings of the latter, concentrated in the petrochemical and telecoms sectors, totalled $2.3 billion. Russian entities, mainly oil and metal firms and banks, borrowed $2 billion. Uncertainty in October about the fate of Yukos, the oil corporation for which banks had started to fund a $1 billion acquisition facility in September, shook Russian financial markets. Borrowers have $1.7 billion worth of outstanding international syndicated loan facilities due to mature by end-June 2004. Turkish banks rolled over $1.4 billion, generally at spreads equivalent to those on the facilities being refinanced. Still, for the region as a whole, weighted average Libor margins on eastern European borrowers’ facilities remain about twice as high as those on western European ones.
Activity in the international syndicated credit market In billions of US dollars Signed facilities Facilities for emerging economies
0
100
200
300
400
500
1999 2000 2001 2002 2003
Total Of which: refinancing
0
10
20
30
40
50
1999 2000 2001 2002 2003
Eastern EuropeLatin America & Caribbean Asia & PacificAfrica & Middle East
Sources: Dealogic Loanware; BIS. __________________________________ The deal had not been signed at the time of writing and is not yet included in the data compiled by the BIS.


BIS Quarterly Review, December 2003 27
Gregory D Sutton+41 61 280 8421
3. The international debt securities market
A sharp fall in net borrowing by euro area entities was responsible for reduced fund-raising through the international debt securities market in the third quarter of 2003. Turbulent market conditions appear to have played an important
Main features of net issuance in international debt securities markets In billions of US dollars
2001 2002 2002 2003
Year Year Q3 Q4 Q1 Q2 Q3
Stocks at end-Sep
2003
Total net issues 1,346.6 1,009.6 179.4 182.2 355.3 347.4 298.6 10,710.7
Money market instruments1 –78.9 2.3 11.8 –10.0 55.4 3.7 –33.2 492.7 Commercial paper 26.9 23.7 19.3 –3.0 46.8 13.3 –25.5 347.2
Bonds and notes1 1,425.4 1,007.3 167.6 192.2 300.0 343.7 331.8 10,217.9 Floating rate issues 390.8 198.9 25.3 39.6 –41.6 –28.0 –14.1 2,230.0 Straight fixed rate issues 995.5 798.2 145.2 155.2 341.2 371.2 341.9 7,657.4 Equity-related issues 39.1 10.2 –2.9 –2.6 0.3 0.5 4.0 330.5
Developed countries 1,259.6 946.2 164.5 171.8 330.9 315.7 277.1 9,500.4 United States 595.6 329.2 33.9 48.8 54.7 29.2 88.1 2,935.4 Euro area 546.5 480.2 93.4 100.3 212.5 208.3 125.1 4,468.5 Japan –11.5 –22.4 –5.3 –10.2 –3.0 –1.8 –3.4 254.9
Offshore centres 28.1 8.3 –1.1 4.7 2.3 4.3 0.4 121.2
Developing countries 42.6 34.2 6.9 8.7 13.0 12.0 19.4 601.1
Financial institutions 1,039.4 835.5 151.7 168.7 273.8 247.2 255.6 7,769.0 Private 954.8 699.0 114.0 132.1 225.6 199.1 212.0 6,587.1 Public 84.6 136.5 37.8 36.6 48.2 48.1 43.7 1,181.9 Corporate issuers 208.3 54.0 –0.1 2.1 15.9 32.0 19.0 1,394.8 Private 170.0 53.3 –1.6 –3.8 10.6 30.3 18.9 1,156.0 Public 38.3 0.7 1.5 5.9 5.2 1.7 0.1 238.7 Governments 82.6 99.2 18.6 14.5 56.5 52.9 22.3 1,058.9 International organisations 16.3 20.9 9.1 –3.0 9.1 15.4 1.7 488.0
Memo: Domestic CP2 –128.8 –104.4 8.7 23.4 11.9 –29.8 –38.3 1,835.1 Of which: US –144.7 –91.4 0.2 23.8 –15.7 –41.9 –22.3 1,290.2
1 Excluding notes issued by non-residents in the domestic market. 2 Data for the third quarter of 2003 are partly estimated.
Sources: Dealogic; Euroclear; ISMA; Thomson Financial Securities Data; national authorities; BIS. Table 3.1

28 BIS Quarterly Review, December 2003
Gross issuance in the international bond and note markets In billions of US dollars
2001 2002 2002 2003 Year Year Q3 Q4 Q1 Q2 Q3
Total announced issues 2,305.3 2,100.6 434.9 490.4 757.9 755.9 681.0
Bond issues 1,348.8 1,165.2 210.1 266.2 435.3 424.7 370.9 Note issues 956.5 935.5 224.8 224.3 322.6 331.2 310.1
Floating rate issues 642.9 603.2 144.1 157.0 123.3 126.6 132.3 Straight fixed rate issues 1,590.2 1,454.7 285.9 325.2 616.6 612.7 522.6 Equity-related issues1 72.2 42.8 5.0 8.2 18.0 16.6 26.1
US dollar 1,131.3 985.9 200.4 218.9 332.1 281.4 285.9 Euro 841.4 806.7 163.9 184.9 330.7 370.2 289.4 Yen 125.2 88.3 21.6 24.5 23.3 26.0 25.3 Other currencies 207.4 219.7 49.0 62.2 71.8 78.4 80.4
Financial institutions 1,710.9 1,633.2 352.7 401.3 583.0 570.2 562.4 Private 1,471.6 1,361.3 291.6 320.7 488.5 467.0 473.1 Public 239.3 271.9 61.1 80.6 94.5 103.2 89.3 Corporate issuers 348.4 210.2 34.0 40.2 54.7 77.7 64.4 Of which: telecoms 135.6 45.9 7.8 10.1 23.5 6.6 7.0 Private 285.7 186.2 28.4 30.7 39.6 70.6 53.2 Public 62.7 24.1 5.6 9.5 15.1 7.1 11.2 Governments 171.2 172.9 28.3 31.1 81.6 79.4 38.9 International organisations 74.8 84.3 20.0 17.9 38.7 28.6 15.3
Completed issues 2,305.1 2,100.2 441.6 495.6 716.9 727.1 678.8
Memo: Repayments 879.7 1,093.0 274.0 303.4 416.9 383.5 347.0
1 Convertible bonds and bonds with equity warrants.
Sources: Dealogic; Euroclear; ISMA; Thomson Financial Securities Data; BIS. Table 3.2
role in the slowdown. Issuance was particularly weak in August, a month that saw heightened interest rate volatility. However, the decline proved to be transitory, as issuance rebounded in September to its second highest monthly rate ever. Nevertheless, because of the slowdown in August, aggregate net issuance fell by 14% in the third quarter to $299 billion (Table 3.1). Gross issuance in the international bond and note markets also contracted over the period, by 10% to $681 billion (Table 3.2).
The decline in fund-raising by euro area entities was partially offset by greater net borrowing by others. For instance, emerging market borrowers stepped up their net issuance in the international debt securities market, against the backdrop of a series of rating upgrades. In July, both Turkey and Venezuela received upgrades from Standard & Poor’s, and both countries subsequently borrowed heavily in the international debt securities market. Many more emerging market countries received credit rating upgrades in October. Russia’s sovereign debt rating was raised to investment grade by Moody’s, a remarkable development for a borrower that had defaulted as recently as 1998.

BIS Quarterly Review, December 2003 29
US financial institutions also raised their net issuance in the third quarter, as economic growth in the United States picked up markedly. This helped to push net issuance of US dollar-denominated securities to $138 billion, roughly equal to that of euro-denominated securities. This is the first time in two years that net dollar issuance has been at least as large as net euro issuance.
Global bond market sell-off disrupts fund-raising
The global bond market sell-off that began in mid-June, the largest since 1994 and discussed in detail in the last issue of this Review, affected issuance plans in the international debt securities market. Long-term government yields in the major markets rose sharply over the 10-week period following the start of the sell-off (Graph 3.1). However, the effect on financing decisions was to some extent mitigated by the fact that credit spreads remained relatively stable and rates were at or near historical lows prior to the start of the sell-off. At first, interest rate volatility in the euro area and the United States did not grow significantly. Towards the end of July, however, interest rate volatility, as measured by the forward-looking volatility implicit in options on government bond futures, increased in the United States and in the euro area. In the case of the United States, the rise was dramatic, and volatility remained elevated during the entire month of August, although by the end of the month it had declined substantially from the peak attained in late July. In the euro area, in contrast, interest rate volatility returned to more normal levels by mid-August. Against this backdrop, announced issuance of international bonds fell markedly in August, to only $69 billion (Graph 3.2). Although August is usually a slow month, issuance was a long way below what would have been expected on the basis of the typical seasonal pattern exhibited by the market.
Government bond markets
Ten-year yields1 Implied volatilities2
3
3.25
3.5
3.75
4
4.25
4.5
4.75
Jan 03 Apr 03 Jul 03 Oct 030
0.25
0.5
0.75
1
1.25
1.5
1.75 United States (rhs)Euro area (rhs)Japan (lhs)
0
3
6
9
12
Jan 03 Apr 03 Jul 03 Oct 03
United States Euro areaJapan
1 In percentages. 2 Price volatility implied by the price of the at-the-money call options on 10-year government bond futures contracts.
Source: Bloomberg. Graph 3.1
Heightened interest rate volatility in August … … coincides with a sharp fall in issuance

30 BIS Quarterly Review, December 2003
Announced issuance of international bonds and notes In billions of US dollars
Actual and expected¹ bond issuance Issuance in 2003 Q3, by nationality
0
50
100
150
200
Jul 02 Jan 03 Jul 03
Actual Expected
0
50
100
150
200
EA² US GB JP DC²
JulyAugustSeptember
¹ Computed from the seasonal pattern of monthly percentage changes in issuance. Assumes that the natural logarithm of deseasonalised gross issuance follows a random walk over the near term. Includes bonds issued under EMTN documentation. ² EA = euro area; DC = developing countries.
Sources: Dealogic; Euroclear; ISMA; Thomson Financial Securities Data; BIS. Graph 3.2
Nevertheless, the fall in issuance proved to be transitory. Total
announcements of international bonds rebounded strongly in September and October, as interest rate volatility in US and euro area government bond markets declined. Indeed, on a seasonally adjusted basis, issuance in September exceeded that in May, the month immediately preceding the start of the recent bond market turmoil. The strong issuance in September and October probably in part reflected issuance originally planned for August that was postponed until interest rate volatility had fallen back from heightened levels.
The weakness of issuance in August was a general phenomenon. Between July and August, announcements of international bond and note issues by euro area borrowers fell by 57%, those of UK borrowers by 64% and those of Japanese borrowers by 78%. Announcements by US borrowers also slowed over the period, by 7%. However, the relatively small decline in issuance by US nationals between July and August might understate the impact of the global bond market sell-off on US fund-raising. Announced issuance by US nationals rose sharply in September to almost double the July amount. This suggests that robust US economic growth led to a greater demand for funds by US businesses over the course of the third quarter. When compared to issuance in September, August was a weak month for US fund-raising.
A higher level of gross issuance in the international bond and note markets in September was also a general pattern. In addition to increased borrowing by US nationals, euro area, UK and Japanese borrowers also stepped up their fund-raising in that month. The relative strength of US borrowing helped to push total net issuance by US entities for the third quarter to $88 billion, three times the amount recorded during the second quarter. Greater borrowing by US financial institutions was the main reason for the
Issuance rebounds in September
The rebound is widespread

BIS Quarterly Review, December 2003 31
upsurge. Their net issuance more than tripled to $75 billion in the third quarter. In the case of euro area nationals, however, the rise in September was not sufficient to offset the slowdown in August. Consequently, net issuance by euro area nationals contracted to $125 billion in the third quarter from $208 billion in the previous one. In percentage terms, the largest decline was for German borrowers, whose net borrowing fell by 60%. Dutch and French entities also reduced their net fund-raising between the second and third quarters, by 55% and 38% respectively.
Greater US borrowing supports dollar issuance
The shift in fund-raising from euro area nationals towards US nationals was associated with a pronounced change in the currency composition of net borrowing. Net issuance of euro-denominated securities in the international debt securities market declined by 40% between the second and third quarters of 2003 while that of US dollar-denominated securities rose by 82% (Table 3.3). In the third quarter, both currencies accounted for about $140 billion each in new funds raised. This was the first quarter in which net issuance of US dollar-denominated securities was at least as large as that of euro-denominated securities since the third quarter of 2001. This occurred in spite of a sharp slowdown in US dollar borrowing by non-US residents in August. In that month, net US dollar issuance by these borrowers declined by 39% from its July pace.
Net issuance of international debt securities by region and currency1 In billions of US dollars
2001 2002 2002 2003 Region/currency
Year Year Q3 Q4 Q1 Q2 Q3
North America US dollar 522.0 297.0 35.0 48.2 38.0 25.9 71.5 Euro 63.9 39.4 7.2 0.4 15.7 6.5 14.9 Yen 18.8 –7.4 –1.5 –2.5 0.0 –1.8 –1.6 Other currencies 10.4 12.1 –1.8 4.5 1.8 7.6 6.1
European Union
US dollar 46.7 68.5 4.2 16.6
39.7
30.7 43.1
Euro 522.4 464.0 101.5 92.8 204.3 212.3 116.0 Yen –2.2 –26.2 –6.5 –2.7 –4.5 –3.2 –3.5 Other currencies 70.5 86.1 26.7 13.9 28.8 27.2 18.4
Others US dollar 82.4 53.7 6.2 8.1 19.5 19.3 23.5 Euro 10.7 18.4 5.4 –0.1 6.5 13.2 8.5 Yen 0.1 –10.1 –0.5 –3.7 –1.6 1.9 –1.8 Other currencies 0.8 14.1 3.4 6.9 7.0 8.0 3.6
Total US dollar 651.2 419.2 45.4 72.8 97.3 75.9 138.1 Euro 597.1 521.9 114.2 93.1 226.5 232.0 139.4 Yen 16.6 –43.7 –8.4 –8.9 –6.1 –3.2 –6.9 Other currencies 81.7 112.3 28.3 25.2 37.6 42.7 28.0
1 Based on the nationality of the borrower.
Sources: Dealogic; Euroclear; ISMA; Thomson Financial Securities Data; BIS. Table 3.3
Dollar issuance matches euro issuance

32 BIS Quarterly Review, December 2003
The increase in net issuance of dollar-denominated securities probably reflected in the main the greater borrowing by US financial institutions noted above; however, currency movements may also have played a role. In particular, the pronounced decline in the value of the dollar since October 2000, especially vis-à-vis the euro, may have been a factor supporting elevated dollar issuance. The perception of continued dollar depreciation might lead entities whose base currency is not the US dollar to shift to dollar-denominated borrowing. Moreover, between October 2000 and October 2003, the yield on the US 10-year Treasury note actually fell by about 140 basis points, further reducing US dollar fund-raising costs. Since the start of 2003, slightly more than two years after the dollar peaked against the euro, there has been a greater tendency for non-US nationals to issue US dollar-denominated securities, although there was a sharp slowdown in such issuance in August. The rebound of such issuance in September took place even as foreign purchases of US Treasury and agency securities dropped sharply (see the box on page 33). In the case of EU nationals, this culminated in $43 billion in net dollar-denominated issuance in the third quarter of this year. Outside the European Union, non-US and non-Canadian entities had $24 billion of net dollar-denominated issuance. This included $8 billion in net borrowing by Australian nationals alone, the result of many small and medium-sized dollar-denominated issues.
The increased preference of non-US nationals for issuing US dollar-denominated securities helped to push gross issuance of yankee bonds to a high level in the third quarter of 2003. As reported by Dealogic, gross issuance of such bonds reached $12 billion in the third quarter, a 24% gain over the recent record set in the second quarter. A sharp rise in yankee issuance by EU, South African and Brazilian entities more than offset a decline in issuance by Canadian nationals.
Rating upgrades back greater developing country borrowing
Developing country entities sharply increased their fund-raising through the international debt securities market between the second and third quarters of 2003. Their net issuance expanded by 62% to $19.4 billion, the largest amount of new funds raised since the second quarter of 2001. This occurred even against the backdrop of a switch from net positive to net negative flows into US mutual funds specialising in emerging market debt (Graph 3.3). At the same time, the greater borrowing was highly concentrated, with Russian and Taiwanese entities alone accounting for a $5.9 billion rise in net issuance.
As in the industrial world, the global bond market sell-off temporarily disrupted fund-raising by developing country borrowers. Announcements of international bonds and notes by developing country entities fell sharply in August, but September witnessed a rebound in issuance. September also saw most of the largest issues by emerging market borrowers during the third quarter. This included a €1 billion seven-year bond floated by the Republic of Hungary.

BIS Quarterly Review, December 2003 33
Flows into US bonds versus flows into US dollar bonds Robert N McCauley
When the US Treasury announced in mid-November that international purchases of US bonds had dropped sharply in September, the dollar sold off. Netting out estimated principal payments on asset-backed securities (ABSs), September may have seen net non-official purchases of US bonds fall to zero. A widening US current account deficit and feeble ex ante demand for US bonds was thought to be a recipe for dollar decline (barring a surge in demand for US equities).
This box distinguishes between international purchases of US bonds and such purchases of dollar bonds. The former can take the form of a cross-border purchase of a US Treasury, agency or corporate bond, and should be captured by the Treasury International Capital (TIC) reporting system. But international purchases of dollar bonds issued by non-residents of the United States can also take place in the eurodollar market and thus not be captured by the TIC system.
Foreign purchases of US bonds and issuance of US dollar bonds by non-US residents Foreign purchases of US bonds Issuance of US dollar
international bonds and notes by non-US residents
Treasury Agency Corporate Total Total Excl yankee
bonds
2003 Total Official Total Official Total Official Total Official Gross Net Gross Net
May 41.1 15.2 32.0 2.5 27.4 0.1 100.5 17.8 50.1 21.1 40.8 22.6 Ex ABSs1 41.1 15.2 26.0 ... 24.9 ... 92.0 ... … … … … June 44.0 16.5 7.0 –2.6 22.8 0.7 73.8 14.6 55.3 26.4 47.7 19.5 Ex ABSs1 44.0 16.5 1.3 ... 20.3 ... 65.3 ... … … … … July 44.7 12.3 11.8 –0.1 26.4 0.4 82.9 12.6 48.8 28.6 44.6 27.6 Ex ABSs1 44.7 12.3 5.4 ... 23.8 ... 73.9 ... … … … … August 25.1 –1.0 8.9 0.4 16.9 0.4 50.9 –0.2 27.8 17.4 27.4 17.5 Ex ABSs1 25.1 –1.0 1.9 ... 14.6 ... 41.6 ... … … … … September 5.6 8.1 –3.2 3.0 19.8 0.5 22.2 11.6 52.1 23.6 49.4 23.2 Ex ABSs1 5.6 8.1 –8.6 ... 14.6 ... 11.6 ... … … … …
1 Excluding estimated repayment of asset-backed securities.
Sources: Federal Reserve Bank of New York; US Treasury; BIS.
Normally, international purchases of US bonds provide a good indication of demand by international asset managers for dollar bonds. On the one hand, the overwhelming majority of bonds sold by US issuers are dollar-denominated. On the other hand, most holdings of dollar bonds by non-US residents take the form of US bonds. For instance, in early 2000, about three quarters of foreign official holdings of US dollar bonds were invested in US bonds.
As the accompanying article makes clear, however, September was not a normal month. With the sell-off in bond markets, international issuance of dollar bonds fell in August only to rebound in September. This pause in issuance reflected the natural hopes of treasurers that the sell-off would reverse itself, as well as the discount offered by underwriters for bonds to be issued into volatile markets. After this pause, issuers played catch-up in September, and issuance and hence foreign purchases of international dollar bonds were strong that month. This observation does not support the inference drawn from the US Treasury data that non-resident investors lost their appetite for dollar bonds in September. While international purchases of dollar bonds issued by residents of countries other than the United States do not directly finance the US current account deficit, they do suggest that international portfolio managers continued to buy dollar bonds during this period. __________________________________
Estimated as identified holdings of Treasury, agency and corporate bonds divided by the sum of such holdings and unidentified holdings of dollars, taken to be dollar bonds issued by non-US residents. See R McCauley and B Fung, “Choosing instruments in managing dollar foreign exchange reserves”, BIS Quarterly Review, March 2003, Table 1.

34 BIS Quarterly Review, December 2003
Major financing flows In billions of US dollars
Flows into US mutual funds¹ Rated international bonds²
-2
0
2
4
6
Jan 98 Jan 00 Jan 02 -0.2
0
0.2
0.4
0.6 High-yield bonds (rhs) Emerging market debt (lhs)
0
50
100
150
200
Jul 02 Jan 03 Jul 03
AAAAA, A, BBBBB and lower
¹ Three-month moving averages. ² Includes bonds issued under EMTN documentation.
Sources: Bloomberg; Investment Company Institute; Dealogic; BIS. Graph 3.3
The largest emerging market issues during the third quarter were those by
the governments of Turkey and Venezuela. In late July, both countries received one-notch upgrades from Standard & Poor’s, to B and B– respectively, and subsequently borrowed heavily in the international debt securities market. On 24 September, the Republic of Turkey raised $1.25 billion with a 10-year fixed rate bond that carried a coupon of 9.5%. On 7 August, the Bolivarian Republic of Venezuela issued a seven-year fixed rate bond with a face value of $1.5 billion that carried a coupon of 5.375%. The proceeds from this issue were used to retire Brady bonds. These issues helped both countries attain positive net issuance in the third quarter, $0.4 billion in the case of Turkey and $1.6 billion in the case of Venezuela. This was the first quarter in which Venezuela had had positive net issuance since the fourth quarter of 2001.
There were other important upgrades during the period under review. In October, Standard & Poor’s raised Malaysia’s foreign currency rating to A–, Thailand’s to BBB and Indonesia’s to B. In the same month, Moody’s raised Hong Kong SAR’s external rating by two notches to A1 and Russia’s also by two notches to Baa3. This was the first time that Russian sovereign debt had received an investment grade rating. Shortly after the upgrade, Sberbank, a state-owned Russian savings bank, raised $1 billion with a three-year floating rate note that carried a spread of 196 basis points over Libor.
The People’s Republic of China was also upgraded in October, following the resumption of rapid economic growth in that country, and shortly afterwards tapped the international market for funds. After a setback in the second quarter caused by the outbreak of SARS and uncertainties related to the war in Iraq, growth in Chinese real output reached 9% (year on year) in the third quarter. In mid-October, Moody’s raised China’s sovereign rating to A2 from A3. On 29 October, the People’s Republic of China issued $1.5 billion in both dollar- and euro-denominated bonds in the international market, the first such issues
Turkey and Venezuela borrow heavily
Russia achieves investment grade status

BIS Quarterly Review, December 2003 35
since May 2001. The US dollar-denominated part of the package, a 10-year bond, was priced at a spread of only 53 basis points over a comparable maturity US Treasury, about the same pricing as that achieved by US agency debt.
Against the backdrop of sluggish economic growth, net issuance by developing country entities in Latin America declined slightly between the second and third quarters of 2003, from $5.3 billion to $4.1 billion. Increased net issuance by Venezuelan entities was more than offset by lower Brazilian and Mexican net borrowing. In the case of Brazil, whose sovereign spread widened by approximately 200 basis points between mid-June and early August, net borrowing by nationals fell to $3.6 billion in the third quarter from $5.1 billion in the previous one. There was, however, a subsequent narrowing of the country’s sovereign spread on speculation that Brazil might also be upgraded. On 22 October, in response to these favourable market conditions, the Federative Republic of Brazil raised by 50% a planned $1 billion sovereign issue of seven-year notes. The $1.5 billion package of US dollar-denominated bonds priced with a yield to maturity of 9.68%.
There was a much sharper decline in Mexican fund-raising in the international market in the third quarter. Net issuance by Mexican entities fell from $3 billion in the second quarter to –$0.7 billion in the third. The fact that the rebound in economic activity in the United States during the third quarter failed to spill over into Mexico may have played a role here.
A significant development concerning Mexican fund-raising is that the Mexican government is substituting domestic for international borrowing. In late October, Mexico successfully tapped the domestic market for new funds when the Ministry of Finance carried out its first auction of a 20-year fixed rate peso-denominated bond in the domestic market. This is the first time in the country’s history that fixed rate instruments have been issued with a 20-year maturity in the domestic market. After the auction, the government signalled its intention to cut its foreign debt by $500 million next year by continuing to increase the proportion of domestic debt in its portfolio. This helped to send yield spreads on US dollar-denominated Mexican sovereign bonds to record lows.
Lower-rated issuers postpone plans in the face of volatility
The recent bond market turmoil was also associated with a fall in the amount of lower-rated issues placed in the international bond market. Announcements of bonds rated below investment grade declined to $0.8 billion in August, the lowest amount since December 2002 and $7 billion less than in July. To some extent, this was a reflection of the reduced fund-raising activities by developing country entities discussed above; they issued $2.5 billion of high-yield bonds in July but floated no such issues in August.
High-yield issuance in the international bond market rebounded in September along with issuance more generally. At $7.2 billion, issuance in this category was about the same as in July. Developing country entities were responsible for 76% of the total. For the third quarter as a whole, there was $15.6 billion in non-investment grade issuance of international bonds, down
Latin American entities borrow less
Mexico issues 20-year fixed rate peso bond
After falling in August …
… high-yield issuance rebounds in September …

36 BIS Quarterly Review, December 2003
slightly from the $18.7 billion posted in the second quarter. Among the largest of these issues from developed country entities during the third quarter were three five-year bonds floated by Vivendi Universal, a $975 million US dollar issue, a €605 million euro issue and a €500 million euro issue. As a result, Vivendi was by far the largest developed country issuer of high-yield bonds in the third quarter.
Issuance of investment grade bonds also rebounded in September and October. After falling by 58% to $57.2 billion between July and August, announcements of bonds rated investment grade rose to about $160 billion in September and October, 19% higher than the amount for July. The total included two fixed rate US dollar-denominated bonds issued by Ford Motor Credit, a $1 billion five-year bond and a $2 billion 10-year bond. These were the first fixed rate, dollar-denominated issues by the company in over a year.
The rating downgrade of DaimlerChrysler and associated turmoil in the secondary market for motor industry debt do not appear to have significantly affected the ability of this firm to raise funds in the international market. On 21 October, Standard & Poor’s reduced the long-term credit rating of DaimlerChrysler to BBB from BBB+, with a negative outlook. As discussed in the Overview, there followed a period of dramatically higher secondary market spreads on the bonds of the automobile companies and their related finance subsidiaries. On 6 November, however, DaimlerChrysler tapped the international market for $2 billion. This 10-year fixed rate US dollar issue priced at a spread of 215 basis points over the comparable maturity US Treasury security.
A repayment bulge in early 2004
A fall in scheduled repayments of bonds and notes in the international debt securities market in the third quarter of 2003 was associated with a slowdown in gross issuance. After rising for several quarters, scheduled repayments had peaked at $396 billion in the first quarter of 2003 (Graph 3.4). The peak was followed by two quarters of declines, with scheduled repayments falling to $324 billion in the third quarter. This was associated with a 10% drop in gross issuance of international bonds and notes to $681 billion between the first and third quarters.
Scheduled repayments are forecast to decline further in the fourth quarter before picking up again next year and reaching a peak in early 2005. In the first quarter of 2004 scheduled repayments are projected to rise to $354 billion. Bonds and notes issued in 2001 and 2002 and coming to maturity in the first quarter of 2004 account for about half of this total. Scheduled repayments are expected to continue to rise further in the first quarter of 2005 to about the same level achieved in the first quarter of this year. In the earlier period, the bulge in repayments was financed by a shift to straight fixed rate bonds and notes from floating rate issues, which occurred against the backdrop of dwindling government yields and narrowing credit spreads. In contrast, early 2004 is unlikely to supply as favourable an environment for refinancing unless interest rates move down from current levels.
… as does issuance of investment grade bonds
DaimlerChrysler unfazed by downgrade
Scheduled repayments fall …
… but are projected to pick up next year

BIS Quarterly Review, December 2003 37
Scheduled repayments of international bonds and notes In billions of US dollars
0
125
250
375
2002 2003 2004 2005
Future payments Past payments
Sources: Dealogic; Euroclear; ISMA; Thomson Financial Securities Data; BIS. Graph 3.4
After remaining essentially flat in the second quarter at $16.5 billion, gross
issuance of convertible bonds shot up by almost 60% to $26.1 billion in the third quarter. This figure includes a €5 billion convertible bond announced by the Kreditanstalt für Wiederaufbau in early July, the largest convertible issue on record. A unique feature of this particular convertible is that it is exchangeable into shares of Deutsche Telekom AG. There was evidently strong demand for the issue, as the issue amount of €5 billion represents an 11% increase over the initially planned €4.5 billion offer.


BIS Quarterly Review, December 2003 39
Serge Jeanneau+41 61 280 8416
4. Derivatives markets
The aggregate turnover of exchange-traded financial derivatives contracts monitored by the BIS contracted in the third quarter of 2003. The combined value of trading in interest rate, stock index and currency contracts amounted to $223 trillion, a 9% decline from the second quarter (Graph 4.1). Activity was uneven across the two major market risk groups, with turnover in interest rate contracts falling substantially and that in stock index contracts growing moderately. The overall decline in the turnover of exchange-traded fixed income instruments resulted from a pronounced drop in money market contracts on US exchanges, which offset a rise in government bond contracts.
The latest BIS semiannual data on aggregate positions in over-the-counter (OTC) derivatives markets show an acceleration of activity in the first half of the year. The notional amount of outstanding contracts was up 20% to almost $170 trillion, compared with an increase of 11% in the previous period. At the same time, gross market values rose by 24% to $7.9 trillion, compared with a 43% increase in the earlier period. Gross market values have expanded at a more rapid pace than notional amounts since 2001.
Turnover of exchange-traded futures and options Quarterly data, in trillions of US dollars
By contract type By region
0
50
100
150
200
00 01 02 03
Long-term interest rate Short-term interest rate Stock market index
0
50
100
150
200
00 01 02 03
Asia-PacificEuropeNorth America
Sources: FOW TRADEdata; Futures Industry Association; BIS calculations. Graph 4.1

40 BIS Quarterly Review, December 2003
Contrasting pattern of activity in interest rate contracts
Aggregate trading in exchange-traded interest rate contracts, the largest of the broad market risk categories, declined in the third quarter of 2003. The volume of transactions fell by 10% to $202.8 trillion, compared with an increase of 25% in the second quarter and 18% in the first quarter. This overall decline in fixed income business resulted from a contrasting pattern of activity between the short-term and long-term interest rate segments, with a pronounced drop in money market contracts more than offsetting an expansion in government bond contracts. Turnover in short-term interest rate contracts, including eurodollar, Euribor and euroyen, declined by 13% to $173 trillion, while business in longer-term instruments, including 10-year US Treasury notes, 10-year German government bonds and 10-year Japanese government bonds, rose by 5% to $29.8 trillion.
Activity on US exchanges accounted for much of the divergence in aggregate transactions between short-term and long-term interest rate contracts. Trading in US money market contracts dropped by 18% to $91 trillion, while transactions in US long-term contracts grew by 18% to $10.5 trillion, leaving overall US fixed income business down by 15% at $101.5 trillion.
Volatile markets slow the turnover of interest rate options
The most notable feature of activity in US short-term interest rate contracts was a particularly sharp drop in the trading of options, with transactions falling by 33% to $24.7 trillion. This was the largest percentage fall in the quarterly volume of transactions in such options since 1993, the year the BIS began to collect quarterly data on the value of turnover in exchange-traded financial derivatives. Business in options on eurodollar futures on the Chicago Mercantile Exchange (CME), the largest US marketplace for short-term products, declined by 31% to $15.8 trillion, while that in options on 30-day US federal funds futures on the Chicago Board of Trade shrank by 86% to $0.8 trillion.
The turnover of options on fixed income instruments tends to exhibit greater variability than the turnover of futures (which declined by only 10% to $66.3 trillion in the third quarter). Options are less actively traded than futures and their liquidity is probably affected to a greater extent by swings in the interest rate cycle or adverse market movements.
This is what seems to have happened in the most recent period, with trading apparently hampered by an abrupt change in market conditions. The upward pressure on the yields of US fixed income assets in the second half of June turned in July and August into a fully fledged reversal of the previous market rally. The slackening in the pace of mortgage refinancing (Graph 4.2) confronted holders of mortgage-backed securities (MBSs) with a sudden and significant extension in the duration of their portfolios. In an attempt to bring duration back to their target levels, holders of MBSs entered into a new round
Contrasting pattern for short- and long-term rate contracts …
… particularly on US exchanges
Sharpest drop in US options on short-term rates since 1993
Options show greater variability than futures

BIS Quarterly Review, December 2003 41
Turnover in US short-term interest rate contracts and US mortgage refinancing index
0
2,000
4,000
6,000
8,000
Jan 00 Jul 00 Jan 01 Jul 01 Jan 02 Jul 02 Jan 03 Jul 03 0
10
20
30
40
Options turnover (lhs)¹Futures turnover (lhs)¹Refinancing index (rhs)²
1 In trillions of US dollars. 2 Refinancing index of the US Mortgage Bankers Association. Monthly average, 16 March 1990 = 100.
Sources: Bloomberg; FOW TRADEdata; Futures Industry Association; BIS calculations. Graph 4.2
of cash market and derivatives transactions. This large volume of rebalancing trades was reported to have strained the market-making capacity of dealers in markets for Libor-based trading instruments, including interest rate swaps and swaptions, causing a sharp increase in market volatility (see the Overview in the September 2003 issue of the BIS Quarterly Review). Some dealers were reported to have made significant losses in their market-making and proprietary trading activities, which may have led to a retreat from market-making in the following weeks.
Another factor accounting for the marked decline in business in short-term interest rate options was a pronounced contraction in transactions related to US monetary policy actions. The expansion in turnover in options on 30-day US federal funds rate futures had been impressive in the second quarter but activity in such contracts nearly dried up in the third.1 This boom and bust pattern may have reflected the contract’s relative “immaturity” given its recent introduction (in the first quarter of 2003).
Activity in US government bond contracts was more evenly balanced than that in short-term interest rate contracts, with futures and options accounting in equal measure for the 18% increase in turnover. Business in government bond futures was robust throughout the quarter. Trading in 10-year US Treasury note futures, the most active US government bond contract, was notably buoyant, with a 22% increase in turnover (Graph 4.3). Business in government bond options was less evenly spread, with an all-time peak in July but a drop to more “normal” volumes in the following two months. Activity in government bond futures and options may have benefited from a shift away from Libor-based contracts given the strains observed in markets for such instruments.
1 Federal funds contracts are directly tied to the federal funds rate, which makes them well
suited for trading on US monetary policy actions.
Drying-up of options on the federal funds rate
Growth in US government bond contracts

42 BIS Quarterly Review, December 2003
Turnover in government bond contracts Quarterly futures contract turnover, in trillions of US dollars
United States Germany Japan and United Kingdom
0 1 2 3 4 5 6 7 8
00 01 02 03
5-year 10-year 30-year
0
2
4
6
8
10
12
14
16
00 01 02 03
2-year5-year10-year
0
1
2
3
4
5
6
7
8
00 01 02 03
Japan, 10-year United Kingdom, 10-year
Sources: FOW TRADEdata; Futures Industry Association; BIS calculations. Graph 4.3
Uncertainty about future movements in the US Treasury market remained high throughout the quarter (Graph 4.4).
Overall business in interest rate products in Europe declined in the third quarter. Turnover fell by 6% to $87.2 trillion, with money market contracts dropping by 7% to $70.6 trillion and government bond contracts down by 3% to $16.6 trillion. The two major categories followed a similar pattern of activity over the course of the quarter. Turnover moderated significantly in July and August, following an all-time peak in business in June.
Trading in interest rate products in the Asia-Pacific region rose by 8% to $11.6 trillion. Much of the expansion in the area reflected buoyant activity in Japan, where aggregate turnover rose by 75% to $3.5 trillion. The expansion in activity in Japan was largely accounted for by a near quadrupling in the trading of short-term futures and options to $1.6 trillion. The surge in Japanese money market business appears to have reflected speculation that the Bank of Japan (BOJ) would abandon its “quantitative easing” policy in the wake of improving growth and inflation prospects. However, such rumours, and the accompanying upward pressure on short-term rates, were dispelled by the BOJ’s large purchases of nine-month bills at the end of August and a statement by the Governor of the BOJ regarding its policy stance in early September. It is worth noting that the move to quantitative easing in the first quarter of 2001 had been followed by a virtual drying-up of activity in Japanese money market instruments, as traders widely believed that short-term interest rates would remain low for an extended period of time.
Activity in Japanese government bond contracts rose by another 25% to almost $2 trillion in the third quarter. Positive data releases and portfolio shifts to equities in the context of a rising stock market led to a sharp drop in the Japanese bond market in July and August, prompting market participants to readjust their balance sheets through derivatives.
Overall decline in European fixed income business
Buoyancy of Japanese activity … … largely in short rate contracts

BIS Quarterly Review, December 2003 43
Volatility of major bond markets Five-day moving averages
Ten-year US Treasury note
Ten-year German government bond
Ten-year Japanese government bond
0
3
6
9
12
Jan 02 Jul 02 Jan 03 Jul 03
GARCH¹ Implied²
0
3
6
9
12
Jan 02 Jul 02 Jan 03 Jul 030
3
6
9
12
Jan 02 Jul 02 Jan 03 Jul 03 1 Annualised conditional variance of daily changes in bond yields from a GARCH(1,1) model. 2 Volatility implied by the prices of at-the-money call options.
Sources: Bloomberg; national data; BIS calculations. Graph 4.4
Further expansion of stock index contracts
Trading in stock index futures and options expanded for the second consecutive quarter. Aggregate turnover rose in the third quarter of 2003 by 5% to $19.1 trillion. The level of activity varied significantly from one area to another: business in North America declined by 3% to $8 trillion, that in Europe rose by 6% to $3.7 trillion and that in the Asia-Pacific region grew by 15%, reaching $7.2 trillion.
The notable increase of activity in Asia was again largely attributable to robust trading in options on the Korea Stock Exchange’s KOSPI 200 index, with a rise in turnover of 11% to $5.2 trillion. However, trading in Japanese stock index instruments expanded at a more rapid pace, up by 53% to $1 trillion. The upsurge of business in Japan may have been related to foreign investors’ renewed appetite for Japanese equities. Stock index contracts enable buyers to cheaply and quickly lock in a price ahead of actual cash market transactions.
Currency contracts trade at a steady pace
Turnover in exchange-traded currency contracts, which account for less than 1% of overall turnover in financial instruments, remained at the same level as the previous quarter at $1.1 trillion. However, the monthly pattern of activity fluctuated significantly during the course of the quarter. Trading dropped markedly in July and August but recovered smartly in September. Activity in September was driven largely by higher turnover in futures on the dollar/euro rate (up by 35% to $156.3 billion) and the dollar/yen rate (up by 72% to
Robust trading in Korean stock index options

44 BIS Quarterly Review, December 2003
The rise of pan-European equity index trading
The introduction of the euro on 1 January 1999 had a significant influence on the financial markets of the euro area. In equity markets, in particular, the elimination of exchange rate risk prompted investors to attach less importance to country-specific factors in the determination of stock prices and put greater emphasis on pan-European sectoral factors. Research shows that this change in the relative importance of country- and sector-related factors has been reflected in the determination of equity prices for a number of the largest continental European firms. The effect of pan-European sectoral factors now outweighs the impact of country factors.
This shift to a pan-European outlook has also had an influence on activity in European exchange-traded derivatives markets. Exchanges reacted to the need for regional trading instruments by developing, in combination with index providers, a large number of new pan-European stock market indices and related derivatives contracts.
This movement began even before the introduction of the euro. In May 1998, LIFFE (the predecessor of Euronext.liffe) and AEX (the predecessor of Euronext Amsterdam) jointly launched a futures contract on the FTSE Eurotop 100 index, while in June 1998 the ParisBourse/MATIF (the predecessor of Euronext Paris), the DTB (the predecessor of Eurex) and the Swiss Exchange/ SOFFEX introduced separate contracts on the pan-European Dow Jones STOXX 50 and the euro area-specific Dow Jones EURO STOXX 50 indices. Such contracts enjoyed a monopoly for nearly a year until competing instruments began to appear. In May 1999, LIFFE launched contracts on a number of broader MSCI indices (the MSCI Pan-Euro Index and the MSCI Euro Index) and FTSE Eurotop indices (Eurotop 300, Eurotop 300 ex UK and Eurobloc 100).
Those contracts, and the many that followed, have experienced mixed fortunes. The only one to have been truly successful is the Dow Jones EURO STOXX 50 contract. The version traded on Eurex is now the most active stock index instrument in Europe, exceeding trading in the Dax contract, the most active country-based European contract, by a wide margin. The other pan-European or euro area-specific contracts have generally failed to find broad market acceptance.
The experience of European stock index trading stands in sharp contrast to that in the United States. In Europe, activity has been dominated by a narrow stock index, the Dow Jones EURO STOXX 50, while in the United States the most active stock index contract has been based for a long time on a broad market index, the S&P 500.
The strong performance of the Dow Jones EURO STOXX 50 contract has been something of a surprise to market participants. Many had expected European activity to follow the US pattern of successful trading in a broad index. The popularity of the S&P 500 contract can be explained by three main factors. First, the S&P 500 Index provided a reasonable proxy for the US market as a whole, which meant that it was widely used by institutional investors for benchmarking purposes. Second, its constituent stocks were generally highly liquid, which made it easy for traders and arbitrageurs to create a basket of cash instruments replicating its performance. Third, the S&P 500 was able to benefit from the window created by the Dow Jones Company’s initial decision not to license its index to any exchange. This combination of market representativeness and liquidity made it natural for investors to use S&P 500 contracts for hedging and trading purposes.
The structure of equity markets in the euro area made the race for benchmark status significantly more complicated than in the United States. In particular, the ideal combination of market representativeness and liquidity was difficult to achieve in Europe. The main reason for this was that European equity markets were more fragmented than US markets when the euro was introduced. There was less consensus concerning the appropriate pan-European benchmark. As a result, market participants continued to trade in the national contracts for a fairly long period after the introduction of the single currency, which apparently hampered activity in the nascent pan-European contracts. ____________________________
See G Galati and K Tsatsaronis, “The impact of the euro on Europe’s financial markets”, BIS Working Papers,
no 100, July 2001, and E Ametistova and Y Sharaiha, “European stock selection: the factors that matter”, Morgan Stanley Global Equity and Derivatives Markets, December 2002. This occurred despite the fact that investors in pan-European index products would have enjoyed a number of advantages relative to alternative trading strategies involving a basket of national index contracts, such as savings in trading commissions, the posting of a single margin deposit rather than several (which must be rolled over at set intervals) and exposure to a single clearing house.

BIS Quarterly Review, December 2003 45
Turnover of major European stock index futures In trillions of US dollars
0
2
4
6
8
10
1998 1999 2000 2001 2002 2003
FTSE 100 CAC 40 DJ EURO STOXX 50 Dax Other
Note: For 2003, turnover data for the first three quarters at an annual rate.
Sources: FOW TRADEdata; Futures Industry Association; BIS calculations.
This fragmentation also had a bearing on the type of index that could be traded successfully.
Although institutional investors often measured their performance against broad-based market indices, such as the Financial Times Actuaries Europe or the MSCI Europe, such indices included a number of stocks that lacked sufficient market liquidity. The low liquidity of a fraction of component stocks made index replication strategies more complex and expensive to implement than would have been the case with a more liquid set of underlying stocks. It also made it difficult for traders to arbitrage between the underlying baskets of shares and the relevant contracts.
These problems explain why trading gravitated to narrower market indices such as the Dow Jones EURO STOXX 50. These indices are easier and cheaper for portfolio managers to track, replicate and use for arbitrage purposes. Moreover, despite their higher volatility and tracking risks relative to the broader benchmarks, their correlation with broad indices is sufficiently high to make them attractive instruments for hedging and trading purposes.
The introduction of the euro has also resulted in another noteworthy development. Pan-European sectoral indices have seen only a moderate expansion. Some market participants have explained this by the prevalence of a bear market between the first quarter of 2000 and the first quarter of 2003. Investors were reportedly reluctant to take exposures on particular industries, which apparently led them to shift away from sectoral indices (illustrated by the closure of several sector funds) and back towards country or pan-European indices.
__________________________________
The correlation between the Dow Jones EURO STOXX 50 index and the MSCI Europe stood at 97% between 1 January 1999 and 30 September 2003.
$77.8 billion) on the CME, the largest marketplace in the world for exchange-traded currency contracts. The upswing was fuelled in large measure by the G7 countries’ call in late September for more exchange rate flexibility. The statement, which was viewed by the foreign exchange market as an implicit criticism of intervention by Asian countries to keep their currencies at low levels relative to the dollar, prompted a plunge in the dollar to a three-year low against the yen on 22 September.
Upswing in currency contracts in September

46 BIS Quarterly Review, December 2003
Broad-based expansion of OTC markets
The latest BIS semiannual data on aggregate positions in global OTC derivatives markets at the end of June 2003 show an acceleration of activity in the first half of the year. The estimated notional amount of outstanding OTC contracts rose by 20% to almost $170 trillion in the most recent half-year period, compared with an increase of 11% in the previous period. This robust expansion was in line with data reported by other market sources.2 At the same time, gross market values continued to grow more rapidly than notional amounts, up 24% to $7.9 trillion.
One of the most notable features of activity in the first half of 2003 was the broad-based nature of the expansion. In recent years market activity has been driven mainly by interest rate instruments, the largest of the broad market risk categories. This time, however, business was equally buoyant in interest rate, foreign exchange and equity-linked instruments, with outstanding amounts in each segment growing by about 20%. Business in commodity contracts, the smallest of the major groups of instruments, grew at a weaker pace, up by 13%.3
Within this overall expansion, the 20% increase in the stock of foreign exchange instruments was particularly noteworthy. This market segment has never grown so rapidly since the BIS began collecting semiannual data on OTC
Global OTC derivatives In trillions of US dollars
Notional amounts outstanding by broad risk category
Gross market values by broad risk category
0
30
60
90
120
150
99H1 00H1 01H1 02H1 03H1
Foreign exchange Equity Interest rate Other¹
0
1
2
3
4
5
6
7
99H1 00H1 01H1 02H1 03H1 1 Estimated positions of non-regular reporting institutions.
Source: BIS. Graph 4.5
2 The International Swaps and Derivatives Association (ISDA) and the US Office of the
Comptroller of the Currency (OCC) have confirmed the rapid expansion of the OTC market. ISDA reported a 22% increase in the global stock of OTC contracts in the first half of 2003, while the OCC reported a 17% rise in commercial bank holdings of derivatives contracts (most of which are OTC). Further information is available at www.isda.org and www.occ.treas.gov.
3 Credit derivatives, which according to market sources have recently grown rapidly, are currently not included in the semiannual BIS survey of OTC derivatives market activity.
Acceleration of OTC business
All segments of OTC market are active
Noteworthy rise in OTC currency contracts …

BIS Quarterly Review, December 2003 47
Global OTC derivatives market1 Amounts outstanding, in billions of US dollars
Notional amounts Gross market values End-Dec 2001
End-Jun
2002
End-Dec 2002
End-Jun
2003
End-Dec 2001
End-Jun
2002
End-Dec 2002
End-Jun
2003
Grand total 111,178 127,509 141,679 169,678 3,788 4,450 6,360 7,908
A. Foreign exchange contracts 16,748 18,068 18,460 22,088 779 1,052 881 996
Outright forwards and forex swaps 10,336 10,426 10,719 12,332 374 615 468 476
Currency swaps 3,942 4,215 4,503 5,159 335 340 337 419 Options 2,470 3,427 3,238 4,597 70 97 76 101
B. Interest rate contracts2 77,568 89,955 101,658 121,799 2,210 2,467 4,266 5,459 FRAs 7,737 9,146 8,792 10,270 19 19 22 20 Swaps 58,897 68,234 79,120 94,583 1,969 2,213 3,864 5,004 Options 10,933 12,575 13,746 16,946 222 235 381 434
C. Equity-linked contracts 1,881 2,214 2,309 2,799 205 243 255 260 Forwards and swaps 320 386 364 488 58 62 61 67 Options 1,561 1,828 1,944 2,311 147 181 194 193
D. Commodity contracts3 598 777 923 1,040 75 79 86 110 Gold 231 279 315 304 20 28 28 22 Other 367 498 608 736 56 51 58 88 Forwards and swaps 217 290 402 458 ... ... ... ... Options 150 208 206 279 ... ... ... ...
E. Other4 14,384 16,496 18,330 21,952 519 609 871 1,083
Gross credit exposure5 . . . . 1,171 1,317 1,511 1,750 1 All figures are adjusted for double-counting. Notional amounts outstanding have been adjusted by halving positions vis-à-vis other reporting dealers. Gross market values have been calculated as the sum of the total gross positive market value of contracts and the gross negative market value of contracts with non-reporting counterparties. 2 Single currency contracts only. 3 Adjustments for double-counting estimated. 4 Estimated positions of non-regular reporting institutions. 5 Gross market values after taking into account legally enforceable bilateral netting agreements. Table 4.1
markets in the first half of 1998 and, with $22.1 trillion in outstanding contracts, it has reached its largest size ever.
All of the three main components of the market for foreign exchange derivatives were active in the most recent period. Outright forwards and forex swaps, the largest subsegment, which had been stagnant since 1999, advanced by 15% to $12.3 trillion. Cross-currency swaps grew at a similar pace to $5.2 trillion. Currency options, however, were the most dynamic subsegment, expanding by 42% to $4.6 trillion. Options involving the US dollar increased by 36% to $1.9 trillion, those involving the euro by 55% to $1.3 trillion and those involving the yen by 4% to $0.6 trillion.4 The dollar had been comparatively stable relative to the euro in the second half of 2002. However, it embarked on a steep downward trend from December 2002 onwards. This appears to have prompted non-financial customers to seek
4 Some of the smaller currency markets expanded even more rapidly. Options involving the
pound sterling, the Swiss franc and the Canadian dollar grew by 74%, 92% and 152% respectively.
… particularly options
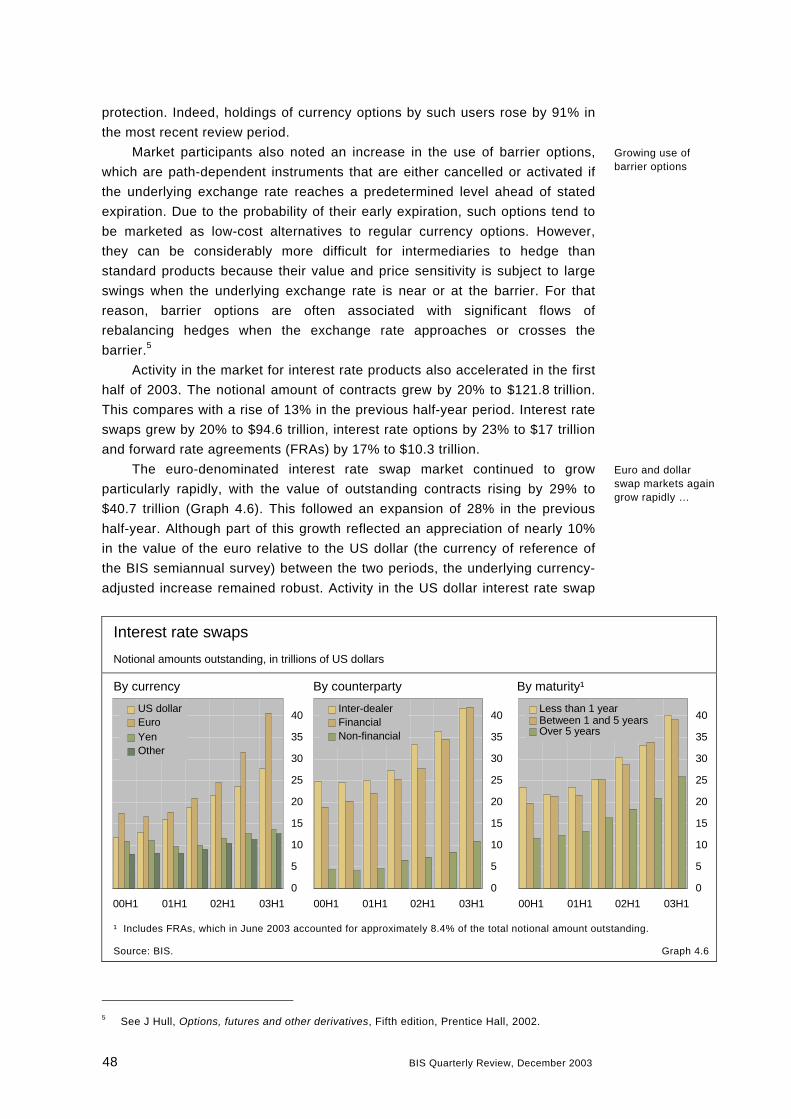
48 BIS Quarterly Review, December 2003
protection. Indeed, holdings of currency options by such users rose by 91% in the most recent review period.
Market participants also noted an increase in the use of barrier options, which are path-dependent instruments that are either cancelled or activated if the underlying exchange rate reaches a predetermined level ahead of stated expiration. Due to the probability of their early expiration, such options tend to be marketed as low-cost alternatives to regular currency options. However, they can be considerably more difficult for intermediaries to hedge than standard products because their value and price sensitivity is subject to large swings when the underlying exchange rate is near or at the barrier. For that reason, barrier options are often associated with significant flows of rebalancing hedges when the exchange rate approaches or crosses the barrier.5
Activity in the market for interest rate products also accelerated in the first half of 2003. The notional amount of contracts grew by 20% to $121.8 trillion. This compares with a rise of 13% in the previous half-year period. Interest rate swaps grew by 20% to $94.6 trillion, interest rate options by 23% to $17 trillion and forward rate agreements (FRAs) by 17% to $10.3 trillion.
The euro-denominated interest rate swap market continued to grow particularly rapidly, with the value of outstanding contracts rising by 29% to $40.7 trillion (Graph 4.6). This followed an expansion of 28% in the previous half-year. Although part of this growth reflected an appreciation of nearly 10% in the value of the euro relative to the US dollar (the currency of reference of the BIS semiannual survey) between the two periods, the underlying currency-adjusted increase remained robust. Activity in the US dollar interest rate swap
Interest rate swaps Notional amounts outstanding, in trillions of US dollars
By currency By counterparty By maturity¹
0 5 10 15 20 25 30 35 40
00H1 01H1 02H1 03H1
US dollar Euro Yen Other
0
5
10
15
20
25
30
35
40
00H1 01H1 02H1 03H1
Inter-dealerFinancialNon-financial
0
5
10
15
20
25
30
35
40
00H1 01H1 02H1 03H1
Less than 1 year Between 1 and 5 years Over 5 years
¹ Includes FRAs, which in June 2003 accounted for approximately 8.4% of the total notional amount outstanding.
Source: BIS. Graph 4.6
5 See J Hull, Options, futures and other derivatives, Fifth edition, Prentice Hall, 2002.
Growing use of barrier options
Euro and dollar swap markets again grow rapidly …

BIS Quarterly Review, December 2003 49
market was also buoyant, with the notional amount of contracts rising by 17% to $27.6 trillion. This continued growth of activity in euro- and dollar- denominated swaps was somewhat surprising given the narrow range within which yields on fixed income assets evolved between January and April. However, the rally in fixed income markets between early May and mid-June is likely to have generated a wave of transactions for balance sheet repositioning.
The dollar value of yen-denominated swaps rose by 6% to $13.5 trillion. Currency valuation effects only played a marginal role in the yen-denominated market, with the yen depreciating by 1% between the two half-year periods.
Gross market values grow at a robust pace
Gross market values continued to grow at a robust pace in the first half of 2003, up by 24% to $7.9 trillion. Gross market values measure the replacement cost of outstanding contracts had they been settled on the last day of a given reporting period (in this case 30 June 2003). As such, they are a more accurate indicator of counterparty credit risk than notional amounts.6 The increase in these values once again exceeded that in notional amounts (Graph 4.5). The overall ratio of gross market values to notional amounts thus rose to a new high of 4.7% at end-June 2003.7
The ratio has fluctuated noticeably over the years. It followed a declining trend between the first half of 1998 and the second half of 2000, to a low of 2.7%, and then rose to a new high in the most recent review period. Interest rate products, particularly swaps, have accounted for much of the recent increase in overall gross market values. Whereas the ratio for such instruments varied between 2 and 3% between the first half of 1998 and the first half of 2002, it stood at 4.5% in the first half of 2003. This increase may have been related to the rally observed in fixed income markets between early 2000 and mid-2003. The downward trend in swap yields generated valuation losses for fixed rate payers, since the lower market rates would have implied lower fixed rate payments on new swaps than on those contracted in earlier periods.
OTC business slows relative to that on exchanges
The most recent numbers on the OTC market show that OTC business was slower than exchange-traded activity in the first half of 2003 (Graph 4.7). As discussed above, the stock of outstanding OTC contracts rose by 20%
6 The gross market value of forward-type contracts is generally zero at the initiation of the
contract, while that for options depends on the premium paid for protection. However, subsequent changes in the prices of underlying assets lead to the emergence of symmetric mark to market gains and losses between counterparties. Hence, gross market values tend to reflect changes in the prices or volatility of financial market assets.
7 It should be stressed that gross market values overstate actual credit exposures, since they exclude bilateral netting and other risk-reducing arrangements such as collateralisation. Allowing for netting lowers the derivatives-related credit exposure of reporting institutions to $1.8 trillion.
… with buoyant activity at the end of the period
Interest rate products drive gross market values

50 BIS Quarterly Review, December 2003
Global derivatives positions Amounts outstanding in trillions of US dollars
OTC Exchange-traded
0
30
60
90
120
150
98H2 99H2 00H2 01H2 02H2
Options Forwards and swaps
0
8
16
24
32
40
98H2 99H2 00H2 01H2 02H2
OptionsFutures
Sources: FOW TRADEdata; Futures Industry Association; BIS. Graph 4.7
compared with an increase in open positions on exchanges of 61%. This pattern of business contrasts with that observed in 2002, when OTC activity easily outpaced stagnant business on exchanges. Both types of market have expanded substantially since 1998 but OTC markets have developed at a steadier pace. In part, this reflects the fact that hedging or trading in OTC markets involves the writing of new contracts, which leads to a gradual build-up of notional amounts outstanding.
OTC markets grow at a steady pace

BIS Quarterly Review, December 2003 51
Jeffery D Amato+41 61 280 8434
Eli M Remolona+41 61 280 8414
The credit spread puzzle1
Spreads on corporate bonds tend to be many times wider than what would be implied by expected default losses alone. These spreads are the difference between yields on corporate debt subject to default risk and government bonds free of such risk.2 While credit spreads are often generally understood as the compensation for credit risk, it has been difficult to explain the precise relationship between spreads and such risk. In 1997–2003, for example, the average spread on BBB-rated corporate bonds with three to five years to maturity was about 170 basis points at annual rates. Yet, during the same period, the average yearly loss from default amounted to only 20 basis points. In this case, the spread was more than eight times the expected loss from default. The wide gap between spreads and expected default losses is what we call the credit spread puzzle.3
In this article we argue that the answer to the credit spread puzzle might lie in the difficulty of diversifying default risk. Most studies to date have implicitly assumed that investors can diversify away the unexpected losses in a corporate bond portfolio. However, the nature of default risk is such that the distribution of returns on corporate bonds is highly negatively skewed. Such skewness would require an extraordinarily large portfolio to achieve full diversification. Evidence from the market for collateralised debt obligations (CDOs) indicates that in practice such large portfolios are unattainable, and thus unexpected losses are unavoidable. Hence, we argue that spreads are so wide because they are pricing undiversified credit risk.
We first review the existing evidence on the determinants of credit spreads, including the role of taxes, risk premia and liquidity premia. We then
1 We thank Franklin Allen, Claudio Borio, Pierre Collin-Dufresne, Jacob Gyntelberg and Roberto
Mariano for helpful discussions, and Christopher Flanagan and Benjamin Graves of JPMorgan Chase for providing us with data on CDOs. The views expressed in this article are those of the authors and do not necessarily reflect those of the BIS.
2 Our primary focus is on the United States, where US government debt is generally understood to be free of default risk. In some emerging market countries, by contrast, government debt is often subject to sovereign default risk.
3 See, for example, Collin-Dufresne et al (2001), Collin-Dufresne et al (2002) and Driessen (2003) for previous discussions of the credit spread puzzle.

52 BIS Quarterly Review, December 2003
discuss the role of unexpected losses and the difficulties involved in diversifying credit portfolios, drawing on evidence from the CDO market.4
Decomposing the spreads
Average spreads on US corporate debt across rating categories and maturity buckets are given in Table 1. These values are computed using option-adjusted spread (OAS) bond indices provided by Merrill Lynch.5 The period covered is January 1997 to August 2003.6 Spreads on AAA debt have averaged about 50 basis points at short maturities and 74 basis points at maturities of seven to 10 years.7 Spreads increase significantly at lower ratings down to BBB, and even more so across sub-par investment grade debt, reaching as high as 761 basis points on B-rated bonds at one- to three-year maturities. In addition, the term structures are upward-sloping for the higher-rated investment grade bonds, hump-shaped for BBB debt and downward-
Spreads and expected default losses1 Rating Maturity
1–3 years 3–5 years 5–7 years 7–10 years
Spread Expected loss
Spread Expected loss
Spread Expected loss
Spread Expected loss
AAA 49.50 0.06 63.86 0.18 70.47 0.33 73.95 0.61 AA 58.97 1.24 71.22 1.44 82.36 1.86 88.57 2.70 A 88.82 1.12 102.91 2.78 110.71 4.71 117.52 7.32 BBB 168.99 12.48 170.89 20.12 185.34 27.17 179.63 34.56 BB 421.20 103.09 364.55 126.74 345.37 140.52 322.32 148.05 B 760.84 426.16 691.81 400.52 571.94 368.38 512.43 329.40
1 In basis points. Spreads are averages over the period January 1997–August 2003 of Merrill Lynch option-adjusted spread indices for US corporate bonds. See text for details on computation of expected loss.
Sources: Altman and Kishore (1998); Bloomberg; Moody’s Investors Service; authors’ calculations. Table 1
4 See Amato and Remolona (2003) for a more detailed analysis of the issues examined in this
article.
5 The option adjustment is done for callable bonds, for which the premium on the embedded option needs to be taken into account.
6 While it would be desirable to compute averages over longer time periods to ensure that all purely cyclical effects have been cancelled out, OAS corporate bond indices are not available for an earlier period. Spreads computed as the difference between the yield on a corporate bond index and a treasury index of similar maturity, for which longer time series are available, can be misleading (see Duffee (1996)). One potential bias not corrected for in the OAS indices demarcated by rating category is the effect of ratings migration of individual bonds. The rating of each constituent of a particular index at any point in time is required to be the same as the rating of the index. However, this is mainly a problem in assessing changes in yields of a given set of bonds, whereas the focus here is on the level of yields.
7 To economise on notation, we will use only the rating codes of Standard and Poor’s throughout this article. Hence, an “AAA” rating should be taken to mean also the Moody’s “Aaa” rating.
Average spreads are high, especially on low-rated bonds

BIS Quarterly Review, December 2003 53
sloping for the sub-par investment grade segment. Moreover, at all maturities, spreads are inversely related to the rating grade, suggesting that ratings are indeed linked to credit quality.
As mentioned above, one obvious component of spreads is the expected loss on corporate bonds due to default. Estimates of expected loss are also provided in Table 1, next to the corresponding value of the spread. Expected loss is computed using an (unconditional) one-year ratings transition matrix – indicating probabilities of downgrades as well as defaults – and by assuming that recovery rates are a constant share of face value. The transition matrix is based on historical Moody’s rating changes and defaults, and the estimates of recovery rates are taken from Altman and Kishore (1998).8 At a given time horizon of T years into the future, the expected loss is the probability of an issue defaulting within the next T years times loss given default. Expected losses are then averaged across the years for each maturity bucket.9
The most striking feature in Table 1 is that, across all rating categories and maturities, expected loss accounts for only a small fraction of spreads. For BBB-rated bonds with three to five years to maturity, for example, the expected loss amounts to only 20 basis points, while the average spread is 171 basis points. In general, spreads magnify expected losses, but the relationship is not one of simple proportions. For example, while the average spread on BBB-rated bonds with three to five years to maturity is more than eight times the expected loss, the corresponding multiple for AAA-rated bonds is 355 times.10 Perhaps a more relevant feature of the relationship between spreads and expected losses is that the difference between them increases in absolute terms as the credit rating declines. As shown in Table 1, this difference increases from 64 basis points for AAA-rated bonds with three- to five-year maturities to 291 basis points for B-rated bonds with the same maturities. This absolute difference is important because it gives rise to arbitrage opportunities, as we explain later.
The fact that expected loss on US corporate debt appears to be only a small part of the total spread over Treasuries has prompted a search for other factors. Recent work has explored the role of taxes, risk premia and liquidity premia. The remainder of this section briefly discusses each of these in turn. As a benchmark for our discussion, and to illustrate some results in the empirical literature, Table 2 documents the findings of two recent studies using
8 These recovery rates, in percentages, are 68.34 (AAA), 59.59 (AA), 60.63 (A), 49.42 (BBB),
39.05 (BB), 37.54 (B) and 38.02 (CCC).
9 One potential critique of our calculation of expected loss is that it is based on constant recovery in the event of default and unconditional transition matrices constructed using data over a long time period. Instead, we could have computed expected losses by allowing these to vary over time. See, for example, Nickell et al (2000) for a discussion of time-varying transition matrices; Frye (2003) on the relation between probabilities of default and recovery rates; and Altman et al (2003) for an analysis of the link between default and recovery rates.
10 In the language of modern finance, the “risk neutral” probabilities for BBB-rated bonds are eight times the “physical” probabilities.
Investors are compensated for expected loss ...
… but spreads are many times wider than loss estimates
Other factors drive spreads

54 BIS Quarterly Review, December 2003
Decomposing credit spreads Authors Spread component Attributed portion of spread
(in percentages)
Rating
AA A BBB
Maturity
5 10 5 10 5 10
Elton et al (2001) Expected loss 3.5 8.0 11.4 17.8 20.9 34.7 Taxes 72.6 58.0 48.0 44.1 29.0 28.4 Risk premium1 19.4 27.6 33.0 30.9 40.7 30.0
Other1 4.5 6.4 7.7 7.2 9.4 7.0
Driessen (2003) Taxes 57.1 55.0 50.8 48.5 37.4 34.0 Risk premium 17.9 23.3 26.2 32.4 45.8 52.1 Liquidity premium 25.0 21.7 23.0 19.1 16.9 13.8
1 Approximation based on authors’ calculations.
Sources: Driessen (2003); Elton et al (2001). Table 2
US data.11 Elton et al (2001) decomposed spot rates on corporate bonds into expected loss, taxes and a residual. They then examined how much of the variation over time in the residual spread can be explained by systematic risk factors, and calculated a risk premium based on these contributions.12 The more recent paper by Driessen (2003) employs different methods and data to further decompose spreads, in particular by allowing for a liquidity premium.13
Taxes
In the United States, corporate bonds are subject to taxes at the state level, whereas Treasury securities are not. Since investors compare returns across instruments on an after-tax basis, arbitrage arguments imply that the yield on corporate debt will be higher to compensate for the payment of taxes. Maximum marginal tax rates on corporate bonds vary roughly from 5 to 10% across states. Taking account of the deduction of state taxes from federal tax, Elton et al (2001) use a benchmark tax rate of 4.875% to find that taxes can account for 28–73% of spreads depending upon rating and maturity (see Table 2). Using a different sample and methods, Driessen (2003) finds that
11 Clearly, there are many other studies that we do not discuss here. Our apologies to other
authors. We stress that Table 2 and the discussion in the text are meant to be indicative rather than exhaustive. See Amato and Remolona (2003) for a more complete review of the literature.
12 More specifically, Elton et al (2001) first regress the spread less the expected loss and tax components on the three Fama-French (1993) risk factors (market, SMB, HML). The risk premium is then determined by summing across factors the sensitivity of the residual spread to each factor multiplied by the price of each factor.
13 More precisely, Driessen (2003) decomposes spreads into the following categories: taxes, liquidity risk, common factors risk, default event risk, default-free factors risk and firm-specific factors risk. To simplify our presentation, we have combined the last four categories under the heading risk premium.
After-tax returns matter

BIS Quarterly Review, December 2003 55
taxes may account for 34–57% of spreads. Since such taxes are more closely related to the level of yields than to the spread, their effect is roughly constant across rating classes, and thus they explain a smaller fraction of the spread on lower-rated bonds than on higher-rated bonds.
Risk premium
The fact that the unexplained spread is itself volatile adds to the risk of corporate bonds. Moreover, this additional risk cannot easily be diversified away by holding stocks in the same portfolio. Hence, risk-averse investors would require a premium for bearing this risk, in addition to compensation for expected (ie average future) losses and taxes. Elton et al (2001) suggested that such a risk premium might account for anywhere between 19 and 41% of spreads (see Table 2). Driessen (2003) estimated risk premia in a fully specified model and found that they account for a fraction of spreads as low as 18% (AA, five-year maturity) and as high as 52% (BBB, 10-year maturity). Note that such risk premia help suggest why the unexplained spread is so wide, not why it exists at all.14
Liquidity premium
Even in the United States, most corporate bonds trade in relatively thin markets. This means that it is typically more costly to undertake transactions in these instruments than in equities and Treasuries. Investors must be compensated for this. For example, Schultz (2001) estimates that round-trip trading costs in the US corporate bond market are about 27 basis points. More generally, there can be uncertainty about the liquidity (or illiquidity) of a given bond at a given time, and investors might also require a premium to bear this risk.15 Indeed, several recent studies have argued that liquidity premia may be the next most important component of spreads after taxes. Driessen (2003) estimates that liquidity premia account for about 20%, with Perraudin and Taylor (2003) obtaining even larger estimates.16
The difficulty of diversification
A neglected explanation for the size of credit spreads is the difficulty of diversifying credit risk. In corporate bond portfolios, there is often a chance that actual losses from default will exceed expected losses. All the studies
14 Collin-Dufresne et al (2001) find that changes in the spread tend to be highly correlated
across issuers but are unrelated to macroeconomic and financial variables.
15 A related but conceptually distinct issue is liquidation risk (see Duffie and Ziegler (2003)). Even for buy and hold investors there is always a chance that positions will have to be liquidated under tight market conditions. Thus, investors will require a premium to bear this risk. However, since the probability of such events is very small, it seems implausible that liquidation risk could induce a large premium.
16 See also, for example, Delianedis and Geske (2001), Dignan (2003), Janosi et al (2001) and Longstaff et al (2003).
Returns are risky …
… and the market is not so liquid

56 BIS Quarterly Review, December 2003
Portfolio losses relative to number of assets1
Medium portfolio2 Large portfolio3
0.00
0.10
0.20
0.30
0.40
0.50
0.60
-75 -60 -45 -30 -15 00.00
0.05
0.10
0.15
0.20
0.25
0.30
-40 -35 -30 -25 -20 -15 -10 -5 01 Probabilities on the vertical axis and portfolio losses in thousands of US dollars on the horizontal axis. Probabilities are computed using the binomial distribution. 2 Holding 100 bonds with $30,000 face value each. 3 Holding 300 bonds with $10,000 face value each.
Source: BIS calculations. Graph 1
mentioned above implicitly assume that investors can diversify away this unexpected component of default risk by holding a sufficiently large portfolio. This assumption, however, may not hold in practice. Without full diversification, unexpected losses will be priced in the spread. Indeed, we argue that this risk could very well account for most of the spread.
Skewness in returns is a critical factor that stands in the way of diversification. Because of this factor, corporate bond portfolios are not as easy to diversify as equity portfolios. Default risk for corporate bonds means there is a small but significant probability of a large loss without any chance for a comparably large gain. The resulting distribution of returns is negatively skewed, that is, it has a long left tail. Given such skewness, diversification is difficult in the sense that the size of the portfolio required to reduce unexpected losses to a minimum is very large. We argue that in practice such large portfolios are not attainable. In contrast, equity returns tend to show a much more symmetric distribution, in which the probabilities of large losses are matched by the probabilities of large gains. Such symmetry makes diversification relatively easy for equity portfolios, and a portfolio with as few as 30 stocks could be considered well diversified. This is not so for a portfolio with 30 corporate bonds.
To illustrate the difficulty of diversifying credit risk, consider two hypothetical corporate bond portfolios worth a total of $3 million each and divided equally among 100 and 300 different obligor names, respectively.17 Assume further that these names have identical default probabilities and
17 To keep things simple, we account only for the probability of default. In practice, losses can
also arise from downgrades and wider spreads, which would presumably increase the correlation of losses in portfolios. In general, it is important to account for this by integrating credit and market risk. Duffie and Singleton (2003), for example, show how this might be done.
Skewness is the bane of diversification

BIS Quarterly Review, December 2003 57
independent default times.18 Graph 1 shows the probabilities of varying amounts of default losses for these portfolios, where the default probability of each obligor is 0.5% and the recovery rate in the event of default is 50%. The binomial density is used to compute the probabilities. For both portfolios, the expected loss is $7,500. However, the probabilities of much greater losses than this are significant in both cases. For example, in the medium-sized portfolio with 100 names, there is a greater than 1% probability that losses would be as large as $45,000, six times the expected loss. Note that such unexpected losses are already in the order of magnitude of the credit spreads. Diversification is improved by increasing the size of the portfolio from 100 to 300 names, but it still remains poor: a loss of $25,000 can occur with a probability exceeding 1%, a loss that is more than three times the expected loss.
Evidence from arbitrage CDOs
Can investors actually hold corporate bond portfolios that are large enough to be fully diversified? One way to address this question is to examine CDOs, particularly arbitrage CDOs. These are vehicles for securitisation that rely on lower-rated debt securities as collateral and issue several tranches of notes, the bulk of which are typically AAA-rated securities. Arbitrage CDOs are particularly interesting for our purposes because they are structured precisely to exploit credit spreads that are wide relative to expected losses, and their success depends on how well they can diversify default risk. The extent to which they do diversify would then be evidence of what is attainable.
The basic logic of arbitrage CDOs is simple: take a long position in low-quality debt paying high spreads and take a short position in high-quality debt paying low spreads. Ordinarily, this would be a risky strategy, because it would lose money if spreads widened (spreads would widen more on the long position than on the short position). What makes the strategy an arbitrage, however, is that CDOs take the risk of widening spreads out of the equation by effectively transforming the low-quality debt into high-quality debt at the outset without giving up much of the spread differential. The transformation involves treating the low-quality debt as collateral and setting aside part of it to cover possible losses from default. This strategy works because the gap in spreads between the two classes of debt is much wider than the gap in expected default losses.
To illustrate the strategy, consider a collateral pool of BBB-rated bonds, each of which has an independent default probability of 0.5% a year and a recovery rate of 50%, as in the above hypothetical examples. In this case, the expected loss will amount to 25 basis points in annual terms. Suppose the credit spread paid on these bonds is 175 basis points. If the collateral pool is large enough to be perfectly diversified, the CDO manager will not need to be concerned about unexpected losses from default. If 0.25% of the collateral pool is set aside to cover expected losses, the remaining collateral will constitute a
18 We discuss the role of correlations below.
Actual losses could be a multiple of expected losses
CDOs exploit the credit spread puzzle …
… gaining from the spread differential
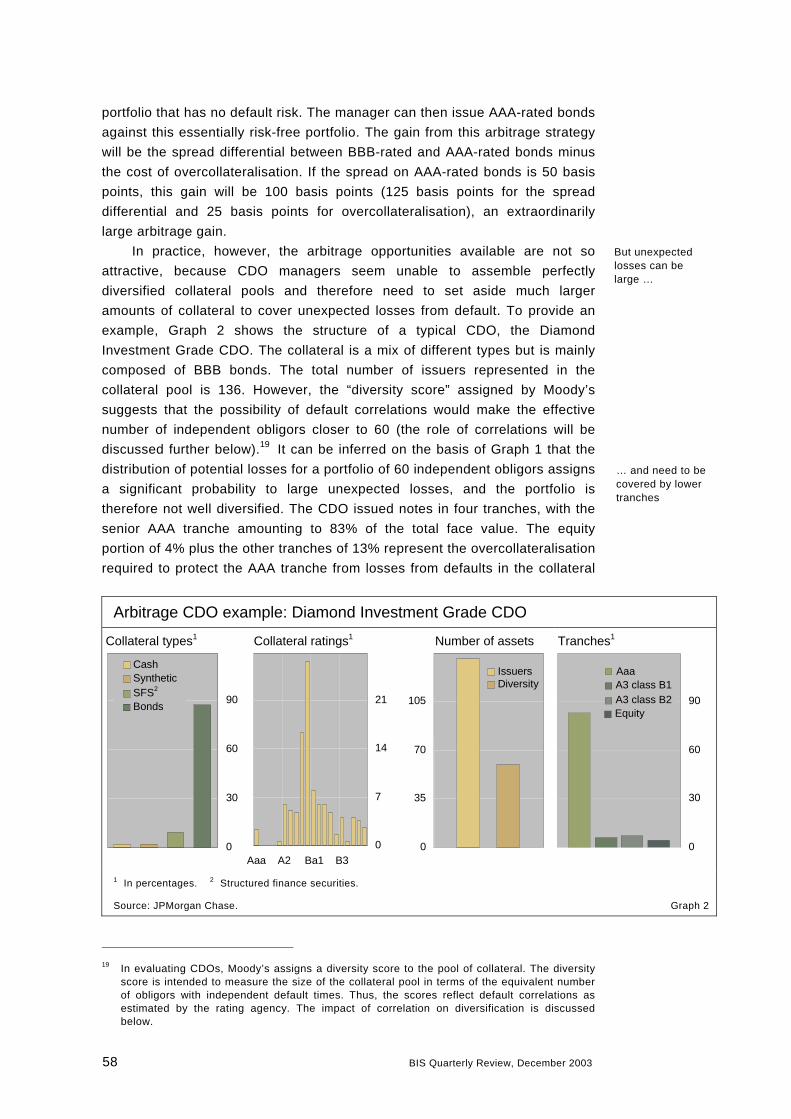
58 BIS Quarterly Review, December 2003
portfolio that has no default risk. The manager can then issue AAA-rated bonds against this essentially risk-free portfolio. The gain from this arbitrage strategy will be the spread differential between BBB-rated and AAA-rated bonds minus the cost of overcollateralisation. If the spread on AAA-rated bonds is 50 basis points, this gain will be 100 basis points (125 basis points for the spread differential and 25 basis points for overcollateralisation), an extraordinarily large arbitrage gain.
In practice, however, the arbitrage opportunities available are not so attractive, because CDO managers seem unable to assemble perfectly diversified collateral pools and therefore need to set aside much larger amounts of collateral to cover unexpected losses from default. To provide an example, Graph 2 shows the structure of a typical CDO, the Diamond Investment Grade CDO. The collateral is a mix of different types but is mainly composed of BBB bonds. The total number of issuers represented in the collateral pool is 136. However, the “diversity score” assigned by Moody’s suggests that the possibility of default correlations would make the effective number of independent obligors closer to 60 (the role of correlations will be discussed further below).19 It can be inferred on the basis of Graph 1 that the distribution of potential losses for a portfolio of 60 independent obligors assigns a significant probability to large unexpected losses, and the portfolio is therefore not well diversified. The CDO issued notes in four tranches, with the senior AAA tranche amounting to 83% of the total face value. The equity portion of 4% plus the other tranches of 13% represent the overcollateralisation required to protect the AAA tranche from losses from defaults in the collateral
Arbitrage CDO example: Diamond Investment Grade CDO
Collateral types1 Collateral ratings1 Number of assets Tranches1
0
30
60
90
Cash Synthetic SFS2
Bonds
0
7
14
21
Aaa A2 Ba1 B30
35
70
105
IssuersDiversity
0
30
60
90
Aaa A3 class B1A3 class B2Equity
1 In percentages. 2 Structured finance securities.
Source: JPMorgan Chase. Graph 2
19 In evaluating CDOs, Moody’s assigns a diversity score to the pool of collateral. The diversity
score is intended to measure the size of the collateral pool in terms of the equivalent number of obligors with independent default times. Thus, the scores reflect default correlations as estimated by the rating agency. The impact of correlation on diversification is discussed below.
… and need to be covered by lower tranches
But unexpected losses can be large …

BIS Quarterly Review, December 2003 59
Diversification and overcollateralisation in CDOs The amount of overcollateralisation is effectively determined by rating agencies: they calculate the amount that will be sufficient to protect the higher-rated tranches against defaults in the collateral pool at probabilities consistent with the ratings of those tranches. The amount of protection will depend largely on the likelihood of unexpected losses in the collateral pool, and these losses will depend on how well diversified the pool is.
The relationship between overcollateralisation and diversification can be discerned from the graph below. The three curves in the left-hand panel correspond to collateral pools of different sizes. The graph plots the probability that the proportion of defaults in the collateral pool will exceed the overcollateralisation ratio, which is shown on the horizontal axis. The graph shows that the bigger the collateral pool, the smaller the probability that the proportion of losses will exceed a given overcollateralisation ratio. The required ratio is then set so that this probability is consistent with the default probability associated with a AAA rating, which is the rating of the tranche being protected by the collateral. As shown in the middle panel, the required overcollateralisation ratio is the intersection between the curve for loss probabilities and the horizontal line representing the default probability for the senior tranche. This ratio is smaller for the larger collateral pool. In other words, diversification reduces the proportion of collateral required to cover unexpected losses at a given level of confidence. The right-hand panel shows the arbitrage gains relative to the size of the pool. In this example, the gains roughly amount to the spread differential between BBB and AAA bonds multiplied by the difference in asset size between the senior and equity tranches. The fact that the overcollateralisation ratio continues to decline with the size of the collateral pool means that arbitrage gains also increase.
Benefits of diversification Loss probabilities1 Required overcollateralisation1 Diversification3
0
0.2
0.4
0.6
0.02 0.03 0.04 0.05 0.06 0
0.005
0.01
0.015
0.08 0.09 0.10 0.11 0.12
Large portfolioMedium portfolioSmall portfolioAAA²
0
6
12
18
24
30
0 50 100 150 200 250 300
Ratio with full diversification Required ratio
1 The horizontal axis is the ratio of the number of assets in default (ND) to the total number of assets (N). The vertical axis is the probability that the proportion of defaults is greater than ND/N. 2 Probability of default of a AAA-rated bond over a five-to seven-year horizon. 3 The horizontal axis plots the total number of bonds in the collateral pool (N). The minimum collateralisation ratio (mc) is the minimum size of the equity tranche (in percentages) required to achieve a AAA rating for the senior tranche of a two-tranche CDO. The calculations assume that the collateral pool consists of BBB-rated bonds with identical probabilities of default (pB = 0.03) over a five- to seven-year horizon and independent default times. The ratio with full diversification is equal to pB–pA, where pA = 0.001 is the probability of default of a AAA-rated bond over a five- to seven-year horizon.
Source: BIS calculations.
pool. Since the expected loss is small, most of the required overcollateralisation represents coverage for unexpected losses.
For CDO managers, the required overcollateralisation represents a cost that reduces the gains from arbitrage. Such overcollateralisation in turn depends on the degree of diversification achieved in the collateral pool. The

60 BIS Quarterly Review, December 2003
Size and structure of arbitrage CDOs1
For CDOs based on cash collateral and cash flow management
Investment grade High-yield
Total2 521.1 391.6 Tranches2 Senior 273.5 142.0 Mezzanine 142.5 253.3 Equity 60.9 66.3 Number of assets3 100 150 Diversity score3 40 45
1 Averages, at issuance, over the period January 1997–August 2003. 2 In millions of US dollars. 3 Approximate.
Source: JPMorgan Chase. Table 3
more diversified the pool, the less the collateral needed to cover unexpected losses from default and the greater the arbitrage gain (see box on page 59 for an illustration). Hence, the benefits of diversification provide the CDO manager with a strong incentive to increase the size of the collateral pool or, more specifically, the number of independent names in the pool.
It is significant that in spite of the strong incentive to diversify, actual arbitrage CDOs do not become very large. The typical arbitrage CDO structured on investment grade assets contains only about 100 names in its collateral pool, resulting in an average diversity score of only about 40 (Table 3). Only a few CDOs have had more than 200 names. Conversations with market participants suggest that it can take many months for a CDO manager to assemble the collateral for a given structure. It appears that beyond a few benchmark bonds, the cost of searching for additional names rises sharply. Indeed, the fact that the most common collateral tends to be investment grade debt rather than high-yield debt, for which potential arbitrage gains should be larger, suggests that the availability of collateral is an important limiting factor.20 Hence, full diversification is not achieved even by investors who would have the most to gain.
The practical difficulties of diversification imply that investors cannot fully avoid the risk of unexpected losses from default. In actual portfolios, such risk remains significant and must therefore command a risk premium. It is this risk premium that we believe accounts for much of the credit spread puzzle.
The role of default correlations
To the extent that defaults tend to occur at the same time, the scope for diversification is more limited. In the extreme, a portfolio with, say, 100 names but with 100% default correlation would have the risk profile of a portfolio with a single name. In practice, default correlations have been difficult to estimate
20 Other factors, such as moral hazard, might also limit profit opportunities. See Duffie and
Singleton (2003) and Amato and Remolona (2003) for further discussion.
Yet CDO managers do not fully diversify …
… so wide spreads reflect undiversified credit risk

BIS Quarterly Review, December 2003 61
with any precision.21 Nonetheless, there are two main factors that are understood to determine default correlations between two firms, their credit quality and whether they are in the same industry.
First, the higher the probabilities of default, the more likely that two firms will default together. Zhou (1997) and Gersbach and Lipponer (2003), for example, analytically derive default correlations from asset correlations, the latter serving as an upper bound on the former. Zhou explains that for two firms of low credit quality and a given asset correlation, it will not take much of a decline in asset values for the default of one to be followed by the default of the other. Gersbach and Lipponer provide a numerical example in which an asset correlation of 40% and a default probability of 1% lead to a default correlation of 8%, while the same asset correlation but a default probability of 5% lead to a default correlation of 14%.
Second, two firms in the same industry are more likely to default together than two firms in different industries. After all, the business risks faced by firms within the same industry are likely to be similar and asset correlations are likely to be high. Indeed, market participants often assume that default correlations are significantly positive for firms in the same industry and negligible for firms in different industries. Intra-industry estimates from Moody’s based on a large sample of speculative grade firms range from a correlation of 6% for banking firms to 1% for technology firms. Das et al (2001) derive estimates that are as high as 25% for firms in the same industry.22 However, in general, such correlation estimates tend to be low.
While default correlations limit the scope for diversification, they are not what makes corporate bond portfolios so difficult to diversify by comparison with other assets. The fact that equity returns are much more highly correlated than default probabilities means there is less that is diversifiable in equity portfolios. Given what is diversifiable, however, it is harder to achieve full diversification in corporate bond portfolios because of the skewness in returns. As mentioned above, a small equity portfolio can be well diversified in that the idiosyncratic risk of individual stock returns is negligible, while a large corporate bond portfolio is likely to remain poorly diversified in that unexpected losses from default remain significant.
Conclusions and implications
In this article we have examined various possible sources for the spreads observed on US corporate bonds relative to US Treasuries. We provided calculations confirming the stylised fact that expected losses in the event of default can account for only a small portion of observed spreads. We then 21 There is a large theoretical literature on estimating default correlations. Popular approaches
include “copula” and “intensity” models, which tend to rely on parameters derived from estimates of the “lower tail dependence” between asset values of borrowing firms. See Duffie and Singleton (2003).
22 High correlations lead to time variation in default rates. For example, an average probability of default of 1% in a portfolio of 1,000 bonds could mean 10 defaults a year in the absence of a correlation or 20 defaults every other year in the presence of correlation.
Lower credit ratings mean higher correlations
Correlations across industries are small
Correlations are less important than skewness

62 BIS Quarterly Review, December 2003
reviewed arguments and evidence regarding the importance of other factors. While taxes, risk premia and illiquidity may contribute to spreads, they still do not fully explain why spreads are so wide. We suggest instead that the spreads are largely a compensation for the risk of unexpected losses from default that are invariably present in corporate bond portfolios.
Unexpected losses are difficult to avoid because default risk leads to returns that are highly negatively skewed. Given this skewness, unexpected losses can be diversified away only with extraordinarily large portfolios. We suggest that such large portfolios are not attainable in practice. For evidence, we turn to arbitrage CDOs, the managers of which have a strong incentive to diversify. The relatively small number of bonds included in actual arbitrage CDOs lends support to the view that diversification is difficult. Beyond a limited number of benchmark bonds, the cost of finding additional bonds seems to rise sharply.
Apart from the implications the supply of corporate bonds has for diversification, there are other technical issues specific to credit markets that we have largely ignored. The development of derivatives markets, and the fact that certain market participants have taken large gambles involving different credit instruments such as CDOs and CDSs, has surely had an impact on spreads at times. How important these factors are for the average level of spreads remains an open question.
Our arguments regarding the difficulty of diversifying credit risk and the subtleties involved in identifying liquidity premia call for more work on both of these issues. Moreover, the ongoing development of credit derivatives has the possibility to transform credit markets even more in the future, particularly with regard to diversification opportunities and market liquidity. This is likely to reduce spreads over the long run, but the size and pace of these effects is yet to be determined. In the end, a better understanding of corporate bond spreads will help improve risk management of defaultable securities and the liquidity of portfolios. It should also lead to improvements in pricing, and hence efficiency, in the markets for corporate bonds and credit derivatives.
References
Altman, E I and V M Kishore (1998): Defaults and returns on high yield bonds: analysis through 1997, mimeo, NYU Salomon Center.
Altman, E I, B Brady, A Resti and A Sironi (2003): “The link between default and recovery rates: theory, empirical evidence and implications”, Journal of Business, forthcoming.
Amato, J D and E Remolona (2003): Is there a credit premium puzzle?, mimeo, BIS.
Collin-Dufresne, P, R Goldstein and J Helwege (2002): Is credit event risk priced? Modeling contagion via the updating of beliefs, mimeo, Carnegie Mellon University.
Diversified portfolios are unattainable …
… because not enough bonds can be found

BIS Quarterly Review, December 2003 63
Collin-Dufresne, P, R Goldstein and J Spencer Martin (2001): “The determinants of credit spread changes”, Journal of Finance, vol LVI, no 6, December, pp 2177–207.
Das, S R, G Fong and G Geng (2001): “Impact of correlated default risk on credit portfolios”, Journal of Fixed Income, December, pp 9–19.
Delianedis, G and R Geske (2001): “The components of corporate credit spreads: default, recovery, tax, jumps, liquidity and market factors”, Paper 22–01, the Anderson School at UCLA.
Dignan, J H (2003): “Nondefault components of investment-grade bond spreads”, Financial Analysts Journal, May/June.
Driessen, J (2003): Is default event risk priced in corporate bonds?, mimeo, University of Amsterdam.
Duffee, G R (1996): Treasury yields and corporate bond yield spreads: an empirical analysis, mimeo, Federal Reserve Board.
Duffie, D and K J Singleton (2003): Credit risk: pricing measurement and management, Princeton University Press.
Duffie, D and A Ziegler (2003): “Liquidation risk”, Financial Analysts Journal, May/June.
Elton, E J, M J Gruber, D Agrawal and C Mann (2001): “Explaining the rate spread on corporate bonds”, Journal of Finance, vol LVI, no 1, February, pp 247–77.
Fama, E and K French (1993): “Common risk factors in the returns on stocks and bonds”, Journal of Financial Economics, 33, pp 3–57.
Frye, J (2003): “A false sense of security”, Risk, August, pp 63–7.
Gersbach, H and A Lipponer (2003): “Firm defaults and the correlation effect”, European Financial Management, vol 9, pp 361–77.
Janosi, T, R Jarrow and Y Yildirim (2001): Estimating expected losses and liquidity discounts implicit in debt prices, mimeo, Cornell University, Ithaca.
Longstaff, F, S Mithal and E Neis (2003): The credit default swap market: is credit protection priced correctly?, mimeo, UCLA.
Nickell, P, W Perraudin and S Varotto (2000): “Stability of rating transitions”, Journal of Banking and Finance, 24, pp 203–27.
Perraudin, W R M and A P Taylor (2003): Liquidity and bond market spreads, mimeo, Bank of England.
Schultz, P (2001): “Corporate bond trading costs: a peek behind the curtain”, Journal of Finance, vol LVI, no 2, April, pp 677–98.
Zhou, C (1997): “Default correlation: an analytical result”, FEDS paper 1997–27, Federal Reserve Board, May.


BIS Quarterly Review , December 2003 65
Patrick McGuire+41 61 280 8921
Martijn A Schrijvers+31 20 524 2167
Common factors in emerging market spreads1
Emerging market bond debt has become an increasingly important asset class for portfolio managers and, over the last decade, emerged as a key source of funds for emerging market governments. Spreads on emerging market bond debt across countries tend to move in tandem over time, suggesting that one or more common factors drive their movements. Yet despite its relevance to portfolio management, the degree of common variation in spreads on emerging market debt, and the number of underlying factors that might drive this covariation, has received little attention in the asset pricing literature.
This article investigates the extent to which spreads on emerging market sovereign debt react to forces that are common across markets. Similar in spirit to the Litterman and Scheinkman (1991) analysis of the US Treasury yield curve, and to the extensive work in the asset pricing literature on the factors driving equity returns, we use principal factor analysis to determine the number of common factors that drive movements in emerging market bond spreads.
Three broad conclusions are supported by the analysis presented below. First, we find that common forces account for, on average, one third of the total variation in the daily movement of each spread for our primary sample of 15 emerging market issuers. This result is robust to rating differences, as well as differences in sample size. Second, we find that a single common factor explains approximately 80% of the common variation, although there is tentative evidence of a second common factor emerging in recent years. Third, the primary factor may reflect changes in investors’ attitudes towards risk, as evidenced by its high correlation with economic variables that are thought to reflect changes in risk premia.
Asset pricing and the portfolio manager
Spreads on emerging market sovereign bonds tend to be highly correlated across countries, a fact that has important implications for portfolio managers. For example, for the sample of 15 emerging market borrowers described below, the average (across countries) correlation between the daily movement
1 Martijn Schrijvers was seconded to the BIS by the Netherlands Bank at the time of this
research project. The views expressed in this article are those of the authors and do not necessarily reflect those of the BIS or the Netherlands Bank.

66 BIS Quarterly Review, December 2003
in each spread series with that of the JPMorgan Emerging Market Bond Index Global (EMBI Global) between January 1998 and June 2003 was 0.53.2 While spreads on some bonds, such as those of Turkey, South Africa and China, had relatively low correlations with the EMBI Global, others, such as those of Brazil, Mexico and Korea, had correlations well above 0.6.
From the portfolio manager’s perspective, the underlying forces driving these spreads, and the degree of heterogeneity in spread movements, are key to achieving the appropriate degree of portfolio diversification. A necessary step in addressing the portfolio allocation decision is to determine both the number and the nature of the common sources of variation for each asset class. For example, a change in the global investing climate can influence investors’ risk appetite, and hence be reflected in common movements in spreads across issuing countries. Indeed, as emerging markets become ever more integrated in the global economy, and with the rise of “crossover investors”, global, or common, factors may become more important determinants of emerging market bond spreads relative to idiosyncratic factors.3
The search for common sources of variation has a long history in the asset pricing literature. Early work relied on analysis of the covariance matrix of securities to determine the common components driving returns (Feeney and Hester (1967), Farrell (1974), Arnott (1980)). More recently, factor models of one form or another have become a standard tool to analyse security returns. At the heart of these factor models is the assumption that the returns on different securities will be correlated only through reactions to one or more of the specified factors. For equity returns, for example, the excess market return is the single factor in the standard CAPM, although many have argued that equity returns are more appropriately modelled with multiple factors.4 In addition, Ross’s (1976) APT model, which is based on a no-arbitrage argument, shows that the systematic portion of equity returns can be expressed as a linear function of a set of “factors”. However, this model leaves both the number and the nature of these factors unspecified, prompting a large but inconclusive literature which addresses these issues.5 For fixed income securities, Litterman and Scheinkman (1991) apply principal factor analysis to the returns on US Treasury notes, and find that three factors can explain a
2 This statistic can be misleading because of differences in the weighting of countries in the
EMBI Global. An alternative is to calculate the simple average of all the pairwise correlations between the series themselves. This yields an average correlation of 0.29.
3 Crossover investors have a relatively broad mandate which permits them to switch between developing and developed world assets, thus putting emerging market assets in direct competition with other assets. While many crossover investors are limited to investment grade instruments, they are nevertheless becoming more involved in emerging market securities due to the improved credit quality of some large issuers.
4 See Fama and French (1992, 1993, 1996) for tests of the CAPM model. Fama and French (1996), for example, show that a three-factor model performs well in explaining the variation in the excess returns on value-weighted portfolios of US equities.
5 To name but a few in a large literature, see Trzcinka (1986), Brown (1989), Connor and Korajczyk (1993), Mei (1993a,b) and Harvey (1995).
Portfolio allocation hinges on asset price co-movement …
… which can be decomposed into factors

BIS Quarterly Review , December 2003 67
significant portion of the variation in returns across the term structure. They interpret these factors as representing the level of interest rates, the slope of the yield curve and the curvature of the yield curve.
Building on the above literature, we apply principal factor analysis to emerging market sovereign bond spreads to investigate their common sources of variation, and provide tentative answers to the following questions. First, to what extent are movements in emerging market spreads driven by common forces? Second, how many distinct common forces drive their co-movement? Finally, what are these common forces? That is, can the underlying factors be interpreted in an economically meaningful way?
Emerging market debt as an asset class
Although foreign direct investment remains by far the most significant financing source, the international debt securities market has overtaken bank loans and official creditor flows over the last 10 years to become the second largest source of capital for emerging market borrowers. Net financing in the form of bank loans constituted 26% of all medium- and long-term private capital flows to these markets between 1980 and 1985. However, with increased access to direct financing, net intermediated credit fell to only 11% of total financing to emerging markets between 1996 and 2002, while the net issuance of debt securities rose from 2% to 35% over the same period. Currently, bank loans and debt securities have roughly equal shares in total external debt (Graph 1, left-hand panel).
The shift from loans to securities was triggered by the Mexican debt crisis of 1982, after which many outstanding bank loans to emerging markets were restructured into collateralised bonds (so-called Brady bonds) at the end of the 1980s and in the early 1990s. This conversion of loans into Brady bonds was a major impetus behind the rapid rise in outstanding emerging market bond debt,
Structure of emerging market debt
Debt outstanding1 Net flows (in $ bn)
0
8
16
24
32
40
1980 1985 1990 1995 2000
BondsBanks
-40
-20
0
20
40
60
1980 1985 1990 1995 2000
1 As a percentage of total emerging market external debt outstanding.
Source: World Bank. Graph 1
The debt market blossomed following the Brady Plan …

68 BIS Quarterly Review, December 2003
which had grown to $485 billion by 2002, or by 27% per year on average. Roughly 77% of the sovereign bonds issued in the last 10 years by emerging market governments have been denominated in US dollars, followed by euro (17%) and yen (6%) denominations.
In recent years, bond financing has proved to be more resilient than bank loans. The Asian and Russian crises in the late 1990s, followed by the recent Argentine default, led to a sharp decline in bank financing; the net flow of bank loans to emerging market borrowers turned negative in 1999 for the first time in 20 years (Graph 1, right-hand panel). Conversely, bond flows, while also declining, remained positive. However, the aggregate figures obscure a significant shift in flows from Latin America towards Asia; gross flows to Latin America declined by 48% in 2002, mainly reflecting the deteriorating situation in Argentina during this period.
The market for emerging market debt has matured considerably in recent years. Market liquidity and transparency have been enhanced as the investor base has broadened. In 1998, hedge funds accounted for 30% of all activity in this market, while high-grade or “real money” investors (eg pension funds and other institutional investors) constituted only 9%.6 By 2002, the share of hedge funds had declined to 10%, while that of high-grade investors had risen to 32%. Furthermore, an increasing number of countries are now able to issue longer-maturity bonds (eg 10-year maturity), which is beneficial for issuers trying to reduce interest rate sensitivity, and for investors looking for higher-duration investment opportunities. Evidence of the maturing of this market is the decline in the share of Brady bonds in total emerging market debt; countries have repurchased Brady bonds for cost reasons since these bonds typically trade at a discount. The share of outstanding Brady bonds and other repackaged issues in the stock of international debt securities issued by emerging markets fell from 49% in March 1995 to 12% in June 2003.
Common variation in spreads
Although spreads at issuance, which reflect the actual cost of capital, may be the most relevant for the issuer, portfolio managers arguably follow spreads in the secondary market more closely. Secondary market spreads, available with daily frequency, may reflect subtle changes in the global investing climate more accurately than lower-frequency data. Thus our data sample comprises the country-specific components of the EMBI Global index.7 The primary data
6 Other participants in this market include mutual funds, Latin American accounts and non-US
financial institutions.
7 The EMBI Global index tracks the total return and spreads for US dollar-denominated debt instruments issued by emerging market sovereign and semi-sovereign entities, and consists of Brady bonds, eurobonds and loans. Because the share of loans in the EMBI Global is negligible (1.6% in the total index), and because the majority of emerging market debt is dollar-denominated, the index can be considered a close approximation of an emerging market bond portfolio. The inclusion of Brady bonds may introduce price distortions because of their specific structure (eg collateralisation). In addition, differences in the average duration of each country-specific component in the EMBI Global may affect the degree to which each spread reacts to global shocks.
… and matured as the investor base broadened

BIS Quarterly Review , December 2003 69
sample consists of the changes in daily spreads for 15 emerging markets for the period 31 March 1997 to 18 June 2003. For certain purposes (noted below), we rely on a broader country sample (over a shorter time period).
In the remainder of this section, we investigate the number of common forces that influence emerging market spreads using principal factor analysis. This empirical technique also allows us to say something about the degree to which common forces, rather than idiosyncratic forces, influence spread movements. Simply put, factor analysis is a statistical method by which the common variation in a set of correlated variables is extracted and used to form new data series (or factors) that “summarise” the original series. Data series that are highly covariate need few common factors to explain a significant portion of their common variance. In this section, we focus on the degree to which common factors are relevant, and how their importance differs by rating.
Common variation and the number of factors
Factor analysis indicates that only one significant factor drives the common portion of the variation in daily spread changes for the 15-country sample, a somewhat surprising result given the presumably complex process underlying sovereign debt markets.8 This single factor explains roughly 95% of the common variation in the underlying daily spreads. That said, this common variation accounts for a relatively small share of the variation in daily spread movements. The average (across countries) “uniqueness”, or the portion of total variation in each spread not explained by the common factor, is
Factor loadings and uniqueness measures 31 March 1997 – 18 June 2003
Country Loading Uniqueness
Argentina 0.364 0.867 Brazil 0.744 0.446 Bulgaria 0.733 0.462 China 0.258 0.934 Colombia 0.596 0.645 Ecuador 0.403 0.837 Korea 0.590 0.652 Malaysia 0.335 0.888 Mexico 0.860 0.260 Nigeria 0.321 0.897 Panama 0.764 0.417 Peru 0.625 0.609 South Africa 0.418 0.825 Turkey 0.439 0.808 Venezuela 0.655 0.570
Average 0.540 0.674
Table 1
8 The number of relevant factors is determined using the Kaiser criterion, which drops those
factors that account for less variance than at least one underlying spread series.
Nearly all common variation is explained by a single factor …

70 BIS Quarterly Review, December 2003
0.67, indicating that, on average, only one third of the total variation in spreads is driven by common forces.9
Although the common portion of variation has an apparently simple structure, there remains considerable cross-country heterogeneity in spread movements. Table 1 lists the factor loadings, which are a measure of the degree to which individual spreads move with the common factor, and the uniqueness measures for each of the 15 countries. For only four countries (Mexico, Panama, Brazil and Bulgaria) does the common factor account for more than half the variation in the underlying spread series; that is, they load highly on the common factor and have relatively low uniqueness measures. While there does not seem to be a clear pattern across countries, the average uniqueness for the eight Latin American countries is 0.54, while that for the three emerging Asian countries is over 0.82. This regional difference may be indicative of sample bias, as Latin America is more heavily represented in our sample. Alternatively, it may be driven by differences in the average debt quality, or rating, across these regions.
To investigate this issue more systematically, we apply factor analysis separately to groups of investment grade and non-investment grade countries. By dividing the sample (of 25 countries) in this way, we should expect to see lower (average) uniqueness measures (relative to the pooled sample) for each group given the assumption that the underlying factors that drive bond spreads are different across rating classes.10 In addition, the underlying factors
Emerging market bond spreads by rating class
Spread levels Spread changes1
0
2
4
6
8
10
12
14
Aug 99 Aug 00 Aug 01 Aug 02
Investment grade Non-investment grade
-0.06
-0.04
-0.02
0
0.02
0.04
0.06
0.08
Nov 99 Nov 00 Nov 01 Nov 02
Note: Period of analysis is 3 August 1999 to 11 June 2003; data based on spreads over US Treasuries (in percentages).
1 Ninety-day moving average of the simple average across countries.
Sources JP Morgan Chase; BIS calculations. Graph 2
9 Robustness tests using a sample of 21 countries over the 1998–2003 period yield similar
results.
10 To maximise the number of countries available, this analysis relies on daily spread data from 3 August 1999 to 11 June 2003.
… although idiosyncratic forces remain important
We separate out investment grade countries

BIS Quarterly Review , December 2003 71
Factor loadings and uniqueness measures by rating class 3 August 1999 – 11 June 2003
Investment grade Non-investment grade
Country Loading Uniqueness Country Loading Uniqueness
Chile 0.440 0.806 Argentina 0.311 0.903 China 0.560 0.686 Brazil 0.655 0.571 Croatia 0.032 0.999 Bulgaria 0.487 0.763 Hungary 0.366 0.866 Colombia 0.607 0.632 Korea 0.652 0.575 Côte d'Ivoire 0.152 0.977 Malaysia 0.645 0.583 Ecuador 0.259 0.933 Poland 0.632 0.601 Lebanon 0.261 0.932 South Africa 0.546 0.702 Mexico 0.754 0.432 Thailand 0.515 0.735 Morocco 0.329 0.892 Nigeria 0.234 0.945 Panama 0.702 0.507 Peru 0.607 0.631 Philippines 0.648 0.581 Russia 0.325 0.894 Turkey 0.522 0.728 Venezuela 0.528 0.721 Average 0.488 0.728 Average 0.461 0.753
Table 2
themselves should differ. A country is considered investment grade if it had a Standard & Poor’s rating of BBB– or above on its foreign currency denominated debt for at least half of the sample period. This yields the nine investment grade countries and 16 non-investment grade countries which are listed in Table 2.
Graph 2, which shows the difference in the average spread levels for these groups of countries, as well as the greater average volatility of the non-investment grade debt, hints at the potential importance of this separation. The average spread on non-investment grade debt was, on average, 750 basis points higher than that on investment grade debt between August 1999 and end-May 2002. This difference increased to 1,150 basis points between June 2002 and June 2003, reflecting the deteriorating situation in Argentina and Brazil during this period. Similarly, the daily change in spreads on non-investment grade debt was, on average, 7 basis points greater than that on investment grade debt during the earlier period, and 13 basis points greater in the latter period.
However, despite this, there is little evidence of sustained differences in the common forces of variation across rating classes. Factor analysis again indicates that a single common factor explains virtually all of the common variation in each group. Moreover, as shown in Table 2, the average uniqueness measures are similar across rating classes, and imply that the class-specific common factor accounts for, on average, one third of the total variation in each underlying spread. When factor analysis is applied to the
While spreads differ across rating classes …
… their underlying factors are remarkably similar

72 BIS Quarterly Review, December 2003
group of 25 countries as a whole, the average uniqueness measure is 0.79, higher than that in each group, but only marginally so.11
While the different factors driving the investment and non-investment grade spreads move together overall (Graph 3), they appear to diverge starting in mid-2002.12 In addition, there remains considerable intra-class heterogeneity in spread movements. The (moving average of the) non-investment grade common factor rises to 0.35 by end-May 2002, which corresponds to the rise in the underlying spreads on Latin American debt during the Argentine default and the impending crisis in Brazil. By January 2003, however, spreads in Latin America had come down, and this is reflected in the precipitous fall in the non-investment grade common factor.
Differences over time
While the above evidence suggests at most a single common factor, the global macroeconomic environment, and (possibly) the corresponding risk appetite of portfolio managers, changed substantially over the 1997–2003 period with the rise and fall of world equity markets. Thus, there may have been structural changes in the forces driving emerging market spreads that the above (pooled) analysis fails to uncover. The continued integration of emerging markets into the global economy may suggest that emerging market spreads should become more synchronised over time. However, regional issues, such as the Russian and Argentine defaults and the asymmetric effect of the global economic slowdown, may actually have led to a decrease in their co-movement. Indeed, the divergence since mid-2002 of the investment and
Common factors by rating class
-0.4
-0.2
0
0.2
0.4
Aug 99 Aug 00 Aug 01 Aug 02
Investment gradeNon-investment grade
Note: Period of analysis is 3 August 1999 to 11 June 2003; 90-day moving averages.
Sources: JPMorgan Chase; BIS calculations. Graph 3
11 Factor analysis for the pooled sample of 25 countries indicates the presence of two common
factors, although the second common factor only marginally passes the selection criterion. This issue is discussed in the next section.
12 These factors have a correlation coefficient of 0.498, but are not statistically different from each other.
Global market integration may influence the number of common factors

BIS Quarterly Review , December 2003 73
Factor number and common variation explained Year Significant factors Proportion factor 11 Proportion factor 2 Average uniqueness2
19973 1 0.816 0.109 0.502 1998 1 0.818 0.092 0.489 1999 1 0.846 0.126 0.633 2000 1 0.863 0.155 0.683 2001 2 0.766 0.212 0.568 2002 2 0.779 0.187 0.625 20034 1 0.780 0.119 0.671
1 The proportion of common variation explained by the factor. 2 Measured across the 15 countries in the sample. 3 Data for 31 March 1997 to 31 December 1997. 4 Data for 1 January 2003 to 18 June 2003. Table 3
non-investment grade factors discussed above suggests that this may be the case (Graph 3).
In the analysis that follows, we return to the original 15-country sample, repeat the factor analysis separately for each year and report the results in Table 3. For the years up to and including 2000, the common variation is again driven by a single common factor. In fact, the proportion of common variation explained by the first factor is little changed over this period, rising from 0.82 in 1997 to 0.86 in 2000. However, the average of the uniqueness measures across countries rises from around 0.5 in 1997 to 0.68 in 2000. Thus, while common components accounted for, on average, half the total variation in emerging market spreads in the early years of the sample period, idiosyncratic forces became more important vis-à-vis common forces in later years, in keeping with the hypothesis that market participants became more discriminating (see also the 72nd BIS Annual Report (2002)).
Consistent with this changing covariance structure, a second factor is identified for the years 2001 and 2002, although this evidence is tentative at best.13 The proportion of common variation explained by the first factor dropped to 0.76, while that explained by the second rose to around 0.2. In addition, the average uniqueness fell to 0.56 in 2001 and 0.62 in 2002, still higher than the 1997 and 1998 values, but suggesting that the common sources of variation increased vis-à-vis idiosyncratic forces in the wake of equity market collapses. That said, there does not seem to be a sustained change in the underlying covariance structure. Analysis of the first half of 2003, when again a single common factor is identified, indicates that the uniqueness measure rose to 0.67, roughly the same as the 1999 and 2000 values.
Assigning economic meaning
The above analysis suggested that movements in emerging market bond spreads are driven to some extent by a single common component, but
13 While the Kaiser rule does indicate a second common factor in 2001 and 2002, this selection
criterion remains somewhat controversial. In addition, the second factor only marginally passes this selection test (relative to the first factor), meaning that these results may be driven by statistical noise rather than changes in economic fundamentals.
A second common factor has emerged in recent years

74 BIS Quarterly Review, December 2003
provided no guidance as to what economic forces might underlie this common source of variation. This section explores this issue in search of an economically meaningful interpretation of the common factor. By construction, the factor is an abstract series that explains (a portion of) the common variation in the daily spread movements. As such, it seems most likely to correspond to developments in the global economy, changes in the willingness of investors to incur risk, or common developments for emerging markets as a group.
Our strategy is to analyse the simple correlation between the common factor series and variables that are hypothesised to reflect these global trends. While it is impossible to identify precisely what the common factor represents, such an exercise may prove useful in determining which global trends tend to be the most important. In particular, we focus on the explanatory power of the return of the S&P 500, FTSE and Nasdaq stock indices, long- and short-term US interest rates and the slope of the US yield curve, the price of oil, and several measures of investor risk tolerance. These include the implied volatilities on US Treasuries of various maturities, the VIX, the BBB corporate spread and the high-yield spread.14 With the exception of the daily implied volatilities, all series are expressed as daily changes.
The common factor is significantly correlated with several of these variables (Table 4). This result is driven both by the high correlation between many of these variables themselves and by the fact that the common factor, by construction, represents a mixture of all common forces driving emerging market debt spreads. Overall, the analysis indicates a negative correlation between the common factor and US interest rate variables, and a positive
Correlation between common factor and economic variables
Equity indices Nasdaq –0.280 FTSE –0.324 S&P 500 –0.364
US interest rates
Federal funds futures –0.171 US three-month Treasury yield –0.084 US 10-year Treasury yield –0.365 Slope yield curve –0.264
Other measures
Price of oil –0.023 VIX index 0.419 BBB spread 0.111 High-yield spread 0.401
Note: All variables are in differences. Table 4
14 The VIX is the Chicago Board Options Exchange Volatility Index, and is a market estimate of
future volatility. It is based on a weighted average of the implied volatilities of eight OEX calls and puts. The slope of the US yield curve is the difference in the yields on the 10-year and three-month US Treasury bills.
The common factor correlates with US interest rates …

BIS Quarterly Review , December 2003 75
correlation between the factor and measures of risk tolerance. In particular, the implied negative relationship between daily changes in the federal funds futures rate, an indicator of market expectations of future US monetary policy, and emerging market spreads is somewhat inconsistent with previous empirical work that has relied on lower-frequency data (see the box on page 76).
A possible explanation for this negative relationship can be found in the information content of the slope of the US yield curve, which is often used as a proxy for expected future economic growth. If investors become optimistic about future economic growth in the developed world, triggering an increase in the slope of the yield curve, they may expect emerging markets to benefit from increased product demand, particularly in export-dependent countries. This, in turn, may reduce the probability of sovereign default, and thus lead to a decrease in emerging market sovereign spreads. This effect may be amplified if, in addition, investor risk tolerance and expectations of future growth prospects are procyclical, as the subsequent substitution into riskier assets may further drive down emerging market spreads.
Consistent with this, two of the variables that correlate highly with the common factor are directly related to investors’ risk tolerance. The VIX and the high-yield spread both have correlation coefficients above 0.4, while the BBB spread has a coefficient above 0.1. This hypothesis is further supported by the relatively strong (negative) correlations between the common factor and the equity market indices.15 A rise in the return on the S&P 500 Index, for example, is associated with a fall in the common factor, and hence a fall in spreads. To the extent that equity returns and changes in risk tolerance are linked, this negative relationship suggests that changes in investors’ overall appetite for risk are a significant component of the common variation in emerging market spreads.
Conclusions
Using principal factor analysis, we find that a single common factor drives the common portion of variation in sovereign bond spreads for a sample of 15 emerging market countries. The common factor accounts for, on average, one third of the total variation in daily spread changes, indicating that idiosyncratic elements remain the most significant explanation for spread movements. Although spreads on investment and non-investment grade debt differ (both in levels and in volatility), the common factors for each of these groups are surprisingly similar across a broader sample of 25 countries.
At the same time, we find tentative signs of a changing covariance structure, as evidenced by the decline in the proportion of total variation accounted for by common components and by the emergence of a second common factor sometime after 2000. This is highlighted by the divergence in
15 Changes in the discount factor (ie the degree of risk aversion) are thought to be responsible
for a significant portion of the volatility in equity prices. See Cochrane (2001) for a discussion.
… and variables related to risk tolerance

76 BIS Quarterly Review, December 2003
US interest rates and emerging market bond spreads
A noteworthy result from the factor analysis in the main text is the negative correlation between the common factor underlying emerging market sovereign bond spreads and daily changes in US interest rates and federal funds futures. Our findings imply that increases in US interest rates, or expected increases in rates as proxied by federal funds futures, are associated with lower emerging market spreads. This result must be interpreted against the backdrop of a considerable, but inconclusive, literature on the relationship between US monetary policy and emerging market spreads. While some studies find a positive relationship (Arora and Cerisola (2001)), others find a negative relationship (Eichengreen and Mody (1998)), or no relationship at all (Kamin and von Kleist (1999)).
This lack of consensus is driven by the idiosyncratic nature of much of the previous empirical work. Results depend on whether primary or secondary market spreads are used, on the inclusion/exclusion of certain emerging market issuers, on the time period under consideration, and on the regression technique applied to the data (see the table below). In addition, most previous studies relied on low-frequency data, which allows the inclusion of country-specific economic variables as regressors, but necessarily precludes analysis of high-frequency spread movements. The results from the factor analysis in the main text hint at a more nuanced relationship, where long-term changes coincide but short-term patterns are different.
Summary of empirical work on emerging market debt
Authors Period sample
Data frequency Dependent variable Sign1
Dooley et al (1996) 1986–92 annual Log level secondary market prices + 2
Kamin and von Kleist (1999) 1991–97 not relevant Log level primary market spreads – / 0 3
Eichengreen and Mody (1998) 1991–96 not relevant Log level primary market spreads – 4
Arora and Cerisola (2001) 1994–99 monthly Log level secondary market spreads + 5
McGuire and Schrijvers (2003) 1997–2003 daily Changes and levels of secondary market spreads
–
1 Indicates the relationship between emerging market spreads or yields and some measure of US interest rates. 2 Dooley et al (1996) find a significant negative relationship between 10-year US interest rates and the market price of emerging market securities. 3 Kamin and von Kleist (1999) calculate their own emerging market index and find (in most cases) insignificant coefficients on the one-year US Treasury interest rate. 4 Eichengreen and Mody (1998) use a Bondware emerging market index and find a lower probability of emerging market debt issues if US interest rates are high. 5 Arora and Cerisola (2001) find significant results for 10 out of 11 sample countries.
In order to facilitate comparison between our results and those in previous studies, we applied
ordinary least squares (OLS) to the EMBI Global index (and to the individual country components of this index), and included the US interest rate variables described in the main text as regressors. Using the EMBI Global in levels as the dependent variable, the coefficient on the level of US interest rates (either the three-month US Treasury yield or the federal funds futures rate) is indeed positive (although insignificant) for the pooled sample covering the entire 1999–2003 period. Interestingly, however, the same exercise on a year-by-year basis yields very different results. In four out of five years, the coefficient on either the US interest rate or the federal funds futures rate is negative, and is significant three times. Furthermore, the explanatory power increases considerably in the year-by-year equations.
____________________________
Jeanneau and Micu (2002) find a comparable positive relationship between the level of real short-term interest rates in industrial countries and bank lending to emerging markets.

BIS Quarterly Review , December 2003 77
Since the change in spreads is considered a proxy for returns, the above experiment was
repeated after first-differencing all the data, the standard practice in the empirical finance literature. Simple OLS regressions on these data yield similar results; expected changes in US monetary policy or US interest rates are negatively correlated with changes in emerging market spreads in the pooled sample as well as in each year, and are everywhere statistically significant. Moreover, these same regressions were repeated separately for each of 20 countries. For 18 of the 20 countries, the coefficients on the US interest rate measures were negative and significant, both in the pooled sample and in the year-by-year regressions. Together, these results suggest that emerging market spreads do move in tandem with US interest rates over long periods, but that different processes govern the short-run dynamics. __________________________________
First-differencing the spread series helps to avoid econometric problems caused by unit roots. Kamin and von Kleist (1999) find non-stationarity when testing with levels.
the factors underlying investment and non-investment grade spreads, which probably reflected the deteriorating situation in Argentina in 2001 and the crisis in Brazil in 2002.
There is some evidence that the common factor reflects changes in investors’ tolerance for risk. Although it is impossible to ascribe precise economic meaning to the common factor, the high correlation between it and high-frequency measures of risk tolerance suggests that the common variation in emerging market debt spreads is largely explained by changes in attitudes towards risk within the international investment community. Furthermore, to the extent that changes in investor risk tolerance and expectations of future growth prospects are procyclical, this hypothesis is supported by the negative correlation between the factor and US interest rate variables.
References
Arnott, R (1980): “Cluster analysis and stock price movements”, Financial Analysts Journal, 36, no 3, November/December, pp 56–62.
Arora, V and M Cerisola (2001): “How does US monetary policy influence sovereign spreads in emerging markets?”, IMF Staff Papers, Washington, pp 474–98.
Bank for International Settlements (2002): 72nd BIS Annual Report, Basel.
Brown, S (1989): “The number of factors in security returns”, Journal of Finance, 44, no 5, December, pp 1247–62.
Cochrane, J (2001): Asset pricing, Princeton University Press, Princeton.
Connor, G and R Korajczyk (1993): “A test for the number of factors in an approximate factor model”, Journal of Finance, 48, no 4, September, pp 1263–91.
Dooley, M, E Fernández-Arias and K Kletzer (1996): “Is the debt crisis history? Recent private capital inflows to developing countries”, World Bank Economic Review, vol 10, pp 27–50.

78 BIS Quarterly Review, December 2003
Eichengreen, B and A Mody (1998): “What explains changing spreads on emerging-market debt: fundamentals or market sentiment?”, NBER Working Papers, no 6408.
Fama, E and K French (1992): “The cross-section of expected stock returns”, Journal of Finance, 47, no 2, June, pp 427–65.
——— (1993): “Common risk factors in the returns on stocks and bonds”, Journal of Financial Economics, 33, no 1, February, pp 3–56.
——— (1996): “The CAPM is wanted, dead or alive”, Journal of Finance, 49, no 5, December, pp 1579–93.
Farrell, J (1974): “Analyzing covariation of returns to determine homogenous stock groupings”, Journal of Business, 47, no 2, April, pp 186–207.
Feeney, G and D Hester (1967): “Stock market indices: a principal components analysis”, in D Hester and J Tobin (eds), Risk aversion and portfolio choice, Wiley, New York.
Harvey, C R (1995): “Predictable risk and return in emerging markets”, Review of Financial Studies, 8, no 3, pp 773–816.
Jeanneau, S and M Micu (2002): “International bank lending to emerging market countries: explaining the 1990s roller coaster”, BIS Quarterly Review, March, pp 52–64.
Kamin, S and K von Kleist (1999): “The evolution and determinants of emerging market credit spreads in the 1990s”, BIS Working Paper no 68, May.
Litterman, R and J Scheinkman (1991): “Common factors affecting bond returns”, Journal of Fixed Income, pp 54–61.
Mei, J (1993a): “A semiautoregression approach to the arbitrage pricing theory”, Journal of Finance, 48, no 2, June, pp 599–620.
——— (1993b): “Explaining the cross-section of returns via a multi-factor APT model”, Journal of Financial and Quantitative Analysis, 28, no 3, September, pp 331–45.
Ross, S (1976): “The arbitrage theory of capital asset pricing”, Journal of Economic Theory, 13, no 3, December.
Trzcinka, C (1986): “On the number of factors in the arbitrage pricing model”, Journal of Finance, 41, no 2, June, pp 347–68.

BIS Quarterly Review, December 2003 79
Frank Packer+41 61 280 8449
Chamaree Suthiphongchai+662 283 5307
Sovereign credit default swaps1
The market for credit derivatives, or financial contracts whose payoffs are linked to changes in the credit quality of a reference asset, has expanded dramatically in recent years. According to the 2002 Credit Derivatives Report of the British Bankers’ Association, the credit derivatives market grew from $40 billion outstanding notional value in 1996 to an estimated $1.2 trillion at the end of 2001, and is expected to reach $4.8 trillion by the end of 2004.2 The same report indicates that single name credit default swaps (CDSs) accounted for roughly 45% of the overall credit derivatives market.
This note examines developments in the CDS market with a particular focus on the segments where the reference assets are sovereign obligations. Sovereign CDSs, which benefited from the standardisation of contract form and definitions in 1998 and 1999 as well as successful execution in the case of recent defaults, are considered the most liquid credit derivative instruments in emerging markets. Particularly as their liquidity increases, sovereign CDSs have the potential to supplement and increase efficiency in underlying sovereign bond markets.3
This special feature begins by briefly outlining the function and structure of credit default swaps. We then review the data provided by CreditTrade, one of the major trading platforms for credit derivatives, and use this as a basis for comparing sovereign with corporate and bank CDSs across a number of dimensions, including concentration of quotes by name of the reference asset, rating composition, maturity and pricing.
1 Chamaree Suthiphongchai was seconded to the BIS by the Bank of Thailand while this special
feature was being researched. The views expressed in this article are those of the authors and do not necessarily reflect those of the BIS or the Bank of Thailand. The authors wish to acknowledge the invaluable assistance of Anna Cobau, and helpful comments from Jacob Gyntelberg and Haibin Zhu in the course of preparing this feature.
2 In a more recent survey of around 200 financial institutions, Fitch Ratings (2003) identified derivatives-related sold credit protection of around $1.7 trillion.
3 Although some work has found bid-ask spreads of the credit default swaps in the more liquid sovereign names to be 10–20 basis points, generally wider than those observed in the cash market, increasing volumes in the CDS market could narrow the differential going forward. For a detailed analysis, see Dresdner Kleinwort Wasserstein Research (2002). Earlier work on the topic is to be found in JPMorgan (2001).

80 BIS Quarterly Review, December 2003
Background and data source
Credit default swaps are credit protection contracts whereby one party agrees, in exchange for a periodic premium, to make a contingent payment in the case of a defined credit event. For buyers of credit protection, the CDS market offers the opportunity to reduce credit concentration and regulatory capital while maintaining customer relationships. For sellers of protection, it offers the opportunity to take credit exposure over a customised term and earn income without having to fund the position.
The quoting convention for CDSs is the annual premium payment as a percentage of the notional value of the reference obligation. Under certain conditions, this CDS premium should be approximately equal to the credit spread (yield minus risk-free rates) of the reference bond of the same maturity. In addition to confirming this stylised fact, empirical work suggests that the CDS premium tracks the spread over dollar swap rates more closely than the spread over US Treasury rates.4
The main data source for this special feature is CreditTrade, a major broker in the trading of credit and credit derivatives. The company’s Market Prices database lists bids and offers of brokers and traders for CDSs, as well as other characteristics of the quote and reference asset. In addition to the price (premium) in basis points, the database includes with each quote the reference entity name, the notional amount and seniority of the reference asset, whether the quote is a bid or an offer, the date of the quote, the rating by
Breakdown of CDS names (January 1997 – June 2003)
By region By sector
7 238
133
4819
473 29
709
6
Africa Japan Asia excl Japan Australia Eastern Europe Europe Latin America Middle East North America
293
1,292
77
Bank Corporate Sovereign
Source: CreditTrade. Graph 1
4 See, for example, the discussions in Zhu (2003) and Hull et al (2003).
The CDS database includes dated premium quotes ...
... and other characteristics of the reference asset

BIS Quarterly Review, December 2003 81
both Moody’s and Standard & Poor’s, maturity, and type of restructuring clause.
The database also identifies quotes that result in actual transactions through the system, and the number is not particularly large. For instance, in 2002 only 6% of quotes corresponded to actual transactions. Even so, quotes are more than indicative, since once submitted they are binding on participants. In what follows, we will use all quotes entered into the system as a metric for market activity.
In terms of chronological and geographical coverage, the database spans the period from January 1997 to June 2003, and contains slightly more than 400,000 quotes on 1,662 different reference entities from around the world. Of these entities, 1,292 are corporate names, 293 are banks and 77 are sovereigns (Graph 1).
Growth and development
Table 1 lists the overall number of quotes on CDSs reported in the database each year, classified by category of the reference asset, ie corporate, bank or sovereign. Clearly, the growth of quotes overall continues to be very strong, reaching 124% and 63.8% in 2001 and 2002, respectively. The overall number of quotes on CDSs for the first six months of 2003 was nearly 53% greater than that registered over the same period in 2002.
Within the CDS market, quotes on sovereign CDSs occupy a relatively small share, in part reflecting the far smaller number of names being traded. Sovereign CDSs accounted for around 7.4% of all quotes in 2002 and 2003 to date. Corporates account for the bulk of quotes over the same years at 78.6%, while banks account for roughly 14%. Even so, the resulting mean number of quotes per name is higher for sovereign CDSs than for the other categories, suggesting a higher degree of concentration in activity in sovereign names, as discussed further below.
Number of quotes by type of CDS Number of quotes
Type 1997 1998 1999 2000 2001 2002 20031
Corporate 196 1,892 11,726 22,538 55,679 102,039 88,817 Bank 394 2,715 8,021 6,854 16,844 25,490 8,615 Sovereign 771 2,283 8,169 8,133 11,535 10,124 7,844 Total 1,361 6,890 27,916 37,525 84,058 137,653 105,276
% change of number of quotes and trades from the previous year
Corporate . 865.3 519.8 92.2 147.0 83.3 96.9 Bank . 589.1 195.4 –14.5 145.8 51.3 –50.5 Sovereign . 196.1 257.8 –0.4 41.8 –12.2 48.2 Total . 406.2 305.2 34.4 124.0 63.8 52.9
1 First half; change over first half of 2002.
Source: CreditTrade. Table 1
Quotes on sovereign CDSs are relatively few but concentrated

82 BIS Quarterly Review, December 2003
Volume of CDS contracts by exposure class In billions of US dollars1
0
100
200
300
400
500
600
700
2000 2001 2002 2003
Bank Corporate Sovereign
1 Yearly sum of volume of contracts quoted on CreditTrade; for 2003, first half only.
Sources: CreditTrade; BIS calculations. Graph 2
Though the growth of sovereign CDSs has consistently been less than
that of corporate CDSs, the first six months of 2003 recorded a robust 48.2% year-on-year rate of growth. This was a significant rebound from the decline in activity seen in 2002. More than one third of this decline was due to the elimination of Argentina from the list of reference entities after its default in late 2001. Most of the rest of the drop was accounted for by a fall in transactions for Asian names such as China, Korea and Thailand. However, the decline in Asian names has levelled off in 2003, while growth in other Latin American names such as Brazil and Mexico has continued.
Similar patterns can be noted in the overall volume of quoted CDS contracts, where the volume is defined as the sum of available quotes multiplied by the size of the notional reference debt obligation (Graph 2). Thus defined, the volume of sovereign CDSs for the first six months of 2003 was higher than that for the first six months of 2002, although the rate of expansion was less than that for the volume of CDSs on corporate obligations. At the same time, the growth rate was well above that observed for CDS volume on bank obligations, which fell into negative territory.
Relative to the corporate sector, the concentration of quotes on sovereign CDSs by name is very marked. The five leading names are Brazil, Mexico, Japan, the Philippines and South Africa, which together account for more than 40% of listed quotes on sovereign names. The addition of Colombia and China brings the total to more than 50% (Table 2). By contrast, the top five names in corporate CDSs yield only 7.7% of all corporate quotes on CreditTrade.
The concentration of sovereign CDSs among emerging market sovereign names is for the most part consistent with the composition of TRAC-X Emerging Markets, the new credit default swap index from JPMorgan Chase and Morgan Stanley. For instance, the weighting of the top three names in the TRAC-X index, Mexico, Russia and Brazil, is slightly higher than 37%, while the most actively quoted sovereign names for 2003 in CreditTrade, Mexico, Brazil
Higher volume growth for sovereign than for bank CDSs

BIS Quarterly Review, December 2003 83
and South Africa, comprise more than 35% of the 2003 sample. Though quotes on non-emerging market entities constitute less than 10% of the total quotes on sovereigns, one country that has had a significant presence as a reference entity in the CreditTrade data set is Japan. CDSs on Japanese bonds make up more than 6% of all observed sovereign quotes on CreditTrade during 2000–03.
Unlike CDSs written on bank and corporate obligations, the vast majority of outstanding sovereign CDSs remain governed by the old restructuring clause of the 1999 ISDA Credit Derivatives Definitions (Graph 3). Among non-sovereign CDS contracts drafted under this clause, there had been several cases where protection buyers had claimed higher compensation than the actual losses they suffered. These unjustified claims were behind the development of a modified restructuring clause in 2001 (with further refinement in 2003). Though many protection sellers included the new clause in corporate and bank CDS contracts, CDSs on sovereign obligations do not seem to have been similarly affected. This is reportedly because the likelihood of restructuring occurring in the absence of a real deterioration in financial status is believed to be very rare in the case of sovereign CDSs. Most emerging market sovereign CDSs are bond-oriented in terms of the credit event indication and the deliverable obligation, and opportunistic restructuring is viewed as less feasible in the case of widely held bond obligations.
Concentration of quotes on sovereign CDSs Number of quotes Average rating1
Name 2000 2001 2002 2003 Total
Percentage 2000 2001 2002 2003
Brazil 1,080 1,352 1,293 868 4,593 12.2 B+ B+ B B Mexico 748 1,010 1,644 933 4,335 11.5 BBB– BBB– BBB BBB Japan 418 1,062 628 205 2,313 6.1 AA+ AA– A+ A+ Philippines 821 740 436 209 2,206 5.9 BB+ BB+ BB+ BB South Africa 94 518 717 683 2,012 5.3 BBB– BBB– BBB– BBB Colombia 93 345 801 556 1,795 4.8 BB BB BB BB China 743 672 140 62 1,617 4.3 BBB+ BBB+ BBB+ BBB+ Korea 533 636 138 287 1,594 4.2 BBB BBB A– A– Poland 329 388 406 420 1,543 4.1 BBB+ BBB+ A– A– Venezuela 155 521 497 319 1,492 4.0 B B+ B B Turkey 146 471 475 380 1,472 3.9 B+ B B– B– Malaysia 302 685 256 85 1,328 3.5 BBB BBB BBB+ BBB+ Argentina 851 461 0 6 1,318 3.5 B+ . . . Thailand 494 562 121 37 1,214 3.2 BB– BBB– BBB– BBB– Russia 16 395 365 377 1,153 3.1 B– B– BB BB Other countries 1,310 1,717 2,207 2,417 7,651 20.3 . . . . All emerging
markets 7,523 10,283 9,218 7,053 34,077 90.5 . . . .
Total 8,133 11,535 10,124 7,844 37,636 100.0 . . . .
1 End-year average of Moody’s and Standard & Poor’s ratings from CreditTrade transactions. Table 2
Sovereign CDSs rely on the old restructuring clause

84 BIS Quarterly Review, December 2003
CDS contracts by restructuring clause As a percentage of total number of contracts
Bank Corporate Sovereign No restructuring Old restructuring Modified restructuring 2003 modified restructuring
0
20
40
60
80
100
1997 1999 2001 2003 0
20
40
60
80
100
1997 1999 2001 20030
20
40
60
80
100
1997 1999 2001 2003
Sources: CreditTrade; BIS calculations. Graph 3
The sovereign-linked CDSs tend to be on lower credit quality assets than
the other categories of CDS. Graph 4 documents the composition of CDS volume by rating category for our three classes of reference asset.5 Just below 40% of sovereign obligations that provide the underlying asset for CDSs are sub-investment grade (BB and below), far more than in the case of either corporate or bank reference assets. Similarly, 10–15% of the reference assets for sovereigns tend to be highly rated at AAA or AA, a smaller proportion than the 20% rates seen for bank CDSs, though larger than is the case for corporates.6
Sovereign-linked CDSs tend to have a U-shaped distribution for the maturity of their reference assets, populated by more of both long- and short-term maturity reference assets than their corporate counterparts (Graph 5). For instance, between 30 and 40% of the quoted obligations have a maturity of more than eight years, versus less than 20% for corporates and less than 10% for banks. In contrast, with the exception of 2003, there have tended to be relatively more quotes on short maturity (ie four years or less) sovereign reference assets than on corporates and banks. This latter characteristic is consistent with the relatively high proportion of lower credit quality sovereigns in the sample, which are often only able to issue at short-term maturities as a result.
5 When the reference obligation has two different ratings from Moody’s and Standard & Poor’s,
the average rating is taken.
6 The distinction between sovereign and corporate CDSs in the investment grade category appears to have become sharper over the past few years. Among corporates, there has been a modest shift to lower investment grade reference assets (ie rated A and BBB). By contrast, the past few years have seen the introduction of quotes on very highly rated names such as France, Germany and Italy. This has compensated for the movement of Japan to the A category from AA in 2002.
Sovereign CDSs tend to be of lower credit quality …
… and on shorter maturity obligations

BIS Quarterly Review, December 2003 85
CDS volumes by rating As a percentage of total volume
Bank Corporate Sovereign AAA AA A BBB BB Below BB Non-rated
0
20
40
60
80
100
2000 2001 2002 20030
20
40
60
80
100
2000 2001 2002 20030
20
40
60
80
100
2000 2001 2002 2003
Sources: CreditTrade; BIS calculations. Graph 4
Premia on sovereign CDSs
As discussed above, the premium should roughly correspond to the spread of the reference obligation of equal maturity over the risk-free rate. For this reason, we should expect the premium to show a fairly close cross-sectional relationship with the credit risk of the underlying reference asset as measured by credit rating agencies. Indeed, there appears to be a consistently negative relationship between ratings and premia on sovereign CDSs (Graph 6).
One question of interest is how the premia on sovereign CDSs might match up relative to other CDS segments, holding the credit rating constant. In the mid-1990s, Cantor and Packer (1995) documented a tendency for lower-grade sovereign bonds to be priced at wider spreads than corporate bonds. This stylised fact would still appear to hold many years later at the letter grade rating levels of B and below; the Bloomberg fair market curve is significantly higher for the US dollar sovereign B sector than the US dollar industrial B2 sector. Do we see a similar result holding for CDS premia as well? In Graph 6, we chart the monthly average CDS premia for all categories between January 2000 and June 2003 for six different rating classes.
A number of results are evident. In the upper rating classes of A or higher, quoted premia for corporate CDSs have tended to be consistently higher than those for the sovereign credits. For instance, in 2003 the spread of AAA-rated corporate-linked CDSs has been around 30 basis points over that of comparably rated sovereigns; for AA- and A-rated obligations, the average difference has been around 40 and 50 basis points, respectively.
The results may be explained by the small sample of highly rated sovereigns for which CDS quotes are available, combined with the relatively broad letter grade rating categories for which the comparisons have been
Just as low-rated sovereign bonds tend to price at higher spreads than their corporate counterparts …

86 BIS Quarterly Review, December 2003
CDS volume by maturity As a percentage of total volume
Bank Corporate Sovereign 0–1 year 2–4 years 5 years 6–7 years 8–11 years 12 or more years
0
20
40
60
80
100
2000 2001 2002 2003 0
20
40
60
80
100
2000 2001 2002 20030
20
40
60
80
100
2000 2001 2002 2003
Sources: CreditTrade; BIS calculations. Graph 5
made. For instance, in the case of AAA-rated reference obligations, the two sovereigns, Germany and France, comprise virtually the entire sample of quotes. But these sovereigns arguably represent credits that would be rated over AAA were such a rating available, so that the sovereign CDSs would naturally be trading at lower premia than a sample of corporations. Similarly in the case of AA- and A-rated credits, specific characteristics of the small sample of sovereign obligations that serve as the underlying asset might explain the difference between the average premia at different rating categories.7
The situation changes when we move to lower grade reference assets, however. The difference between sovereigns and corporates in the premium appears to be virtually indistinguishable for the lower grade categories of BBB and BB, suggesting greater similarity in the pricing of sovereign and industrial credits than was found in the 1990s. Even so, for reference assets rated below BB, sovereign credit still appears to be priced higher, with the average sovereign premium at most times significantly above the corporate average. In the very lowest grade categories, in which countries such as Argentina, Brazil and Turkey have been prominent, the argument can be made that the market is less sure about the returns in the event of default on sovereign credits, and thus has demanded a higher premium than for similarly rated CDSs on corporate credits.8 7 In the case of AA-rated reference obligations, quotes from Japan dominated in 2001 and the
first half of 2002, and were replaced by Italy, Belgium and Spain in 2003. These three countries are rated AA+ and are thus at the higher end of the AA range; Japan is one case where a number of observers have suggested that the market has a more sanguine view of the country’s creditworthiness than that of the major rating agencies. Similarly, the lower premia for CDSs in the A category might be explained by Japan, which had a prominent place in this category in the second half of 2002 and in 2003 subsequent to its rating agency downgrades.
8 To check that outlying observations were not driving the outcome, we also charted the median premia for each rating and sector segment, with similar results.
… premia on low-rated sovereign CDSs tend to be higher as well

BIS Quarterly Review, December 2003 87
Five-year CDS premia by rating Monthly average; in basis points
AAA AA A
0
20
40
60
80
Jan 00 Jan 01 Jan 02 Jan 03
Bank Corporate Sovereign
0
25
50
75
100
Jan 00 Jan 01 Jan 02 Jan 030
40
80
120
160
Jan 00 Jan 01 Jan 02 Jan 03
BBB BB Below BB
0
100
200
300
400
Jan 00 Jan 01 Jan 02 Jan 030
200
400
600
800
Jan 00 Jan 01 Jan 02 Jan 030
400
800
1,200
1,600
Jan 00 Jan 01 Jan 02 Jan 03
Sources: CreditTrade; BIS calculations. Graph 6
Conclusion
Sovereign CDSs constitute a minor though growing part of the CDS market. After falling off in 2002, observed quotes on sovereign CDSs have risen markedly in 2003, with more than 90% of them linked to so-called “emerging market” sovereign credits. Our examination of the quotes available for sovereign CDSs suggests that trading is more concentrated in fewer names than for corporate or bank CDSs, and also tends to be concentrated in underlying assets of relatively short maturity, which is consistent with the relative proportion of low-rated sovereigns that can only issue at short maturities.
With regard to the pricing of sovereign CDSs relative to the pricing of those written on corporate or bank obligations, there is a striking asymmetry between cases depending on whether the underlying is high- or low-rated. On the one hand, the premia for sovereign CDSs are generally lower than for similarly rated corporates at high rating levels. Whether there is a liquidity-based reason for this, or whether it is simply due to the small sample of

88 BIS Quarterly Review, December 2003
sovereigns and the crude grouping by letter grade rating, remains to be seen. By contrast, the mean premia for CDSs written on very low-rated sovereigns appear much higher than those for CDSs written on low-rated corporates. This result is consistent with the market being less sure about returns in the event of sovereign default.
References
British Bankers’ Association (2002): Credit Derivatives Report 2002, September.
Cantor, R and F Packer (1995): “Sovereign credit ratings”, Current issues in economics and finance, Federal Reserve Bank of New York, June.
Dresdner Kleinwort Wasserstein Research (2002): Credit default swaps: a product overview, September.
Fitch Ratings (2003): Global credit derivatives: a qualified success, 24 September.
Hull, J, M Predescu and A White (2003): “The relationship between credit default swap spreads, bond yields and credit rating announcements”, University of Toronto Working Paper, October.
JPMorgan (2001): Emerging market credit derivatives, November.
Xu, D and C Wilder (2003): “Emerging market credit derivatives: market overview, product analyses, and applications”, Deutsche Bank Global Markets Research, May.
Zhu, H (2003): An empirical comparison of credit spreads between the bond market and the CDS market, Bank for International Settlements, manuscript, September.

BIS Quarterly Review, December 2003 89
Robert N McCauley+852 2878 7106
Unifying government bond markets in East Asia1
One conclusion drawn by policymakers from the Asian crisis of 1997–98 is that broader and deeper domestic bond markets would serve to reduce the financial vulnerability of banks and firms to sudden shifts of risk perception on the part of global investors. Better able to sell domestic currency bonds, firms would be less likely to sell foreign currency bonds in order to obtain long-term funding. This would reduce the risk of introducing a mismatch between the currency of cash flows and debt. The temptation to finance long-term investments with short-term bank debt would also be lessened.
Another conclusion drawn is that higher levels of official foreign exchange reserves can likewise serve to reduce financial vulnerability. Asian economies with high reserves, namely China, Hong Kong SAR, Singapore and Taiwan, China (hereinafter Taiwan) seem to have been spared the worst effects of the crisis. Whether coincidence or cause, foreign exchange reserves in the region have since grown strongly (see Aizenmann and Marion (2002)).
These two conclusions are usually seen as complementary but distinct. In June 2003, a group of Asia-Pacific central banks announced that they would be investing about $1 billion in dollar bonds issued by governments and quasi-governments from eight economies in the region. This highlighted the possibility of using the success in the build-up of reserves to advance the development of local bond markets. Indeed, at that time, the group, called the Executives’ Meeting of East Asia-Pacific Central Banks and Monetary Authorities (EMEAP),2 set its sights on establishing a second fund that would invest in the domestic currency bond markets: “After the launch of the US dollar Asian Bond Fund (ABF), the EMEAP Group will proceed to study the extension of the ABF concept to include bonds denominated in regional currencies, further strengthening the contribution of the initiative to the broadening and deepening of bond markets in the region”.3
1 The views expressed in this article are those of the author and do not necessarily reflect those
of the BIS. Thanks are due to Brian Coulton, Jeong-Ho Hahm, T K Ogawa and participants in seminars at the Reserve Bank of Australia, Hong Kong Institute for Monetary Research, the Bank of Korea and the Bank of Thailand. All errors remain the author’s.
2 EMEAP comprises the monetary authorities of Australia, China, Hong Kong SAR, Indonesia, Japan, Korea, Malaysia, New Zealand, the Philippines, Singapore and Thailand.
3 See EMEAP (2003).

90 BIS Quarterly Review, December 2003
This special feature identifies a potential synergy between the growth of foreign exchange reserves and the development of regional bond markets. The synergy arises from the use of public obligations to finance (or to sterilise) holdings of foreign exchange reserves. The fact that these obligations have commonly taken the form of central bank debt, however, has meant that much of the opportunity for them to develop the bond market has been missed.
Drawing on Singapore’s experience, one can envision how changes in debt management practices by governments, and corresponding changes in liability structures of central banks, could help realise the potential. In particular, the government can “overfund” its fiscal needs. Subsequent deposits of the proceeds in the central bank would then replace the central bank’s liabilities to market participants. As side benefits, money markets in the region would gain better balance (in a sense defined below) and central banks would obtain sufficient government securities to allow the normal use of repurchase operations. The greatest impediment to the adoption of the proposal would probably be the natural reluctance of finance ministers to issue and parliaments to authorise the needed expansion of recognised government debt. The political commitment in the region to the development of regional bond markets could, however, overcome this.
This special feature focuses on East Asia, especially Indonesia, Korea, Malaysia, Taiwan and Thailand.4 In addition, The People’s Bank of China, faced with the need to sterilise a significant increase in foreign exchange reserves, has also begun to issue substantial amounts of its own bills. Thus, consideration of mobilising government debt for this purpose is timely. India also seems to be reaching the stage at which other central banks have begun to issue their own liabilities in the past.5
The following sections outline the transactions needed to transform central bank debt to market participants into government debt proper, and the benefits to the bond market and to monetary operations of doing so. The next section discusses the issues that arise, including servicing the government deposit at the central bank, the duration of the extra government debt, implications for credit ratings and consistency with the government budgetary process.
Overfunding the fiscal deficit to transform central bank debt
To unify the domestic bond market, the government can “overfund” its own fiscal needs in order to replace debt issued by the central bank to market participants. First, the government sells more debt than it needs to finance any deficit and to roll over maturing issues (overfunding). This produces a cash surplus that the government places on deposit with the central bank, thereby
4 Because Hong Kong SAR does not have a government debt, the argument of this special
feature does not apply there. Similarly, it would not apply to Chile, where the central bank is the only issuer of public debt.
5 At the moment, however, the Reserve Bank of India does not seem to have legislative authority to issue its own debt securities.
Transforming central bank debt into government debt …

BIS Quarterly Review, December 2003 91
Mechanics of overfunding and refunding
Government:
Overfunds its deficits and places the proceeds on deposit with the central bank
Assets Liabilities
+ deposits due from the central bank + government securities
Central bank:
The government deposits transform the balance sheet
Assets Liabilities
Foreign exchange reserves
+ government securities
Monetary base
+ deposits due government
– central bank debt to market
Table 1
draining bank reserves. The central bank is then in a position to pay off its maturing obligations to market participants, thereby re-injecting bank reserves. From the standpoint of the private sector, this would essentially mean a swap of claims on the central bank for claims on the government. The case shown in Table 1 entails an overfunding of sufficient scale to permit the central bank to buy some government securities outright for further use in monetary operations.
Singapore has recently engaged in such an operation. In order to develop its bond market, the Singapore government more than doubled its outstanding government securities, thereby raising the outstanding stock to 39% of GDP at end-2001, despite fiscal surpluses (see Lian (2002, p 184)). In fiscal 2001/02 and 2002/03, deposits placed by the government with the MAS grew by SGD 21.7 billion, mainly reflecting “the proceeds from the larger issuance of Singapore Government Securities through the [Monetary] Authority to the public and the Central Provident Fund Board”.6 This allowed “provisions and other liabilities” to fall by SGD 10.9 billion over the two years, “due largely to
Selected changes to the Monetary Authority of Singapore’s balance sheet, 2001/02–2002/03 In millions of Singapore dollars
Assets Liabilities
Foreign assets1 +23,967
Singapore government securities +118
Provisions and other liabilities –10,866 (“largely … borrowings from banks”)
Deposits of Singapore government +21,699 1 Includes SGD 15,986 from the merger of the Currency Fund on 1 October 2002. Table 2
6 This and the following citations are from MAS (2002, 2003, p 62 and p 84, respectively).
… as seen in Singapore

92 BIS Quarterly Review, December 2003
the reduction in the Authority’s borrowings from banks as part of its money market operations”. At the same time, holdings of Singapore government securities (SGSs) by the MAS rose by SGD 118 million. “The increase was in line with the Authority’s policy to build up its portfolio of SGSs for more active use in repurchase transactions as part of its money market operations.” These transactions implied the changes shown in Table 2.
Benefits to the bond market and monetary operations
Significant benefits could be gained from the overfunding operation described in the previous section. The main benefit arises from the increased liquidity in the secondary market that could be fostered by consolidating all the public debt. In some Asian economies, the increase in the size of the government bond market could be significant, representing growth of anything from 137% to 222%. In aggregate, the five markets considered could be $220 billion larger. In the next section, the general advantage that size provides for liquidity is elaborated. Measures are then offered for how much larger regional bond markets could be were central bank debt to be transformed into government debt.
Size and liquidity in government bond markets7
The relationship between the size and liquidity of government bond markets is complicated by the fact that size has several dimensions. In dealer markets, liquidity is generally supplied by market-makers, who not only provide quotes but also take positions. How far size matters for liquidity thus hinges on the various economies of scale in market-making. The size of individual issues
Size and liquidity
Log of turnover value Bid-ask spreads (in basis points)
US JP DE
IT FR
GB CA
SE
BE CH
1
2
3
4
5
6
1.0 1.5 2.0 2.5 3.0 3.5 4.0
USDEGB
ITBECA
JP
CH FR
SE
0
3
6
9
12
15
1 2 3 4 5 6
Sources: H Inoue, “The structure of government securities markets in G10 countries: summary of questionnaire results”, in Market liquidity: research findings and selected policy implications, Committee on the Global Financial System, Basel, May 1999; Salomon Smith Barney. Graph 1
7 This section draws on McCauley and Remolona (2000).
Larger size leads to more trading and greater liquidity …
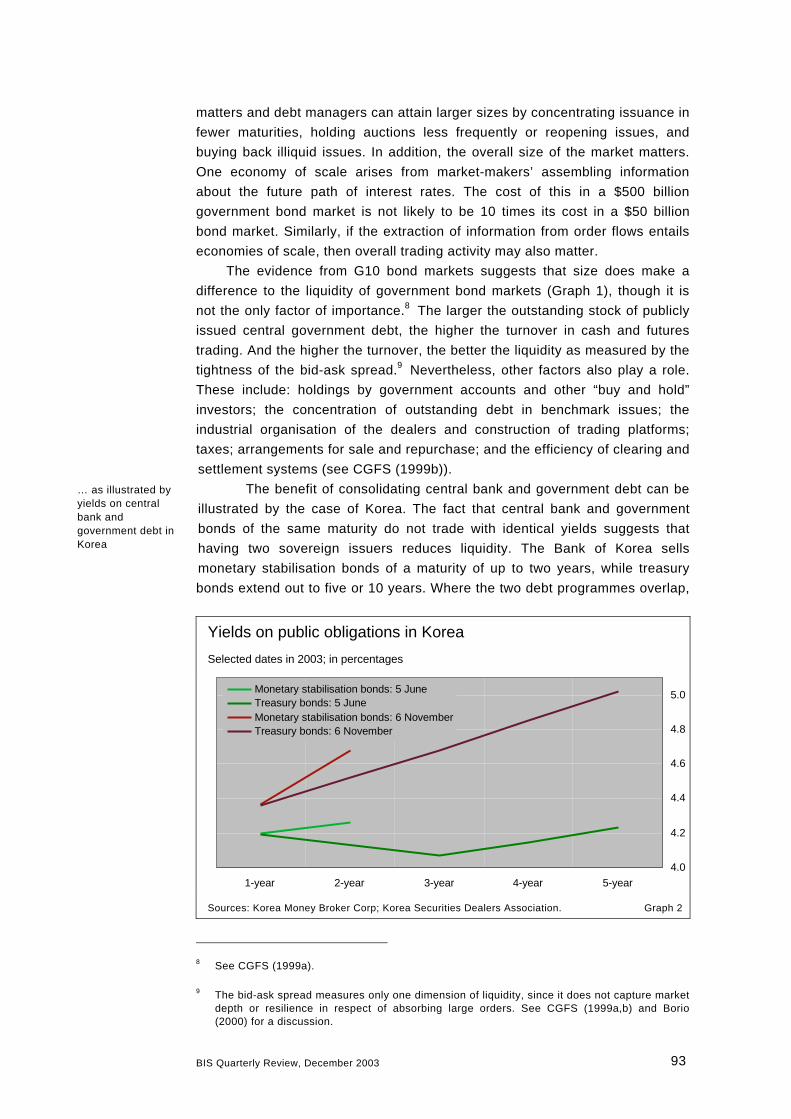
BIS Quarterly Review, December 2003 93
matters and debt managers can attain larger sizes by concentrating issuance in fewer maturities, holding auctions less frequently or reopening issues, and buying back illiquid issues. In addition, the overall size of the market matters. One economy of scale arises from market-makers’ assembling information about the future path of interest rates. The cost of this in a $500 billion government bond market is not likely to be 10 times its cost in a $50 billion bond market. Similarly, if the extraction of information from order flows entails economies of scale, then overall trading activity may also matter.
The evidence from G10 bond markets suggests that size does make a difference to the liquidity of government bond markets (Graph 1), though it is not the only factor of importance.8 The larger the outstanding stock of publicly issued central government debt, the higher the turnover in cash and futures trading. And the higher the turnover, the better the liquidity as measured by the tightness of the bid-ask spread.9 Nevertheless, other factors also play a role. These include: holdings by government accounts and other “buy and hold” investors; the concentration of outstanding debt in benchmark issues; the industrial organisation of the dealers and construction of trading platforms; taxes; arrangements for sale and repurchase; and the efficiency of clearing and settlement systems (see CGFS (1999b)).
The benefit of consolidating central bank and government debt can be illustrated by the case of Korea. The fact that central bank and government bonds of the same maturity do not trade with identical yields suggests that having two sovereign issuers reduces liquidity. The Bank of Korea sells monetary stabilisation bonds of a maturity of up to two years, while treasury bonds extend out to five or 10 years. Where the two debt programmes overlap,
Yields on public obligations in Korea Selected dates in 2003; in percentages
4.0
4.2
4.4
4.6
4.8
5.0
1-year 2-year 3-year 4-year 5-year
Monetary stabilisation bonds: 5 JuneTreasury bonds: 5 JuneMonetary stabilisation bonds: 6 NovemberTreasury bonds: 6 November
Sources: Korea Money Broker Corp; Korea Securities Dealers Association. Graph 2
8 See CGFS (1999a).
9 The bid-ask spread measures only one dimension of liquidity, since it does not capture market depth or resilience in respect of absorbing large orders. See CGFS (1999a,b) and Borio (2000) for a discussion.
… as illustrated by yields on central bank and government debt in Korea

94 BIS Quarterly Review, December 2003
Potential increase in size of government bond markets Government bond market size Central bank debt to market
Domestic currency $ billion Domestic
currency $ billion
Memo: Size of combined market as a % of current
Indonesia1 398.2 trillion 47.1 147.3 trillion 17.3 137 Korea2 81.5 trillion 69.0 98.9 trillion 84.0 222 Malaysia3 109.6 billion 28.8 77.9 billion 20.5 171 Taiwan, China1 2.5 trillion 73.5 2.8 trillion 82.4 212 Thailand2 1,269.5 billion 30.5 648.0 billion 15.6 151
Total . 248.9 . 219.8 188
Note: Central bank debt: for Indonesia, Bank Indonesia certificates, August 2003; for Korea, monetary stabilisation bonds (MSBs), August 2003; for Malaysia, Central Bank of Malaysia bills/bonds and net deposits of banks, finance companies and merchant banks with Central Bank of Malaysia other than statutory reserves, September 2003; for Taiwan, China, negotiable certificates of deposit (NCDs), September 2003; for Thailand, net borrowing under repo from banks and other financial institutions, Bank of Thailand net forward sales of baht, and Bank of Thailand bonds, August 2003.
1 End-September 2003. 2 End-July 2003. 3 End-December 2002.
Sources: CEIC; national data. Table 3
for instance at the one-year maturity, the yields are often not identical (Graph 2). The fact that they are not identical despite the practical identity of the issuers’ credit standing points to their trading as separate instruments. If they were lumped together into a single instrument, it might trade at a yield lower than either one: liquidity divided is liquidity lost. Another observation that suggests the loss of liquidity from two sovereign issuers is the small, often negative, difference between the yield on the very liquid three-year bond (served by a successful futures contract) and the two-year monetary stabilisation bond. Confronted by such a strong demand for a benchmark issue, a single debt manager might well issue more three-year bonds and fewer two-year bonds.
The case of Korea suggests that transforming central bank debt into debt of longer maturity might be particularly advantageous in that it would allow greater issuance at longer benchmark maturities. But it also suggests that market functioning would be improved even if government debt simply replaced central bank debt at the shorter maturities characteristic of the latter.
Prospective increase in the size of government bond markets in East Asia
How much of a difference would the transformation of central bank debt into government debt make to the government bond markets in East Asia? The answer varies across the region. The potential stock of government debt would be a third as high again as its current level in Indonesia, half as high again as its current level in Malaysia and Thailand (Graph 3), and more than twice its current level in Korea and Taiwan (Table 3 and Graph 4). This could make a substantial difference to liquidity. For instance, Malaysia’s bond market is dominated by such buy and hold investors as the provident fund (see Harun (2002)). Were the level of government debt to rise by 50%, a significant amount of this debt might be available for trading by more active accounts.
Debt consolidation would substantially increase the size of government bond markets …

BIS Quarterly Review, December 2003 95
Monetary policy operations and the repo market
Three related advantages pertaining to monetary operations would arise from the transformation of central bank liabilities into explicit government debt. Such a step would help rebalance monetary operations, would allow the central bank to engage in reversed transactions against government bonds and would thereby help to develop the bond market further.
First, the central bank could have a firmer influence over short-term rates if the structural balance in the money market could be shifted from structural surplus to deficit. At present, redemptions of maturing central bank debt and interest payments on such debt represent predetermined injections of bank reserves that must be offset by active draining operations. Sufficient overfunding, and the stability of the government’s deposit with the central bank, could make the money market structurally short of funds and therefore dependent on regular injections of reserves by the central bank. While it is not technically necessary for effective policy implementation, most central bankers instinctively prefer a situation where market participants need to come to the central bank for funding.
Second, sufficient overfunding would give the central bank a substantial holding of government paper. This would permit it to carry out reversed transactions (repos and reverse repos) against government securities, either to drain or to inject bank reserves. Moreover, to the extent that the central bank can encourage the development of a repo market, not only for its own operations but also among market participants themselves, it would lead the banking system away from outright and towards collateralised interbank transactions. This can enhance counterparty risk management.
Third, development of a deep and liquid repo market that benefits from central bank operations is conducive to the increased depth and liquidity of the
Outstanding public debt in three Southeast Asian economies In billions of domestic currency1
Indonesia Malaysia Thailand
0
150
300
450
600
750
Oct 99 Oct 00 Oct 01 Oct 02
Bank Indonesia certificatesGovernment bonds
0
40
80
120
160
200
92 94 96 98 00 02
Deposits in central bankless statutory reservesCentral bank bills/bondsGovernment securities
0
250
500
750
1,000
1,250
1,500
1,750
99 00 01 02 03
Bank of Thailand bonds BOT net forex forward² BOT net repo Government bonds
1 For Indonesia, in trillions. 2 Truncated at zero between February 2001 and December 2002.
Sources: CEIC; national data. Graph 3
… and permit central banks to acquire government debt for operations

96 BIS Quarterly Review, December 2003
Outstanding public debt in two Northeast Asian economies In billions of domestic currency1
Korea Taiwan, China
0
50
100
150
Jul 97 Jul 99 Jul 01 Jul 03
BOK monetary stabilisation bonds Treasury forex stabilisation bonds Treasury bonds
0
1,000
2,000
3,000
4,000
5,000
Sep 94 Sep 97 Sep 00 Sep 03
CBC negotiable CDsTreasury billsTreasury bonds
1 For Korea, in trillions.
Sources: Central Bank of China (CBC); CEIC; national data. Graph 4
government bond market more generally. Short positions become easier to fund and smaller securities firms find it easier to finance themselves. This would contribute to a broadening of the dealer market and more active trading.
Issues to be resolved
A number of practical issues need to be resolved before central bank debt can be transformed into government debt. First, there is the question of what yield the central bank should pay on the government deposits. Available models include profit-sharing and fixed returns.10 A second issue is the choice of duration of the government securities used to finance foreign exchange reserves. This choice should be considered along with the choice of duration of the international reserve holdings. A third issue is whether rating agencies might see the larger gross stock of government debt as a negative for the sovereign rating. This would happen if the rating agencies looked strictly at the reported gross debt of the government. In contrast, they should be encouraged to put more emphasis on a net concept, recognising that the government’s deposits with the central bank (and ultimately the foreign exchange reserves) are assets to be accounted for. A final issue is reconciling the uncertain extent of sterilisation in a year with the prior authorisation of government debt in the budget cycle (an issue in Japan today, where foreign exchange reserves are financed at the margin by government debt issues). Central bank debt might be issued in the first instance, and subsequently transformed in the next budget year.
10 The HKMA (2003) remunerates different government deposits on both bases. The Bank of
Thailand would require legislation to enable it to remunerate government deposits. For practice across industrial countries, see Borio (1997, pp 60–62).
Servicing the government deposit … … choice of duration … … reaction of rating agencies … … and integration with the budget cycle

BIS Quarterly Review, December 2003 97
As difficult as these issues might be to resolve, probably the greatest impediment to the consolidation of central bank and government debt is the natural reluctance of finance ministers to increase outstanding debt for which they are explicitly responsible. This may be grounded in the fear of seeming to make a virtue out of more government debt, thus opening the door to further spending or tax cutting. The legislature, for its part, may distrust the argument that the increase in public debt will have as its counterpart a deposit at the central bank. This may seem an unstable bargain, with the government then being able to draw down the deposit at will to meet some unanticipated need without having to go to the legislature to authorise an increase in debt (see Smith (1937)). As the reference to rating agencies above suggests, however, market discipline substitutes in some measure for the legal discipline of setting debt ceilings.
Conclusions
If these issues can be resolved, then the central bank debt that has financed large holdings of foreign exchange reserves could be consolidated with government debt. In particular, issuing government debt beyond the need of the public sector borrowing requirement could finance a government deposit with the central bank. This would allow a run-off of central bank liabilities.
The benefits from lumping central bank liabilities into government debt are likely to be substantial. Government bond markets could grow to anywhere from 137% to 222% of their current size. Properly handled, such an increase would make these bond markets more liquid and thereby more attractive to investors.
References
Aizenmann, J and N Marion (2002): “The high demand for international reserves in the Far East: what’s going on?”, NBER Working Papers, no 9266, October.
Borio, C (1997): The implementation of monetary policy in industrial countries: a survey, BIS Economic Papers, no 47 (July).
——— (2000): “Market liquidity and stress: selected issues and policy implications”, BIS Quarterly Review, November, pp 38–48.
Committee on the Global Financial System (1999a): “Market liquidity: research findings and selected policy implications”, CGFS Working Group Reports, no 11, May.
——— (1999b): “How should we design deep and liquid markets? The case of government securities”, CGFS publications, no 13, October.
Executives’ Meeting of East Asia-Pacific Central Banks and Monetary Authorities (2003): “EMEAP central banks to launch Asian Bond Fund”, 2 June, www.emeap.org.

98 BIS Quarterly Review, December 2003
Harun, S (2002): “The development of debt markets in Malaysia”, in BIS Papers, no 11, June, pp 147–50.
Hong Kong Monetary Authority (2003): Annual Report 2002.
Lian, T S (2002): “Debt market development in Singapore”, in BIS Papers, no 11, June, pp 183–89.
McCauley, R N and E Remolona (2000): “Size and liquidity in government bond markets”, BIS Quarterly Review, November, pp 52–8.
Monetary Authority of Singapore (2002): Annual Report 2001/2002, August.
——— (2003): Annual Report 2002/2003, August.
Smith, A (1937): The wealth of nations, New York, Modern Library, book 5, chapter 3, “Of public debts”.

BIS Quarterly Review, December 2003 99
Serge Jeanneau+41 61 280 8416
Recent initiatives by Basel-based committees and the Financial Stability Forum
Basel Committee on Banking Supervision
In July, the Basel Committee on Banking Supervision (BCBS) issued final versions of Risk management principles for electronic banking and Management and supervision of cross-border electronic banking activities.1 The purpose of these papers is to provide supervisory guidance on safety and soundness in electronic banking activities. The first paper identifies 14 risk management principles for electronic banking to help banking institutions expand their existing risk oversight policies and processes to cover their electronic banking activities. The second paper identifies additional risk management principles specific to cross-border electronic banking activities.
Also in July, the BCBS welcomed the Financial Action Task Force’s (FATF) revised documentation on combating money laundering. The Committee noted that its publication Customer due diligence for banks, released in October 2001, had been reflected in the FATF’s recommendations concerning customer due diligence. Whereas its own paper specifically addresses risk management by banks, the BCBS recognises that the FATF’s recommendations apply to anti-money laundering procedures for all financial and non-financial institutions.
In August, the BCBS published a report entitled High-level principles for the cross-border implementation of the New Accord. As the Committee moves towards the completion of Basel II, this interim publication highlights the work of the Accord Implementation Group (AIG) in developing a set of principles to facilitate closer, practical cooperation and information exchange among supervisors.2 The report points out that the existing cross-border responsibilities of home and host country supervisors, as established in the Basel Concordat and the original Accord, will continue to apply when the New
1 The papers were initially released for consultation in May 2001 and October 2002
respectively. They are available at www.bis.org.
2 The AIG was set up by the BCBS to serve as a means for supervisors to share information on and approaches to the implementation of the New Accord.
The BCBS issues two papers on electronic banking …
… welcomes FATF documentation on money laundering …
… publishes a report on implementing the New Accord …

100 BIS Quarterly Review, December 2003
Accord is finalised. The New Accord calls for enhanced levels of cooperation between supervisors.
In the same month, the BCBS issued a consultative paper providing banks with practical guidance on managing their “know-your-customer” (KYC) risks on a consolidated basis. The publication, entitled Consolidated KYC risk management, is a supplement to the Committee’s Customer due diligence for banks. It examines the critical elements for effective management of KYC policies and procedures in banks’ foreign branches and subsidiaries, namely customer acceptance policies, customer identification, ongoing monitoring of higher-risk accounts and risk management.
In September, the BCBS published a revised version of Principles for the management and supervision of interest rate risk. The paper was originally released as a supporting document to the second consultative paper on the New Accord in January 2001. The new version was issued for comment.
Next steps for the New Basel Capital Accord
On 10–11 October 2003, the members of the BCBS met to discuss responses to public comments received on the New Basel Capital Accord.
The BCBS received over 200 comments on its third consultative paper (“CP 3”). The responses indicated that there was continued broad support for the structure of the New Accord and agreement on the need to adopt a more risk-sensitive capital framework.
All members of the Committee agreed on the importance of finalising the New Accord expeditiously and in a manner that was technically and prudentially sound. The New Accord should offer considerable benefits over the existing system. Moreover, it was important in the near term to provide banks with as much certainty as possible while they planned and prepared for the adoption of the new rules. BCBS members committed to work promptly to resolve the outstanding issues by no later than mid-2004.
The Committee also acknowledged the importance of national rule-making processes under way in several jurisdictions and that it would need to consider the outcome of these processes within this time frame.
The BCBS welcomed the efforts of banks in preparing for implementation and encouraged them to continue. The ongoing further discussions by the Committee as outlined in this box were not expected to alter the need for banks to continue improving databases and risk management systems in preparation for the New Accord.
Areas of focus
The principal areas in which the BCBS identified opportunities to improve the framework were: changing the overall treatment of expected versus unexpected credit losses; simplifying the treatment of asset securitisation, including eliminating the “supervisory formula” and replacing it with a less complex approach; revisiting the treatment of credit card commitments and related issues; and reviewing the treatment of certain credit risk mitigation techniques. The BCBS and its working groups have developed a plan for addressing these issues.
Treatment of expected and unexpected losses
With respect to the internal ratings-based (IRB) treatment of credit losses, the existing proposals call for banks to hold enough capital to absorb expected and unexpected credit losses. BCBS members recognised that this approach represented a practical compromise to address differences ____________________________ The comments are available at www.bis.org.
… and issues a paper on customer due diligence

BIS Quarterly Review, December 2003 101
in national accounting practices and supervisory rules regarding provisioning. However, in the light of the public comments received on CP 3 and subsequent research undertaken by its working groups, the Committee decided to revisit the issue and to adopt an approach based on unexpected losses subject to an adjustment to the definition of eligible capital for IRB banks.
The broad direction of the approach that the BCBS asked its working groups to develop further was described in an attachment to the press release published on the BIS website on 11 October. The BCBS invited interested parties to comment on this proposal by end-2003. Although the Committee did not believe that the proposal would substantially change the mechanics of the New Accord, it considered it sufficiently important to merit additional public consideration.
At its meeting in January 2004, the BCBS will evaluate the outcome of the consultation on the expected/unexpected loss issue, assess further related work on the calibration of the IRB approach and review the progress made in resolving the other technical issues mentioned above. It will also assess the work on the calibration of the IRB approach in the light of the Committee’s objectives on overall capital. At that time, the Committee will provide a further update on the status of its discussions. The BCBS does not foresee the need for changes to the standardised approach.
Calibration of the New Accord
The BCBS also discussed the importance of ensuring that the calibration of the New Accord achieves the Committee’s objectives. Accordingly, the Committee agreed that prior to implementation a further review of calibration would be conducted on the basis of additional information. If necessary, the Committee will propose additional adjustments to calibration based on this review. These adjustments are not expected to alter the fundamental structure of the New Accord.
Financial Stability Forum
In September, the Financial Stability Forum (FSF) met to discuss three broad topics: vulnerabilities in the international financial system; market foundations and corporate governance; and offshore financial centres.
Concerning the first topic, the Forum noted the general improvement in financial conditions and the increasing, if uneven, signs of a global recovery. Members felt that downside risks seemed more muted than when the FSF last met in March 2003. Nevertheless, they also noted that domestic and international imbalances persisted and could pose risks.
The FSF also discussed efforts under way to identify and close information gaps in the area of credit risk transfer (CRT). In particular, members encouraged the Joint Forum to pursue its plan to take stock of institutional participation in the CRT market and to assess the need for related supervisory information, with a focus on addressing financial stability concerns.3 Members also welcomed the ongoing work in this area by the Committee on the Global Financial System, which requested that the G10 central banks begin collecting separate data on credit default swaps in the context of the semiannual survey of over-the-counter (OTC) derivatives markets by the end of 2004. In addition, the FSF urged insurance supervisors and insurance firms to continue moving forward together to resolve a number
3 The Joint Forum was established in 1996 under the aegis of the BCBS, the International
Organization of Securities Commissions and the International Association of Insurance Supervisors.
The FSF discusses vulnerabilities in financial systems …
… encourages work on credit risk transfer and reinsurance …

102 BIS Quarterly Review, December 2003
of complex issues concerning the reinsurance industry and to ensure that plans for new information on this market segment, including data on global reinsurance markets, were relevant to strengthening market discipline.
With regard to market foundations and corporate governance, the Forum reviewed progress and international coherence in a number of areas, including auditor oversight and audit practice standards, accounting standards, the relationship between credit agencies and financial analysts, and the OECD’s work on corporate governance.
Lastly, the FSF reviewed the Offshore Financial Centres (OFCs) initiative it launched in May 2000, based on a report prepared by IMF staff on their OFC assessment programme. The Forum welcomed the improvements that had taken place in supervisory and regulatory arrangements in many OFCs, as well as in cooperation on such matters. It supported making the monitoring of OFCs an integral part of the IMF’s financial sector surveillance work. The FSF attached particular importance to the publication of the IMF assessments as a means of enhancing transparency and enabling the position of individual OFCs to be evaluated by all parties concerned.
Other initiatives
In July, the G10 central banks announced that they would carry out their triennial survey of global activity in foreign exchange and derivatives markets in April and June 2004. The reporting exercise will comprise the collection of market data on the dollar value of turnover in spot foreign exchange transactions and OTC foreign exchange and interest rate derivatives transactions. In addition, it will cover notional amounts outstanding and gross market values of foreign exchange, interest rate, equity, commodity, credit and other OTC derivative instruments. The format of the survey will be broadly similar to the one conducted in April and June 2001, incorporating only a limited number of refinements and clarifications. The objective of the reporting exercise is to obtain reasonably comprehensive and internationally consistent information on the size and structure of foreign exchange and OTC derivatives markets, with a view to helping authorities and market participants better monitor global patterns of activity and improve market transparency.
In August, the Joint Forum released two reports dealing with a number of issues common to the banking, securities and insurance sectors. The first report, Trends in risk integration and aggregation, is based on a survey of 31 financial institutions. It highlights the emphasis being placed on the management of risks on a firm-wide basis and related efforts to develop quantitative measures of aggregate risk, for example via economic capital models. The second report, Operational risk transfer across sectors, is based on interviews carried out with 23 financial institutions. It focuses on risk management and supervisory issues arising when operational risk is transferred from protection buyers to protection sellers.
In September, the G10 finance ministers and central bank governors discussed the general climate and key challenges facing the G10 economies. They also welcomed the increasingly widespread use of collective action
… and reviews initiatives on offshore centres
The G10 central banks announce the 2004 triennial survey
The Joint Forum releases reports on risk integration and operational risk
The G10 finance ministers welcome the use of CACs

BIS Quarterly Review, December 2003 103
clauses in international sovereign bond issues and noted that they looked forward to the inclusion of such clauses as a standard feature of bond issues in all major legal jurisdictions as an important element of the debt resolution framework.


