Instrument First, Spacecraft Second: Implementing a New Paradigm Bob Bitten & Eric Mahr The Aerospace Corporation Claude Freaner NASA Headquarters, Science Mission Directorate 2012 NASA Program Management Challenge Orlando, Florida 22-23 February 2012 2012 The Aerospace Corporation
Transcript
Instrument First, Spacecraft Second:Implementing a New Paradigm
Bob Bitten & Eric Mahr The Aerospace CorporationClaude FreanerNASA Headquarters, Science Mission Directorate
2012 NASA Program Management ChallengeOrlando, Florida22-23 February 2012
• Instrument development difficulties have been shown to be a significant contributor to overall mission cost and schedule growth
• An approach that starts instrument development prior to mission development, entitled “Instrument First, Spacecraft Second” (IFSS), could potentially lead to a reduction in cost growth
• An assessment of the IFSS approach was conducted looking at historical instrument development times to assess schedule variability at the mission level and its effect on a portfolio of missions
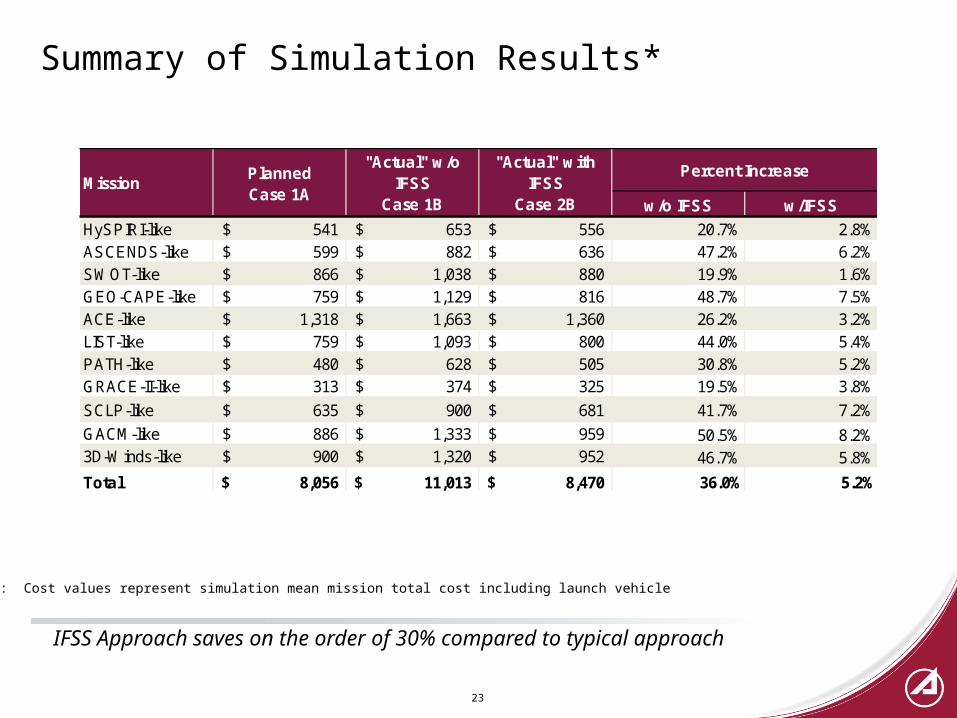
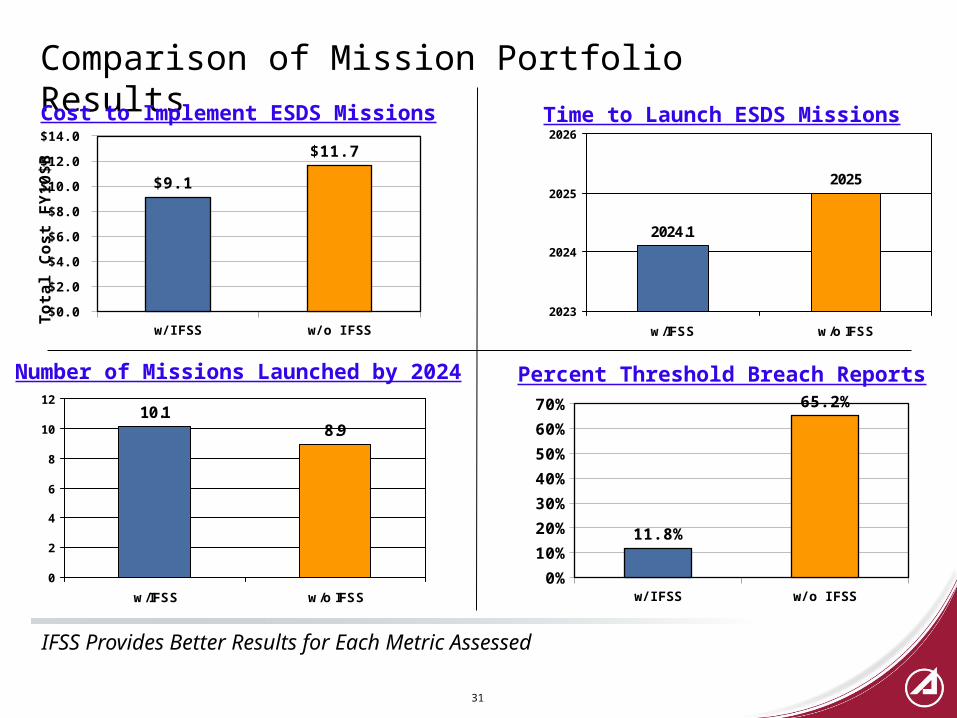
• Applying IFSS approach to the Tier 2 and Tier 3 Earth Science Decadal Survey (ESDS) missions has the potential to save NASA several billion dollars while providing additional benefits including:
– Launching full set of ESDS missions sooner– Increasing number of missions launched by a given date– Decreasing number of Threshold Breach instances
Executive Summary – Implementation Considerations
• IFSS approach can be implemented within current NPD 7120.5 guidance– IFSS implementation approach would accommodate the spacecraft design/decision
required by Mission PDR after Instrument CDR (iCDR)
• Typical IFSS “Offset” for instrument development is two years– Mission schedule should be based on acquisition approach and instrument
development type(s) and characteristics– Provides instruments with a two year head start prior to a three to four year mission
development phase
• Three implementation approaches identified, each with relative pros and cons– Assumes that mission systems engineers and spacecraft vendors are involved at
low level of effort to ensure mission requirements and spacecraft accommodations are considered
• Instrument Office approach may provide best balance with regard to mission dependency, cost, schedule and funding profile
4
5
Agenda
• Executive Summary
• Background
• Assessment Overview and Results– Mission Savings– Portfolio Savings
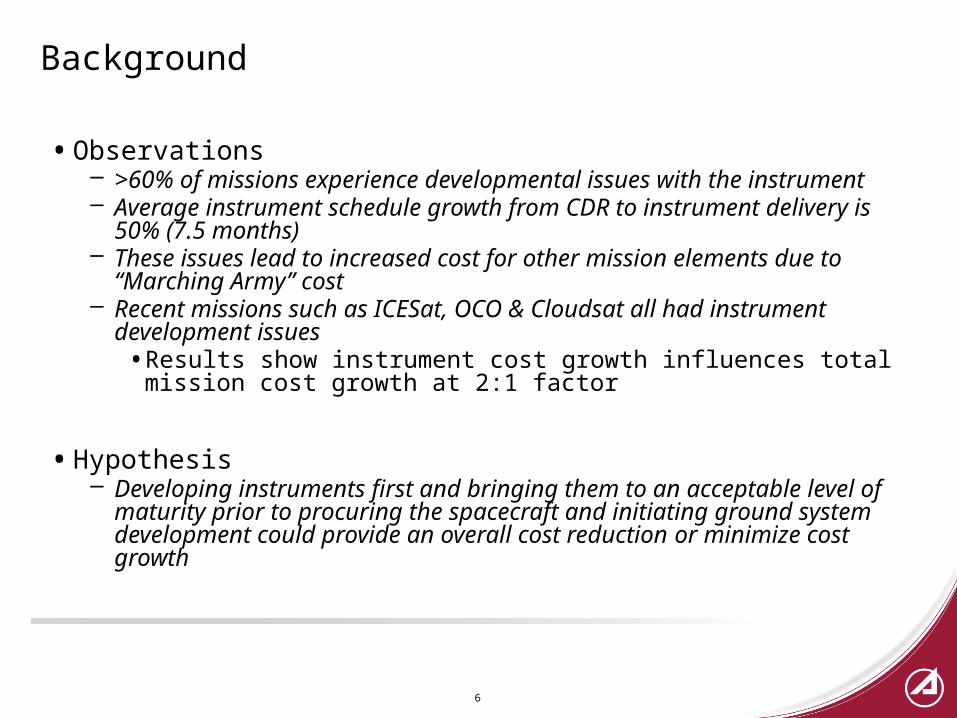
• Observations– >60% of missions experience developmental issues with the instrument– Average instrument schedule growth from CDR to instrument delivery is
50% (7.5 months)– These issues lead to increased cost for other mission elements due to
“Marching Army” cost– Recent missions such as ICESat, OCO & Cloudsat all had instrument
development issues• Results show instrument cost growth influences total mission cost
growth at 2:1 factor
• Hypothesis– Developing instruments first and bringing them to an acceptable level of
maturity prior to procuring the spacecraft and initiating ground system development could provide an overall cost reduction or minimize cost growth
7
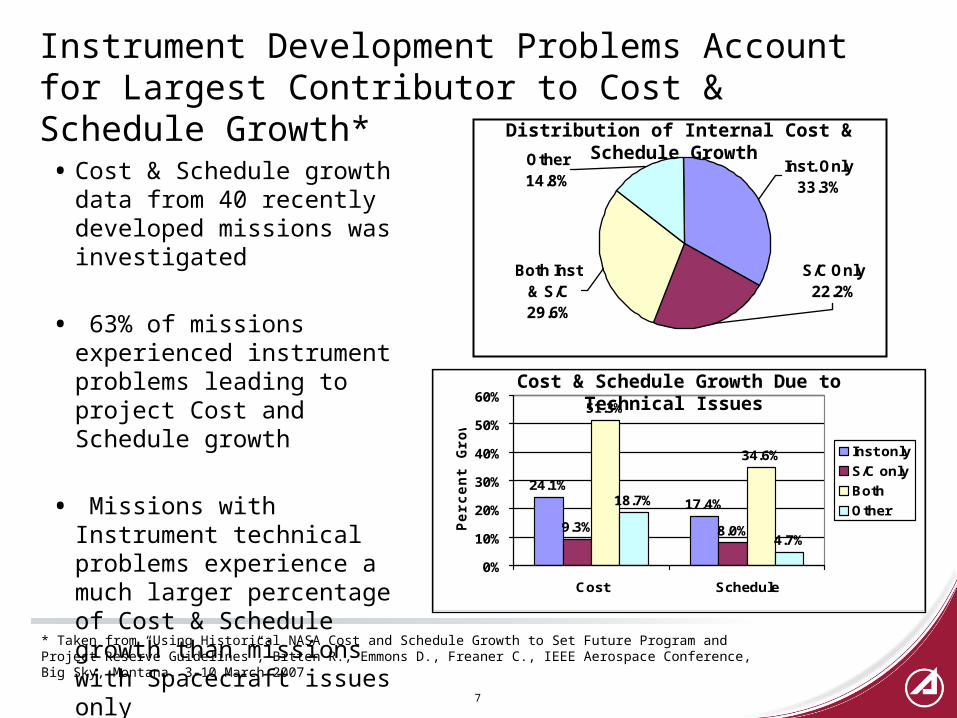
Instrument Development Problems Account for Largest Contributor to Cost & Schedule Growth*
• Cost & Schedule growth data from 40 recently developed missions was investigated
• 63% of missions experienced instrument problems leading to project Cost and Schedule growth
• Missions with Instrument technical problems experience a much larger percentage of Cost & Schedule growth than missions with Spacecraft issues only
Distribution of Internal Cost & Schedule Growth
* Taken from “Using Historical NASA Cost and Schedule Growth to Set Future Program and Project Reserve Guidelines”, Bitten R., Emmons D., Freaner C., IEEE Aerospace Conference, Big Sky, Montana, 3-10 March 2007
24.1%
17.4%
9.3% 8.0%
18.7%
4.7%
34.6%
51.3%
0%
10%
20%
30%
40%
50%
60%
Cost Schedule
Pe
rce
nt
Gro
wth
Inst only
S/C only
Both
Other
Cost & Schedule Growth Due to Technical Issues
Both Inst & S/C29.6%
Other14.8%
Inst. Only33.3%
S/C Only22.2%
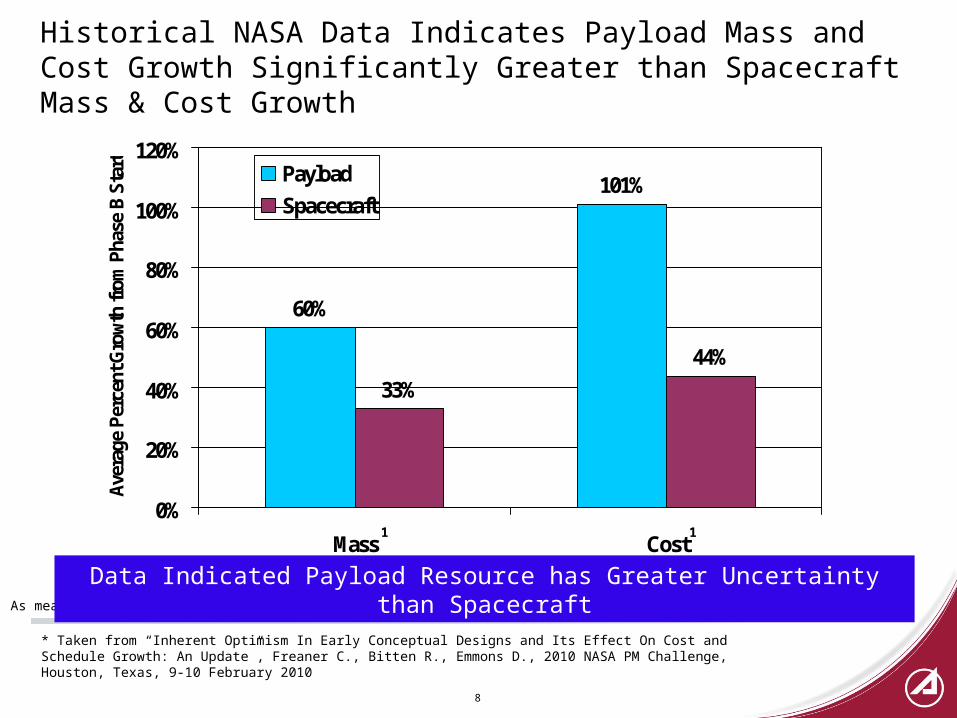
Historical NASA Data Indicates Payload Mass and Cost Growth Significantly Greater than Spacecraft Mass & Cost Growth
60%
101%
33%
44%
0%
20%
40%
60%
80%
100%
120%
Mass Cost
Ave
rage
Per
cent
Gro
wth
from
Pha
se B
Sta
rt
Payload
Spacecraft
8
1 1
Note: 1) As measured from Current Best Estimate, not including reserves
Data Indicated Payload Resource has Greater Uncertainty than Spacecraft
* Taken from “Inherent Optimism In Early Conceptual Designs and Its Effect On Cost and Schedule Growth: An Update”, Freaner C., Bitten R., Emmons D., 2010 NASA PM Challenge, Houston, Texas, 9-10 February 2010
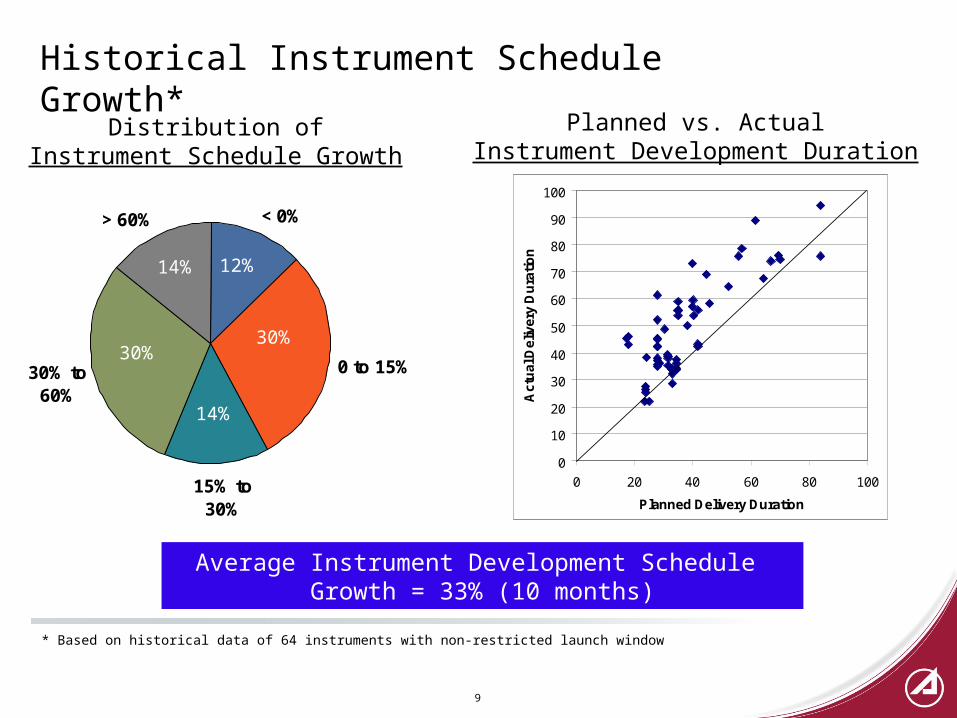
Historical Instrument Schedule Growth*
< 0%
0 to 15%
15% to 30%
30% to 60%
> 60%
9
12%
30%
14%
30%
14%
Distribution ofInstrument Schedule Growth
Average Instrument Development Schedule Growth = 33% (10 months)
* Based on historical data of 64 instruments with non-restricted launch window
0
10
20
30
40
50
60
70
80
90
100
0 20 40 60 80 100
Planned Delivery Duration
Ac
tua
l De
live
ry D
ura
tio
n
Planned vs. ActualInstrument Development Duration
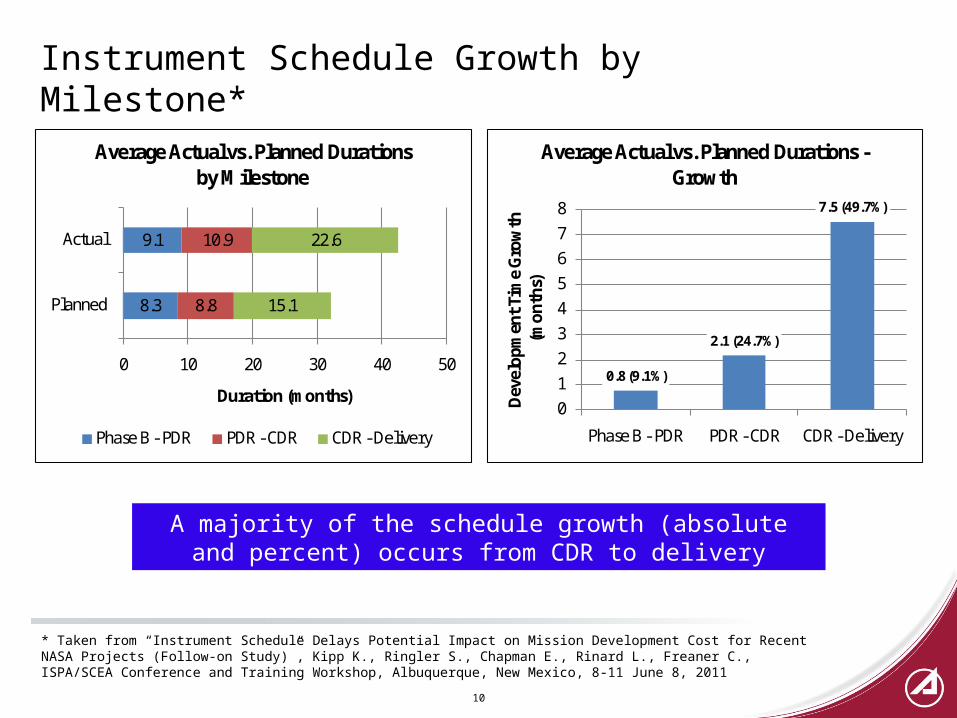
Instrument Schedule Growth by Milestone*
10
8.3
9.1
8.8
10.9
15.1
22.6
0 10 20 30 40 50
Planned
Actual
Duration (months)
Average Actual vs. Planned Durations by Milestone
Phase B - PDR PDR - CDR CDR - Delivery
0.8 (9.1%)
2.1 (24.7%)
7.5 (49.7%)
012345678
Phase B - PDR PDR - CDR CDR - Delivery
Dev
elop
men
t Tim
e G
row
th
(mon
ths)
Average Actual vs. Planned Durations -Growth
A majority of the schedule growth (absolute and percent) occurs from CDR to delivery
* Taken from “Instrument Schedule Delays Potential Impact on Mission Development Cost for Recent NASA Projects (Follow-on Study)”, Kipp K., Ringler S., Chapman E., Rinard L., Freaner C., ISPA/SCEA Conference and Training Workshop, Albuquerque, New Mexico, 8-11 June 8, 2011
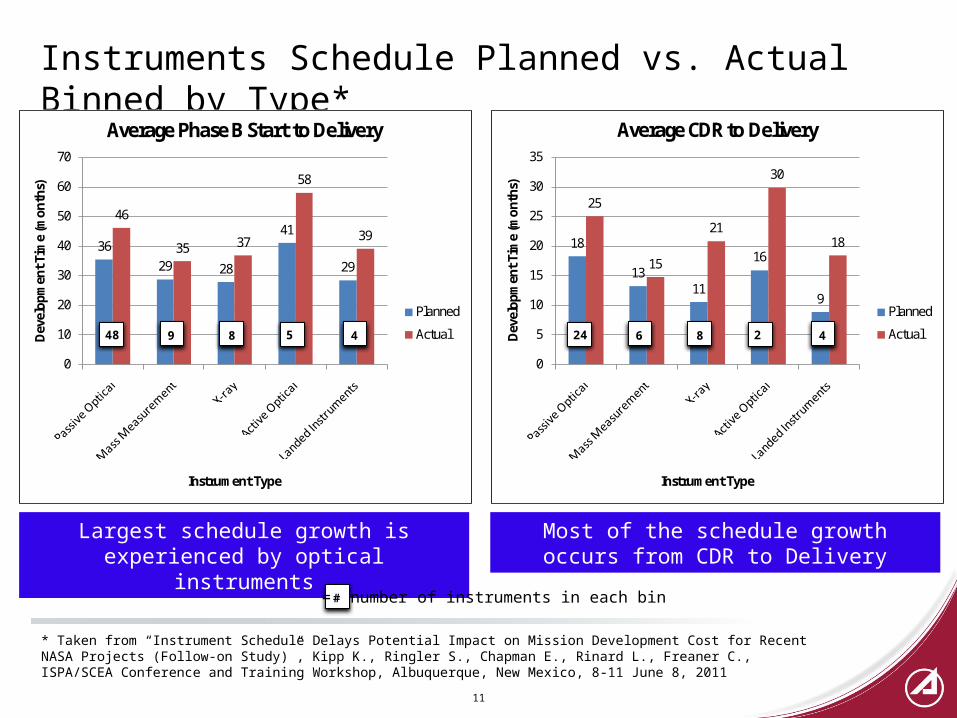
Instruments Schedule Planned vs. Actual Binned by Type*
11
3629 28
41
29
46
35 37
58
39
0
10
20
30
40
50
60
70
Dev
elop
men
t Tim
e (m
onth
s)
Instrument Type
Average Phase B Start to Delivery
Planned
Actual
18
1311
16
9
25
15
21
30
18
0
5
10
15
20
25
30
35
Dev
elop
men
t Tim
e (m
onth
s)
Instrument Type
Average CDR to Delivery
Planned
Actual48 9 8 5 4 24 6 8 2 4
Largest schedule growth is experienced by optical instruments
Most of the schedule growth occurs from CDR to Delivery
# = number of instruments in each bin
* Taken from “Instrument Schedule Delays Potential Impact on Mission Development Cost for Recent NASA Projects (Follow-on Study)”, Kipp K., Ringler S., Chapman E., Rinard L., Freaner C., ISPA/SCEA Conference and Training Workshop, Albuquerque, New Mexico, 8-11 June 8, 2011
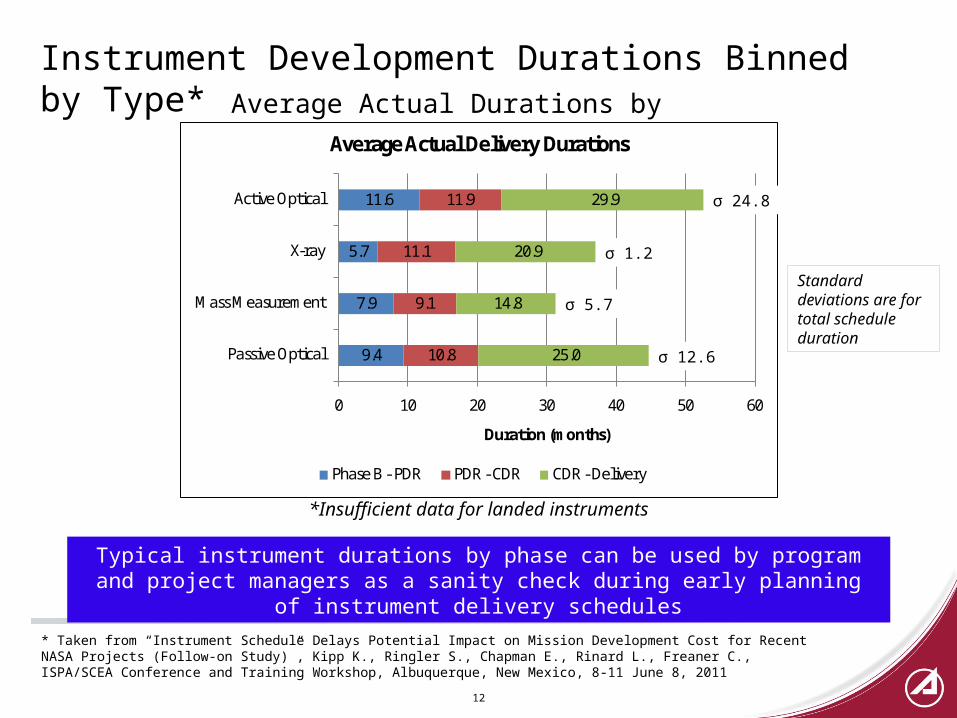
Instrument Development Durations Binned by Type*
12
Average Actual Durations by Milestone
9.4
7.9
5.7
11.6
10.8
9.1
11.1
11.9
25.0
14.8
20.9
29.9
0 10 20 30 40 50 60
Passive Optical
Mass Measurement
X-ray
Active Optical
Duration (months)
Average Actual Delivery Durations
Phase B - PDR PDR - CDR CDR - Delivery
*Insufficient data for landed instruments
Standard deviations are for total schedule duration
Typical instrument durations by phase can be used by program and project managers as a sanity check during early planning of instrument delivery schedules
σ 24.8
σ 1.2
σ 5.7
σ 12.6
* Taken from “Instrument Schedule Delays Potential Impact on Mission Development Cost for Recent NASA Projects (Follow-on Study)”, Kipp K., Ringler S., Chapman E., Rinard L., Freaner C., ISPA/SCEA Conference and Training Workshop, Albuquerque, New Mexico, 8-11 June 8, 2011
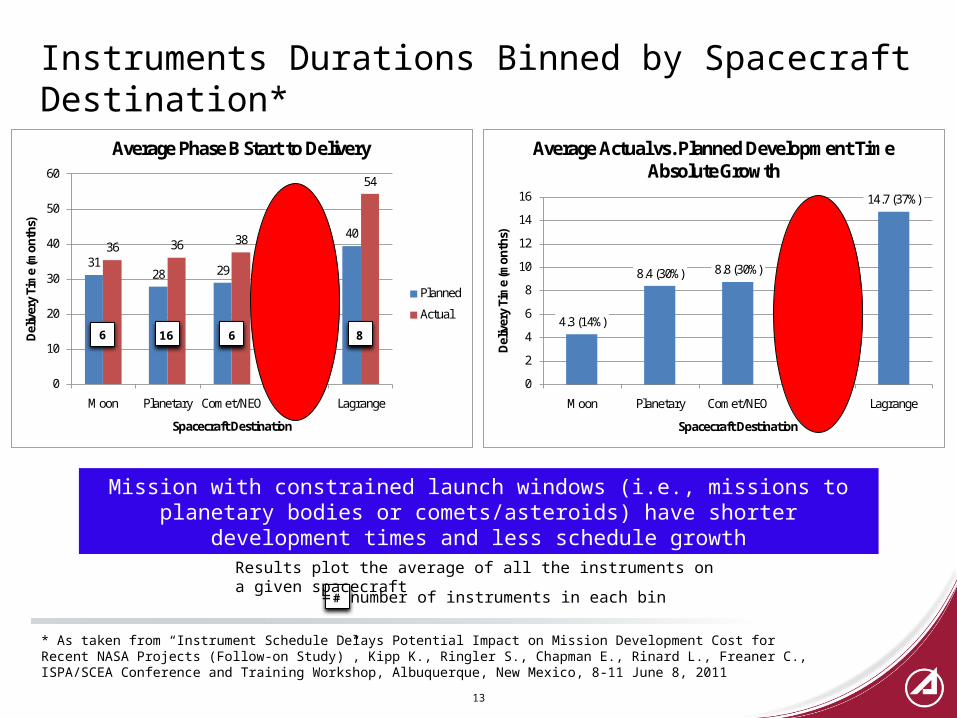
Instruments Durations Binned by Spacecraft Destination*
13
3128 29
3640
36 36 38
47
54
0
10
20
30
40
50
60
Moon Planetary Comet/NEO Earth Lagrange
Del
iver
y Ti
me
(mon
ths)
Spacecraft Destination
Average Phase B Start to Delivery
Planned
Actual4.3 (14%)
8.4 (30%) 8.8 (30%)
11.0 (30%)
14.7 (37%)
0
2
4
6
8
10
12
14
16
Moon Planetary Comet/NEO Earth Lagrange
Del
iver
y Ti
me
(mon
ths)
Spacecraft Destination
Average Actual vs. Planned Development Time Absolute Growth
6 16 6 50 8
Mission with constrained launch windows (i.e., missions to planetary bodies or comets/asteroids) have shorter development times and less schedule growth
# = number of instruments in each bin
* As taken from “Instrument Schedule Delays Potential Impact on Mission Development Cost for Recent NASA Projects (Follow-on Study)”, Kipp K., Ringler S., Chapman E., Rinard L., Freaner C., ISPA/SCEA Conference and Training Workshop, Albuquerque, New Mexico, 8-11 June 8, 2011
Results plot the average of all the instruments on a given spacecraft
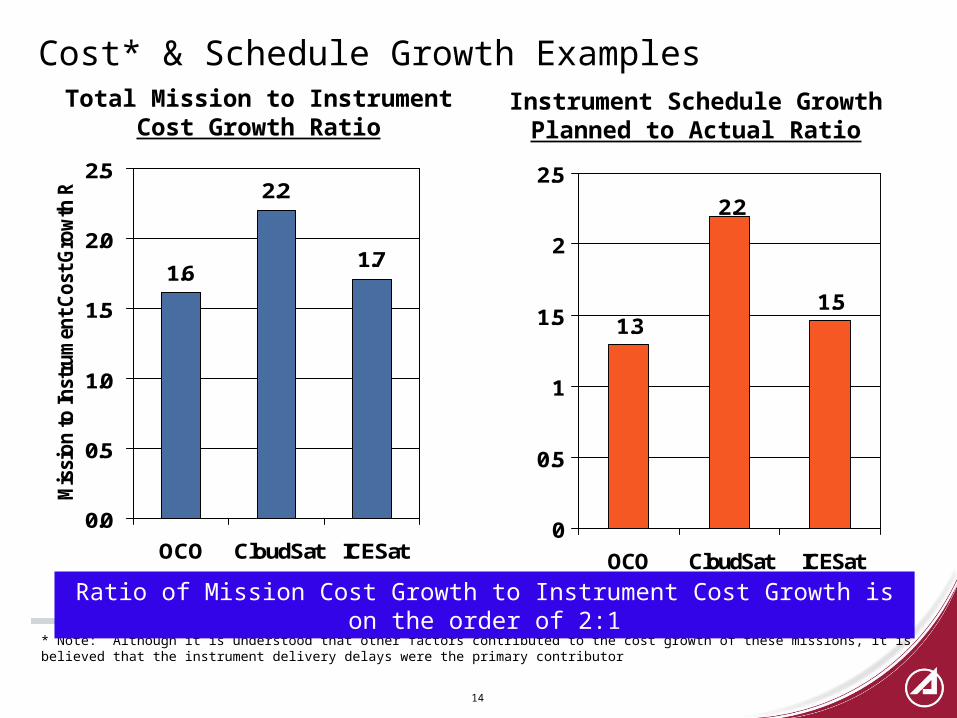
Cost* & Schedule Growth Examples
1.61.7
2.2
0.0
0.5
1.0
1.5
2.0
2.5
OCO CloudSat ICESat
Mis
sio
n t
o In
stru
men
t C
ost
Gro
wth
Rat
io
14
1.31.5
2.2
0
0.5
1
1.5
2
2.5
OCO CloudSat ICESat
Total Mission to InstrumentCost Growth Ratio
Instrument Schedule GrowthPlanned to Actual Ratio
* Note: Although it is understood that other factors contributed to the cost growth of these missions, it is believed that the instrument delivery delays were the primary contributor
Ratio of Mission Cost Growth to Instrument Cost Growth is on the order of 2:1
15
Agenda
• Executive Summary
• Background
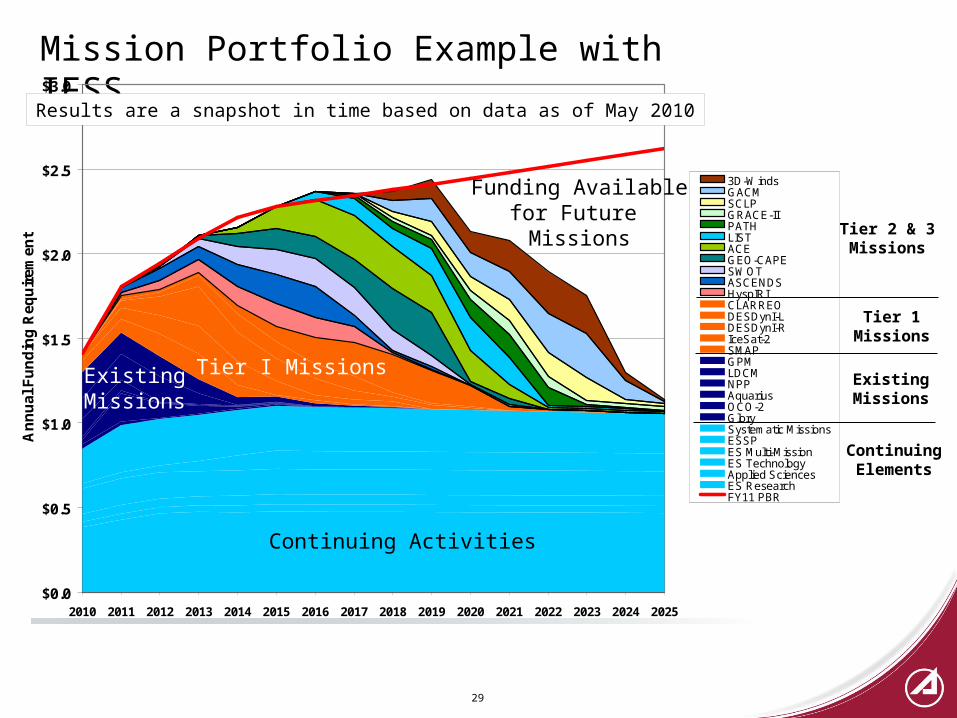
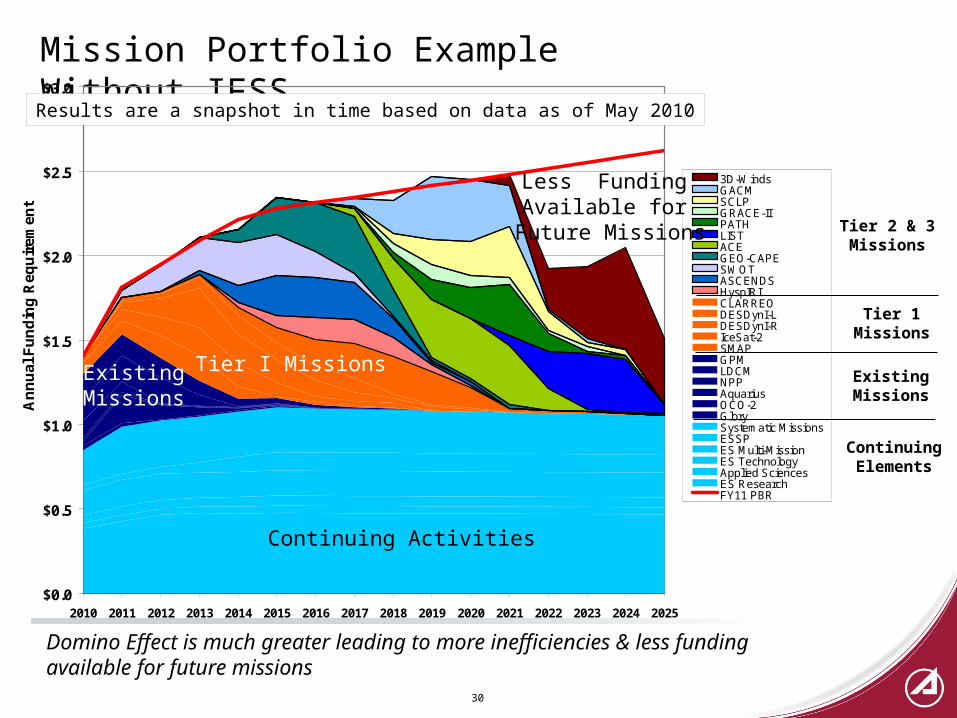
• Assessment Overview and Results– Mission Savings– Portfolio Savings
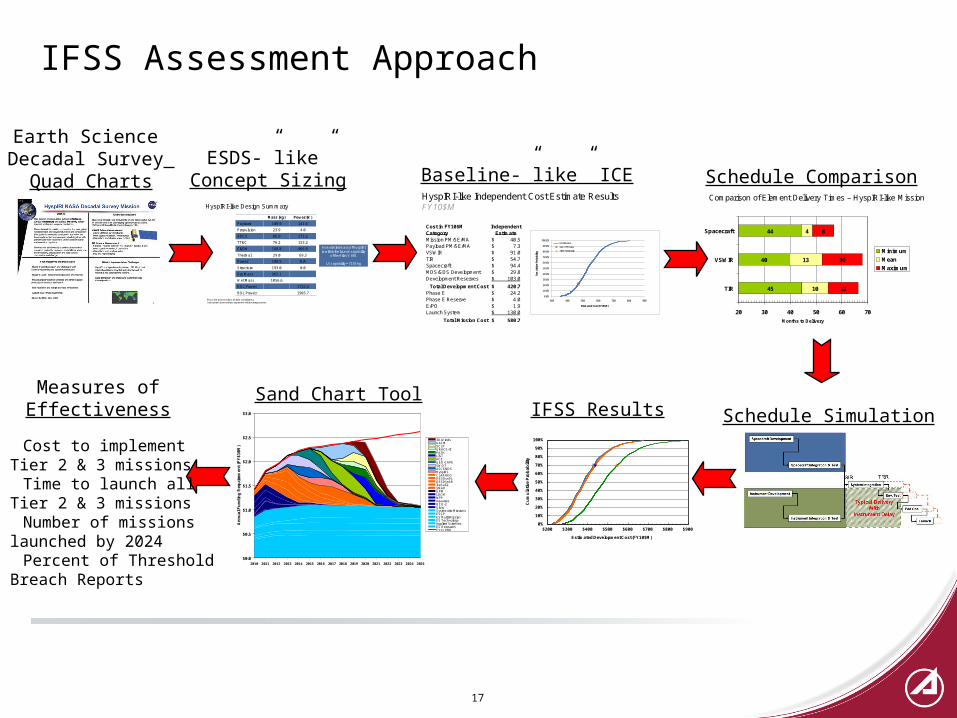
Schedule SimulationIFSS ResultsSand Chart ToolMeasures of
Effectiveness
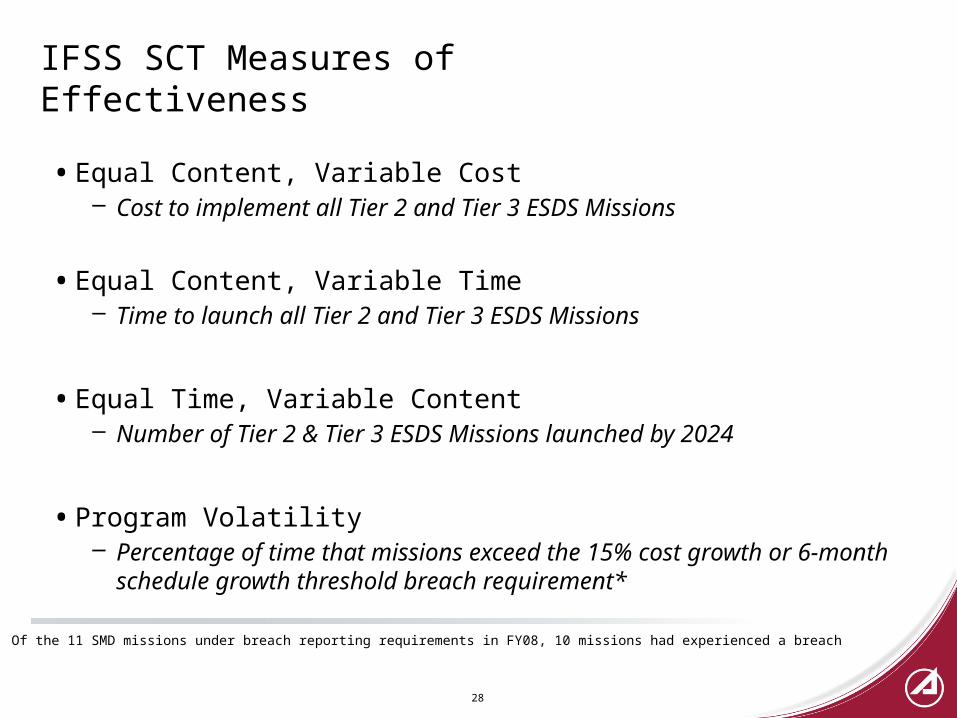
• Cost to implement Tier 2 & 3 missions• Time to launch all Tier 2 & 3 missions• Number of missions launched by 2024• Percent of Threshold Breach Reports
Cost in FY10$M IndependentCategory EstimateMission PM/SE/MA 40.5$ Payload PM/SE/MA 7.3$ VSWIR 91.0$ TIR 54.7$ Spacecraft 94.4$ MOS/GDS Development 29.8$ Development Reserves 103.0$
Total Development Cost 420.7$ Phase E 24.2$ Phase E Reserve 4.0$ E/PO 1.9$ Launch System 130.0$
Total Mission Cost 580.7$
0.0%
10.0%
20.0%
30.0%
40.0%
50.0%
60.0%
70.0%
80.0%
90.0%
100.0%
300 400 500 600 700 800 900
Cum
ulati
ve P
roba
bilit
y
Estimated Cost (FY10$M)
Distribution
Sum of Modes
70th Percentile
0%
10%
20%
30%
40%
50%
60%
70%
80%
90%
100%
$200 $300 $400 $500 $600 $700 $800 $900 C
um
ula
tive
Pro
ba
bili
ty
Estimated Development Cost (FY10$M)
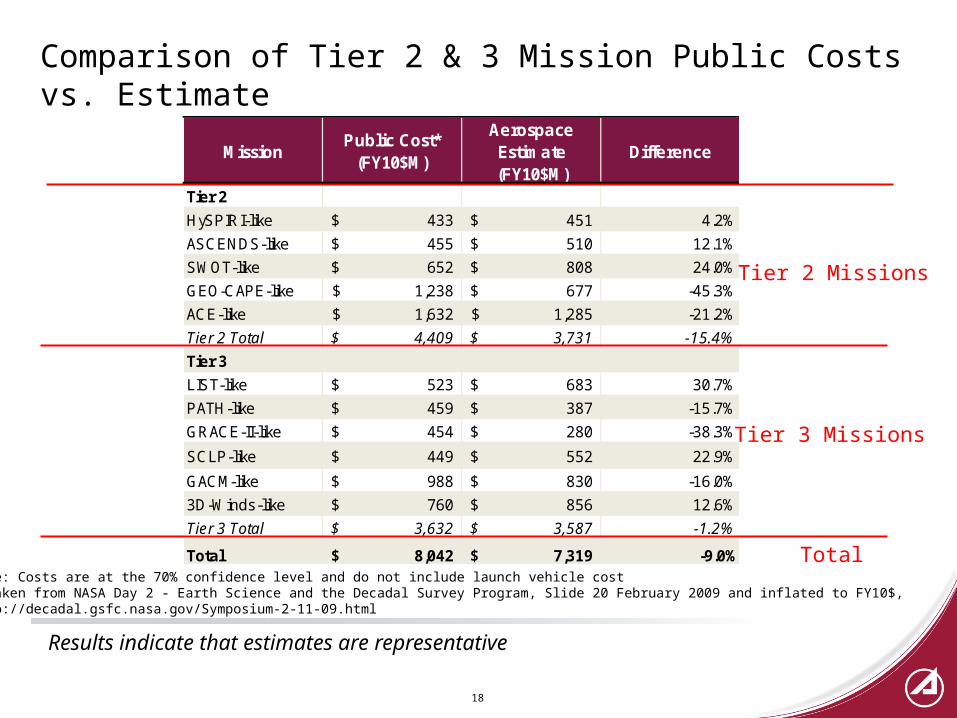
Comparison of Tier 2 & 3 Mission Public Costs vs. Estimate
18
MissionPublic Cost*
(FY10$M)
Aerospace Estimate(FY10$M)
Difference
Tier 2
HySPIRI-like 433$ 451$ 4.2%
ASCENDS-like 455$ 510$ 12.1%
SWOT-like 652$ 808$ 24.0%
GEO-CAPE-like 1,238$ 677$ -45.3%
ACE-like 1,632$ 1,285$ -21.2%
Tier 2 Total 4,409$ 3,731$ -15.4%
Tier 3
LIST-like 523$ 683$ 30.7%
PATH-like 459$ 387$ -15.7%
GRACE-II-like 454$ 280$ -38.3%
SCLP-like 449$ 552$ 22.9%
GACM-like 988$ 830$ -16.0%
3D-Winds-like 760$ 856$ 12.6%
Tier 3 Total 3,632$ 3,587$ -1.2%
Total 8,042$ 7,319$ -9.0%
Note: Costs are at the 70% confidence level and do not include launch vehicle cost* Taken from NASA Day 2 - Earth Science and the Decadal Survey Program, Slide 20 February 2009 and inflated to FY10$,http://decadal.gsfc.nasa.gov/Symposium-2-11-09.html
Tier 2 Missions
Tier 3 Missions
Total
Results indicate that estimates are representative
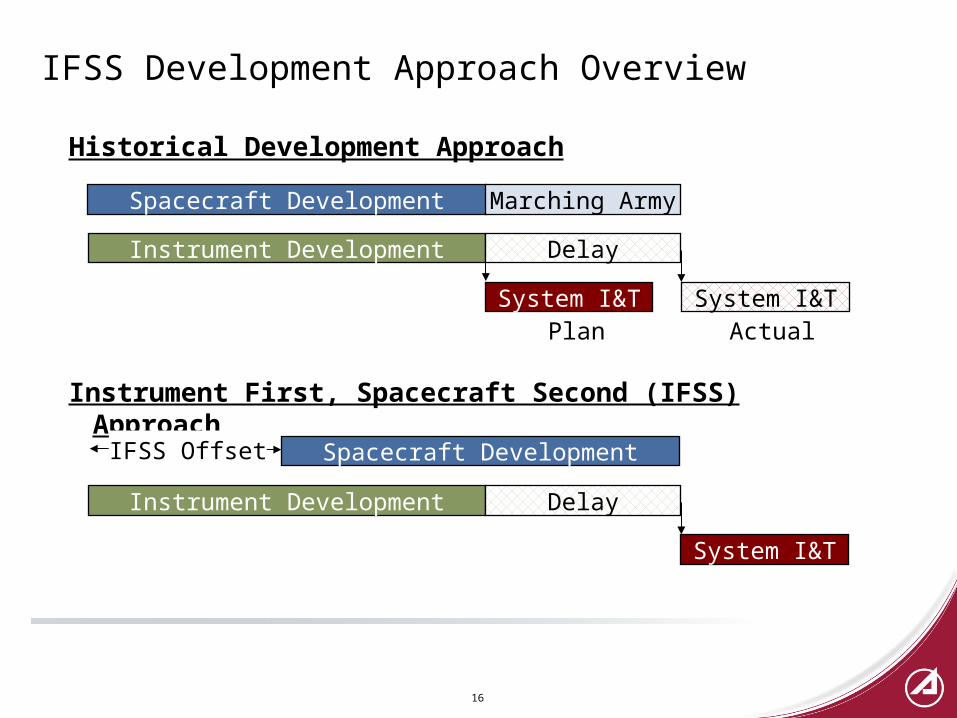
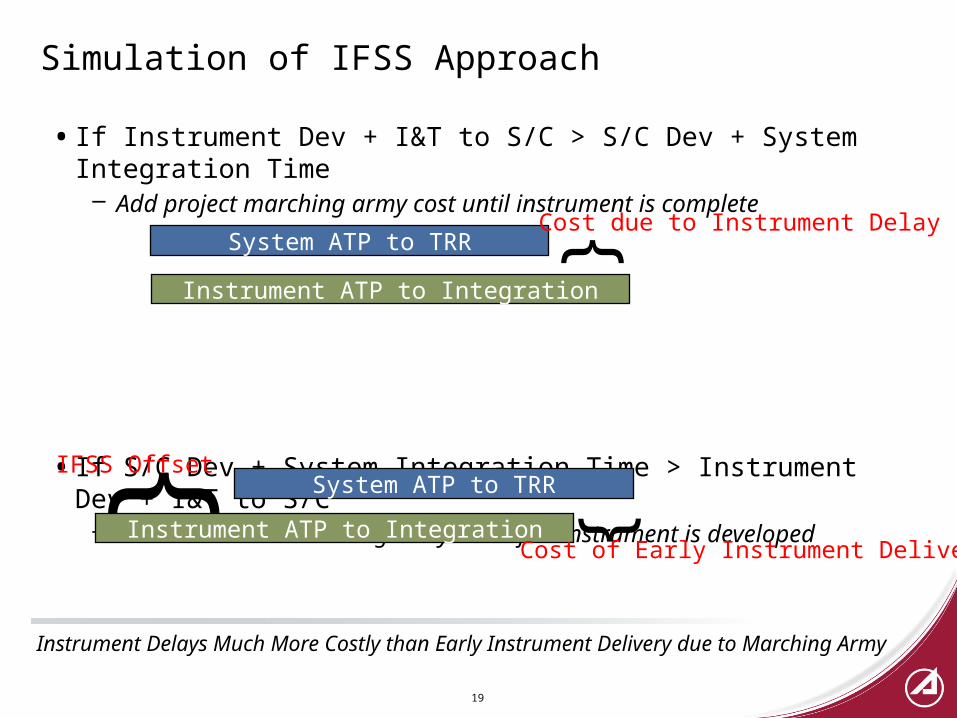
Simulation of IFSS Approach
• If Instrument Dev + I&T to S/C > S/C Dev + System Integration Time– Add project marching army cost until instrument is complete
• If S/C Dev + System Integration Time > Instrument Dev + I&T to S/C– Add instrument marching army cost after instrument is developed
19
System ATP to TRR
Instrument ATP to Integration
}Cost due to Instrument Delay
System ATP to TRR
Instrument ATP to Integration
}IFSS Offset
}
Cost of Early Instrument Delivery
Instrument Delays Much More Costly than Early Instrument Delivery due to Marching Army
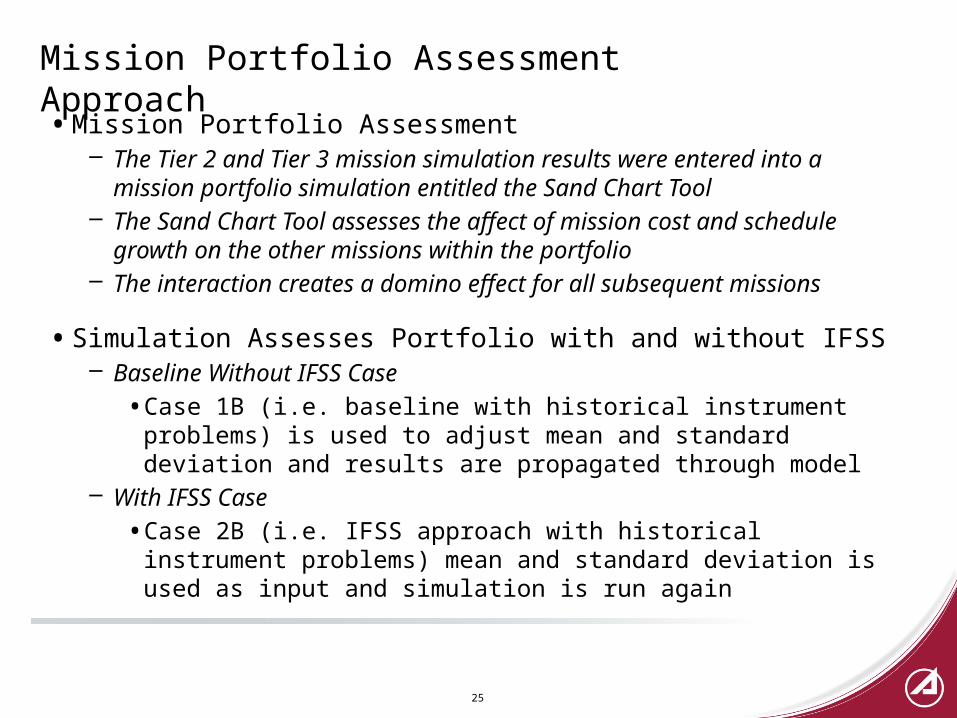
Mission Simulation Overview
• To test the potential impact of implementing an IFSS approach, an analysis was conducted using historical instrument development durations to simulate the development of a mission
• A simulation was developed in which a Monte Carlo draw is made for both the spacecraft development duration and instrument development duration(s) to determine if the spacecraft will be ready for system testing prior to the instruments’ availability for integration to the spacecraft
– Simulation provides a statistical distribution of potential outcomes allowing for an assessment of the benefit or penalty of different IFSS offsets
• Two primary cases were studied – – Case 1: Baseline without any IFSS “offset”– Case 2: IFSS with an IFSS “offset”
20
Summary of Cases
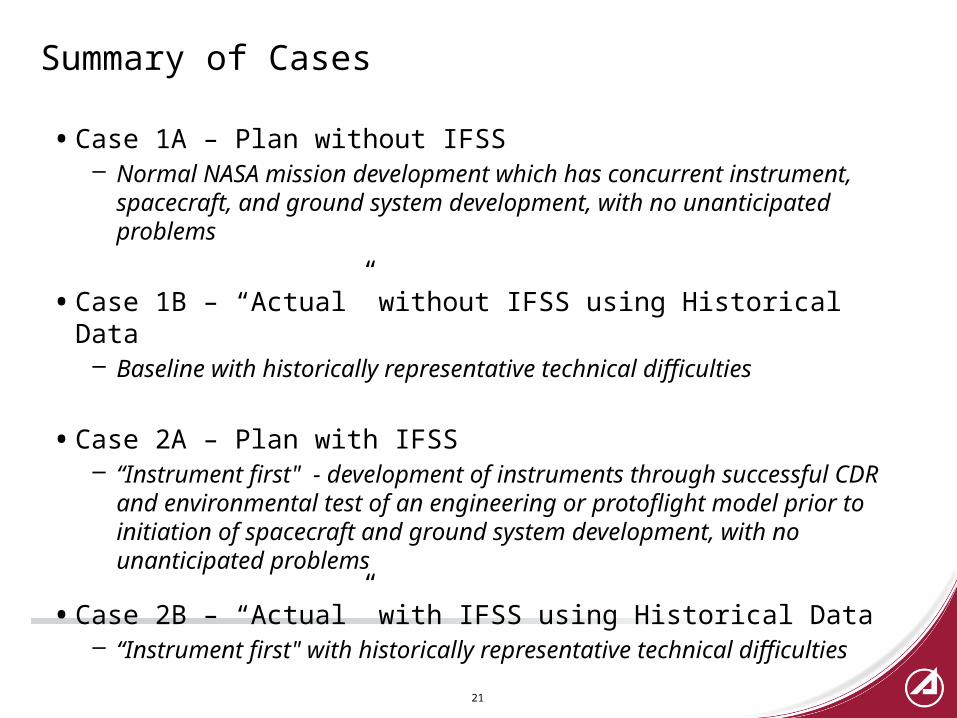
• Case 1A – Plan without IFSS– Normal NASA mission development which has concurrent instrument,
spacecraft, and ground system development, with no unanticipated problems
• Case 1B – “Actual” without IFSS using Historical Data– Baseline with historically representative technical difficulties
• Case 2A – Plan with IFSS– “Instrument first" - development of instruments through successful CDR
and environmental test of an engineering or protoflight model prior to initiation of spacecraft and ground system development, with no unanticipated problems
• Case 2B – “Actual” with IFSS using Historical Data– “Instrument first" with historically representative technical difficulties
21
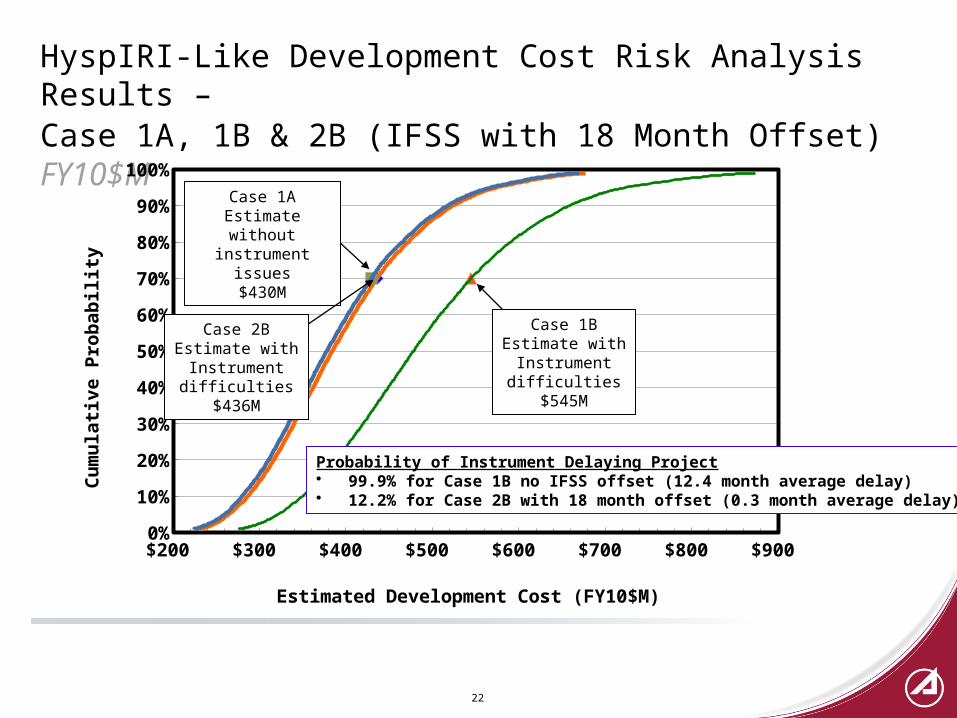
HyspIRI-Like Development Cost Risk Analysis Results – Case 1A, 1B & 2B (IFSS with 18 Month Offset) FY10$M
22
$200 $300 $400 $500 $600 $700 $800 $900 0%
10%
20%
30%
40%
50%
60%
70%
80%
90%
100%
Estimated Development Cost (FY10$M)
Cu
mu
lati
ve
Pro
ba
bili
ty
Case 1BEstimate with
Instrumentdifficulties
$545M
Case 1AEstimate without instrument issues
$430M
Case 2BEstimate with
Instrumentdifficulties
$436M
Probability of Instrument Delaying Project• 99.9% for Case 1B no IFSS offset (12.4 month average delay)• 12.2% for Case 2B with 18 month offset (0.3 month average delay)
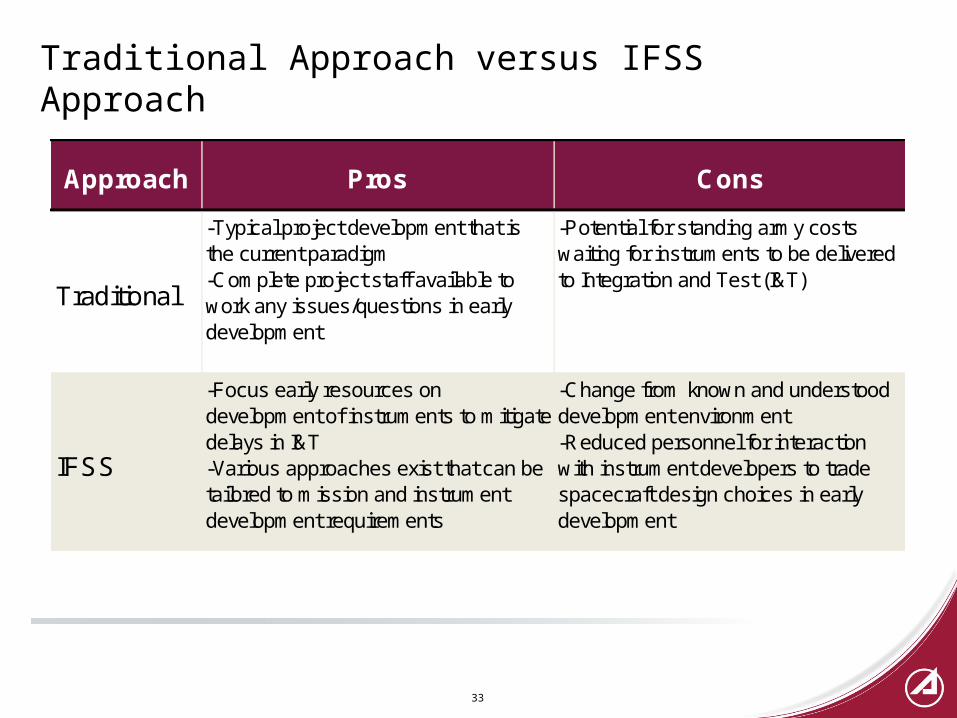
-Typical project development that is the current paradigm-Complete project staff available to work any issues/questions in early development
-Potential for standing army costs waiting for instruments to be delivered to Integration and Test (I&T)
IFSS
-Focus early resources on development of instruments to mitigate delays in I&T-Various approaches exist that can be tailored to mission and instrument development requirements
-Change from known and understood development environment-Reduced personnel for interaction with instrument developers to trade spacecraft design choices in early development
IFSS Implementation Considerations
• NPR 7120.5X policy considerations– Does 7120.5 need to be modified to implement an IFSS approach?
• IFSS Implementation Guidance– What is best way to structure an IFSS acquisition?
• Organizational implications– What is the best organization to implement an IFSS approach?
34
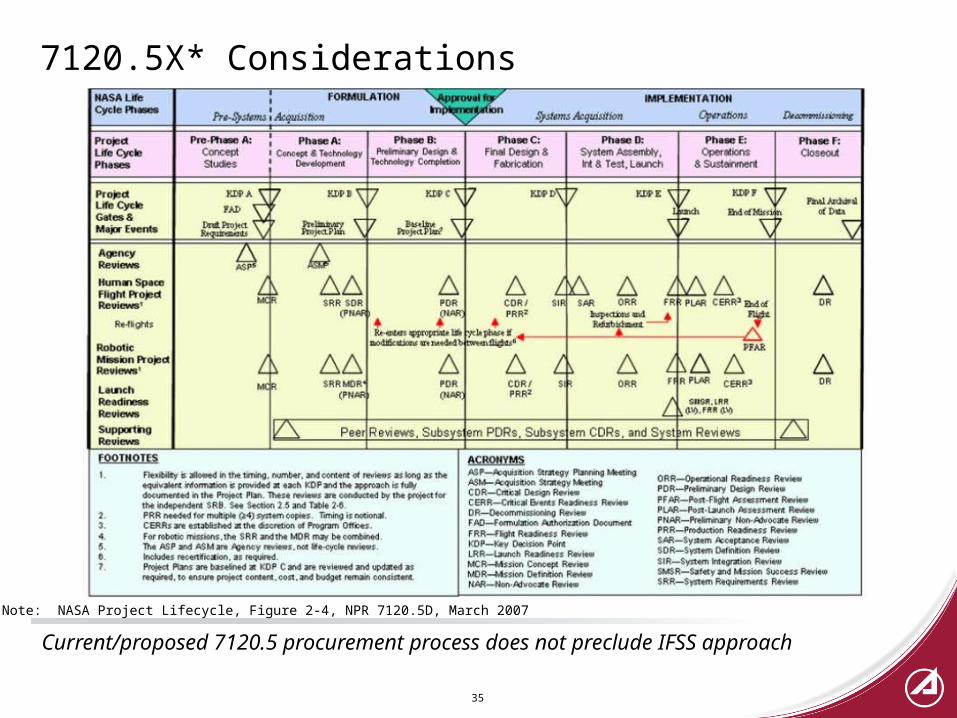
7120.5X* Considerations
35
Current/proposed 7120.5 procurement process does not preclude IFSS approach
* Note: NASA Project Lifecycle, Figure 2-4, NPR 7120.5D, March 2007
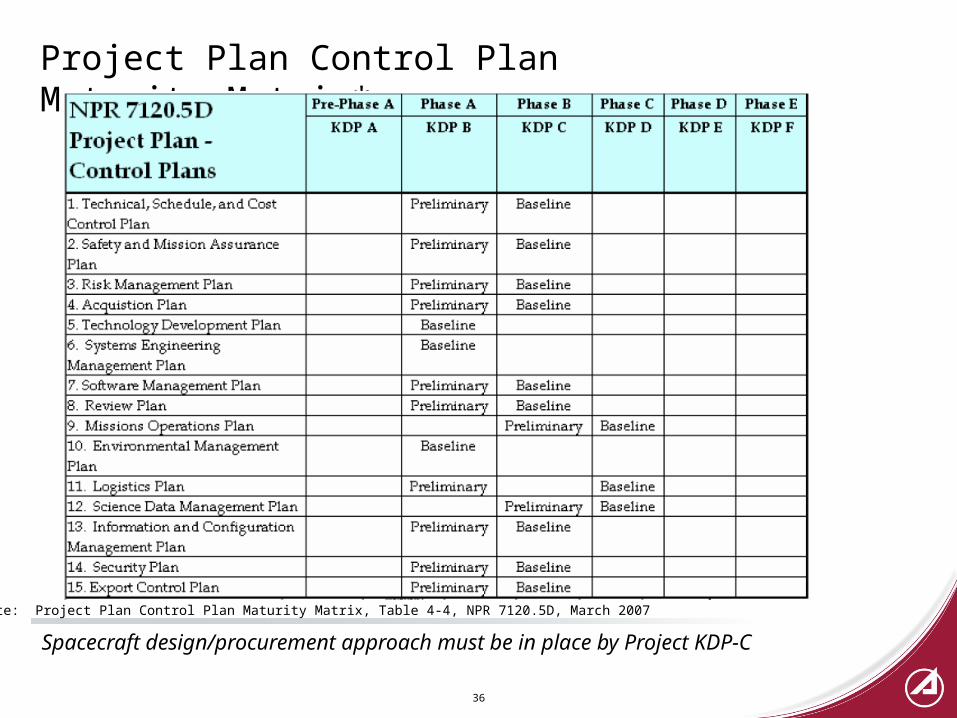
Project Plan Control Plan Maturity Matrix*
36
Spacecraft design/procurement approach must be in place by Project KDP-C
* Note: Project Plan Control Plan Maturity Matrix, Table 4-4, NPR 7120.5D, March 2007
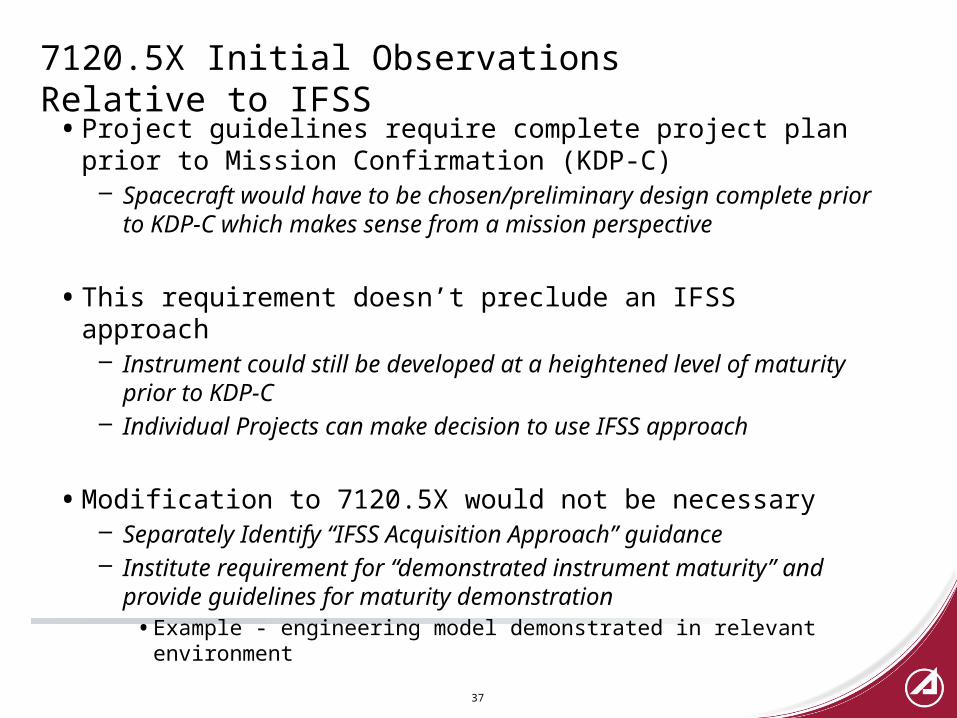
7120.5X Initial Observations Relative to IFSS
• Project guidelines require complete project plan prior to Mission Confirmation (KDP-C)– Spacecraft would have to be chosen/preliminary design complete prior
to KDP-C which makes sense from a mission perspective
• This requirement doesn’t preclude an IFSS approach– Instrument could still be developed at a heightened level of maturity
prior to KDP-C– Individual Projects can make decision to use IFSS approach
• Modification to 7120.5X would not be necessary– Separately Identify “IFSS Acquisition Approach” guidance– Institute requirement for “demonstrated instrument maturity” and
provide guidelines for maturity demonstration• Example - engineering model demonstrated in relevant environment
37
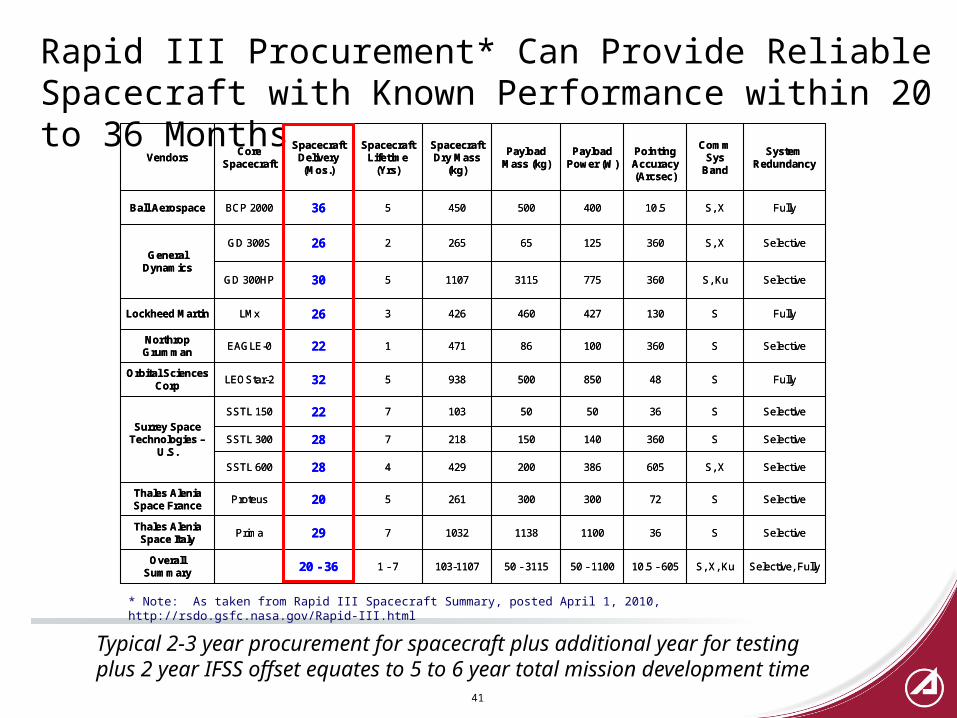
IFSS Approach Schedule Guidance
38
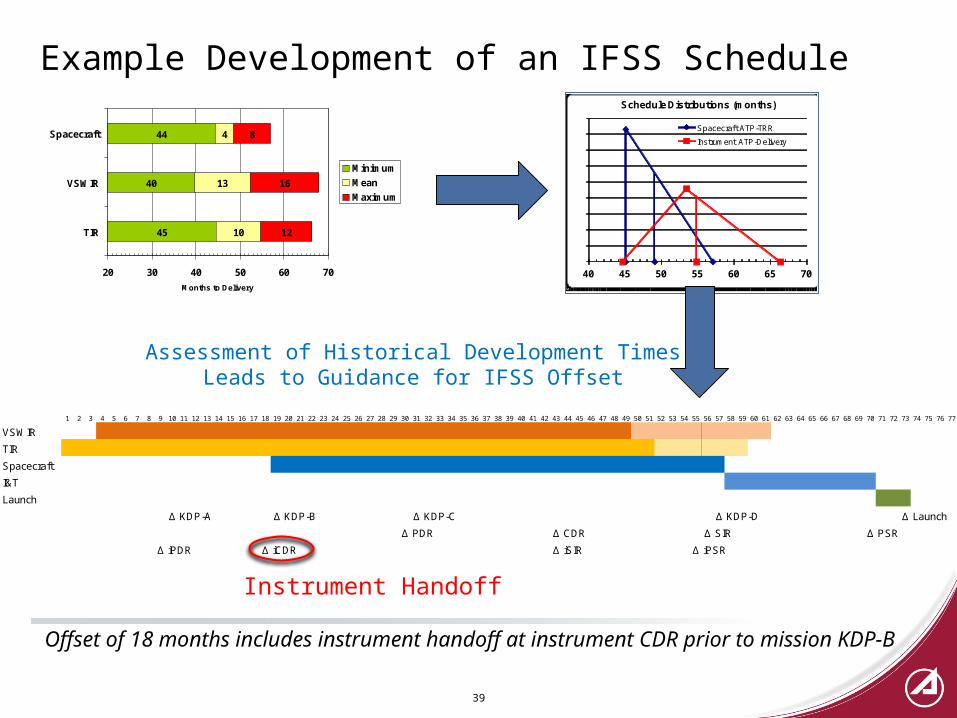
• Development schedule for a mission can be based on historical duration and variance of instrument development duration to stagger instrument procurement and spacecraft procurement
• Mean and variance of instrument development durations can be identified by instrument type
• Identify unique characteristics/challenges of instrument development
• Lay out specific instrument development plan
• Compare with spacecraft development durations
• For Instrument Office approach, instrument handoff would occur after instrument CDR, after engineering models are developed and tested
• Specific guidelines for passing instrument CDR to be developed
Typical 2-3 year procurement for spacecraft plus additional year for testing plus 2 year IFSS offset equates to 5 to 6 year total mission development time
* Note: As taken from Rapid III Spacecraft Summary, posted April 1, 2010, http://rsdo.gsfc.nasa.gov/Rapid-III.html
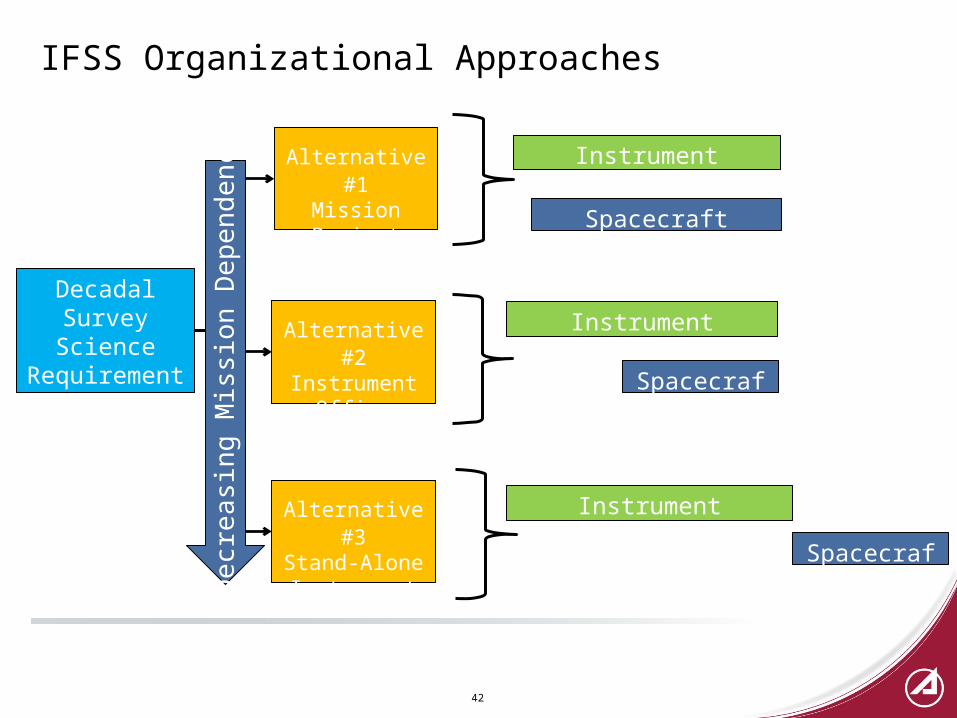
IFSS Organizational Approaches
42
DecadalSurveyScience
Requirements
InstrumentAlternative #1Mission
Project Office
Alternative #2Instrument
Office
Alternative #3Stand-AloneInstrument
Spacecraft
Instrument
Spacecraft
Instrument
SpacecraftDe
crea
sin
g M
issi
on
Dep
end
en
ce
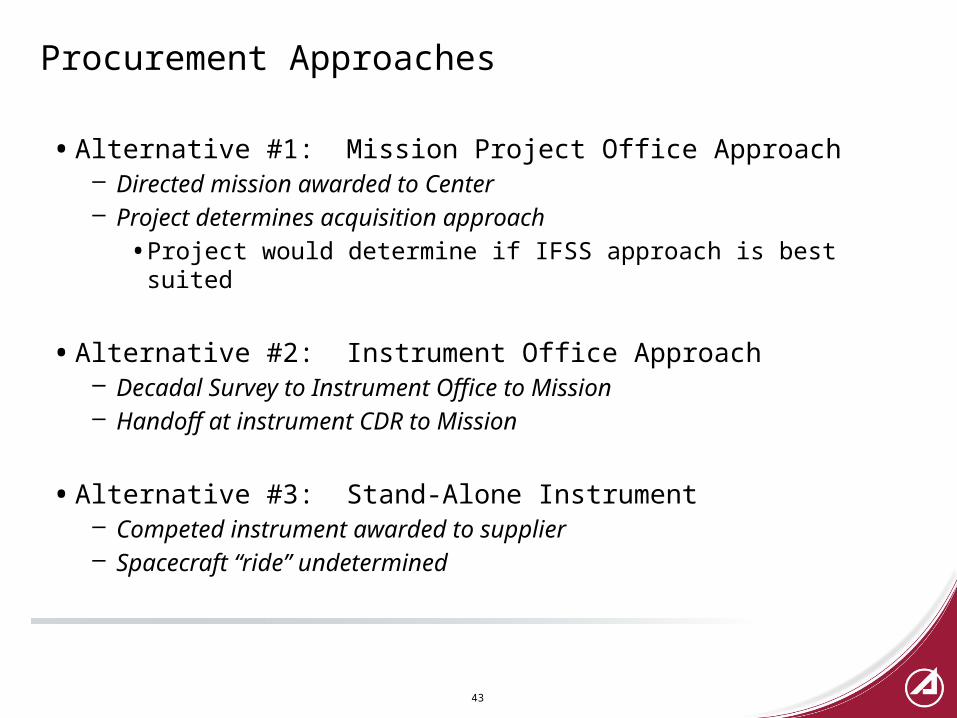
Procurement Approaches
• Alternative #1: Mission Project Office Approach– Directed mission awarded to Center– Project determines acquisition approach
• Project would determine if IFSS approach is best suited
• Alternative #2: Instrument Office Approach– Decadal Survey to Instrument Office to Mission– Handoff at instrument CDR to Mission
• Alternative #3: Stand-Alone Instrument– Competed instrument awarded to supplier– Spacecraft “ride” undetermined
43
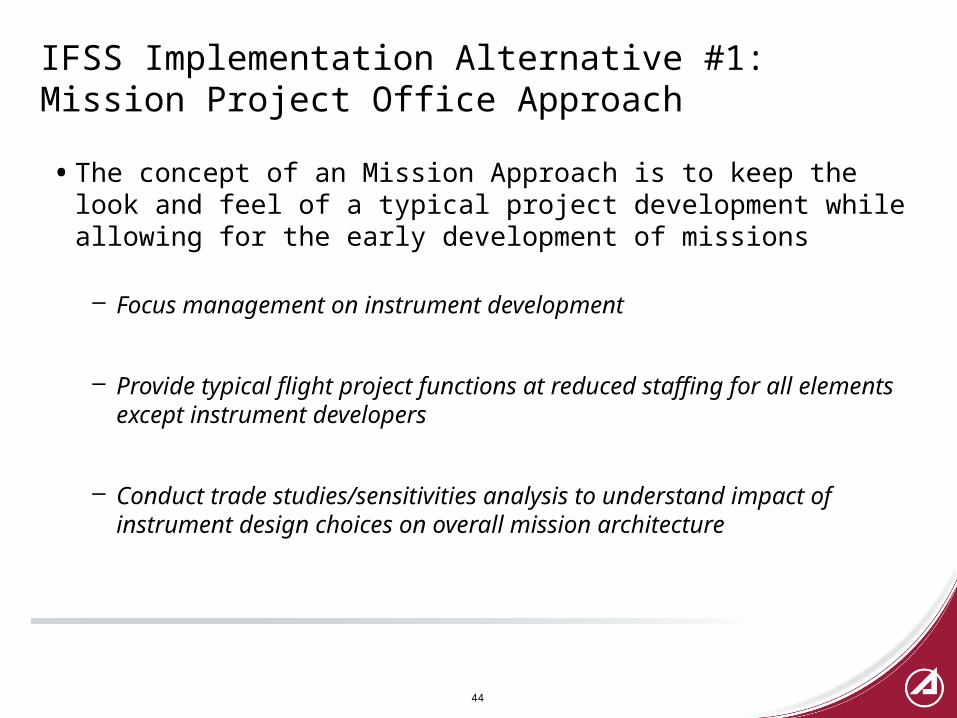
IFSS Implementation Alternative #1: Mission Project Office Approach
• The concept of an Mission Approach is to keep the look and feel of a typical project development while allowing for the early development of missions
– Focus management on instrument development
– Provide typical flight project functions at reduced staffing for all elements except instrument developers
– Conduct trade studies/sensitivities analysis to understand impact of instrument design choices on overall mission architecture
44
IFSS Implementation Alternative #1: Mission Approach
IFSS Implementation Alternative #1: Mission Approach
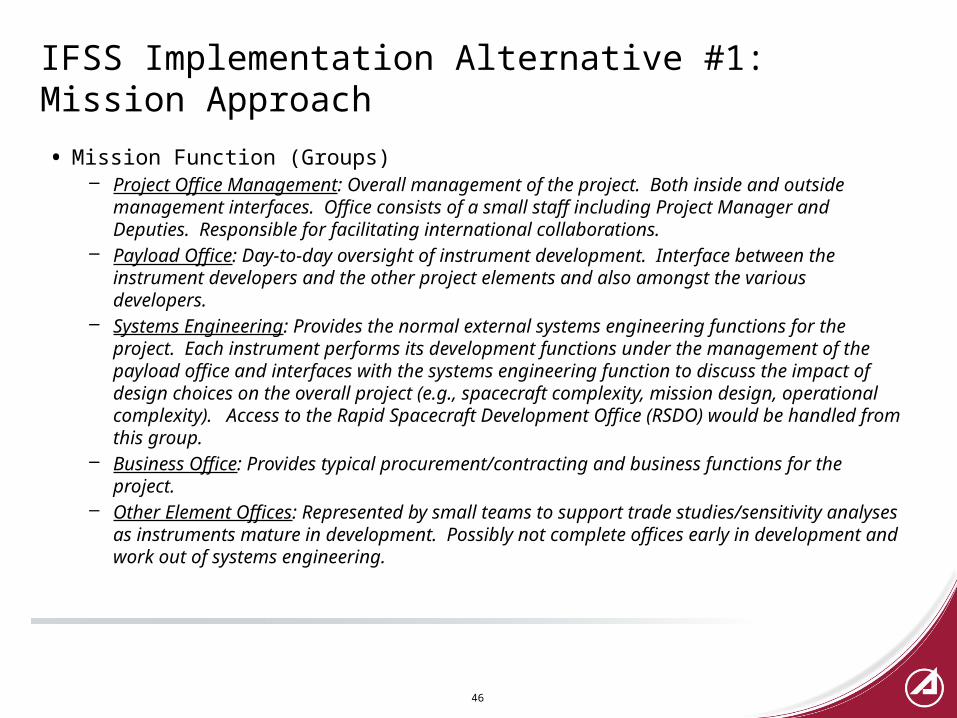
• Mission Function (Groups)– Project Office Management: Overall management of the project. Both inside and outside
management interfaces. Office consists of a small staff including Project Manager and Deputies. Responsible for facilitating international collaborations.
– Payload Office: Day-to-day oversight of instrument development. Interface between the instrument developers and the other project elements and also amongst the various developers.
– Systems Engineering: Provides the normal external systems engineering functions for the project. Each instrument performs its development functions under the management of the payload office and interfaces with the systems engineering function to discuss the impact of design choices on the overall project (e.g., spacecraft complexity, mission design, operational complexity). Access to the Rapid Spacecraft Development Office (RSDO) would be handled from this group.
– Business Office: Provides typical procurement/contracting and business functions for the project.
– Other Element Offices: Represented by small teams to support trade studies/sensitivity analyses as instruments mature in development. Possibly not complete offices early in development and work out of systems engineering.
46
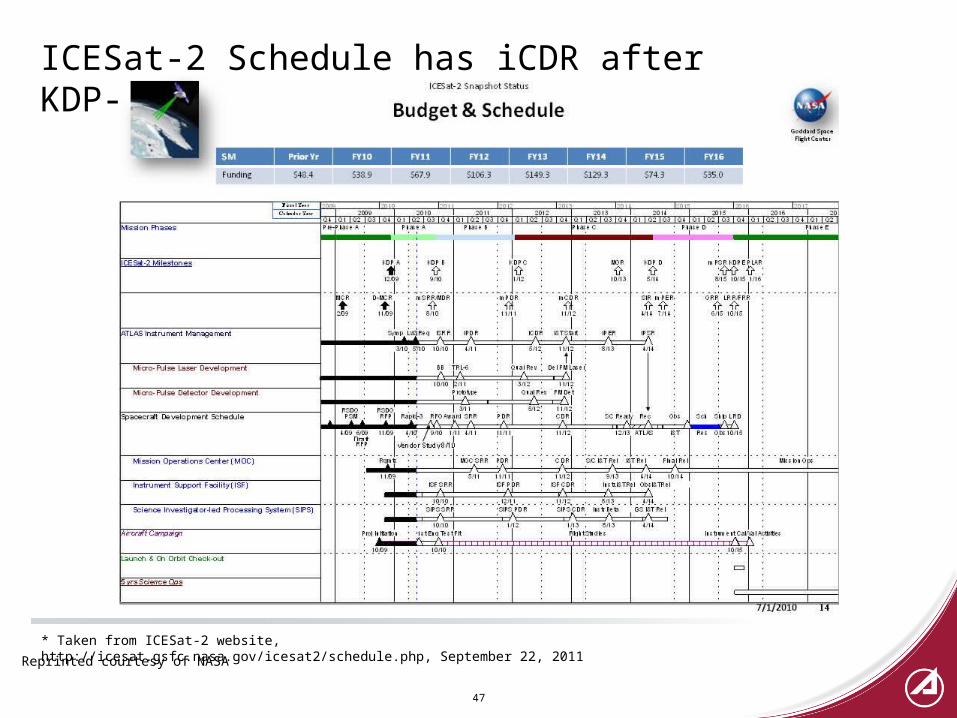
ICESat-2 Schedule has iCDR after KDP-C
47
* Taken from ICESat-2 website, http://icesat.gsfc.nasa.gov/icesat2/schedule.php, September 22, 2011
Reprinted courtesy of NASA
IFSS Implementation Alternative #2: Instrument Program Office
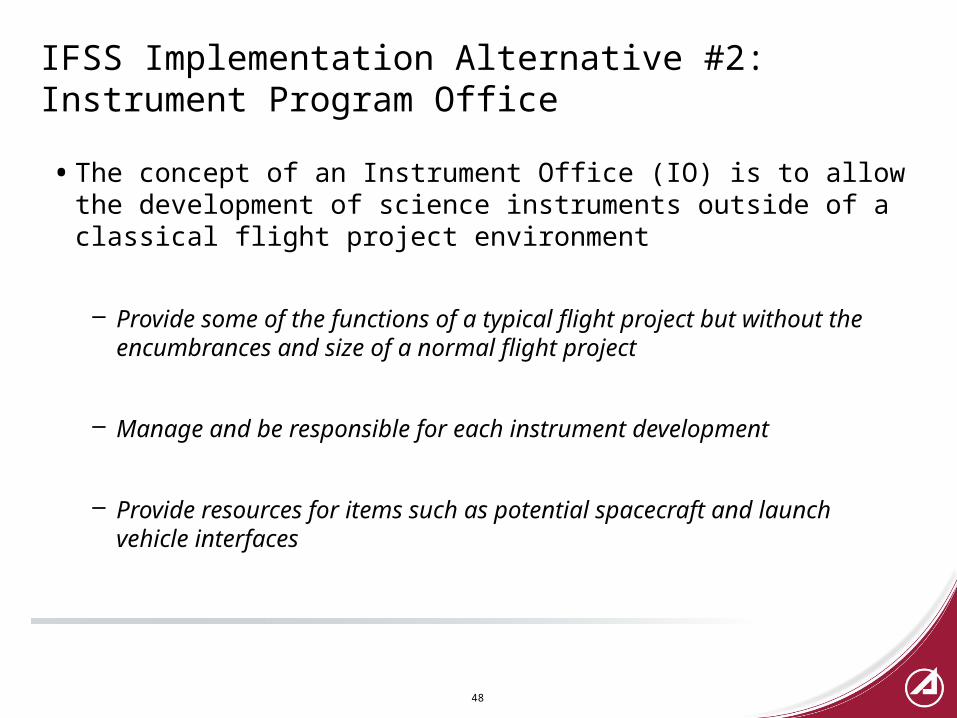
• The concept of an Instrument Office (IO) is to allow the development of science instruments outside of a classical flight project environment
– Provide some of the functions of a typical flight project but without the encumbrances and size of a normal flight project
– Manage and be responsible for each instrument development
– Provide resources for items such as potential spacecraft and launch vehicle interfaces
48
IFSS Implementation Alternative #2: Instrument Program Office
49
INSTRUMENT OFFICE
SHAREDRESOURCES/BUSINESS
SYSTEMSENGINEERING
INSTRUMENT 1 INSTRUMENT 2 INSTRUMENT ~
RSDO
LAUNCHSERVICES
IFSS Implementation Alternative #2: Instrument Program Office
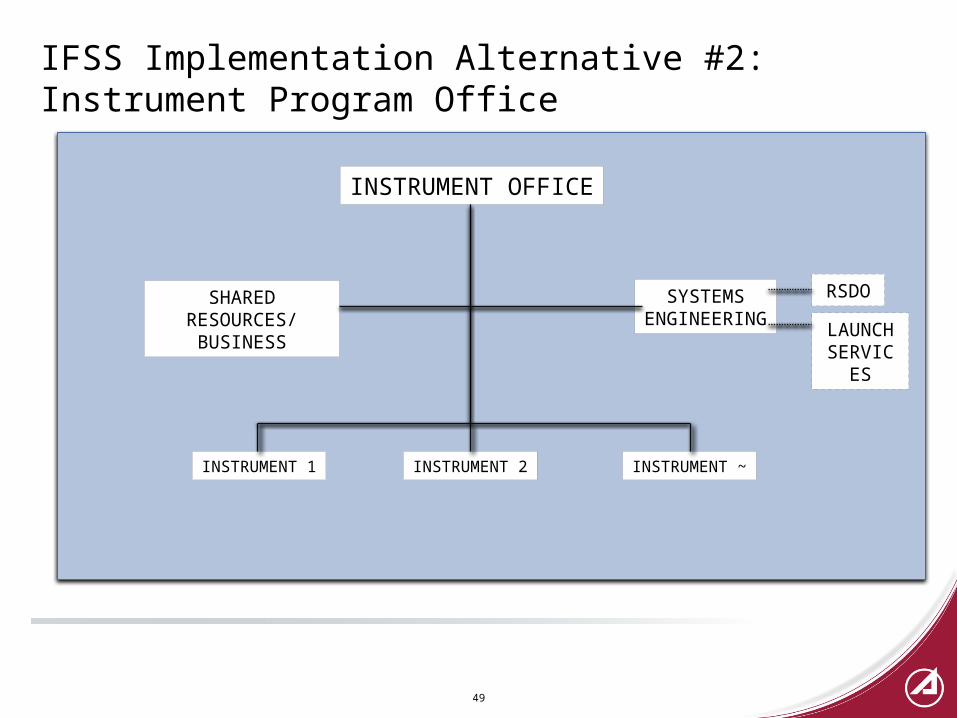
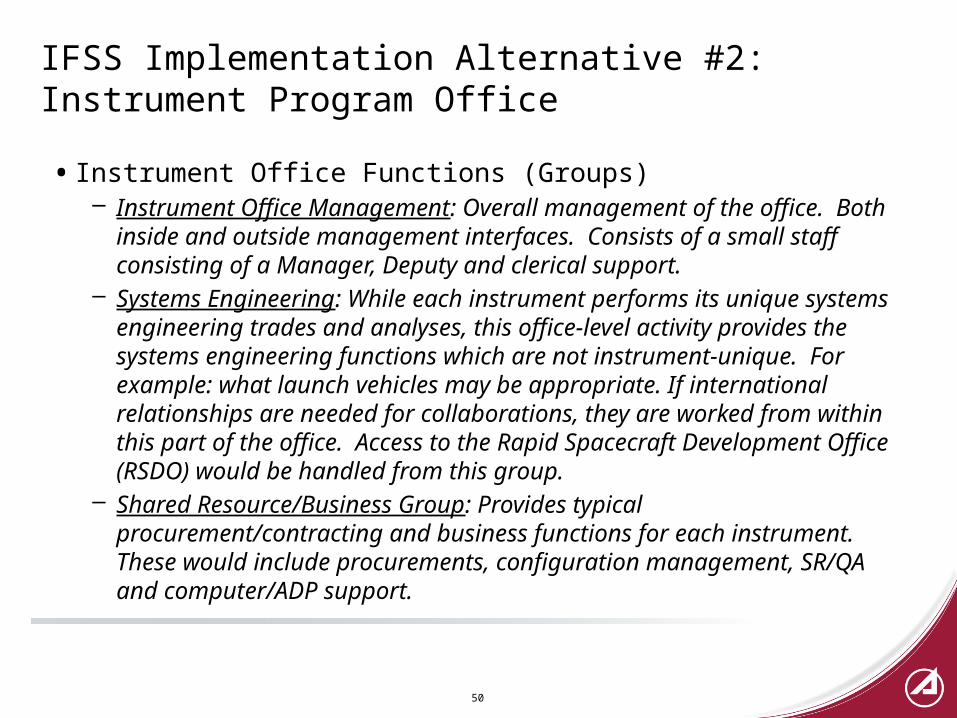
• Instrument Office Functions (Groups)– Instrument Office Management: Overall management of the office. Both
inside and outside management interfaces. Consists of a small staff consisting of a Manager, Deputy and clerical support.
– Systems Engineering: While each instrument performs its unique systems engineering trades and analyses, this office-level activity provides the systems engineering functions which are not instrument-unique. For example: what launch vehicles may be appropriate. If international relationships are needed for collaborations, they are worked from within this part of the office. Access to the Rapid Spacecraft Development Office (RSDO) would be handled from this group.
– Shared Resource/Business Group: Provides typical procurement/contracting and business functions for each instrument. These would include procurements, configuration management, SR/QA and computer/ADP support.
50
IFSS Implementation Alternative #3: Stand-Alone Instrument
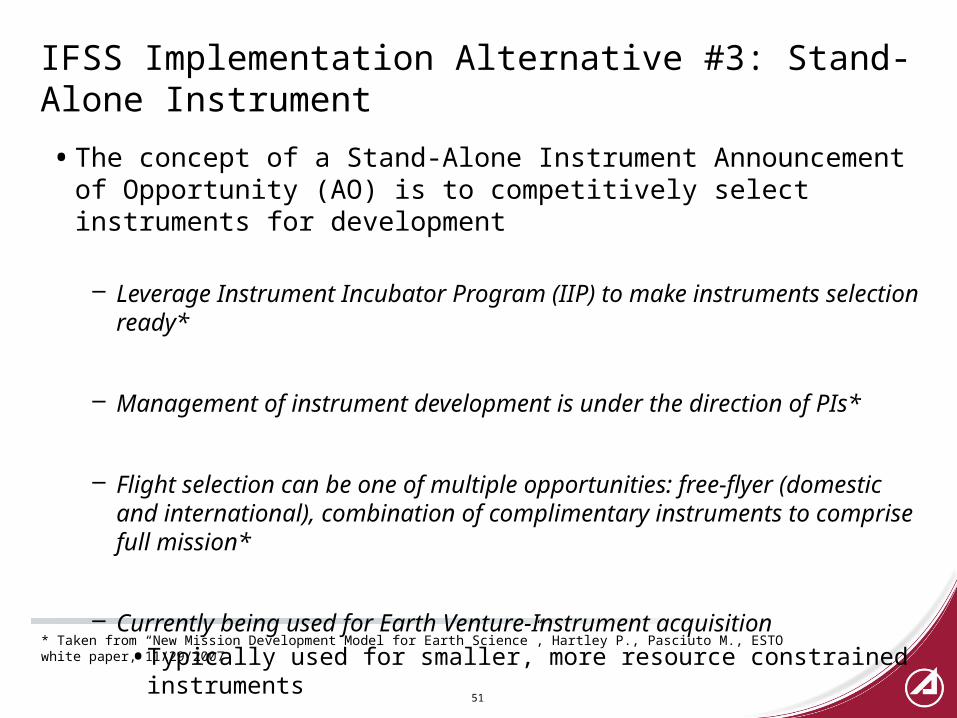
• The concept of a Stand-Alone Instrument Announcement of Opportunity (AO) is to competitively select instruments for development
– Leverage Instrument Incubator Program (IIP) to make instruments selection ready*
– Management of instrument development is under the direction of PIs*
– Flight selection can be one of multiple opportunities: free-flyer (domestic and international), combination of complimentary instruments to comprise full mission*
– Currently being used for Earth Venture-Instrument acquisition
• Typically used for smaller, more resource constrained instruments
51
* Taken from “New Mission Development Model for Earth Science”, Hartley P., Pasciuto M., ESTO white paper, 11/29/2007
IFSS Implementation Alternative #3: Stand-Alone Instrument
52
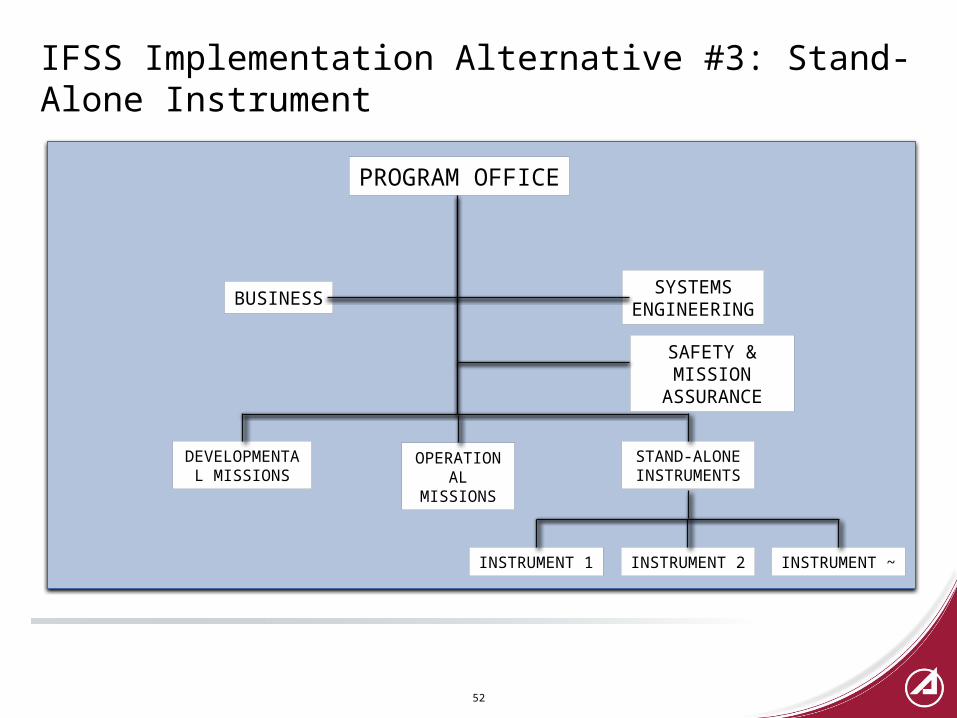
PROGRAM OFFICE
BUSINESS SYSTEMSENGINEERING
INSTRUMENT 1 INSTRUMENT 2 INSTRUMENT ~
DEVELOPMENTAL MISSIONS
STAND-ALONE INSTRUMENTS
OPERATIONAL MISSIONS
SAFETY & MISSION ASSURANCE
Implementation Approach Comparison
53
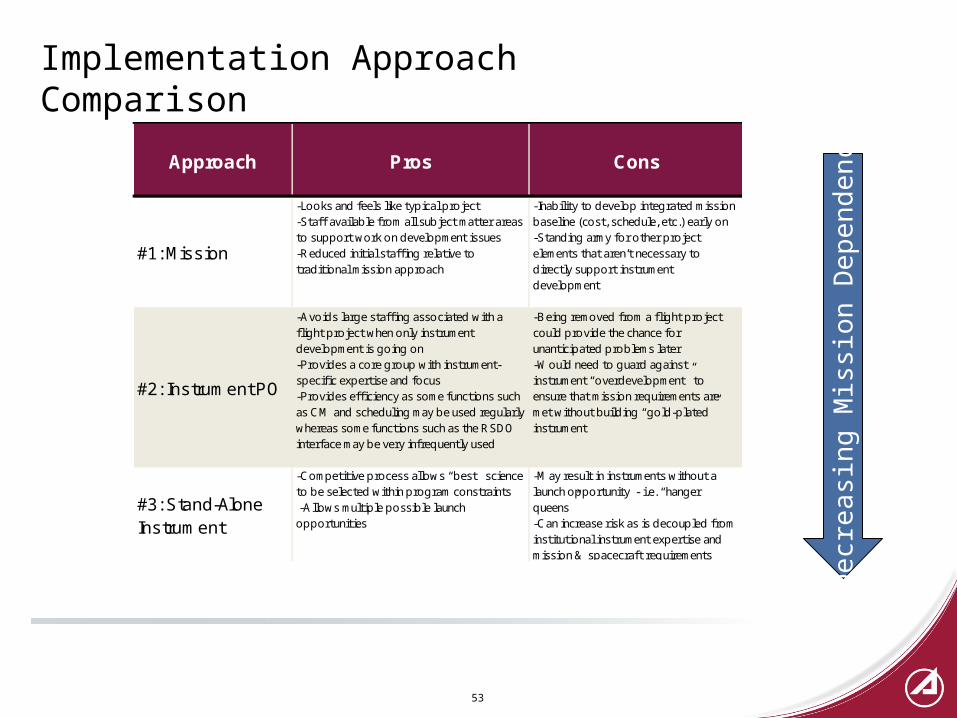
Approach Pros Cons
#1: Mission
-Looks and feels like typical project-Staff available from all subject matter areas to support work on development issues-Reduced initial staffing relative to traditional mission approach
-Inability to develop integrated mission baseline (cost, schedule, etc.) early on-Standing army for other project elements that aren’t necessary to directly support instrument development
#2: Instrument PO
-Avoids large staffing associated with a flight project when only instrument development is going on-Provides a core group with instrument-specific expertise and focus-Provides efficiency as some functions such as CM and scheduling may be used regularly whereas some functions such as the RSDO interface may be very infrequently used
-Being removed from a flight project could provide the chance for unanticipated problems later-Would need to guard against instrument “overdevelopment” to ensure that mission requirements are met without building “gold-plated” instrument
#3: Stand-Alone Instrument
-Competitive process allows “best” science to be selected within program constraints -Allows multiple possible launch opportunities
-May result in instruments without a launch opportunity - i.e. “hanger queens”-Can increase risk as is decoupled from institutional instrument expertise and mission & spacecraft requirements D
ecr
easi
ng
Mis
sio
n D
epe
nde
nce
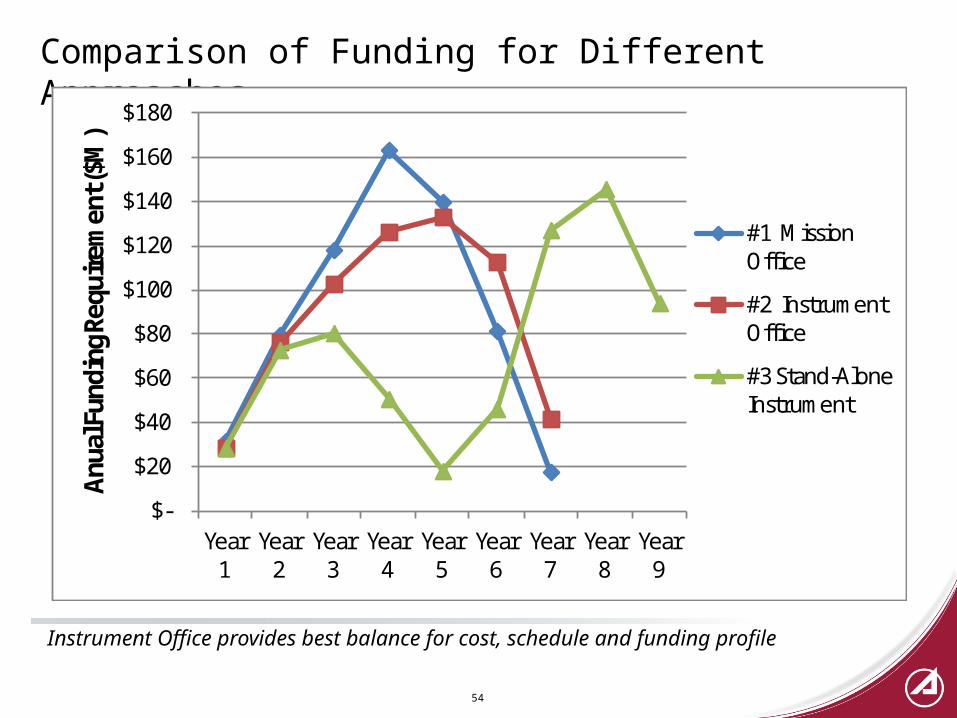
Comparison of Funding for Different Approaches
54
Instrument Office provides best balance for cost, schedule and funding profile
$-
$20
$40
$60
$80
$100
$120
$140
$160
$180
Year 1
Year 2
Year 3
Year 4
Year 5
Year 6
Year 7
Year 8
Year 9
Anua
l Fun
ding
Req
uire
men
t ($M
)
#1 Mission Office
#2 Instrument Office
#3 Stand-Alone Instrument
55
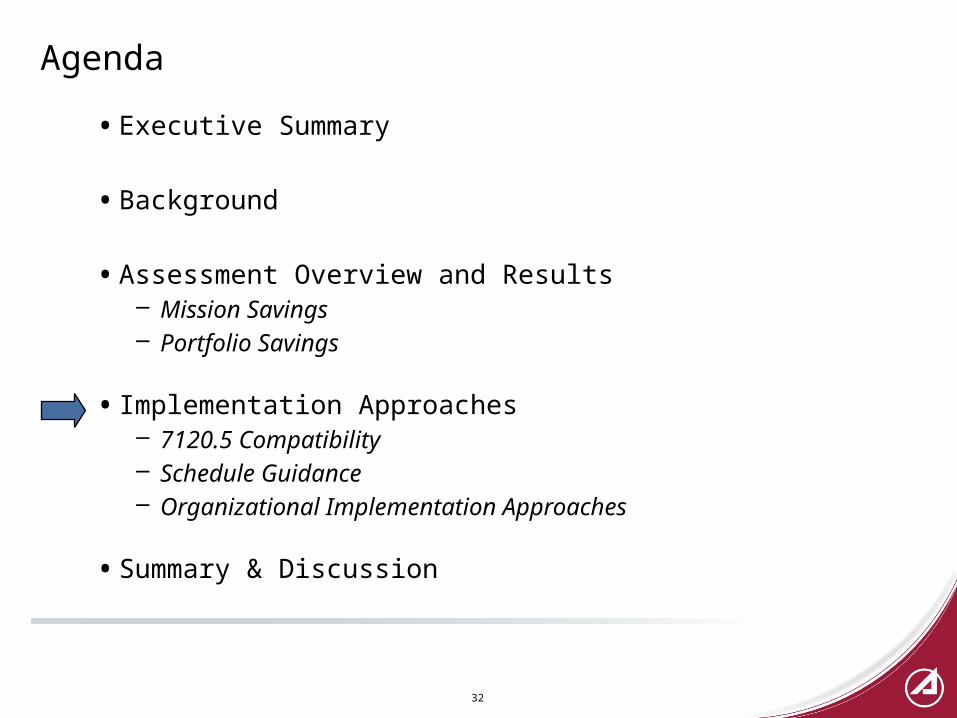
Agenda
• Executive Summary
• Background
• Assessment Overview and Results– Mission Savings– Portfolio Savings
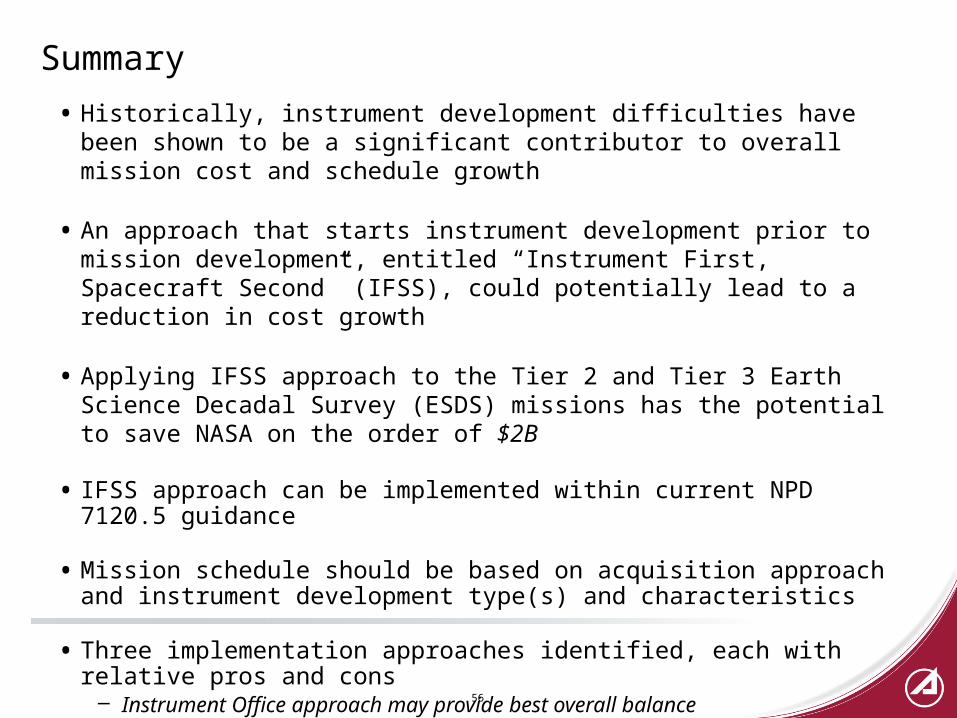
• Historically, instrument development difficulties have been shown to be a significant contributor to overall mission cost and schedule growth
• An approach that starts instrument development prior to mission development, entitled “Instrument First, Spacecraft Second” (IFSS), could potentially lead to a reduction in cost growth
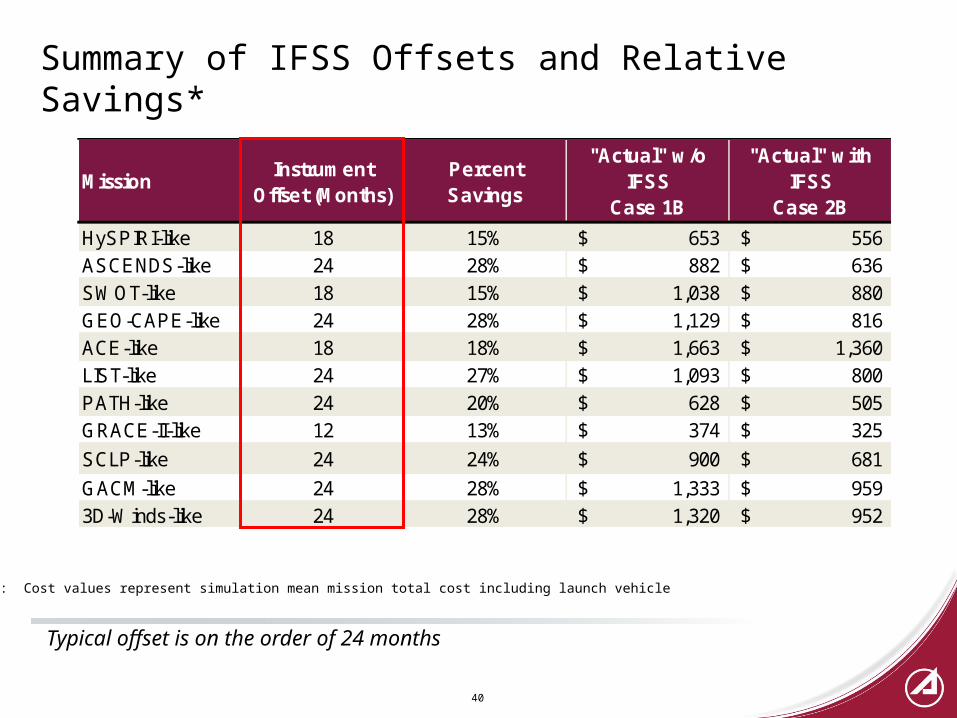
• Applying IFSS approach to the Tier 2 and Tier 3 Earth Science Decadal Survey (ESDS) missions has the potential to save NASA on the order of $2B
• IFSS approach can be implemented within current NPD 7120.5 guidance
• Mission schedule should be based on acquisition approach and instrument development type(s) and characteristics
• Three implementation approaches identified, each with relative pros and cons– Instrument Office approach may provide best overall balance
57
Back-Up
58
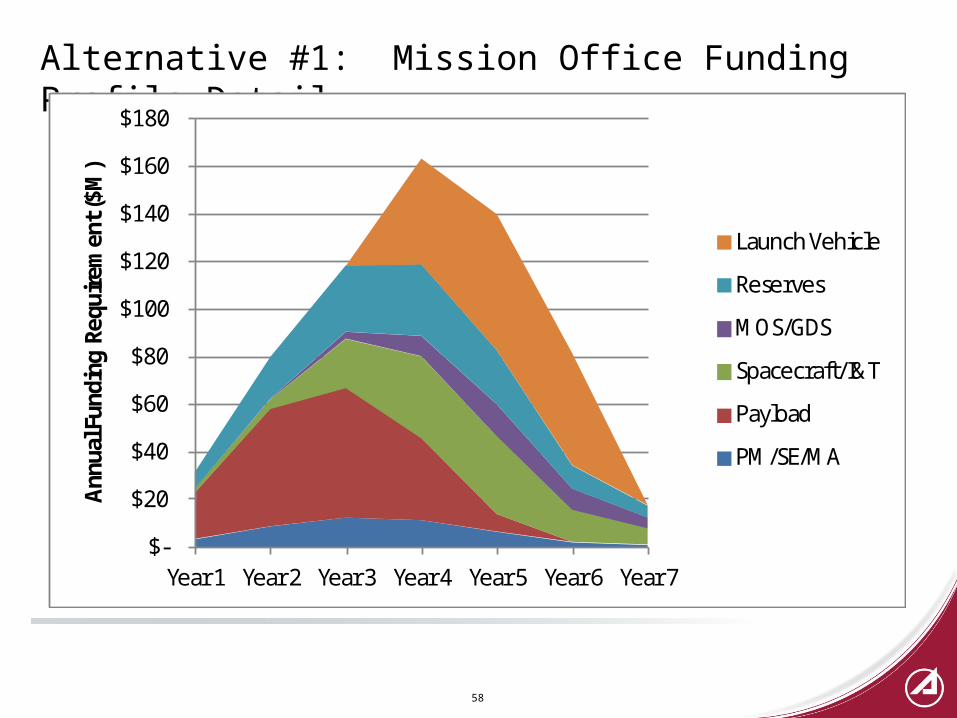
Alternative #1: Mission Office Funding Profile Detail
$-
$20
$40
$60
$80
$100
$120
$140
$160
$180
Year 1 Year 2 Year 3 Year 4 Year 5 Year 6 Year 7
Ann
ual F
undi
ng R
equi
rem
ent (
$M)
Launch Vehicle
Reserves
MOS/GDS
Spacecraft/I&T
Payload
PM/SE/MA
59
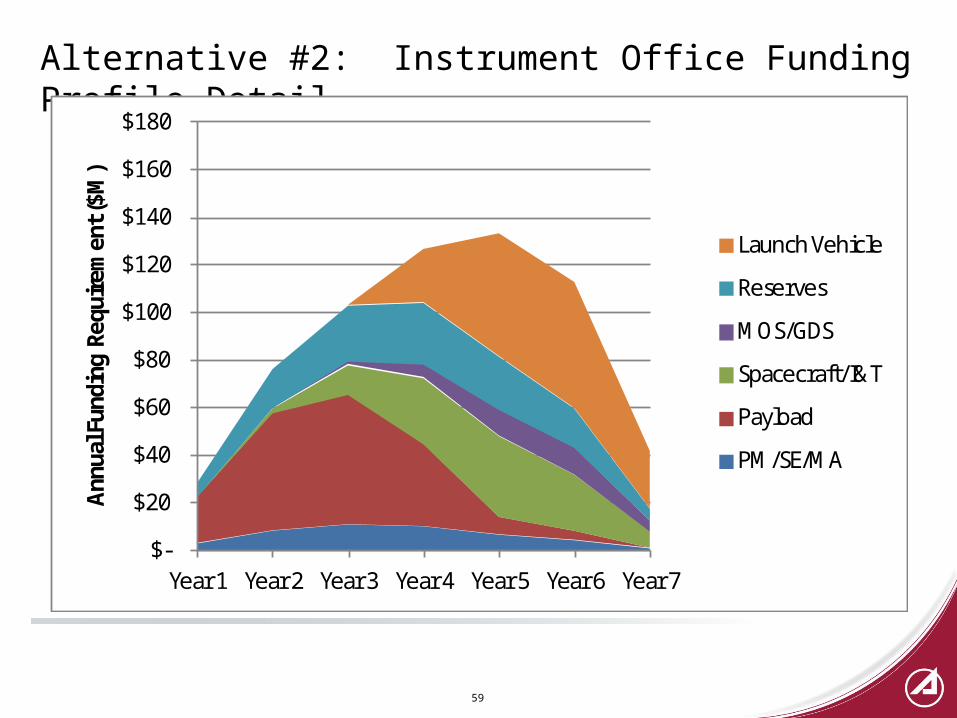
Alternative #2: Instrument Office Funding Profile Detail
$-
$20
$40
$60
$80
$100
$120
$140
$160
$180
Year 1 Year 2 Year 3 Year 4 Year 5 Year 6 Year 7
Ann
ual F
undi
ng R
equi
rem
ent (
$M)
Launch Vehicle
Reserves
MOS/GDS
Spacecraft/I&T
Payload
PM/SE/MA
60
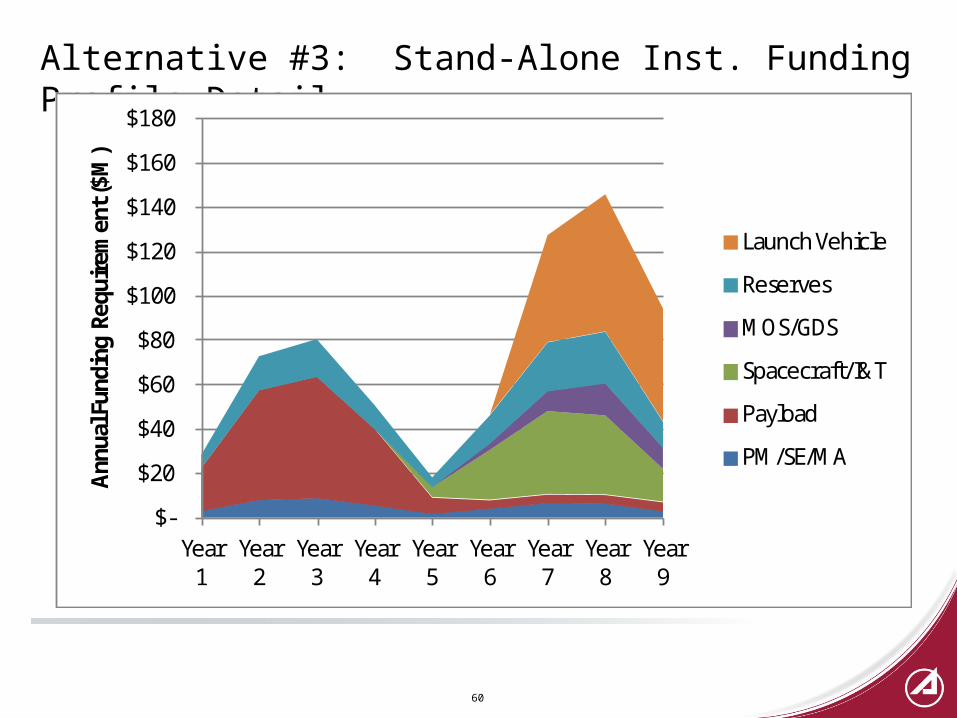
Alternative #3: Stand-Alone Inst. Funding Profile Detail